Copyright © 2008 by Edward J. Riedl and Suraj Srinivasan Working papers are in draft form. This working paper is distributed for purposes of comment and discussion only. It may not be reproduced without permission of the copyright holder. Copies of working papers are available from the author. Signaling Firm Performance Through Financial Statement Presentation: An Analysis Using Special Items Edward J. Riedl Suraj Srinivasan Working Paper 09-031

Welcome message from author
This document is posted to help you gain knowledge. Please leave a comment to let me know what you think about it! Share it to your friends and learn new things together.
Transcript

Copyright © 2008 by Edward J. Riedl and Suraj Srinivasan
Working papers are in draft form. This working paper is distributed for purposes of comment and discussion only. It may not be reproduced without permission of the copyright holder. Copies of working papers are available from the author.
Signaling Firm Performance Through Financial Statement Presentation: An Analysis Using Special Items Edward J. Riedl Suraj Srinivasan
Working Paper
09-031

Electronic copy available at: http://ssrn.com/abstract=923898
Signaling Firm Performance Through Financial Statement Presentation: An Analysis Using Special Items
Edward J. Riedl *
Harvard Business School
Suraj Srinivasan University of Chicago
October 2007
ABSTRACT: This paper investigates whether presentation of special items within the financial statements reflects the firm’s underlying economic performance or opportunism. We examine the presentation of recognized special items either as a separate line item on the income statement or aggregated within another line item with disclosure only in the footnotes. Our study is motivated by standard-setting interest in performance reporting and financial statement presentation, as well as prior research investigating managers’ presentation choices in other contexts. Using different constructs of persistence to capture the economics of reported special items, we find evidence consistent across a range of specifications that special items highlighted on the income statement are more transitory than those revealed only in the footnotes. For most special items, these results are consistent with this presentation decision reflecting underlying firm performance. For a subset observations – namely, those likely to reflect “big bath” reporting incentives – we provide limited evidence suggestive of opportunism in this presentation decision. Keywords: special items, strategic reporting, presentation, voluntary disclosure, pro forma We thank the following individuals for their useful comments and discussions on previous versions of this manuscript: Ray Ball, Phil Berger, Mark Bradshaw, Michael Kimbrough, S.P. Kothari, Ben Lansford, Roby Lehavy, Asis Martinez-Jerez, Greg Miller, Ray Pfeiffer, Doug Skinner, Mohan Venkatachalam, Jim Wahlen, Greg Waymire, and seminar participants at Harvard Business School, University of Massachusetts – Amherst, Michigan State, the UNC/Duke Fall Camp, Stanford University, and the AAA 2006 Annual meeting. We gratefully acknowledge the contribution of I/B/E/S International Inc. for providing earnings-per-share forecast data, available through the International Brokers Estimate System. These data have been provided as part of a broad academic program to encourage earnings-expectation research. We also thank Claire Chiron, Maylene Han, Susanna Kim, and Grace Lin for excellent research assistance. The paper was previously titled “The Strategic Reporting of Special Items: Does Management Presentation Reflect Underlying Firm Performance or Opportunism?” * corresponding author: Morgan Hall 365 Boston, MA 02163 617.495.6368 617.496.7363 fax [email protected]

Electronic copy available at: http://ssrn.com/abstract=923898
1
Signaling Firm Performance Through Financial Statement Presentation: An Analysis Using Special Items
ABSTRACT
This paper investigates whether presentation of special items within the financial statements reflects the firm’s underlying economic performance or opportunism. We examine the presentation of recognized special items either as a separate line item on the income statement or aggregated within another line item with disclosure only in the footnotes. Our study is motivated by standard-setting interest in performance reporting and financial statement presentation, as well as prior research investigating managers’ presentation choices in other contexts. Using different constructs of persistence to capture the economics of reported special items, we find evidence consistent across a range of specifications that special items highlighted on the income statement are more transitory than those revealed only in the footnotes. For most special items, these results are consistent with this presentation decision reflecting underlying firm performance. For a subset observations – namely, those likely to reflect “big bath” reporting incentives – we provide limited evidence suggestive of opportunism in this presentation decision.

Electronic copy available at: http://ssrn.com/abstract=923898
2
Signaling Firm Performance Through Financial Statement Presentation: An Analysis Using Special Items
1. Introduction
This paper investigates managers’ presentation of special items within the financial
statements. Specifically, we examine the use of aggregation/disaggregation within the income
statement as a mechanism to highlight special items. We test whether management’s decision to
present special items either as a separate line item on the income statement (income statement
presentation) or aggregated into another line item with identification only via footnote disclosure
(footnote presentation) reflects informational or opportunistic motivations. Under both
presentation choices, the special item is recognized, i.e., reflected in net income. By
informational, we suggest managers use income statement presentation as a mechanism to assist
users in better identifying and understanding the firm’s underlying performance. In our context,
disaggregation of special items via income statement presentation is informational when those
special items have different economic characteristics (lower persistence) than special items that
are aggregated with other income statement items and only disclosed via footnote presentation.
By opportunistic, we suggest managers use this presentation decision to influence perceptions of
the firm’s performance in a biased manner. In our context, we examine if managers choose to
highlight special items on the income statement to portray more favorable benchmarks of the
firm’s performance.
Our study is motivated by academic interest in financial statement presentation,
particularly that examining the aggregation of line items (e.g., Dye and Sridhar 2004) and the
characteristics of permanent versus transitory components of earnings (e.g., Brooks and
Buckmaster 1976; Elliott and Hanna 1996). These papers provide evidence that disaggregation of
elements having differential implications for firm performance improves the information about the

3
firm. In addition, our paper is motivated by standard-setter interest in performance reporting
issues, which arises from the flexibility afforded managers in these presentation choices and the
potential for these choices to affect users’ analysis and decisions. This is evidenced in a joint
project between the Financial Accounting Standards Board (FASB) and International Accounting
Standards Board (IASB) to establish common, high-quality standards for the presentation of
information in financial statements (see FASB 2006 and IASB 2006). Consistent with this
perspective, prior literature provides experimental evidence that financial statement presentation
can affect users’ judgments (e.g., Hirst and Hopkins 1998; Maines and McDaniel 2000). Our
examination of disclosure choices regarding special items – which are typically described as “non-
recurring” items – also provides insights relevant to other current and future financial reporting
requirements likely to introduce similar non-recurring items (such as fair value accounting).
We choose the presentation of special items as our experimental setting for the following
reasons. First, special items have been shown to have differing properties relative to other
components of income (e.g., Lipe 1986), suggesting differing presentation in financial statements
may be warranted. Second, they have been increasing, quite dramatically, in frequency and
magnitude over time (e.g., Elliott and Hanna 1996; see also Appendix A), thus becoming a
significant component of income for many firms. Third, they are heterogeneous across a number
of characteristics (e.g., Francis, Hanna, and Vincent 1996; Burgstahler, Jiambalvo, and Shevlin
2002), providing cross-sectional variation that we exploit in our empirical examination. Finally,
we conjecture that special items provide a strong setting for examining motivations underlying
managers’ financial statement presentation choices, as the reporting of special items typically
reflects substantial inherent uncertainty (e.g., the success of a restructuring) and measurement
error (e.g., estimation of impaired goodwill).

4
Our empirical tests use detailed hand-collected data spanning the period 1993-2002 for a
random sample of 500 firms within the S&P 1500. Data are collected to enable measurement of
both the specific composition of the reported special items as well as the related financial
statement presentation choice. We observe considerable variation in the income statement versus
footnote presentation choices – both across and within firms. To disentangle informational versus
opportunistic motivations for presentation of special items, our analyses focus on an ex post
measure of the special item’s economic content: the persistence of the special item. Overall, we
find evidence consistent across a range of specifications that managers choose to highlight on the
income statement special items that are more transitory than those revealed only in the footnotes.
For most special items, these results are consistent with the presentation decision reflecting
informational motivations. However, for a subset of observations – in particular, those likely to
reflect “big bath” reporting incentives – we provide limited evidence that opportunistic
motivations underlie this presentation decision.
Our paper contributes to the accounting literature in four primary ways. First, we build on
prior research examining managers’ reporting behavior in other types of financial reporting
presentation choices, particularly that investigating pro forma reporting (e.g., Schrand and Walther
2000; Bhattacharya et al. 2003). These studies generally conclude that managers act
opportunistically in their reporting decisions. While we provide limited evidence consistent with
opportunism, our overall results suggest that managers appear to apply their presentation decisions
in a manner consistent with informational motivations, particularly in the absence of “big bath”
reporting incentives (i.e., for the majority or reported special items).1 Second, our insights
complement experimental findings that presentation choices affect user judgments (e.g., Hirst and
1 While we focus on the presentation choice, our findings complement other research investigating informational
versus opportunistic motivations in the recognition of reported items (e.g., Aboody 1996; Aboody, Barth, and Kasznik 2004; and Hodder et al. 2006).
5
Hopkins 1998) by suggesting linkages between observed management presentation behavior and
the consequences of this behavior. Third, we build on prior research documenting differential
persistence across the sign of special items (Burgstahler, Jiambalvo, and Shevlin 2002) by
showing that differences in persistence exist even within categories of special items. Finally, we
complement prior descriptive evidence (e.g., Elliott and Hanna 1996) by documenting a continued
increase in the frequency and magnitude of reported special items.
The remainder of this paper is organized as follows. Section 2 discusses related prior
research, motivation, and our hypothesis development. Section 3 presents the research design.
Section 4 discusses our sample selection and descriptive data. Section 5 presents our empirical
results. Section 6 provides sensitivity analyses. Section 7 concludes.
2. Prior Research, Motivation, and Hypothesis Development
Prior Research and Motivation
Prior literature on management disclosure (e.g., Healy and Palepu 2001) suggests that
disclosure decisions reflect both informational motivations (that is, managers use these decisions
to inform financial statement users about the underlying economics of their firms) and
opportunistic motivations (that is, managers use these decisions to bias users’ perspectives). In
this study, we focus on management choice of presentation within the financial statements as a
disclosure medium. Thus, we examine managers’ choice to present separately (and therefore
highlight) certain elements within the financial statements, a notion that relates to the literature on
aggregation of performance measures (e.g., Dye and Sridhar 2004).
Prior research on disclosure choices to emphasize financial performance metrics has
generally focused on alternative settings, particularly pro forma reporting. A number of papers

6
provide evidence consistent with management reporting in this context reflecting opportunism.
Schrand and Walther (2000) examines earnings press releases, and documents that managers are
more likely to separately announce a prior-period gain from the sale of assets than a loss,
consistent with managers opportunistically selecting the prior-period earnings amount used as a
benchmark to evaluate current-period earnings. Weiss (2001) examines the reporting effects of
the 1993 change in corporate income tax rates, and similarly finds that managers are more likely to
separately disclose negative than positive non-recurring items in press releases, consistent with
managers attempting to highlight the negative items as transitory or non-core expenses. McVay
(2006) provides similar evidence, documenting that managers opportunistically shift reported
expenses from core expenses (such as cost of goods sold) to special items, thereby overstating
“core” earnings. Taken together, these papers suggest that managers use certain presentation
decisions – particularly in the context of “pro forma” reporting – in an opportunistic fashion.2
Other research provides evidence that “pro forma” reporting reflects elements of both
underlying economic performance and opportunistic behavior. Lougee and Marquardt (2004)
finds that firms with low GAAP earnings informativeness are more likely to disclose pro forma
earnings consistent with motivations to accurately reflect the firm’s performance; however, the
direction of the GAAP earnings surprise is also an important determinant of this decision,
consistent with opportunistic motivations. Similarly, Bowen, Davis, and Matsumoto (2005)
provides evidence that managers emphasize metrics that portray more favorable firm performance;
however, these same metrics are also more value relevant.
2 While several studies provide evidence that investors are misled, at least temporarily, by such opportunistic
presentation behavior (e.g., Schrand and Walther 2000), some research concludes otherwise (e.g., Johnson and Schwartz 2005). Bhattacharya et al. (2007) reveals that less sophisticated investors react to such pro forma disclosures, suggesting consideration of investor type may partially reconcile these differing conclusions.

7
In the current paper, we examine managers’ direct presentation decisions within the
financial statements, which have received scant empirical investigation. Prior experimental
research in other financial statement presentation contexts (such as the reporting of comprehensive
income) reveals that such presentation choices can affect the costs to users to identify, interpret,
and weigh the implications of reported items for the firm (e.g., Hirst and Hopkins 1998; Maines
and McDaniel 2000; Elliott 2006). Thus, similar to the literature on pro forma reporting, we
examine a management presentation decision – i.e., the extent to which management chooses to
highlight reporting elements within the financial statements.
As our setting, we focus on managers’ presentation of special items. Accounting
Principles Board 30 – Reporting the Results of Operations defines special items as charges that
are infrequent or unusual in nature.3 We choose special items as our setting for the following
reasons. First, proper identification and labeling of this type of charge is likely relevant for
financial statement users, as these items may have differing properties from other components of
earnings (e.g., Lipe 1986; Fairfield, Sweeney, and Yohn 1996; Francis, Hanna, and Vincent 1996;
Burgstahler, Jiambalvo, and Shevlin 2002). Second, special items have increased dramatically in
frequency and magnitude over recent years (e.g., Elliott and Hanna 1996; our Appendix A).
Further, special items represent reporting events where opportunities to inform or bias perceptions
through presentation choice are likely exacerbated, owing to the high uncertainty (such as the
success of a restructuring endeavor) and challenging measurement issues (such as estimating an
impairment) that typically surround special items. Finally, there are no rigid guidelines regarding
the presentation of such items, except that they must be included in operating income. Thus,
3 Related, note that our analysis excludes discontinued operations, extraordinary items, and effects of changes in
accounting principle. All three qualify for specific treatment under US GAAP: each must be disclosed separately, net of applicable taxes, on the income statement below income from continuing operations.

8
managers have discretion over how special items are presented on the income statement.4 In
particular, managers may present special items in one of two ways: as a separate line item on the
income statement with possible discussion in the footnotes (i.e., income statement presentation),
or aggregated within another line item on the income statement with identification and discussion
of the special items only via the footnotes (i.e., footnote presentation). Again, in both cases the
special items are recognized – i.e., reflected in net income. The choice is the extent to which
management highlights these items on the face of the income statement.
Hypothesis Development
Applying the findings of prior research, we propose that management presentation of
special items within the income statement reflects two notions. First, managers may use the
presentation choice to provide users with information on the underlying economic characteristics
of these items (i.e., informational motivations). In the context of special items, highlighting such
charges via separate presentation on the income statement suggests that these items have differing
properties, such as implications for future performance, than other income statement elements.
However, because separate presentation can suggest different properties of the income statement
item, managers may alternatively use the presentation choice to bias users’ perceptions of
performance (i.e., opportunistic motivations). In the context of special items, such opportunism
could manifest through managers using presentation to inflate performance measures such as core
4 While we explicitly incorporate the magnitude of the special item into our research design, we are unaware of any
rules imposing an income statement presentation requirement based on materiality. Firms are required to “identify” (i.e., disclose) all material events; however, they have discretion in the presentation decision as it relates to the financial statements, including the income statement. As an example, the SEC raised questions to IBM regarding its 1999 annual report, in which IBM aggregated a $4.06 billion gain from the sale of a subsidiary, which was identified in the footnotes but presented as an offsetting item within SG&A on the income statement. However, the matter was subsequently dropped, and IBM was not required to amend its filings (Bulkely 2002).
9
earnings. Thus, we examine whether management presentation of special items reflects
informational or opportunistic motivations, on average.
To disentangle these motivations, we will use the persistence of reported special items to
discern their economic content. Accordingly, informational motivations will be evidenced by
income statement (footnote) presentation of special items that are more transitory (persistent) in
nature. Conversely, opportunistic motivations will be evidenced by income statement (footnote)
presentation of special items that are more persistent (transitory) in nature. Thus, we will provide
evidence on whether the disaggregation of special items (reflected in their income statement
presentation) is justified relative to the aggregation of special items (reflected in their footnote
presentation) by examining the relative persistence of these two groups of special items to assess
their economic content.
However, persistence can only partially disentangle whether informational versus
opportunistic motivations underlie the presentation of special items. In particular, opportunism
can affect both the presentation and recognition of special items. Regarding the latter, prior
research provides evidence that “big bath” reporting incentives affect the recognition of special
items (e.g., Francis, Hanna, and Vincent 1996; Riedl 2004), which may create a competing
inference regarding the use of persistence. Specifically, under “big bath” reporting, managers
recognize excessive negative special items. These are likely to both receive income statement
presentation (as managers likely wish to frame such charges as non-recurring) and be transitory (as
the charges are economically excessive). Thus, for those special items likely to reflect “big bath”
reporting incentives, persistence can only partially disentangle the motivations underlying this
presentation.5
5 In this discussion, we focus on “big bath” reporting of special items, as other incentives to recognize special items
(such as income smoothing) do not lead to competing explanations regarding our persistence measure.

10
However, such incentives likely occur only in a particular portion of the distribution of
reported special items. Accordingly, we address this potential competing explanation by
decomposing observations into those likely to reflect “big bath” reporting incentives, and those
unlikely to reflect these incentives. We define “big bath” observations as those having the
following characteristics. First, the firm must report both net negative special items and large
negative special items, as “big bath” behavior should reflect net income-decreasing charges that
are substantial. Second, the firm must have missed an important earnings benchmark, as “big
bath” behavior reflects reporting of income that falls below some performance threshold (Riedl
2004). Thus, while the inferences regarding “big bath” observations (which represent
approximately 20% of our sample) may remain unclear, inferences regarding “non-big bath”
observations (which represent approximately 80% of our sample) should be unaffected by any
alternative explanation.
3. Research Design
Our research design employs two primary tests. First, we model the determinants of the
presentation of special items. Second, we examine whether the persistence of special items varies
across the presentation decision. Consistent with the above discussion, for both analyses we also
separately examine “big bath” versus “non-big bath” observations to better identify special items
where informational versus opportunistic motivations are more likely to occur.
Determinants of Financial Statement Presentation of Special Items
We use the following model to examine the determinants of management’s presentation of
special items separately on the income statement (income statement presentation) versus

11
aggregated into another line item with identification only via footnote disclosure (footnote
presentation):
SI_Sepjt = δ0 + δ1YEAR t + δ2SIZEjt + δ3INSTjt + δ4SI_MAGjt
+ δ5SI_PERSISTjt + δ6NSIjt + δ7MISS_PYEjt + δ8BEAT_PYEjt + φjt (1)
We estimate this model under two specifications. First, under an OLS specification, we define
SI_Sep as the percentage of special items reported within a separate line item on the income
statement for firm j in fiscal year t. This is measured as the absolute amount of special items
identified in a separate line item on the income statement, divided by the absolute amount of total
reported special items; thus, the variable ranges in value from 0 to 1, inclusive. Note that positive
(i.e., income-increasing) and negative (i.e., income-decreasing) special items are not netted in this
calculation.6 Second, since our dependent variable has significant clustering at the end points of
its distribution, we also examine a logistic specification. Here, we define SI_Sep as an indicator
variable equal to 1 when any reported special items receive income statement presentation, and 0
when all reported special items receive footnote presentation. This is akin to suggesting that the
highlighting of any special item serves as a “red flag” for users to look for other related items.
Our model includes four control variables. First, we include YEAR (the year) as the
likelihood of presenting special items separately on the income statement may be changing over
time; for example, pro forma reporting increased over our sample period (e.g., Bradshaw and
Sloan 2002). Second, we include SIZE (the log of firm j’s year t sales) to control for differing
investing and information environments across variously sized firms on the presentation decision.
6 For example, consider a firm having a $40 write-off and $10 gain in year 19XX. If the firm reports both items
separately on the income statement, then SI_Sep = 1 (50/50). If the firm reports only the write-off separately, with the gain aggregated within another line item, then SI_Sep = .80 (40/50). If the firm reports only the gain separately, with the write-off aggregated, then SI_Sep = 0.20 (10/50). If the firm aggregates both items within other line items, then SI_Sep = 0 (0/50). Thus, we consider all special items as absolute amounts individually to define SI_Sep, as netting may obscure presentation differences, particularly across positive/negative special items.

12
Third, we include INST (the percentage of firm j’s common shares outstanding owned by
institutions at the end of year t, measured using Spectrum), with institutional owners representing
sophisticated users, which may affect this presentation decision. However, the effects of YEAR,
SIZE and INST on this presentation are unclear ex ante; accordingly, we do not predict a sign for
δ1, δ2, or δ3. Finally, we include SI_MAG (firm j’s total reported special items divided by total
assets at the beginning of year t), as the likelihood of reporting special items as a separate line item
should be increasing in the magnitude of the special item, consistent with materiality affecting
management presentation decisions. Thus, the predicted sign for δ4 is positive.
We then include four experimental variables. Of primary interest, we first examine if the
economic characteristics of the reported special items affect the presentation decision. This seems
warranted, as standard-setter interest regarding the interpretation of income statement reporting
elements surrounds the correct weighting users should apply with respect to predicting future
performance (FASB 1980). Accordingly, we use as an economic characteristic the special items’
ability to predict the firm’s future performance, thus applying an ex post measure to assess the
economic content of the reported special item. To capture future performance, we use the firm’s
one-year ahead earnings (before special items) for the following reasons. First, future earnings is
a key performance measure for valuation. Second, prior research suggests that special items have
serial correlation (e.g., Elliott and Hanna 1996; Arner 2004), and may affect other components
(including “recurring” components) of net income. Finally, we use one-year ahead earnings as
any continuing economic implications of reported special items, while potentially affecting
multiple future periods, are likely to manifest in the immediately subsequent period.
Accordingly, we include SI_PERSIST, measured as follows. We estimate regressions of
earnings before special items for year t+1 on earnings before special items for year t and special

13
items for year t. We use all available data from Compustat, estimating annual regressions for each
3-digit SIC industry, which will capture the economics of similar firms in similar time periods.
Thus, SI_PERSIST reflects the observed coefficient on special items, i.e., the vector of the year-
industry persistence parameters for special items.7
Recall that we wish to identify whether the presentation decision reflects informational
versus opportunistic motivations, on average. Regarding SI_PERSIST, informational motivations
would suggest that managers use income statement presentation to highlight those special items
that are more transitory in nature, and footnote presentation for those special items that are more
likely to having recurring (i.e., persistent) implications for firm performance. That is,
disaggregation of special items via income statement presentation is informational when those
special items have different economic characteristics (lower persistence) than special items that
are aggregated with other income statement items and disclosed via footnote presentation. Thus,
under informational motivations, we would expect the manager to provide income statement
(footnote) presentation for those special items that are economically more transitory (persistent) in
nature, leading to a predicted negative sign for δ5.
In contrast, opportunistic motivations in this presentation decision likely reflect incentives
(such as capital market pressures to meet particular benchmarks) for managers to inflate current
7 That is, we estimate the following regression by industry i and year t: E*jt+1 = λ0 + λ1E*jt + λ2SIjt + νjt where E*jt+1 (E*jt) is earnings before special items for firm j for year t+1 (year t), and SIjt is reported special items
per Compustat for firm j for year t. All variables are scaled by beginning market value of equity. Thus, SI_PERSIST is the vector consisting of i X t estimates of λ2 obtained from the industry-year regressions.
We use Compustat data to obtain this variable, versus our smaller sample of hand-collected special items data, in order to increase the sample size. Thus, in the current analysis we estimate the regressions cross-sectionally within a year, instead of in a time-series within a firm. Alternatively, we could estimate firm level parameters. However, the relative infrequency of reporting special items for any individual firm across our 10-year sample period makes it impractical to compute firm-specific estimates of the parameter on special items. Note, for industry-years having less than 20 observations, we aggregate to the 2-digit SIC level.
Results are unchanged using alternative specifications to obtain SI_PERSIST (e.g., defining the dependent variable as earnings versus earnings before special items; obtaining coefficients at the 2-digit SIC level; winsorizing the distribution of special items parameters).

14
period core earnings.8 If managers wish to artificially inflate core earnings, they would provide
income statement presentation for any special item that reduces net income, attempting to
highlight these as transitory regardless of their economic content. Similarly, managers would
provide footnote presentation for any special items that increase net income, attempting to
designate these as persistent regardless of their economic content. That is, disaggregation of
special items via income statement presentation is opportunistic when those special items have
different economic characteristics (higher persistence) than special items that are aggregated with
other income statement items and disclosed via footnote presentation. Thus, under opportunistic
motivations, we would expect the manager to provide income statement (footnote) presentation for
those special items that are economically more persistent (transitory) in nature, leading to a
predicted positive sign for δ5.
Next, we argue that the effect of the special item on net income (i.e., whether it is a
positive special item (PSI) or negative special item (NSI)) affects this presentation decision.
Accordingly, we include NSI, an indicator variable equal to 1 if the firm has negative special
items, and 0 otherwise. Prior research suggests NSI are more transitory than PSI (Burgstahler,
Jiambalvo, and Shevlin 2002), and are more likely to be separately presented on the income
statement (Kinney and Trezevant 1997) and in press releases (Weiss 2001), suggesting a positive
predicted sign for δ6.9 However, management may wish to downplay income-decreasing special
items (i.e., “bad news” such as write-offs), suggesting NSI are less likely to receive income
statement presentation than PSI (i.e., a negative predicted sign for δ6). Thus, we do not predict the
sign on δ6. Note, too, that informational versus opportunistic motivations cannot be disentangled
8 We do not examine particular contracting incentives (e.g., compensation like bonus thresholds, or debt restrictions
like covenants), as presentation is unlikely to affect calculations embedded in such contracts. 9 While Kinney and Trezevant (1997) documents that NSI are more likely to be shown on the face of the income
statement than PSI, the paper applies only a univariate analysis on a limited sample of firms.

15
with this coefficient; nonetheless, a positive (negative) coefficient for δ6 is consistent with
management being more likely to present NSI (PSI) as a separate line item.
Finally, we include two proxies to directly examine whether opportunistic motivations
underlie the presentation decision. Both focus on whether the special item causes the firm to miss
or beat prior year’s earnings, as prior research documents that benchmarks affect the recognition
of special items (e.g., Riedl 2004) and their presentation in press releases (e.g., Schrand and
Walther 2000; Lougee and Marquardt 2004). We use prior year’s earnings measured before
special items and extraordinary items (i.e., “operating earnings”) as a benchmark, versus other
constructs such as consensus earnings forecasts, as there is variation in how analysts
include/exclude special items in their forecasts (e.g., Gu and Chen 2004). Accordingly, we first
include MISS_PYE, an indicator variable equal to 1 if the reported special items cause operating
earnings to all below prior year operating earnings, and 0 otherwise. The predicted sign for δ7 is
positive, as management would wish to highlight that such an item is transitory, and thus should
not be considered a part of current year’s “core earnings.” We then include BEAT_PYE, an
indicator variable equal to 1 if the reported special items cause operating earnings to be above
prior year operating earnings, and 0 otherwise. The predicted sign for δ8 is negative, as
management would wish to de-emphasize that beating prior year’s earnings is attributable to a
current year special item (similar to Schrand and Walther 2000). Note that each variable captures
specific distributions of the (net) NSI and PSI, respectively. For example, while all NSI reduce
earnings by definition, only a subset of firms reporting NSI will miss prior year’s earnings as a
direct result of reporting the NSI. Similarly, while all PSI increase earnings by definition, only a
subset of firms reporting PSI will beat prior year’s earnings as a direct result of reporting the PSI.

16
Consistent with our previous discussion, we first apply Equation (1) to the full sample, and
then separately to the sub-samples of “big bath” and “non-big bath” observations. We define “big
bath” observations as those with all of the following characteristics: report net negative special
items; report “large” negative special items (defined, consistent with prior research, as total
negative special items exceeding 1% of lagged total assets – see Elliott and Shaw 1988, and Elliott
and Hanna 1996); and that miss prior year’s earnings due to the special item. Because “non-big
bath” observations should be unaffected by “big bath” incentives to recognize special items, this
sub-sample should provide the cleanest inferences regarding informational versus opportunistic
motivations for the presentation decision.
Presentation of Special Items and Earnings Persistence
In the previous analysis, we measure persistence of the special items at an average (i.e.,
industry) level. We now alternatively employ the following analysis examining the presentation
of special items and earnings persistence (similar to Burgstahler, Jiambalvo, and Shevlin 2002),
which allows a more direct measure of firm-level persistence of reported special items:
Ejt+1 = α0 + α1E*jt + α2SI_ISjt + α3SI_FNjt + γjt (2)
Ejt+1 is earnings for firm j for year t+1. E*jt is earnings before special items for firm j for year t.
SI_ISjt is special items receiving income statement presentation for firm j for year t. SI_FNjt is
special items receiving footnote presentation firm j for year t. For this analysis we use signed
(versus absolute) special item amounts.10 All variables are scaled by market value of equity at the
beginning of year t.
10 Equation (1) uses absolute special items to avoid netting in the context of the presentation decision. The current
analysis of Equation (2) uses signed special items, which better reflects their mapping into future performance.

17
This analysis examines the predictive content of current period earnings and special items
for future (one-period ahead) earnings; thus, we again use an ex post measure of future
performance to assess the economic content (that is, the persistence) of the reported special item.
If managers correctly ex ante identify those special items that are economically more transitory,
and emphasize them via income statement presentation, informational motivations predict α2 < α3.
Alternatively, if managers use income statement presentation to highlight as transitory those
special items that economically are more persistent, opportunistic motivations predict α2 > α3.
To again better disentangle the informational versus opportunistic motivations, we
incorporate the “big bath” reporting incentive into Equation (2) by estimating the following:
Ejt+1 = β0 + β1E*jt + β2SI_ISjt + β3SI_FNjt + β4SI_IS_BATHjt + β5SI_FN_BATHjt + θjt (2a)
SI_IS_BATH (SI_FN_BATH) are special items receiving income statement (footnote) presentation
for those observations likely to reflect “big bath” reporting incentives. We define “big bath”
observations as in Equation (1). All other variables are as defined in Equation (2). While it is
unclear whether informational versus opportunistic motivations can be disentangled for the “big
bath” observations (i.e., β4 and β5), the inference should be unambiguous for the “non-big bath”
observations (i.e., β2 and β3).
While we expect consistency across our two analyses, Equation (2) may have less
measurement error in the sense that it takes the presentation of special items (which is directly
observable) as given, and estimates the “persistence” parameter (which is not directly observable).
Thus, it estimates the effect of presentation on persistence. In contrast, the Equation (1) design
takes persistence as given, and estimates the “presentation” parameter (i.e., estimates the effect of
persistence on presentation). Use of both methods should provide additional robustness to our
inferences.

18
4. Sample Selection and Descriptive Data
To allow for a richer analysis, we derive a sample of firms to obtain a full decomposition
of reported special items (see Table 1). We first identify all firm-years falling within the S&P
1500 during the period 1993 – 2002. Our restriction to this subset enables us to capture a broad
cross-section of firms while focusing our analysis on a relatively large proportion of U.S. market
capitalization. Due to the cost of hand-collection of data, we randomly choose 500 firms from
among all firms that fall within the S&P 1500 during our sample period. We include all available
firm-years for these firms within the sample period, resulting in a sample of 4,695 firms-years.11
We then hand-collect and categorize all special items using the firm’s 10-Ks, annual
reports, and/or 10-Qs. Our collection includes performing key word searches within electronic
source documents, as well as scanning management discussion and analysis, the financial
statements, and footnotes for indications of special items, regardless of whether Compustat reports
that the firm has a special item. We also collect the presentation of special items (income
statement or footnote presentation) in the aggregate, by the sign of the special item, and within
each of three categories (restructuring, write-offs, and other).12, 13
Table 2 provides descriptive data for our sample. The average firm-year has total assets of
$8.4 billion, consistent with our selection criteria focusing on S&P 1500 firms. Over half of the
observations report special items (2,412 out of 4,695, or 51%). Of those reporting special items,
slightly more than half report large special items (1,279 out of 2,412, or 53%), and only negative 11 Various analyses use a subset of the 4,695 observations; these are noted where appropriate. 12 Reiterating our motivation for hand-collecting this data: during our sample period, Compustat does not identify the
category of the special item, nets positive and negative special items together, and does not provide information on the format of the special item’s presentation within the financial statements.
13 Restructuring charges include employee severance, facility closing, other, and restructuring reversals. Write-offs include write-offs of goodwill, intangibles, PP&E, investments, oil and gas properties, software, leases, inventory, and other. Other includes gains on settlements (both legal and insurance charges), losses on settlements, in-process R&D, gains on sales of assets, losses on sales of assets, merger related costs, and other.

19
special items (1,452 out of 2,412, or 60%). Special items are distributed widely across the three
primary categories of restructuring charges (46% of observations reporting special items), write-
offs (34%), and other (71%).14 Finally, there is substantial variation in firms’ presentation of
special items, with 55% (1,335 out of 2,412) presenting all special items as separate line items on
the income statement, 30% aggregating all special items in other line items on the income
statement with identification only via footnote disclosure, and 15% adopting mixed presentation.
Note that our analyses focus on this variation in the presentation decision, as reflected in the
bottom three rows and last two columns of Table 2.
5. Empirical Results
Descriptive Statistics and Univariate Results
Table 3 presents descriptive statistics for the sample used to examine the determinants of
income statement versus footnote presentation of special items. This sample focuses on those
observations reporting special items and having available data for Equation (1) (N = 2,228). Panel
A presents means and medians for the regression variables. Special items are typically reported as
a separate line item on the income statement (mean of SI_Sep = 0.646), and on average represent
approximately 5% of beginning total assets (mean of SI_MAG = 0.048). Special items have an
average persistence (SI_PERSIST) of 0.21, and 86% of observations reporting special items report
a negative special item (NSI = 0.859). Almost 21% of observations report negative special items
that result in the firm missing prior year’s earnings (MISS_PYE = 0.208), while only 4% report
positive special items that result in the firm beating prior year’s earnings (BEAT_PYE = 0.039).
This latter is consistent with the generally conservative nature of how special items are reported –
leading to a higher frequency (and concurrent greater impact on benchmarks) of negative than 14 The percentages do not sum to 100%, as a firm may report multiple categories of special items in any given year.

20
positive special items (see, for example, Basu 1997). Panel B presents Pearson correlations, with
univariate associations generally consistent with our previously discussed predictions.
Table 4 presents univariate comparisons of observations reporting special items under
income statement versus footnote presentation; for expositional convenience, we present results
only for the magnitude of special items (SI_MAG) and our key construct for economic
performance, the persistence of special items (SI_PERSIST). The table provides several insights.
Panel A, examining all observations with necessary data (N = 2,228), reveals that special items
receiving income statement presentation are larger in magnitude (e.g., SI_MAG mean of 0.062
versus 0.015) and less persistent (SI_PERSIST of 0.181 versus 0.304). Panels B and C decompose
the sample into observations likely to reflect “big bath” reporting incentives (N = 406) and those
unlikely to reflect these incentives (N = 1,822). In Panel B, within the subset of “big bath”
observations, larger special items are more likely to receive income statement presentation
(SI_MAG mean of 0.101 versus 0.054), but differences in persistence are insignificant
(SI_PERSIST mean of 0.135 versus 0.251). In Panel C, within the subset of “non-big bath”
observations, special items presented on the income statement are again larger (SI_MAG of 0.051
versus 0.011), as well as less persistent (SI_PERSIST of 0.199 versus 0.309). For the latter
observations, this provides preliminary evidence that this presentation decision reflects
informational motivations, as incentives to distort (i.e., “big bath” reporting incentives) are
unlikely to reside in this subsample. We now turn to the multivariate analysis for further
evidence.

21
Determinants of Financial Statement Presentation of Special Items
Table 5 presents results from OLS analyses examining the determinants of management’s
decision to present special items as a separate line item on the income statement. Focusing on all
observations (column 1, N = 2,228), of our control variables, SIZE is negatively associated with
this decision, consistent with larger firms being less likely to separately present special items. In
addition, the coefficient on INST is significantly positive, consistent with managers being more
likely to separately present special items as institutional ownership increases.15 Finally, SI_MAG
is positively associated with this decision, consistent with materiality affecting the presentation
decision, as larger special items are more likely to receive income statement presentation. The
coefficient on YEAR is negative and insignificant.16
Regarding our experimental variables, SI_PERSIST is negative and significant as predicted
(coefficient = –0.03, t-statistic = –2.89), indicating managers are more likely to provide income
statement presentation for those special items having lower persistence. This is consistent with
managers being able to identify more transitory special items ex ante, and using income statement
presentation to identify transitory versus recurring reporting items (i.e., for informational
motivations). In addition, NSI is positive and significant (coefficient = 0.12, t-statistic = 4.32),
indicating that ceteris paribus managers are more likely to present negative special items
separately on the income statement than positive special items. Of the reporting incentive
variables, only MISS_PYE is significantly positive as predicted (coefficient = 0.14, t-statistic =
5.78), indicating that managers are more likely to provide income statement presentation for
15 We alternatively include analyst following as a proxy for demand for transparent information, which also obtains a
significant positive coefficient. The other variables are unchanged. 16 Alternative specifications to control for temporal effects reveal similar results. First, we drop YEAR and instead
include year fixed-effects; inferences are unchanged. Second, we drop YEAR and estimate ten annual regressions (i.e., a Fama-Macbeth approach). Inferences are unchanged, with adjusted t-statistics as follows: SIZE = -3.68; INST = 4.83; SI_MAG = 4.22; SI_PERSIST = -1.95; NSI = 3.24; MISS_PYE = 6.19; and BEAT_PYE = 0.65.

22
special items that cause current year’s earnings to fall below previous year’s earnings. This is
consistent with managers using income statement presentation to highlight negative special items
that affect a relevant earnings benchmark (i.e., for opportunistic motivations). However,
BEAT_PYE is not significant and obtains the opposite to predicted sign.
The above results reveal that special items presented on the income statement are more
transitory than those presented in the footnotes. This is consistent with the presentation choice
reflecting informational motivations, that is, to better highlight for users those items having lower
persistence. However, observations in which “big bath” reporting incentives may exist have a
competing explanation: that managers are misreporting (i.e., recognizing) special items, calling
into question our use of persistence to distinguish informational versus opportunistic motivations
across all observations. Accordingly, we now conduct analyses focusing on subsets of
observations likely to reflect “big bath” incentives versus those unlikely to reflect such incentives
to better isolate the motivations underlying this presentation decision. Columns (2) and (3)
present OLS results for these two subsamples.
Focusing on the “big bath” observations (N = 406), column (2) reveals similar inferences
for the control variables as revealed for all observations. However, the experimental variable
SI_PERSIST is insignificant (–0.03, t-statistic = –1.27). Note that this analysis excludes the
variables NSI, MISS_PYE, and BEAT_PYE, as there is no variation in these variables due to the
sub-sample definition (e.g., all observations have NSI). Turning to the “non-big bath”
observations (N = 1,822), column (3) again reveals results for the control variables that are similar
to those presented for all observations. Of the experimental variables, only SI_PERSIST (–0.03, t-
statistic = –2.47) and NSI (0.12, t-statistic = 4.03) are significant. Interestingly, neither of the
incentive variables are significant (MISS_PYE, t-statistic = –0.34; BEAT_PYE, t-statistic = 1.63).

23
If this subsample reasonably identifies observations unlikely to be affected by “big bath” reporting
incentives, the latter results are consistent with the presentation decision for this subset of special
items reflecting informational motivations.
Table 6 presents results using a logistic specification applied to the full sample (column 1),
the “big bath” sample (column 2), and the “non-big bath” sample (column 3). Results are
unchanged from those discussed for the OLS specification above. In addition, untabulated results
are unchanged estimating a second logistic specification, defining the dependent variable, SI_Sep,
as an indicator variable equal to 1 if management provides income statement presentation for all
reported special items, and 0 if management provides footnote presentation for all reported special
items (i.e., excluding observations having a mixed presentation).
Presentation of Special Items and Earnings Persistence
Table 7 presents results from analyses examining the presentation of special items on the
income statement and earnings persistence. Column (1) provides a benchmark, revealing that
special items (SIt) have lower persistence than earnings before special items (E*t) in predicting
one-year ahead earnings, consistent with prior research (Burgstahler, Jiambalvo, and Shevlin
2002) (untabulated results indicate the difference is significant at the less than 1% level). Column
(2) reveals that special items presented in the footnotes (SI_FNt) are more persistent (coefficient =
0.26) than those receiving income statement presentation (SI_ISt) (coefficient = 0.09) (F-value on
difference = 8.16). This is consistent with the presentation decision reflecting informational
motivations, as those special items receiving income statement (footnote) presentation are more
transitory (persistent).

24
Column (3) presents results incorporating the effects of the “big bath” observations. For
the baseline observations – that is, “non-big bath” observations unlikely to reflect “big bath”
incentives – special items receiving income statement presentation (SI_IS = 0.09) are less
persistent than those receiving footnote presentation (SI_FN = 0.18), with a difference that is
statistically significant (p-value = 0.10; F-statistic = 1.48). Because these observations should be
unaffected by “big bath” incentives, these results are consistent with managers using the
presentation decision of special items for informational motivations. For the “big bath”
observations, the table also reveals that special items receiving income statement presentation
(SI_IS_BATH = 0.04) are less persistent than those receiving footnote presentation (SI_FN_BATH
= 0.21), with a difference that is again statistically significant (p-value = 0.09; F-statistic = 1.68).
Because the “big bath” observations may reflect bias in the recognition of the reported special
items, we are unable to disentangle opportunism versus informational motivations for these
observations.
6. Sensitivity Analyses
In this section, we conduct several sensitivity analyses to validate our results. First, we
partition on the magnitude of special items. Second, we examine partitions on the sign and
category of special items. Third, we examine an alternative disclosure context: press releases.
Finally, we conduct analyses on several subsamples.
Partitioning on the Magnitude of Special Items
Table 8 presents results for analyses partitioning the sample into large and small special
items. This analysis is warranted, if our previous decomposition of the sample into “big bath” and
25
“non-big bath” observations does not fully capture observations affected by “big bath” reporting
incentives. Thus, the “large” designation will capture any observation reporting substantial special
items (i.e., having “big bath” incentives). In contrast, small special items should be unaffected by
these incentives. Consistent with prior research (e.g., Elliott and Hanna 1996), we define large
(small) special items as those in aggregate that are greater than or equal to (less than) 1% of lagged
total assets. Note, that small special items remain material enough to be identified by
management, and on average are 0.4% (approximately 10%) of the firm’s beginning assets (net
income) (see Table 2).
Panel A presents results for Equation (1), examining the determinants of the decision to
present special items on the income statement. Focusing on the experimental variables, column
(2) for the “large special items” observations reveals that our proxy for economic content,
SI_PERSIST, is negative but insignificant (–0.01, t-statistic = –0.74) and the one proxy for
reporting incentives, MISS_PYE, is positive and significant (0.06, t-statistic = 2.52). The other
experimental variables are insignificant. Under column (3) for the “small special items”
observations, SI_PERSIST is significantly negative (–0.05, t-statistic = –2.82), and NSI (0.07, t-
statistic = 1.75) is also marginally significant. The other experimental variables are insignificant.
These results confirm our earlier findings, as the presentation of small special items appears to
reflect informational motivations evidenced in the variable SI_PERSIST. In contrast, the large
special items reflect some evidence of opportunism, evidenced in the variable MISS_PYE.
Panel B presents results for Equation (2), examining the presentation of special items and
earnings persistence.17 Columns (1) and (2) provide baseline regressions, with results similar to
those presented in Table 7. Columns (3) and (4) present results for large (N = 1,016) and small (N
17 Note for this estimation, we exclude observations reporting no special items (whereas in Table 7 these are
included). This exclusion is done to simplify the decomposition of the sample into large and small special items observations (i.e., so that the samples are additive). Results are unaffected by the exclusion of these observations.

26
= 819) special items observations, respectively. Focusing on the test of differences across the
presentation of special items, special items receiving income statement presentation are less
persistent for both large special items (difference = –0.09, F-statistic = 2.13) and small special
items (difference = –0.35, F-statistic = 2.08). If the small special items are unaffected by “big
bath” reporting incentives, results for this sub-sample remain consistent with managers using the
presentation decision primarily for informational reasons.
Partitioning on the Sign and Category of Special Item
We now examine the consistency of our results across two additional partitions of the data:
the sign and category of reported special items. Regarding the sign of special items, we examine
if differential persistence exists across the presentation of special items, conditional on their signed
effect on reported income (i.e., positive special items, or PSI, and negative special items, or NSI)
(Burgstahler, Jiambalvo, and Shevlin 2002). Untabulated results reveal consistent directional
evidence that special items presented in the income statement are less persistent than those
presented in the footnotes for both positive and negative special items; however, significance
levels vary depending on the sub-sample employed.
Regarding the category of special items, we examine if differential persistence exists
across the presentation of special items, conditional on the category (i.e., restructuring, write-off,
and other) (e.g., Francis, Hanna, and Vincent 1996). Untabulated results again reveal consistent
directional evidence that special items receiving income statement presentation are less persistent
than those receiving footnote presentation within all three categories of special items. However,
significance of these differences again varies depending on the sub-sample. Overall, this
sensitivity analysis extends the finding that special items presented on the income statement are

27
more transitory than those in the footnotes, by revealing this difference in persistence exists even
within the sign and categories of special items.
Consistency Across Alternative Disclosure Media: Press Releases
Because managers have multiple avenues for providing information, the presentation
decision on the income statement may also reflect a disclosure decision in these alternative
mechanisms, the most common of which are earnings press releases and conference calls. Due to
data availability, we focus on earnings announcements.18 We hand-collect annual earnings press
releases for a subsample of observations reporting special items to provide a comparative analysis
of managers’ decision to discuss special items in their press releases relative to their decision to
present special items on the income statement. We begin with all observations having special
items (N = 2,412), retaining only those in which the source of the press release from Factiva is
either Business Wire (BW) or Press Release Newswire (PRN), leading to 1,514 available
observations.19 Due to the cost of hand-collection, we randomly select one-half of the
observations (N = 762), reading the annual press releases to identify any discussion of the special
items (i.e., in the headline, text, or any tabulated financial statements). This will capture (in a
binary sense) managers’ highlighting of special items in the press release. Untabulated results
show a strong positive association between discussion in the press release and income statement
presentation (correlation = 0.36, probability < 0.001).
18 In particular, an analysis of conference call data relating to the presentation/discussion of special items would
require availability of transcripts to identify the nature of management discussion regarding these items. However, conference call transcripts are not widely available for most of our sample period.
19 We impose this restriction to focus our analysis on direct (i.e., unedited) management disclosures. Press releases from other sources (such as Dow Jones or Reuters) may experience editing of the original disclosure with unclear implications for our analysis. Test of means comparing observations with versus without BW/PRN press releases reveal no significant differences in either firm (e.g., size, profitability) or special items (e.g., magnitude, income statement presentation) characteristics.
28
We re-estimate a logistic analysis (N = 725), similar to Equation (1), examining the
decision to discuss the special items in the press release; thus, the dependent variable is
SI_Sep_PR, defined as an indicator variable equal to 1 if the special items are explicitly discussed
or identified anywhere in the annual press release, and 0 otherwise. Our predicted signs on all of
the variables are unchanged, with untabulated results similar to those presented in Table 6.
Among the experimental variables, NSI and MISS_PYE remain positive and significant; and
SI_PERSIST is negative, but insignificant. This provides limited support that the determinants of
the presentation on the income statement are similar to those within the press release.
Subsample Analyses
Finally, we examine several subsamples to further validate our inferences. We first
examine the subset of observations reporting both PSI and NSI within a fiscal year. We obtain the
percentage of observations reporting PSI as a separate line item on the income statement, and
compare this to the same percentage for NSI using tests of means. Across a range of cutoffs, we
find that NSI are consistently more likely than PSI to receive income statement presentation
(conditional on reporting both). We then re-estimate Equation (2) (N = 447), finding that PSI have
higher persistence (coefficient = 0.50, t-statistic = 7.41) than NSI (coefficient = 0.16, t-statistic =
3.34), with a difference that is significant at the < 1% level. This corroborates our previous
finding that NSI are more likely to receive income statement presentation than PSI due to
informational (versus opportunistic) motivations, as NSI are more transitory even for firms
reporting both NSI and PSI.
Second, we examine the within firm presentation of special items over time, as the
presentation decision may reflect a one-time disclosure policy choice. That is, we examine

29
whether firms consistently present special items using either income statement or footnote
presentation across all sample years in which they report special items, versus changing from one
presentation method to another. Untabulated descriptive results reveal that 85% (426) of our
sample firms report special items in multiple years; of these, most (320, or 75%) change their
presentation behavior at least once during our sample period. Overall, this suggests that most
firms do not follow a sticky presentation decision regarding special items. We then focus on the
subset of observations wherein the firm reports a special item for the first time within our sample
period, allowing us to better isolate the initial presentation decision. We re-estimate Equation (1)
with this subsample (N = 448), with untabulated results consistent with those previously reported.
We also re-estimate Equation (1) for the full sample, now including an additional control variable:
the presentation of special items in the most recent year having a special item (LAG_SI_Sep).
Untabulated results are similar to those reported, except INST is of the same sign but no longer
significant (t-statistic = 1.34); LAG_SI_Sep is positive and significant (t-statistic = 20.60).20
Finally, we examine the subset of firms providing mixed presentation of special items: that
is, firms reporting some special items using income statement presentation, and some special items
using footnote presentation. Re-estimating Equation (1) for this subsample (N = 327), inferences
are unchanged; similarly, re-estimating Equation (2) (N = 250) reveals that special items receiving
income statement presentation are more transitory than those receiving footnote presentation.
Overall, the results of these subsample analyses corroborate our findings that managers appear to
provide income statement presentation for special items that are more transitory, consistent with
informational versus opportunistic motivations.
20 Note that we do not include LAG_SI_Sep in our primary model, as we are attempting to model the underlying
determinants of the presentation decision, versus document serial presentation behavior per se.

30
7. Conclusion
This paper examines whether managers’ presentation decisions within the financial
statements reflect informational motivations (that is, revealing the underlying economics of the
firm) or opportunistic motivations (that is, attempts to bias perceptions of firm performance).
Specifically, we examine managers’ decision to present special items separately on the income
statement (income statement presentation), versus aggregated in other line items with disclosure in
the footnotes only (footnote presentation). This analysis is motivated by prior research, which
provides evidence that managers engage in opportunistic reporting in other presentation decisions
(e.g., Schrand and Walther 2000; Bhattacharya et al. 2003), as well as evidence that managers’
financial statement presentation decisions can affect users’ judgments (Hirst and Hopkins 1998;
Maines and McDaniel 2000; Libby, Nelson, and Hunton 2005). It is also motivated by standard-
setters’ interest in performance reporting and financial statement presentation (FASB 2006; IASB
2006), as well as their movement towards reporting standards likely to increase the occurrence of
“non-recurring” type charges that are similar to special items, such as fair value changes.
Overall, our results consistently reveal that special items receiving income statement
presentation are more transitory than those receiving footnote presentation. For observations
reporting special items that are unlikely affected by “big bath” reporting incentives (representing
over three-quarters of our special items observations), these results are consistent with managers
using discretion in the financial statement presentation of special items for informational reasons.
For observations reporting special items likely to reflect “big bath” reporting incentives (less than
one-quarter of our special items observations), we provide limited evidence that opportunistic
motivations underlie this presentation decision. Overall, our results extend the findings of prior
research examining pro forma reporting by documenting that managers, in most instances, appear

31
to use the flexibility afforded in the presentation of special items to inform users of the underlying
economics of these items.

32
REFERENCES
Aboody, D. 1996. “Recognition versus Disclosure in the Oil and Gas Industry.” Journal of Accounting Research 34 (Supplement): 21-32.
Aboody, D., M. Barth, and R. Kasznik. 2004. “Firms’ Voluntary Recognition of Stock-Based
Compensation Expense.” Journal of Accounting Research 42 (May): 123-150. Accounting Principles Board (APB), 1973. Reporting the Results of Operations – Reporting the
Effects of Disposal of a Segment of A Business, and Extraordinary, Unusual and Infrequently Occurring Events and Transactions. Opinion No. 30. Norwalk, CT: FASB.
Arner, F. 2004. “Kodak’s Fuzzy Numbers: The company has taken ‘one-time’ charges every year
for the past twelve.” Business Week, February 9. Basu, S. 1997. “The Conservatism Principle and the Asymmetric Timeliness of Earnings.”
Journal of Accounting and Economics 24: 3-37 Bhattacharya, N., E. Black, T. Christensen, and C. Larson. 2003. “Assessing the Relative
Informativeness and Permanence of Pro Forma Earnings and GAAP Operating Earnings.” Journal of Accounting and Economics 36 (December): 285-319.
Bhattacharya, N., E. Black, T. Christensen, and R. Mergenthaler. 2007. “Who Trades on Pro
Forma Earnings Information?” The Accounting Review 82 (May): 581-619. Bowen, R., A. Davis, and D. Matsumoto. 2005. “Emphasis on Pro Forma versus GAAP Earnings
in Quarterly Press Releases: Determinants, SEC Intervention, and Market Reactions.” The Accounting Review 80: 1011-1038.
Bradshaw, M., and R. Sloan. 2002. “GAAP Versus The Street: An Empirical Assessment of Two
Alternative Definitions of Earnings.” Journal of Accounting Research 40 (March): 41-66. Brooks, L., and D. Buckmaster. 1976. “Further Evidence of the Time Series Properties of
Accounting Income.” Journal of Finance 31: 1359-1373. Bulkely, W. 2002. “SEC Urged IBM to Amend Its 1999 Annual Report.” Wall Street Journal,
March 28. Burgstahler, D., J. Jiambalvo, and T. Shevlin. 2002. “Do Stock Prices Fully Reflect the
Implications of Special Items for Future Earnings?” Journal of Accounting Research 40 (June): 585-612.
Dye, R. and S. Sridhar. 2004. “Reliability-Relevance Trade-offs and the Efficiency of
Aggregation.” Journal of Accounting Research 42 (March): 51-88.

33
Elliott, J., and J. D. Hanna. 1996. “Repeated Accounting Write-offs and the Information Content of Earnings.” Journal of Accounting Research 34 (Supplement): 135-155.
Elliott, J. and W. Shaw. 1988. “Write-offs as Accounting Procedures to Manage Perceptions.”
Journal of Accounting Research 26 (Supplement): 91-119. Elliot, W. 2006. “Are Investors Influenced by Pro Forma Emphasis and Reconciliations in
Earnings Announcements?” The Accounting Review 81 (January): 113-133. Fairfield, P., R. Sweeney, and T. Yohn. 1996. “Accounting Classification and the Predictive
Content of Earnings.” The Accounting Review 71 (July): 337-355. Financial Accounting Standards Board. 1980. Statement of Financial Accounting Concepts No.
2: Qualitative Characteristics of Accounting Information. FASB, Stamford, Connecticut. Financial Accounting Standards Board. 2006. Financial Statement Presentation – Joint Project
of the IASB and FASB (formerly known as Financial Performance Reporting by Business Enterprises). FASB, Stamford, Connecticut.
Francis, J., J. D. Hanna, and L. Vincent. 1996. “Causes and Effects of Discretionary Asset Write-
Offs.” Journal of Accounting Research 34 (Supplement): 117-134 Gu, Z. and T. Chen. 2004. “Analysts’ Treatment of Nonrecurring Items in Street Earnings.”
Journal of Accounting and Economics 38: 129 – 170. Healy, P. and K. Palepu. 2001. “Information Asymmetry, Corporate Disclosure, and the Capital
Markets: A Review of the Empirical Disclosure Literature.” Journal of Accounting and Economics 31: 405-440.
Hirst, E., and P. Hopkins. 1998. “Comprehensive Income Reporting and Analysts’ Valuation
Judgments.” Journal of Accounting Research 36 (Supplement): 47-75. Hodder, L., W. Mayew, M. McAnally, and C. Weaver. 2006. “Employee Stock Option Fair-
Value Estimates: Do Managerial Discretion and Incentives Explain Accuracy?” Contemporary Accounting Research 23 (Winter): 933-975.
International Accounting Standards Board. 2006. Board Decisions on International Financial
Reporting Standards: Update March 2006. IASB, London, UK. Johnson, W., and W. Schwartz. 2005. “Are Investors Misled by “Pro Forma” Earnings?
Contemporary Accounting Research 22 (Winter): 915-963. Kinney, M., and R. Trezevant. 1997. “The Use of Special Items to Manage Earnings and
Perceptions.” Journal of Financial Statement Analysis 3 (Fall): 45-53.

34
Libby, R., M. Nelson, and J. Hunton. 2005. “Recognition v. Disclosure and Auditor Misstatement Correction: The Cases of Stock Compensation and Leases.” Working paper, Cornell University.
Lipe, R. 1986. “The Information Contained in the Components of Earnings.” Journal of
Accounting Research 24 (Supplement): 37-64. Lougee, B., and C. Marquardt. 2004. “Earnings Informativeness and Strategic Disclosure: An
Empirical Examination of “Pro Forma” Earnings.” The Accounting Review 79 (October): 769-795.
Maines, L., and L. McDaniel. 2000. “Effects of Comprehensive-Income Characteristics on
Nonprofessional Investors’ Judgments: The Role of Financial-Statement Presentation Format.” The Accounting Review 75 (April): 179-207.
McVay, S. 2006. “Earnings Management Using Classification Shifting: An Examination of Core
Earnings and Special Items.” The Accounting Review 81 (October): 501-531. Riedl, E. 2004. “An Examination of Long-Lived Asset Impairments.” The Accounting Review 79
(October): 823-852. Schrand, C., and B. Walther. 2000. “Strategic Benchmarks in Earnings Announcements: The
Selective Disclosure of Prior-Period Earnings Components.” The Accounting Review 75 (April): 151-177.
Weiss, I. 2001. “Managerial Responses to a Transitory Earnings Shock: Strategic Manipulation
Between the Core and Non-Core Components of Earnings.” University of Chicago, unpublished dissertation.

35
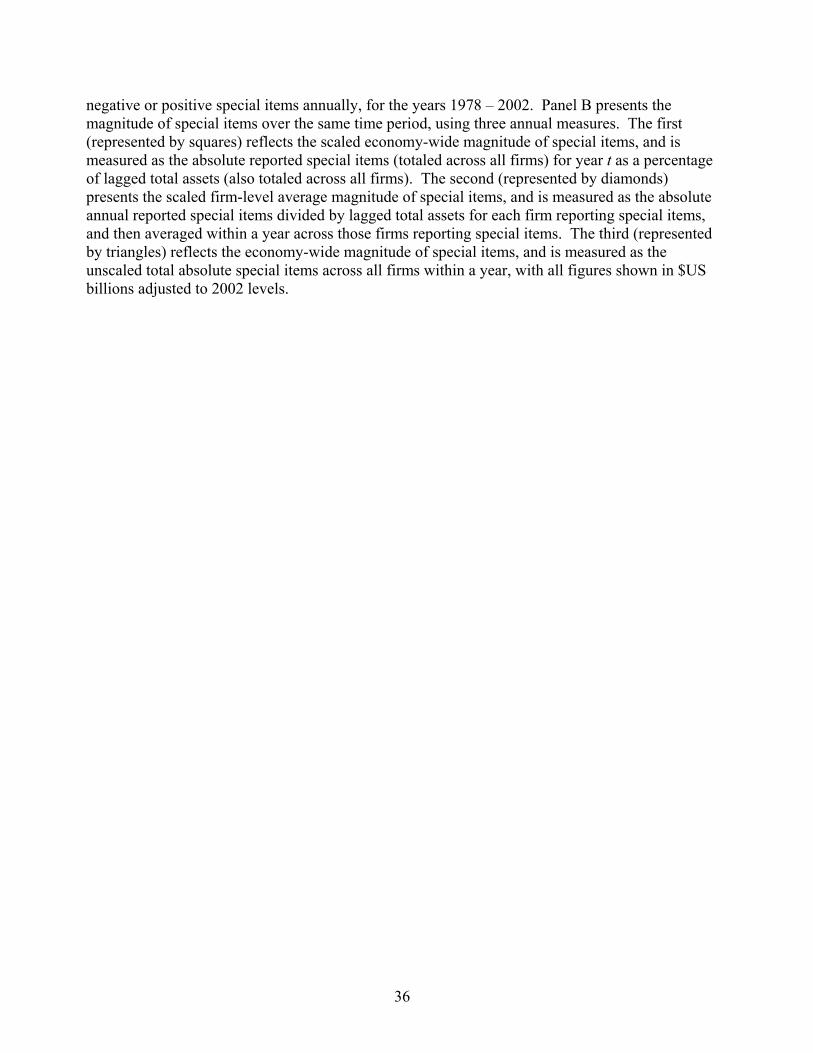
APPENDIX A Frequency and Magnitude of Reported Special Items: 1978 – 2002
Panel A: Frequency of Reported Special Items
0%
10%
20%
30%
40%
50%
1978
1980
1982
1984
1986
1988
1990
1992
1994
1996
1998
2000
2002
Perc
enta
ge o
f Firm
s R
epor
ting
Spec
ial I
tem
s Positive Special Items
Negative Special Items
Panel B: Magnitude of Reported Special Items
0%
2%
4%
6%
8%
10%
12%
1978
1980
1982
1984
1986
1988
1990
1992
1994
1996
1998
2000
2002
0.0
100.0
200.0
300.0
400.0Absolute Special Items/Total Assets - Economy WideAverage Special Items/Total Assets - Firm LevelAbsolute Special Items (2002 $US billions)
Notes: These figures present the increase in frequency and magnitude of reported special items over time, using annual Compustat data. Panel A presents the percentage of Compustat firms reporting
36
negative or positive special items annually, for the years 1978 – 2002. Panel B presents the magnitude of special items over the same time period, using three annual measures. The first (represented by squares) reflects the scaled economy-wide magnitude of special items, and is measured as the absolute reported special items (totaled across all firms) for year t as a percentage of lagged total assets (also totaled across all firms). The second (represented by diamonds) presents the scaled firm-level average magnitude of special items, and is measured as the absolute annual reported special items divided by lagged total assets for each firm reporting special items, and then averaged within a year across those firms reporting special items. The third (represented by triangles) reflects the economy-wide magnitude of special items, and is measured as the unscaled total absolute special items across all firms within a year, with all figures shown in $US billions adjusted to 2002 levels.

37
TABLE 1 Sample Selection
Firm Years
Firms
Available observations from Compustat Annual, 1993 – 2002 72,473 11,557 Observations designated as S&P 1500 by Compustat 1993 – 2002 14,400 a 2,466 All available observations for 1993 – 2002 for any firm designated as within the S&P 1500 during the sample period 20,198 2,466 Final Sample: Random selection of 500 firms, including all available years for 1993 – 2002 4,695 500
Notes: This table shows the sample selection process. We begin with all firm-years available on Compustat for the period 1993 – 2002, identifying all firms that are within the S&P 1500 at any point during this period. From these firms, we randomly choose 500. For the 500 firms selected, we then include all available firm-years for the sample period, leading to 4,695 observations representing 500 firms.
a Per discussion with Compustat, there are only 900 firms classified within the S&P 1500 for 1993; this results in 600 fewer available firm-years than expected (i.e., 15,000 – 14,400 = 600).

38
TABLE 2 Descriptive Data
N Unique Firms
Total Assetst
NIt NIt
(pre SI) SIt |SIt| / Total
Assetst-1
% SI Income
Statement Presentation
% SI Footnote
Presentation All Observations 4,695 500 8,449 207 271 (64) 2.5% 64% 36% By Existence of SI: No SI 2,283 477 5,461 171 171 - - - - SI 2,412 475 11,277 241 365 (124) 4.8% 64% 36% By Magnitude of SI: SI ≥ 1% Total Assetst-1 1,279 400 4,951 94 296 (203) 8.3% 76% 24% SI < 1% Total Assetst-1 1,133 500 18,418 408 443 (36) 0.4% 52% 48% By Sign of SI: Only NSI 1,452 451 10,185 202 329 (127) 5.5% 67% 33% Only PSI 349 215 8,419 342 295 46 3.3% 51% 49% Both NSI and PSI 611 267 15,496 277 492 (215) 4.0% 66% 34% By Category of SI: Restructuring 1,108 354 16,764 241 469 (229) 4.8% 74% 26% Write-off 836 359 7,465 76 315 (239) 6.5% 61% 39% Other 1,723 450 11,618 269 399 (130) 5.3% 63% 37% By Presentation of SI: All SI listed separately on income statement 1,335 399 12,265 171 317 (146) 6.1% 100% 0% All SI identified only in footnotes 733 309 9,274 340 383 (42) 1.6% 0% 100% Mixed presentation 344 196 11,687 304 516 (213) 6.5% 64% 36%

39
Notes: This table provides descriptive data for the observations used in our analyses. N is the number of observations. Unique firms is the number of unique firms within each grouping. We then report means of the following measures. Total Assetst is end-of-year total assets. NIt is annual net income before extraordinary items. NIt (pre SI) is annual net income before extraordinary items and special items. SIt is annual net reported special items, measured using hand-collected annual data from firms’ 10-Ks. The previous four variables are denoted in $ millions. |SI| / Total Assetst-1 is the absolute annual net reported special items divided by beginning-of-year total assets. % SI Income Statement Presentation is the average percent of the absolute total special items (not netted) that are presented on the firm’s income statement in a separate line item. % SI Footnote Presentation is the average percent of the absolute total special items (not netted) that are aggregated within another line item on the income statement and identified only via footnote disclosure.
We present the above measures for six groups of observations. First, All Observations is for the pooled observations. Second, we group observations according to the existence of special items: No SI reflect observations reporting no special
items; and SI reflect those reporting non-zero special items. Third, we group observations reporting special items based on the magnitude of total reported special items: SI ≥ 1% Total
Assetst-1 reflects observations reported where special items are greater than or equal to 1% of lagged total assets; and SI < 1% Total Assetst-1 reflects those where special items are less than 1% of lagged total assets.
Fourth, we group observations reporting special items based on the directional impact on net income: Only NSI reflect observations reporting only income-decreasing (i.e., negative) special items; Only PSI reflect observations reporting only income-increasing (i.e., positive) special items; and BOTH NSI and PSI reflect observations reporting both income-decreasing and income-increasing special items in the same fiscal year.
Fifth, we group observations reporting special items based on the category of reported special items: Restructuring reflect observations reporting any restructuring charges; Write-off reflect observations reporting any write-offs; and Other reflect observations reporting other categories of special items.
Finally, we group observations based on the presentation of the reported special items: All SI listed separately on income statement reflect observations wherein all special items are reported in separate line items on the income statement; All SI identified only in footnotes reflect observations wherein all special items are aggregated in other line items on the income statement and identified only via footnote disclosure; and Mixed presentation reflect observations wherein some special items are listed separately on the income statement and others are aggregated into other line items.

40
TABLE 3 Descriptive Statistics and Correlations
Panel A: Descriptive Statistics (N = 2,228) Variable Mean Median Standard Deviation SI_Sep 0.646 1.000 0.455 YEAR 1998 1999 2.722 SIZE 7.109 7.091 1.676 INST 0.681 0.693 0.223 SI_MAG 0.048 0.013 0.223 SI_PERSIST 0.218 0.140 0.823 NSI 0.859 1.000 0.348 MISS_PYE 0.208 0.000 0.406 BEAT_PYE 0.039 0.000 0.195
Panel B: Correlations (N = 2,228) SI_Sep YEAR SIZE INST SI_MAG SI_PERSIST NSI MISS_PYE YEAR –0.017 SIZE –0.079 *** 0.104 *** INST 0.073 *** 0.278 *** 0.063 *** SI_MAG 0.101 *** 0.013 –0.099 *** 0.009 SI_PERSIST –0.070 *** –0.055 *** 0.021 –0.049 ** 0.032 NSI 0.120 *** 0.092 *** 0.004 0.085 *** 0.025 –0.058 *** MISS_PYE 0.147 *** –0.067 *** 0.053 ** 0.009 0.082 *** –0.035 * 0.208 *** BEAT_PYE –0.001 –0.025 0.011 -0.066 *** 0.077 *** 0.025 –0.248 *** –0.104 ***
Notes: This table presents descriptive statistics (Panel A) and Pearson correlations (Panel B) for the variables used in the analysis examining management’s decision to present special items as a separate line item on the income statement (i.e., income statement presentation) versus aggregate them within another line item with identification only via footnote disclosure (i.e., footnote presentation). The sample is comprised of observations reporting special items and having available data for Equation (1) (N = 2,228).
SI_Sep is the absolute amount of (non-netted) annual special items presented in a separate line item on the income statement, divided by the absolute amount of total annual (non-netted) reported special items: thus it ranges in value from 0 to 1, inclusive.

41
YEAR is the year. SIZE is the log of the firm’s year t sales. INST is the percentage of the firm’s outstanding common shares owned by institutions at year end. SI_MAG is the absolute value of the total annual (non-netted) special items, divided by the firm’s beginning-of-period total assets. SI_PERSIST is the persistence parameter for year t special items on one-year ahead earnings before special items; the parameter is calculated by year and industry at the 3-digit SIC level. NSI is an indicator variable equal to 1 if the firm reports negative (income-decreasing) special items, and 0 otherwise. MISS_PYE is an indicator variable equal to 1 if the net special items cause the firm’s earnings to be below prior year earnings, and 0 otherwise. BEAT_PYE is an indicator variable equal to 1 if the net special items cause the firm’s earnings to be above prior year’s earnings, and 0 otherwise. ***, **, * indicate significance at the less than 1%, 5%, and 10% levels for two-tailed tests, respectively.

42
TABLE 4 Univariate Comparison of Income Statement versus Footnote Presentation of Special Items
Income Statement Presentation
Footnote Presentation
Difference
Panel A: All Observations (N = 2,228)
(N = 1,555) (N = 673) Mean Median Mean Median Mean Median SI_MAG 0.062 0.019 0.015 0.005 0.047 *** 0.014 ^^^ SI_PERSIST 0.181 0.130 0.304 0.169 –0.123 *** –0.039 ^
Panel B: Big Bath Observations (N = 406)
(N = 352) (N = 54) Mean Median Mean Median Mean Median SI_MAG 0.101 0.058 0.054 0.037 0.047 *** 0.021 ^^^ SI_PERSIST 0.121 0.135 0.251 0.024 –0.130 0.111
Panel C: Non-Big Bath Observations (N = 1,822)
(N = 1,203) (N = 619) Mean Median Mean Median Mean Median SI_MAG 0.051 0.013 0.011 0.005 0.040 *** 0.008 ^^^ SI_PERSIST 0.199 0.128 0.309 0.169 –0.110 *** –0.041 ^
Notes: This table presents univariate comparisons of select variables across two groups of observations: those in which the firm presents any recognized special items as a separate line item on the income statement (“Income Statement Presentation”), and those in which the firm aggregates all recognized special items into other line items, with identification only via footnote disclosure (“Footnote Presentation”). Only those observations having sufficient data to estimate Equation (1) are included. Note that observations in which the firm adopts a mixed presentation (N = 395) are classified as having “income statement presentation.” Panel A includes all observations reporting special items (N = 2,228). Panel B includes “Big Bath Observations,” i.e., those in which net special items are income-decreasing, total negative special items exceed 1% of lagged total assets, and the special items cause the firm to miss prior year’s earnings (N = 406). Panel C includes “Non-Big Bath Observations,” i.e., all other observations reporting special items (N = 1,822). SI_MAG is the absolute value of the total annual (non-netted) special items, divided by the firm’s beginning-of-period total assets. SI_PERSIST is the persistence parameter for year t special items on one-year ahead earnings before special items; the parameter is calculated by year and industry at the 3-digit SIC level. ***, **, * (^^^, ^^, ^) indicate significance at the less than 1%, 5%, and 10% levels, respectively, for two-tailed tests comparing means (medians) across observations having “Income Statement Presentation” versus “Footnote Presentation.”
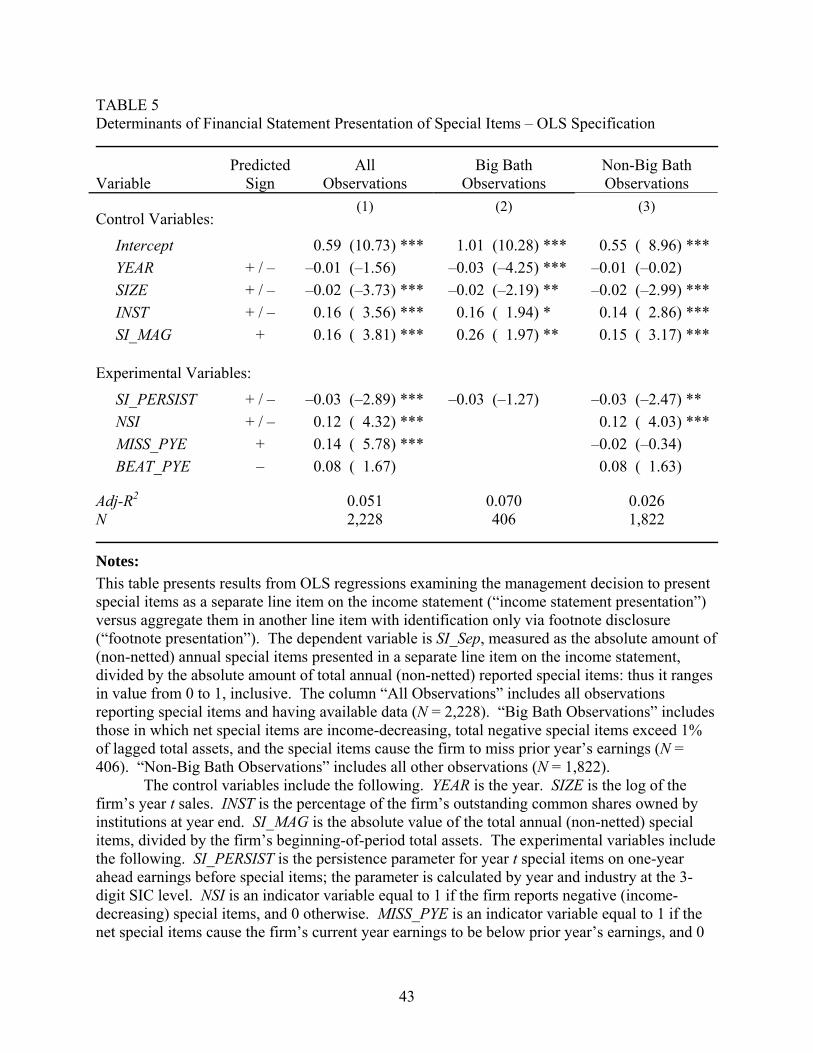
43
TABLE 5 Determinants of Financial Statement Presentation of Special Items – OLS Specification
Variable
Predicted Sign
All Observations
Big Bath Observations
Non-Big Bath Observations
Control Variables: (1) (2) (3)
Intercept 0.59 (10.73) *** 1.01 (10.28) *** 0.55 ( 8.96) *** YEAR + / – –0.01 (–1.56) –0.03 (–4.25) *** –0.01 (–0.02) SIZE + / – –0.02 (–3.73) *** –0.02 (–2.19) ** –0.02 (–2.99) *** INST + / – 0.16 ( 3.56) *** 0.16 ( 1.94) * 0.14 ( 2.86) *** SI_MAG + 0.16 ( 3.81) *** 0.26 ( 1.97) ** 0.15 ( 3.17) ***
Experimental Variables:
SI_PERSIST + / – –0.03 (–2.89) *** –0.03 (–1.27) –0.03 (–2.47) ** NSI + / – 0.12 ( 4.32) *** 0.12 ( 4.03) *** MISS_PYE + 0.14 ( 5.78) *** –0.02 (–0.34) BEAT_PYE – 0.08 ( 1.67) 0.08 ( 1.63) Adj-R2 0.051 0.070 0.026 N 2,228 406 1,822
Notes: This table presents results from OLS regressions examining the management decision to present special items as a separate line item on the income statement (“income statement presentation”) versus aggregate them in another line item with identification only via footnote disclosure (“footnote presentation”). The dependent variable is SI_Sep, measured as the absolute amount of (non-netted) annual special items presented in a separate line item on the income statement, divided by the absolute amount of total annual (non-netted) reported special items: thus it ranges in value from 0 to 1, inclusive. The column “All Observations” includes all observations reporting special items and having available data (N = 2,228). “Big Bath Observations” includes those in which net special items are income-decreasing, total negative special items exceed 1% of lagged total assets, and the special items cause the firm to miss prior year’s earnings (N = 406). “Non-Big Bath Observations” includes all other observations (N = 1,822).
The control variables include the following. YEAR is the year. SIZE is the log of the firm’s year t sales. INST is the percentage of the firm’s outstanding common shares owned by institutions at year end. SI_MAG is the absolute value of the total annual (non-netted) special items, divided by the firm’s beginning-of-period total assets. The experimental variables include the following. SI_PERSIST is the persistence parameter for year t special items on one-year ahead earnings before special items; the parameter is calculated by year and industry at the 3-digit SIC level. NSI is an indicator variable equal to 1 if the firm reports negative (income-decreasing) special items, and 0 otherwise. MISS_PYE is an indicator variable equal to 1 if the net special items cause the firm’s current year earnings to be below prior year’s earnings, and 0

44
otherwise. BEAT_PYE is an indicator variable equal to 1 if the net special items cause the firm’s current year earnings to be above prior year’s earnings, and 0 otherwise. We exclude NSI, MISS_PYE, and BEAT_PYE from column (2) as there is no variation in these variables for the “Big Bath Observations” due to the subsample definition.
t-statistics are in parentheses. ***, **, * indicate significance at the less than 1%, 5%, and 10% levels for the indicated one- or two-tailed tests, respectively. Standard errors are robust to heteroskedasticity and clustered by company.

45
TABLE 6 Determinants of Financial Statement Presentation of Special Items – Logistic Specification
Variable
Predicted Sign
All Observations
Big Bath Observations
Non-Big Bath Observations
Control Variables: (1) (2) (3)
Intercept –0.52 (–3.42) * 2.80 ( 8.66) *** –0.76 (–6.58) ** YEAR + / – –0.01 (–0.01) –0.16 (–6.41) ** 0.02 ( 0.75) SIZE + / – –0.01 (–0.14) –0.20 (–4.31) ** 0.02 ( 0.28) INST + / – 0.75 (10.67) *** 1.89 ( 6.34) ** 0.57 ( 5.59) ** SI_MAG + 18.25 (67.92) *** 5.52 ( 3.80) * 23.55 (62.17) ***
Experimental Variables:
SI_PERSIST + / – –0.14 (–5.87) ** –0.20 (–0.98) –0.13 (–4.50) ** NSI + / – 0.57 (17.61) *** 0.52 (14.75) *** MISS_PYE + 0.32 ( 4.52) ** 0.03 ( 0.01) BEAT_PYE – 0.01 ( 0.01) –0.11 ( 0.15) Wald Statistic 153.09 22.62 105.85 N 2,228 406 1,822
Notes: This table presents results from logistic regressions examining the management decision to present special items as a separate line item on the income statement (“income statement presentation”) versus aggregate them in another line item with identification only via footnote disclosure (“footnote presentation”). The dependent variable equals 1 if any special items receive income statement presentation, and 0 otherwise (i.e., all reported special items receive footnote presentation). The column “All Observations” includes all observations reporting special items and having available data (N = 2,228). “Big Bath Observations” includes those in which net special items are income-decreasing, total negative special items exceed 1% of lagged total assets, and the special items cause the firm to miss prior year’s earnings (N = 406). “Non-Big Bath Observations” includes all other observations reporting special items (N = 1,822).
The control variables include the following. YEAR is the year. SIZE is the log of the firm’s year t sales. INST is the percentage of the firm’s outstanding common shares owned by institutions at year end. SI_MAG is the absolute value of the total annual (non-netted) special items, divided by the firm’s beginning-of-period total assets. The experimental variables include the following. SI_PERSIST is the persistence parameter for year t special items on one-year ahead earnings before special items; the parameter is calculated by year and industry at the 3-digit SIC level. NSI is an indicator variable equal to 1 if the firm reports negative (income-decreasing) special items, and 0 otherwise. MISS_PYE is an indicator variable equal to 1 if the net special items cause the firm’s current year earnings to be below prior year’s earnings, and 0 otherwise. BEAT_PYE is an indicator variable equal to 1 if the net special items cause the firm’s

46
current year earnings to be above prior year’s earnings, and 0 otherwise. We exclude NSI, MISS_PYE, and BEAT_PYE from column (2) as there is no variation in these variables for the “Big Bath Observations” due to the subsample definition.
Wald Chi-Square statistics are in parentheses. ***, **, * indicate significance at the less than 1%, 5%, and 10% levels for the indicated one- or two-tailed tests, respectively. Standard errors are robust to heteroskedasticity and clustered by company.

47
TABLE 7 Presentation of Special Items and Earnings Persistence
Model Model Model (1) (2) (3)
Intercept 0.02 ( 5.19) *** 0.02 ( 5.32) *** 0.02 ( 5.45) *** E*t 0.90 (49.96) *** 0.90 (49.74) *** 0.89 (49.01) *** SIt 0.09 (10.42) ***
SI_ISt 0.09 (10.03) *** 0.09 ( 9.35) *** SI_FNt 0.26 ( 4.37) *** 0.18 ( 2.37) **
SI_IS_BATHt 0.04 ( 1.49) * SI_FN_BATHt 0.21 ( 1.69) **
Year Dummies Yes Yes Yes Adj-R2 0.538 0.539 0.540 N 3,702 3,702 3,702 F-Test of: SI_IS – SI_FN –0.17 (8.16) ∀∀∀ –0.09 ( 1.48) ∀ SI_IS_BATH – SI_FN_BATH –0.13 ( 1.68) ∀
Notes: This table presents regressions examining the persistence of reported special items in predicting one-year ahead earnings. The dependent variable is Et+1, or earnings for year t+1. We include observations with data available for Equation (2). We eliminate observations with large studentized residuals (representing approximately 1% of total observations) to reduce the effect of outliers.
E*t are earnings before special items for year t. SIt are reported special items for year t. SI_IS (SI_FN) are reported special items for year t, which receive income statement (footnote) presentation. SI_IS_BATH (SI_FN_BATH) are reported special items for year t, which receive income statement (footnote) presentation, which also are “big bath” observations. “Big bath” observations are those in which net special items are income-decreasing, total negative special items exceed 1% of lagged total assets, and the special items cause the firm to miss prior year’s earnings. Income statement presentation refers to special items, which are presented as a separate line item on the income statement. Footnote presentation refers to special items, which are aggregated within another line item and identified only via footnote disclosure. All variables are scaled by beginning market value of equity. ***, **, * represent significance at the less than 1%, 5%, and 10% levels for two-tailed tests examining whether the coefficients differ from zero. t-statistics are shown in parentheses. ∀∀∀, ∀∀, ∀ represent significance at the less than 1%, 5% , and 10% levels for one-tailed tests comparing differences across coefficients for special items receiving income statement versus footnote presentation. F-statistics are shown in parentheses. All standard errors are robust to heteroskedasticity and clustered by company.

48
TABLE 8 Sensitivity Analysis: Partitioning on the Magnitude of Special Items
Panel A: Determinants of Financial Statement Presentation of Special Items
Variable
Pred Sign
All Observations
Large Special Items
Small Special Items
Control Variables: (1) (2) (3)
Intercept 0.59 (10.73) *** 0.89 (12.91) *** 0.21 ( 2.41) ** YEAR + / – –0.01 (–1.56) –0.02 (–4.30) *** 0.01 ( 2.22) ** SIZE + / – –0.02 (–3.73) *** –0.02 (–3.12) *** 0.00 ( 0.40) INST + / – 0.16 ( 3.56) *** 0.09 ( 1.74) * 0.13 ( 1.83) * SI_MAG + 0.16 ( 3.81) *** 0.10 ( 2.61) *** 11.78 ( 2.14) **
Experimental Variables:
SI_PERSIST + / – –0.03 (–2.89) *** –0.01 (–0.74) –0.05 (–2.82) *** NSI + / – 0.12 ( 4.32) *** 0.04 ( 0.94) 0.07 ( 1.75) * MISS_PYE + 0.14 ( 5.78) *** 0.06 ( 2.52) *** 0.05 ( 0.81) BEAT_PYE – 0.08 ( 1.67) 0.02 ( 0.30) –0.04 (–0.39) Adj-R2 0.051 0.032 0.023 N 2,228 1,228 1,000
Panel B: Presentation of Special Items and Earnings Persistence
All Observations
All Observations
Large Special Items
Small Special Items
(1) (2) (3) (4)
Intercept 0.02 ( 3.73) *** 0.02 ( 3.72) *** 0.01 ( 1.82) * 0.03 ( 3.33) *** E*t 0.83 (36.18) *** 0.84 (36.27) *** 0.78 (24.43) *** 0.89 (25.59) *** SIt 0.13 ( 7.48) ***
SI_ISt 0.13 ( 6.43) *** 0.10 ( 4.52) *** 0.05 ( 0.29) SI_FNt 0.25 ( 4.58) *** 0.19 ( 3.13) *** 0.40 ( 1.99) **
Year Dummies Yes Yes Yes Yes
Adj-R2 0.445 0.450 0.401 0.485 N 1,835 1,835 1,016 819
F-Test of: SI_IS – SI_FN –0.12 (4.67) ∀∀ –0.09 ( 2.13) ∀ –0.35 (2.08) ∀
Notes: This table presents results from sensitivity analyses partitioning the sample into observations reporting large versus small special items. The column “All Observations” includes all

49
observations having available data. The column “Large Special Items” includes only those observations, in which total reported special items are greater than or equal to 1% of lagged total assets. The column “Small Special Items” includes only those observations, in which total reported special items are less than 1% of lagged total assets.
Panel A presents results from an OLS specification examining the management decision to present special items as a separate line item on the income statement (“income statement presentation”) versus aggregate them in another line item with identification only via footnote disclosure (“footnote presentation”). The dependent variable is the percentage of recognized special items receiving income statement presentation (SI_Sep), measured as the annual absolute amount of (non-netted) special items receiving income statement presentation, divided by the absolute annual amount of total (non-netted) reported special items; thus, the dependent variable has a range of 0 to 1, inclusive. The control variables include the following. YEAR is the year. SIZE is the log of the firm’s year t sales. INST is the percentage of the firm’s outstanding common shares owned by institutions at year end. SI_MAG is the absolute value of the total annual (non-netted) special items, divided by the firm’s beginning-of-period total assets. The experimental variables include the following. SI_PERSIST is the persistence parameter for year t special items on one-year ahead earnings before special items; the parameter is calculated by year and industry at the 3-digit SIC level. NSI is an indicator variable equal to 1 if the firm reports negative (income-decreasing) special items, and 0 otherwise. MISS_PYE is an indicator variable equal to 1 if the net special items cause the firm’s current year earnings to be below prior year’s earnings, and 0 otherwise. BEAT_PYE is an indicator variable equal to 1 if the net special items cause the firm’s current year earnings to be above prior year’s earnings, and 0 otherwise.
Panel B presents results from regressions examining the persistence of reported special items in predicting one-year ahead earnings, where the dependent variable is Et+1, or earnings for year t+1. E*t are earnings before special items for year t. SI_IS (SI_FN) are reported special items for year t, which receive income statement (footnote) presentation. In the latter panel, we eliminate observations with large studentized residuals (representing approximately 1% of total observations) to reduce the effect of outliers. All variables are scaled by beginning market value of equity. ***, **, * represent significance at the less than 1%, 5%, and 10% levels for two-tailed tests examining whether the coefficients differ from zero. t-statistics are shown in parentheses. ∀∀∀, ∀∀, ∀ represent significance at the less than 1%, 5% , and 10% levels for one-tailed tests comparing differences across coefficients for special items receiving income statement versus footnote presentation. F-statistics are shown in parentheses. Standard errors are robust to heteroskedasticity and clustered by company.
Related Documents


