Signal Processing Approaches to Diagnosis of Esophageal Motility Disorders Mani Najmabadi A Thesis in the Department of Electrical and Computer Engineering Presented in Partial Fulfillment of the Requirements for the Degree of Master of Applied Science (Electrical and Computer Engineering) at Concordia University Montreal, Quebec, Canada August 2008 ©Mani Najmabadi, 2008

Welcome message from author
This document is posted to help you gain knowledge. Please leave a comment to let me know what you think about it! Share it to your friends and learn new things together.
Transcript

Signal Processing Approaches to Diagnosis of
Esophageal Motility Disorders
Mani Najmabadi
A Thesis
in
the Department
of
Electrical and Computer Engineering
Presented in Partial Fulfillment of the Requirements
for the Degree of Master of Applied Science (Electrical and Computer Engineering) at
Concordia University
Montreal, Quebec, Canada
August 2008
©Mani Najmabadi, 2008

1*1 Library and Archives Canada
Published Heritage Branch
395 Wellington Street Ottawa ON K1A0N4 Canada
Bibliotheque et Archives Canada
Direction du Patrimoine de I'edition
395, rue Wellington Ottawa ON K1A0N4 Canada
Your file Votre reference ISBN: 978-0-494-45496-1 Our file Notre reference ISBN: 978-0-494-45496-1
NOTICE: The author has granted a nonexclusive license allowing Library and Archives Canada to reproduce, publish, archive, preserve, conserve, communicate to the public by telecommunication or on the Internet, loan, distribute and sell theses worldwide, for commercial or noncommercial purposes, in microform, paper, electronic and/or any other formats.
AVIS: L'auteur a accorde une licence non exclusive permettant a la Bibliotheque et Archives Canada de reproduire, publier, archiver, sauvegarder, conserver, transmettre au public par telecommunication ou par Plntemet, prefer, distribuer et vendre des theses partout dans le monde, a des fins commerciales ou autres, sur support microforme, papier, electronique et/ou autres formats.
The author retains copyright ownership and moral rights in this thesis. Neither the thesis nor substantial extracts from it may be printed or otherwise reproduced without the author's permission.
L'auteur conserve la propriete du droit d'auteur et des droits moraux qui protege cette these. Ni la these ni des extraits substantiels de celle-ci ne doivent etre imprimes ou autrement reproduits sans son autorisation.
In compliance with the Canadian Privacy Act some supporting forms may have been removed from this thesis.
Conformement a la loi canadienne sur la protection de la vie privee, quelques formulaires secondaires ont ete enleves de cette these.
While these forms may be included in the document page count, their removal does not represent any loss of content from the thesis.
Canada
Bien que ces formulaires aient inclus dans la pagination, il n'y aura aucun contenu manquant.

ABSTRACT
Signal Processing Approaches to Diagnosis of Esophageal Motility Disorders
Mani Najmabadi
Esophageal Motility Disorders (EGMDs) are a group of abnormalities
characterized by the muscular dysfunction of the esophagus in the transportation of food
from the oral cavity to the stomach. EGMDs typically cause chronic problems and affect
a vast and ever-increasing number of the global population.
The diagnosis of EGMDs mainly relies on a key test presently used to study the
esophagus motility, known as esophageal manometry (EGM). EGM involves pressure
measurements inside the esophagus, which provide information pertaining to its
contractions. The diagnosis process is mainly based on visual inspection of the EGM test
results to find certain characteristics of the manometric patterns.
There are several factors that make such inspection tedious. For instance,
manometry test results are often contaminated with a considerable amount of noise, (e.g.
noise from external environment) and artifacts, (e.g. respiration artifacts) leading to a
longer and more complex diagnosis process. As such, the diagnosis based on visual
inspection is prone to human error and demands extensive amount of expert's time.
This thesis introduces new signal processing approaches to provide an accurate
means for the diagnosis of EGMDs as well as to reduce the amount of time spent on the
diagnosis process. Specifically, a new technique known as wavelet decomposition (WD)
iii
is applied to the filtering of the EGM data. A nonlinear pulse detection technique (NPDT)
is applied to the de-noised data leading to extraction of diagnostically important
information i.e. esophageal pulses. Such information is used to generate a model using a
statistical pulse modeling (SPM) technique, which can classify the EGM patterns.
The proposed approaches are applied to the EGM data of 20 patients and
compared with those from existing techniques. Such comparisons illustrate the
advantages of the proposed approaches in terms of accuracy and efficiency.
As part of this thesis, a new circuit-based approach is proposed for the treatment
of Gastroesophageal Reflux Disease (GERD), i.e. the most prevalent disease caused by
EGMDs. The objective is to provide a framework for further research towards the
implementation of the proposed approach for GERD treatment.
IV

ACKNOWLEDGEMENTS
I would like to thank my supervisors Dr. Vijay Devabhaktuni and Dr. Mohamad
Sawan for their efforts in the advancement of my education and career.
I also want to express genuine appreciation for the expert advice and council of
Dr. Carlo Fallone and Dr. Serge Mayrand. Their extensive technical knowledge in
gastroenterology as well as their assistance served as a backbone for this work.
Additionally, this work would not have been possible without the efforts and support of
my colleagues in the CAD laboratory at Concordia University. A special mention of
gratitude must be made to Navid Arbabi, Farzin Manouchehri and Li Zhu for their
continued support and friendship. I would also like to extend my heartfelt appreciation to
my family for their ongoing guidance, support, and understanding.
Lastly, financial support received by the Regroupement Strategique en
Microsystemes du Quebec (ReSMiQ) was well appreciated and most helpful during my
studies at Concordia University.
v

To my loving parents
Pourandokht and Bagher

TABLE OF CONTENTS
List of Figures xii
List of Tables xiv
List of Symbols and Abbreviations xv
Chapter 1 Introduction 1
1.1 Esophageal Motility Disorders Diagnosis 1
1.2 Motivation and Objectives 3
1.3 Thesis Outline 3
Chapter 2 Esophageal Motility Disorders (EGMDs) Overview 5
2.1 The Esophagus and its Function 6
2.2 EGMDs: Definition and Classification 8
2.3 Common Esophageal Motility Disorders and Diseases 9
2.3.1 Gastroesophageal Reflux Disease (GERD) 9
2.3.2 Achalasia 10
2.3.3 Diffuse Esophageal Spasm (DES) 10
vii

2.3.4 Nutcracker Esophagus 10
2.4 Diagnosis of EGMDs and the Role of EGM 11
2.4.1 Manometry Procedure for Sphincter Examination/Profiling 11
2.4.2 Manometry Procedure for Esophageal Body Examination 12
2.5 Challenges in Diagnosis of EGMDs Using EGM 14
2.6 Computer Aided Solutions for EGMDs Diagnosis Using EGM 15
2.7 GERD Overview 16
2.8 Cause of GERD 17
2.8.1 Lower Esophageal Sphincter (LES) 17
2.8.2 Mechanisms of Reflux 19
2.9 A Potential Solution for GERD Treatment 20
2.10 Summary 20
Chapter 3 De-noising of EGM Data for EGMDs Diagnosis 22
3.1 Empirical Mode Decomposition (EMD) 23
3.1.1 EMD Theory and Algorithm 24
3.2 Proposed Wavelet Decomposition (WD) Approach 26
viii

3.2.1 Wavelets and the Wavelet Transform 26
3.2.2 Wavelet Transform Algorithm 28
3.2.3 WD for EGM De-noising 30
3.3 Experimental Results 32
3.3.1 Application of EMD to EGM De-noising 32
3.3.2 Application of WD to EGM De-noising 34
3.3.3 Comparison of EMD and WD in EGM De-noising 36
3.4 Summary 38
Chapter 4 Analysis and Modeling of EGM Data for EGMDs Diagnosis 40
4.1 Overview of Pulse Detection Techniques 42
4.2 Overview of Poincare Mapping (PM) 44
4.3 Proposed Nonlinear Pulse Detection Technique (NPDT) 47
4.3.1 Phase 1: Detection of Critical Points (CP) 47
4.3.2 Phase 2: Wave-Shape Determination and Line-Fitting 49
4.4 Poincare Map Based Pulse Modeling 53
4.5 Experimental Results 57
ix

4.5.1 Experimental Results from NPDT 57
4.5.2 Experimental Results from SPM Technique 60
4.6 Summary 67
Chapter 5 A New Approach for Treatment of Gastroesophageal Reflux Disease (GERD) 68
5.1 A Potential Approach to GERD Treatment 69
5.1.1 LES Control Utilizing Neurostimulation Techniques 69
5.1.2 An Effective Approach to Realizing Neurostimulation-Based Control of LES 69
5.2 A Smart Implant Dedicated to GERD Treatment 70
5.2.1 LES Stimulation Concept 70
5.2.2 Main Tasks/Responsibilities of the Implant 71
5.3 Implant System Structure and Circuits 72
5.3.1 The Power Recovery System 74
5.3.2 Communication System 80
5.4 Summary 88
Chapter 6 Conclusions 89
6.1 Contributions 89
X

6.2 Future Work 91
References 93
XI

LIST OF FIGURES Figure 2.1 The esophagus location in human body 6
Figure 2.2 Esophageal peristalsis for transportation of food 7
Figure 2.3 Location of the esophageal sphincters in human body [4] 8
Figure 2.4 An example of the manometry results for LES profiling 13
Figure 2.5 An example of the manometry results for esophageal body examination.. 14
Figure 2.6 LES location at the junction of the esophagus and the stomach [5] 18
Figure 3.1 A sample group of widely used mother wavelets: (a) Haar, (b)
Biorthogonal, (c) Daubechies, (d) Symlet [9] 27
Figure 3.2 An illustration of CWT realization for a random signal [9] 29
Figure 3.3 IMFs evaluated using the EMD 33
Figure 3.4 Original manometric data and the de-noised pressure signal using the EMD
approach 34
Figure 3.5 Mother wavelet 'sym3' used in the WD approach 35
Figure 3.6 WD functions i.e. C,s evaluated using the WD approach 35
Figure 3.7 Original manometric data and the de-noised pressure signal using the WD
approach 36
Figure 3.8 Comparison of the original manometric data, the de-noised pressure signal
using the EMD approach and the de-noised pressure signal using the WD approach 37
Figure 4.1 A conceptual illustration of Poincare mapg 47
Figure 4.2. An illustration of proposed method for CP detection 50
Figure 4.3 Extracted and linearly estimated EGM data by NPDT 51
Figure 4.4 Overall Flowchart of the proposed NPDT 52
Figure 4.5 Poincare plot of consecutive slopes using the proposed method 56
Figure 4.6 An example of a Poincare plot illustrating the geometrical shape fitted to a
blur of points 57
Figure 4.7 De-noised EGM signal and the fitted straight lines using NPDT 58
Figure 4.8 Poincare plot of consecutive slopes for a normal case using SPM 61
Figure 4.9 Poincare plot of consecutive slopes for an abnormal case using SPM 62
xii

Figure 4.10 Isosceles triangle fitted to Poincare plot of consecutive slopes for a normal
case 64
Figure 4.11 Realization of̂ diff from Poincare plot for a normal case 64
Figure 5.1 Proposed implant system 73
Figure 5.2 Implant structure 74
Figure 5.3 Power recovery system 75
Figure 5.4 Integrated CMOS full-wave bridge rectifier 76
Figure 5.5 A typical dual output (LDO) voltage regulator from [26] 78
Figure 5.6 Start up Circuit 79
Figure 5.7 Level shifter circuit 80
Figure 5.8 Inductive link for transmitted data: (a) Costas loop demodulator (b) detailed
demodulator block diagram [35] 82
Figure 5.9 Comparator for the demodulator [35] 85
Figure 5.10 Phase detector and multiplier circuit [35] 86
Figure 5.11 VCO circuit 87
Figure 5.12 Phase detector and multiplier circuit 88
xni

LIST OF TABLES TABLE 3.1 Comparison of EMD and WD Approaches 38
TABLE 4.1 Possible Scenarios for Wave-Shapes in a Data Segment 50
TABLE 4.2 Comparison of Spike Detection Techniques 60
TABLE 4.3 Statistical Measures for EGM Pulses Realized by SPM for 10 Normal
Patients 66
TABLE 5.1 Recent Data Communication Techniques_Proposed for Implantable
Devices 81
xiv

LIST OF SYMBOLS AND
ABBREVIATIONS
C Wavelet coefficient
8 Sampling period
E Signal energy
s Sensitivity
/ Function
Pi Falling point
pr Rising point
if/ Mother wavelet
R" n-Dimensional space
APDR Accurate pulse detection rate
BPSK Binary phase shift keying
CMFB Common mode feedback
CP Critical point
CWT Continuous wavelet transform
DES Diffuse esophageal spasm
DWT Discrete wavelet transform
ECG Electrocardiography
EEG Electroencephalography
xv

EMD
EGM
EGMD
GER
GERD
IMF
LDO
LES
MASI
MISI
NLEO
NPDE
NPDT
PM
PSI
SBR
SD
SLESR
SPM
TLESR
UES
VCO
WD
Empirical mode decomposition
Esophageal manometry
Esophageal motility disorder
Gastroesophageal reflux
Gastroesophageal reflux disease
Intrinsic mode function
Low-drop-out
Lower esophageal sphincter
Maximum sharpness indicator
Minimum sharpness indicator
Nonlinear energy operator
Normalized pulse duration error
Nonlinear pulse detection technique
Poincare mapping
Pulse symmetry index
Signal-to-background ratio
Standard deviation
Swallow-induced lower esophageal sphincter relaxation
Statistical pulse modeling
Transient lower esophageal sphincter relaxation
Upper esophageal sphincter
Voltage controlled oscillator
Wavelet decomposition
xvi

Chapter 1
Introduction
1.1 Esophageal Motility Disorders Diagnosis
Esophageal Motility Disorders (EGMDs), are a group of abnormalities originated
by the muscular dysfunction of the esophagus in transportation of food from oral cavity
to the stomach [1]. These disorders correspond to very common diseases such as
gastroesophageal reflux disease (GERD), diffuse esophageal spasm (DES) and nutcracker
esophagus that are typically chronic and life-long [2]. For instance, GERD which is a
state in which the liquid content of the stomach refluxes into the esophagus affects an
estimated 5-7% of the global population including men, women, and children [3]. Owing
to relatively unhealthy diets and lifestyles, this percentage is even higher among the
1

North American population. Such diseases affect the patients' quality of life by causing
problems such as heartburn, swallowing/breathing difficulties and chest pain.
Current diagnosis of EGMDs is based on a group of esophageal tests designed to
examine the esophagus. The main purpose of these tests is to observe the function of the
esophagus muscles regarding the food delivery. A noninvasive test presently used to
study the esophagus is EGM. The EGM test essentially measures the pressure inside the
esophagus, which in turn allows experts to discern vital information about the
contractions of the different esophageal regions. The diagnosis process mainly involves
visual inspection of these test results to find certain morphological characteristics of the
manometric patterns. However, there are several factors that make such a visual
inspection tedious. First, EGM data is contaminated by high-frequency noise, e.g. noise
from external environment. Second, visual examination of EGM data involves
differentiating between contractions and artifacts (e.g. respiration artifacts), which is
prone to human error. Third, medical experts should examine each esophageal
pulse/contraction and determine whether it is normal.
General solutions to overcome the above challenges can be realized by means of a
computer-based implementation, with emphasis on accuracy and efficiency. Obviously,
such implementation requires development of signal processing techniques for EGM data
analysis, including the filtering of the noise from the raw EGM data, detection/extraction
of the key information in the whole data recording and classification of the results for
diagnosis.
2

1.2 Motivation and Objectives
The motivation behind this thesis is the desire to provide new signal processing
tools to medical experts in an effort to aid in overcoming the challenges in the diagnosis
of EGMDs. The main objectives are reducing the amount of time spent on the diagnosis
process as well as providing an accurate means for the diagnosis of EGMDs. From a
healthcare perspective, this work is highly practical as it enhances the ability of experts to
diagnose disorders affecting a vast and ever-increasing number of the North American
population.
1.3 Thesis Outline
This thesis proposes new signal processing-based approaches for the analysis and
modeling of EGM data to assist the diagnosis of EGMDs. In addition, a new circuit-based
electrical engineering approach for treatment of GERD is presented.
Chapter 2 presents an overview of the EGMDs from a medical perspective
including a brief description of the esophagus anatomy, an explanation of EGMDs origin,
as well as different types of diseases caused by EGMDs. Also, a brief overview of GERD
as well as a short description of the relevant esophagus physiology is presented.
Chapter 3 describes a wavelet-based signal processing technique known as WD
for filtering of the high-frequency noise from EGM data. The chapter begins with the
background theory of an existing technique proposed for EGM data analysis known as
empirical mode decomposition (EMD). The proposed WD is then described in detail.
3

Both the EMD and the WD are applied to the patients' EGM data and the experimental
results are shown for the purpose of comparison.
Chapter 4 introduces novel approaches for detection/extraction of the
diagnostically key information and model-based classification of EGM data. The relevant
background theory regarding pulse detection techniques as well as a pertinent modeling
technique is presented. The proposed approaches to detection/extraction and modeling of
esophageal pulses are then described. The approaches are applied to the patients' EGM
data and the experimental results are illustrated. Such results are compared with the
results from similar existing techniques where applicable.
Chapter 5 proposes a circuit-based electrical engineering approach for treatment
of GERD as the most prevalent esophageal disease caused by EGMDs. The idea for
implementation of the approach using an electronic implantable device is described.
Furthermore, a number of recent state-of-the-art circuits for the proposed implant
structure from the existing literature are presented.
Chapter 6 contains a discussion on the thesis' contributions as well as the
direction for possible future works.
4

Chapter 2
Esophageal Motility Disorders
(EGMDs) Overview
As previously mentioned, EGMDs are identified by the muscular dysfunction of
the esophagus in transporting the food from the oral cavity to the stomach. In order to
understand the causes of the EGMDs, it is necessary to know the physiology of the
esophagus and its function. In this chapter, a brief overview of the esophagus anatomy
and its functional role is discussed. In addition, the diagnosis process of EGMDs and the
corresponding challenges are described. Also presented in this chapter, is a brief
background overview of GERD including its definition and causes.
5

2.1 The Esophagus and its Function
The esophagus is a muscular tube that has the function of transporting the food
from the oral cavity to the stomach (see Figure 2.1).
J * _ • — * • '
; '.i
Mouth
Esophagus
Stomach
Figure 2.1 The esophagus location in human body.
In order to carry out this task safely and effectively, the esophagus is constructed
as an 18 to 26 cm long hollow muscular channel with a slippery inner lining [1]. After
each swallow, the food travels from mouth down to the throat and into the esophagus,
passes the mid part of the esophagus and enters the stomach. During this journey, the
muscles of the esophagus work together to receive food bolus in each level and push it
down towards the stomach. This process is called the esophageal peristalsis. In essence,
the entire esophagus wall consists of muscles that work harmoniously to transit
6

swallowed content to the stomach. Figure 2.2 shows an example of an esophageal
peristalsis.
I Figure 2.2 Esophageal peristalsis for transportation of food.
There are two sphincters at the beginning and the end of the esophagus that
control the transition of material. The first sphincter (known as upper esophageal
sphincter or UES) is located at the junction of the oral cavity and the esophagus. It
controls the entrance of the esophagus and contracts unless there is a swallow event. The
second sphincter (known as lower esophageal sphincter or LES) is located between the
esophagus and the stomach. It controls the junction between the esophagus and the
stomach and is contracted unless there is a swallow event. In every swallow process, food
passes through the UES, travels along esophageal body and passes through the LES to
enter the stomach. Figure 2.3 shows the locations of the esophageal sphincters in human
body.
7

Figure 2.3 Locations of the esophageal sphincters in human body [4].
2.2 EGMDs: Definition and Classification
The delivery of food from the oral cavity to the stomach is a very complex
process which involves the coordination of a set of different muscles and organs.
Disruptions of this highly integrated muscular motion translate to EGMDs. Such
disorders limit the delivery of food and fluid to the stomach and cause swallowing
problems, chest pain, acid reflux, etc.
8

EGMDs are classified based on the type of abnormality which causes the
disruption in esophagus function [2]. Generally, these abnormalities are: (i)
uncoordinated contractions, (ii) hyper contractions, (iii) hypo contractions, and (iv)
inadequate sphincter relaxations. Various disorders and diseases are originated from such
categories of abnormalities. In the following section, a brief overview of the most
common disorders and diseases initiated from esophagus abnormalities is presented.
2.3 Common Esophageal Motility Disorders and Diseases
In order to know the importance of EGMDs and their impact on society's health,
a brief overview of the most prevalent disorders and diseases related to EGMDs is
presented in this section.
2.3.1 Gastroesophageal Reflux Disease (GERD)
GERD, generally known as acid reflux, is a state in which the liquid content of
the stomach refluxes into the esophagus. The acidic nature of the liquid has the potential
to damage the sensitive lining of the esophagus, causing esophagus inflammation, known
as esophagitis. GERD is a chronic, and in most cases life-long disease, which can result
in possible swallowing and breathing problems or even esophageal cancer in extreme
cases. GERD is caused by the dysfunction of the LES as a barrier to reflux of acidic
content of the stomach to the esophagus. It is estimated that GERD currently affects an
estimated 5-7% of the world's population. Owing to relatively unhealthy diets and
lifestyles, this percentage is even higher in the North American population
(approximately 22 million people in North America suffer from GERD) [3].
9

2.3.2 Achalasia
Achalasia is an EGMD of unknown cause characterized by the absence of
peristalsis in esophageal body and impaired relaxation of the LES. As a result, patients
with achalasia usually suffer from swallowing difficulties and weight loss. Although it is
not a very common disease, it is frequent enough to be considered as an important
EGMD. Achalasia is a disease that occurs with equal frequency between men and
women. There are, however, striking international differences with the disease. Achalasia
is more common in North America, north-western Europe and New Zealand [2].
2.3.3 Diffuse Esophageal Spasm (DES)
DES is an EGMD of unknown cause characterized by uncoordinated spastic
activity in the smooth muscle portion of the esophagus. DES is manifested clinically by
episodes of swallowing difficulty and chest pain. Such a pain can mimic the angina of
coronary artery disease which is critical due to the fact that DES patients are typically
older than 50 years of age. DES occurs with equal frequency between men and women.
DES is more common in North America compare to the rest of the world.
2.3.4 Nutcracker Esophagus
Nutcracker Esophagus is a condition in which the swallow induced peristaltic
waves in the esophageal body have higher amplitudes compared to normal levels.
Therefore, patients diagnosed with Nutcracker Esophagus suffer from severe chest pain
and swallowing difficulties to both solid and liquid foods. Nutcracker esophagus can
affect people of any age, but is more common in the 6th and 7th decades of life.
10

2.4 Diagnosis of EGMDs and the Role of EGM
The diagnosis of EGMDs is a complex process which involves a number of tests
to examine the esophagus and its function. The most important test for assessment of
esophagus is EGM. As mentioned, EGM involves pressure measurements inside the
esophagus, which provide information in terms of contractions of the esophagus [1]. This
is due to the fact that any abnormality in esophagus function manifests itself in pressure
dynamics inside the esophagus. Such measurements, i.e., the recorded pressure
waveforms, are reviewed by medical experts, in order to qualify/quantify the wave
morphologies leading to classification of normal and abnormal patterns.
There exist a number of EGM procedures which medical experts employ
depending upon the symptoms of the patient. These procedures are (i) sphincter
examination/profiling and (ii) esophageal body examination. The former is mainly
employed for examination of the LES in diagnosis of GERD or examination of the UES
in diagnosis of swallow related disorders in the pharynx area. The latter is mainly
employed for diagnosis of motility disorders in the esophageal body such as DES and
Nutcracker Esophagus. A brief description of such procedures is presented in the
following sections.
2.4.1 Manometry Procedure for Sphincter Examination/Profiling
EGM for sphincter examination/profiling is performed while the patient is awake,
alert, and in a supine position. The procedure takes about 40 minutes and the patient
should have fasted for six hours [2]. An esophageal motility catheter, which is a
11

flexible/soft tube containing micro-transducers for pressure measurements is used. The
catheter is slowly passed into the esophagus through the nose and throat of the patient.
Profiling of the sphincter (i.e. LES or UES) is done using the station pull-through
technique, which involves a slow and step-wise withdrawal of the catheter. The catheter
is moved in 0.5cm steps and is held at each position/station long enough so as to obtain a
stable pressure reading. Once the pressure data is recorded, the results are saved on a
machine or printed on to a paper. An example of the manometry results for LES profiling
from a patient is shown in Figure 2.4. The LES high pressure zone is labelled in the
figure.
2.4.2 Manometry Procedure for Esophageal Body Examination
EGM for esophageal body examination is performed while the patient is awake,
alert, and in a supine position. The procedure takes about 40 minutes and the patient
should have fasted for at least six hours. Medications that may potentially alter normal
esophageal function must be discontinued at least 24 hours before the procedure [2]. An
esophageal motility catheter, which is a soft tube containing micro-transducers, is used.
The catheter is slowly passed into the esophagus through the nose and throat of the
patient. The patient is usually asked to swallow saliva (i.e. a dry swallow) or water (i.e. a
wet swallow). The esophagus muscles normally contract from the top portion of the
esophagus and progress in an orderly sequence to the bottom portion of the esophagus.
Resulting pressure changes from esophageal contractions are recorded. The recordings
are in the form of tracings in time-domain. Sampling rate and other signal specifications
12

are adjusted by the medical doctor. An example of a 15s manometry results for
esophageal body examination from a patient is shown in Figure 2.5.
8 10 12 Time (min)
Figure 2.4 An example of the manometry results for LES profiling.
13

60
50
•a 4Q X E e. 2 1 30
Pre
; le
tric
g 20 c CO
5
10
0
i n
<ww J
i
(In _
| I Esophageal Peristalsis
| /
I I
I
i
-
-
iJ\MA
5 10 Time (sec)
15
Figure 2.5 An example of the manometry results for esophageal body examination.
2.5 Challenges in Diagnosis of EGMDs Using EGM
As previously mentioned, EGM involves pressure measurements inside the
esophagus, which provide information in terms of contractions of the esophagus. These
measurements, i.e., the recorded pressure waveforms, are reviewed by medical experts, in
order to qualify/quantify the wave morphologies leading to classification of normal and
abnormal patterns. Similar to other biological signals, e.g. electrocardiography (ECG)
and electroencephalography (EEG), EGM signal/wave analysis by medical experts highly
relies on visual inspection. However, there are several factors that make visual inspection
14

tedious. First, EGM data is contaminated by high-frequency noise, e.g. noise from
external environment. Second, manual examination of EGM data involves differentiating
between contractions and artifacts (e.g. respiration artifacts), which is prone to human
error. Third, medical experts should examine each esophageal pulse/contraction and
determine whether it is normal. As such, accurate diagnosis based on visual inspection
demands extensive amount of expert's time, and such inspection can be even more
challenging in the case of 24-hour EGM data monitoring.
2.6 Computer Aided Solutions for EGMDs Diagnosis Using EGM
A general solution to the mentioned problems is to filter the high-frequency noise,
browse through the de-noised EGM data to extract critical data portions/segments, and
compare these portions with standard cases for diagnosis. The above solution can be
realized by means of a computer-based implementation using signal processing methods,
with emphasis on accuracy and efficiency. Obviously, such implementation requires
development of an algorithm for EGM data analysis, which involves three specific tasks,
namely, i) filtering of high-frequency noise from raw EGM data, ii) detection/extraction
of diagnostically important segments from the EGM recordings, and iii) development of a
convenient computational model that facilitates differentiation between normal and
abnormal patterns.
In chapters 3 and 4, the proposed signal processing techniques for implementation
of the above tasks are presented. The following section is dedicated to a background
overview of GERD, necessary for the GERD treatment approach described in chapter 5.
15

2.7 GERD Overview
Gastroesophageal Reflux Disease (GERD), generally known as acid reflux, is a
state in which the liquid content of the stomach refluxes into the esophagus [3]. The
acidic nature of the liquid has the potential to damage the sensitive lining of the
esophagus, causing esophagus inflammation, known as esophagitis. GERD is a chronic,
and in most cases life-long disease, which can result in possible swallowing and
breathing problems or even esophageal cancer in extreme cases. It is estimated that
GERD currently affects an estimated 7% of the global population. The widespread effect
of this disease reflects the need to develop effective diagnosis and treatment methods
compared to those presently available.
Current diagnosis of GERD involves a set of esophageal tests designed to
examine the esophagus. One of the key tests presently used to study the esophagus in
GERD diagnosis is EGM. EGM allows experts to obtain vital information about the
amplitude and coordination of esophageal contractions especially in the LES region.
Medical treatment of GERD is a complicated process and is based on symptoms
presented along with organ damages [2]. Less invasive treatments involve life-style
changes such as alteration of eating and sleeping habits. More severe cases are treated
with prescription drugs such as antacids to control the reflux. More advanced and
invasive GERD management methods include surgical and endoscopic techniques [3].
Despite the numerous existing techniques for GERD treatment, research towards an
effective cure for GERD has continued unabated.
16

2.8 Cause of GERD
The backward flow of gastric content into the esophagus, that is, gastroesophageal
reflux (GER), is up to a certain extent a normal physiological phenomenon [1]. When the
threshold of normality is surpassed, GER may induce inflammatory changes of the
esophageal inner lining due to exposure from stomach contents. These contents (i.e. acid
and enzymes) can damage the esophagus leading to symptoms such as chest pain,
swallowing and breathing problems.
There is a natural anti-reflux barrier in the junction of the esophagus and the
stomach preventing the flow of stomach contents into the esophagus. This natural barrier
is the LES. LES is in fact a muscle that acts as a valve at the opening of stomach. The
failure of the LES to prevent the acid flow from the stomach to the esophagus causes
GER episodes and overtime results in GERD. The location of the LES is demonstrated in
Figure 2.6. A brief description of the LES is presented in the following section.
2.8.1 Lower Esophageal Sphincter (LES)
The LES involves 3 to 4 cm of the esophagus right above the stomach [1]. Resting
LES pressure ranges from 10 to 30 mmHg (or Torr). A minimum of 5 to 10 mmHg is
necessary to prevent GER from stomach to the esophagus. The LES has the duty of
maintaining a high pressure almost at all times except an event of a swallow event. There
is considerable daytime variation in LES pressure; it is lowest after meals and highest at
night. It is also influenced by circulating hormone related foods (particularly fat) as well
as a number of drugs [1] [2]. It is to note that the diaphragm (see Figure 2.6), provides
17

external squeeze to the LES, contributing to resting pressure during inspiration and
augmenting LES pressure during periods of increased abdominal pressure such as
coughing, sneezing, or bending. Diaphragm contractions impose rhythmic pressure
increases of about 5 to 10 mmHg on the LES pressure assuring the LES function.
Figure 2.6 LES location at the junction of the esophagus and the stomach [5].
LES is controlled directly by the brain and receives its control signals through one
of the most important nerve branches known as Vagus nerve. Vagus nerve is the only
nerve that initiates in the brainstem and controls most of the vital organs such as heart,
liver and kidneys. It regulates both the inhibitory (relaxation) and the excitatory
(contraction) responses of the LES.
18

As mentioned, LES is the barrier to acid reflux from stomach to esophagus and its
dysfunction results in GERD. However, it has not been mentioned as to which LES
characteristic corresponds to GERD origin. Therefore, a question may arise: Is the
absence of LES tone/pressure the cause of GERD or there are other factors?
In order to find the answer to the above question one should study the conditions
in which GER is most likely. In the following section, the mechanisms of reflux are
explained.
2.8.2 Mechanisms of Reflux
2.8.2.1 Transient Lower Esophageal Sphincter Relaxations (TLESR)
A TLESR is a relaxation of LES that is not initiated by a swallow. TLESRs are
the most frequent mechanisms for reflux in patients with sufficient sphincter pressure.
Such LES relaxations occur independently of swallowing, are not accompanied by
esophageal peristalsis, usually persist longer than 10 seconds and are accompanied by
inhibition of diaphragm pressure. Importantly, TLESRs account for 50% to 80% in
GERD patients.
2.8.2.2 Swallow-Induced Lower Esophageal Sphincter Relaxations (SLESR)
A SLESR is a relaxation of LES that is initiated by a swallow in order to allow
food to enter the stomach. About 5% to 10% of reflux episodes occur during swallow-
induced LES relaxations. Most episodes are associated with defective or incomplete
peristalsis. During a normal SLESR, reflux is uncommon due to the factors; (i) the
19

diaphragm does not relax (ii) the duration of SLESRs is really short (around 5 seconds)
(iii) reflux is prevented by the oncoming peristaltic wave.
2.8.2.3 Hypotensive (Low-Pressure) Lower Esophageal Sphincter
GER can occur in the context of hypotensive LES by either strain-induced or free
reflux. Strain induced reflux occurs when a relatively hypotensive LES is overcome and
blown open by normal events such as coughing or bending over. Free reflux is
characterized by a fall in esophageal ph caused by extremely low LES pressure. Reflux
due to a low or absent LES pressure is uncommon.
2.9 A Potential Solution for GERD Treatment
As explained in the previous section, acid reflux can occur during different
mechanisms which may result in GERD. Therefore, GERD is considered as a multi
factorial disease i.e. various factors can cause GERD. However, the common feature in
all GERD cases is the LES failure to stay contracted in the absence of a swallow. As
such, a general solution for GERD treatment should involve the control of LES in order
to assure its contraction at appropriate times. In chapter 5, an engineering approach based
on electrical stimulation of the LES using neurostimulation techniques for GERD
treatment is presented.
2.10 Summary
In this chapter, function of the esophagus as well as a brief overview of the
EGMDs has been presented. Also, the challenges in EGMDs diagnosis along with the
20

proposed signal processing-based solutions have been discussed. In addition, a brief
overview of GERD as the most important disease caused by EGMDs, has been described.
21

Chapter 3
De-noising of EGM Data for EGMDs
Diagnosis
As discussed in the previous chapters, there are certain facts that make the EGM-
based diagnosis of EGMDs challenging. The primary fact is that the EGM data is usually
contaminated by noise. Such noise includes components with much higher frequency
compared to the frequency of esophageal movements and contractions. The potential
sources of noise are external environment (e.g. patient's body movements) or the EGM
test equipment. Such noise can make the diagnosis tedious since it may distort the
esophageal waveforms. Therefore, there is a need for a suitable filtering technique to
remove the high frequency noise from EGM data. 22

It is to be noted that raw manometric data exhibits discontinuities and sharp peaks
due to natural pressure fluctuations in the esophagus. Therefore, typical filtering
techniques may not be appropriate options. This is due to the fact that the resulted filtered
signal using these techniques may fail to follow sharp peaks and rapid changes of the
original signal. Recently, a signal processing technique referred to as Empirical Mode
Decomposition (EMD) has been proposed for the analysis of manometric data [6].
In this chapter, an overview of EMD as the existing technique for analysis of
EGM data in the signal processing literature is presented. The proposed technique, i.e.
WD, for de-noising of EGM data is then described in detail. Both the EMD and WD are
applied to the patients' EGM data and the experimental results are presented for
comparison.
3.1 Empirical Mode Decomposition (EMD)
The EMD is a general signal processing method for analyzing nonlinear and non-
stationary time series. EMD was initially proposed for the study of ocean waves, and
found pressing applications in biomedical engineering [6]. The fundamental idea of EMD
is to decompose a signal into a finite and often small number of intrinsic mode functions
(IMFs). An IMF is defined as any function having the number of extrema and the number
of zero-crossings equal (or differing at most by one), and also having symmetric
envelopes defined by the local minima, and maxima respectively. The major advantage of
EMD is that the IMFs are derived directly from the signal itself. Therefore, the analysis is
23

adaptive, in contrast to Fourier analysis, where the basis functions are linear
combinations of fixed sinusoids.
3.1.1 EMD Theory and Algorithm
The principle of EMD is to decompose a signal into a sum of oscillatory
functions, namely IMFs, that: i) have the same numbers of extrema and zero-crossings or
differ at most by one; and ii) are symmetric with respect to local zero mean. With these
two requirements, the instantaneous frequency of an IMF can be well defined.
EMD decomposes a given signal into a set of IMFs with discrete frequencies.
Decomposition is accomplished by empirically identifying the physical time-scales
fundamental to the data/signal. These time-scales are the time-fragments between
consecutive maxima or minima. Each IMF satisfies the criteria of having a zero mean for
its upper/lower envelopes. The procedure for determining IMFs includes finding
upper/lower envelopes (xup/xioW) of the signal x(t) by connecting maxima/minima points
via cubic splines and then subtracting the mean of the above-said envelopes from the
signal i.e.
hxx{t) = x{t)-(xup(t) + xlow{t))l2. (3.1)
Treating h\\(t) as the original signal and using (3.1), we evaluate hn{f). In an
iterative fashion, we continue to evaluate h\$(t), ..., h\p(t) and so forth. The procedure
terminates when the mean of the envelopes of h\p(t) becomes zero, providing the first
IMF i.e. I\(f) = h\p(f). Residue r\{t) = x(i) - I\(f) is then used as new data and the above
24

procedure is repeated resulting in subsequent IMFs h(i) = /*2p(0> ^(0 ~ 3̂p(0> and so
forth, assuming p to be a variable index. The EMD approach terminates when the
difference between two consecutive IMFs is equal to a small value (typically in the 0.2-
0.3 range).
In principle, the original signal x(f) can be reconstructed as
N
x(t)= ZA-(0 + > N ( 0 . (3.2)
In (3.2), N is the number of IMFs, Ix (t) is the z'th IMF, and r^(t) is the residue when the
EMD terminates. Since each IMF corresponds to a specific frequency component of x(f),
partial addition of the IMFs i.e.
JC(0=Z AW, (3-3)
results in a filtered signal. In (3.3), j,ke{\,...,N] and j<k. It is to be noted that de-
noising of the original signal can be achieved by adding the low-frequency IMFs.
25

3.2 Wavelet Decomposition (WD)
Wavelet decomposition is gaining attention as a novel signal processing tool for
analyzing nonlinear time-series. Compared to traditional Fourier transform, wavelet
transform better represents functions exhibiting discontinuities and sudden changes. As
such, wavelet-based techniques are strong candidates for the analysis of bio-signals (e.g.
gastric and esophageal signals), in which, sudden changes and sharp peaks are likely [7]
[8]. A brief overview of wavelet theory and WD is presented in this section.
3.2.1 Wavelets and the Wavelet Transform
A wavelet is a mathematical function used as a basis to divide a given function or
continuous-time signal into different frequency components. A wavelet transform is the
representation of a function by such wavelets. The wavelets are scaled
(stretched/compressed over time-axis) and positioned (shifted over time-axis) copies of a
finite-length waveform known as the mother wavelet. Similar to the Fourier transform in
which a signal is represented by sum of sine waves, in wavelet transform a signal is
represented by sum of scaled and shifted mother wavelets. There are different types of
mother wavelets developed for various applications. Figure 3.1 illustrates some of the
most popular and widely used mother wavelets.
26

-1
0.5
(a)
(c)
Figure 3.1 A sample group of widely used mother wavelets: (a) Haar, (b)
Biorthogonal, (c) Daubechies, (d) Symlet [9].
Wavelet transforms have advantages over traditional Fourier transforms for
representing functions that have discontinuities and sharp peaks, and for accurately
deconstructing and reconstructing finite, non-periodic and non-stationary signals. This is
due to the fact that in wavelet transform a signal is analyzed by a group of wavelets with
limited length, (thus suitable for analyzing local variation of the signal) which are scaled
in order to match the original signal frequency.
27

3.2.2 Wavelet Transform Algorithm
Wavelet transform breaks down a given signal to a group of functions known as
wavelets. In this section a brief conceptual description of the general algorithm used in
wavelet analysis is presented through 5 simple steps. For simplicity, the continuous-time
case is described here.
The continuous wavelet transform (CWT) is the sum over all time of the signal
multiplied by scaled, shifted versions of the wavelet. This process produces wavelet
coefficients that are a function of scale and position.
Stepl: Choose a mother wavelet and compare it to the first portion of the original signal.
Step2: Calculate a numerical value, e.g. coefficient C, which represents the
similarity/correlation between the signal portion and the wavelet. The higher the C, the
more similar is the wavelet to the original signal.
Step3: Move on to the next portion and repeat the steps 1 and 2 and calculate the
coefficients, i.e. Cs until the end of the signal.
Step4: Scale/stretch the wavelet in order to obtain the new wavelet (i.e. still from the
same family) and repeat the steps 1 to 3 to calculate all the Cs for the scaled wavelet.
Step5: Repeat the steps 1 to 4 for all the scales i.e. scaled wavelets.
Figure 3.2 illustrates the above process in CWT. Having calculated the Cs using
the above procedure, the original signal can be presented by means of a set of Cs along
with the corresponding wavelet.
28

Signal §-'*'"**~*~XJ 'U Wavelet m
C - 0.0102
Signal
I ft/ rsi loioi O I Shift over time
Signal §* IlAi Wavelet 5-
C = 0.2247 New scale
Figure 3.2 An illustration of CWT realization for a random signal [9].
It is to be noted that any signal processing performed on a computer using real-
world data must be performed on a discrete signal, (i.e. on a signal that has been
measured at discrete times) using the discrete wavelet transform (DWT). Therefore a
question may arise regarding the difference between the CWT and DWT. The main factor
that differentiates the CWT from DWT is the set of scales and positions at which it 29

operates. Unlike the DWT, the CWT can operate at every scale, from that of the original
signal up to some maximum scale that you determine by trading off your need for
detailed analysis with available computational horsepower. The CWT is also continuous
in terms of shifting: during computation, the analyzing wavelet is shifted smoothly over
the full domain of the analyzed function.
3.2.3 WD for EGM De-noising
In this section a brief overview of the WD for filtering of EGM data is presented
[9]. CWT of a given signal x(f) can be expressed as
y(s,T)=\x(t)y/'^{t)dt. (3.4)
In (3.4), s and r denote scale and position parameters, and y/*s,i(t) is the complex
conjugate of i//sr(t) given by
•sJS
1 (t-T^
V s J (3.5)
It is to be noted that y/ (t) is a user-defined mother wavelet, and its selection depends
upon the shape of the original signal. The inverse wavelet transform can be expressed as
30

x(0 = \\y(s,T)i//StZ(t)drds . (3.6)
In the discrete form, we define
^ » = ^ V n- j2
2' (3.7)
where n, i, and j represent sample index, decomposition index and position index along
the time-axis respectively. Substituting (3.7) in (3.4), coefficients y(i,j) can be evaluated
for different i and/. In theory, discrete signal x(ri) can be re-constructed as
where / and J are index sets. From a signal decomposition perspective, the corresponding
WD functions can be evaluated as
c i(«)=2K^;)^JW- (3.9) jeJ
Since each C\ corresponds to a specific frequency component of x{ri), partial addition of
the WD functions, i.e.
31

>>(«)= £ Cs (/i), (3.10)
where I al, results in a filtered biomedical signal. In other words, de-noising of the
given signal can be achieved by adding the low-frequency Qs. The WD approach is
applied to the de-noising of raw EGM data.
3.3 Experimental Results
In this section, the simulation results of the EMD and the WD are presented. Both
the techniques are applied to the real EGM data from patients and the results are
compared in order to highlight the advantages of the WD over the EMD. The presented
manometry test results are obtained using the LES profiling procedure as part of the
GERD diagnosis. The sampling rate in the experiments is chosen to be 6 Hz.
3.3.1 Application of EMD to EGM De-noising
EMD reviewed in section 3.1 is applied to the patient's data. The original signal is
decomposed into a set of IMFs using an in-house program developed in MATLAB. EMD
approach terminated after evaluating N = 17 IMFs, shown in Figure 3.3. De-noising of
the signal is performed through a partial addition of the IMFs i.e. only low-frequency
IMFs are considered in the summation of (3.3). The de-noised signal (see Figure 3.4) is
easy-to-analyze; however, it does not accurately detect sharp peaks and rapid changes.
32

->*--«HjMi#-»-'-*--4h'*-^ H l i # * --«•••—+«•-
4-H!»*
W — — ^ f o f i l l f ^ H l M V H ^ ' - * " ^ ^ •>-<«-«i»" 4- 1 1 1 J 1
*^ / ,A/V—*^/\|ww\MiiJ!Mjw^'tf^o^vv^/^^ —^A^«w\/y(/vj»w^rvvjwAw-Avy^*wvv'-W H V W W T H
—-~~MMMMAA~v\/vyyvvw-w\jywWv^
—-^vw\A^A^^AA./v\/t~^-^v\/yyyvv^~—~^xA^^^v\y^^v\y\Aivv\/v—AAMM VWWVH
/ V \ A A ^ - ~ A / \ / \ / V V ^ ^
Time (min)
Figure 3.3 IMFs evaluated using the EMD.
33

8 10 12 Time (min)
20
Figure 3.4 Original manometric data and the de-noised pressure signal using the EMD
approach.
3.3.2 Application of WD to EGM De-noising
WD introduced in section 3.2 is applied to the patient's data. For this purpose,
built-in functions of MATLAB are used. Considering the time-domain behaviour of the
pressure signal, index /' is chosen to be 15. Owing to the shape of the signal, mother
wavelet "sym3" shown in Figure 3.5 is picked. Resulting wavelets (C,s) are shown in
Figure 3.6.
34

0 ~~_
E <
-~y A
y A
1 i v -
Time
Figure 3.5 Mother wavelet 'sym3' used in the WD approach.
-^4->*MH+ti*--,f-'*--*''"H*W''+--4 Hf+^tH1*-**-' HH-I ^^w^r*****-*!^*.
i i i i i i '
S3
3
3
**~^Mpr^^iji^it&^-^^^»^^ —y^w**^
WNwr- 'YvjM^j i /WllM^W
"/W^VS-A/VT/\MWV—-~~-\'\/VyvV\A-v-—'vVMjyvv-/w~~—.-^(JKAA-W-^—^^v^/^^^w-^
+ + + + 5 Time (rnin) 1S
Figure 3.6 WD functions i.e. C,s evaluated using the WD approach.
35

Typically, esophageal movements and contractions correspond to a frequency
range less than 0.1Hz. As such, de-noised pressure signal is obtained using (3.10) with
/ = {5, 6, 7, ..., 10}. The de-noised signal (see Figure 3.7) does not miss sharp peaks and
sudden changes present in the original signal. In addition, there is no obvious phase
difference between the original and de-noised signals.
301 1 1 1 1 1 1 1 1 r
I i i i i i i i i l I
0 2 4 6 8 10 12 14 16 18 20 Time (min)
Figure 3.7 Original manometric data and the de-noised pressure signal using the WD
approach.
3.3.3 Comparison of EMD and WD in EGM De-noising
For the purpose of comparison, de-noised signals from both EMD and WD
approaches along with the raw signal are shown in Figure 3.8. In general, both methods
36

seem to provide a smooth de-noised signal. However, a close inspection of the results
could lead to interesting observations. De-noised signal from the WD approach is able to
detect/retain all the sharp changes in the original signal, which is not the case with the de-
noised signal from the EMD approach. There is a phase difference between the de-noised
signal from EMD and the given signal.
8 10 12 Time (min)
20
Figure 3.8 Comparison of the original manometric data, the de-noised pressure signal
using the EMD approach and the de-noised pressure signal using the WD approach.
37

A comparison in terms of number of decompositions/coefficients, CPU-time, and
signal-to-background ratio defined as
Z(x(',))2
SBR=-& , (3.11)
1=1
is presented in Table 3.1. In the above definition of SBR, x(tt) is the filtered
signal and n represents the total number of samples.
TABLE 3.1 COMPARISON OF EMD AND WD APPROACHES
Decomposition Method No. of CPU-Time SBR
Decompositions
EMD 17 75s 0.85
WD 15 0.5s 0.97
3.4 Summary
In this chapter, a wavelet-based decomposition approach has been applied to the
filtering of esophageal manometric data critical to EGMDs diagnosis. For comparison,
the WD approach and a recent approach (i.e. EMD) have both been applied to the
patients' data. The WD approach is better in terms of accuracy, and the corresponding de-
38

noised signal conveys relatively better information. In addition, the WD approach
requires less CPU-time
39

Chapter 4
Analysis and Modeling of EGM Data
for EGMDs Diagnosis
As discussed in the previous chapters, there are certain factors that make the
EGM-based diagnosis of EGMDs challenging. In chapter 3, WD was presented as an
effective tool for EGM data de-noising. In this chapter the other challenges are addressed
through signal processing techniques for detection/extraction of diagnostically key
information and generation of a computational model for classification of EGM patterns
benefiting the EGMDs diagnosis.
40

Subsequent to high-frequency noise filtering, detection and extraction of critical
EGM data segments is important for EGMDs diagnosis. It is to be noted that the primary
wave morphologies to be detected and extracted from the EGM data are the esophageal
pulses or contraction waves. For biomedical pulse/spike detection, several techniques
have been proposed [10]-[12], although not specifically for the EGM data. Some of the
early works based on the concept of sharpness [10], had limited success. Some of the
more recent techniques are based on time-frequency analysis [13] and spectrum analysis
[14]. In the case of EGM data, not much research has been reported thus far, and this is
one of the several motivations for the presented work in this chapter.
Model-based classification of normal and abnormal cases can immensely
contribute to computer-aided diagnosis of EGMDs. Toward this end, a convenient
mathematical model needs to be developed. Considering the fact that in reality there is no
such thing as an ideal case of human/patient in terms of EGM data, such model has to be
developed employing statistics (e.g. pulse amplitude) from a number of normal cases.
Since esophageal contractions in a normal case consist of a set of periodic events [2], the
model can be viewed as a dynamic periodic (or quasi-periodic) bio-system. Poincare
mapping (PM) [15][16], which recently emerged as a vehicle to the modeling of dynamic
bio-systems based on their statistics, is considered.
In this chapter, brief overview of the background for the relevant techniques in
pulse/spike detection and modeling is presented. Subsequently, the proposed techniques
for detection/extraction and modeling of EGM data are described in detail. Furthermore,
the proposed techniques are applied to the EGM data from 20 patients and the 41

experimental results are presented. Such results are compared to those from existing
literature where applicable.
4.1 Overview of Pulse Detection Techniques
Pulse/spike detection is an important tool for segmentation of biomedical data,
e.g. EGM signals. In this section, a quick overview of such techniques is presented.
Techniques commonly used for measuring sharpness of waves are based on three-point
interpolations, e.g. Taylor series approximation [17], which help estimate second
derivative of a given signal. First derivative of a de-noised discrete signal y(ri) can be
expressed as
y'(n)*(y(n)-y(n-\))l5, (4.1)
where n and S denote sample index and sampling period respectively. Second derivative
of y(ri) can be expressed as
y\ri)*(yXn + l)-y'(n))/S=(y(n + \)-2y(n)+y(n-r))/S2. (4.2)
A major drawback of (4.2) is that it utilizes highly local data, e.g. a peak and its
neighbours say, ignoring certain other points that also contribute to signal sharpness. In
the literature, there exist some techniques, e.g. [18], which utilize "less local" data. 42

More recent techniques for pulse/spike detection utilize the time-frequency
concept. A good example of such technique is the nonlinear energy operator (NLEO)
proposed in [19]. NLEO is a simple way to measure the energy content of a discrete-time
signal, based on an idea that energy variation of a signal indicates an event, e.g.
pulse/spike. In [19], energy of a de-noised discrete signal y(ri) is defined as
£Ka,ser [ * (« ) ] = / ( « ) " X " " 1XK« " 2 ) . (4 .3)
In (4.3), ̂ Kaiser satisfies a key property, i.e.
Raiser M COS( O>0» + 9)] = ^ A 1 ^ . (4.4)
From (4.4), the energy is proportional to both amplitude and frequency, and hence termed
as frequency-weighted energy. In [20], NLEO was presented in a more general form
using the energy definition
EJy(n)] = y(n - d)y{n - o) - y(n - q)y{n - r), (4.5)
43

where d + o = q + r. In the cases where d *• o and q*r, £gis more robust to "undesired
artifacts", e.g. respiratory artifacts, owing to the absence of the squared term in (4.3).
Considering the above definition(s) of energy, the objective is to detect/track the
energy changes in a given signal. Toward this end, in [20], a sliding temporal window is
used, and the frequency-weighted energy of the first half of the window is subtracted
from that of the second half, i.e.
"-*NLEO ' " m i d )
"raid " m i d + i
(4.6)
where «mid is the mid point of the sliding window of length 2Z, and m is the time-index. A
major drawback of such techniques is that any change in the energy content of a
biomedical signal results in a change in SNLEO, regardless of the cause (e.g. undesired
artifact). This drawback is critical in the case of EGM data as well, owing to the presence
of artifacts. In this chapter, a new NPDT, which is relatively insensitive to artifacts, is
proposed and applied to the EGM data.
4.2 Overview of Poincare Mapping (PM)
In this section, PM [15], which is an emerging technique for modeling of periodic
bio-systems, is reviewed. Given a bio-system with periodic (or quasi-periodic) dynamic
behaviors, PM maps the "system behaviors" from a ^-dimensional space onto a n-\
44

dimensional space referred to as the Poincare section. Owing to this dimensional
reduction, PM-based system analysis is often less complex. For instance, consider human
body temperature measurements as a function of time that correspond to a two-
dimensional dynamic system. If the temperature is observed to vary around 36°C, the
system can be considered to possess quasi-periodic behavior. One way to apply PM to
this scenario is to simply record the time points at which the temperature crosses the
desired value.
Having quoted an example, the mathematics involved in PM technique is
presented. Consider an autonomous differential equation in /? given by
^- = f(P), f:R"^R", peR", (4.7) at
and its solution/trajectory is of the form
P(.t) = t(Po>to>t), (4.8)
where (/?o, ft) is the initial condition. Let r represent an n-\ dimensional hyper-plane in
the ^-dimensional space, i.e.
45
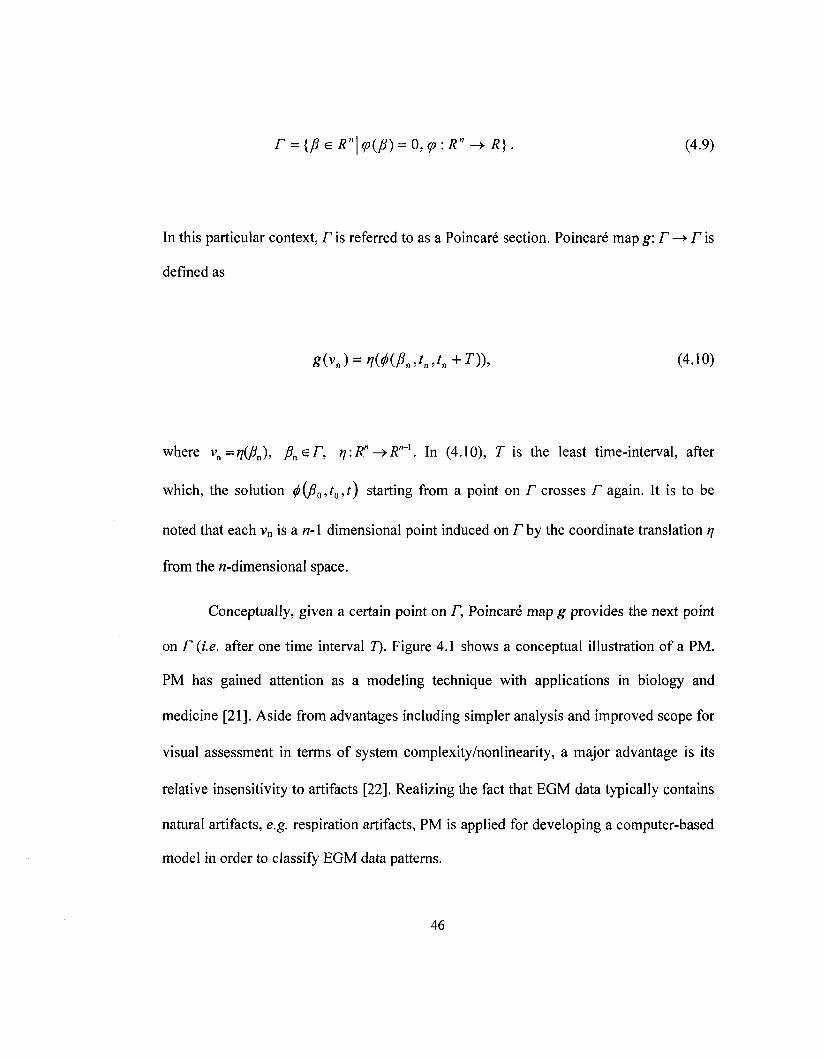
r = {fieR"\<p(p) = 0,<p:R" ~> R}. (4.9)
In this particular context, ris referred to as a Poincare section. Poincare map g:r—*r\s
defined as
gM=tl(Kfin>tn,tn+T)), (4.10)
where va=rj{fin), pneT, rj: R" -^ R"~l. In (4.10), T is the least time-interval, after
which, the solution 0(j3o,to,t) starting from a point on r crosses r again. It is to be
noted that each vn is a n-\ dimensional point induced on Tby the coordinate translation r\
from the ^-dimensional space.
Conceptually, given a certain point on r, Poincare map g provides the next point
on r (i.e. after one time interval 7). Figure 4.1 shows a conceptual illustration of a PM.
PM has gained attention as a modeling technique with applications in biology and
medicine [21]. Aside from advantages including simpler analysis and improved scope for
visual assessment in terms of system complexity/nonlinearity, a major advantage is its
relative insensitivity to artifacts [22]. Realizing the fact that EGM data typically contains
natural artifacts, e.g. respiration artifacts, PM is applied for developing a computer-based
model in order to classify EGM data patterns.
46

Figure 4.1 A conceptual illustration of Poincare mapg.
4.3 Proposed Nonlinear Pulse Detection Technique (NPDT)
In this section, a new EGM-oriented NPDT involving two phases described below
is developed. It is to be noted that the raw EGM data is first de-noised using the WD
overviewed in section 3.1.
4.3.1 Phase 1: Detection of Critical Points (CP)
The objective of the first phase is to locate the critical points in the de-noised
EGM data fundamental to the patient's pulse shape. Conceptually, these points are the
boundaries of the estimated straight lines fitted to the de-noised EGM data using a least
square approach. In the case of an EGM pulse, a CP is either a pre-steep/rising point (pr)
or a post-steep/falling point (pf).
In the proposed technique, the de-noised EGM data is first divided into a number
of data segments based on the patient's pulse duration (typically 7-1 Os). Considering one
such segment at a time, the technique involves sliding of what is referred to as a short-47

time data analysis window, through the segment. The purpose of such window is to
monitor the rate at which the EGM data trend changes within the segment. Detection of a
number of consecutive rises (or falls) as the window slides in small steps indicates a CP.
In terms of implementation, the length of the short-time analysis window and the number
of consecutive rises (or falls) that ascertain a CP are determined according to the patient
EGM pulse duration.
As mentioned earlier, considering a data segment at a time, the short-time window
is slide with an objective to find a rising (or falling) trend. Within a window frame, least-
square method is used to determine a straight line that approximates the data, with the
slope of the line quantifying the rise (or fall). In other words, for a given set of data lying
within the tfh short-time window, i.e. yk(w), w = 1, 2, ..., W, a line i.e. lk(w) = a]gyv+bk,
is determined, which best-fits the EGM data yk(w). This task is accomplished by
minimizing the error function IT k given by
w nk = Ibk(>v)-/k(w)]2, (4.ii)
w=\
where w is sample index, W is the short-time window length, and y\&yv) and l\Syv) are the
de-noised and fitted data respectively. Solving = 0 and = 0 leads to dak dbk
computation of the unknown coefficients. For example, slope of /k(w) becomes
48

w
w=l w~l w=l / ^ 1 0 \
(*F]T/»)_(£/(w))2
Condition ak > £ is checked, where £ represents the margin or threshold for a
rising trend. If the condition is met, a similar process is performed on the k+\th short-time
window to determine slope ak+i and condition ok+1 > S, is then checked. Satisfaction of
the latter condition indicates a rising trend and the first point in the fcth window, i.e. y\SS),
is labelled as a CP. Similarly, the other CPs in the data segment are also detected. The
above process is repeated for all the data segments of a patient's EGM data. In essence, at
the end of phase 1, CPs in each data segment are detected. An illustrative example of the
proposed technique in the case of a 15s long data segment is shown in Figure 4.2.
4.3.2 Phase 2: Wave-Shape Determination and Line-Fitting
Consider one data segment at a time. Starting with the CPs detected in the first
phase, the objective of the second phase is to determine the underlying wave-shapes and
accordingly fit the CPs with straight lines. Basically, the wave-shape is determined by the
location of pT andp? in the data segment.
49

100 200 300 Sample index («)
Figure 4.2. An illustration of proposed method for CP detection.
Specifically, in the case where px is detected prior to pf {i.e. a rising data trend
followed by a fall), a proper pulse (see Table 4.1) is deemed to be present in the data
segment. In the case where pt is detected prior to pr, the data segment lies between two
pulses. Since the length of the data segment is chosen such that there would not be two or
more pulses within a segment, the possible scenarios for wave-shapes are limited to those
presented in Table 4.1.
TABLE 4.1 POSSIBLE SCENARIOS FOR WAVE-SHAPES IN A DATA SEGMENT
Scenario CP sequence Wave-shape Description
I
II
III
Pr-*Pf
Pf-*P<
NoCP
_A_ Proper pulse
Between pulses
No event
50

Once the wave-shape corresponding to a data segment is determined, the EGM
data between the two CPs occurring at time instants «p and nv.\ is estimated by a straight
line, i.e. ep(n) = mpn + up, obtained using the least-square method. At the end of phase 2,
critical information pertinent to the EGM data, i.e. EGM pulses, are detected and fitted
with straight lines. The detected/extracted EGM signal, i.e.
e(n) =
ex(n), \<n<nx
e7(n), «, <n< «, . , (4.13)
where p denotes the CP index, formed by straight lines contains only those portions of the
EGM data that are diagnostically important. An example of such a signal is depicted in
Figure 4.3. In essence, the signal resulting from the proposed technique is suitable for
computer-aided model-based classification into normal and abnormal cases. The flow
chart of the proposed NPDT is shown in Figure 4.4.
ei{n)I \eiri) e5(n)l \e6(»)
e\{n) / \ e4(«) / W«) es(n)
Figure 4.3 Extracted and linearly estimated EGM data by NPDT.
51

(~StarT)
Load experimental data within a segment, i.e. y(n),
n = 1,2,..., iVand N- data length. CP Detection
Generate the k* short-time analysis window, i.e. }\(w), w - 1, 2,..., W.
1
Shift the Analysis Window; k=k+l
I Fit a line to data using least-square
method, i.e. 4(w)= a^w+b^.
Examine the next short-time window, and fit a line,
i.e. 4+i(w) = ak+|W+6k+,.
Yes Consider ̂ k(l) as CP
Wave-Shape Determination & Line fitting
Set CP as the falling point (pr)
No
Match the
- ^
pulse to Data Wave-Shap
— -
e
X Fit lines i.e. ep(w)= mp«+«pto
experimental data using least-square method
3: (fEnd )
Figure 4.4 Overall Flowchart of the proposed NPDT.
52

4.4 Poincare Map Based Pulse Modeling
PM reviewed in section 4.2 is applied to the modeling of EGM data. The
proposed technique, which involves generation of a statistical model for classification of
normal/abnormal cases, is described in this section.
As mentioned, there is no such thing as an ideal EGM pulse (or an ideal patient).
In other words, even for normal cases, there exist different EGM pulse characteristics
(e.g. amplitude, shape etc). Consequently, there is no definite scheme for classification
into normal and abnormal cases. In such cases, development of a model based on pure
mathematical formulae, is not preferable [21]. Black-box modeling techniques (e.g.
artificial neural networks), although general, require excessive amounts of training data,
i.e. widely varying patient data, and hence not efficient. As such, there is a need for
techniques, which bring out statistical features from modest amounts of available
biomedical or EGM data, in numerical/visual form. Motivated by this scenario PM has
been used as a vehicle to statistical pulse modeling (SPM) of EGM data.
From the proposed NPDT, important information including the estimated slopes
representing the EGM signal rise/fall and their order of occurrence are available. The
objective of SPM is to model both the quantitative values of slopes (i.e. mp) and their
order of occurrence (e.g. a signal rise followed by a fall). Considering the
detected/extracted EGM signal e(n) of (4.13), which consists of straight lines, a data set
Mis defined as
53

M = {mpe R\ mv = e'v(n), p = \,2,..., P - 1}, (4.14)
where p is the CP index, nv is the time instant corresponding to pth CP, and P is the total
number of CPs. As can be seen, M includes the numerical/quantitative values of slopes
corresponding to each CP and can be deemed to emulate the dynamic system of (4.8). In
order to represent the order of occurrence of the slopes, two Poincare sections T\ and 7~2
are defined for any given consecutive slopes in M(i.e. pih and/?+l,h slopes), i.e.
r\={mv), (4.15)
and
r2={mp+l}. (4.16)
i~i and r% when defined for each pair of consecutive slopes will correspondingly produce
a number of ordered pairs of slopes, i.e. (mp, m^\) that contain both the quantitative value
of slopes as well as their order of occurrence.
An effective way to depict Poincare sections F\ and A is to graph them using an
orthogonal coordinate system. Such plots lead to effective visual representation of PM,
54

i.e. g: M-* M. Once such graphical representation becomes available, given the current
slope (say m\), all the future slope values can be iteratively found using the graph. Since
this concept is new in the context of EGM data, an illustrative explanation follows.
Consider the detected/extracted and line-fitted EGM data of Figure 4.3 employing
the proposed NPDT. Applying the proposed PM technique (including generation of
ordered pairs and representing them on a two dimensional mp-mp+i graph) leads to what is
referred to as a Poincare plot (Figure 4.5). Although simple, the plot conveys information
with regard to slope values as well as correlation between consecutive slopes
corresponding to the extracted EGM pulses. In other words, the plot offers information
about any given EGM pulse, both in terms of its "shape characteristics" and its "location"
in a stream of EGM pulses. As such, the plots facilitate observation of the dynamics of
the EGM pulses in a given patient, by medical experts.
Interestingly, for a comprehensive set of EGM recordings (including a vast
number of EGM pulses), the plot appears as a blur of points (see Figure 4.6). Based on
the shape of the blur, one can fit a geometrical shape to the blur, mathematically
characterize the shape, and extract key statistical information about the EGM pulses. An
example illustrating this approach in the case of heart-rate variability measurements is
presented in [23]. Following such an approach, a patient's EGM pulse stream can be
statistically quantified (e.g. standard deviation, variance, etc) after fitted a suitable
geometrical shape (e.g. circle). Such statistical information can be used as a basis for
differentiation between normal and abnormal cases. As an example, consider the EGM
55

pulse stream of Figure 4.3 fitted to a circle. Standard deviation (SD) is denoted by the
radius (R) of the circle, and variance (V) can be evaluated using
V=-n
(4.17)
where A denotes area of the circle. From a diagnosis point of view, medical experts can
define/specify a range for R, within which a patient is considered normal.
The proposed NPDT followed by the proposed SPM technique are applied to the EGM
data of a number of patients, and the results are presented in the following section.
Wp+l
(m6, mi)
Figure 4.5 Poincare plot of consecutive slopes using the proposed method.
56

Wp+l
Figure 4.6 An example of a Poincare plot illustrating the geometrical shape fitted to a
blur of points.
4.5 Experimental Results
In this section, the experimental results of the proposed NPDT and SPM are
illustrated. Both the techniques are applied to the real EGM data from patients and the
results are shown. The presented EGM test results are obtained using the esophageal
body examination procedure as part of the EGMDs diagnosis. The sampling rate in the
experiments is chosen to be 16 Hz.
4.5.1 Experimental Results from NPDT
The proposed NPDT is applied to the de-noised EGM data of all 20 patients. The
algorithm is implemented in the MATLAB environment.
A de-noised 10 minute EGM data recording of each patient (about 9600 data
samples based on a sampling rate of 16 Hz) is considered. Each patient's data is divided
into 40 segments of length 15s (240 samples), noting the patient's pulse duration, which
57

is typically 7-10s. Each of the segments is analyzed using a short-time sliding window of
length Is (i.e. W=\6). Typically, threshold t; lies within [0, 0.2] range and varies for the
de-noised EGM data of different patients. Considering this, the proposed NDPT is run
several times, i.e. for different values of £, in order to find the optimal E, for each
patient. For each £, CPs of a data segment are detected by sliding the short-time
window, i.e. k=\, 2, ..., 15. The de-noised EGM data between the CPs are fitted by
straight lines. More specifically, in our work, £ leading to the least error between the de-
noised EGM data and the line-fitted waveform is treated as the optimal £ for the patient
under consideration. For the purpose of illustration, Figure 4.7 shows the line-fitted
NDPT result for one of the 20 patients over a 30s time-frame.
60
50
•3 40
x E £ w 30 w 2 o. o B o> | 20 « 2
10
0
*100 5 ~T0 15~ 2tT 25 30 Time (sec)
Figure 4.7 De-noised EGM signal and the fitted straight lines using NPDT.
58

The proposed NPDT is compared with existing techniques briefly
mentioned/reviewed in section 4.1 (Table 4.2). Comparison is done in terms of accuracy,
as quantified by normalized pulse duration error (NPDE), i.e.
/ \Detected pulse duration - Actual pulse duration NPDE = ^ J \= [,(4.18)
/ j Data segment duration
in terms of efficiency, as quantified by accurate pulse detection rate (APDR), i.e.
/ No. of Accurate pulses detected APDR =±*= - - , (4.19)
/ i No . of Total pulses detected
and in terms of sensitivity (e), i.e.
_ Minimum detected pulse amplitude
Average pulse amplitude (4.20)
De-noised EGM data of all 20 patients is used. Table 4.2 shows that the proposed
NPDT is both accurate and efficient compared to other techniques as indicated by the
values of NPDE and APDR respectively. In addition, the proposed NPDT offers the best
59

sensitivity for detection of EGM pulses. However, it is worth-mentioning that the existing
techniques used for comparison have been shown to be accurate/useful for
detection/extraction of certain classes of biomedical signals such as EEG signals.
TABLE 4.2 COMPARISON OF SPIKE DETECTION TECHNIQUES
Detection Technique NPDE APDR s
Taylor Series 2nd Derivative [17]
Extrema based Estimation [18]
Least Square Acceleration [12]
Non-Linear Energy Operator [19]
Proposed NPDT
4.5.2 Experimental Results from SPM Technique
The proposed SPM technique, implemented in MATLAB, is applied to the
detected/extracted and line-fitted EGM data of all 20 patients (10 normal cases and 10
abnormal cases). For brevity, SPM results of one normal case and one abnormal case are
presented in this section.
For each patient, the ordered pairs of consecutive slopes from NPDT, i.e. (mp,
Wp+i), are depicted as a Poincare plot, using an orthogonal coordinate system. These plots
offer an interesting perspective to the review of EGM pulse dynamics. In order to bring
out the differences between normal and abnormal cases, the adjacent points on these plots
are connected using straight lines. The objective of such an exercise is to see if there
60
0.7 0.13 0.61
0.8 0.2 0.41
0.4 0.83 0.35
0.6 0.78 0.56
0.2 0.94 0.27

exists notable visual distinction between Poincare plots of normal and abnormal cases.
Poincare plots consisting of 120 ordered pairs, i.e. P = 120, of a normal case and an
abnormal case, with adjacent points connected, are shown in Figures 4.8 and 4.9
respectively.
A visual inspection of Figures 4.8 and 4.9 shows that the Poincare plot of a
normal case shows a regular pattern/trend, which is lacking in that of an abnormal case.
In other words, given the current slope value in the case of a normal patient, there seems
to be a possibility to find future slopes exploiting such pattern. This observation forms a
"qualitative basis" for classification of normal and abnormal cases. Within the cases
exhibiting regular patterns, certain abnormalities (e.g. out-of-range pulse amplitude) can
not be ruled out. As such, a "quantitative approach" to further studying the Poincare plots
of probable normal cases is of interest.
/w0(mmHg/s) 15 F
10
5
0
-5
-10
"1-51S ^ 0 -5 6 5 10 1~5
Figure 4.8 Poincare plot of consecutive slopes for a normal case using SPM.
61

mp(mmHg/s) 15
10
5
0
-5
-10
'1-515 -10 -5 0 5 10 15
Figure 4.9 Poincare plot of consecutive slopes for an abnormal case using SPM.
From the visual inspection of Poincare plots of all 10 normal cases, it has been
determined that an isosceles triangle best-fits the regular patterns. Figure 4.10 shows an
example of one such fitted triangle along with its geometrical parameters, i.e. equal sides'
length (a), non-equal side's length (b), and height (h). These parameters have a potential
to offer key statistical information about each patient's data.
The next step is to relate the above-said triangle parameters to EGM pulse
dynamics using mathematical equations. One of the diagnostically critical information
with regard to a patient's EGM pulses is the maximum/minimum of pulse sharpness or
slope. This information can be related to the height of the isosceles triangles, with the
outer triangle height (h) and the inner triangle height (H) representing the maximum and
minimum respectively, as seen in Figure 4.11. Maximum sharpness indicator (MASI) is
defined as
62
J I I L

h = Jal--y , (4.21)
and minimum sharpness indicator (MISI) is defined as
H A2--B2 . 4
(4.22)
Symmetry of the patient EGM pulses also offers diagnostically important information.
The patient's pulse symmetry index (PSI) using parameters o\ and oi (of Figures 4.10 and
4.11) is defined as
PSI =i
cr.
cr,
; cr, > cr2
; a2>a.
(4.23)
Ideally, the value of PSI regarding to an EGM data including a number of symmetrical
pulses is 1.
63

»Jp(mmHg/s)
Figure 4.10 Isosceles triangle fitted to Poincare plot of consecutive slopes for a normal
case.
Wp(mmHg/s)
-15 -10 -5 10 15 20
Figure 4.11 Realization of A^m from Poincare plot for a normal case.
64

A yet another interesting information with regard to patient's EGM pulses comes
from the standard deviation (SD) of slopes. For quantifying this measure, area .<4diff is
defined as
Adlf[=AoM-Ain=±(b.h-B.H). (4.24)
Substituting for h from (4.21), and //from (4.22), we have
SD oc Adm = - Ja2b2 - A2B2 - -(b2 - B2) , (4.25)
which is an indicator for the consistency of a patient's EGM pulses.
The proposed SPM technique (including all the above measures) is applied to the
EGM data of 10 normal patients, and the numerical results are summarized in Table 4.3.
Such results convey key statistical information regarding to patients' EGM pulses as
describe by the measures. A range can be specified by experts for the numerical results
regarding each measure in which the patient is considered as normal. Interestingly,
meaningful data is not only obtained through the particular measures cited in Table 4.3,
but the combination of measures has enabled the observation of correlation between
them. For instance, in cases where the MASI and MISI are relatively high yet within a
65

normal range, the higher values of SD are considered normal. Therefore, the range for the
SD values in which the patient is considered as normal is dictated using MASI and MISI.
Such a quantitative approach to the study of Poincare plots provides an effective tool for
further assessment of EGM pulses aiming at differentiating certain abnormalities.
TABLE 4.3 STATISTICAL MEASURES FOR EGM PULSES REALIZED BY SPM FOR 10 NORMAL PATIENTS
MASI MISI Patient PSI
(mmHg) (mmHg) (mmHg)
^diff
2
1 24 11 0.98 295
2 16 9 0.64 120
3 23 13 0.52 238
4 19 8 0.23 170
5 27 16 0.82 343
6 37 26 0.69 282
7 25 11 0.71 310
8 22 12 0.42 225
9 29 16 0.43 364
10 14 9 0.71 114
66

4.6 Summary
In this chapter, new techniques to analysis and modeling of EGM data for
EGMDs diagnosis are described. Subsequent to high-frequency noise filtering from EGM
data, the proposed techniques include detection/extraction of diagnostically valuable
portions of the EGM recordings, and development of a statistical model for
differentiation between normal and abnormal cases. The raw EGM data from 20 patients
is first filtered using the WD described in chapter 3. A new NPDT is developed to
identify and extract the critical information, i.e. EGM pulses with emphasis on accuracy
and efficiency. For comparison, the proposed NPDT and the similar techniques in
existing literature are applied to the de-noised EGM data. Such comparison shows that
the NPDT leads to better results in terms of accuracy. The detected/extracted EGM pulses
are then used to generate a statistical model exploiting PM that classifies/differentiates
normal and abnormal cases. Such model aids the medical experts in the EGMDs
diagnosis based on EGM data.
67

Chapter 5
A New Approach for Treatment of
Gastroesophageal Reflux Disease
(GERD)
As mentioned earlier, GERD is the most prevalent EGMD-based disease that
despite the numerous existing techniques for its treatment, research towards an effective
cure has continued unabated. In this chapter, a novel idea for treatment of GERD using
an electronic implantable device is described. Furthermore, a number of sample circuits
for the proposed implant structure from the existing literature are presented. 68

5.1 A Potential Approach to GERD Treatment
As explained in section 2.8.2, acid reflux can occur during different mechanisms
which may result in GERD. However, the common feature in all GERD cases is the LES
failure to stay contracted in absence of a swallow. As such, a general solution for GERD
treatment should involve the control of LES in order to assure its contraction at
appropriate times. In the following, an engineering approach based on electrical
stimulation of LES using neurostimulation techniques for GERD treatment is proposed.
5.1.1 LES Control Utilizing Neurostimulation Techniques
LES consists of a muscle that controls the transition of material at the junction
between the stomach and the esophagus. Importantly, this muscle can be stimulated
through its motor nerves/neurons using available neuroengineering techniques [24]. A
good example for application of such techniques is presented in [25]. Ultimately, the
control of LES can be accomplished by means of these techniques and it can be
considered as an effective GERD treatment. In the next section, a new approach to
implement this idea is described.
5.1.2 An Effective Approach to Realizing Neurostimulation-Based Control of
LES
The control of LES using neurostimulation techniques can be implemented by
using an electronic device implantable in the body of the patient. Such an implant is
responsible to control the LES and guarantee the LES contraction and relaxation at
appropriate times. Obviously, the implant device has to be supplied with electrical power
69

to be able to perform the control tasks. This power can be supplied by means of wireless
power transmission methods dedicated to biomedical applications [25]. It should be noted
that, the implant consists of a number of circuits/modules that have to be designed
according to strict criteria such as low power consumption, low supply voltage, minimal
chip area, etc. Therefore, analog circuit design techniques are required to achieve the
desired criteria for circuits of the device. A number of sample analog circuits from the
existing literature are presented in the following sections.
5.2 A Smart Implant Dedicated to GERD Treatment
In this section, the concept of the proposed implant device for GERD treatment is
described extensively. The main idea of LES control through neurostimulation techniques
is explained and the potential challenges/concerns are mentioned. The objective is to
create a basis for further research regarding this subject.
5.2.1 LES Stimulation Concept
As explained in section 2.8.1, LES is a muscle that receives its control signals
from parts of the brain through Vagus nerve. Therefore the control of LES can be
accomplished through electrical neurostimulaion of the motor neurons included in the
Vagus nerve. This stimulation can be done by applying low amounts of electric current
(in the order of mAs), by means of simulation electrodes (e.g. cuff electrodes) [24].
There are two motor neuron groups included in the Vagus nerve, one producing
contraction and the other relaxation of the LES. In other words, contractions and
relaxations of the LES are two separate events that are produced by the brain and
70

transmitted by neurons. Therefore, the LES control procedure used by the proposed
implant should include two separate sections dedicated for creation of contractions and
relaxations. In the following section, the main tasks/responsibilities of the implant are
described. Consequently, a control algorithm is developed based on these
tasks/responsibilities.
5.2.2 Main Tasks/Responsibilities of the Implant
As explained in section 2.8.2, the main mechanism of reflux leading to GERD is
the frequent TLESRs. In other words the high incidence rate of these transient LES
relaxations leads to GERD overtime. Therefore an effective strategy to cure GERD is to
reduce the number of TLESRs. As such, the tasks/responsibilities of the implant are
determined so that the LES is forced to stay contracted at appropriate time thus reducing
the TLESRs. It should be noted that the TLESR is a natural mechanism and occurs due to
a number of reasons such as stomach distention caused by food or gas (which results in
belching), excess body fat and stress. Consequently, the total elimination of all the
TLESRs is not an option. However, the idea of reducing the number of TLESRs seems to
be an effective means to cure GERD.
As explained, the implant is responsible to stimulate the LES to stay contracted
unless there is a swallow event or a stomach distention. As such, there is a need for
different sensors in order to detect swallows or stomach distentions. Based on the facts
mentioned above, the main tasks of the implant are summarized as:
i) Detection of swallow events.
71

ii) Detection of stomach distentions.
iii) Contraction of the LES unless there is a swallow or a stomach distention.
iv) Relaxation of the LES when there is a swallow or a stomach distention.
It is to note that the contraction and relaxation of LES are two separate tasks ever
since each of them is accomplished by stimulation of a different nerve group. An implant
capable of realizing the above tasks has to be equipped with multiple channels of sensors
and stimulators. In the following section a general scheme for implementation of the
proposed implant system is described. In addition, a number of sample circuits proposed
in the literature are also presented.
5.3 Implant System Structure and Circuits
The proposed implant system consists of two main units, one implanted in
patient's body and another one being outside the body (see Figure 5.1). The first unit is
the actual implant device which is responsible for the LES control. The second unit is the
external controller unit which is responsible for transmitting electrical power and control
commands to the implant unit. More precisely, it supplies the power for the implant and
adds user-based control features to the system. The above mentioned units communicate
through a wireless link for transmission of power and data. A suitable option for
implementation of such a link is via inductive link using two coils, one on each unit.
72

Esophagus
Figure 5.1 Proposed implant system.
The implant unit is determined to be in close contact with the target tissue in order
to acquire the sensory signals and to stimulate the tissue. As such, this unit includes a
control/logic module to manage the operation of the other modules in the implant and
generate necessary control signals. The power needed for all the modules in implant unit
is provided by a power recovery circuitry which receives the transmitted power from the
external source. A communication circuitry is designed to receive the data which is
mainly the user-implied control signals in emergency situations. A sensing module is
determined to collect the desired physical quantity {i.e. displacement in this case) from
the body tissue and provide such information to the control/logic unit. Stimulation of the
target tissue is performed via the stimulator module which is designed to generate the
suitable electrical signal for the specific tissue.
73

The external controller is responsible for transmission of power and user
commands to the implant device. Therefore, it consists of a control/logic module to
manage the control commands and a communication module for transmission of power
and data. Figure 5.2 illustrates the different modules in the proposed implant structure. In
the following sections a number of sample circuits for implementation of the proposed
system are presented.
External Controller
Power Supply Control/ Logic
Data
Inductive link
Power
Implant
Power Recovery
Communication Curcuitry
Control/Logic
Sensor/ Stimulator
Tissue Interface
Figure 5.2 Implant structure.
5.3.1 The Power Recovery System
In this subsection a power recovery system to be implemented on the implant
device is presented. Typically, the circuits designed for devices dedicated to nerve
stimulation applications need a certain amount of stimulating current which requires a
large voltage supply to drive the electrodes. This is due to the fact that the equivalent
tissue impedance is in the range of several tens of kilo-Ohms and need significant amount
74
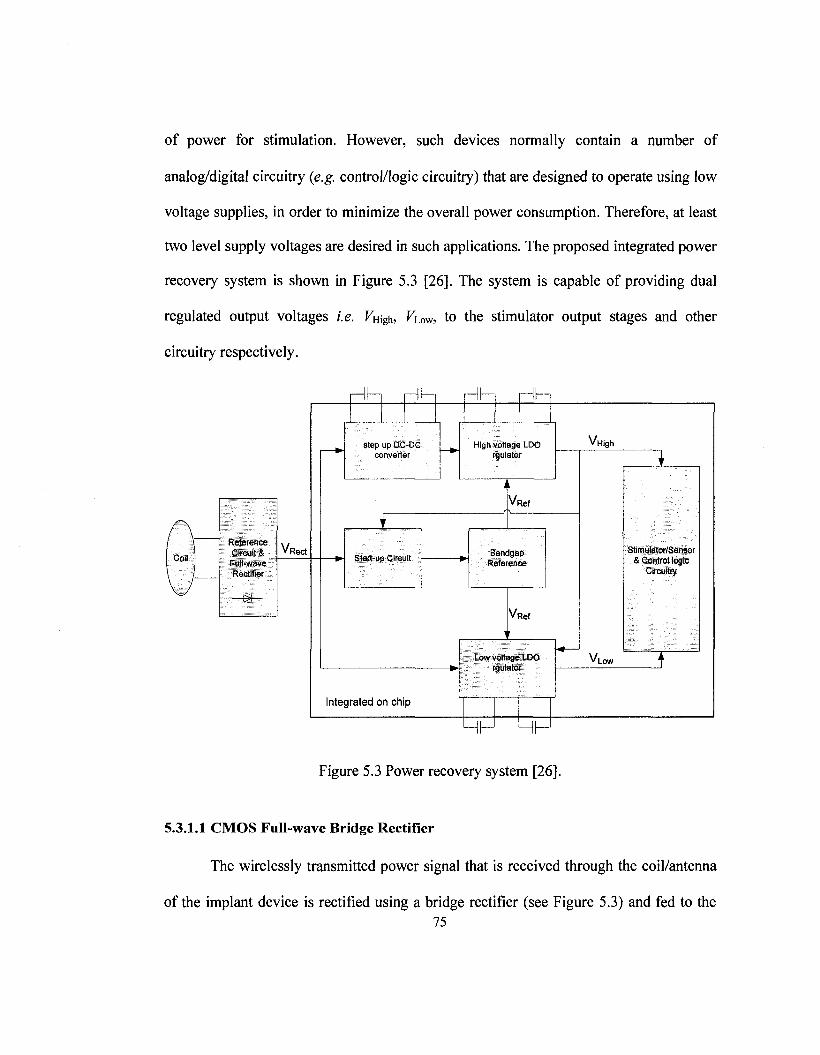
of power for stimulation. However, such devices normally contain a number of
analog/digital circuitry (e.g. control/logic circuitry) that are designed to operate using low
voltage supplies, in order to minimize the overall power consumption. Therefore, at least
two level supply voltages are desired in such applications. The proposed integrated power
recovery system is shown in Figure 5.3 [26]. The system is capable of providing dual
regulated output voltages i.e. Vw^, Viow, to the stimulator output stages and other
circuitry respectively.
Reference Circuit & Full-wave Rectifier
—£+—
V, Red
H HH H H
Step up DO-DC converter
Start-up Circuit
Integrated on chip
High voltage LDO rgulator
V R e f
Reference
V R e f
Low voltage LOO rgulator
|_J L_|
V, High
VLOW
Stimulator/Sensor & Control logic
Circuitry
Figure 5.3 Power recovery system [26].
5.3.1.1 CMOS Full-wave Bridge Rectifier
The wirelessly transmitted power signal that is received through the coil/antenna
of the implant device is rectified using a bridge rectifier (see Figure 5.3) and fed to the 75

other stages of the power recovery system. An applicable sample of a CMOS full-wave
bridge rectifier is proposed in [27] (see Figure 5.4). Employing a full-wave bridge
rectifier as compared to a half-wave rectifier significantly reduces the implant size and
also helps the regulator to achieve better AC-DC conversion efficiency. In the circuit of
Figure 5.4, diode connected pMOS transistors Mpi and MP2 and the diode connected
nMOS transistors Mni and Mn2, form a bridge for the received signal from the coil.
Transistors MP3 through MP6 are auxiliary transistors which facilitate the function of Mpi
and Mp2. Transistors Qi and Q2 help the transistors Mni and Mn2 to return current from
grounded substrate to the coil.
Coil2 Separated N-WeH
Mp2 *-*
Mp5
Mp6;
f — f
Q
h Mp3
K. Mn2 3lL_—
Colli Separated N-Wel!
Mp4|
+ JL^. Mpi
Vout
• — - #
Mill Q2
Figure 5.4 Integrated CMOS full-wave bridge rectifier [27].
76

5.3.1.2 Dual-Output Low-Dropout Voltage Regulator
As mentioned earlier, the wirelessly received energy must be rectified and
regulated. This regulation can be achieved by using the regulator structure proposed in
[26] known as low-drop-out (LDO) linear voltage regulator (see Figure 5.5). Typically,
linear regulator consists of a voltage reference, a pass device, an error amplifier, and a
resistive feedback network. It is mainly divided into two categories according to the pass
transistor device: p-type and n-type regulators. Each has its own advantages and
drawbacks. The latter structure is often preferred due to its less stability problems, better
line load regulation, and naturally low-ohmic output impedance structure. However, the
conventional nMOS regulator suffers from large dropout voltage problem, due to the fact
that the gate potential voltage of the pass transistor needs at least one threshold voltage
(Vth), higher than the regulated output. The problem can be mitigated by using a native
transistor (i.e. NMi in Figure 5.5), available in many modern CMOS processes. The
difference between a native CMOS and a usual CMOS is that a native CMOS is a
transistor which skips the step of adjusting the threshold-voltage (Vth) during its
fabrication process. Regulators using n-type pass devices show fewer stability problems,
better regulation and lower output impedance characteristics compared to their p-type
counterparts.
77

Vree"
*• V,
Figure 5.5 A typical dual output (LDO) voltage regulator from [26].
5.3.1.3 CMOS Bandgap Reference
A bandgap reference circuit is desired to provide a reference voltage to both
regulators in the system. A sample CMOS bandgap reference circuit is described in [26].
Unlike in most conventional bandgap reference applications, the requirement of
temperature dependency for the circuit is relaxed. This is due to the fact that the circuit
environment temperature (i.e. patient's body temperature) in the target application is not
widely varied.
5.3.1.4 Start up Circuit
According to the fact that both the voltage regulator and the bandgap reference in
the power recovery module are interdependent, meaning they need each other to function
properly, a start up circuit is used to provide the bandgap reference with the rectified
voltage on power up, and then switch to the regulated voltage when it becomes available.
78

The start-up circuit compares Vrec and Vnigh, and feeds the larger of the two to the
bandgap reference. The schematic of the start up circuit is shown in Figure 5.6 [26].
Figure 5.6 Start up Circuit [26].
5.3.1.5 DC-DC Converter
A DC-DC converter (level shifter) [27] can be used to supply and generate the
desired voltages VLOW and VHigh to the regulators. A typical circuit for the level shifter is
shown in Figure 5.7. The output voltage is simply equal to input voltage minus two gate-
source voltages i.e. Vovl = J/in-(PsGi + PsG2)- The circuit consumes very low power which
is a significant advantage for the target application.
79

y-m
R
M » l
M3
Figure 5.7 Level shifter circuit [27].
5.3.2 Communication System
In this section, the desired building blocks of the communication system are
introduced and in each case a sample circuitry is proposed. As described earlier, there is
an external controller in the proposed implant system which is responsible for
transmission of power and user commands to the implanted device via an inductive link.
The inductive link between the two units is a bi-directional data link and is composed of
two separate links for data transmission. The first link transmits the data from the
external controller to the implanted device (i.e. downlink) and the second link transmits
the data from the implanted device to the external controller (i.e. uplink). These links can
be implemented using different circuit strategies aiming to meet a number of certain
criteria (e.g. data transmission rate, power consumption, etc.) in different applications. In
fact, bi-directional data transmission has become a trend in state-of-the-art design of
wireless biomedical systems. Recently, a few wireless inductive link designs have been
80

reported. The main data communication characteristics of these works are summarized in
Table 5.1.
TABLE 5.1 RECENT DATA COMMUNICATION TECHNIQUES PROPOSED FOR IMPLANTABLE DEVICES
References Downlink
(rate) Uplink (rate) Carrier (Hz) Power
Consumption Technology
[28]
[29]
[30]
[31]
[32]
[33]
[34]
Packet
detection
PWM-ASK
(250 kbps)
ASK
ASK (120 k)
OOK (100
kbps)
OOK
BPSK
Burst of RF
energy
ASK
PWM-ASK
(125 kbps)
BPSK (117-
234 k) No
LSK
(200kbps)
BPSK
2.5 M
1-10 M
4M
10 M
13.56 M
5mW
10-90 mW
4.5 mA
2 /an CMOS
1.2 jum
CMOS
3 fiva.
BiCMOS
2.5 jum BiC
5M 0.5 mA, 10 V 2/mi CMOS
6.78 M <120mW
652 /uW
1.2 jum
CMOS
0.18/mi
CMOS
In this work the proposed link for the communication in implant system is known
as binary phase shift keying (BPSK) [34]. BPSK is a process where the target binary
signal shifts the phase of a carrier waveform between 0° and 180°. This is equivalent to
multiplying the carrier with a bit stream o f 1' and ' - 1 ' representing high and low states
respectively. As such, a BPSK modulator simply multiplies a target signal i.e. m{f) to a
carrier i.e. sin(cyi/ + 6\). However the demodulation process is not as simple. Figure 5.8
81

illustrates the block diagram of the BPSK demodulator including a structure known as
Costas loop. A brief description of the demodulator function follows.
Data tn
mf^sinfojii + ft,)
Lowpass Filter
I Branch Data Out
mf t j cos^ - Bz)
sin{&^\ + ft2)
VCO Lowpass Filter
Phase Shifter
e o s ^ t + 02)
Lowpass Filter
2m2( t)sin2(e1-e2)
Q Branch
(a)
Receiver Coil
(b)
Figure 5.8 Inductive link for transmitted data: (a) Costas loop demodulator (b) detailed
demodulator block diagram [35]. 82
The input signal of the demodulator is the product of a data stream and a carrier.
Here, the purpose is to obtain the data stream by separating it from the carrier signal.
Assume that in Figure 5.8(a), the term m{i) represents the data stream in the input signal
composed of either T or ' - 1 ' and the term s\n{w\t + d\) is the carrier. After passing
through the low-pass filters, the outputs of the upper and lower branches are expressed as
Vo\{t) = m(t)QOs{6\ - 62) and Voq(i) = m(t)sm{6\ - di). By means of an additional
multiplier and a loop filter at the center branch, the control voltage of the VCO becomes
only proportional to the phase difference (6>i - #2). In case there is no phase difference in
that signal the required demodulated signal is achieved in the output. In other words, the
system tries to make the phase difference (d\ - #>) equal to zero by finding the phase 6%
equal to 9\. Consequently, the target signal m(t) is obtained from the upper branch in
Figure 5.8(a).
The detailed block diagram of the Costas loop demodulator is shown in Figure
5.8(b) The multipliers are implemented using simple XOR gates and the low pass filters
are RC low-pass filters. These low-pass filters are necessary in order to cancel any
unwanted harmonics since the multiplication is a nonlinear process. In the following
subsections a number of sample circuits for the demodulator building blocks are
described.
5.3.2.1 Comparator
In the detailed diagram of Figure 5.8(b), there are two comparators located at the
input and upper branch. The first comparator converts the input signal to the square
83

waveform. This allows using simple digital phase detectors in the circuit. The second
comparator assures that the output signal is in the form of a data stream of' Is' and ' - I s ' .
The comparator circuit is shown in Figure 5.9 [35]. The whole circuit consists of
two parts. On part provides the reference voltages for the bias of the circuit and the other
part is the high gain differential amplifier which does the comparison of the input signals.
The reference voltage circuit is shown on the left side of the Figure 5.9. The nMOS
transistors, Mi and IVk, are the differential input pair and form the main core of the
comparator. Transistors M3 and M4, are current sinks to supply the required current for
the differential pair. Transistors M5 - M12, are current mirrors as active loads for the
differential pair to boost its gain. The output stage consists of transistors, M B - Mig, and
M19 - M24. Two digital buffers are also put at the output for the isolation of the circuits.
The employment of two current mirror transistors, Mi 7 and M23, eliminated the need of a
common mode feedback circuit (CMFB), which has simplified the overall system.
84
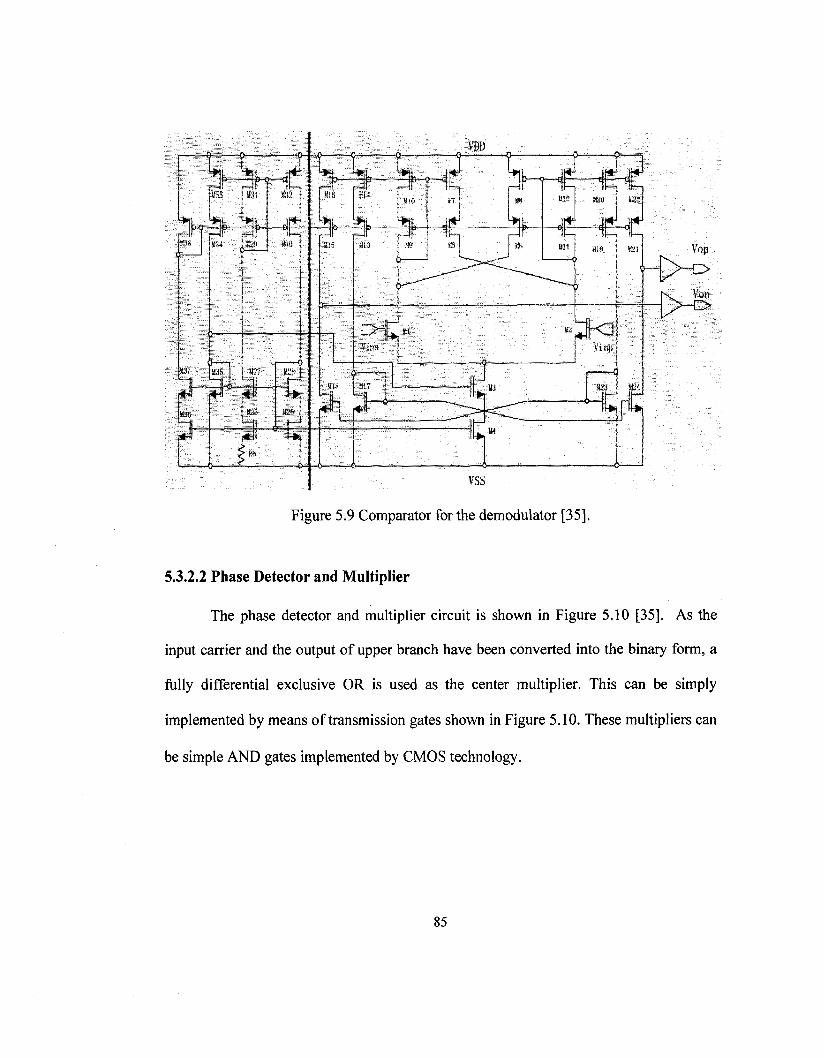
Figure 5.9 Comparator for the demodulator [35].
5.3.2.2 Phase Detector and Multiplier
The phase detector and multiplier circuit is shown in Figure 5.10 [35]. As the
input carrier and the output of upper branch have been converted into the binary form, a
fully differential exclusive OR is used as the center multiplier. This can be simply
implemented by means of transmission gates shown in Figure 5.10. These multipliers can
be simple AND gates implemented by CMOS technology.
85

A o
A o
VQN
o Z VIP O
o Z VINO
VOP
VQN
Figure 5.10 Phase detector and multiplier circuit [35].
5.3.2.3 Voltage Controlled Oscillator (VCO)
The structure of the voltage controlled oscillator for the demodulator is shown in
Figure 5.11. The whole structure is made of two parts: a transconductance cell (left side)
and oscillation cell (right side). The transconductance cell is designed to convert the
applied input voltage to a control current effective to the oscillation frequency of the
VCO. The oscillation cell is the core of the VCO which generates the oscillation
frequency. Transistors (Mi, M2) operate as switches, which are turned on/off in turn in
accordance with voltage potentials of their gate and source terminals. The frequency is
controlled by a linear transconductance cell which generates a control current injected to
the oscillation cell in Figure 5.11. This control current is proportional to the applied input
voltage of the VCO. The oscillation is generated by turning on/off the transistors Mi and
86

M2 resulting charge/recharge of the capacitor C\. Any change in the control current is
copied to the charging current of the capacitor thus results in the frequency of oscillation.
M12
o Itune
Vinp p*> - | j _ Vinn M9
Figure 5.11 VCO circuit [35].
5.3.2.4 Phase Shifter (Quadrature Signal Generator)
As shown in Figure 5.8(b), there is a need to generate the quadrature of the
oscillated signal in the lower branch of the demodulator. This task can be completed by a
digital circuit consisting two D-flip flops as shown in Figure 5.12 [35]. The function of
this circuit is to generate 90 degrees shift in phase of the input signal and convert the sine
function to cosine function and vice versa. This is simply achieved by addition of a time
delay in the function using D-flip flops. It should be noted that a reference with twice of
87

the carrier frequency has to be generated in the VCO with this circuit which results in a
slightly more power consumption but still the best option for the desired application.
! >OUT
OOUTB
OOUTQ
\ > OUTQB
Figure 5.12 Phase detector and multiplier circuit [35].
5.4 Summary
In this chapter, an electrical engineering solution using circuit implementation for
treatment of GERD has been proposed. The approach is based on the electrical
stimulation of a sphincter located at the junction of the stomach and the esophagus in
order to control the acid reflux. For the first time, a new idea for implementation of the
approach using an electronic implantable device has been presented. Furthermore, a
number of sample circuits for the implant structure from the literature have been
described briefly. The objective has been to provide a framework for further research on
the proposed idea of the implant for GERD treatment.
88

Chapter 6
Conclusions
6.1 Contributions
Esophageal motility disorders (EGMDs) correspond to a group of widespread
diseases with a rapidly increasing prevalence rate in North America. The diagnosis of
EGMDs can be tedious, time consuming, and technically challenging. This thesis
attempted to address the challenges of EGMDs diagnosis through the use of signal
processing methods. The ultimate goal has been to develop new computer-based
approaches that:
i) Increase the accuracy of the diagnosis;
ii) Reduce the amount of time required for diagnosis; 89

iii) Enhance the ability of the experts in diagnosis.
In addition, a new circuit-based solution for treatment of GERD, i.e. the most
common disease caused by EGMDs, using electrical neuro-stimulation methods is
proposed. The main objective has been to provide a framework for further research
regarding a potential GERD treatment based on electrical neuro-stimulation methods.
The desire for development of engineering techniques applicable to diagnosis and
treatment of EGMDs demands for a basic knowledge about the esophagus physiology
and its motility. As such, chapter 2 of this thesis was devoted to an overview of the
medical aspect. This chapter included a brief description of the esophagus anatomy, an
explanation of EGMDs causes, as well as a brief overview of GERD.
The key test for motility assessment of esophagus is EGM. EGM results are
inspected visually by medical experts for diagnosis. However the visual inspection of the
results by the doctors can be tedious due to the fact that the results are usually
contaminated by noise and artifacts. As such, new signal processing-based approaches
aiming at simplifying the EGMDs diagnosis are developed and described in chapters 3
and 4 of this thesis. In chapter 3, a signal processing technique i.e. WD, is applied to the
filtering of the EGM data. In chapter 4, a new NPDT is applied to the de-noised EGM
data leading to identification and extraction of diagnostically important information. Such
information is used to generate a statistical model, which can classify the EGM patterns.
The proposed approach is computationally effortless, thus making it suitable for real-time
application. Experimental results using measured EGM data from patients is presented in
90

each chapter. In addition, the results of the proposed techniques are compared with those
techniques from existing literature where applicable. Such comparisons show the
advantages of the proposed approaches over the existing techniques.
In chapter 5, a new approach for treatment of GERD based on electrical neuro-
stimulation methods has been proposed. The approach involves the design of an
implantable device dedicated to electrical stimulation of a sphincter at the junction of the
esophagus and the stomach. The proposed approach is an effective tool for GERD
treatment compared to the existing surgical methods and may permanently cure GERD.
The main structure of the implant system as well as a group of state-of-the-art analog
circuits from existing literature have been described in order to provide a framework for
the design and implementation of the idea.
6.2 Future Work
The proposed approaches for EGMDs diagnosis offer a scope for future work in
terms of additions and improvements. Further research towards the development of more
efficient techniques for filtering and detection of key EGM data can provide more
practical tools for medical experts in EGMDs diagnosis. For instance, in case of WD
filtering technique, further research towards development of a new optimum wavelet for
the EGM data analysis to replace the symlets may increase efficiency and accuracy of the
WD. In addition, in case of NPDT, the detection of EGM pulses can be improved by
defining the algorithms that are more accurate/efficient in finding the CPs. Ultimately,
the proposed SPM for EGM pulse modeling can be modified and completed through
91

addition of new features that take account of the EGM pulses' coordination in addition to
the pulses' shape information.
The proposed approach for GERD treatment demands future work in terms of
extensive study towards the implementation of the implant system. Such study may
include the detailed analysis of the LES motor function along with the best ways of its
stimulation, the development of control algorithms based on the defined responsibilities
of the implant and the design of the specific circuits in the implant system.
92

REFERENCES
[1] M. Feldman, L.S. Friedman, L.J. Brandt, and M.H. Sleisenger, Gastrointestinal
and Liver Disease, 8th ed., vol. 1, Philadelphia, PA: Saunders Elsevier, 2006,
chapter 41, pp. 855-877.
[2] D.O. Castell and J.E. Richter, The Esophagus, 4th ed., Philadelphia, PA:
Lippincott Williams & Wilkins, 2004, chapter 5, pp. 115-136.
[3] F.A. Granderath, T. Kamolz, and R. Pointner, Gastroesophageal Reflux Disease,
1st ed., Wien, Austria: Springer-Verlag, 2006, chapter 11, pp. 121-139.
[4] http://www.riversideonline.com/source/images/image_popup/ans7_esophagus.jpg
[5] http://www.gispecialists.net/images/art/stomach.gif
[6] H. Liang, Q. Lin, and J.D.Z. Chen, "Application of empirical mode
decomposition to the analysis of esophageal manometric data in gastroesophageal
reflux disease," IEEE Trans. Biomed. Engg, vol. 52, no. 10, pp. 1692-1701,2005.
[7] W. Qiao, H.H. Sun, W.Y. Chey, and K.Y. Lee, "Continous wavelet analysis as an
aid in the representation and interpretation of electrogastrographic signals," Proc.
IEEE. Biomed. Engg. Con/., Dayton, OH, March 1996, pp.140-141.
[8] H. Liang and Z. Lin, "Stimulus artifact cancellation in the serosal recordings of
gastric myoelectric activity using wavelet transforms," IEEE Trans. Biomed.
Engg., vol. 49, pp. 681-688,2002.
[9] I. Daubechies, Ten Lectures on Wavelets, 2nd ed., Philadelphia, PA: Society for
Industrial Mathematics, 1992, chapters 3-5, pp. 53-167.
93

[10] J.R. Smith, "Automatic analysis and detection of EEG spikes," IEEE Trans.
Biomed. Engg, vol. 21, no. 1, pp. 1-7, 1974.
[11] X. Yang and S.A. Shamma, "A totally automated system for the detection and
classification of neural spikes," IEEE Trans. Biomed Engg., vol. 35, no. 10, pp.
806-816, 1988.
[12] M.G. Frei, R.L. Davidchack, and I. Osorio, "Least squares acceleration filtering
for the estimation of signal derivatives and sharpness at extrema," IEEE Trans.
Biomed. Engg, vol. 46, no. 8, pp. 971-977, 1999.
[13] H.S. Bokil, B. Pesaran, R.A. Andersen, and P.P. Mitra, "A method for detection
and classification of events in neural activity," IEEE Trans. Biomed. Engg., vol.
53, no. 8, pp. 1678-1687,2006.
[14] J. Muthuswamy, D.L. Sherman, and N.V. Thakor, "Higher-order spectral analysis
of burst patterns in EEG," IEEE Trans. Biomed. Engg., vol. 46, no. 1, pp. 92-99,
1999.
[15] T.S. Parker and L.O. Chua, Practical Numerical Algorithems for Chaotic systems,
1st ed., New York, NY: Springer-Verlag, 1989, chapters 2-5, pp. 38-348.
[16] J.J. Gray, Linear Differential Equations and Group Theory from Riemann to
Poincare, 2nd ed., Boston, MA: Birkhauser, 2000, chapter 6, pp. 173-221.
[17] E.W. Cheney and D.R. Kincaid, Numerical Mathematics and Computing, 4th ed.,
Pacific Grove, CA: Brooks Cole Pub. Co., 1999, chapter 10, pp. 453-521.
[18] J. Gotman and P. Gloor, "Automatic recognition and quantification of interictal
epileptic activity in the human scalp EEG," Electroencephalography and Clinical
Neurophysiology, vol. 41, pp.513-529, 1976.
94

[19] J.F. Kaiser, "On a simple algorithm to calculate the 'energy' of a signal," Proc.
IEEE. Int. Conf. ICASSP, Albuquerque, NM, April 2007, pp. 381-384.
[20] E.I. Plotkin and M.N.S. Swamy, "Nonlinear signal processing based on parameter
invariant moving average modeling," Proc. CCECE, Toronto, Canada, Sept.
1992, pp. TM3.11.1-TM3.11.4.
[21] S.H. Strogatz, Nonlinear Dynamics and Chaos: with Applications to Physics,
Biology, Chemistry, and Engineering, 1st ed., vol. 1, Reading, MA: Addison-
Wesley, 1994, chapters 1-10, pp. 1-398.
[22] D. Singh and K. Vinod "Effect of RR segment duration on short-term HRV
assessment using Poincare plot," Proc. IEEE. Int. Conf. ICISIP, Chennai, India,
Jan. 2005, pp. 430-434.
[23] M. Brennan, M. Palaniswami, and P. Kamen, "Do existing measures of poincare
plot geometry reflect nonlinear features of heart rate variability?," IEEE Trans.
Biomed. Engg., vol. 48, no. 11, pp. 1342-1346, 2001.
[24] W.E. Finn and P.G. LoPresti, Handbook of Neuroprosthetic Methods, 1st ed.,
Boca Raton, FL: CRC Press, 2003, chapters 4-7, pp. 75-195.
[25] S. Boyer, M. Sawan, M. Abdel-Gawad, S. Robin, and M.M. Elhilali, "Implantable
selective stimulator to improve bladder voiding: Design and chronic experiments
on dogs," IEEE Trans. Rehabilitation Engg, vol. 8, no. 4, pp. 464-470, 2000.
[26] Y. Hu, M. Sawan, and M.N. El-Gamal, "A power recovery strategy dedicated to
implantable applications," Proc. IEEE. Int. Conf. ICECS, Sharjah, UAE, Dec.
2003,pp.l212-1215.
[27] A. M. Sodagar, K. Najafi, K. D. Wise, and M. Ghovanloo, "Fully-integrated
CMOS power regulator for telemetry-powered implantable biomedical
95

microsystems," Proc. IEEE. Int. Conf. CICC, San Jose, CA, Sept. 2006, pp. 659-
662.
[28] G. J. Suaning and N.H. Lovell, "CMOS neurostimulation ASIC with 100
channels, scaleable output, and bidirectional radio-frequency telemetry," IEEE
Trans. Biomed. Engg., vol. 48, no. 2, pp. 248-260, 2001.
[29] W. Liu, et al., "A neuron-stimulus chip with telemetry unit for retinal prosthetic
device," IEEE J. Solid-State Circuits, vol. 35, no 10, pp. 1487-1497, 2000.
[30] T. Akin, K. Najafi, and R.M. Bradley, "A wireless implantable multichannel
digital neural recording system for a micromachined sieve electrode," IEEE J.
Solid-State Circuits, vol. 33, no 1, pp. 109-118, 1998.
[31] J. Parramon, et al., "ASIC-based battery less implantable telemetry microsystem
for recording purposes," Proc. IEEE. EMBS Int. Conf., Chicago, IL, Nov. 1997,
pp. 2225-2228.
[32] G. Gunnar, E. Bruun, and H. Morten, "A Chip for an Implantable Neural
Stimulator," Journal of Analog Integrated Circuits and Signal Processing, vol.
22, pp. 81-89,1999.
[33] B. Smith, et al., "An externally powered, multichannel, implantable stimulator-
telemeter for control of paralyzed muscle," IEEE Trans. Biomed. Engg., vol. 45,
no 4, pp. 463-475, 1998.
[34] Y. Hu and M. Sawan, "A fully integrated low-power BPSK demodulator for
implantable medical devices," IEEE Trans. Circuits and Systems I, vol. 52, no.
12, pp.2552-2562,2005.
[35] M. Sawan, Y. Hu, and J. Coulombe, "Wireless smart implants dedicated to
multichannel monitoring and microstimulation," IEEE Circuits and Systems
Magazine, vol. 5, no. 1, pp. 21-39, 2005. 96
Related Documents