Signal attenuation and box-counting fractal analysis of optical coherence tomography images of arterial tissue Dan P. Popescu, 1,* Costel Flueraru, 2 Youxin Mao, 2 Shoude Chang, 2 and Michael G. Sowa 1 1 National Research Council of Canada, Institute for Biodiagnostics, 435 Ellice Avenue, Winnipeg, MB, R3B 1Y6; Canada 2 National Research Council of Canada, Institute for Microstructural Sciences, 1200 Montreal Road, Ottawa, ON, K1A 0R6; Canada *[email protected] Abstract: The sensitivity of optical coherence tomography images to sample morphology is tested by two methods. The first method estimates the attenuation of the OCT signal from various regions of the probed tissue. The second method uses a box-counting algorithm to calculate the fractal dimensions in the regions of interest identified in the images. Although both the attenuation coefficient as well as the fractal dimension correlate very well with the anatomical features of the probed samples; the attenuation method provides a better sensitivity. Two types of samples are used in this study: segments of arteries collected from atherosclerosis–prone Watanabe rabbits (WHHL-MI) and healthy segments of porcine coronary arteries. ©2010 Optical Society of America OCIS codes: (170.4500) Optical coherence tomography; (170.6935) Tissue characterization; (170.3880) Medical and Biological Imaging; (030.5770) Roughness. References and links 1. M. Shiomi, T. Ito, S. Yamada, S. Kawashima, and J. Fan, “Development of an animal model for spontaneous myocardial infarction (WHHLMI rabbit),” Arterioscler. Thromb. Vasc. Biol. 23(7), 1239–1244 (2003). 2. C. Flueraru, H. Kumazaki, S. Sherif, S. Chang, and Y. Mao, “Quadrature Mach- Zehnder interferometer with application in optical coherence tomography,” J. Opt. A, Pure Appl. Opt. 9(4), L5–L8 (2007). 3. Y. Mao, S. Chang, S. Sherif, and C. Flueraru, “Graded-index fiber lens proposed for ultrasmall probes used in biomedical imaging,” Appl. Opt. 46(23), 5887–5894 (2007). 4. S. H. Yun, G. J. Tearney, J. F. de Boer, N. Iftimia, and B. E. Bouma, “High-speed optical frequency-domain imaging,” Opt. Express 11(22), 2953–2963 (2003). 5. D. Levitz, L. Thrane, M. Frosz, P. E. Andersen, C. B. Andersen, S. Andersson-Engels, J. Valanciunaite, J. Swartling, and P. Hansen, “Determination of optical scattering properties of highly-scattering media in optical coherence tomography images,” Opt. Express 12(2), 249–259 (2004). 6. J. M. Schmitt, S. H. Xiang, and K. M. Yung, “Speckle in optical coherence tomography,” J. Biomed. Opt. 4(1), 95–105 (1999). 7. B. Karamata, M. Laubscher, M. Leutenegger, S. Bourquin, T. Lasser, and P. Lambelet, “Multiple scattering in optical coherence tomography. I. Investigation and modeling,” J. Opt. Soc. Am. A 22(7), 1369–1379 (2005). 8. J. W. Goodman, Laser Speckle and Related Phenomena (Berlin Springer, 1984), Chap. 3 & 5. 9. J. W. Goodman, “Some fundamental properties of speckle,” J. Opt. Soc. Am. 66(11), 1145–1150 (1976). 10. D. J. Faber, F. J. van der Meer, M. C. Aalders, and T. G. van Leeuwen, “Quantitative measurement of attenuation coefficients of weakly scattering media using optical coherence tomography,” Opt. Express 12(19), 4353–4365 (2004). 11. C. Flueraru, D. P. Popescu, Y. Mao, S. Chang, and M. G. Sowa, “Added soft tissue contrast using signal attenuation and the fractal dimension for optical coherence tomography images of porcine arterial tissue,” Phys. Med. Biol. 55(8), 2317–2331 (2010). 12. W. C. Kuo, M. W. Hsiung, J. J. Shyu, N. K. Chou, and P. N. Yang, “Assessment of arterial characteristics in human atherosclerosis by extracting optical properties from polarization-sensitive optical coherence tomography,” Opt. Express 16(11), 8117–8125 (2008). 13. S. S. Chen, J. M. Keller, and R. M. Crownover, “On the Calculation of Fractal Features from Images,” IEEE Trans. Pattern Anal. Mach. Intell. 15(10), 1087–1090 (1993). #129419 - $15.00 USD Received 1 Jun 2010; revised 9 Jul 2010; accepted 20 Jul 2010; published 26 Jul 2010 (C) 2010 OSA 2 August 2010 / Vol. 1, No. 1 / BIOMEDICAL OPTICS EXPRESS 268

Welcome message from author
This document is posted to help you gain knowledge. Please leave a comment to let me know what you think about it! Share it to your friends and learn new things together.
Transcript

Signal attenuation and box-counting
fractal analysis of optical coherence
tomography images of arterial tissue
Dan P. Popescu,1,*
Costel Flueraru,2 Youxin Mao,
2 Shoude Chang,
2
and Michael G. Sowa1
1National Research Council of Canada, Institute for Biodiagnostics, 435 Ellice Avenue, Winnipeg, MB, R3B 1Y6;
Canada 2National Research Council of Canada, Institute for Microstructural Sciences, 1200 Montreal Road, Ottawa, ON,
K1A 0R6; Canada
Abstract: The sensitivity of optical coherence tomography images to
sample morphology is tested by two methods. The first method estimates
the attenuation of the OCT signal from various regions of the probed tissue.
The second method uses a box-counting algorithm to calculate the fractal
dimensions in the regions of interest identified in the images. Although both
the attenuation coefficient as well as the fractal dimension correlate very
well with the anatomical features of the probed samples; the attenuation
method provides a better sensitivity. Two types of samples are used in this
study: segments of arteries collected from atherosclerosis–prone Watanabe
rabbits (WHHL-MI) and healthy segments of porcine coronary arteries.
©2010 Optical Society of America
OCIS codes: (170.4500) Optical coherence tomography; (170.6935) Tissue characterization;
(170.3880) Medical and Biological Imaging; (030.5770) Roughness.
References and links
1. M. Shiomi, T. Ito, S. Yamada, S. Kawashima, and J. Fan, “Development of an animal model for spontaneous
myocardial infarction (WHHLMI rabbit),” Arterioscler. Thromb. Vasc. Biol. 23(7), 1239–1244 (2003).
2. C. Flueraru, H. Kumazaki, S. Sherif, S. Chang, and Y. Mao, “Quadrature Mach- Zehnder interferometer with
application in optical coherence tomography,” J. Opt. A, Pure Appl. Opt. 9(4), L5–L8 (2007).
3. Y. Mao, S. Chang, S. Sherif, and C. Flueraru, “Graded-index fiber lens proposed for ultrasmall probes used in
biomedical imaging,” Appl. Opt. 46(23), 5887–5894 (2007).
4. S. H. Yun, G. J. Tearney, J. F. de Boer, N. Iftimia, and B. E. Bouma, “High-speed optical frequency-domain
imaging,” Opt. Express 11(22), 2953–2963 (2003).
5. D. Levitz, L. Thrane, M. Frosz, P. E. Andersen, C. B. Andersen, S. Andersson-Engels, J. Valanciunaite, J.
Swartling, and P. Hansen, “Determination of optical scattering properties of highly-scattering media in optical
coherence tomography images,” Opt. Express 12(2), 249–259 (2004).
6. J. M. Schmitt, S. H. Xiang, and K. M. Yung, “Speckle in optical coherence tomography,” J. Biomed. Opt. 4(1),
95–105 (1999).
7. B. Karamata, M. Laubscher, M. Leutenegger, S. Bourquin, T. Lasser, and P. Lambelet, “Multiple scattering in
optical coherence tomography. I. Investigation and modeling,” J. Opt. Soc. Am. A 22(7), 1369–1379 (2005).
8. J. W. Goodman, Laser Speckle and Related Phenomena (Berlin Springer, 1984), Chap. 3 & 5.
9. J. W. Goodman, “Some fundamental properties of speckle,” J. Opt. Soc. Am. 66(11), 1145–1150 (1976).
10. D. J. Faber, F. J. van der Meer, M. C. Aalders, and T. G. van Leeuwen, “Quantitative measurement of attenuation
coefficients of weakly scattering media using optical coherence tomography,” Opt. Express 12(19), 4353–4365
(2004).
11. C. Flueraru, D. P. Popescu, Y. Mao, S. Chang, and M. G. Sowa, “Added soft tissue contrast using signal
attenuation and the fractal dimension for optical coherence tomography images of porcine arterial tissue,” Phys.
Med. Biol. 55(8), 2317–2331 (2010).
12. W. C. Kuo, M. W. Hsiung, J. J. Shyu, N. K. Chou, and P. N. Yang, “Assessment of arterial characteristics in
human atherosclerosis by extracting optical properties from polarization-sensitive optical coherence
tomography,” Opt. Express 16(11), 8117–8125 (2008).
13. S. S. Chen, J. M. Keller, and R. M. Crownover, “On the Calculation of Fractal Features from Images,” IEEE
Trans. Pattern Anal. Mach. Intell. 15(10), 1087–1090 (1993).
#129419 - $15.00 USD Received 1 Jun 2010; revised 9 Jul 2010; accepted 20 Jul 2010; published 26 Jul 2010(C) 2010 OSA 2 August 2010 / Vol. 1, No. 1 / BIOMEDICAL OPTICS EXPRESS 268
14. A. I. Penn, and M. H. Loew, “Estimating fractal dimension with fractal interpolation function models,” IEEE
Trans. Med. Imaging 16(6), 930–937 (1997).
15. P. Kotowski, “Fractal dimension of metallic fracture surface,” Int. J. Fract. 141(1-2), 269–286 (2006).
1. Introduction
Atherosclerosis was once exclusively thought of as an occlusive disease where plaque
accumulation on the arterial walls resulted in the narrowing of the arterial lumen. As our
knowledge of atherosclerosis evolves, interest has shifted from the simple model of luminal
narrowing towards complex biological processes occurring under the luminal surface. This
interest induced the need for novel techniques able to image beneath the luminal surface of the
artery. Optical coherence tomography (OCT) seems to be a natural candidate for imaging
structures located under the luminal surface. OCT has an axial resolution that is determined by
the coherence length of the light source, which usually is less than 10 µm. Micrometer range
resolution allows for the investigation of morphological details within the arterial wall not
resolved by other techniques currently used for vascular imaging. Although a lot of
information can be extracted from the visual inspection of an OCT image there is a need to
analyze the data beyond the raw information provided by a simple image. Usually, visual
inspection of an OCT image is a subjective procedure which is limited when there are small
differences in the optical refraction indexes of various arterial components. For such cases,
reliable quantitative parameters need to be identified in order to improve the sensitivity and
the specificity in detecting and distinguishing vascular pathologies. There are two types of
parameters that are the focus of this study. The first parameter considered is the attenuation of
the OCT signal through various regions of interest (ROIs) within the probed samples. The
other parameter class consists of the calculated fractal dimensions of recorded signal texture
from ROIs within OCT images. The samples used for this study are segments of left
descending coronary arteries harvested from healthy pigs and the descending aorta from
atherosclerosis–prone Watanabe heritable hyper-lipidemic (WHHL-MI) rabbits [1].
2. Swept-source optical coherence tomography system and image acquisition
The OCT images for this study were acquired using a 3x3 Mach-Zehnder quadrature
interferometer with a swept-source. The system has been described in detail elsewhere [2].
The swept source (HSL2000, Santac) has a central wavelength of 1320 nm and a full scan
wavelength range of 110 nm. Its coherence length (in air) is 7 µm. The light exiting the
sample arm was focused onto the sample through ball-lens single mode fibers whose design
and fabrication were described in a previous publication [3]. The whole probe head ensemble
had the following specifications: working distance 1.1 mm, depth of field 0.9 mm and spot
size 28.2 µm. The total optical power illuminating the sample was approximately 5 mW. The
balanced detection output is recorded with a digitizer (Alazartech) at a 100 MHz sampling
rate. After the records were re-sampled to equal frequency intervals, an inverse Fourier
transform was performed. The end result was a depth profile (A-scan), which is the
dependence on depth of the sample reflectance. The standard OCT image (B-scan) used for
this study contains 900 A-scans, which amounts to a scanning width of 3 mm. Overall, the
Mach-Zehnder OCT system had a measured sensitivity of 107 dB. There is an exponential
falloff of sensitivity with depth for the swept source which is related to the limited
instantaneous lineshape of its laser [4]. This effect can be explained as a decreasing visibility
of the higher frequency fringes which are back-reflected from deeper locations within the
sample. The sensitivity falloff parameter is defined as the position where the sensitivity
decreases by 6 dB and the measured sensitivity falloff of the home-built OCT system used in
this report was 2.8 mm. Since the measured sensitivity falloff of our system was larger than
the investigated ROI depths, there was not necessary to take into consideration this effect
when analysis of OCT data acquired during this investigation was performed.
#129419 - $15.00 USD Received 1 Jun 2010; revised 9 Jul 2010; accepted 20 Jul 2010; published 26 Jul 2010(C) 2010 OSA 2 August 2010 / Vol. 1, No. 1 / BIOMEDICAL OPTICS EXPRESS 269
3. Sample preparation and image acquisition
Segments of artery were snap-frozen immediately after they were harvested and stored at −80◦
C until the time of imaging. The acquisition of OCT images was conducted at room
temperature after samples were allowed a short period of thawing also at room temperature.
We have investigated two types of arterial tissues: one type harvested from healthy pigs and
the other from atherosclerosis–prone Watanabe (WHHL-MI) rabbits. This type of rabbit
spontaneously develops atherosclerotic plaques resembling key aspects of the human clinical
condition [1]. Testing was carried out in two geometries: one with the lumen side and the
other with the external adventitia exposed to the probing beam, respectively. For the first
testing geometry, the arterial samples were cut open along the direction of blood flow. For the
second testing geometry the arterial samples were not cut open. In this case samples had their
serosa and adventitia layers exposed directly to the probing beam and the collapsed lumen
could be identified in the OCT images.
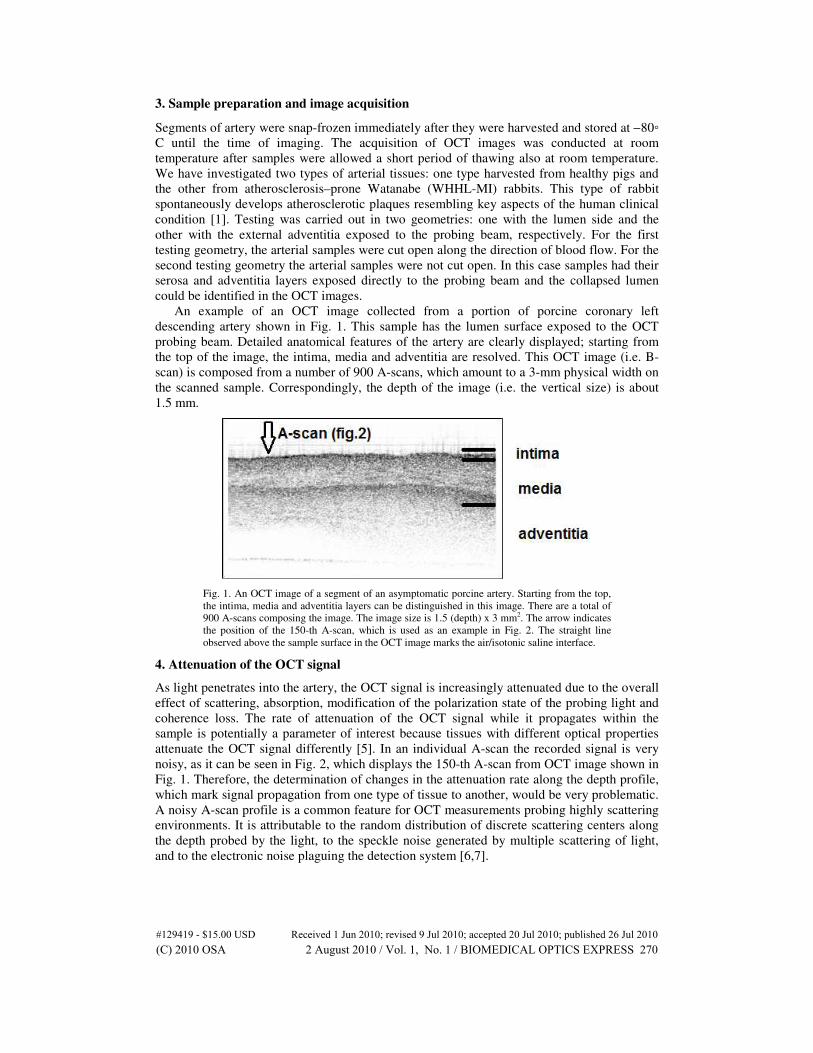
An example of an OCT image collected from a portion of porcine coronary left
descending artery shown in Fig. 1. This sample has the lumen surface exposed to the OCT
probing beam. Detailed anatomical features of the artery are clearly displayed; starting from
the top of the image, the intima, media and adventitia are resolved. This OCT image (i.e. B-
scan) is composed from a number of 900 A-scans, which amount to a 3-mm physical width on
the scanned sample. Correspondingly, the depth of the image (i.e. the vertical size) is about
1.5 mm.
Fig. 1. An OCT image of a segment of an asymptomatic porcine artery. Starting from the top,
the intima, media and adventitia layers can be distinguished in this image. There are a total of
900 A-scans composing the image. The image size is 1.5 (depth) x 3 mm2. The arrow indicates
the position of the 150-th A-scan, which is used as an example in Fig. 2. The straight line
observed above the sample surface in the OCT image marks the air/isotonic saline interface.
4. Attenuation of the OCT signal
As light penetrates into the artery, the OCT signal is increasingly attenuated due to the overall
effect of scattering, absorption, modification of the polarization state of the probing light and
coherence loss. The rate of attenuation of the OCT signal while it propagates within the
sample is potentially a parameter of interest because tissues with different optical properties
attenuate the OCT signal differently [5]. In an individual A-scan the recorded signal is very
noisy, as it can be seen in Fig. 2, which displays the 150-th A-scan from OCT image shown in
Fig. 1. Therefore, the determination of changes in the attenuation rate along the depth profile,
which mark signal propagation from one type of tissue to another, would be very problematic.
A noisy A-scan profile is a common feature for OCT measurements probing highly scattering
environments. It is attributable to the random distribution of discrete scattering centers along
the depth probed by the light, to the speckle noise generated by multiple scattering of light,
and to the electronic noise plaguing the detection system [6,7].
#129419 - $15.00 USD Received 1 Jun 2010; revised 9 Jul 2010; accepted 20 Jul 2010; published 26 Jul 2010(C) 2010 OSA 2 August 2010 / Vol. 1, No. 1 / BIOMEDICAL OPTICS EXPRESS 270
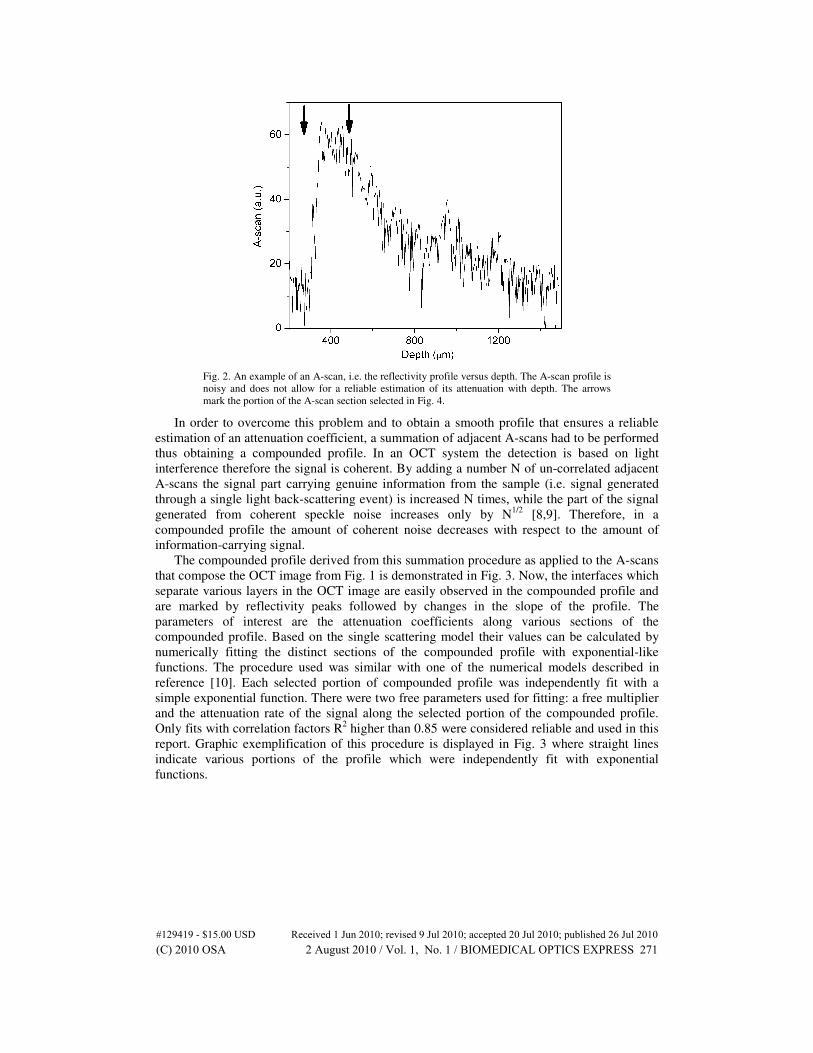
Fig. 2. An example of an A-scan, i.e. the reflectivity profile versus depth. The A-scan profile is
noisy and does not allow for a reliable estimation of its attenuation with depth. The arrows
mark the portion of the A-scan section selected in Fig. 4.
In order to overcome this problem and to obtain a smooth profile that ensures a reliable
estimation of an attenuation coefficient, a summation of adjacent A-scans had to be performed
thus obtaining a compounded profile. In an OCT system the detection is based on light
interference therefore the signal is coherent. By adding a number N of un-correlated adjacent
A-scans the signal part carrying genuine information from the sample (i.e. signal generated
through a single light back-scattering event) is increased N times, while the part of the signal
generated from coherent speckle noise increases only by N1/2
[8,9]. Therefore, in a
compounded profile the amount of coherent noise decreases with respect to the amount of
information-carrying signal.
The compounded profile derived from this summation procedure as applied to the A-scans
that compose the OCT image from Fig. 1 is demonstrated in Fig. 3. Now, the interfaces which
separate various layers in the OCT image are easily observed in the compounded profile and
are marked by reflectivity peaks followed by changes in the slope of the profile. The
parameters of interest are the attenuation coefficients along various sections of the
compounded profile. Based on the single scattering model their values can be calculated by
numerically fitting the distinct sections of the compounded profile with exponential-like
functions. The procedure used was similar with one of the numerical models described in
reference [10]. Each selected portion of compounded profile was independently fit with a
simple exponential function. There were two free parameters used for fitting: a free multiplier
and the attenuation rate of the signal along the selected portion of the compounded profile.
Only fits with correlation factors R2 higher than 0.85 were considered reliable and used in this
report. Graphic exemplification of this procedure is displayed in Fig. 3 where straight lines
indicate various portions of the profile which were independently fit with exponential
functions.
#129419 - $15.00 USD Received 1 Jun 2010; revised 9 Jul 2010; accepted 20 Jul 2010; published 26 Jul 2010(C) 2010 OSA 2 August 2010 / Vol. 1, No. 1 / BIOMEDICAL OPTICS EXPRESS 271

Fig. 3. Compounded profile corresponding to the OCT image from Fig. 1. Numerical fits
corresponding to different layers are also shown.
By applying the signal attenuation method, features which were not clearly evident in the
initial OCT images were identified. For example, in the medial layer of the porcine artery we
identified two sub-layers each bearing its own class of attenuation coefficients. The change in
the attenuation of the OCT signal was attributed to a change in the orientation of the elastin
fiber bundles in the medial layer [11]. It is known that the wall of a healthy artery has a well
ordered elastin fiber network that imparts elasticity to the vessel allowing it to contract and
expand during the cardiac cycle. This leads to a directional anisotropy of the optical properties
of the medial layer of the porcine coronaries, which is reflected in the attenuation of the OCT
signal. These types of morphological-induced optical anisotropies in arterial tissues could be
also emphasized through polarization-sensitive OCT [12].
The media layer sections that showed different elastin fiber orientation could not be easily
differentiated by a visual examination of the OCT image. However, the two sub-sections of
the media layer in the porcine left descending coronary arteries were made evident and
quantifiable by measuring the attenuation coefficient of the compounded signal. The average
values obtained for the attenuation coefficients of the OCT signal propagated through the
media were as follows (starting from the sub-layer that borders the tunica intima): 4.60 ± 0.29
mm−1
and 5.63 ± 0.05 mm−1
(when the scanning occurs along the direction of blood flow), and
1.59 ± 0.19 mm−1
and 8.31 ± 0.09 mm−1
(scanning perpendicular to the flow). Meanwhile, the
media sub-layers were not visible in the OCT images acquired from the WHHL-MI rabbit
arteries but they were signaled by the attenuation coefficients of the corresponding
compounded profiles. For this class of samples, when the scanning occurs perpendicular to the
direction of blood flow the following values are obtained for the attenuation of signal
propagating through the media sub-layers: 1.77 ± 0.02 mm-1 (sub-layer adjacent to the tunica
intima) and 2.38 ± 0.04 mm-1 (sub-layer adjacent to adventitia). Unlike the media, the
adventitia layer has a homogeneous structure characterized by single OCT signal attenuation:
1.19 ± 0.02 mm−1
(porcine, scanned along the blood flow), 1.36 ± 0.03 mm−1
(porcine,
scanned across the blood flow) and 0.81 ± 0.07 mm−1
(rabbit, scanned across the blood flow).
The intima layers were too thin to obtain numerical fits with small errors.
#129419 - $15.00 USD Received 1 Jun 2010; revised 9 Jul 2010; accepted 20 Jul 2010; published 26 Jul 2010(C) 2010 OSA 2 August 2010 / Vol. 1, No. 1 / BIOMEDICAL OPTICS EXPRESS 272

5. Fractal analysis: the box-counting method
Another important feature that could be used to differentiate among various ROI’s that appear
in an OCT image is the texture of the signal as it was recorded within the image. Texture
refers to the physical appearance of a region and the signal texture in an OCT image should
contain information about sample morphology embedded within its speckle. Fractal analysis
is the method of choice for characterizing textures and one of its variants, the box-counting
technique, was used in this study to calculate fractal values corresponding to each A-scan
portion that is part of an ROI. Detailed description of the theoretical background and the
mathematical algorithms for box-counting fractal analysis are provided elsewhere [13,14].
The fractal analysis started by identifying an ROI within an OCT image. Subsequently, the
box-counting algorithm was used for calculating a fractal dimension corresponding to each A-
scan portion contained within that ROI. As an example, we consider a portion of the A-scan
shown in Fig. 2. This A-scan portion is detailed in Fig. 4 where it horizontally spans over 64
pixels corresponding to an optical depth of 275 µm. The location of this portion within the
initial A-scan is marked with arrows in Fig. 2. The first step in calculating the fractal
dimension of this A-scan portion was to “cover” it with a uniform set of square boxes, each of
side length li. Figure 4 shows the case when the A-scan portion of interest was covered with
20 square boxes, each square being 16 pixels wide (~69 µm’s along the x-axis). The second
step of the algorithm counts the number of non-empty boxes Ni, i.e. the boxes containing
signal from the selected A-scan profile. The number of non-empty boxes is ten in the example
provided in Fig. 4.
0 16 32 48 64
0
16
32
48
64
80
A-s
ca
n (
a.u
.)
Measurement points
Fig. 4. The portion from the A-scan shown in Fig. 2 which is contained within the arrows. The
number of measurement points (pixels) is limited to 64 corresponding to a depth of about 275
µm. The box size shown in this example is 20 and a number of ten boxes containing signal
(non-empty) can be counted. This partition corresponds to one point in Fig. 5 describing the
fractal dimension calculation.
These two steps were repeated for different box sizes while the box sides were decreased
each time by a factor of two. The algorithm started with the first box covering the entire
portion of the A-scan (64 pixels in this example) and continued until the profile was covered
with two-pixel wide boxes. Two pixels corresponded to a length of ~8.6 µm, which is very
close to the coherence length of the OCT system. Finally, the box-counting dimension was
calculated as the slope of the line obtained by fitting the number of non-empty boxes Ni
#129419 - $15.00 USD Received 1 Jun 2010; revised 9 Jul 2010; accepted 20 Jul 2010; published 26 Jul 2010(C) 2010 OSA 2 August 2010 / Vol. 1, No. 1 / BIOMEDICAL OPTICS EXPRESS 273

against box side length li on a log–log scale as shown in Fig. 5. The fractal dimension of any
A-scan profile can be any fractional number between 1, which is the fractal dimension of a
straight line, and 2, value which constitutes the fractal dimension of a flat plane.
-1.5 -1.0 -0.5
0.0
0.5
1.0
1.5
2.0
Lo
g(N
r b
ox)
Log(1/box size)
Fig. 5. The slope of the linear fit in log-log scale of number of boxes versus box size is the
fractal dimension. The slope was calculated over six points corresponding to six box sizes from
2 to 64 pixels. The minimum box sizes was 8.6 µm, which corresponded to the axial (spatial)
resolution of the OCT image while the maximum box size was defined by the optical width of
the chosen ROI, 275 µm.
Two examples of full ROIs are indicated in Fig. 6 by the rectangular contours. Both ROIs
were selected to cover a depth of 64 pixels (275 µm in the axial direction) and were extended
to include the whole image width, 900 A-scans in this case.
Fig. 6. An OCT image of a portion of WHHM-LI rabbit artery. The image size is 2 (depth) mm
x 3 mm (width) or 300 x 900 pixels. The rectangular contours indicate examples of two ROIs
extending across the whole width of the image, 900 pixels. Each ROI has a depth of 64 pixels
(275 µm).
The box-counting algorithm described above provides a corresponding fractal value for
each A-scan portion contained within a selected ROI. By using ROIs similar to the ones
selected in Fig. 6, 900 fractal dimensions were obtained for each ROI. In Fig. 7a there is a
histogram plot of all the fractal values from region A with a corresponding Gaussian
numerical fit. The bin size used to calculate the distribution of fractal dimension for an entire
ROI was defined by the maximum standard deviation obtained from all the linear fittings of
log-log graphs corresponding to all A-scan portions contained within that ROI. The peak of
the Gaussian fit indicated an average fractal value for that particular ROI while the width of
#129419 - $15.00 USD Received 1 Jun 2010; revised 9 Jul 2010; accepted 20 Jul 2010; published 26 Jul 2010(C) 2010 OSA 2 August 2010 / Vol. 1, No. 1 / BIOMEDICAL OPTICS EXPRESS 274

the Gaussian fit could be used as a measure for the homogeneity of the tissue portion covered
by the ROI (region A in this case).
Figure 7b was obtained in a similar way for region B, also shown in Fig. 6. Region B has
the same size as region A but is displaced 64 pixels deeper into the sample. Can be noted that
the average fractal value (the Gaussian peak) changed from one ROI to the other and, more
importantly, the Gaussian width decreased in Fig. 7b. This was the result of having different
OCT signal textures within the two selected ROI’s. The first ROI contains a significant
portion of empty space, i.e. portion above the sample surface, while the second ROI contains
mostly signal generated from inside the sample. This example clarifies the potential of using
the width of the Gaussian fit as a classification tool for the tissue portions covered by various
ROI’s..
Fig. 7. (a) The histogram of the fractal dimensions calculated for the region contained within
the rectangle from Fig. 6 (region A). The histogram is fitted with a Gaussian profile. (b)
Histogram of the fractal dimension calculated for the ROI obtained after a 64-pixel
displacement as indicated in Fig. 6 (region B). This histogram is fitted with a Gaussian profile
narrower than the one from Fig. 7a indicating that within this ROI are less OCT signal texture
types.
#129419 - $15.00 USD Received 1 Jun 2010; revised 9 Jul 2010; accepted 20 Jul 2010; published 26 Jul 2010(C) 2010 OSA 2 August 2010 / Vol. 1, No. 1 / BIOMEDICAL OPTICS EXPRESS 275

For all investigated samples, Gaussian numerical fits were applied to the corresponding
histograms with correlation factors R2 0.93 or higher. For the rabbit arteries, the average
Gaussian profile peaks occurred at 1.441 (adventitia) and at 1.472 (media). Meanwhile the
corresponding widths of the Gaussian curves were 0.149 (adventitia) and 0.081 (media),
values that demonstrated narrow distributions around the central peaks (average fractal
values) for samples belonging to the same type of tissue, i.e. to either adventitia or media
layer. Sometimes secondary peaks, three to six times smaller than the amplitude of the main
peak, appeared in the histograms when a selected ROI was partially covering a location with a
different signal texture. The same procedure was used to calculate the fractal dimensions in
the OCT images from the porcine left descending coronaries. The values obtained for the
average fractal dimensions were 1.194 (the first sub-layer of the media), 1.267 (the second
sub-layer) and 1.277 (adventitia). The corresponding widths of the Gaussian distributions
where as follows: 0.085 (the first sub-layer), 0.067 (the second sub-layer) and 0.054
(adventitia).
Kotowski investigated the fractal dimension of metallic fractured surfaces and
demonstrated that the fractal roughness (or dimension) shifts as the length of the surface
profile increase [15]. By plotting the fractal dimension versus length of the surface profile, he
found a plateau called the characteristic fractal value. In the case of OCT images, the length
corresponding to the surface profile is the depth of the A-scan quantity. Since the penetration
depths of OCT scans are limited, a similar analysis with the one proposed by Kotowski is not
applicable. This indicates that the characteristic fractal dimension regime may not be reached
when applying the box-counting method on OCT images. However, in the OCT case, by
applying the algorithm to A-scans which have the same depths makes the comparison of the
fractal dimensions obtained for different regions relevant even when the characteristic fractal
values are not reached.
6. Conclusion
Biological and morphological variations in arterial tissues generate changes in the optical
properties of tissue, such as in light scattering, absorption and refractive index, which in turn
affect the OCT signal. Detection of this altered signal in state-of-the-art OCT systems leads to
high-quality OCT images, which capture many of the structural characteristics of the sample.
Despite the fidelity of images, OCT analysis has to progress beyond the subjective visual
inspection of high-quality images toward more quantitative methods. Two methods were
proposed in this report: one based on determining the attenuation coefficient of the OCT
signal as it propagated within the probed sample and the other based on calculation of average
fractal dimensions using a box-counting algorithm applied to specific ROIs in OCT images.
Two types of arterial tissue samples were used in this investigation: healthy porcine left
descending coronary arteries and pieces of descending aortas harvested from atherosclerosis–
prone Watanabe heritable hyper-lipidemic (WHHL-MI) rabbits. The method based on using
the attenuation coefficient was not only able to distinguish the gross anatomical features of the
arterial wall but was also able to point toward more subtle anatomical features not apparent on
the original OCT images. For example, the two sub-layers of the tunica media where the
smooth elastin fibers have different orientations could be distinguished based on different
OCT signal attenuations. In addition, we have shown that the second method, box-counting,
could provide two parameters suitable to be used fro sample characterization: the average
fractal value and the width of the Gaussian fit. These parameters could be used for further
improvement in soft-tissue differentiation. Different fractal dimensions were obtained for
different layers and sub-layers of the investigated samples. Although more studies are needed,
there is a strong indication that fractal analysis could be used to further refine the
classification of various regions within OCT images acquired from anatomically complex
biological samples. In addition, a procedure which makes use of both methods could be
envisioned. The box counting method could be used in a preliminary step to identify areas
#129419 - $15.00 USD Received 1 Jun 2010; revised 9 Jul 2010; accepted 20 Jul 2010; published 26 Jul 2010(C) 2010 OSA 2 August 2010 / Vol. 1, No. 1 / BIOMEDICAL OPTICS EXPRESS 276

with similar signal textures within OCT images. In a follow-up step, the attenuation
coefficient for the OCT signal within such a fractal-identified region of interest could be
extracted.
#129419 - $15.00 USD Received 1 Jun 2010; revised 9 Jul 2010; accepted 20 Jul 2010; published 26 Jul 2010(C) 2010 OSA 2 August 2010 / Vol. 1, No. 1 / BIOMEDICAL OPTICS EXPRESS 277
Related Documents


![[Coherence] coherence 모니터링 v 1.0](https://static.cupdf.com/doc/110x72/54c1fc894a79599f448b456b/coherence-coherence-v-10.jpg)