SIGMOD Officers, Committees, and Awardees Chair Vice-Chair Secretary/Treasurer Yannis Ioannidis Christian S. Jensen Alexandros Labrinidis University of Athens Department of Computer Science Department of Computer Science Department of Informatics Aarhus University University of Pittsburgh Panepistimioupolis, Informatics Bldg Åbogade 34 Pittsburgh, PA 15260-9161 157 84 Ilissia, Athens DK-8200 Århus N PA 15260-9161 HELLAS DENMARK USA +30 210 727 5224 +45 99 40 89 00 +1 412 624 8843 <yannis AT di.uoa.gr> <csj AT cs.aau.dk > <labrinid AT cs.pitt.edu> SIGMOD Executive Committee: Sihem Amer-Yahia, Curtis Dyreson, Christian S. Jensen, Yannis Ioannidis, Alexandros Labrinidis, Maurizio Lenzerini, Ioana Manolescu, Lisa Singh, Raghu Ramakrishnan, and Jeffrey Xu Yu. Advisory Board: Raghu Ramakrishnan (Chair), Yahoo! Research, <First8CharsOfLastName AT yahoo-inc.com>, Amr El Abbadi, Serge Abiteboul, Rakesh Agrawal, Anastasia Ailamaki, Ricardo Baeza-Yates, Phil Bernstein, Elisa Bertino, Mike Carey, Surajit Chaudhuri, Christos Faloutsos, Alon Halevy, Joe Hellerstein, Masaru Kitsuregawa, Donald Kossmann, Renée Miller, C. Mohan, Beng-Chin Ooi, Meral Ozsoyoglu, Sunita Sarawagi, Min Wang, and Gerhard Weikum. SIGMOD Information Director: Curtis Dyreson, Utah State University, < curtis.dyreson AT usu.edu> Associate Information Directors: Manfred Jeusfeld, Georgia Koutrika, Michael Ley, Wim Martens, Mirella Moro, Rachel Pottinger, Altigran Soares da Silva, and Jun Yang. SIGMOD Record Editor-in-Chief: Ioana Manolescu, Inria Saclay—Île-de-France, <ioana.manolescu AT inria.fr> SIGMOD Record Associate Editors: Yanif Ahmad, Denilson Barbosa, Pablo Barceló, Vanessa Braganholo, Marco Brambilla, Chee Yong Chan, Anish Das Sarma, Glenn Paulley, Alkis Simitsis, Nesime Tatbul and Marianne Winslett. SIGMOD Conference Coordinator: K. Selçuk Candan, Arizona State University <candan AT asu.edu> PODS Executive Committee: Rick Hull (chair), <hull AT research.ibm.com>, Michael Benedikt, Wenfei Fan, Maurizio Lenzerini, Jan Paradaens and Thomas Schwentick. Sister Society Liaisons: Raghu Ramakhrishnan (SIGKDD), Yannis Ioannidis (EDBT Endowment). Awards Committee: Rakesh Agrawal, Elisa Bertino, Umesh Dayal, Masaru Kitsuregawa (chair, University of Tokyo, <kitsure AT tk1.iis.u-tokyo.ac.jp>) and Maurizio Lenzerini. Jim Gray Doctoral Dissertation Award Committee: Johannes Gehrke (Co-chair), Cornell Univ.; Beng Chin Ooi (Co-chair), National Univ. of Singapore, Alfons Kemper, Hank Korth, Alberto Laender, Boon Thau Loo, Timos Sellis, and Kyu-Young Whang. [Last updated : March 21st, 2013] SIGMOD Record, June 2013 (Vol. 42, No. 2) 1

Welcome message from author
This document is posted to help you gain knowledge. Please leave a comment to let me know what you think about it! Share it to your friends and learn new things together.
Transcript

SIGMOD Officers, Committees, and Awardees Chair Vice-Chair Secretary/Treasurer Yannis Ioannidis Christian S. Jensen Alexandros Labrinidis University of Athens Department of Computer Science Department of Computer Science Department of Informatics Aarhus University University of Pittsburgh Panepistimioupolis, Informatics Bldg Åbogade 34 Pittsburgh, PA 15260-9161 157 84 Ilissia, Athens DK-8200 Århus N PA 15260-9161 HELLAS DENMARK USA +30 210 727 5224 +45 99 40 89 00 +1 412 624 8843 <yannis AT di.uoa.gr> <csj AT cs.aau.dk > <labrinid AT cs.pitt.edu> SIGMOD Executive Committee:
Sihem Amer-Yahia, Curtis Dyreson, Christian S. Jensen, Yannis Ioannidis, Alexandros Labrinidis, Maurizio Lenzerini, Ioana Manolescu, Lisa Singh, Raghu Ramakrishnan, and Jeffrey Xu Yu.
Advisory Board: Raghu Ramakrishnan (Chair), Yahoo! Research, <First8CharsOfLastName AT yahoo-inc.com>, Amr El Abbadi, Serge Abiteboul, Rakesh Agrawal, Anastasia Ailamaki, Ricardo Baeza-Yates, Phil Bernstein, Elisa Bertino, Mike Carey, Surajit Chaudhuri, Christos Faloutsos, Alon Halevy, Joe Hellerstein, Masaru Kitsuregawa, Donald Kossmann, Renée Miller, C. Mohan, Beng-Chin Ooi, Meral Ozsoyoglu, Sunita Sarawagi, Min Wang, and Gerhard Weikum. SIGMOD Information Director: Curtis Dyreson, Utah State University, < curtis.dyreson AT usu.edu> Associate Information Directors: Manfred Jeusfeld, Georgia Koutrika, Michael Ley, Wim Martens, Mirella Moro, Rachel Pottinger, Altigran Soares da Silva, and Jun Yang. SIGMOD Record Editor-in-Chief: Ioana Manolescu, Inria Saclay—Île-de-France, <ioana.manolescu AT inria.fr> SIGMOD Record Associate Editors: Yanif Ahmad, Denilson Barbosa, Pablo Barceló, Vanessa Braganholo, Marco Brambilla, Chee Yong Chan, Anish Das Sarma, Glenn Paulley, Alkis Simitsis, Nesime Tatbul and Marianne Winslett. SIGMOD Conference Coordinator:
K. Selçuk Candan, Arizona State University <candan AT asu.edu>
PODS Executive Committee: Rick Hull (chair), <hull AT research.ibm.com>, Michael Benedikt, Wenfei Fan, Maurizio Lenzerini, Jan Paradaens and Thomas Schwentick. Sister Society Liaisons: Raghu Ramakhrishnan (SIGKDD), Yannis Ioannidis (EDBT Endowment). Awards Committee:
Rakesh Agrawal, Elisa Bertino, Umesh Dayal, Masaru Kitsuregawa (chair, University of Tokyo, <kitsure AT tk1.iis.u-tokyo.ac.jp>) and Maurizio Lenzerini.
Jim Gray Doctoral Dissertation Award Committee: Johannes Gehrke (Co-chair), Cornell Univ.; Beng Chin Ooi (Co-chair), National Univ. of Singapore, Alfons Kemper, Hank Korth, Alberto Laender, Boon Thau Loo, Timos Sellis, and Kyu-Young Whang.
[Last updated : March 21st, 2013]
SIGMOD Record, June 2013 (Vol. 42, No. 2) 1

SIGMOD Officers, Committees, and Awardees (continued) SIGMOD Edgar F. Codd Innovations Award For innovative and highly significant contributions of enduring value to the development, understanding, or use of database systems and databases. Until 2003, this award was known as the "SIGMOD Innovations Award." In 2004, SIGMOD, with the unanimous approval of ACM Council, decided to rename the award to honor Dr. E. F. (Ted) Codd (1923 - 2003) who invented the relational data model and was responsible for the significant development of the database field as a scientific discipline. Recipients of the award are the following: Michael Stonebraker (1992) Jim Gray (1993) Philip Bernstein (1994) David DeWitt (1995) C. Mohan (1996) David Maier (1997) Serge Abiteboul (1998) Hector Garcia-Molina (1999) Rakesh Agrawal (2000) Rudolf Bayer (2001) Patricia Selinger (2002) Don Chamberlin (2003) Ronald Fagin (2004) Michael Carey (2005) Jeffrey D. Ullman (2006) Jennifer Widom (2007) Moshe Y. Vardi (2008) Masaru Kitsuregawa (2009) Umeshwar Dayal (2010) Surajit Chaudhuri (2011) Bruce Lindsay (2012) SIGMOD Contributions Award For significant contributions to the field of database systems through research funding, education, and professional services. Recipients of the award are the following: Maria Zemankova (1992) Gio Wiederhold (1995) Yahiko Kambayashi (1995) Jeffrey Ullman (1996) Avi Silberschatz (1997) Won Kim (1998) Raghu Ramakrishnan (1999) Michael Carey (2000) Laura Haas (2000) Daniel Rosenkrantz (2001) Richard Snodgrass (2002) Michael Ley (2003) Surajit Chaudhuri (2004) Hongjun Lu (2005) Tamer Özsu (2006) Hans-Jörg Schek (2007) Klaus R. Dittrich (2008) Beng Chin Ooi (2009) David Lomet (2010) Gerhard Weikum (2011) Marianne Winslett (2012) SIGMOD Jim Gray Doctoral Dissertation Award SIGMOD has established the annual SIGMOD Jim Gray Doctoral Dissertation Award to recognize excellent research by doctoral candidates in the database field. Recipients of the award are the following: • 2006 Winner: Gerome Miklau, University of Washington. Runners-up: Marcelo Arenas, University of Toronto; Yanlei Diao, University of California at Berkeley. • 2007 Winner: Boon Thau Loo, University of California at Berkeley. Honorable Mentions: Xifeng Yan, University of Indiana at Urbana Champaign; Martin Theobald, Saarland University • 2008 Winner: Ariel Fuxman, University of Toronto. Honorable Mentions: Cong Yu, University of Michigan; Nilesh Dalvi, University of Washington. • 2009 Winner: Daniel Abadi, MIT. Honorable Mentions: Bee-Chung Chen, University of Wisconsin at Madison; Ashwin Machanavajjhala, Cornell University. • 2010 Winner: Christopher Ré, University of Washington. Honorable Mentions: Soumyadeb Mitra, University of Illinois, Urbana-Champaign; Fabian Suchanek, Max-Planck Institute for Informatics. • 2011 Winner: Stratos Idreos, Centrum Wiskunde & Informatica. Honorable Mentions: Todd Green, University of Pennsylvania; Karl Schnaitter, University of California in Santa Cruz. • 2012 Winner: Ryan Johnson, Carnegie Mellon University. Honorable Mention: Bogdan Alexe, University of California in Santa Cruz. A complete listing of all SIGMOD Awards is available at: http://www.sigmod.org/awards/
[Last updated : December 18th, 2012]
2 SIGMOD Record, June 2013 (Vol. 42, No. 2)
Editor’s Notes
Welcome to the June 2013 issue of the ACM SIGMOD Record! The issue opens with a vision paper by Bartoš, Skopal and Moško on efficient indexing techniques supporting similarity search. Efficient techniques for similarity search are required in many contexts such as bioinformatics, social networks and multimedia databases. Importantly, while the most commonly known distance functions based on which similarity is assessed are related to some metric space and obey some corresponding constraints (think of the triangle inequality for distances in an Euclidian space), there are important non-metric (or unconstrained) distance functions. The authors focus on the resulting unconstrained similarity search problem, which is the target of their SIMDEX framework. SIMDEX allows a dataset-driven exploration of alternative indexing strategies in order to support efficient and scalable similarity search. The authors present experiments validating their framework, and discuss directions for future development. The article by Montolio, Dominguez-Sal and Larriba-Pey investigates the connection between two hotly discussed metrics characterizing scientific conferences : conference quality, respectively, endogamy, defined as repeated collaborations (co-signing) of recurring sets of co-authors. The authors introduce a simple metric for endogamy and evaluate it for a set of conference and journals, including well-known database ones such as SIGMOD, VLDB, ICDE and ICDT. The finding of this study is that low endogamy (thus, time-varying co-authorship networks) correlates with conferences and journals reputed of high quality; in a time when data management research takes strong interest in social networks, this article is an interesting opposing perspective of social graph analysis applied to database publications themselves ! The survey by Guille, Hacid, Favre and Zighed keeps us in the area of social networks, more specifically focusing on information diffusion patterns. The core questions considered are: which information items are popular and diffused the most, how, why and through which paths, and which are the important influencers in the network. The authors introduce a set of basis notion related to information diffusion and then classify existing algorithms and methods for answering these questions. This clear, well-illustrated survey is very timely, given both the database community interest in social network analysis, and the spread of research in this area across several communities, including data mining, text analysis, and algorithms on graphs. In the Systems and Prototypes column, Nakashole, Weikum and Suchanek present PATTY, a system for extracting semantic relationships out of text snippets found on the Web. The article discusses the successive extraction stages (text pattern extraction, syntactic-ontological pattern transformation, pattern generalization and subsumption and synonym mining) implemented within PATTY, describes the modules which are part of the tool, and ends by providing precision/recall results and applications. The Distinguished Profiles column features an interview with Jeffrey Vitter, now the provost and executive vice chancellor at the University of Kansas. He talks about his PhD student days in Stanford, the lessons learned from Jeff Ullman, the importance of understanding both theory and systems in order to get good results at either of them, applying wavelets to database problems, the interest of having an MBA on top of a PhD in Computer Science, the interest of listening to problems from other disciplines, whether chemistry, physics, and music, to understand where actual open data management problems lie and investigate them. In the Research centers column, Bressan, Chan, Hsu, Lee, Ling, Ooi, Tan and Tung give an overview of data management reseach at the National University of Singapore (NUS). The work areas surveyed in the paper include cloud-based data management, data management technologies applied to digital megacities,
SIGMOD Record, June 2013 (Vol. 42, No. 2) 3
for instance in the area of environment monitoring and real-time location-aware social search, data analytics, mining and visualization. The Open forum column features a quite unique column where Graham Cormode spells out the duties, chores, and pleasures of an Associate Editor. Having served for a few years as an Associate Editor myself, and having coopted many of today’s SIGMOD Record Associate Editors, I am in a position to appreciate the clear, thoughtful, and thoroughly entertaining explanations! I am sure they will clarify things for many current and future scientific journal editors and reviewers, and demystify the ways refereed journals are produced to the benefit of editors, reviewers, and authors alike. The issue closes with two reports. First, Benedikt and Olteanu report on the first Workshop on Innovative Querying of Streams, held in Oxford in September 2012. The workshop was organized in connection to a research project on XML streams. The topics explored include social streams, semantic Web data streaming, stream uncertainty, monitoring and distribution. Last but not least, the second report from Atzeni, Jensen, Orsi, Ram, Tanca and Torlone summarizes the discussions of a panel held in the Non-Conventional Data Access (NoCoDa) workshop 2012, on the topic of NoSQL models, querying, and overall place in the history and perspectives of data management. Read this very lively rendition of the panel’s talks to form your own opinion whether conceptual database design and physical data independence really are too old for our scientific “country”? Your contributions to the Record are welcome via the RECESS submission site (http://db.cs.pitt.edu/recess). Prior to submitting, be sure to peruse the Editorial Policy on the SIGMOD Record’s Web site (http://www.sigmod.org/publications/sigmod-record/sigmod-record-editorial-policy).
Ioana Manolescu
June 2013
Past SIGMOD Record Editors:
Harrison R. Morse (1969) Daniel O’Connell (1971 – 1973) Randall Rustin (1974-1975) Douglas S. Kerr (1976-1978) Thomas J. Cook (1981 – 1983) Jon D. Clark (1984 – 1985) Margaret H. Dunham (1986 – 1988) Arie Segev (1989 – 1995) Jennifer Widom (1995 – 1996) Michael Franklin (1996 – 2000)
Ling Liu (2000 – 2004) Mario Nascimento (2005 – 2007) Alexandros Labrinidis (2007 – 2009)
4 SIGMOD Record, June 2013 (Vol. 42, No. 2)
Towards Efficient Indexing of Arbitrary Similarity
[Vision paper]
Tomas Bartos Tomas Skopal Juraj MoskoCharles University in Prague, Faculty of Mathematics and Physics, SIRET Research Group
Malostranske nam. 25, 118 00 Prague, Czech Republic{bartos, skopal, mosko}@ksi.mff.cuni.cz
ABSTRACTThe popularity of similarity search expanded with theincreased interest in multimedia databases, bioinformat-ics, or social networks, and with the growing numberof users trying to find information in huge collectionsof unstructured data. During the exploration, the usershandle database objects in different ways based on theutilized similarity models, ranging from simple to com-plex models. Efficient indexing techniques for similaritysearch are required especially for growing databases.
In this paper, we study implementation possibilities ofthe recently announced theoretical framework SIMDEX,the task of which is to algorithmically explore a givensimilarity space and find possibilities for efficient index-ing. Instead of a fixed set of indexing properties, suchas metric space axioms, SIMDEX aims to seek for alter-native properties that are valid in a particular similaritymodel (database) and, at the same time, provide efficientindexing. In particular, we propose to implement thefundamental parts of SIMDEX by means of the geneticprogramming (GP) which we expect will provide high-quality resulting set of expressions (axioms) useful forindexing.
1. INTRODUCTIONThe content-based retrieval is widely used in vari-
ous areas of computer science including multimediadatabases, data mining, time series, genomic data,social networks, medical or scientific databases, bio-metric systems, etc. In fact, searching collections ofa priori unstructured data entities requires a kindof aggregation that ranks the data as more or lessrelevant to a query. A popular type of such a mech-anism is the similarity search where, given a samplequery object (e.g., an image), the database searchesfor the most similar objects (images). Two unstruc-tured objects represented by their descriptors arecompared by a similarity function, which producesa single numerical score interpreted as the degree ofsimilarity between the two original objects.
For a long time, the database-oriented research
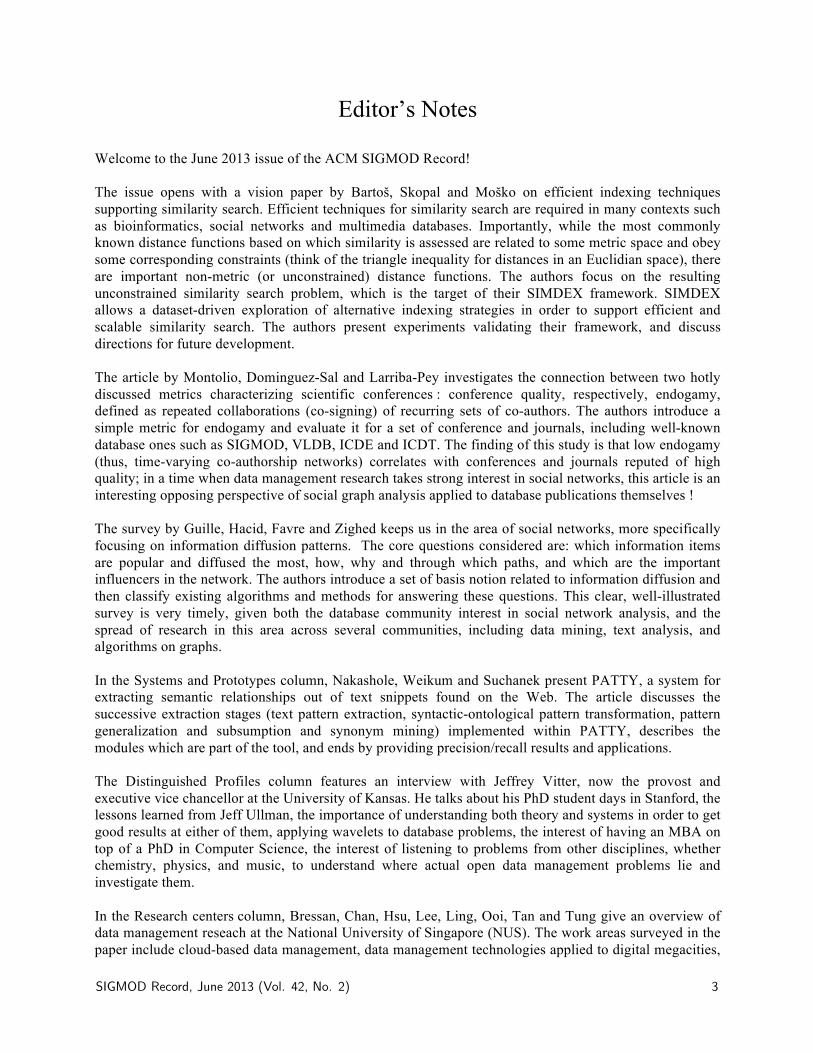
(a) Image similarity (b) Protein similarity
Figure 1: Sample similarity models
of similarity search employed the definition of sim-ilarity restricted to the metric space model withfixed properties of identity, positivity, symmetry,and especially triangle inequality, using metric ac-cess methods for indexing [2, 20, 14].
Together with the increasing complexity of datatypes across various domains, recently there ap-peared many similarities that were not metric –we call them nonmetric or unconstrained similarityfunctions [17]. As the nonmetric similarity func-tions are not constrained by any properties thatneed to be satisfied (unlike the metric ones), theyallow to better model the desired concept of sim-ilarity and therefore lead to more precise retrieval(see Fig. 1a for a robust matching using local imagefeatures).
Also nonmetric similarities allow to design modelsthat cannot be formalized into a closed-form equa-tion. They could be defined as heuristic algorithmssuch as an alignment or a transformational proce-dure, while the enforcement of metric axioms couldbe very difficult or even impossible. As an exam-ple (see Fig. 1b), consider alignment algorithms formeasuring functional similarity of protein sequences[18] or structures [8].
However, usually just the database experts areconcerned with the existence of specific propertiesin a similarity function, as the properties enable theways how to index the database for efficient similar-ity search. But database experts usually do not in-vestigate the applicability of their techniques to spe-cific domains. On the other hand, there are much
SIGMOD Record, June 2013 (Vol. 42, No. 2) 5
larger domain expert communities of different kinds– people who use specialized similarity search appli-cations and are ready to apply any method in orderto get expected results. These experts typically donot care about the indexing techniques or perfor-mance issues to a certain extent, so enforcement ofany indexing-specific properties in their similarityfunctions is out of their expertise. For them, thebest approach is to use the simplest (possibly ineffi-cient) database methods as they are easy to imple-ment. However, in long term and with large-scaledatabases, the efficiency will become a critical fac-tor for choosing suitable similarity search methods.
Based on the different interests of database anddomain research communities, the main goal of ourresearch is to find a complex solution that providesthe various domain experts with a database tech-nique that allows effective similarity search yet thatdoes not require any database-specific interventionto the generally unconstrained similarity models. Inthe following text, we shortly summarize previousattempts to unconstrained (nonmetric) similaritysearch before we sketch the idea of how to applygenetic programming for this purpose.
2. MOTIVATIONIt is not always easy for domain experts to invent
a perfect similarity measure, mostly represented asa distance (dissimilarity) function δ, and use it ef-ficiently for large-scale databases with no compro-mise. The general way how to efficiently search isto use the lowerbounding principle – instead of com-puting expensive distances between a query objectand all database objects a cheaper lowerboundingfunction LB is applied to filter the irrelevant ones.
The first lowerbounding approach might be tomeet requirements of the metric space model bymodifying the similarity model. Then a lowerboundfunction LB∆ utilizing the triangle inequality is used
δ(q, o) ≥ LB4(δ(q, o)) = |δ(q, p)− δ(p, o)| (1)
for query q, pivot (reference) object p, and databaseobject o. However, such a transformation mightspoil the benefits of the original model.
So, the next option is to use an indirect varia-tion of the model leveraging the known mapping ap-proaches such as TriGen [15] which ”converts” thenonmetric similarities into metric ones and, again,the metric model might be used. However, this isnot always the best-case scenario as it might lead toeither large retrieval error or low indexability [17].
Hence, there appeared some alternative methodsof database indexing for unstructured data, such asthe Ptolemaic Indexing [9, 11]. Here, the Ptolemy’s
inequality is used to construct lowerbounds. It statesthat for any quadrilateral, the pairwise products ofopposing sides sum to more than the product of thediagonals. So, for any four database objects x, y,u, v ∈ D, we have:
δ(x, v)·δ(y, u) ≤ δ(x, y)·δ(u, v)+δ(x, u)·δ(y, v) (2)
For Ptolemaic lowerbounding LBptol with a givenset of pivots P, the bound δC derived from (2) ismaximized over all pairs of distinct pivots [9, 11]:
δ(q, o) ≥ LBptol(δ(q, o)) = maxp,s∈ P
δC(q, o, p, s) (3)
The ptolemaic indexing was successfully used withthe signature quadratic form distance [11] that issuitable for effective matching of image signatures [1].The idea of ptolemaic indexing shows that findingnew indexing axioms could be a solution to speed-up similarity search in other way than mapping theproblem to the metric space model.
3. RELATED WORKWe acknowledge that ”lowerbounding problem”
has been studied widely from various perspectivesbut as we found out this is true mostly for specificdomains such as text or information retrieval (IR).For example, the recent paper [4] discusses axiomsor constraints useful for term-weighting functionsbut it is limited to IR, while in [12] authors tryto overcome improper lowerbounds with a new suf-ficiently large lowerbound for term frequency nor-malization (hardly applicable outside IR area).
Another work [13] reveals dynamic pruning strate-gies based on upper bounds to quickly determinethe dissimilarity between an object and a query andthus quickly filter out objects; again designed for IRdomain only.
Next, the definitions of axioms and constraints forsimilarity functions used in text retrieval systemsare studied in [7], but the author provides only thetheoretical background.
Interestingly, there exists a framework that pro-vides an axiomatic approach for developing retrievalmodels [6]. It searches the spaces of candidate re-trieval functions with the aim of finding the onethat satisfies specific constraints. Although our ap-proach might look the same, there are significantdifferences from our work. Particularly because au-thors are strongly connected to IR as they assume”bag-of-terms” representation of objects and theycreate retrieval functions inductively with respectto specific retrieval criteria. Most importantly, theyfocus on modeling the relevance rather than devel-oping efficient database indexing techniques.
6 SIGMOD Record, June 2013 (Vol. 42, No. 2)
Grammar definition
Expressiongeneration
Expression testing
Expression reduction
Parallelization
black-boxsimilarity
model
analyticindexingmodel
axiom exploration
Indexingstructures
DB sample
black-boxsimilarity function
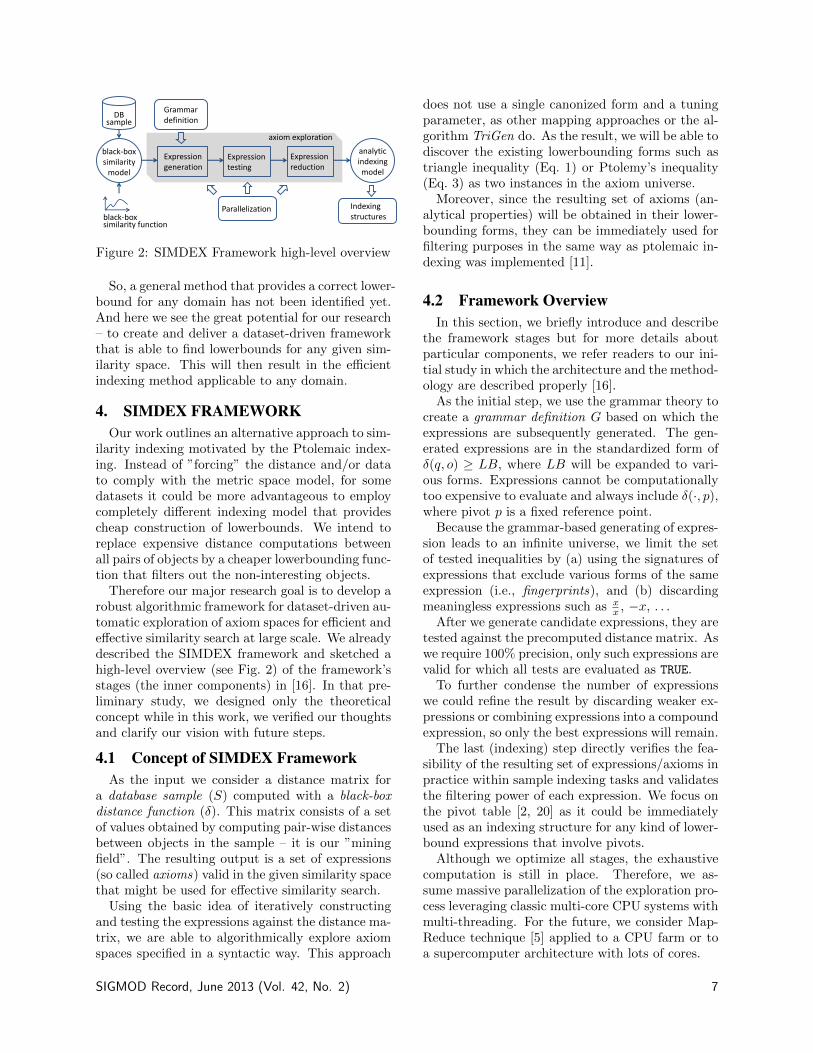
Figure 2: SIMDEX Framework high-level overview
So, a general method that provides a correct lower-bound for any domain has not been identified yet.And here we see the great potential for our research– to create and deliver a dataset-driven frameworkthat is able to find lowerbounds for any given sim-ilarity space. This will then result in the efficientindexing method applicable to any domain.
4. SIMDEX FRAMEWORKOur work outlines an alternative approach to sim-
ilarity indexing motivated by the Ptolemaic index-ing. Instead of ”forcing” the distance and/or datato comply with the metric space model, for somedatasets it could be more advantageous to employcompletely different indexing model that providescheap construction of lowerbounds. We intend toreplace expensive distance computations betweenall pairs of objects by a cheaper lowerbounding func-tion that filters out the non-interesting objects.
Therefore our major research goal is to develop arobust algorithmic framework for dataset-driven au-tomatic exploration of axiom spaces for efficient andeffective similarity search at large scale. We alreadydescribed the SIMDEX framework and sketched ahigh-level overview (see Fig. 2) of the framework’sstages (the inner components) in [16]. In that pre-liminary study, we designed only the theoreticalconcept while in this work, we verified our thoughtsand clarify our vision with future steps.
4.1 Concept of SIMDEX FrameworkAs the input we consider a distance matrix for
a database sample (S) computed with a black-boxdistance function (δ). This matrix consists of a setof values obtained by computing pair-wise distancesbetween objects in the sample – it is our ”miningfield”. The resulting output is a set of expressions(so called axioms) valid in the given similarity spacethat might be used for effective similarity search.
Using the basic idea of iteratively constructingand testing the expressions against the distance ma-trix, we are able to algorithmically explore axiomspaces specified in a syntactic way. This approach
does not use a single canonized form and a tuningparameter, as other mapping approaches or the al-gorithm TriGen do. As the result, we will be able todiscover the existing lowerbounding forms such astriangle inequality (Eq. 1) or Ptolemy’s inequality(Eq. 3) as two instances in the axiom universe.
Moreover, since the resulting set of axioms (an-alytical properties) will be obtained in their lower-bounding forms, they can be immediately used forfiltering purposes in the same way as ptolemaic in-dexing was implemented [11].
4.2 Framework OverviewIn this section, we briefly introduce and describe
the framework stages but for more details aboutparticular components, we refer readers to our ini-tial study in which the architecture and the method-ology are described properly [16].
As the initial step, we use the grammar theory tocreate a grammar definition G based on which theexpressions are subsequently generated. The gen-erated expressions are in the standardized form ofδ(q, o) ≥ LB, where LB will be expanded to vari-ous forms. Expressions cannot be computationallytoo expensive to evaluate and always include δ(·, p),where pivot p is a fixed reference point.
Because the grammar-based generating of expres-sion leads to an infinite universe, we limit the setof tested inequalities by (a) using the signatures ofexpressions that exclude various forms of the sameexpression (i.e., fingerprints), and (b) discardingmeaningless expressions such as x
x , −x, . . .After we generate candidate expressions, they are
tested against the precomputed distance matrix. Aswe require 100% precision, only such expressions arevalid for which all tests are evaluated as TRUE.
To further condense the number of expressionswe could refine the result by discarding weaker ex-pressions or combining expressions into a compoundexpression, so only the best expressions will remain.
The last (indexing) step directly verifies the fea-sibility of the resulting set of expressions/axioms inpractice within sample indexing tasks and validatesthe filtering power of each expression. We focus onthe pivot table [2, 20] as it could be immediatelyused as an indexing structure for any kind of lower-bound expressions that involve pivots.
Although we optimize all stages, the exhaustivecomputation is still in place. Therefore, we as-sume massive parallelization of the exploration pro-cess leveraging classic multi-core CPU systems withmulti-threading. For the future, we consider Map-Reduce technique [5] applied to a CPU farm or toa supercomputer architecture with lots of cores.
SIGMOD Record, June 2013 (Vol. 42, No. 2) 7
1
10
100
1000
10000
100000
1000000
100000 250000 400000 550000 700000 850000Dis
tan
ce C
om
pu
tati
on
s (
log
sc
ale
)
Database Size
CoPhIR with L0.5
Triangle
Ptolemaic
Triangle^1.85
Figure 3: CoPhIR - Distance computations (log scale)
Triangle76.4%
Ptolemaic18.8%
Triangle^1.85100%
0
1
2
3
4
5
6
7
8
0% 20% 40% 60% 80% 100% 120%
Ave
rag
e Q
ue
ry T
ime
Sp
ee
dU
p
vs
. S
EQ
sc
an
Average Precision (in %)
CoPhIR with L0.5
Triangle
Ptolemaic
Triangle^1.85
Figure 4: CoPhIR - Avg speedup vs. avg precision
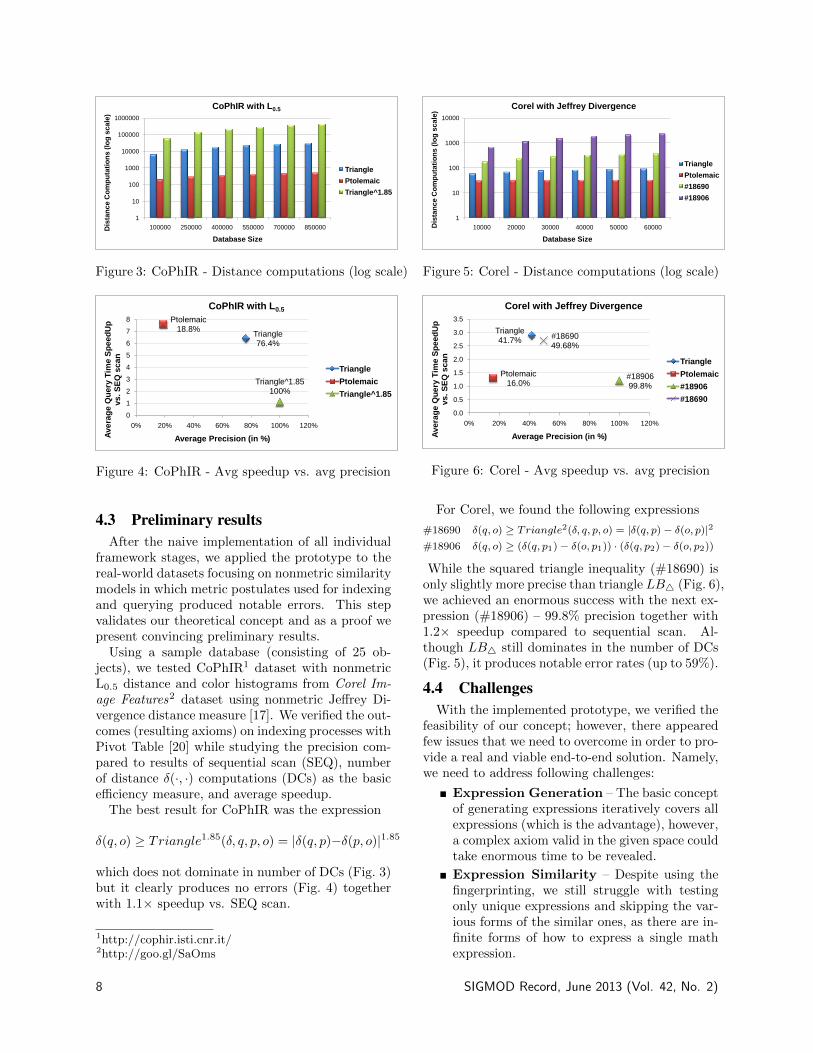
4.3 Preliminary resultsAfter the naive implementation of all individual
framework stages, we applied the prototype to thereal-world datasets focusing on nonmetric similaritymodels in which metric postulates used for indexingand querying produced notable errors. This stepvalidates our theoretical concept and as a proof wepresent convincing preliminary results.
Using a sample database (consisting of 25 ob-jects), we tested CoPhIR1 dataset with nonmetricL0.5 distance and color histograms from Corel Im-age Features2 dataset using nonmetric Jeffrey Di-vergence distance measure [17]. We verified the out-comes (resulting axioms) on indexing processes withPivot Table [20] while studying the precision com-pared to results of sequential scan (SEQ), numberof distance δ(·, ·) computations (DCs) as the basicefficiency measure, and average speedup.
The best result for CoPhIR was the expression
δ(q, o) ≥ Triangle1.85(δ, q, p, o) = |δ(q, p)−δ(p, o)|1.85
which does not dominate in number of DCs (Fig. 3)but it clearly produces no errors (Fig. 4) togetherwith 1.1× speedup vs. SEQ scan.
1http://cophir.isti.cnr.it/2http://goo.gl/SaOms
1
10
100
1000
10000
10000 20000 30000 40000 50000 60000Dis
tan
ce
Co
mp
uta
tio
ns (
log
sc
ale
)
Database Size
Corel with Jeffrey Divergence
Triangle
Ptolemaic
#18690
#18906
Figure 5: Corel - Distance computations (log scale)
Triangle41.7%
Ptolemaic16.0%
#1890699.8%
#1869049.68%
0.0
0.5
1.0
1.5
2.0
2.5
3.0
3.5
0% 20% 40% 60% 80% 100% 120%
Ave
rag
e Q
ue
ry T
ime S
pe
ed
Up
vs
. S
EQ
sc
an
Average Precision (in %)
Corel with Jeffrey Divergence
Triangle
Ptolemaic
#18906
#18690
Figure 6: Corel - Avg speedup vs. avg precision
For Corel, we found the following expressions
#18690 δ(q, o) ≥ Triangle2(δ, q, p, o) = |δ(q, p)− δ(o, p)|2#18906 δ(q, o) ≥ (δ(q, p1)− δ(o, p1)) · (δ(q, p2)− δ(o, p2))
While the squared triangle inequality (#18690) isonly slightly more precise than triangle LB4 (Fig. 6),we achieved an enormous success with the next ex-pression (#18906) – 99.8% precision together with1.2× speedup compared to sequential scan. Al-though LB4 still dominates in the number of DCs(Fig. 5), it produces notable error rates (up to 59%).
4.4 ChallengesWith the implemented prototype, we verified the
feasibility of our concept; however, there appearedfew issues that we need to overcome in order to pro-vide a real and viable end-to-end solution. Namely,we need to address following challenges:
� Expression Generation – The basic conceptof generating expressions iteratively covers allexpressions (which is the advantage), however,a complex axiom valid in the given space couldtake enormous time to be revealed.
� Expression Similarity – Despite using thefingerprinting, we still struggle with testingonly unique expressions and skipping the var-ious forms of the similar ones, as there are in-finite forms of how to express a single mathexpression.
8 SIGMOD Record, June 2013 (Vol. 42, No. 2)
� Expression Testing – We have to compro-mise between a large number of expressions tobe tested and a bigger sample size. Testingthe whole sample does not have to be alwaysappropriate and we might take only some in-teresting objects from the sample.
� Verifying indexing model – To validate thatresulting axioms could be used for indexingpurposes, we run a separate indexing processon the data outside the sample which is correctbut time-consuming.
5. GENETIC PROGRAMMING VISIONIn order to improve and extend the framework
capabilities and to overcome mentioned challenges(see Section 4.4), we propose using genetic program-ming (GP) as the main driver of generating andtesting expressions. The concept of GP is not newand has been studied for several years since one ofthe first inspiring books was published [10]. In gen-eral, GP applies evolutionary patterns to a partic-ular problem to achieve a specific goal using opera-tions such as selection, crossover, or mutation [3].
We expect that GP-based approach will give thereal power to the purely theoretical SIMDEX Frame-work (i.e., it will ”materialize the theory”), willboost the efficiency of axiom discovery and speedupthe axiom exploration process. Applying the prin-ciples of natural expression evolution will then leadto faster axiom resolution. Maybe we will not findall axioms valid in the given space but this is notour primary goal. In the first phase, we concentrateon detecting at least some axioms that will increasethe efficiency of the indexing/filtering process.
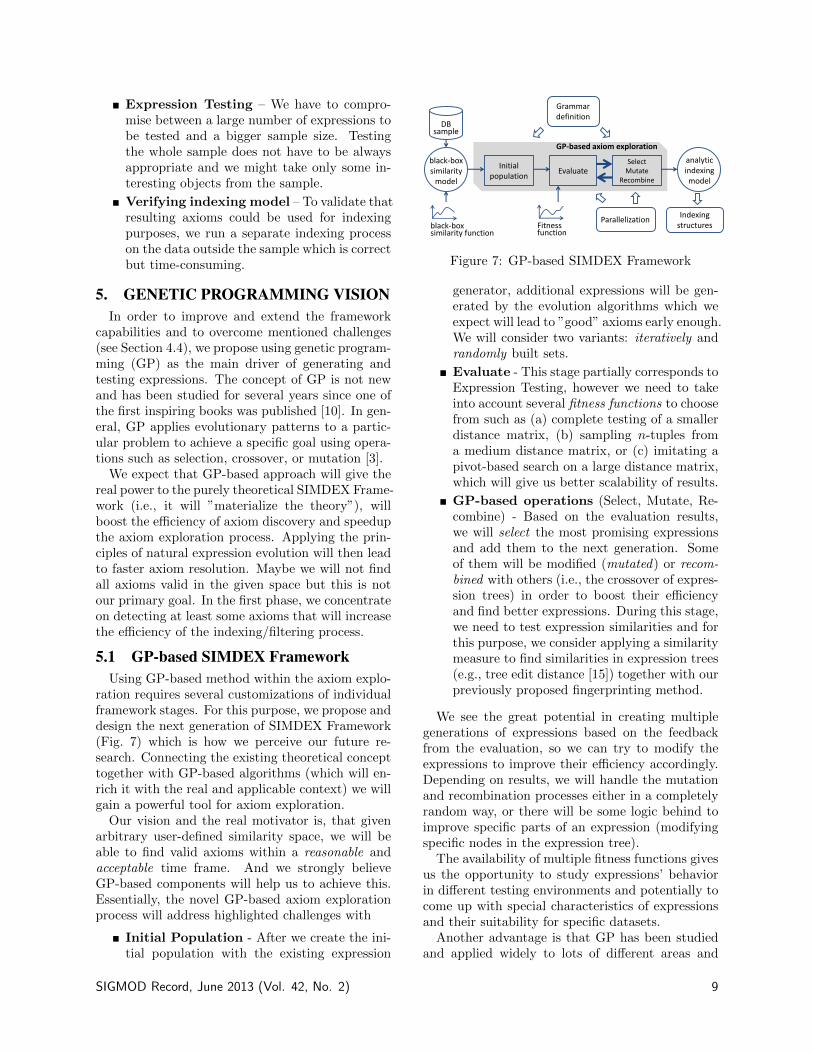
5.1 GP-based SIMDEX FrameworkUsing GP-based method within the axiom explo-
ration requires several customizations of individualframework stages. For this purpose, we propose anddesign the next generation of SIMDEX Framework(Fig. 7) which is how we perceive our future re-search. Connecting the existing theoretical concepttogether with GP-based algorithms (which will en-rich it with the real and applicable context) we willgain a powerful tool for axiom exploration.
Our vision and the real motivator is, that givenarbitrary user-defined similarity space, we will beable to find valid axioms within a reasonable andacceptable time frame. And we strongly believeGP-based components will help us to achieve this.Essentially, the novel GP-based axiom explorationprocess will address highlighted challenges with
� Initial Population - After we create the ini-tial population with the existing expression
Initialpopulation
EvaluateSelect
Mutate Recombine
Grammar definition
black-boxsimilarity
model
analyticindexingmodel
Parallelization
GP-based axiom exploration
Indexingstructures
DB sample
black-boxsimilarity function
Fitnessfunction
Figure 7: GP-based SIMDEX Framework
generator, additional expressions will be gen-erated by the evolution algorithms which weexpect will lead to ”good” axioms early enough.We will consider two variants: iteratively andrandomly built sets.
� Evaluate - This stage partially corresponds toExpression Testing, however we need to takeinto account several fitness functions to choosefrom such as (a) complete testing of a smallerdistance matrix, (b) sampling n-tuples froma medium distance matrix, or (c) imitating apivot-based search on a large distance matrix,which will give us better scalability of results.
� GP-based operations (Select, Mutate, Re-combine) - Based on the evaluation results,we will select the most promising expressionsand add them to the next generation. Someof them will be modified (mutated) or recom-bined with others (i.e., the crossover of expres-sion trees) in order to boost their efficiencyand find better expressions. During this stage,we need to test expression similarities and forthis purpose, we consider applying a similaritymeasure to find similarities in expression trees(e.g., tree edit distance [15]) together with ourpreviously proposed fingerprinting method.
We see the great potential in creating multiplegenerations of expressions based on the feedbackfrom the evaluation, so we can try to modify theexpressions to improve their efficiency accordingly.Depending on results, we will handle the mutationand recombination processes either in a completelyrandom way, or there will be some logic behind toimprove specific parts of an expression (modifyingspecific nodes in the expression tree).
The availability of multiple fitness functions givesus the opportunity to study expressions’ behaviorin different testing environments and potentially tocome up with special characteristics of expressionsand their suitability for specific datasets.
Another advantage is that GP has been studiedand applied widely to lots of different areas and
SIGMOD Record, June 2013 (Vol. 42, No. 2) 9
there exists multiple options of how to perform eachoperation – sampling, recombination, or mutation,in order to obtain the next generation [19]. There-fore we can pick the method that will be mostlyrelated and suitable to mathematical expressions.
6. CONCLUSION AND FUTURE WORKWith the preliminary implementation of purely
theoretical SIMDEX Framework, we are able todemonstrate how to deal with the efficiency of simi-larity search in nonmetric spaces in other way thanforcing the domain experts to implant and use met-ric postulates in their similarity models. Based onthe results, we conclude that our framework is ca-pable of finding alternative ways of indexing thatspeed up high-precision similarity queries.
However, to achieve this within an acceptabletime frame and to find interesting axioms, we needto optimize it dramatically. For this purpose, wepush our framework towards evolutionary algorithms(e.g., genetic programming). Doing so, we expect toexplore the search space of all possible expressionsmore effectively and to have good results quickly.This method could provide better outcomes in termsof query efficiency/effectiveness for complex non-metric similarity models. In the metric spaces, oursolution will just provide a solid alternative to qual-itatively dominating state-of-the-art techniques.
7. ACKNOWLEDGMENTSThis research has been supported by Grant Agency
of Charles University (GAUK) projects 567312 and910913 and by Czech Science Foundation (GACR)project 202/11/0968.
8. REFERENCES[1] C. Beecks, M. S. Uysal, and T. Seidl.
Signature quadratic form distance. In Proc.ACM International Conference on Image andVideo Retrieval, pages 438–445, 2010.
[2] E. Chavez, G. Navarro, R. Baeza-Yates, andJ. L. Marroquın. Searching in metric spaces.ACM Comp. Surveys, 33(3):273–321, 2001.
[3] N. L. Cramer. A representation for theadaptive generation of simple sequentialprograms. In Proc. of the 1st Int. Conf. onGenetic Algorithms, pages 183–187. L.Erlbaum Associates Inc., USA, 1985.
[4] R. Cummins and C. O’Riordan. An axiomaticcomparison of learned term-weighting schemesin information retrieval: clarifications andextensions. Artif. Intell. Rev., 28:51–68, 2007.
[5] J. Dean and S. Ghemawat. MapReduce:simplified data processing on large clusters. In
Proc. of the 6th conf. on Symp. on Oper.Systems Design & Impl., USA, 2004.
[6] H. Fang and C. Zhai. An exploration ofaxiomatic approaches to information retrieval.In SIGIR, pages 480–487. ACM, 2005.
[7] R. K. France. Weights and Measures: anAxiomatic Approach to SimilarityComputations. Technical report, 1995.
[8] J. Galgonek, D. Hoksza, and T. Skopal. SProt:sphere-based protein structure similarityalgorithm. Proteome Science, 9:1–12, 2011.
[9] M. L. Hetland. Ptolemaic indexing.arXiv:0911.4384 [cs.DS], 2009.
[10] J. R. Koza. Genetic programming. MIT Press,Cambridge, MA, USA, 1992.
[11] J. Lokoc, M. Hetland, T. Skopal, andC. Beecks. Ptolemaic indexing of the signaturequadratic form distance. In Similarity Searchand Applications, pages 9–16. ACM, 2011.
[12] Y. Lv and C. Zhai. Lower-bounding termfrequency normalization. In Proc. of the 20thACM Int. Conf. on Information andknowledge management, CIKM ’11, pages7–16, New York, NY, USA, 2011. ACM.
[13] C. Macdonald, N. Tonellotto, and I. Ounis.On upper bounds for dynamic pruning. InProc. of the 3rd Int. Conf. on Advances ininformation retrieval theory, ICTIR’11, pages313–317. Springer-Verlag, 2011.
[14] H. Samet. Foundations of Multidimensionaland Metric Data Structures. MorganKaufmann Publishers Inc., USA, 2005.
[15] T. Skopal. Unified framework for fast exactand approximate search in dissimilarityspaces. ACM Transactions on DatabaseSystems, 32(4):1–46, 2007.
[16] T. Skopal and T. Bartos. AlgorithmicExploration of Axiom Spaces for EfficientSimilarity Search at Large Scale. In SimilaritySearch and Applications, LNCS, 7404, pages40–53. Springer, 2012.
[17] T. Skopal and B. Bustos. On nonmetricsimilarity search problems in complexdomains. ACM Comp. Surv., 43:1–50, 2011.
[18] T. F. Smith and M. S. Waterman.Identification of common molecularsubsequences. Journal of molecular biology,147:195–197, 1981.
[19] D. Whitley. A genetic algorithm tutorial.Statistics and computing, 4(2):65–85, 1994.
[20] P. Zezula, G. Amato, V. Dohnal, andM. Batko. Similarity Search: The MetricSpace Approach. Advances in DatabaseSystems. Springer-Verlag, USA, 2005.
10 SIGMOD Record, June 2013 (Vol. 42, No. 2)
Research Endogamy as an Indicator of ConferenceQuality
Sergio Lopez Montolio, David Dominguez-Sal, Josep Lluis Larriba-PeyDAMA-UPC
Universitat Politecnica de Catalunya, Barcelona TechBarcelona
{slopez,ddomings,larri}@ac.upc.edu
ABSTRACTEndogamy in scientific publications is a measure of thedegree of collaboration between researchers. In this pa-per, we analyze the endogamy of a large set of computerscience conferences and journals. We observe a strongcorrelation between the quality of those conferences andthe endogamy of their authors: conferences where re-searchers collaborate with new peers have significantlymore quality than conferences where researchers workin groups that are stable along time.
1. INTRODUCTIONSocial sciences define endogamy as “the custom
of marrying only within the limits of a local com-munity, clan, or tribe”1. We can extend this con-cept to measure the degree of collaboration betweenpersons. In the context of scientific publications, weconsider endogamy as the inclination of a person ora group to usually collaborate (i.e., publish papers)within a small group of selected people.
Coauthorship networks represent authors as nodesin a graph and edges linking people who coauthora paper. They provide information about how theresearchers cooperate to produce new ideas [11]. Itis known that not all collaborations have an equalimpact, and some of them produce higher researchimpact [2]. Furthermore, Guimera et al. studied asmall set of journals and found that endogamy isa significant factor in the performance of researchteams in some research fields such as social psy-chology or ecology [6]. The collaborations with newresearchers open new streams of ideas, and henceare a positive indicator of good research.
In this paper, we go further in the study of theendogamy in computer science collaborations. Weapply this endogamy to calculate the endogamy ofa broad spectrum of computer science conferences(926) and journals (317). We observe that there is
1http://oxforddictionaries.com/definition/endogamy
a strong influence of the endogamy of the researchteams publishing in a conference on the quality ofsuch conference (up to 80% agreement with theERA conference ranking2). This shows the socialimportance of conferences for computer scientists,where they are able to meet new peers that in turnlead to better publications. In particular, reputedconferences such as PODS, ICDT, SIGMOD, VLDBor ICDE stand out among database conferences ashaving particularly low endogamy. Although thiscollaborative strategy works well for conferences, itis not universal, because we found that computerscience journals are not affected by endogamy alike.
The correlation found between the endogamy andthe quality of conferences opens the possibility toconsider having metrics to evaluate the quality ofa conference that are based on the social aspectsof research. Currently, the evaluation of confer-ences relies mostly on measures based on the cita-tions: h-index, cites per paper, pagerank, etc. [1, 5]and in few occasions (e.g. program committee re-lations [14]) personal relations are analyzed. But,the extraction of cites is not an easy task [3] and er-ror free citation collection requires a large manualeffort. Furthermore, the median age of citation isseveral years (e.g. the median age for TODS is over10 years [13]), which delays the release of reliablequalifications for conferences and journals. In con-trast, coauthor networks are easy to obtain and theydescribe the current information without delay. Al-though social metrics cannot be used to evaluate thecontent of an article because scientific excellence isdetermined by article’s content and not by authors’profiles, social metrics can be computed to obtainearly estimates of the quality of recent conferences.
We define the endogamy in Section 2. Then, wedescribe the experimental environment in Section 3.After computing the endogamy for all the available
2Previously known as CORE. Available at http://www.arc.gov.au/era/era_2010/archive/default.htm
SIGMOD Record, June 2013 (Vol. 42, No. 2) 11
journals and conferences in our dataset, we evaluatethe results for conferences in general in Section 4,and for database conferences in Section 5. Finally,we evaluate analyze the endogamy of journals inSection 6.
2. ENDOGAMY COMPUTATIONResearch is based on the proposal and study of
new ideas. The collaboration with researchers ex-ternal to the usual research team is a very goodmeans to introduce such new ideas and allow merg-ing the expertise from multiple fields. In this pa-per, we quantify this degree of new collaborationsby means of a new indicator called endogamy.
We compute the endogamy of a set of authors asthe inclination of a person or a group to usually col-laborate (i.e., publish papers) within a small groupof selected people as:
Endo(A) =|d(A)|
|⋃a∈A d({a})| , (1)
where A is a set of authors, and d(A) is the set of pa-pers that were published by the full set of authors,in other words, papers coauthored by all the mem-bers of A. For example, consider the endogamy ofa group formed by authors x and y, who have indi-vidually published three papers (d({x}) = {a, b, c}and d({y}) = {b, c, d}). Since they have collabo-rated in half of their publications their endogamy,Endo({x, y}), is: 2/4 = 0.5
Endogamy of a paper: Let A(p) be the set ofauthors of a paper p and Li(p) = Pi(A(p)) be thepower set of authors of size i (the set of all subsets
with size i within A(p)). Then, L(p) =⋃i=|A|
i=2 Li
is the set of all the subsets with more than one au-thor. We compute the endogamy of a paper p, asthe aggregation of the endogamies of L(p). We testseveral endogamy aggregations:
• Max: Maximum of the endogamies of all groups:
Endo(p) = maxx∈L(p)(Endo(x))
• Min: Minimum of the endogamies of all groups:
Endo(p) = minx∈L(p)(Endo(x))
• Med: Median of the endogamies:
Endo(p) = medx∈L(p)(Endo(Li))
• Avg: Arithmetic mean of the endogamies:
Endo(p) =
∑x∈LEndo(x)
|L|
Conferences JournalsA/A* 223 122B 308 87C 395 108Total 926 317
Table 1: Conferences and journals by tier.
• Harm: Harmonic mean of the endogamies withinL(p):
Endo(p) = harm({Endo(x)|x ∈ L(p)}),
where harm(X) =|X|∑x∈X
1x
• Avg size: Arithmetic mean of the endogamiesof the subsets of authors grouped by size:
Endo(p) =1
|A| − 1·i=|A|∑
i=2
∑x∈Li(p)
Endo(x)
|Li(p)|
• Harm size: Harmonic mean of the endogamiesof the subsets of authors grouped by size:
Endo(p) = harm({harm(Li(p))|2 ≤ i ≤ |A|})
Endogamy of a conference/journal: Let C bethe set of articles published in a conference or ajournal. We compute the endogamy as the averageendogamy of its papers:
Endo(C) =1
|C|∑
p∈C
Endo(p) (2)
Endo must not be seen as an absolute value ofthe research quality of a group of people. Indeed,the quality of an individual paper cannot be com-puted by simply stating the persons who wrote it.High quality research relies on good scientific con-tent, which can be potentially written by any per-son. Endo should be seen as a probability distri-bution of the quality of a paper. The Endo valueassociated to a group is a number between 0 and 1.An Endo value close to 1 indicates that the paperis not likely to bring new ideas because the authorsare not working with other members of the commu-nity. Values close to 0 show that the researchersconstantly collaborate with new researchers, andthus they are more likely to introduce new ideas.
3. EXPERIMENTAL ENVIRONMENTIn order to study the influence of the endogamy
of authors on the quality of conferences and jour-nals, we rank the computer science conferences and
12 SIGMOD Record, June 2013 (Vol. 42, No. 2)
journals available in the DBLP database3 by theirEndo value4. In order to verify the quality of theranking, we take the quality indicators publishedby the project Excellence in Research for Australia(ERA) as reference. We take the ERA evaluationperformed in 2010, which ranks conferences andjournals in three categories: A, B and C. In thisclassification, publications in category A are betterthan publications in category B, and publicationsin category B are better than publications in cate-gory C. Since the titles in DBLP and ERA are notnormalized, we only select those conferences andjournals that appear in both datasets with exactlythe same title or acronym. After this process, we re-trieve 926 conferences and 317 journals that belongto all the three ranks of ERA as shown in Table 1.
We report the degree of similarity between theERA and Endo rankings by means of the agreementbetween both series. Given the two rankings, a pairof conferences c1 and c2 is concordant if c1 > c2 forboth rankings (and by symmetry c1 < c2 for bothrankings). Otherwise, the pair is discordant. Wecompute for all pairs of conferences (or journals) inthe dataset, the number of concordant pairs p, andthe number of discordant ones f (ties are not con-sidered). The following percentage ratio computesthe agreement between both rankings:
ρ = 100 · p
p+ f(3)
We verify the statistical significance of our resultsby means of the Kendall tau [12], which is a nonparametric test that measures the rank correlationbetween two lists without making assumptions ofthe sorting method, and ANOVA, which is suitedfor comparing different configurations of our metricusing the R statistical package5.
4. CONFERENCE ANALYSISWe ranked the conferences using the six described
variants of Endo. In this first experiment, we re-moved entities with low activity: those conferenceswith less than 500 papers in all their history. Withthis, we ended up with a total of 241 conferencesto be used for the first experiment. We show laterthat the conclusions are the same if no cleanup isperformed. The dark series of Figure 1 shows the
3http://www.informatik.uni-trier.de/~ley/db4When we compute of a paper p using Equation 1, weconsider only collaborations performed before the pub-lication date of p. So, we do not introduce unavailableinformation about subsequent collaborations after p waspublished.5All statistical test in the paper are performed with con-fidence level α = 0.05
0
10
20
30
40
50
60
70
80
90
Max Min Avg Med Harm Avg Size Harm Size
Agr
eem
ent
All tiers Tier A
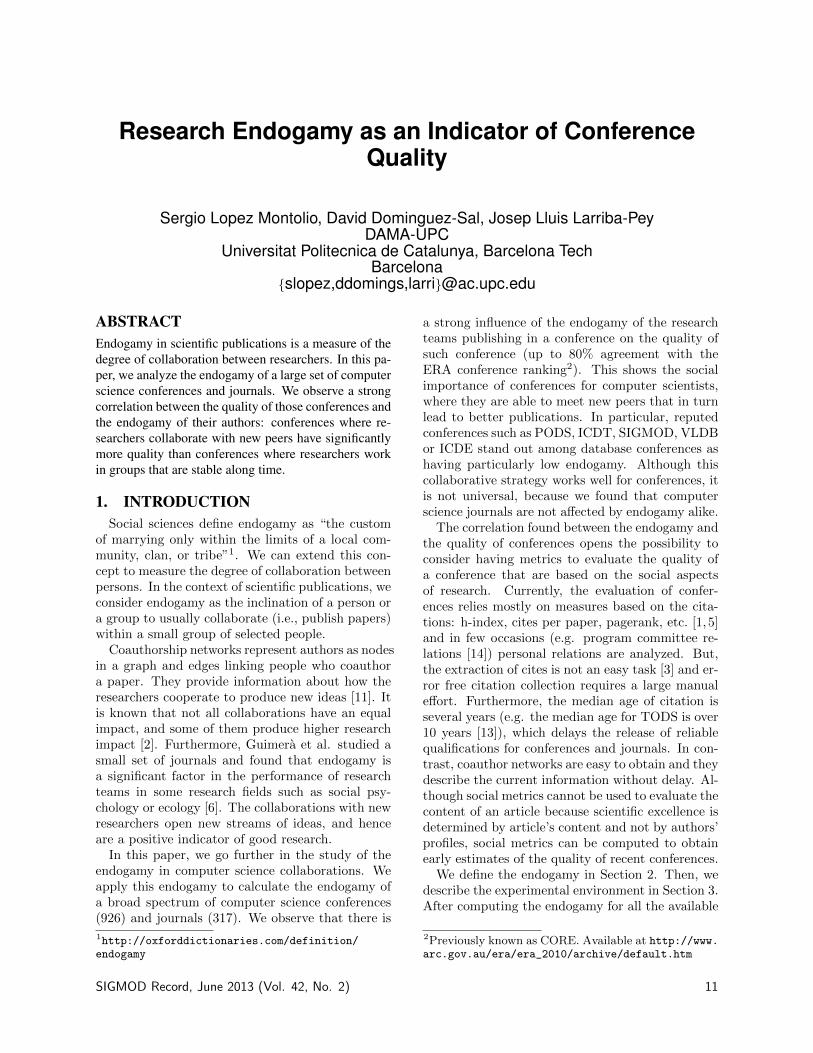
Figure 1: Agreement ρ for conferences withmore than 500 papers.
agreement for each aggregation technique. We ob-serve that the ranking of conferences performed byEndo has a very strong agreement with those ofERA independently of the aggregation performed.By means of the Kendall Tau coefficient test, wefound that such correlations are statistically sig-nificant for all the aggregation techniques. Amongthem, Max and Avg are the best aggregation tech-niques. This corresponds to selecting the most en-dogamous group of authors, or average endogamyof all subsets of authors, respectively.
We also consider the case of deciding whether aconference is a top tier (A) or a non top tier confer-ence (B and C) according to ERA. We depict theagreement with this binary decision in the light se-ries of Figure 1 showing that it also correlates well,being the influence statistically significant consider-ing the Kendall coefficient.
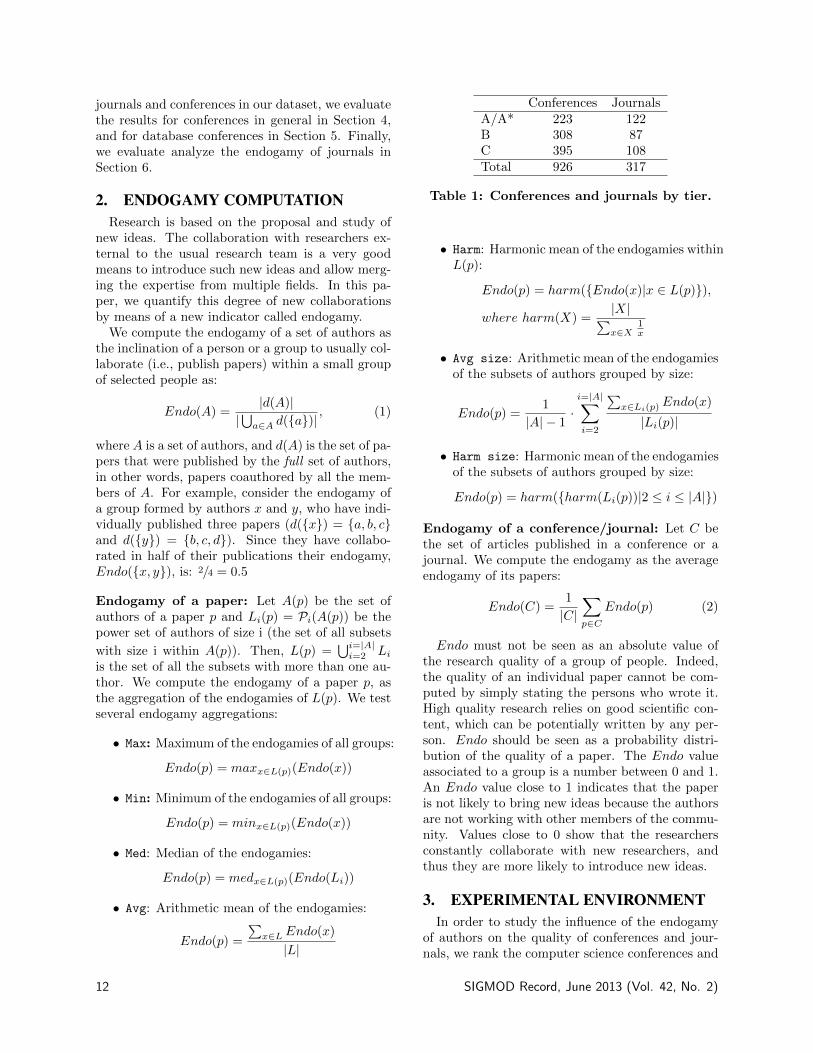
We observed that depending on the conferencetier, the distribution of Endo changes. We illus-trate this change as a boxplot in Figure 2 for theconferences in the previous experiment, where wedepict Endo using Avg with respect to the ERAtier. Note that the median Endo increases as welower the conference quality, and the median Endoof a tier is lower than the first quartile of the nextranked tier consistently.
We verify the significance of the differences bymeans of an ANOVA test. We first performed a ran-dom sample of 50 conferences of each tier, adding up150 conferences in total and compared their Endoin logarithmic scale. The ANOVA allows us to con-clude that there exists statistically significant dif-ferences between the three tiers considered with re-spect to Endo. In order to improve the confidence ofour statistical analysis, we applied resampling. Weselected ten new samples, where each sample con-tains 50 conferences in each tier, and recomputedthe ANOVA procedure. In all the cases, the re-sults showed significant differences between tiers,
SIGMOD Record, June 2013 (Vol. 42, No. 2) 13
A B C
0.1
0.2
0.5
Tier
Avg
End
ogam
y
2 3 4 5 6
0.0
0.2
0.4
0.6
0.8
1.0
Number of authors
Max
End
ogam
y
2 3 4 5 6
0.0
0.2
0.4
0.6
0.8
1.0
Number of authors
Avg
End
ogam
y
Figure 2: Endo per confer-ence tier using Avg.
Figure 3: Endo using Max vs.authors of a paper.
Figure 4: Endo using Avg vs.authors of a paper.
and thus, we conclude that each conference tier hasa characteristic Endo. The different pairs of tiershave been compared using a Tukey’s test, conclud-ing that for any pair of tiers their Endo is statisti-cally different.
Impact of parameters in Endo: We observedthat Max and Avg are the best candidates to be con-sidered as quality indicators of conferences. Afterverifying the significance of their predictions (weshowed in the previous section the results for Avg
and for space reasons we do not report those for Max),we proceed to analyze with more detail the im-pact of the variables involved in the computationof Endo.
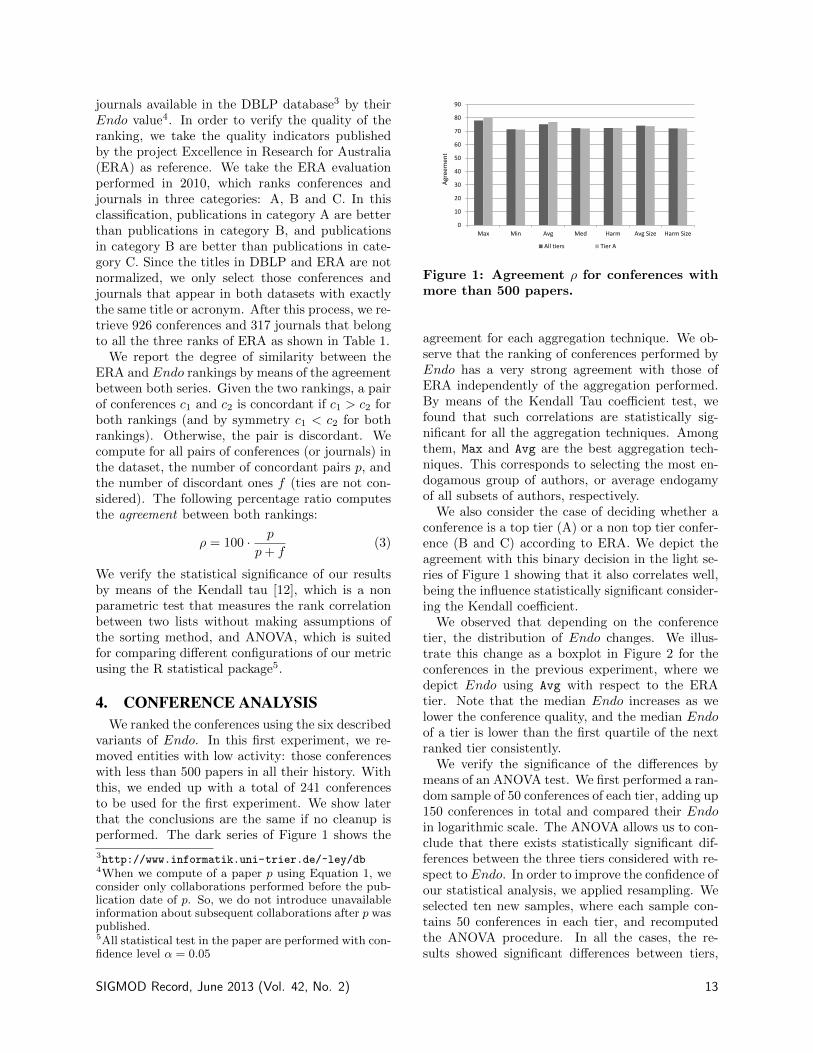
First, we analyze the impact of the number of au-thors in the computation of the endogamy of a pa-per. We separate the papers in groups by the num-ber of authors and plot Endo for each paper in thegroup as a boxplot in Figures 3 and 4. We expectedthat the number of authors would not be relevantfor the quality of the paper. We found that despitethe higher precision of Max, the value of Endo ob-tained with it depends on the number of authorsof a paper: more authors imply larger Endo. Max
takes into account only the most endogamic group,and with more authors there are more subgroupsthat may have large endogamy. On the other hand,Figure 4 shows an homogeneous distribution of en-dogamies for Avg no matter the number of authors.We conclude that Max gives biased results betweenconferences with different distributions of authorsbut this is not the case for Avg. Therefore, in thefollowing experiments we focus on Avg.
In our next experiment, we study if the numberof papers of a conference and the number of papersper author have an impact in the accuracy of Endoas a predictor. We set five levels for each variable:
0
10
20
30
40
50
60
70
80
90
1 3 5 7
Agr
eem
ent
Number of papers
0
100
250
500
1000
Minimum Conference
Size
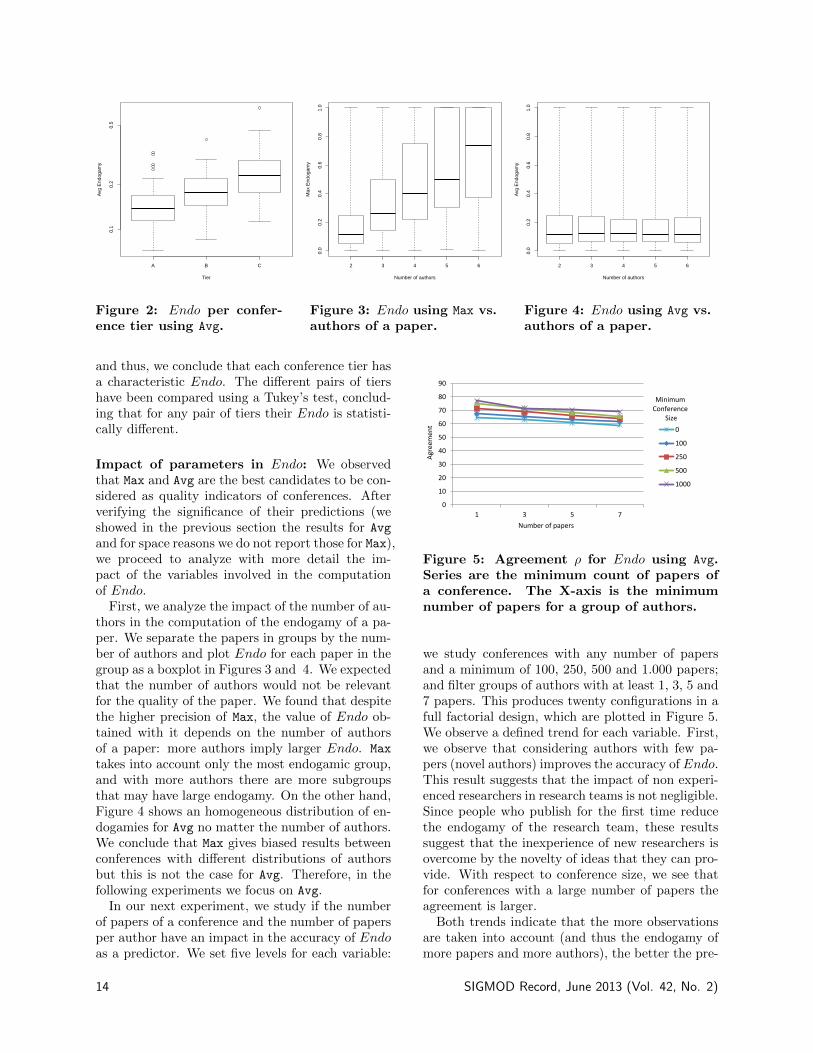
Figure 5: Agreement ρ for Endo using Avg.Series are the minimum count of papers ofa conference. The X-axis is the minimumnumber of papers for a group of authors.
we study conferences with any number of papersand a minimum of 100, 250, 500 and 1.000 papers;and filter groups of authors with at least 1, 3, 5 and7 papers. This produces twenty configurations in afull factorial design, which are plotted in Figure 5.We observe a defined trend for each variable. First,we observe that considering authors with few pa-pers (novel authors) improves the accuracy of Endo.This result suggests that the impact of non experi-enced researchers in research teams is not negligible.Since people who publish for the first time reducethe endogamy of the research team, these resultssuggest that the inexperience of new researchers isovercome by the novelty of ideas that they can pro-vide. With respect to conference size, we see thatfor conferences with a large number of papers theagreement is larger.
Both trends indicate that the more observationsare taken into account (and thus the endogamy ofmore papers and more authors), the better the pre-
14 SIGMOD Record, June 2013 (Vol. 42, No. 2)
Conference Tier Avg.Endo
PODS A 0.083ISIT B 0.085EDBT A 0.095ICDE A 0.108PKDD A 0.120
SIGMOD A 0.122MDM C 0.126
ASIACRYPT A 0.132DASFAA A 0.132PAKDD A 0.133
All history
Conference Tier Avg.Endo
PODS A 0.058CRYPTO A 0.062ICDT A 0.065DBLP B 0.065
SIGMOD A 0.073EUROCRYPT A 0.073
VLDB A 0.077EDBT A 0.079
ASIACRYPT A 0.080ICDE A 0.081
Years 2003-2012
0
10
20
30
40
50
60
70
80
90
Max Min Avg Med Harm Avg Size Harm Size
Agr
eem
ent
All tiers Tier a
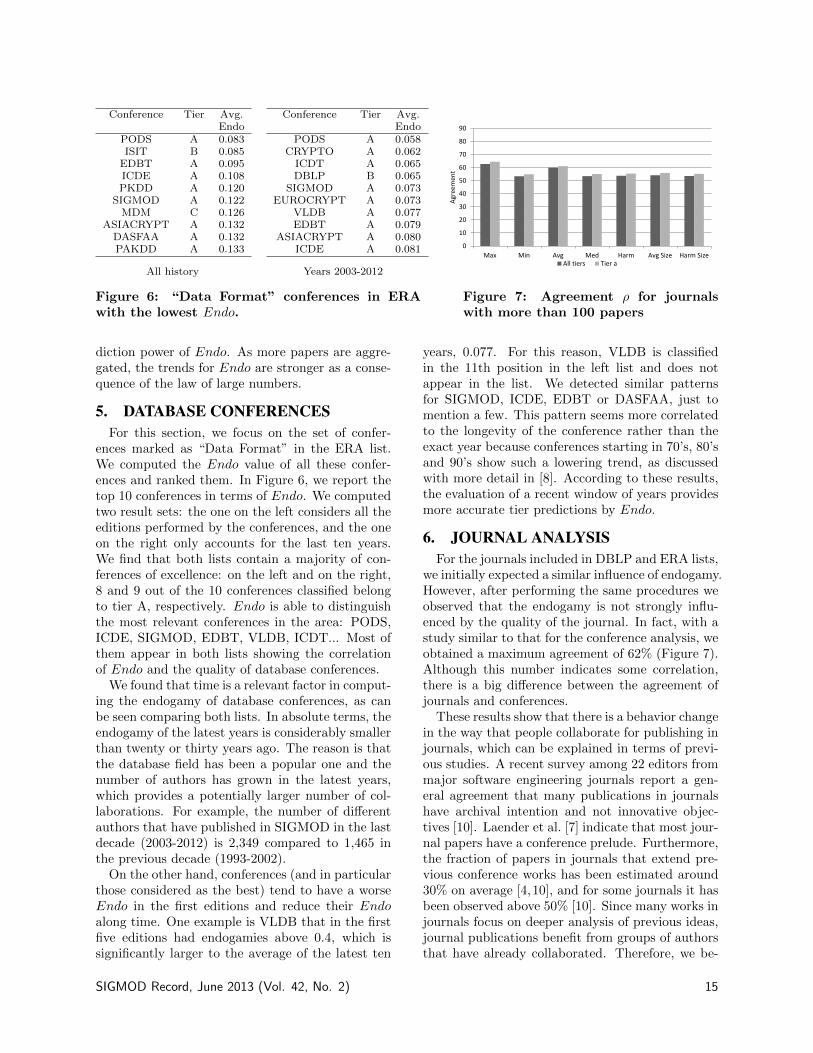
Figure 6: “Data Format” conferences in ERAwith the lowest Endo.
Figure 7: Agreement ρ for journalswith more than 100 papers
diction power of Endo. As more papers are aggre-gated, the trends for Endo are stronger as a conse-quence of the law of large numbers.
5. DATABASE CONFERENCESFor this section, we focus on the set of confer-
ences marked as “Data Format” in the ERA list.We computed the Endo value of all these confer-ences and ranked them. In Figure 6, we report thetop 10 conferences in terms of Endo. We computedtwo result sets: the one on the left considers all theeditions performed by the conferences, and the oneon the right only accounts for the last ten years.We find that both lists contain a majority of con-ferences of excellence: on the left and on the right,8 and 9 out of the 10 conferences classified belongto tier A, respectively. Endo is able to distinguishthe most relevant conferences in the area: PODS,ICDE, SIGMOD, EDBT, VLDB, ICDT... Most ofthem appear in both lists showing the correlationof Endo and the quality of database conferences.
We found that time is a relevant factor in comput-ing the endogamy of database conferences, as canbe seen comparing both lists. In absolute terms, theendogamy of the latest years is considerably smallerthan twenty or thirty years ago. The reason is thatthe database field has been a popular one and thenumber of authors has grown in the latest years,which provides a potentially larger number of col-laborations. For example, the number of differentauthors that have published in SIGMOD in the lastdecade (2003-2012) is 2,349 compared to 1,465 inthe previous decade (1993-2002).
On the other hand, conferences (and in particularthose considered as the best) tend to have a worseEndo in the first editions and reduce their Endoalong time. One example is VLDB that in the firstfive editions had endogamies above 0.4, which issignificantly larger to the average of the latest ten
years, 0.077. For this reason, VLDB is classifiedin the 11th position in the left list and does notappear in the list. We detected similar patternsfor SIGMOD, ICDE, EDBT or DASFAA, just tomention a few. This pattern seems more correlatedto the longevity of the conference rather than theexact year because conferences starting in 70’s, 80’sand 90’s show such a lowering trend, as discussedwith more detail in [8]. According to these results,the evaluation of a recent window of years providesmore accurate tier predictions by Endo.
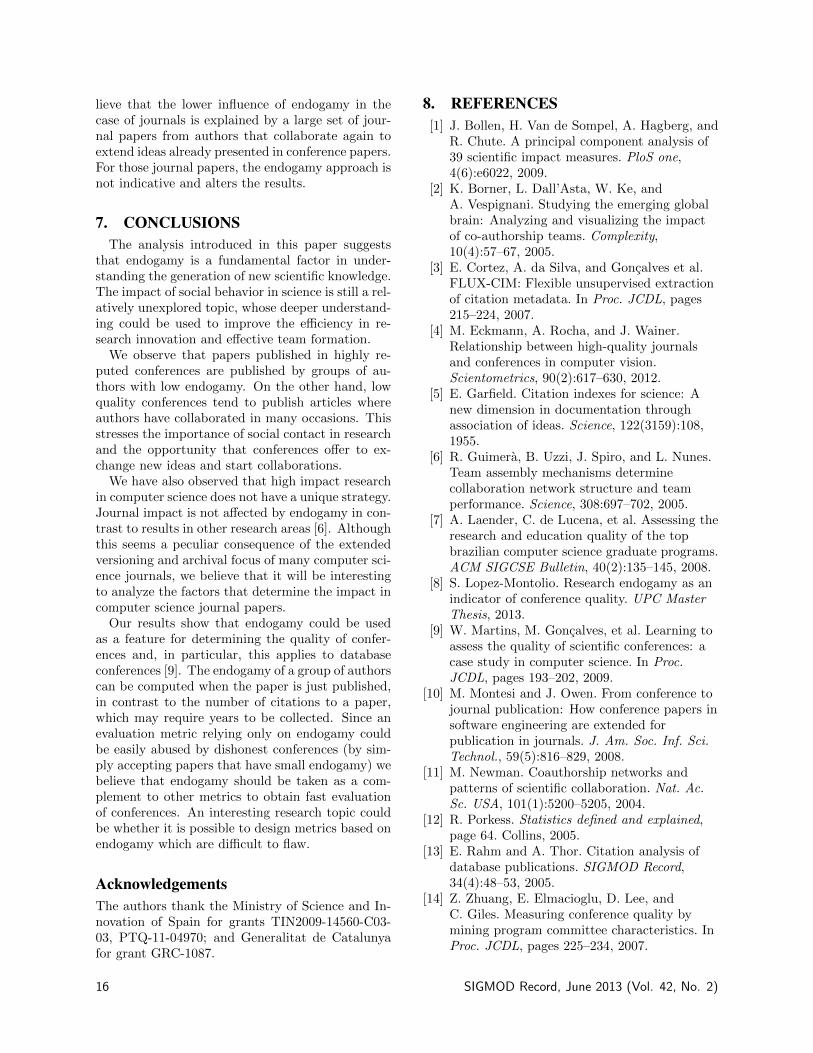
6. JOURNAL ANALYSISFor the journals included in DBLP and ERA lists,
we initially expected a similar influence of endogamy.However, after performing the same procedures weobserved that the endogamy is not strongly influ-enced by the quality of the journal. In fact, with astudy similar to that for the conference analysis, weobtained a maximum agreement of 62% (Figure 7).Although this number indicates some correlation,there is a big difference between the agreement ofjournals and conferences.
These results show that there is a behavior changein the way that people collaborate for publishing injournals, which can be explained in terms of previ-ous studies. A recent survey among 22 editors frommajor software engineering journals report a gen-eral agreement that many publications in journalshave archival intention and not innovative objec-tives [10]. Laender et al. [7] indicate that most jour-nal papers have a conference prelude. Furthermore,the fraction of papers in journals that extend pre-vious conference works has been estimated around30% on average [4,10], and for some journals it hasbeen observed above 50% [10]. Since many works injournals focus on deeper analysis of previous ideas,journal publications benefit from groups of authorsthat have already collaborated. Therefore, we be-
SIGMOD Record, June 2013 (Vol. 42, No. 2) 15
lieve that the lower influence of endogamy in thecase of journals is explained by a large set of jour-nal papers from authors that collaborate again toextend ideas already presented in conference papers.For those journal papers, the endogamy approach isnot indicative and alters the results.
7. CONCLUSIONSThe analysis introduced in this paper suggests
that endogamy is a fundamental factor in under-standing the generation of new scientific knowledge.The impact of social behavior in science is still a rel-atively unexplored topic, whose deeper understand-ing could be used to improve the efficiency in re-search innovation and effective team formation.
We observe that papers published in highly re-puted conferences are published by groups of au-thors with low endogamy. On the other hand, lowquality conferences tend to publish articles whereauthors have collaborated in many occasions. Thisstresses the importance of social contact in researchand the opportunity that conferences offer to ex-change new ideas and start collaborations.
We have also observed that high impact researchin computer science does not have a unique strategy.Journal impact is not affected by endogamy in con-trast to results in other research areas [6]. Althoughthis seems a peculiar consequence of the extendedversioning and archival focus of many computer sci-ence journals, we believe that it will be interestingto analyze the factors that determine the impact incomputer science journal papers.
Our results show that endogamy could be usedas a feature for determining the quality of confer-ences and, in particular, this applies to databaseconferences [9]. The endogamy of a group of authorscan be computed when the paper is just published,in contrast to the number of citations to a paper,which may require years to be collected. Since anevaluation metric relying only on endogamy couldbe easily abused by dishonest conferences (by sim-ply accepting papers that have small endogamy) webelieve that endogamy should be taken as a com-plement to other metrics to obtain fast evaluationof conferences. An interesting research topic couldbe whether it is possible to design metrics based onendogamy which are difficult to flaw.
AcknowledgementsThe authors thank the Ministry of Science and In-novation of Spain for grants TIN2009-14560-C03-03, PTQ-11-04970; and Generalitat de Catalunyafor grant GRC-1087.
8. REFERENCES[1] J. Bollen, H. Van de Sompel, A. Hagberg, and
R. Chute. A principal component analysis of39 scientific impact measures. PloS one,4(6):e6022, 2009.
[2] K. Borner, L. Dall’Asta, W. Ke, andA. Vespignani. Studying the emerging globalbrain: Analyzing and visualizing the impactof co-authorship teams. Complexity,10(4):57–67, 2005.
[3] E. Cortez, A. da Silva, and Goncalves et al.FLUX-CIM: Flexible unsupervised extractionof citation metadata. In Proc. JCDL, pages215–224, 2007.
[4] M. Eckmann, A. Rocha, and J. Wainer.Relationship between high-quality journalsand conferences in computer vision.Scientometrics, 90(2):617–630, 2012.
[5] E. Garfield. Citation indexes for science: Anew dimension in documentation throughassociation of ideas. Science, 122(3159):108,1955.
[6] R. Guimera, B. Uzzi, J. Spiro, and L. Nunes.Team assembly mechanisms determinecollaboration network structure and teamperformance. Science, 308:697–702, 2005.
[7] A. Laender, C. de Lucena, et al. Assessing theresearch and education quality of the topbrazilian computer science graduate programs.ACM SIGCSE Bulletin, 40(2):135–145, 2008.
[8] S. Lopez-Montolio. Research endogamy as anindicator of conference quality. UPC MasterThesis, 2013.
[9] W. Martins, M. Goncalves, et al. Learning toassess the quality of scientific conferences: acase study in computer science. In Proc.JCDL, pages 193–202, 2009.
[10] M. Montesi and J. Owen. From conference tojournal publication: How conference papers insoftware engineering are extended forpublication in journals. J. Am. Soc. Inf. Sci.Technol., 59(5):816–829, 2008.
[11] M. Newman. Coauthorship networks andpatterns of scientific collaboration. Nat. Ac.Sc. USA, 101(1):5200–5205, 2004.
[12] R. Porkess. Statistics defined and explained,page 64. Collins, 2005.
[13] E. Rahm and A. Thor. Citation analysis ofdatabase publications. SIGMOD Record,34(4):48–53, 2005.
[14] Z. Zhuang, E. Elmacioglu, D. Lee, andC. Giles. Measuring conference quality bymining program committee characteristics. InProc. JCDL, pages 225–234, 2007.
16 SIGMOD Record, June 2013 (Vol. 42, No. 2)
Information Diffusion in Online Social Networks:A Survey
Adrien Guille1 Hakim Hacid2 Cécile Favre1 Djamel A. Zighed1,3
1ERIC Lab, Lyon 2 University, France{firstname.lastname}@univ-lyon2.fr
2Bell Labs France, Alcatel-Lucent, [email protected]
3Institute of Human Science, Lyon 2 University, [email protected]
ABSTRACTOnline social networks play a major role in the spread ofinformation at very large scale. A lot of effort have beenmade in order to understand this phenomenon, rang-ing from popular topic detection to information diffu-sion modeling, including influential spreaders identifi-cation. In this article, we present a survey of represen-tative methods dealing with these issues and propose ataxonomy that summarizes the state-of-the-art. The ob-jective is to provide a comprehensive analysis and guideof existing efforts around information diffusion in socialnetworks. This survey is intended to help researchers inquickly understanding existing works and possible im-provements to bring.
1. INTRODUCTIONOnline social networks allow hundreds of millions
of Internet users worldwide to produce and con-sume content. They provide access to a very vastsource of information on an unprecedented scale.Online social networks play a major role in the dif-fusion of information by increasing the spread ofnovel information and diverse viewpoints [3]. Theyhave proved to be very powerful in many situations,like Facebook during the 2010 Arab spring [22] orTwitter during the 2008 U.S. presidential elections[23] for instance. Given the impact of online socialnetworks on society, the recent focus is on extract-ing valuable information from this huge amount ofdata. Events, issues, interests, etc. happen andevolve very quickly in social networks and their cap-ture, understanding, visualization, and predictionare becoming critical expectations from both end-users and researchers. This is motivated by the factthat understanding the dynamics of these networksmay help in better following events (e.g. analyz-ing revolutionary waves), solving issues (e.g. pre-
venting terrorist attacks, anticipating natural haz-ards), optimizing business performance (e.g. opti-mizing social marketing campaigns), etc. Thereforeresearchers have in recent years developed a vari-ety of techniques and models to capture informa-tion di↵usion in online social networks, analyze it,extract knowledge from it and predict it.
Information di↵usion is a vast research domainand has attracted research interests from many fields,such as physics, biology, etc. The di↵usion of in-novation over a network is one of the original rea-sons for studying networks and the spread of diseaseamong a population has been studied for centuries.As computer scientists, we focus here on the par-ticular case of information di↵usion in online so-cial networks, that raises the following questions :(i) which pieces of information or topics are popu-lar and di↵use the most, (ii) how, why and throughwhich paths information is di↵using, and will be dif-fused in the future, (iii) which members of the net-work play important roles in the spreading process?
The main goal of this paper is to review develop-ments regarding these issues in order to provide asimplified view of the field. With this in mind, wepoint out strengths and weaknesses of existing ap-proaches and structure them in a taxonomy. Thisstudy is designed to serve as guidelines for scien-tists and practitioners who intend to design newmethods in this area. This also will be helpful fordevelopers who intend to apply existing techniqueson specific problems since we present a library ofexisting approaches in this area.
The rest of this paper is organized as follows.In Section 2 we detail online social networks basiccharacteristics and information di↵usion properties.In Section 3 we present methods to detect topics ofinterest in social networks using information di↵u-sion properties. Then we discuss how to model in-
SIGMOD Record, June 2013 (Vol. 42, No. 2) 17
formation di↵usion and detail both explanatory andpredictive models in Section 4. Next, we presentmethods to identify influential information spread-ers in Section 5. In the last section we summarizethe reviewed methods in a taxonomy, discuss theirshortcomings and indicate open questions.
2. BASICS OF ONLINE SOCIAL NET-WORKS AND INFORMATION DIFFU-SION
An online social network (OSN ) results from theuse of a dedicated web-service, often referred to associal network site (SNS ), that allows its users to (i)create a profile page and publish messages, and (ii)explicitly connect to other users thus creating socialrelationships. De facto, an OSN can be describedas a user-generated content system that permits itsusers to communicate and share information.
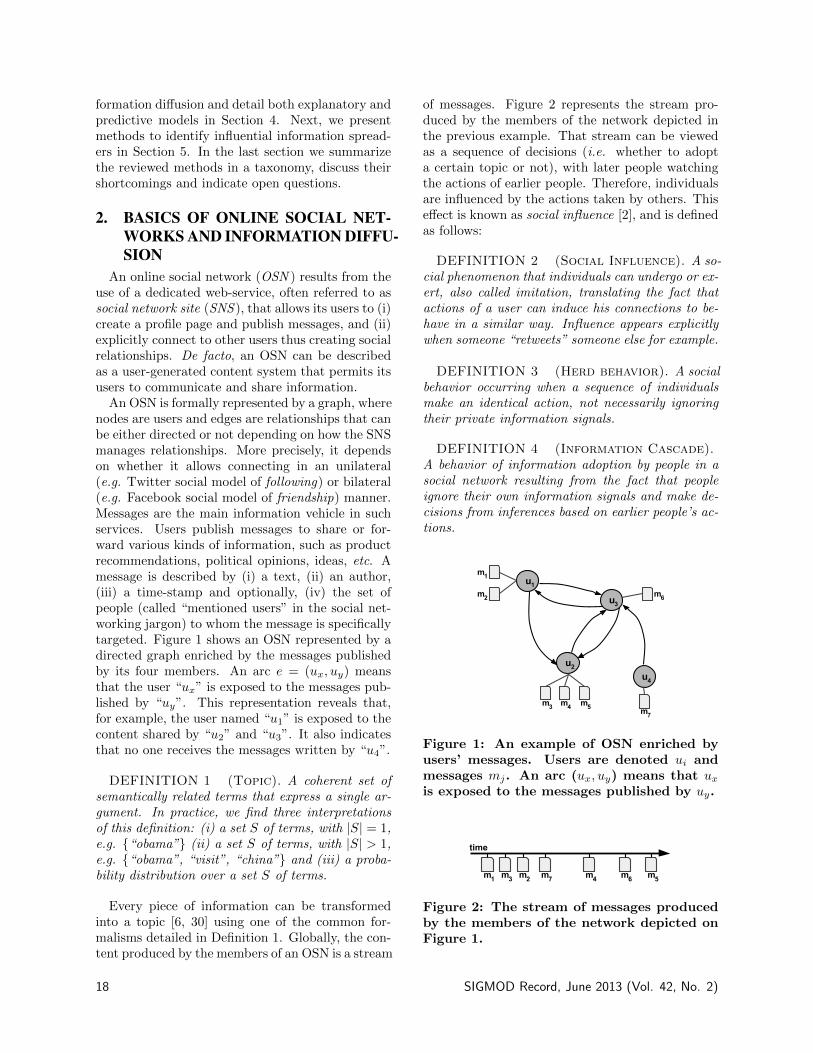
An OSN is formally represented by a graph, wherenodes are users and edges are relationships that canbe either directed or not depending on how the SNSmanages relationships. More precisely, it dependson whether it allows connecting in an unilateral(e.g. Twitter social model of following) or bilateral(e.g. Facebook social model of friendship) manner.Messages are the main information vehicle in suchservices. Users publish messages to share or for-ward various kinds of information, such as productrecommendations, political opinions, ideas, etc. Amessage is described by (i) a text, (ii) an author,(iii) a time-stamp and optionally, (iv) the set ofpeople (called “mentioned users” in the social net-working jargon) to whom the message is specificallytargeted. Figure 1 shows an OSN represented by adirected graph enriched by the messages publishedby its four members. An arc e = (ux, uy) meansthat the user “ux” is exposed to the messages pub-lished by “uy”. This representation reveals that,for example, the user named “u1” is exposed to thecontent shared by “u2” and “u3”. It also indicatesthat no one receives the messages written by “u4”.
DEFINITION 1 (Topic). A coherent set ofsemantically related terms that express a single ar-gument. In practice, we find three interpretationsof this definition: (i) a set S of terms, with |S| = 1,e.g. {“obama”} (ii) a set S of terms, with |S| > 1,e.g. {“obama”, “visit”, “china”} and (iii) a proba-bility distribution over a set S of terms.
Every piece of information can be transformedinto a topic [6, 30] using one of the common for-malisms detailed in Definition 1. Globally, the con-tent produced by the members of an OSN is a stream
of messages. Figure 2 represents the stream pro-duced by the members of the network depicted inthe previous example. That stream can be viewedas a sequence of decisions (i.e. whether to adopta certain topic or not), with later people watchingthe actions of earlier people. Therefore, individualsare influenced by the actions taken by others. Thise↵ect is known as social influence [2], and is definedas follows:
DEFINITION 2 (Social Influence). A so-cial phenomenon that individuals can undergo or ex-ert, also called imitation, translating the fact thatactions of a user can induce his connections to be-have in a similar way. Influence appears explicitlywhen someone “retweets” someone else for example.
DEFINITION 3 (Herd behavior). A socialbehavior occurring when a sequence of individualsmake an identical action, not necessarily ignoringtheir private information signals.
DEFINITION 4 (Information Cascade).A behavior of information adoption by people in asocial network resulting from the fact that peopleignore their own information signals and make de-cisions from inferences based on earlier people’s ac-tions.
X�X�
X�
P�
P�
P� P� P�
P�
X�
P�
Figure 1: An example of OSN enriched byusers’ messages. Users are denoted ui andmessages mj. An arc (ux, uy) means that ux
is exposed to the messages published by uy.
P� P� P� P� P� P�P�
WLPH
Figure 2: The stream of messages producedby the members of the network depicted onFigure 1.
18 SIGMOD Record, June 2013 (Vol. 42, No. 2)
Based on the social influence e↵ect, informationcan spread across the network through the prin-ciples of herd behavior and informational cascadewhich we define respectively in Definition 3 and 4.In this context, some topics can become extremelypopular, spread worldwide, and contribute to newtrends. Eventually, the ingredients of an informa-tion di↵usion process taking place in an OSN canbe summarized as follows: (i) a piece of informationcarried by messages, (ii) spreads along the edgesof the network according to particular mechanics,(iii) depending on specific properties of the edgesand nodes. In the following sections, we will dis-cuss these di↵erent aspects with the most relevantrecent work related to them as well as an analysisof weaknesses, strength, and possible improvementsfor each aspect.
3. DETECTING POPULAR TOPICSOne of the main tasks when studying information
di↵usion is to develop automatic means to providea global view of the topics that are popular overtime or will become popular, and animate the net-work. This involves extracting “tables of content”to sum up discussions, recommending popular top-ics to users, or predicting future popular topics.
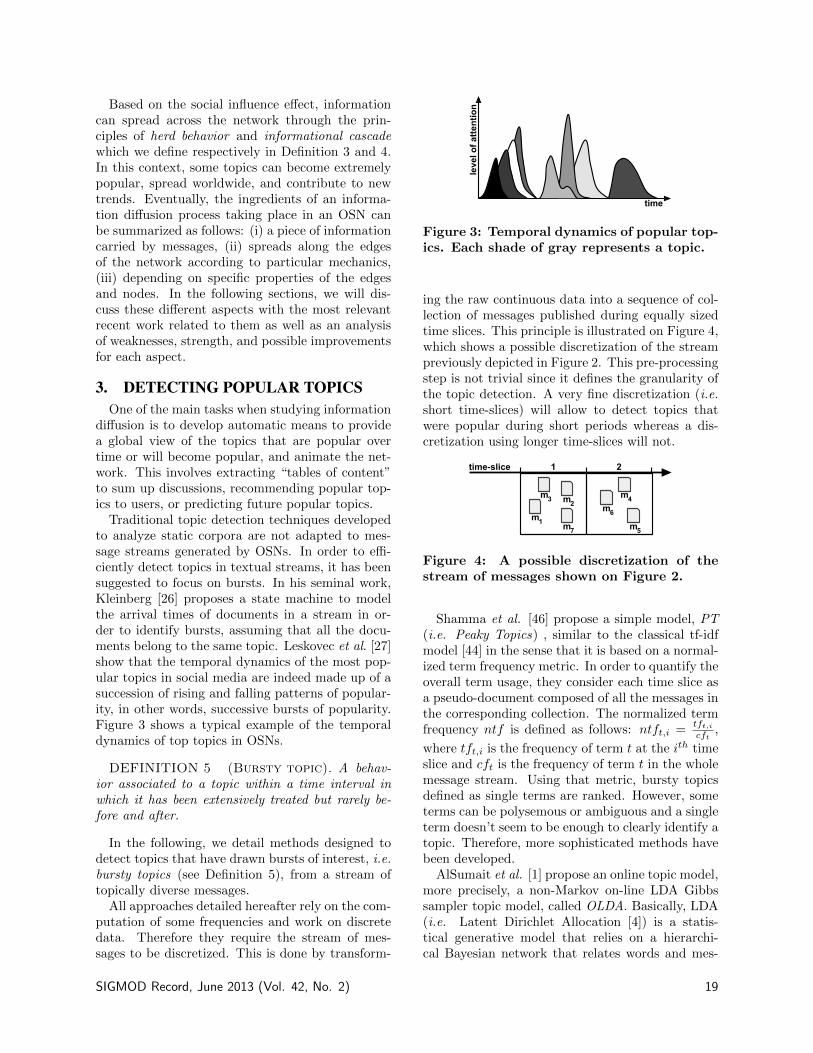
Traditional topic detection techniques developedto analyze static corpora are not adapted to mes-sage streams generated by OSNs. In order to e�-ciently detect topics in textual streams, it has beensuggested to focus on bursts. In his seminal work,Kleinberg [26] proposes a state machine to modelthe arrival times of documents in a stream in or-der to identify bursts, assuming that all the docu-ments belong to the same topic. Leskovec et al. [27]show that the temporal dynamics of the most pop-ular topics in social media are indeed made up of asuccession of rising and falling patterns of popular-ity, in other words, successive bursts of popularity.Figure 3 shows a typical example of the temporaldynamics of top topics in OSNs.
DEFINITION 5 (Bursty topic). A behav-ior associated to a topic within a time interval inwhich it has been extensively treated but rarely be-fore and after.
In the following, we detail methods designed todetect topics that have drawn bursts of interest, i.e.bursty topics (see Definition 5), from a stream oftopically diverse messages.
All approaches detailed hereafter rely on the com-putation of some frequencies and work on discretedata. Therefore they require the stream of mes-sages to be discretized. This is done by transform-
WLPH
OHYHO�RI�DWWH
QWLRQ
Figure 3: Temporal dynamics of popular top-ics. Each shade of gray represents a topic.
ing the raw continuous data into a sequence of col-lection of messages published during equally sizedtime slices. This principle is illustrated on Figure 4,which shows a possible discretization of the streampreviously depicted in Figure 2. This pre-processingstep is not trivial since it defines the granularity ofthe topic detection. A very fine discretization (i.e.short time-slices) will allow to detect topics thatwere popular during short periods whereas a dis-cretization using longer time-slices will not.
P�
P� P�
P�
P�
P�
P�
WLPH�VOLFH � �
Figure 4: A possible discretization of thestream of messages shown on Figure 2.
Shamma et al. [46] propose a simple model, PT(i.e. Peaky Topics) , similar to the classical tf-idfmodel [44] in the sense that it is based on a normal-ized term frequency metric. In order to quantify theoverall term usage, they consider each time slice asa pseudo-document composed of all the messages inthe corresponding collection. The normalized termfrequency ntf is defined as follows: ntft,i =
tft,i
cft,
where tft,i is the frequency of term t at the ith timeslice and cft is the frequency of term t in the wholemessage stream. Using that metric, bursty topicsdefined as single terms are ranked. However, someterms can be polysemous or ambiguous and a singleterm doesn’t seem to be enough to clearly identify atopic. Therefore, more sophisticated methods havebeen developed.
AlSumait et al. [1] propose an online topic model,more precisely, a non-Markov on-line LDA Gibbssampler topic model, called OLDA. Basically, LDA(i.e. Latent Dirichlet Allocation [4]) is a statis-tical generative model that relies on a hierarchi-cal Bayesian network that relates words and mes-
SIGMOD Record, June 2013 (Vol. 42, No. 2) 19
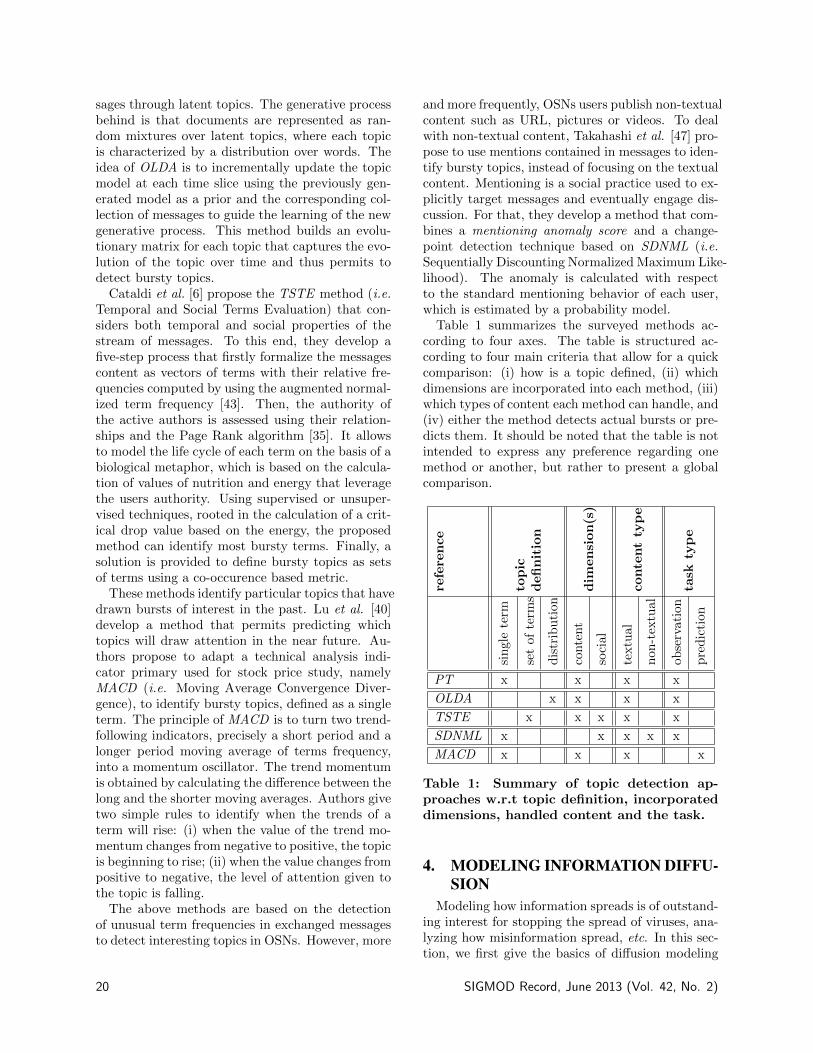
sages through latent topics. The generative processbehind is that documents are represented as ran-dom mixtures over latent topics, where each topicis characterized by a distribution over words. Theidea of OLDA is to incrementally update the topicmodel at each time slice using the previously gen-erated model as a prior and the corresponding col-lection of messages to guide the learning of the newgenerative process. This method builds an evolu-tionary matrix for each topic that captures the evo-lution of the topic over time and thus permits todetect bursty topics.
Cataldi et al. [6] propose the TSTE method (i.e.Temporal and Social Terms Evaluation) that con-siders both temporal and social properties of thestream of messages. To this end, they develop afive-step process that firstly formalize the messagescontent as vectors of terms with their relative fre-quencies computed by using the augmented normal-ized term frequency [43]. Then, the authority ofthe active authors is assessed using their relation-ships and the Page Rank algorithm [35]. It allowsto model the life cycle of each term on the basis of abiological metaphor, which is based on the calcula-tion of values of nutrition and energy that leveragethe users authority. Using supervised or unsuper-vised techniques, rooted in the calculation of a crit-ical drop value based on the energy, the proposedmethod can identify most bursty terms. Finally, asolution is provided to define bursty topics as setsof terms using a co-occurence based metric.
These methods identify particular topics that havedrawn bursts of interest in the past. Lu et al. [40]develop a method that permits predicting whichtopics will draw attention in the near future. Au-thors propose to adapt a technical analysis indi-cator primary used for stock price study, namelyMACD (i.e. Moving Average Convergence Diver-gence), to identify bursty topics, defined as a singleterm. The principle of MACD is to turn two trend-following indicators, precisely a short period and alonger period moving average of terms frequency,into a momentum oscillator. The trend momentumis obtained by calculating the di↵erence between thelong and the shorter moving averages. Authors givetwo simple rules to identify when the trends of aterm will rise: (i) when the value of the trend mo-mentum changes from negative to positive, the topicis beginning to rise; (ii) when the value changes frompositive to negative, the level of attention given tothe topic is falling.
The above methods are based on the detectionof unusual term frequencies in exchanged messagesto detect interesting topics in OSNs. However, more
and more frequently, OSNs users publish non-textualcontent such as URL, pictures or videos. To dealwith non-textual content, Takahashi et al. [47] pro-pose to use mentions contained in messages to iden-tify bursty topics, instead of focusing on the textualcontent. Mentioning is a social practice used to ex-plicitly target messages and eventually engage dis-cussion. For that, they develop a method that com-bines a mentioning anomaly score and a change-point detection technique based on SDNML (i.e.Sequentially Discounting Normalized Maximum Like-lihood). The anomaly is calculated with respectto the standard mentioning behavior of each user,which is estimated by a probability model.
Table 1 summarizes the surveyed methods ac-cording to four axes. The table is structured ac-cording to four main criteria that allow for a quickcomparison: (i) how is a topic defined, (ii) whichdimensions are incorporated into each method, (iii)which types of content each method can handle, and(iv) either the method detects actual bursts or pre-dicts them. It should be noted that the table is notintended to express any preference regarding onemethod or another, but rather to present a globalcomparison.
refe
rence
topic
definit
ion
dim
ensi
on(s
)
conte
nt
type
task
type
singl
ete
rm
set
ofte
rms
dis
trib
uti
on
conte
nt
soci
al
textu
al
non
-tex
tual
obse
rvat
ion
pre
dic
tion
PT x x x x
OLDA x x x x
TSTE x x x x x
SDNML x x x x x
MACD x x x x
Table 1: Summary of topic detection ap-proaches w.r.t topic definition, incorporateddimensions, handled content and the task.
4. MODELING INFORMATION DIFFU-SION
Modeling how information spreads is of outstand-ing interest for stopping the spread of viruses, ana-lyzing how misinformation spread, etc. In this sec-tion, we first give the basics of di↵usion modeling
20 SIGMOD Record, June 2013 (Vol. 42, No. 2)
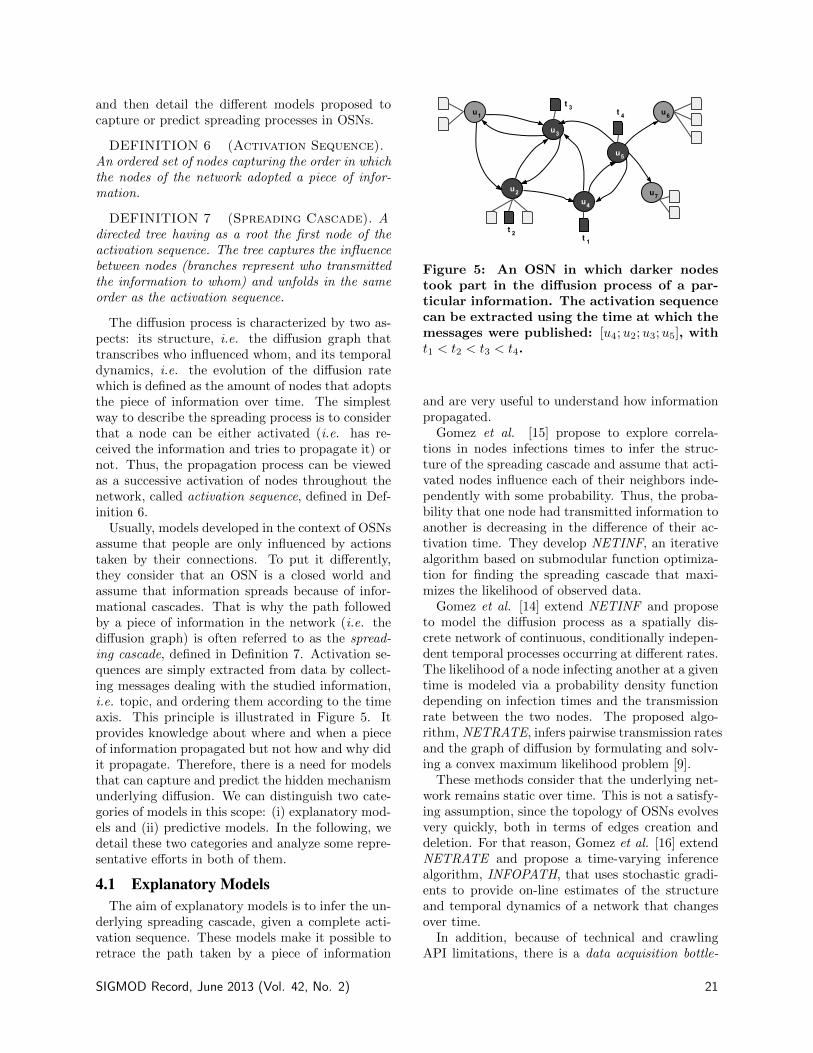
and then detail the di↵erent models proposed tocapture or predict spreading processes in OSNs.
DEFINITION 6 (Activation Sequence). .An ordered set of nodes capturing the order in whichthe nodes of the network adopted a piece of infor-mation.
DEFINITION 7 (Spreading Cascade). Adirected tree having as a root the first node of theactivation sequence. The tree captures the influencebetween nodes (branches represent who transmittedthe information to whom) and unfolds in the sameorder as the activation sequence.
The di↵usion process is characterized by two as-pects: its structure, i.e. the di↵usion graph thattranscribes who influenced whom, and its temporaldynamics, i.e. the evolution of the di↵usion ratewhich is defined as the amount of nodes that adoptsthe piece of information over time. The simplestway to describe the spreading process is to considerthat a node can be either activated (i.e. has re-ceived the information and tries to propagate it) ornot. Thus, the propagation process can be viewedas a successive activation of nodes throughout thenetwork, called activation sequence, defined in Def-inition 6.
Usually, models developed in the context of OSNsassume that people are only influenced by actionstaken by their connections. To put it di↵erently,they consider that an OSN is a closed world andassume that information spreads because of infor-mational cascades. That is why the path followedby a piece of information in the network (i.e. thedi↵usion graph) is often referred to as the spread-ing cascade, defined in Definition 7. Activation se-quences are simply extracted from data by collect-ing messages dealing with the studied information,i.e. topic, and ordering them according to the timeaxis. This principle is illustrated in Figure 5. Itprovides knowledge about where and when a pieceof information propagated but not how and why didit propagate. Therefore, there is a need for modelsthat can capture and predict the hidden mechanismunderlying di↵usion. We can distinguish two cate-gories of models in this scope: (i) explanatory mod-els and (ii) predictive models. In the following, wedetail these two categories and analyze some repre-sentative e↵orts in both of them.
4.1 Explanatory ModelsThe aim of explanatory models is to infer the un-
derlying spreading cascade, given a complete acti-vation sequence. These models make it possible toretrace the path taken by a piece of information
X�X�
X�
P�
P�
P� P� P�
P�
X�
P�
P� P� P� P� P� P�P�
WLPH
W � W �
W � W �
X�
X�
X�
X�
X� X�
X�
Figure 5: An OSN in which darker nodestook part in the di↵usion process of a par-ticular information. The activation sequencecan be extracted using the time at which themessages were published: [u4; u2; u3; u5], witht1 < t2 < t3 < t4.
and are very useful to understand how informationpropagated.
Gomez et al. [15] propose to explore correla-tions in nodes infections times to infer the struc-ture of the spreading cascade and assume that acti-vated nodes influence each of their neighbors inde-pendently with some probability. Thus, the proba-bility that one node had transmitted information toanother is decreasing in the di↵erence of their ac-tivation time. They develop NETINF, an iterativealgorithm based on submodular function optimiza-tion for finding the spreading cascade that maxi-mizes the likelihood of observed data.
Gomez et al. [14] extend NETINF and proposeto model the di↵usion process as a spatially dis-crete network of continuous, conditionally indepen-dent temporal processes occurring at di↵erent rates.The likelihood of a node infecting another at a giventime is modeled via a probability density functiondepending on infection times and the transmissionrate between the two nodes. The proposed algo-rithm, NETRATE, infers pairwise transmission ratesand the graph of di↵usion by formulating and solv-ing a convex maximum likelihood problem [9].
These methods consider that the underlying net-work remains static over time. This is not a satisfy-ing assumption, since the topology of OSNs evolvesvery quickly, both in terms of edges creation anddeletion. For that reason, Gomez et al. [16] extendNETRATE and propose a time-varying inferencealgorithm, INFOPATH, that uses stochastic gradi-ents to provide on-line estimates of the structureand temporal dynamics of a network that changesover time.
In addition, because of technical and crawlingAPI limitations, there is a data acquisition bottle-
SIGMOD Record, June 2013 (Vol. 42, No. 2) 21
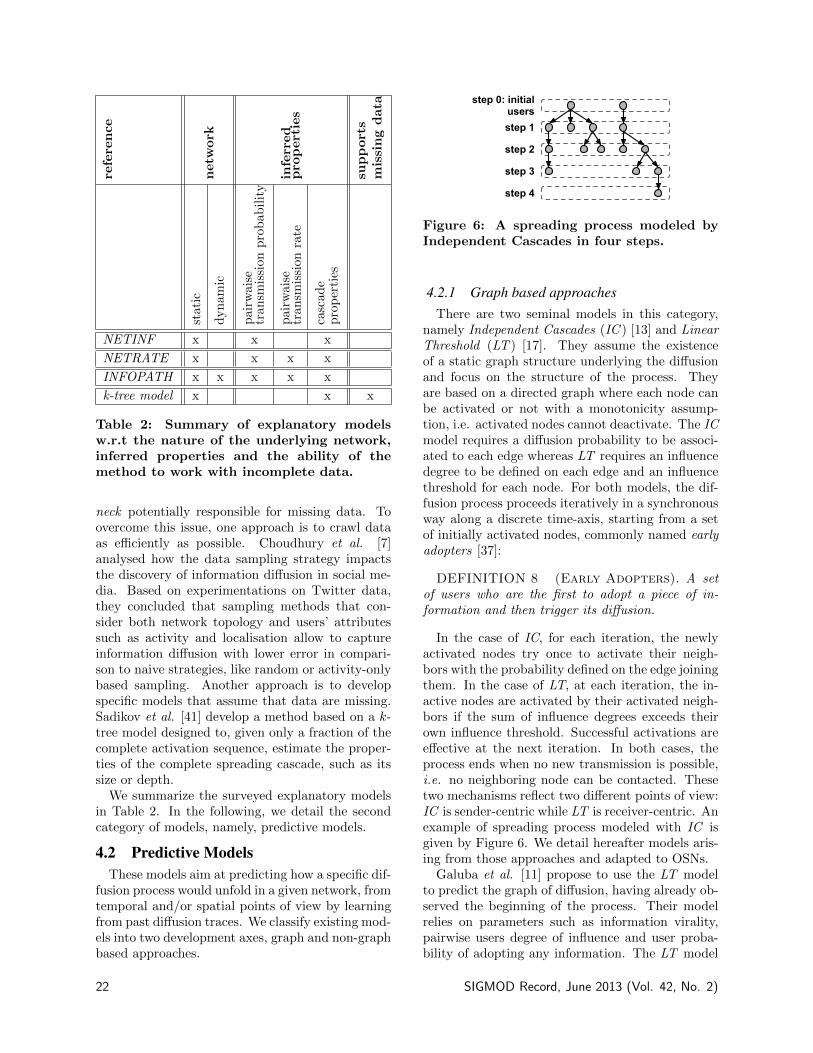
refe
rence
netw
ork
infe
rred
pro
pert
ies
support
sm
issi
ng
data
stat
ic
dynam
ic
pai
rwai
setr
ansm
issi
onpro
bab
ility
pai
rwai
setr
ansm
issi
onra
te
casc
ade
pro
per
ties
NETINF x x x
NETRATE x x x x
INFOPATH x x x x x
k-tree model x x x
Table 2: Summary of explanatory modelsw.r.t the nature of the underlying network,inferred properties and the ability of themethod to work with incomplete data.
neck potentially responsible for missing data. Toovercome this issue, one approach is to crawl dataas e�ciently as possible. Choudhury et al. [7]analysed how the data sampling strategy impactsthe discovery of information di↵usion in social me-dia. Based on experimentations on Twitter data,they concluded that sampling methods that con-sider both network topology and users’ attributessuch as activity and localisation allow to captureinformation di↵usion with lower error in compari-son to naive strategies, like random or activity-onlybased sampling. Another approach is to developspecific models that assume that data are missing.Sadikov et al. [41] develop a method based on a k-tree model designed to, given only a fraction of thecomplete activation sequence, estimate the proper-ties of the complete spreading cascade, such as itssize or depth.
We summarize the surveyed explanatory modelsin Table 2. In the following, we detail the secondcategory of models, namely, predictive models.
4.2 Predictive ModelsThese models aim at predicting how a specific dif-
fusion process would unfold in a given network, fromtemporal and/or spatial points of view by learningfrom past di↵usion traces. We classify existing mod-els into two development axes, graph and non-graphbased approaches.
VWHS����LQLWLDO�XVHUVVWHS��
VWHS��
VWHS��
VWHS��
Figure 6: A spreading process modeled byIndependent Cascades in four steps.
4.2.1 Graph based approachesThere are two seminal models in this category,
namely Independent Cascades (IC ) [13] and LinearThreshold (LT ) [17]. They assume the existenceof a static graph structure underlying the di↵usionand focus on the structure of the process. Theyare based on a directed graph where each node canbe activated or not with a monotonicity assump-tion, i.e. activated nodes cannot deactivate. The ICmodel requires a di↵usion probability to be associ-ated to each edge whereas LT requires an influencedegree to be defined on each edge and an influencethreshold for each node. For both models, the dif-fusion process proceeds iteratively in a synchronousway along a discrete time-axis, starting from a setof initially activated nodes, commonly named earlyadopters [37]:
DEFINITION 8 (Early Adopters). A setof users who are the first to adopt a piece of in-formation and then trigger its di↵usion.
In the case of IC, for each iteration, the newlyactivated nodes try once to activate their neigh-bors with the probability defined on the edge joiningthem. In the case of LT, at each iteration, the in-active nodes are activated by their activated neigh-bors if the sum of influence degrees exceeds theirown influence threshold. Successful activations aree↵ective at the next iteration. In both cases, theprocess ends when no new transmission is possible,i.e. no neighboring node can be contacted. Thesetwo mechanisms reflect two di↵erent points of view:IC is sender-centric while LT is receiver-centric. Anexample of spreading process modeled with IC isgiven by Figure 6. We detail hereafter models aris-ing from those approaches and adapted to OSNs.
Galuba et al. [11] propose to use the LT modelto predict the graph of di↵usion, having already ob-served the beginning of the process. Their modelrelies on parameters such as information virality,pairwise users degree of influence and user proba-bility of adopting any information. The LT model
22 SIGMOD Record, June 2013 (Vol. 42, No. 2)
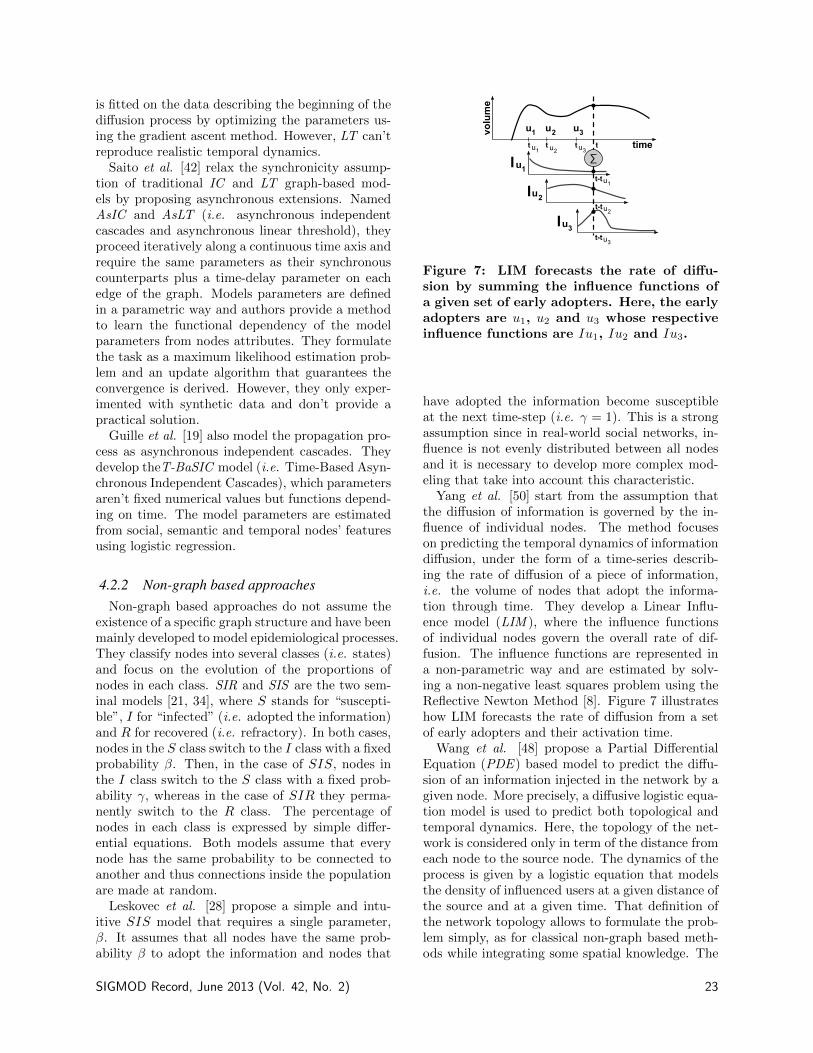
is fitted on the data describing the beginning of thedi↵usion process by optimizing the parameters us-ing the gradient ascent method. However, LT can’treproduce realistic temporal dynamics.
Saito et al. [42] relax the synchronicity assump-tion of traditional IC and LT graph-based mod-els by proposing asynchronous extensions. NamedAsIC and AsLT (i.e. asynchronous independentcascades and asynchronous linear threshold), theyproceed iteratively along a continuous time axis andrequire the same parameters as their synchronouscounterparts plus a time-delay parameter on eachedge of the graph. Models parameters are definedin a parametric way and authors provide a methodto learn the functional dependency of the modelparameters from nodes attributes. They formulatethe task as a maximum likelihood estimation prob-lem and an update algorithm that guarantees theconvergence is derived. However, they only exper-imented with synthetic data and don’t provide apractical solution.
Guille et al. [19] also model the propagation pro-cess as asynchronous independent cascades. Theydevelop theT-BaSIC model (i.e. Time-Based Asyn-chronous Independent Cascades), which parametersaren’t fixed numerical values but functions depend-ing on time. The model parameters are estimatedfrom social, semantic and temporal nodes’ featuresusing logistic regression.
4.2.2 Non-graph based approachesNon-graph based approaches do not assume the
existence of a specific graph structure and have beenmainly developed to model epidemiological processes.They classify nodes into several classes (i.e. states)and focus on the evolution of the proportions ofnodes in each class. SIR and SIS are the two sem-inal models [21, 34], where S stands for “suscepti-ble”, I for “infected” (i.e. adopted the information)and R for recovered (i.e. refractory). In both cases,nodes in the S class switch to the I class with a fixedprobability �. Then, in the case of SIS, nodes inthe I class switch to the S class with a fixed prob-ability �, whereas in the case of SIR they perma-nently switch to the R class. The percentage ofnodes in each class is expressed by simple di↵er-ential equations. Both models assume that everynode has the same probability to be connected toanother and thus connections inside the populationare made at random.
Leskovec et al. [28] propose a simple and intu-itive SIS model that requires a single parameter,�. It assumes that all nodes have the same prob-ability � to adopt the information and nodes that
, , ,
X X X� � �
X�
X�
X�
,
,
,
YROXPH
WLPHW W WX� X� X��W
W�WX�
W�WX�
W�WX�
Figure 7: LIM forecasts the rate of di↵u-sion by summing the influence functions ofa given set of early adopters. Here, the earlyadopters are u1, u2 and u3 whose respectiveinfluence functions are Iu1, Iu2 and Iu3.
have adopted the information become susceptibleat the next time-step (i.e. � = 1). This is a strongassumption since in real-world social networks, in-fluence is not evenly distributed between all nodesand it is necessary to develop more complex mod-eling that take into account this characteristic.
Yang et al. [50] start from the assumption thatthe di↵usion of information is governed by the in-fluence of individual nodes. The method focuseson predicting the temporal dynamics of informationdi↵usion, under the form of a time-series describ-ing the rate of di↵usion of a piece of information,i.e. the volume of nodes that adopt the informa-tion through time. They develop a Linear Influ-ence model (LIM ), where the influence functionsof individual nodes govern the overall rate of dif-fusion. The influence functions are represented ina non-parametric way and are estimated by solv-ing a non-negative least squares problem using theReflective Newton Method [8]. Figure 7 illustrateshow LIM forecasts the rate of di↵usion from a setof early adopters and their activation time.
Wang et al. [48] propose a Partial Di↵erentialEquation (PDE ) based model to predict the di↵u-sion of an information injected in the network by agiven node. More precisely, a di↵usive logistic equa-tion model is used to predict both topological andtemporal dynamics. Here, the topology of the net-work is considered only in term of the distance fromeach node to the source node. The dynamics of theprocess is given by a logistic equation that modelsthe density of influenced users at a given distance ofthe source and at a given time. That definition ofthe network topology allows to formulate the prob-lem simply, as for classical non-graph based meth-ods while integrating some spatial knowledge. The
SIGMOD Record, June 2013 (Vol. 42, No. 2) 23
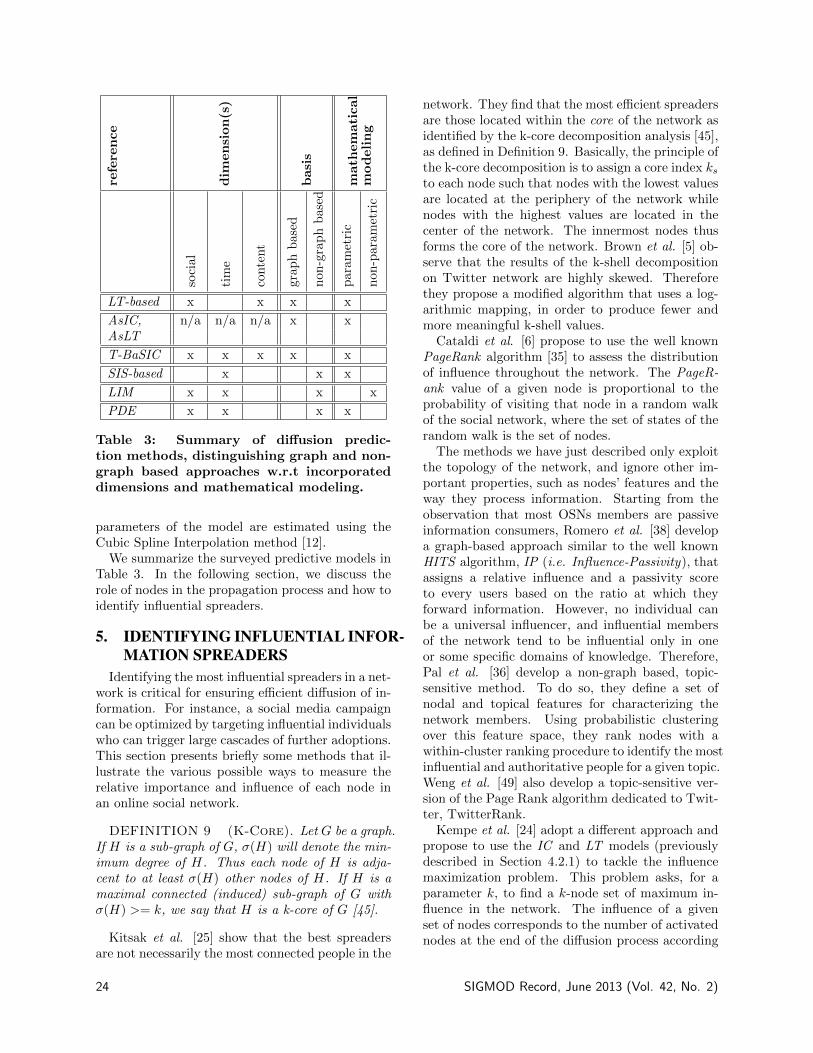
refe
rence
dim
ensi
on(s
)
basi
s
math
em
ati
cal
modeling
soci
al
tim
e
conte
nt
grap
hbas
ed
non
-gra
ph
bas
ed
par
amet
ric
non
-par
amet
ric
LT-based x x x x
AsIC, n/a n/a n/a x xAsLT
T-BaSIC x x x x x
SIS-based x x x
LIM x x x x
PDE x x x x
Table 3: Summary of di↵usion predic-tion methods, distinguishing graph and non-graph based approaches w.r.t incorporateddimensions and mathematical modeling.
parameters of the model are estimated using theCubic Spline Interpolation method [12].
We summarize the surveyed predictive models inTable 3. In the following section, we discuss therole of nodes in the propagation process and how toidentify influential spreaders.
5. IDENTIFYING INFLUENTIAL INFOR-MATION SPREADERS
Identifying the most influential spreaders in a net-work is critical for ensuring e�cient di↵usion of in-formation. For instance, a social media campaigncan be optimized by targeting influential individualswho can trigger large cascades of further adoptions.This section presents briefly some methods that il-lustrate the various possible ways to measure therelative importance and influence of each node inan online social network.
DEFINITION 9 (K-Core). Let G be a graph.If H is a sub-graph of G, �(H) will denote the min-imum degree of H. Thus each node of H is adja-cent to at least �(H) other nodes of H. If H is amaximal connected (induced) sub-graph of G with�(H) >= k, we say that H is a k-core of G [45].
Kitsak et al. [25] show that the best spreadersare not necessarily the most connected people in the
network. They find that the most e�cient spreadersare those located within the core of the network asidentified by the k-core decomposition analysis [45],as defined in Definition 9. Basically, the principle ofthe k-core decomposition is to assign a core index ks
to each node such that nodes with the lowest valuesare located at the periphery of the network whilenodes with the highest values are located in thecenter of the network. The innermost nodes thusforms the core of the network. Brown et al. [5] ob-serve that the results of the k-shell decompositionon Twitter network are highly skewed. Thereforethey propose a modified algorithm that uses a log-arithmic mapping, in order to produce fewer andmore meaningful k-shell values.
Cataldi et al. [6] propose to use the well knownPageRank algorithm [35] to assess the distributionof influence throughout the network. The PageR-ank value of a given node is proportional to theprobability of visiting that node in a random walkof the social network, where the set of states of therandom walk is the set of nodes.
The methods we have just described only exploitthe topology of the network, and ignore other im-portant properties, such as nodes’ features and theway they process information. Starting from theobservation that most OSNs members are passiveinformation consumers, Romero et al. [38] developa graph-based approach similar to the well knownHITS algorithm, IP (i.e. Influence-Passivity), thatassigns a relative influence and a passivity scoreto every users based on the ratio at which theyforward information. However, no individual canbe a universal influencer, and influential membersof the network tend to be influential only in oneor some specific domains of knowledge. Therefore,Pal et al. [36] develop a non-graph based, topic-sensitive method. To do so, they define a set ofnodal and topical features for characterizing thenetwork members. Using probabilistic clusteringover this feature space, they rank nodes with awithin-cluster ranking procedure to identify the mostinfluential and authoritative people for a given topic.Weng et al. [49] also develop a topic-sensitive ver-sion of the Page Rank algorithm dedicated to Twit-ter, TwitterRank.
Kempe et al. [24] adopt a di↵erent approach andpropose to use the IC and LT models (previouslydescribed in Section 4.2.1) to tackle the influencemaximization problem. This problem asks, for aparameter k, to find a k-node set of maximum in-fluence in the network. The influence of a givenset of nodes corresponds to the number of activatednodes at the end of the di↵usion process according
24 SIGMOD Record, June 2013 (Vol. 42, No. 2)
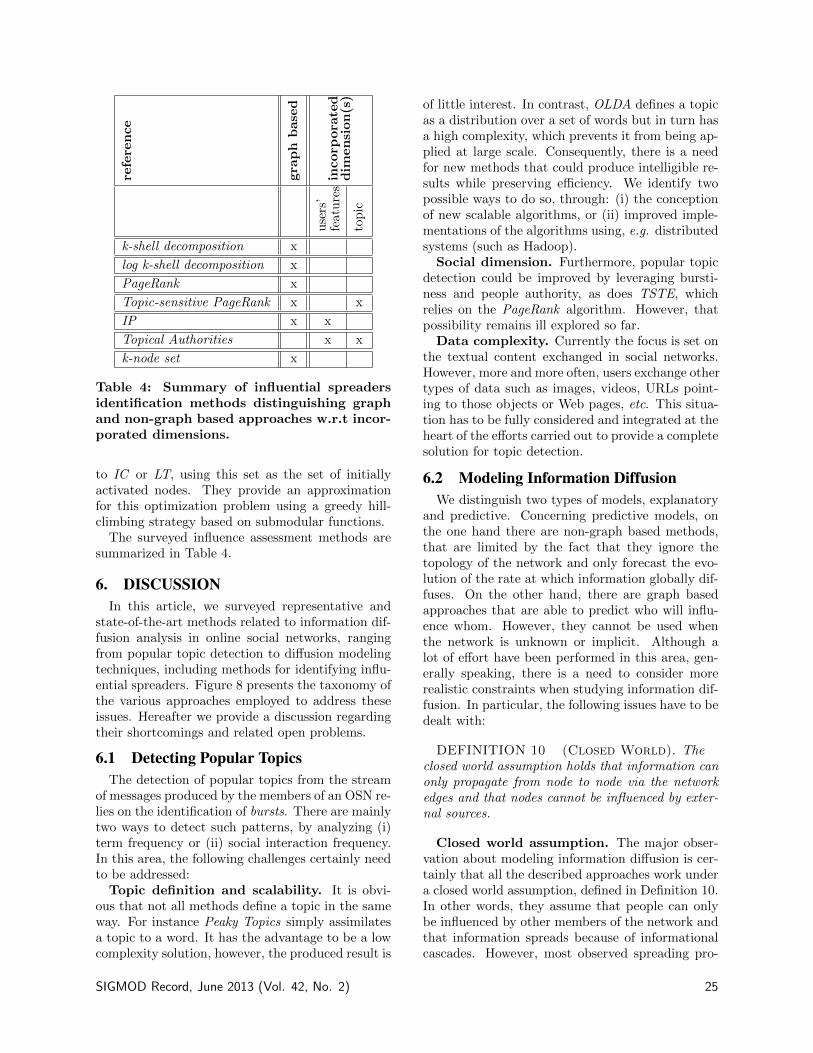
refe
rence
gra
ph
base
d
incorp
ora
ted
dim
ensi
on(s
)
use
rs’
feat
ure
s
topic
k-shell decomposition x
log k-shell decomposition x
PageRank x
Topic-sensitive PageRank x x
IP x x
Topical Authorities x x
k-node set x
Table 4: Summary of influential spreadersidentification methods distinguishing graphand non-graph based approaches w.r.t incor-porated dimensions.
to IC or LT, using this set as the set of initiallyactivated nodes. They provide an approximationfor this optimization problem using a greedy hill-climbing strategy based on submodular functions.
The surveyed influence assessment methods aresummarized in Table 4.
6. DISCUSSIONIn this article, we surveyed representative and
state-of-the-art methods related to information dif-fusion analysis in online social networks, rangingfrom popular topic detection to di↵usion modelingtechniques, including methods for identifying influ-ential spreaders. Figure 8 presents the taxonomy ofthe various approaches employed to address theseissues. Hereafter we provide a discussion regardingtheir shortcomings and related open problems.
6.1 Detecting Popular TopicsThe detection of popular topics from the stream
of messages produced by the members of an OSN re-lies on the identification of bursts. There are mainlytwo ways to detect such patterns, by analyzing (i)term frequency or (ii) social interaction frequency.In this area, the following challenges certainly needto be addressed:
Topic definition and scalability. It is obvi-ous that not all methods define a topic in the sameway. For instance Peaky Topics simply assimilatesa topic to a word. It has the advantage to be a lowcomplexity solution, however, the produced result is
of little interest. In contrast, OLDA defines a topicas a distribution over a set of words but in turn hasa high complexity, which prevents it from being ap-plied at large scale. Consequently, there is a needfor new methods that could produce intelligible re-sults while preserving e�ciency. We identify twopossible ways to do so, through: (i) the conceptionof new scalable algorithms, or (ii) improved imple-mentations of the algorithms using, e.g. distributedsystems (such as Hadoop).
Social dimension. Furthermore, popular topicdetection could be improved by leveraging bursti-ness and people authority, as does TSTE, whichrelies on the PageRank algorithm. However, thatpossibility remains ill explored so far.
Data complexity. Currently the focus is set onthe textual content exchanged in social networks.However, more and more often, users exchange othertypes of data such as images, videos, URLs point-ing to those objects or Web pages, etc. This situa-tion has to be fully considered and integrated at theheart of the e↵orts carried out to provide a completesolution for topic detection.
6.2 Modeling Information DiffusionWe distinguish two types of models, explanatory
and predictive. Concerning predictive models, onthe one hand there are non-graph based methods,that are limited by the fact that they ignore thetopology of the network and only forecast the evo-lution of the rate at which information globally dif-fuses. On the other hand, there are graph basedapproaches that are able to predict who will influ-ence whom. However, they cannot be used whenthe network is unknown or implicit. Although alot of e↵ort have been performed in this area, gen-erally speaking, there is a need to consider morerealistic constraints when studying information dif-fusion. In particular, the following issues have to bedealt with:
DEFINITION 10 (Closed World). Theclosed world assumption holds that information canonly propagate from node to node via the networkedges and that nodes cannot be influenced by exter-nal sources.
Closed world assumption. The major obser-vation about modeling information di↵usion is cer-tainly that all the described approaches work undera closed world assumption, defined in Definition 10.In other words, they assume that people can onlybe influenced by other members of the network andthat information spreads because of informationalcascades. However, most observed spreading pro-
SIGMOD Record, June 2013 (Vol. 42, No. 2) 25
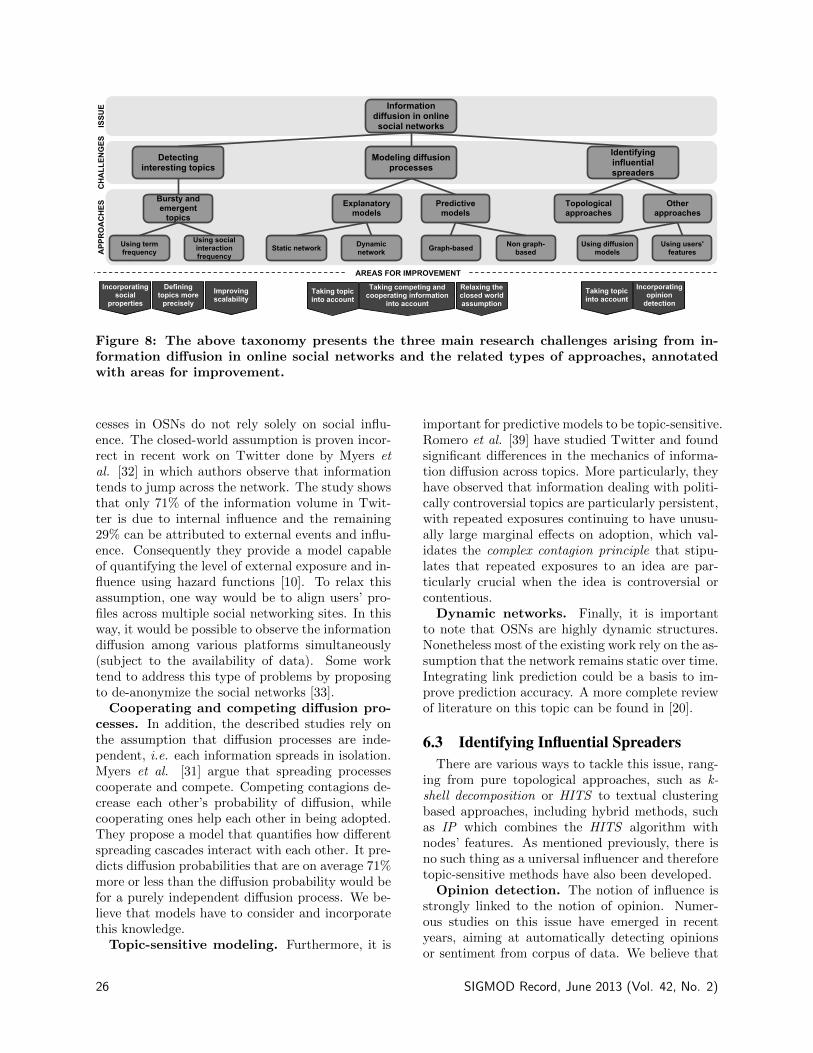
,QIRUPDWLRQ�GLIIXVLRQ�LQ�RQOLQH�VRFLDO�QHWZRUNV
'HWHFWLQJ�LQWHUHVWLQJ�WRSLFV
0RGHOLQJ�GLIIXVLRQ�SURFHVVHV
,GHQWLI\LQJ�LQIOXHQWLDO�VSUHDGHUV
%XUVW\�DQG�HPHUJHQW�WRSLFV
([SODQDWRU\�PRGHOV
3UHGLFWLYH�PRGHOV
7RSRORJLFDO�DSSURDFKHV
2WKHU�DSSURDFKHV
8VLQJ�WHUP�IUHTXHQF\
8VLQJ�VRFLDO�LQWHUDFWLRQ�IUHTXHQF\
6WDWLF�QHWZRUN '\QDPLF�QHWZRUN *UDSK�EDVHG 1RQ�JUDSK�
EDVHG8VLQJ�GLIIXVLRQ�
PRGHOV8VLQJ�XVHUV�IHDWXUHV
&+$//
(1*(6
,668
($33
52$&+(6
,QFRUSRUDWLQJ�RSLQLRQ�GHWHFWLRQ
7DNLQJ�WRSLF�LQWR�DFFRXQW
7DNLQJ�FRPSHWLQJ�DQG�FRRSHUDWLQJ�LQIRUPDWLRQ�
LQWR�DFFRXQW
'HILQLQJ�WRSLFV�PRUH�SUHFLVHO\
,PSURYLQJ�VFDODELOLW\
,QFRUSRUDWLQJ�VRFLDO�
SURSHUWLHV7DNLQJ�WRSLF�LQWR�DFFRXQW
����$5($6�)25�,03529(0(17���
5HOD[LQJ�WKH�FORVHG�ZRUOG�DVVXPSWLRQ
Figure 8: The above taxonomy presents the three main research challenges arising from in-formation di↵usion in online social networks and the related types of approaches, annotatedwith areas for improvement.
cesses in OSNs do not rely solely on social influ-ence. The closed-world assumption is proven incor-rect in recent work on Twitter done by Myers etal. [32] in which authors observe that informationtends to jump across the network. The study showsthat only 71% of the information volume in Twit-ter is due to internal influence and the remaining29% can be attributed to external events and influ-ence. Consequently they provide a model capableof quantifying the level of external exposure and in-fluence using hazard functions [10]. To relax thisassumption, one way would be to align users’ pro-files across multiple social networking sites. In thisway, it would be possible to observe the informationdi↵usion among various platforms simultaneously(subject to the availability of data). Some worktend to address this type of problems by proposingto de-anonymize the social networks [33].
Cooperating and competing di↵usion pro-cesses. In addition, the described studies rely onthe assumption that di↵usion processes are inde-pendent, i.e. each information spreads in isolation.Myers et al. [31] argue that spreading processescooperate and compete. Competing contagions de-crease each other’s probability of di↵usion, whilecooperating ones help each other in being adopted.They propose a model that quantifies how di↵erentspreading cascades interact with each other. It pre-dicts di↵usion probabilities that are on average 71%more or less than the di↵usion probability would befor a purely independent di↵usion process. We be-lieve that models have to consider and incorporatethis knowledge.
Topic-sensitive modeling. Furthermore, it is
important for predictive models to be topic-sensitive.Romero et al. [39] have studied Twitter and foundsignificant di↵erences in the mechanics of informa-tion di↵usion across topics. More particularly, theyhave observed that information dealing with politi-cally controversial topics are particularly persistent,with repeated exposures continuing to have unusu-ally large marginal e↵ects on adoption, which val-idates the complex contagion principle that stipu-lates that repeated exposures to an idea are par-ticularly crucial when the idea is controversial orcontentious.
Dynamic networks. Finally, it is importantto note that OSNs are highly dynamic structures.Nonetheless most of the existing work rely on the as-sumption that the network remains static over time.Integrating link prediction could be a basis to im-prove prediction accuracy. A more complete reviewof literature on this topic can be found in [20].
6.3 Identifying Influential SpreadersThere are various ways to tackle this issue, rang-
ing from pure topological approaches, such as k-shell decomposition or HITS to textual clusteringbased approaches, including hybrid methods, suchas IP which combines the HITS algorithm withnodes’ features. As mentioned previously, there isno such thing as a universal influencer and thereforetopic-sensitive methods have also been developed.
Opinion detection. The notion of influence isstrongly linked to the notion of opinion. Numer-ous studies on this issue have emerged in recentyears, aiming at automatically detecting opinionsor sentiment from corpus of data. We believe that
26 SIGMOD Record, June 2013 (Vol. 42, No. 2)
it might be interesting to include this kind of workin the context of information di↵usion. Work deal-ing with the di↵usion of opinions themselves haveemerged [29] and it seems that there is an interestto couple these approaches.
6.4 ApplicationsEven if there are a lot of contributions in the
domain of online social networks dynamics analy-sis, we can remark that implementations are rarelyprovided for re-use. What is more, available imple-mentations require di↵erent formatting of the in-put data and are written using various program-ming languages, which makes it hard to evaluate orcompare existing techniques. SONDY [18] intendsto facilitate the implementation and distribution oftechniques for online social networks data mining.It is an open-source tool that provides data pre-processing functionalities and implements some ofthe methods reviewed in this paper for topic de-tection and influential spreaders identification. Itfeatures a user-friendly interface and proposes visu-alizations for topic trends and network structure.
7. REFERENCES[1] L. AlSumait, D. Barbara, and C. Domeniconi.
On-line lda: Adaptive topic models for miningtext streams with applications to topicdetection and tracking. In ICDM ’08, pages3–12, 2008.
[2] A. Anagnostopoulos, R. Kumar, andM. Mahdian. Influence and correlation insocial networks. In KDD ’08, pages 7–15,2008.
[3] E. Bakshy, I. Rosenn, C. Marlow, andL. Adamic. The role of social networks ininformation di↵usion. In WWW ’12, pages519–528, 2012.
[4] D. Blei, A. Ng, and M. Jordan. Latentdirichlet allocation. The Journal of MachineLearning Research, 3:993–1022, 2003.
[5] P. Brown and J. Feng. Measuring userinfluence on Twitter using modified k-shelldecomposition. In ICWSM ’11 Workshops,pages 18–23, 2011.
[6] M. Cataldi, L. Di Caro, and C. Schifanella.Emerging topic detection on Twitter based ontemporal and social terms evaluation. InMDMKDD ’10, pages 4–13, 2010.
[7] M. D. Choudhury, Y.-R. Lin, H. Sundaram,K. S. Candan, L. Xie, and A. Kelliher. Howdoes the data sampling strategy impact thediscovery of information di↵usion in socialmedia? In ICWSM ’10, pages 34–41, 2010.
[8] T. F. Coleman and Y. Li. A reflective newtonmethod for minimizing a quadratic functionsubject to bounds on some of the variables.SIAM J. on Optimization, 6(4):1040–1058,Apr. 1996.
[9] I. CVX Research. CVX: Matlab software fordisciplined convex programming, version 2.0beta. http://cvxr.com/cvx, sep 2012.
[10] R. C. Elandt-Johnson and N. L. Johnson.Survival Models and Data Analysis. JohnWiley and Sons, 1980/1999.
[11] W. Galuba, K. Aberer, D. Chakraborty,Z. Despotovic, and W. Kellerer. Outtweetingthe twitterers - predicting informationcascades in microblogs. In WOSN ’10, pages3–11, 2010.
[12] C. F. Gerald and P. O. Wheatley. Appliednumerical analysis with MAPLE; 7th ed.Addison-Wesley, Reading, MA, 2004.
[13] J. Goldenberg, B. Libai, and E. Muller. Talkof the network: A complex systems look atthe underlying process of word-of-mouth.Marketing Letters, 2001.
[14] M. Gomez-Rodriguez, D. Balduzzi, andB. Scholkopf. Uncovering the temporaldynamics of di↵usion networks. In ICML ’11,pages 561–568, 2011.
[15] M. Gomez Rodriguez, J. Leskovec, andA. Krause. Inferring networks of di↵usion andinfluence. In KDD ’10, pages 1019–1028, 2010.
[16] M. Gomez-Rodriguez, J. Leskovec, andB. Schokopf. Structure and dynamics ofinformation pathways in online media. InWSDM ’13, pages 23–32, 2013.
[17] M. Granovetter. Threshold models ofcollective behavior. American journal ofsociology, pages 1420–1443, 1978.
[18] A. Guille, C. Favre, H. Hacid, and D. Zighed.Sondy: An open source platform for socialdynamics mining and analysis. InSIGMOD ’13, (demonstration) 2013.
[19] A. Guille and H. Hacid. A predictive modelfor the temporal dynamics of informationdi↵usion in online social networks. InWWW ’12 Companion, pages 1145–1152,2012.
[20] M. A. Hasan and M. J. Zaki. A survey of linkprediction in social networks. In SocialNetwork Data Analytics, pages 243–275.Springer, 2011.
[21] H. W. Hethcote. The mathematics ofinfectious diseases. SIAM REVIEW,42(4):599–653, 2000.
[22] P. N. Howard and A. Du↵y. Opening closed
SIGMOD Record, June 2013 (Vol. 42, No. 2) 27

regimes, what was the role of social mediaduring the arab spring? Project onInformation Technology and Political Islam,pages 1–30, 2011.
[23] A. Hughes and L. Palen. Twitter adoptionand use in mass convergence and emergencyevents. International Journal of EmergencyManagement, 6(3):248–260, 2009.
[24] D. Kempe. Maximizing the spread of influencethrough a social network. In KDD ’03, pages137–146, 2003.
[25] M. Kitsak, L. Gallos, S. Havlin, F. Liljeros,L. Muchnik, H. Stanley, and H. Makse.Identification of influential spreaders incomplex networks. Nature Physics,6(11):888–893, Aug 2010.
[26] J. Kleinberg. Bursty and hierarchicalstructure in streams. In KDD ’02, pages91–101, 2002.
[27] J. Leskovec, L. Backstrom, and J. Kleinberg.Meme-tracking and the dynamics of the newscycle. In KDD ’09, pages 497–506, 2009.
[28] J. Leskovec, M. Mcglohon, C. Faloutsos,N. Glance, and M. Hurst. Cascading behaviorin large blog graphs. In SDM ’07, pages551–556, (short paper) 2007.
[29] L. Li, A. Scaglione, A. Swami, and Q. Zhao.Phase transition in opinion di↵usion in socialnetworks. In ICASSP ’12, pages 3073–3076,2012.
[30] J. Makkonen, H. Ahonen-Myka, andM. Salmenkivi. Simple semantics in topicdetection and tracking. Inf. Retr.,7(3-4):347–368, Sept. 2004.
[31] S. Myers and J. Leskovec. Clash of thecontagions: Cooperation and competition ininformation di↵usion. In ICDM ’12, pages539–548, 2012.
[32] S. A. Myers, C. Zhu, and J. Leskovec.Information di↵usion and external influence innetworks. In KDD ’12, pages 33–41, 2012.
[33] A. Narayanan and V. Shmatikov.De-anonymizing social networks. In SP ’09,pages 173–187, 2009.
[34] M. E. J. Newman. The structure and functionof complex networks. SIAM Review,45:167–256, 2003.
[35] L. Page, S. Brin, R. Motwani, andT. Winograd. The pagerank citation ranking:Bringing order to the web. In WWW ’98,pages 161–172, 1998.
[36] A. Pal and S. Counts. Identifying topicalauthorities in microblogs. In WSDM ’11,pages 45–54, 2011.
[37] E. M. Rogers. Di↵usion of Innovations, 5thEdition. Free Press, 5th edition, aug 2003.
[38] D. Romero, W. Galuba, S. Asur, andB. Huberman. Influence and passivity insocial media. In ECML/PKDD ’11, pages18–33, 2011.
[39] D. M. Romero, B. Meeder, and J. Kleinberg.Di↵erences in the mechanics of informationdi↵usion across topics: idioms, politicalhashtags, and complex contagion on Twitter.In WWW ’11, pages 695–704, 2011.
[40] L. Rong and Y. Qing. Trends analysis of newstopics on Twitter. International Journal ofMachine Learning and Computing,2(3):327–332, 2012.
[41] E. Sadikov, M. Medina, J. Leskovec, andH. Garcia-Molina. Correcting for missing datain information cascades. In WSDM ’11, pages55–64, 2011.
[42] K. Saito, K. Ohara, Y. Yamagishi,M. Kimura, and H. Motoda. Learningdi↵usion probability based on node attributesin social networks. In ISMIS ’11, pages153–162, 2011.
[43] G. Salton and C. Buckley. Term-weightingapproaches in automatic text retrieval. Inf.Process. Manage., 24(5):513–523, 1988.
[44] G. Salton and M. J. McGill. Introduction toModern Information Retrieval. McGraw-Hill,1986.
[45] S. B. Seidman. Network structure andminimum degree. Social Networks, 5(3):269 –287, 1983.
[46] D. A. Shamma, L. Kennedy, and E. F.Churchill. Peaks and persistence: modelingthe shape of microblog conversations. InCSCW ’11, pages 355–358, (short paper)2011.
[47] T. Takahashi, R. Tomioka, and K. Yamanishi.Discovering emerging topics in social streamsvia link anomaly detection. In ICDM ’11,pages 1230–1235, 2011.
[48] F. Wang, H. Wang, and K. Xu. Di↵usivelogistic model towards predicting informationdi↵usion in online social networks. InICDCS ’12 Workshops, pages 133–139, 2012.
[49] J. Weng, E.-P. Lim, J. Jiang, and Q. He.TwitterRank: finding topic-sensitiveinfluential twitterers. In WSDM ’10, pages261–270, 2010.
[50] J. Yang and J. Leskovec. Modelinginformation di↵usion in implicit networks. InICDM ’10, pages 599–608, 2010.
28 SIGMOD Record, June 2013 (Vol. 42, No. 2)
Discovering Semantic Relations from the Web andOrganizing them with PATTY
Ndapandula Nakashole, Gerhard Weikum, Fabian SuchanekMax Planck Institute for Informatics, Saarbruecken, Germany{nnakasho,weikum,suchanek}@mpi-inf.mpg.de
ABSTRACTPATTY is a system for automatically distilling relationalpatterns from the Web, for example, the pattern “X cov-ered Y” between a singer and someone else’s song. Wehave extracted a large collection of such patterns and or-ganized them in a taxonomic manner, similar in style tothe WordNet thesaurus but capturing relations (binarypredicates) instead of concepts and classes (unary pred-icates). The patterns are organized by semantic typesand synonyms, and they form a hierarchy based on sub-sumptions. For example, “X covered Y” is subsumed by“X sang Y”, which in turn is subsumed by “X performedY” (where X can be any musician, not just a singer).In this paper we give an overview of the PATTY sys-tem and the resulting collections of relational patterns.We discuss the four main components of PATTY’s ar-chitecture and a variety of use cases, including the para-phrasing of relations, and semantic search over subject-predicate-object triples. This kind of search can handleentities, relations, semantic types, noun phrases, and re-lational phrases.
1. INTRODUCTIONOngoing efforts to extract information from Web data
have produced large-scale knowledge bases (KBs) [1, 2,3, 13]. These KBs store information about real-world en-tities, such as people, cities, or movies. The KBs mostlyuse the RDF triple format to store the data. Each triplecontains a subject, a predicate, and an object. For ex-ample, the fact that Amy Winehouse was born in SouthGate would be stored as the triple 〈Amy Winehouse, was-BornIn, South Gate〉. The predicates of such triples arecalled relations. Most KBs contain a limited numberof “standard” relations such as wasBornIn and isMar-riedTo. However, there are many more relations that areoften missing. For example, in the music domain, onemight be interested in relations such as sang, covered-Song and hadDuetWith. Before even populating suchrelations with triples, one has to find which relations ex-ist. With the PATTY project [10, 11, 12], we embarkedon automatically mining new relations from the Web.
Mining relations from the Web is difficult, becauserelationships between entities are expressed in highlydiverse and noisy forms in natural-language text. Forexample, Web sources may use the verbal phrases 〈X’svoice in Y〉 or 〈X’s performance of the song Y〉 to saythat a person sang a song. We call these verbal phrasespatterns, as opposed to the canonical relation sang. Sothe same relation can be expressed with different pat-terns. Conversely, the same pattern may denote differentrelations. For example, 〈X covered Y〉 could refer toa singer performing someone else’s song or to a bookcovering a historic event (e.g., “War and Peace coveredNapoleonic Wars”).
Understanding the semantic equivalence of patternsand mapping them to canonical relations is the core chal-lenge in relational information extraction (IE). This prob-lem arises both in seed-based distantly supervised IEwith explicitly specified target relations, and in OpenIE where the relations themselves are unknown a prioriand need to be discovered in an unsupervised manner.Comprehensively gathering and systematically organiz-ing patterns for an open set of relations is the problemaddressed by the PATTY system.
The approach we take in PATTY is to systematicallyharvest textual patterns from text corpora. We groupsynonymous patterns into pattern synsets, so that pat-terns that express the same relationship are grouped to-gether. We organize these synsets into a subsumptionhierarchy, where more general relationships (such asperformed) subsume more special relationships (suchas sang). PATTY makes use of a generalized notionof ontologically typed patterns. These patterns have atype signature for the entities that they connect, as in〈〈person〉 sang 〈song〉〉. The type signatures are derivedthrough the use of a dictionary of entity-class pairs, pro-vided by knowledge bases like YAGO[13], Freebase [2],or DBpedia[1].
This paper gives an overview of PATTY based onwork reported in [10], [11], and [12]. We first present thedesign of the main components of PATTY’s architecture:the pattern extraction, the SOL pattern model, the pattern
SIGMOD Record, June 2013 (Vol. 42, No. 2) 29
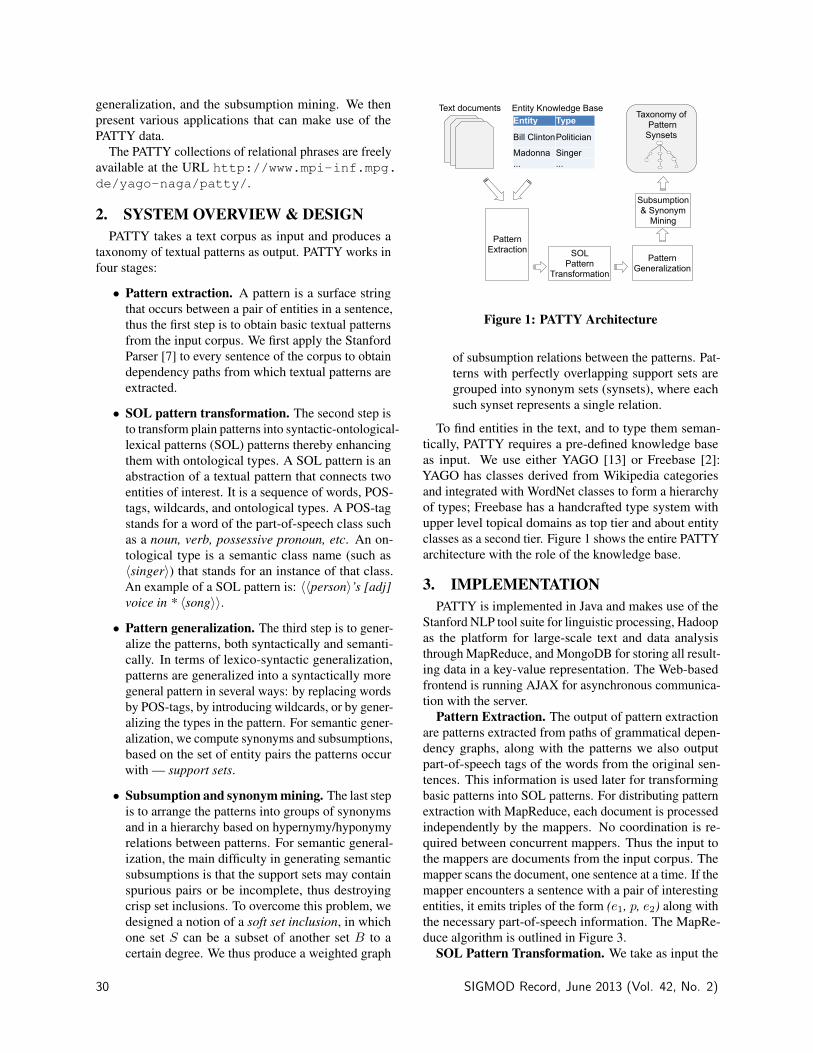
generalization, and the subsumption mining. We thenpresent various applications that can make use of thePATTY data.
The PATTY collections of relational phrases are freelyavailable at the URL http://www.mpi-inf.mpg.de/yago-naga/patty/.
2. SYSTEM OVERVIEW & DESIGNPATTY takes a text corpus as input and produces a
taxonomy of textual patterns as output. PATTY works infour stages:
• Pattern extraction. A pattern is a surface stringthat occurs between a pair of entities in a sentence,thus the first step is to obtain basic textual patternsfrom the input corpus. We first apply the StanfordParser [7] to every sentence of the corpus to obtaindependency paths from which textual patterns areextracted.
• SOL pattern transformation. The second step isto transform plain patterns into syntactic-ontological-lexical patterns (SOL) patterns thereby enhancingthem with ontological types. A SOL pattern is anabstraction of a textual pattern that connects twoentities of interest. It is a sequence of words, POS-tags, wildcards, and ontological types. A POS-tagstands for a word of the part-of-speech class suchas a noun, verb, possessive pronoun, etc. An on-tological type is a semantic class name (such as〈singer〉) that stands for an instance of that class.An example of a SOL pattern is: 〈〈person〉’s [adj]voice in * 〈song〉〉.• Pattern generalization. The third step is to gener-
alize the patterns, both syntactically and semanti-cally. In terms of lexico-syntactic generalization,patterns are generalized into a syntactically moregeneral pattern in several ways: by replacing wordsby POS-tags, by introducing wildcards, or by gener-alizing the types in the pattern. For semantic gener-alization, we compute synonyms and subsumptions,based on the set of entity pairs the patterns occurwith — support sets.
• Subsumption and synonym mining. The last stepis to arrange the patterns into groups of synonymsand in a hierarchy based on hypernymy/hyponymyrelations between patterns. For semantic general-ization, the main difficulty in generating semanticsubsumptions is that the support sets may containspurious pairs or be incomplete, thus destroyingcrisp set inclusions. To overcome this problem, wedesigned a notion of a soft set inclusion, in whichone set S can be a subset of another set B to acertain degree. We thus produce a weighted graph
Entity Type
Bill ClintonPolitician
Madonna Singer... ...
Text documents Entity Knowledge Base
Pattern Extraction SOL
PatternTransformation
PatternGeneralization
Subsumption& Synonym
Mining
Taxonomy of Pattern Synsets
Figure 1: PATTY Architecture
of subsumption relations between the patterns. Pat-terns with perfectly overlapping support sets aregrouped into synonym sets (synsets), where eachsuch synset represents a single relation.
To find entities in the text, and to type them seman-tically, PATTY requires a pre-defined knowledge baseas input. We use either YAGO [13] or Freebase [2]:YAGO has classes derived from Wikipedia categoriesand integrated with WordNet classes to form a hierarchyof types; Freebase has a handcrafted type system withupper level topical domains as top tier and about entityclasses as a second tier. Figure 1 shows the entire PATTYarchitecture with the role of the knowledge base.
3. IMPLEMENTATIONPATTY is implemented in Java and makes use of the
Stanford NLP tool suite for linguistic processing, Hadoopas the platform for large-scale text and data analysisthrough MapReduce, and MongoDB for storing all result-ing data in a key-value representation. The Web-basedfrontend is running AJAX for asynchronous communica-tion with the server.
Pattern Extraction. The output of pattern extractionare patterns extracted from paths of grammatical depen-dency graphs, along with the patterns we also outputpart-of-speech tags of the words from the original sen-tences. This information is used later for transformingbasic patterns into SOL patterns. For distributing patternextraction with MapReduce, each document is processedindependently by the mappers. No coordination is re-quired between concurrent mappers. Thus the input tothe mappers are documents from the input corpus. Themapper scans the document, one sentence at a time. If themapper encounters a sentence with a pair of interestingentities, it emits triples of the form (e1, p, e2) along withthe necessary part-of-speech information. The MapRe-duce algorithm is outlined in Figure 3.
SOL Pattern Transformation. We take as input the
30 SIGMOD Record, June 2013 (Vol. 42, No. 2)
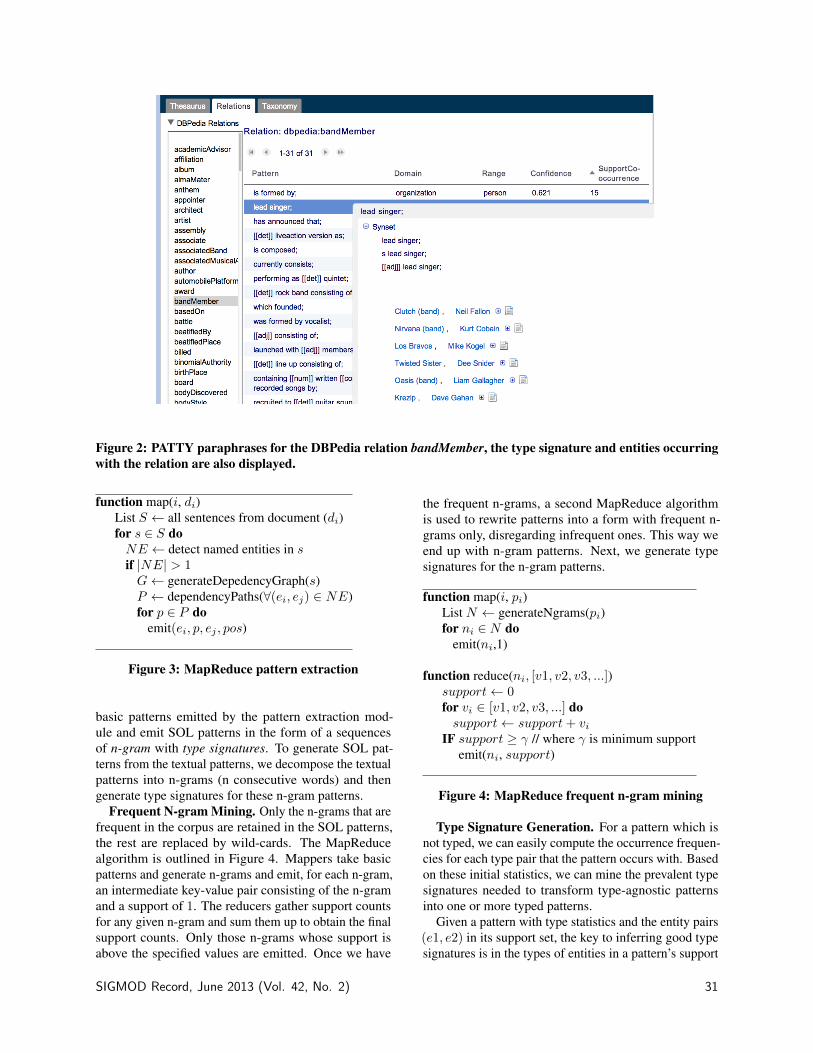
Figure 2: PATTY paraphrases for the DBPedia relation bandMember, the type signature and entities occurringwith the relation are also displayed.
function map(i, di)List S ← all sentences from document (di)for s ∈ S doNE ← detect named entities in sif |NE| > 1G← generateDepedencyGraph(s)P ← dependencyPaths(∀(ei, ej) ∈ NE)for p ∈ P do
emit(ei, p, ej , pos)
Figure 3: MapReduce pattern extraction
basic patterns emitted by the pattern extraction mod-ule and emit SOL patterns in the form of a sequencesof n-gram with type signatures. To generate SOL pat-terns from the textual patterns, we decompose the textualpatterns into n-grams (n consecutive words) and thengenerate type signatures for these n-gram patterns.
Frequent N-gram Mining. Only the n-grams that arefrequent in the corpus are retained in the SOL patterns,the rest are replaced by wild-cards. The MapReducealgorithm is outlined in Figure 4. Mappers take basicpatterns and generate n-grams and emit, for each n-gram,an intermediate key-value pair consisting of the n-gramand a support of 1. The reducers gather support countsfor any given n-gram and sum them up to obtain the finalsupport counts. Only those n-grams whose support isabove the specified values are emitted. Once we have
the frequent n-grams, a second MapReduce algorithmis used to rewrite patterns into a form with frequent n-grams only, disregarding infrequent ones. This way weend up with n-gram patterns. Next, we generate typesignatures for the n-gram patterns.
function map(i, pi)List N ← generateNgrams(pi)for ni ∈ N do
emit(ni,1)
function reduce(ni, [v1, v2, v3, ...])support← 0for vi ∈ [v1, v2, v3, ...] dosupport← support+ vi
IF support ≥ γ // where γ is minimum supportemit(ni, support)
Figure 4: MapReduce frequent n-gram mining
Type Signature Generation. For a pattern which isnot typed, we can easily compute the occurrence frequen-cies for each type pair that the pattern occurs with. Basedon these initial statistics, we can mine the prevalent typesignatures needed to transform type-agnostic patternsinto one or more typed patterns.
Given a pattern with type statistics and the entity pairs(e1, e2) in its support set, the key to inferring good typesignatures is in the types of entities in a pattern’s support
SIGMOD Record, June 2013 (Vol. 42, No. 2) 31
set. We take all types that the knowledge base providesfor a given entity and use heuristics to eliminate unlikelytype signatures. For every (e1, e2), we create two sets,one for all the types of e1, Te1 and one for all the typesof e2, Te2. We then compute the cross-product of the twotype sets T (e1) and T (e2) with an occurrence frequencyof 1. As we iterate over the entity pairs in the support set,we accumulate the occurrence frequencies for every typesignature.
This procedure results in a list of possible type signa-tures for each pattern. The set of candidate signaturesis often very large, so we enforce a threshold on theoccurrence frequency and drop all signatures below thethreshold.
Subsumption & Synonym Mining. Mining subsump-tions and synonyms from pattern support sets is not triv-ial, because a quadratic comparison of each and everypattern support set to every other pattern’s support setwould be prohibitively slow. Therefore, we developed aMap-Reduce algorithm for this purpose. As input, ouralgorithm requires a set of patterns and their support sets.As output, we compute a DAG of pattern subsumptions.We first invert the support sets data. Instead of provid-ing, for a pattern, all entity-pairs that occur with it, weprovide for an entity pair all the patterns that it occurswith. This can be achieved by a Map-Reduce algorithmthat is similar to a standard text indexing Map-Reducealgorithm.
From this data, we have to compute co-occurrencecounts of patterns, i.e., the number of entity-pairs thatthe supports of two patterns have in common. Our Map-Reduce algorithm for this purpose is as follows: Themappers emit pairs of patterns that co-occur for everyentity-pair they occur with. The reducers aggregate co-occurrence information to effectively output the sizesof the set intersection of the possible subsumptions. Asingle machine version of this algorithm is described in[10, 12].
4. RESULTSWe applied PATTY to different corpora to generate
relation taxonomies of varying sizes and quality. Theversion derived from Wikipedia (ca. 3.8 Million articles,version of June 21, 2011) is the richest and cleanestone. It consists of about 350,000 typed-pattern synsetsorganized in a hierarchy with 8,162 subsumptions.
Precision. Random sampling-based assessment showedthat about 85% of the patterns are correct in the sense thatthey denote meaningful relations with a proper type sig-nature. Furthermore, the subsumptions have a sampling-based accuracy of 83% and 75% for top-ranked and ran-domly sampled subsumptions respectively. To furtherevaluate the usefulness of PATTY, we performed a studyon relation paraphrasing: given a relation from a knowl-
edge base, identify patterns that can be used to expressthat relation. We found paraphrasing accuracy to varyfrom relation to relation: in some cases as low as 53%,and in others as high as 96%, the results are shown inTable 1 with 0.9-confidence Wilson score interval. Arandom sample of 1000 paraphrases showed an averageprecision of 0.76± 0.03 across all relations.
Recall. Without a reference resource in the form ofa comprehensive collection of relations, their synonymsand subsumptions, evaluating recall is not truly possi-ble. We estimated recall by manually compiling an ap-proximate reference resource in the music domain. Thereference resource contains all binary relations betweenentities that appear in Wikipedia articles about musicians.Out of 169 ground-truth relations, PATTY contains 126.
Scalability. In terms of run-times, the most expensivepart is pattern extraction, where we identify pattern can-didates through dependency parsing and perform entityrecognition on the entire corpus. This phase runs abouta day for Wikipedia on a Hadoop cluster with ten DellPowerEdge R720 machines and a10 GBit Ethernet con-nection. Each machine has 64GB of main memory, eight2TB SAS 7200 RPM hard disks, and two Intel XeonE5-2640 6-core CPUs. On the same cluster, all otherphases take less than an hour to execute.
5. APPLICATIONSThe data produced by PATTY is a valuable resource
for a variety of applications. First, it can boost IE andknowledge base population tasks by its rich and cleanrepository of paraphrases for the relations. Second, itcan improve Open IE by associating type signatures withpatterns. Third, it can help to discover “Web witnesses”when assessing the truthfulness of search results or state-ments in social media [5]. Last, it provides paraphrasesfor detecting relationships in keyword queries, thus lift-ing keyword search to the entity-relationship level. Thiscan help to understand questions and text snippets innatural-language QA.
We developed a front-end to the PATTY data for ex-ploring these possibilities in three ways: (1) using PATTYas a thesaurus to find paraphrases for relations, (2) us-ing PATTY as a simple kind of QA system to query thedatabase without having to know the schema, and (3)exploring the relationships between entities, as expressedin the textual sources. The Web-based front-end is run-ning AJAX for asynchronous communication with theserver.
5.1 Using PATTY as a ThesaurusPATTY connects the world of textual surface patterns
with the world of predefined RDF relationships. Userswho are aware of RDF-based knowledge bases can ex-plore how RDF relations map to their textual representa-
32 SIGMOD Record, June 2013 (Vol. 42, No. 2)
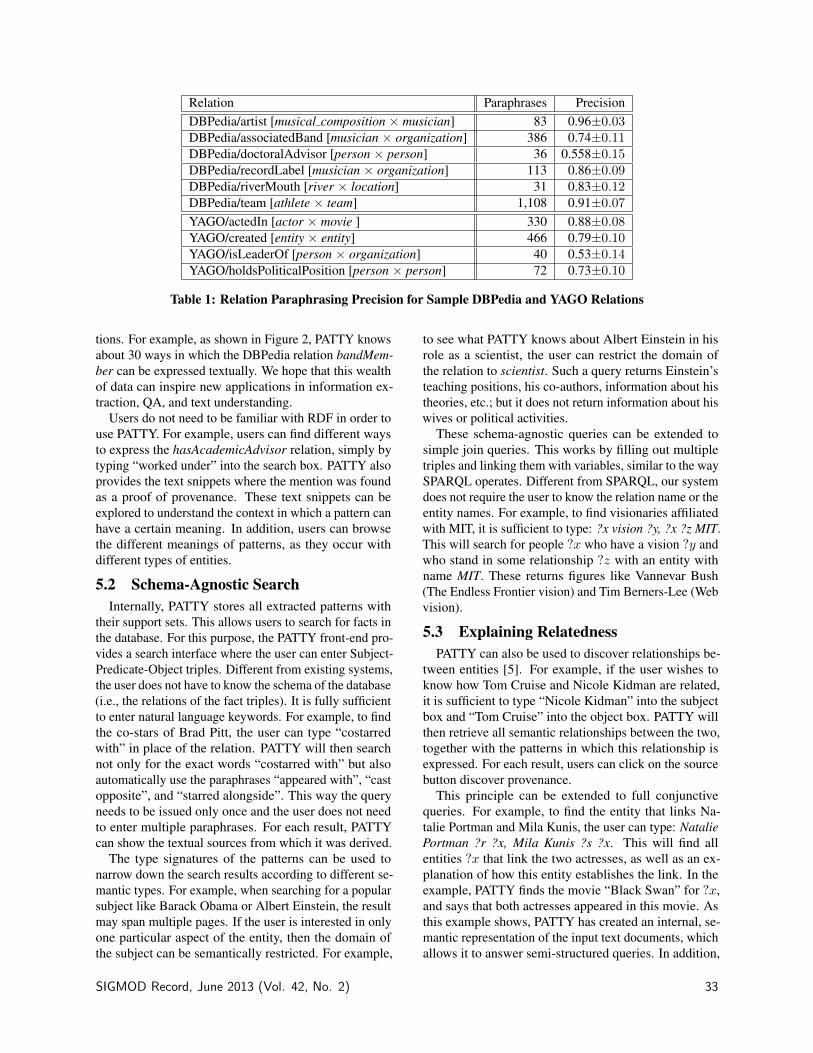
Relation Paraphrases PrecisionDBPedia/artist [musical composition × musician] 83 0.96±0.03DBPedia/associatedBand [musician × organization] 386 0.74±0.11DBPedia/doctoralAdvisor [person × person] 36 0.558±0.15DBPedia/recordLabel [musician × organization] 113 0.86±0.09DBPedia/riverMouth [river × location] 31 0.83±0.12DBPedia/team [athlete × team] 1,108 0.91±0.07YAGO/actedIn [actor × movie ] 330 0.88±0.08YAGO/created [entity × entity] 466 0.79±0.10YAGO/isLeaderOf [person × organization] 40 0.53±0.14YAGO/holdsPoliticalPosition [person × person] 72 0.73±0.10
Table 1: Relation Paraphrasing Precision for Sample DBPedia and YAGO Relations
tions. For example, as shown in Figure 2, PATTY knowsabout 30 ways in which the DBPedia relation bandMem-ber can be expressed textually. We hope that this wealthof data can inspire new applications in information ex-traction, QA, and text understanding.
Users do not need to be familiar with RDF in order touse PATTY. For example, users can find different waysto express the hasAcademicAdvisor relation, simply bytyping “worked under” into the search box. PATTY alsoprovides the text snippets where the mention was foundas a proof of provenance. These text snippets can beexplored to understand the context in which a pattern canhave a certain meaning. In addition, users can browsethe different meanings of patterns, as they occur withdifferent types of entities.
5.2 Schema-Agnostic SearchInternally, PATTY stores all extracted patterns with
their support sets. This allows users to search for facts inthe database. For this purpose, the PATTY front-end pro-vides a search interface where the user can enter Subject-Predicate-Object triples. Different from existing systems,the user does not have to know the schema of the database(i.e., the relations of the fact triples). It is fully sufficientto enter natural language keywords. For example, to findthe co-stars of Brad Pitt, the user can type “costarredwith” in place of the relation. PATTY will then searchnot only for the exact words “costarred with” but alsoautomatically use the paraphrases “appeared with”, “castopposite”, and “starred alongside”. This way the queryneeds to be issued only once and the user does not needto enter multiple paraphrases. For each result, PATTYcan show the textual sources from which it was derived.
The type signatures of the patterns can be used tonarrow down the search results according to different se-mantic types. For example, when searching for a popularsubject like Barack Obama or Albert Einstein, the resultmay span multiple pages. If the user is interested in onlyone particular aspect of the entity, then the domain ofthe subject can be semantically restricted. For example,
to see what PATTY knows about Albert Einstein in hisrole as a scientist, the user can restrict the domain ofthe relation to scientist. Such a query returns Einstein’steaching positions, his co-authors, information about histheories, etc.; but it does not return information about hiswives or political activities.
These schema-agnostic queries can be extended tosimple join queries. This works by filling out multipletriples and linking them with variables, similar to the waySPARQL operates. Different from SPARQL, our systemdoes not require the user to know the relation name or theentity names. For example, to find visionaries affiliatedwith MIT, it is sufficient to type: ?x vision ?y, ?x ?z MIT.This will search for people ?x who have a vision ?y andwho stand in some relationship ?z with an entity withname MIT. These returns figures like Vannevar Bush(The Endless Frontier vision) and Tim Berners-Lee (Webvision).
5.3 Explaining RelatednessPATTY can also be used to discover relationships be-
tween entities [5]. For example, if the user wishes toknow how Tom Cruise and Nicole Kidman are related,it is sufficient to type “Nicole Kidman” into the subjectbox and “Tom Cruise” into the object box. PATTY willthen retrieve all semantic relationships between the two,together with the patterns in which this relationship isexpressed. For each result, users can click on the sourcebutton discover provenance.
This principle can be extended to full conjunctivequeries. For example, to find the entity that links Na-talie Portman and Mila Kunis, the user can type: NataliePortman ?r ?x, Mila Kunis ?s ?x. This will find allentities ?x that link the two actresses, as well as an ex-planation of how this entity establishes the link. In theexample, PATTY finds the movie “Black Swan” for ?x,and says that both actresses appeared in this movie. Asthis example shows, PATTY has created an internal, se-mantic representation of the input text documents, whichallows it to answer semi-structured queries. In addition,
SIGMOD Record, June 2013 (Vol. 42, No. 2) 33
to generate semantic patterns, PATTY has implicitly sum-marized the input text documents. Users can exploit andquery these summaries.
5.4 Other Use CasesRecently, followup work has shown successful usage
of PATTY for other tasks. In [9], PATTY ’s type signa-tures are used for semantic typing of out-of-knowledge-base entities. Because the type signatures are fined-grained (e.g., musician, journalist, etc.), the applicationinfers more semantically informative types than standardnamed entity recognition which works with coarse typessuch as company, person, etc. In [16], PATTY’s relationparaphrases are used for question understanding in thechallenging task of question answering.
6. RELATED WORKRecently, [8] and [17] have addressed the mining of
equivalent patterns, in order to discover new relations,based on clustering. These approaches are based onbuilding large matrices or inference on latent models.They differ from PATTY in that the issue of identifyingsubsumptions between patterns has been disregarded.Among prior works, only ReVerb[4] and NELL[3], havemade their patterns publicly available. However, theReVerb patterns for Open IE are fairly noisy and connectnoun phrases rather than entities. NELL is limited to afew hundred pre-specified relations. None of the priorapproaches knows the ontological types of patterns, toreveal, e.g., that covered holds between a musician and asong.
7. FUTURE WORKThere are several avenues for future research that can
build on and improve PATTY. We focused on two typesof relatedness: synonymy and hypernymy. However, fur-ther types of relatedness between binary relations can beextracted. For example, we can also extract antonyms,where one relation is the opposite of another. Some rela-tions have units; so we could extract the units of relationssuch as hasHeight, hasRevenue, hasLength (for songs),etc. In addition, some relations have value constraints,for example, it is not possible for a person’s height to be5 meters. Another line of future work is extracting n-aryrelations for n > 2. Such relations might be better suitedfor explaining complex events and causality.
8. REFERENCES
[1] S. Auer, C. Bizer, G. Kobilarov, J. Lehmann, R.Cyganiak, Z.G. Ives: DBpedia: A Nucleus for aWeb of Open Data, ISWC/ASWC, pp. 722-7352007
[2] K. D. Bollacker, C. Evans, P. Paritosh, T. Sturge, J.Taylor: Freebase: a Collaboratively Created GraphDatabase for Structuring Human Knowledge.SIGMOD, pp. 1247-1250, 2008
[3] A. Carlson, J. Betteridge, R.C. Wang, E.R.Hruschka, T.M. Mitchell: CoupledSemi-supervised Learning for InformationExtraction, WSDM, pp. 101-110, 2010
[4] A. Fader, S. Soderland, O. Etzioni: IdentifyingRelations for Open Information Extraction,EMNLP, pp. 1535 - 1545, 2011
[5] L. Fang, A. Das Sarma, C. Yu, P. Bohannon: REX:Explaining Relationships between Entity Pairs.PVLDB 5(3), pp. 241-252, 2011
[6] G. Limaye, S. Sarawagi, S. Chakrabarti:Annotating and Searching Web Tables UsingEntities, Types and Relationships. PVLDB 3(1), pp.1338-1347, 2010
[7] M.-C. de Marneffe, B. MacCartney and C. D.Manning. Generating Typed Dependency Parsesfrom Phrase Structure Parses. LREC, 2006
[8] T. Mohamed, E.R. Hruschka, T.M. Mitchell:Discovering Relations between Noun Categories,EMNLP, pp. 1447-1455, 2011
[9] N. Nakashole, T. Tylenda, G. Weikum:Fine-grained Semantic Typing of EmergingEntities, ACL, to appear 2013.
[10] N. Nakashole, G. Weikum, F. Suchanek: PATTY:A Taxonomy of Relational Patterns with SemanticTypes, EMNLP, pp.1135 -1145. 2012
[11] N. Nakashole, G. Weikum, F. Suchanek:Discovering and Exploring Relations on the Web.PVLDB 5(10), pp. 1982–1985, 2012
[12] N. Nakashole: Automatic Extraction of Facts,Relations, and Entities for Web-Scale KnowledgeBase Population. PhD Thesis, Saarland University,2012
[13] F.M. Suchanek, G. Kasneci, G. Weikum: Yago: aCore of Semantic Knowledge, WWW, pp. 697-706,2007
[14] P. Venetis, A. Halevy, J. Madhavan, M. Pasca, W.Shen, F. Wu, G. Miao, C. Wu: RecoveringSemantics of Tables on the Web, VLDB, pp.528-538, 2011
[15] W. Wu, H. Li, H. Wang, K. Zhu: Probase: AProbabilistic Taxonomy for Text Understanding,SIGMOD, pp. 481- 492, 2012
[16] M. Yahya, K.Berberich, S. Elbassuoni, M.Ramanath, V. Tresp, W. Weikum: NaturalLanguage Questions for the Web of Data. EMNLP,pp. 379-390, 2012
[17] L. Yao, A. Haghighi, S. Riedel, A. McCallum:Structured Relation Discovery using GenerativeModels. EMNLP, pp. 1456 -1466, 2011
34 SIGMOD Record, June 2013 (Vol. 42, No. 2)

Jeff Vitter Speaks Out on being a Southerner, Duties of a Dean, and More
by Marianne Winslett and Vanessa Braganholo
Jeffrey S. Vitter
http://provost.ku.edu/jsv Welcome to this installment of ACM SIGMOD Record’s series of interviews with distinguished members of the database community. I’m Marianne Winslett, and today I am at Purdue University. I have here with me Jeff Vitter, who is the Frederick L. Hovde Dean of the College of Science1. Before coming to Purdue, Jeff was on the faculty of Duke and Brown for many years, and he served as the chairman of the Department of Computer Science at Duke. Jeff’s research interest lies in algorithms, especially in the areas of external memory algorithms and compression. Jeff is an ACM Fellow, IEEE Fellow, and Guggenheim Foundation Fellow2. He is on the board of directors of the Computing Research Association and is the former chair of ACM SIGACT. His PhD is from Stanford. So, Jeff, welcome! Great! Thanks for having me, Marianne. 1 This interview was conducted in 2008. Today, Jeff Vitter is the provost and executive vice chancellor and the Roy A. Roberts Distinguished Professor at the University of Kansas. 2 In 2009, Jeff was elected as a Fellow of the American Association for the Advancement of Science (AAAS).
SIGMOD Record, June 2013 (Vol. 42, No. 2) 35
Jeff, what was it like working with Don Knuth at Stanford? Don is just an incredible human being. You know, he is really probably more responsible than any other person for the founding of computer science as an academic discipline. So just getting his insights was really tremendous. Professionally, what really impacted me was his sense of importance of theory and practice, and how it’s vital to have a deep understanding of them both in order to excel at either. It was a little intimidating because he had just started TeX, and he really wasn’t taking students, and one day I went to see him and I told him I had solved this problem and I thought this other one might be interesting to look at, just to see what he thought. And he said, “Well, if you do that, that would make a great thesis. And, by the way, you should plan to do this here, then this then, and graduate at this time,” which was in three years from when I got to Stanford. I didn’t dare question this. I just plowed ahead and did it. And I remember going through my thesis near the end of my third year, getting ready to finish, and Don looks at me and says, “You know, you really did quite a bit here, in an amazingly short amount of time. Why did you do it so quickly?” And I am sitting there after having worked so hard, and I was about to say, “ ‘Cause you told me to!” (Laughing.) But it was just a great experience. He was the most remarkable academic I have ever met. So, what was that thesis on? It was on Coalesced Hashing, as it’s called. It is a hashing method that optimizes the way it uses storage in order to get the absolute best in search time. I have adopted the name “Coalesced” for some our projects here in the College of Science. Jeff, most of your research is on algorithms for massive data sets. But your papers mainly appear in theory-‐oriented venues like Algorithmica and FOCS (Foundations of Computer Science), rather than SIGMOD, VLDB, and ICDE. So are you a theory guy, a database guy, or a database theory guy? Yes (grinning). To follow up on what I learned from Don, I think the most important things are this blending of theory and practice, so that is what I try to instill in my students. I really try to cover both of those communities. I have had some great students who have gone on in the systems arena, but because they have such a strong theory background and can appreciate the elegance and essence of what the techniques they are working on are all about, I think that really brings a scalability that makes what they do in systems work out. I have had students like Mark Nodine, Paul Howard, Dzung Hoang, Darren Vengroff, Lipyeow Lim, Tavi Procopiuc, Rakesh Barve, and Min Wang. They are incredible systems implementers, but they are also fundamentally very strong algorithmic students. I think that is part of the reason they are so good in systems.
36 SIGMOD Record, June 2013 (Vol. 42, No. 2)
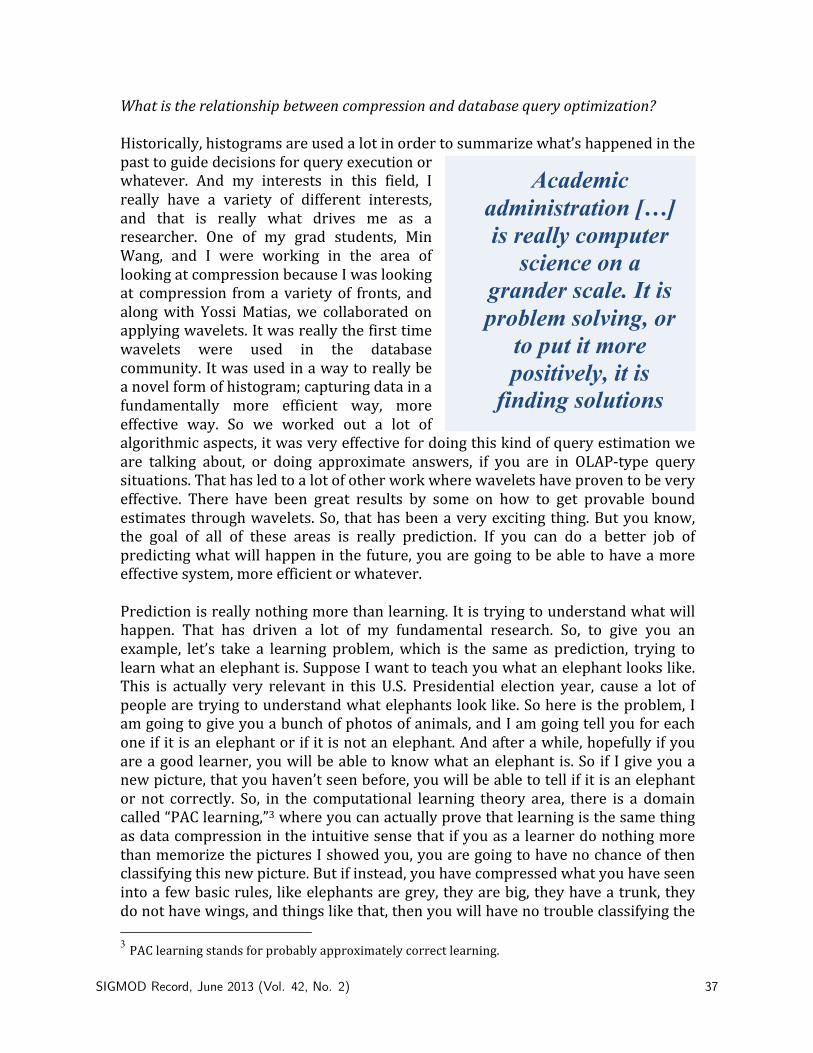
What is the relationship between compression and database query optimization? Historically, histograms are used a lot in order to summarize what’s happened in the past to guide decisions for query execution or whatever. And my interests in this field, I really have a variety of different interests, and that is really what drives me as a researcher. One of my grad students, Min Wang, and I were working in the area of looking at compression because I was looking at compression from a variety of fronts, and along with Yossi Matias, we collaborated on applying wavelets. It was really the first time wavelets were used in the database community. It was used in a way to really be a novel form of histogram; capturing data in a fundamentally more efficient way, more effective way. So we worked out a lot of algorithmic aspects, it was very effective for doing this kind of query estimation we are talking about, or doing approximate answers, if you are in OLAP-‐type query situations. That has led to a lot of other work where wavelets have proven to be very effective. There have been great results by some on how to get provable bound estimates through wavelets. So, that has been a very exciting thing. But you know, the goal of all of these areas is really prediction. If you can do a better job of predicting what will happen in the future, you are going to be able to have a more effective system, more efficient or whatever. Prediction is really nothing more than learning. It is trying to understand what will happen. That has driven a lot of my fundamental research. So, to give you an example, let’s take a learning problem, which is the same as prediction, trying to learn what an elephant is. Suppose I want to teach you what an elephant looks like. This is actually very relevant in this U.S. Presidential election year, cause a lot of people are trying to understand what elephants look like. So here is the problem, I am going to give you a bunch of photos of animals, and I am going tell you for each one if it is an elephant or if it is not an elephant. And after a while, hopefully if you are a good learner, you will be able to know what an elephant is. So if I give you a new picture, that you haven’t seen before, you will be able to tell if it is an elephant or not correctly. So, in the computational learning theory area, there is a domain called “PAC learning,”3 where you can actually prove that learning is the same thing as data compression in the intuitive sense that if you as a learner do nothing more than memorize the pictures I showed you, you are going to have no chance of then classifying this new picture. But if instead, you have compressed what you have seen into a few basic rules, like elephants are grey, they are big, they have a trunk, they do not have wings, and things like that, then you will have no trouble classifying the 3 PAC learning stands for probably approximately correct learning.
Academic administration […] is really computer
science on a grander scale. It is problem solving, or
to put it more positively, it is
finding solutions
SIGMOD Record, June 2013 (Vol. 42, No. 2) 37
new picture as to whether it is an elephant. And that is really the essence of this relationship. So, we were looking at a variety of problems, one of them was prefetching. Prefetching is a job where you have a bunch of accesses to a disk in the past, and now based on those you want to predict what are you going to access in the future so you can prefetch it into memory and have it ready for when you are going to access it, and avoid a costly page fault. So we applied a data compression method because of this intuition that compression is really prediction. We applied a data compression method to the sequence of numbers, which are page accesses, and in the bowels of the method, the Lempel-‐Ziv method, was a prediction for what the next page reference would likely be. We used that, and we showed that actually it allowed us to boost the hit rate from 20% in many applications, up to 70%, so it was very effective. And it has a really nice mathematical foundation. So prediction and compression come into play in a lot of instances. In image databases, it’s the key for storing images so that you can search for them based on similarity. And of course, any time you have compressed data, it will often be stored in faster areas in the memory hierarchy, and then it makes it more efficient. You wrote the book — literally4 — on external memory algorithms. What are they, and how do they relate to databases? It all goes back to a model of memory hierarchies, or what we call a parallel disk model, where in a simple setting, we have a computer with an internal memory and data are simply too large to fit in the internal memory, so we store it on disk. And this is a standard database set-‐up. Because disk drives are these physical rotating media where it takes milliseconds to get to data, but once you get to data, you can get adjacent data very quickly, the result is that data are typically transferred in blocks because that amortizes the cost of the high latency just to go to the data. One of the main goals of external memory algorithms is to minimize the number I/O transfers. And I/O is transferred in large blocks of data, so the main parameters of the model are the size of the transferred block, the size of the internal memory, and then basically that’s it, the problem size itself. And the goal is to design an algorithm that uses locality in a fundamental way, so that data are transferred in blocks, and when you want data, you want a block of data, you don’t want data from random locations, because if you do things effectively, you can speed up computations by a factor of 100 or 1,000 because of this block mechanism. So to give you an example, we applied this in a domain at Duke in collaboration with some folks in the School of the Environment. Lars Arge and I and students and collaborators in the School of the Environment worked on methods for determining, when rain falls, where it will go. So, what will the watershed be? Where will the flooding occur? This is very
4 J. S. Vitter. Algorithms and Data Structures for External Memory, Series on Foundations and Trends in Theoretical Computer Science, Now Publishers, Hanover, MA, 2008. Also published as Volume 2, Issue 4 of Foundations and Trends in Theoretical Computer Science.
38 SIGMOD Record, June 2013 (Vol. 42, No. 2)
important in North Carolina. So we took satellite data and other imaging methods of regions like the Appalachians, and using so-‐called conventional techniques, such as ArcInfo, these calculations could take several days. There would be calculations that could not be run at all. Using newly-‐designed algorithms that focus on block transfer, we were able to reduce the running time from days to hours, or when they couldn’t even be computed at all, we could do them in just a few hours. So it can make a really big difference, especially because data are just expanding at a crazy rate. You are a relatively recent transplant from the east coast to the Midwest. What do you think of life in the Midwest? I grew up in the south, went to grad school in California, and then I was at Brown
and Duke on the east coast. But I did go to Notre Dame as an undergrad, so I have strong roots in Indiana. I am happy to say that being two hours south makes a big difference in temperature. It is a lot warmer and more moderate here. The main thing about Indiana is it is a great family environment. West Lafayette in the last 10 years has gotten some really wonderful restaurants, culture opportunities; in fact, there is a New Orleans restaurant that just opened a couple of months ago, and the owner and chef is a high
school classmate of my brother Mark, so it is really good. It’s a great place to live. And the students here are, with their Midwestern ethic, just very hard workers. They are wonderful to work with. Some people think that CS researchers who aren’t on the east or west coasts must be quite isolated. Have you found that to be true? It is a perception that is challenging at recruiting time, but when you show the candidates all that is going on, all that we have at Purdue, it is really quite remarkable. In databases, with this community, we have an incredible group. We have Ahmed Elmagarmid, Walid Aref, Elisa Bertino, Chris Clifton. It’s a great group. Ahmed is actually the head of the Cyber Center, which integrates IT research across the entire University. In information security, we have what I think is the best group anywhere. 25% of all of the information security PhDs in the entire country come out of Purdue and our CERIAS Center. Mike Atallah and Gene Spafford are just renowned in that area. We have terrific systems people, whether it is in networking, distributed systems, or programming languages, operating systems, graphics and visualization, software engineering. It is really a strong group. So this is a great place to be, and I am very excited to be here. What about your interactions with other Universities?
[…] in the arena of the life sciences
and biology, there are great
opportunities that put databases at
the forward.
SIGMOD Record, June 2013 (Vol. 42, No. 2) 39
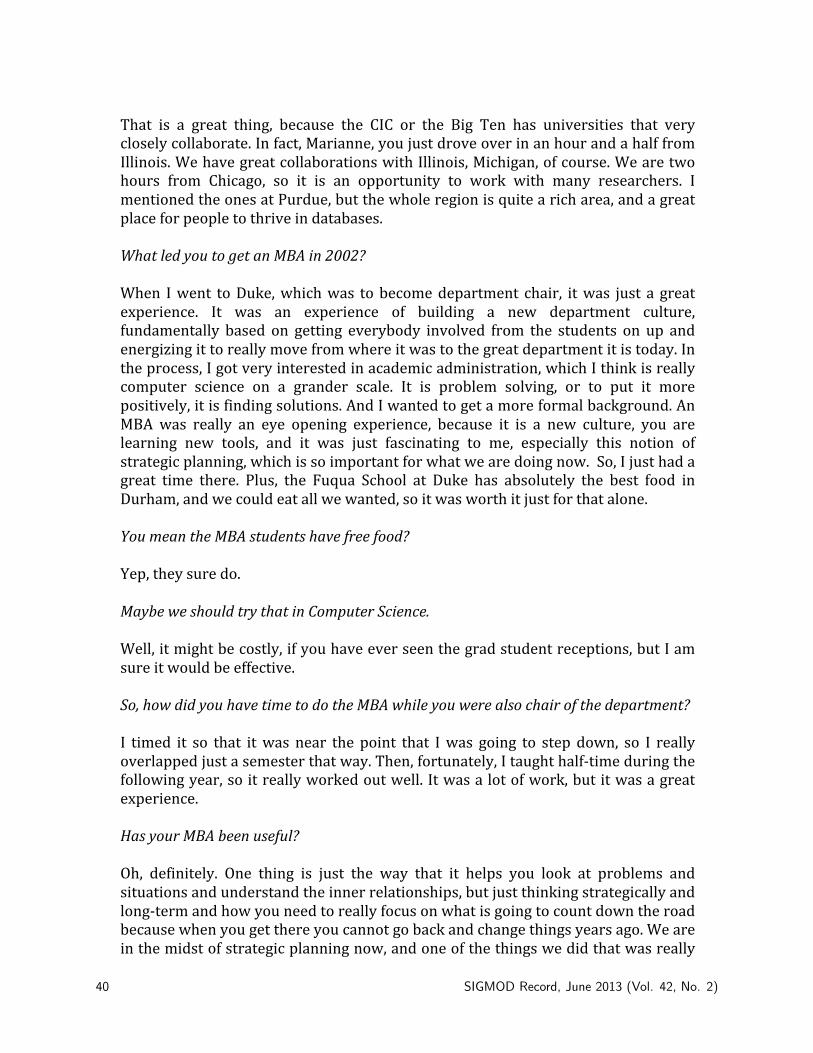
That is a great thing, because the CIC or the Big Ten has universities that very closely collaborate. In fact, Marianne, you just drove over in an hour and a half from Illinois. We have great collaborations with Illinois, Michigan, of course. We are two hours from Chicago, so it is an opportunity to work with many researchers. I mentioned the ones at Purdue, but the whole region is quite a rich area, and a great place for people to thrive in databases. What led you to get an MBA in 2002? When I went to Duke, which was to become department chair, it was just a great experience. It was an experience of building a new department culture, fundamentally based on getting everybody involved from the students on up and energizing it to really move from where it was to the great department it is today. In the process, I got very interested in academic administration, which I think is really computer science on a grander scale. It is problem solving, or to put it more positively, it is finding solutions. And I wanted to get a more formal background. An MBA was really an eye opening experience, because it is a new culture, you are learning new tools, and it was just fascinating to me, especially this notion of strategic planning, which is so important for what we are doing now. So, I just had a great time there. Plus, the Fuqua School at Duke has absolutely the best food in Durham, and we could eat all we wanted, so it was worth it just for that alone. You mean the MBA students have free food? Yep, they sure do. Maybe we should try that in Computer Science. Well, it might be costly, if you have ever seen the grad student receptions, but I am sure it would be effective. So, how did you have time to do the MBA while you were also chair of the department? I timed it so that it was near the point that I was going to step down, so I really overlapped just a semester that way. Then, fortunately, I taught half-‐time during the following year, so it really worked out well. It was a lot of work, but it was a great experience. Has your MBA been useful? Oh, definitely. One thing is just the way that it helps you look at problems and situations and understand the inner relationships, but just thinking strategically and long-‐term and how you need to really focus on what is going to count down the road because when you get there you cannot go back and change things years ago. We are in the midst of strategic planning now, and one of the things we did that was really
40 SIGMOD Record, June 2013 (Vol. 42, No. 2)
fundamental that I think is quite unique across the country is that we have instituted a way of dealing with these large multi-‐disciplinary problems that are society-‐wide: trying to find new forms of energy, trying to deal with the climate change and the environment situation, trying to cure and prevent disease. These are problems that require contributions from multiple disciples; certainly computer scientists, but from all over. They just were not getting proper attention, because we were doing things discipline by discipline, and we were focusing on hiring faculty who were going to be the best for our individual disciplines. And in fact, if a faculty wanted to work elsewhere and collaborate, they were almost seen as perhaps a department losing half of a slot, so we wanted to allow departments who had these priorities already to be able to realize them. We spent a year determining the priorities, but we also had a mechanism in place so that as we were growing — and Purdue was growing by 300 faculty, 60 in our College of Science — and filling these positions, we adopted the approach that we were going to devote these multidisciplinary priorities as the key for these growth positions. We did college-‐wide searches for these areas, and it’s become so much a culture now at our college that as we near our steady state in faculty size, we have decided this is something we want to continue, but we have to do it by a different mechanism. The MBA experiences now help me help design the new mechanism because it is a different circumstance; you cannot use the old approach. You have to design something that makes sense for the time. So we have that, it is unique, it’s for our current situation, but it is allowing us to continue this multidisciplinary momentum. So that is what an MBA can help do. You’re now in your sixth year as Dean of Science here at Purdue. What do deans do? Well, our fundamental mission is to help faculty, students, and staff succeed, so that is my number one goal; and it is through visioning and strategic planning like I talked about. It is raising money. It’s trying to be careful in budget management so we can spend money for the things that are important. It’s designing curriculum. It is really helping people succeed, fundamentally. But everything you have just said, at least at Illinois, is also the job of a department head. That is true, but deans have a broader responsibility. They need to help facilitate the interactions between departments, which is really a substantial challenge. It takes a lot of collaboration and listening. You have really got to communicate and talk a lot with people to understand where they are coming from, what they want to do, and how you can best help them succeed. It is a big job, but it is really fascinating, because when things work, they can have a dramatic effect on people, on lives, on jobs, on revitalizing a state’s economy, hopefully leading this country to a brighter future.
SIGMOD Record, June 2013 (Vol. 42, No. 2) 41
You have 5 papers in DBLP for 2007, and more than that for the previous year. How can you be a dean and still be doing research? So what you are saying is that I am actually publishing less as the years go on, is that what you are saying, Marianne? (Laughing.) It actually goes up and down, so I don’t think we can just extrapolate linearly.
I think, to me, I love research. But more fundamentally, I think it makes me more in tune with what is going on in the college. Staying involved in research keeps me vital. Faculty work incredibly hard, they have a lot of things pulling them in different directions, and I think I should at least work as hard as they do, because we have such a great group here. People always point to the physicists saying how effective they are at working together to get funding for their research. Computer Scientists tend not to do things too often as a body, or speak with one voice. In fact, they often shoot each other! I
guess that is a way of having one voice: if you shoot each other, there is only one person left. Astrophysicists, for example, are renowned at getting together, deciding what are the key often instrumentation needs that they have that will enable the great things they want to do. Then, in a single voice, they lobby and get those sorts of things. That is really what the CCC is all about. Ed Lazowska is leading that effort in the CRA. It is very important to our future because we need absolutely to get that message out. We need to address the pipeline issue. We are seeing slightly higher enrollments now, but we are 50% under nationally in enrollments in computing than we were just six years ago. It is quite a problem. So we have to get the pipeline in because when you look at the Gathering Storm report that came out of the National Academy, there is a tremendous need, and computing has one of the most opportunities for jobs of any discipline. We have 150,000 new jobs created each year, and we graduate 50,000 students. You wouldn’t know it to read the newspapers, would you? They always talk about off-‐shore jobs. Exactly, I think it’s parents telling their kids, “Don’t major in computing because the jobs are going overseas.” So we are trying to get the message out that it is actually
I think the most important thing is to go and talk with your colleagues in physics,
chemistry, biology, history, music, other parts of engineering, because they are just ripe for applications
and new kinds of insights that will help motivate new things.
42 SIGMOD Record, June 2013 (Vol. 42, No. 2)
the opposite. And unless we do something, we are going to be struggling in this country, and the biggest place we can make a mark is in the under-‐represented groups. For women, we are down tremendously for women going into computing these days, and minorities, such as African-‐American, Hispanics, and Native Americans, we need to do a much better job. And southerners too. Many people think that computer science as an academic discipline will wither away like railroad engineering: today, you don’t see Departments of Railroads in universities. Recently, computer science has been moving closer to its application domains, and you can see this trend especially clearly in the database world. Are we going to wither away and be absorbed by these application areas? I hope not. And I think the key to being a vital field is to actually embrace those connections and make them a fundamental part of what we do. The real value of multidisciplinary opportunities is, first of all, that they solve the big problems, not artificial problems. Secondly, the most effective outcome is when you really make deep contributions within each discipline as part of this collaboration. And in the course of working on these problems, you will have suggested to you fundamental problems in your discipline, and that is what keeps disciplines alive. If computer science can really embrace this collaborative role it has with other disciplines, it will be revitalized by the very issues that those other disciplines suggest, and that will always keep computer science as a very strong force that will warrant and have people’s appreciation. The way you say that, it almost sounds like the other fields will inspire us by suggesting what direction we should be going, rather than CS having the intellectual leadership. Well, it is a collaboration, and I think it takes the trust and willingness to not be concerned about who suggested what, so that you can just drive forward, and collaboratively both groups — application arena groups and CS people — are going to make fundamental contributions. If we don’t do that, I think what will happen is that the other disciplines will recognize the need for it on their own and adopt computing in their disciplines, and I think that’s what the real danger is to computing. So we have an opportunity to revitalize computing by embracing all of these opportunities. What are the most challenging database issues in other scientific disciplines? I think in the arena of the life sciences and biology, there are great opportunities that put databases at the fore. For example, in biology, I just have to mention that here at Purdue we have what I think is the top structural biology group in the world. They are focused on understanding the geometry of macromolecules, whether they are viruses or nucleic acids, or whatever, because, in biology, form often determines function. If you take this virus, and you can understand its structure, then drug designers can design drugs that bind to it just right to block its function and cure the disease. Bringing geometry in a fundamental way into databases is really an
SIGMOD Record, June 2013 (Vol. 42, No. 2) 43
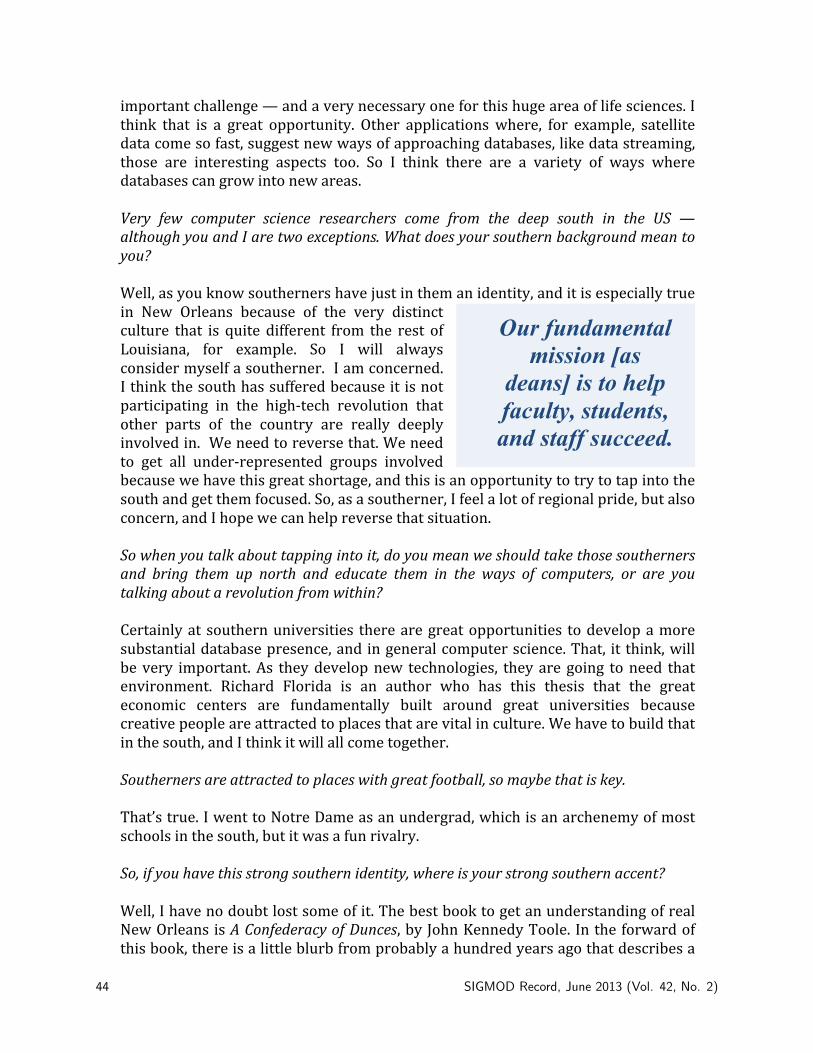
important challenge — and a very necessary one for this huge area of life sciences. I think that is a great opportunity. Other applications where, for example, satellite data come so fast, suggest new ways of approaching databases, like data streaming, those are interesting aspects too. So I think there are a variety of ways where databases can grow into new areas. Very few computer science researchers come from the deep south in the US — although you and I are two exceptions. What does your southern background mean to you? Well, as you know southerners have just in them an identity, and it is especially true in New Orleans because of the very distinct culture that is quite different from the rest of Louisiana, for example. So I will always consider myself a southerner. I am concerned. I think the south has suffered because it is not participating in the high-‐tech revolution that other parts of the country are really deeply involved in. We need to reverse that. We need to get all under-‐represented groups involved because we have this great shortage, and this is an opportunity to try to tap into the south and get them focused. So, as a southerner, I feel a lot of regional pride, but also concern, and I hope we can help reverse that situation. So when you talk about tapping into it, do you mean we should take those southerners and bring them up north and educate them in the ways of computers, or are you talking about a revolution from within? Certainly at southern universities there are great opportunities to develop a more substantial database presence, and in general computer science. That, it think, will be very important. As they develop new technologies, they are going to need that environment. Richard Florida is an author who has this thesis that the great economic centers are fundamentally built around great universities because creative people are attracted to places that are vital in culture. We have to build that in the south, and I think it will all come together. Southerners are attracted to places with great football, so maybe that is key. That’s true. I went to Notre Dame as an undergrad, which is an archenemy of most schools in the south, but it was a fun rivalry. So, if you have this strong southern identity, where is your strong southern accent? Well, I have no doubt lost some of it. The best book to get an understanding of real New Orleans is A Confederacy of Dunces, by John Kennedy Toole. In the forward of this book, there is a little blurb from probably a hundred years ago that describes a
Our fundamental mission [as
deans] is to help faculty, students, and staff succeed.
44 SIGMOD Record, June 2013 (Vol. 42, No. 2)

New Orleans accent as really a soft Brooklyn accent. And that is really what it is. If you go to New Orleans, if you hear a southern accent, it is certainly someone who wasn’t born there. But a real New Orleans accent is a real Brooklyn type accent. Can we get a demonstration here? I’m not quite following you. Well, if I saw you at the local drug store (and of course you’d have your hair up in curlers), I’d say (in New Orleans accent), “Hey, where y’at, MariANNE? Whatcha doin’? You wanna go get some red beans and rice?” There is that tang in there. But it is nothing like a southern accent. In fact, an expression in New Orleans for “how are you?” is “where y’at?” New Orleanians are called Yats as a result. That’s the name of the restaurant that just opened here in West Lafayette; the New Orleans restaurant is called Yats. Do you have any words of advice for fledgling or midcareer database researchers or practitioners? I think the most important thing is to go and talk with your colleagues in physics, chemistry, biology, history, music, other parts of engineering, because they are just ripe for applications and new kinds of insights that will help motivate new things. If you magically had enough extra time to do one additional thing at work that you are not doing now, what would it be? Actually, it would be to go home and spend more time with my family and kids. I have an incredible wife, Sharon, and three wonderful kids, Jillian, Scott, and Audrey. I just wish I could say I was more responsible than I am for how they have turned out. So I would spend more time at home. If you could change one thing about yourself as a computer science researcher, what would it be? I just wish I had the time to learn more things, because there are so many fascinating connections, and many things that I do are dealing with applying paradigms or insights that I picked up one place that shed a new light in another domain and lead to interesting new results. I just wish I had the opportunity to learn more things and keep up with all the things going on in computing and other fields. Well, thank you very much for talking with me today. Great, it was a pleasure to be with you. Thank you.
SIGMOD Record, June 2013 (Vol. 42, No. 2) 45
Database Research at the National University ofSingapore
Stephane Bressan Chee Yong Chan Wynne Hsu Mong-Li LeeTok-Wang Ling Beng Chin Ooi Kian-Lee Tan Anthony K.H. Tung
National University of Singapore, Singapore 117417
1. INTRODUCTIONAt the National University of Singapore (NUS),
the database group has worked on a wide range ofresearch, ranging from traditional database tech-nology (e.g., database design, query processing andoptimization) to more advanced database technol-ogy (e.g., cloud and big data management) to noveldatabase utilities (e.g., database usability, visual-ization, security and privacy). In this article, wedescribe some recent and on-going interdisciplinaryprojects for which we have received significant amountof funding.
2. CLOUD-BASED DATA MANAGEMENTWe have been developing e±cient cloud comput-
ing platforms for large-scale services, and Big Datamanagement and analytics using commodity hard-ware. We shall elaborate them below.
2.1 MapReduce-based SystemsOne of our goals is to allow users of MapReduce-
based systems to keep the programming model ofthe MapReduce framework, and yet to empowerthem with data management functionalities at anacceptable performance. We achieved this in twodirections. First, we sought to identify key de-sign factors of MapReduce (Hadoop) that aÆect itsperformance [17]. We conducted a comprehensiveand in-depth study of Hadoop, and found that, bycarefully tuning these factors, we can achieve muchbetter performance. For example, MapReduce canbenefit much from the use of indexes, and its perfor-mance can improve by a factor of 2.5 for selectiontasks and a factor of up to 10 for join tasks. We alsoshowed that, among the two types of I/O interfacesfor scanning data, the direct I/O mode is superiorover the streaming I/O mode.
Second, we have developed query processing en-gine under the MapReduce framework. At the op-erator level, we have developed join algorithms. Inparticular, our proposed MapReduce-based similar-
ity (kNN) join exploits Voronoi diagram to mini-mize the number of objects to be sent to the reducernode to minimize computation and communicationoverheads [25]. We also designed several schemes forprocessing multi-join queries e±ciently - while theMap-Join-Reduce mechanism [18] introduces a joinoperator to combine multiple datasets, the multi-join scheme in AQUA [40] exploits replication to ex-pand the plan space. We have also developed an au-tomatic query analyzer that accepts an SQL query,optimizes it and translates it into a set of MapRe-duce jobs [40]. Finally, to support data warehous-ing, we have leveraged on column store, and pro-posed Concurrent Join to support multi-way joinover the partitioned data [20]. In all these works,we target to reduce the number of MapReduce jobsto minimize the initialization overheads.
2.2 epiC: A V3-aware Data Intensive CloudSystem
Our second direction is driven by the limitationsof MapReduce-based systems to deal with “vari-eties” in the cloud data management. Most businessproduction environments contain a mixture of datastorage and processing systems; for example, cus-tomer data are maintained by a relational databaseand user requests are logged to a file system, whileimages and digital maps are handled by an objectstorage system. Processing and analyzing these dataoften requires diÆerent APIs and tools. SQL maybe used for generating reports, while proprietarylibraries may be used for feature extraction fromimages. Therefore, migrating such federated pro-duction systems into a centralized cloud infrastruc-ture introduces three kinds of varieties (called V3):variety of data (e.g., structured and unstructured),variety of storage (e.g., database and file systems),and variety of processing (e.g., SQL and proprietaryAPIs).
The V3 problem mentioned above poses two mainchallenges to the cloud data management system:resource sharing and heterogeneous data process-
46 SIGMOD Record, June 2013 (Vol. 42, No. 2)
ing. It is well known that deploying multiple stor-age systems on the same cloud can increase the uti-lization rate of underlying hardware since spacesreleased by one system can be reclaimed by an-other. However, the challenge is how to guaranteethe performance isolation. For example, systemslike HDFS or GFS are optimized for large sequentialscanning and thus prefer manipulating large files.Sharing disks between such systems with the key-value stores may degrade their performance sincekey-value stores frequently create and delete smallsized files, resulting in disk fragmentation.
MapReduce system is proven to be highly scal-able for large scale data processing. But the sys-tem requires its users to re-implement their existingdata processing algorithms with MapReduce inter-faces. As an example, one must implement an SQLengine on top of MapReduce in order to performSQL data processing. Such problem is not trivialfor federated production systems, where multipledata formats have to be supported.
As a response to the V3 challenge, we initiatedthe epiC project, a joint system project betweenresearchers from NUS and Zhejiang University [2].The goal of epiC is to provide a framework for facil-itating companies to deploy and migrate their fed-erated data systems to the cloud. The epiC sys-tem adopts an extensible design. The core of epiCprovides two services: virtual block service (calledVBS) which manages the cloud storage devices anda coordination framework (called E3 [9]) which co-ordinates independent computations over federatedsystems. To analyze the data, users invoke a setof computing units (called Actors). In each Actor,users employ their favorite APIs to process a spe-cific type of data and use E3 to coordinate theseActors for producing the final results.
We have developed a novel elastic storage system(ES2) [8] and deployed it on epiC. ES2 employsvertical partitioning to group columns that are fre-quently accessed together, and horizontal partition-ing to further split these column groups across acluster of nodes. A number of novel cloud-basedindexing structures (e.g., B+-tree [39, 12], bitmapindexes [24], R-tree index [37]) have been developed.
We have also examined how transactions can besupported. This led to the design of ecStore [35]. ec-Store exploits multi-version optimistic concurrencycontrol and provides adaptive read consistency onreplicated data.
2.3 Peer-to-Peer-based Cloud Data Man-agement
Another direction that we are pursuing is the in-
tegration of cloud computing, database and peer-to-peer (P2P) technologies. Exploiting a P2P architec-ture on a cluster of nodes oÆers several advantagesover the MapReduce framework: (a) It oÆers morerobust query processing mechanisms as nodes cannow communicate with one another; (b) It removesthe single point-of-failure in the master/slave ar-chitecture of MapReduce; (c) It facilitates elasticdesign as peers can be readily added and removedin a P2P architecture.
BestPeer++. We have developed BestPeer++[11, 10], a cloud-enabled evolution of BestPeer [26].BestPeer++ is enhanced with distributed access con-trol, multiple types of indexes, and pay-as-you-goquery processing for delivering elastic data shar-ing services in the cloud. The software componentsof BestPeer++ are separated into two parts: coreand adapter. The core contains all the data shar-ing functionalities and is designed to be platformindependent. The adapter contains one abstractadapter which defines the elastic infrastructure ser-vice interface and a set of concrete adapter compo-nents which implement such an interface throughAPIs provided by specific cloud service providers(e.g., Amazon). We adopt this “two-level” designto achieve portability. BestPeer++ instances areorganized as a structured P2P overlay network. Wehave used BATON [16], developed at NUS, as itcan support range queries e±ciently. The data areindexed by the table name, column name and datarange for e±cient retrieval.
Katana. The Katana framework is a novel peer-to-peer (P2P) based generalized data processing frame-work [14]. It can be deployed on many of the cur-rently known structured P2P overlays. The frame-work provides a programming model in which pro-cessing logic may be implicitly distributed with uni-versality and expressiveness, much like the MapRe-duce framework. The programming model can bedistinguished into a data model and a processingmodel. We adopt a key-value data model with pos-sible duplicated keys to represent the data elements.However, the data model is conceptually a graph-based model, i.e., data elements can be organizedinto a graph structure. Now, where the data is list-based, then the graph degenerates into a list. Thisfacilitates the mapping from the data elements tothe Cayley graphs which in turn can be mapped tothe structured P2P overlays.
Like MapReduce, the Katana processing modelhides the parallelism mechanism from the users. In-stead, it provides two MapReduce-like functions:
SIGMOD Record, June 2013 (Vol. 42, No. 2) 47
kata and ana. However, unlike MapReduce, thekata and ana functions are independent from oneanother and are not required to be executed one af-ter another. While kata jobs are used to performaggregation of some sort over the data elements,ana jobs are used to build datasets based on theinput data elements (i.e., to produce data graphsout of the input data graph). The execution essen-tially follows a post-order depth-first traversal of anarbitrary spanning tree of the data graph.
2.4 Big Data ProjectsOur experience on managing data in the cloud
has enabled us to participate in several large projectswith substantial funding. The first, funded by theNational Research Foundation of Singapore (NRF),focuses on exploiting cloud for large-scale data ana-lytics in environmental monitoring and waste man-agement in megacities [1]. This requires building aplatform for scientists to manage and analyze largeamount of sensor data collected from two cities (Sin-gapore and Shanghai) in order to detect emergentpollutants and manage waste. Our initial eÆort is todevelop LogBase, a scalable log-structured databasesystem that adopts log-only storage to remove writebottleneck and to support fast system recovery [36].In our current implementation, LogBase providesin-memory multi-version indexes and various pri-mary and secondary log-based index to speed upretrieval of data from the log. In addition, LogBasesupports transactions that bundle read and writeoperations spanning across multiple records.
The second project, also funded by NRF, aims todevelop a comprehensive IT infrastructure for BigData management, supporting data-intensive appli-cations and analyses. Our epiC project has formedthe basis for us to investigate various issues suchas iterative computations that cannot be well sup-ported by existing systems. At this moment, weare investigating check-pointing, recovery and con-currency issues in supporting iterative processingrequired for data analytics.
Finally, the third project comes under the Sensor-Enhanced Social Media (SeSaMe) Centre [3] jointlyfunded by Zhejiang University, NUS and Media De-velopment Authority (MDA). The SeSaMe researchcenter focuses on long-term research related to sensor-enhanced social media that enables linking of staticand mobile cyber-physical environments over theInternet by the abstraction of sensing, processing,transport and presentation. The center will also fa-cilitate the design of social media applications oncyber-physical systems through research advancesthat will transform the world by providing systems
that respond more quickly. In this project, our goalis to leverage the Cloud techniques to e±cientlymanage and retrieve streaming data from sensors,mobile phones and other real-world data sources tosupport the analytical jobs of real world problemand a tool to visualize the results. We are build-ing a new Cloud-based streaming engine to handlerequests e±ciently and reliably.
3. TSINGNUS: A LOCATION-BASED SER-VICE SYSTEM TOWARDS LIVE CITY
The NUS-Tsinghua Extreme Search (NExT) Cen-ter [4], funded by the Media Development Author-ity (MDA) of Singapore, is a joint collaboration be-tween the NUS and Tsinghua University to developtechnologies towards a livable city. The programbrings together researchers from diÆerent fields (mul-timedia, networks, databases) from the two univer-sities to facilitate extreme search over large amountof real-time and dynamic data - social media (e.g,blogs, tweets, q&a forum), video, image, textual(documents) and structured data - beyond what isindexed in the web.
TsingNUS [6, 19] is a location-based service sys-tem that focuses on exploiting database technolo-gies to support location-based services. TsingNUSgoes beyond traditional location-aware applicationsthat are based solely on user locations. Instead, Ts-ingNUS aims to provide a more user-friendly location-aware search experience. First our location-awaresearch-as-you-type feature enables answers to be con-tinuously returned and refined as users type in queriesletter by letter [45]. For e±ciency, we proposedthe prefix-region tree (PR-tree), a tree-based indexstructure that organizes the dataspace into a hier-archy of spatial-textual regions such that (a) thespatial component of nodes nearer to the root arelarger, and (b) the textual component of nodes nearerto the root are prefix of the textual component ofdescendant nodes.
Second, TsingNUS oÆers e±cient mechanisms toprocess spatial-keyword queries for both AND se-mantics (where all keywords must appear in theretrieved content) and OR semantics (where somekeywords appear in the retrieved content) [42]. Ournewly developed scalable integrated inverted index,I3, is an inverted index of keyword cells. A key-word cell denoted (keyword w, cell c) refers to alist of documents that contain w and the associatedspatial locality of the documents fall in region c. Wehave used the Quadtree structure to hierarchicallypartition the data space into cells.
Third, TsingNUS incorporates continuous spatial-keyword search to e±ciently support continuously
48 SIGMOD Record, June 2013 (Vol. 42, No. 2)
moving queries in a client-server system [15]. Wehave developed an eÆective model to represent thesafe region of a moving top-k spatial-keyword query.Such a region bounds the space for which the user(and hence the query) may move while the answersremain valid.
We are extending our work to road networks (e.g.,finding frequent routes [7]) and to support a widervariety of query types (e.g., nearest group queries[41]). We are also exploring how users’ social net-works can be tapped upon to support more sophis-ticated queries.
4. INTEGRATED MINING AND VISUAL-IZATION OF COMPLEX DATA
The drive to find gold nuggets in data has re-sulted in the explosion of discovery algorithms inthe past decade. Many of these discovery algo-rithms focus on specific data type. However, withthe advances of technology, many applications nowinvolve records with attributes of diverse data types,ranging from categorical, to numerical, to time se-ries, to trajectories.
Knowing the relationships among all the diÆer-ent types of data can aid in the understanding ofa patient health condition. For example, supposewe have a frequent itemset Male, Smoker and aninterval-based temporal pattern Headache OverlapHighBloodPressure. If these two patterns occur to-gether, it may raise an alarm as studies have shownthat a male smoker who experiences headache withelevated blood pressure has a high risk of havingcardiovascular disease.
Handling datasets with such variety is a challengeas the complexity of the problem can quickly growout of hand. We have developed a framework toperform the integrated mining of big data with di-verse data types [28]. The framework consists ofalgorithms for mining patterns from interval-basedevents [27], lag patterns involving motifs in time se-ries data [29], spatial interaction patterns [32, 31],duration-aware region rules and path rules for tra-jectories [30]. With this, we are able to capturethe associations among diÆerent complex data typesand demonstrate how these patterns can be used toimprove the classification accuracy in various realworld datasets.
We have also developed a tool, in cooperationwith the Center for Infectious Diseases Epidemiol-ogy and Research at the Saw Swee Hock School ofPublic Health, to generate and highlight interestingpatterns discovered from the diÆerent data types.This tool will also allow the visualization of eventincidences, clusters and heat maps. Ongoing re-
search aims to develop an interactive system for thevisualization and analysis of trajectories.
5. QUERY REVERSE ENGINEERINGTo help users with constructing queries and un-
derstanding query results, we have developed an ap-proach, termed Query by Output (QBO), to reverseengineer queries given an input pair of database andquery output. Given a database D and a result tableT = Q(D), which is the output of some query Q onD, the goal of QBO is to construct candidate queriesQ’, referred to as instance-equivalent queries, suchthat the output of query Q’ on database D is equalto Q(D).
We have applied QBO to improve database us-ability in two contexts. In the first scenario, QBOis used to help users better understand their queryresults by augmenting the result of a query Q (w.r.t.a database) with instance-equivalent queries thatdescribe alternative characterizations of their queryresults [34]. As an example, suppose that a univer-sity physician issues a query to his clinic’s databaseto find students who have been infected with a skinrash over the past week. Besides returning the queryresult, if the database system had also computedand returned an equivalence-instance query that re-vealed the additional information that all the stu-dents in the query result either had recently re-turned from an overseas trip to region X or arestaying in the same dormitory as those students,then the physician could have been alerted about apotential skin rash outbreak in those dormitories.Thus, it is useful to augment a query’s result withalternative characterizations of the query’s result toprovide additional insightful information.
In the second scenario, QBO is used to gener-ate explanations for unexpected query results thathave missing expected result tuples [33]. As an ex-ample, suppose that a manager issues a query tocompute the annual sales figures for each of herregional sales agents and she is surprised to findthat Alice’s sales performance is lower than that ofBob’s, which is inconsistent with her impression oftheir results. The manager could issue a follow-up“why-not” question to clarify why Alice’s sales fig-ure is not higher than that of Bob’s. Using QBO,the database system could respond to this why-notquestion with an explanation in the form of an alter-native query (e.g., compute total sales for each salesagent excluding the period when Alice was on sickleave) which would have returned an output resultthat is consistent with the manager’s why-not ques-tion. Thus, providing a capability to explain why-not questions would be very useful to help users
SIGMOD Record, June 2013 (Vol. 42, No. 2) 49
understand their query results. We are currentlyimplementating a query acquisition tool based onQBO that enables users to construct queries fromexamples of database and query result pairs.
6. DATA ANALYTICSIn addition to developing novel platforms for e±-
cient data analytical processing, we are also lookingat bringing human into the loop.
6.1 CrowdSourcingWe are developing a data analytics system that
exploits crowdsourcing to manage complex tasks forwhich human can oÆer better (especially in terms ofaccuracy) alternative solutions. Our system, calledCrowdsourcing Data Analytics System (CDAS), isdesigned to support deployment of crowdsourcingapplications [23, 13]. In CDAS, a task is split intotwo parts - the computer-oriented tasks and human-oriented tasks. Crowdsourcing is employed to han-dle the human-oriented tasks. The results of the twotasks are then integrated. CDAS has a number offeatures that distinguish it from other crowdsourc-ing systems. First, CDAS has a quality-sensitive an-swering model that guides the crowdsourcing engineto process and monitor the human-oriented tasks.To reduce costs, the model employs a predictionmodel to estimate the number of workers requiredin order to achieve a certain level of accuracy. Toensure the quality of the estimation, historical in-formation on reliability of workers is used. In fact,we also inject tasks for which answers are known inorder to gauge the reliability of the workers. In ad-dition, CDAS adopts a probabilistic approach (in-stead of the naive voting-based strategy) to verifythe correctness of answers from workers. The ideaof the scheme is to combine vote distribution of thecurrent tasks and the historical accuracies and re-liability of workers to determine the quality of thecurrent answers by the workers. The intuition is togive higher weights to reliable workers.
Second, since workers complete their tasks asyn-chronously, CDAS supports “online aggregation”,i.e., answers (with quality bounds) are continuouslydisplayed and refined as responses from workers arereceived. This reduces the initial response time toend-users significantly.
We have demonstrated the eÆectiveness of CDASin terms of both performance and ease of use in twodiÆerent applications. A twitter sentiment analyt-ics system has been developed on top of CDAS foranalyzing the sentiments of movie goers. Anotherimage tagging system has been built to facilitateimage tagging of Flickr images. We have also ex-
ploited crowdsourcing in web table mapping andschema integration.
6.2 Collaborative Visual AnalyticsIn this research, we study how people can collab-
oratively achieve certain tasks by sharing their dataand analytics results through the social network.
We have set up the Internet Observatory project[5] with the goals to monitor and analyze the dy-namic user-generated contents on the Internet, andto provide a platform for users to share their find-ings. To provide context, we index these dynamiccontents via Wikipedia, a well-established onlineencyclopedia which have entries for large numberof entities and concepts [22, 21]. As an example,consider the Wikipedia entry for Senkaku Island
Dispute. Besides visualizing the Wikepedia en-try, our system also displays dynamic information(obtained from other sources) that are related toSenkaku Island Dispute including URLs, images,tag summarization, community view and geograph-ical view. Currently, our system provides users witha set of social websites that they can choose to lo-gon to in order to extract related information. Thisallows users to link/compare them to other infor-mation and opinions on the Internet. By doing so,the user is implicitly adding his/her private datainto a public pool for general analysis.
We have also started the ReadPeer project whichaims to promote reading as a large scale social ac-tivity by integrating ebooks and social networks toencourage more people to read and discuss aboutthe materials they read. Our ReadPeer system al-lows users to make annotations on ebooks, researcharticles or any documents in PDF format. These an-notations can be linked to various multimedia con-tents like blogs, videos, images, web links etc. andshared to friends in a social network.
Our approach to collaborative visual analytics in-volve reorganizing social media messages around acenter of focus like Wikipedia articles or ebooks in-stead of putting these messages in a plain news feed.This allows users of common interest to come to-gether to share their insights and analysis. Centralto this is the design of visual interfaces that allowusers to communicate and understand each other’sperspectives. Moreover, these interactions generatedatabases that capture a lot of interesting seman-tics through linkages of social media messages intoa rich information network. Visualizing such a richinformation network is challenging [43, 44, 38].
7. ACKNOWLEDGEMENTSMany of our research are done in collaboration with
50 SIGMOD Record, June 2013 (Vol. 42, No. 2)

international visitors. These include Divy Agrawal,Elisa Bertino, H.V. Jagadish, David Maier and TamerOzsu. We also thank our research fellows for theircontributions to our group. Finally, special thanksto our many graduate students - without them, wewould not be where we are today!
8. REFERENCES[1] Energy and environmental sustainability solutions for
megacities. http://www.nus.edu.sg/neri/E2S2.html,2013.
[2] epiC@NUS. http://www.comp.nus.edu.sg/~epic,2013.
[3] SeSaMe. http://sesame.comp.nus.edu.sg/, 2013.[4] The NExT Center. http://next.comp.nus.edu.sg,
2013.[5] Trendspedia. http://www.trendspedia.com/, 2013.[6] TsingNUS. http://tsingnus.comp.nus.edu.sg, 2013.[7] H. Aung, L. Guo, and K. L. Tan. Mining
sub-trajectory cliques to find frequent routes. InSSTD, 2013.
[8] Y. Cao, C. Chen, F. Guo, D. Jiang, Y. Lin, B. C. Ooi,
H. T. Vo, S. Wu, and Q. Xu. Es2: A cloud datastorage system for supporting both oltp and olap. InICDE, pages 291–302, 2011.
[9] G. Chen, K. Chen, D. Jiang, B. C. Ooi, L. Shi, H. T.Vo, and S. Wu. E3: an elastic execution engine forscalable data processing. JIP, 20(1):65–76, 2012.
[10] G. Chen, T. Hu, D. Jiang, P. Lu, K. L. Tan, H. T. Vo,and S. Wu. Bestpeer++: A peer-to-peer basedlarge-scale data processing platform. In TKDE(Special Issue for Best Papers in ICDE’2012).
[11] G. Chen, T. Hu, D. Jiang, P. Lu, K. L. Tan, H. T. Vo,and S. Wu. Bestpeer++: A peer-to-peer basedlarge-scale data processing platform. In ICDE, pages582–593, 2012.
[12] G. Chen, H. T. Vo, S. Wu, B. C. Ooi, and M. T. Ozsu.A framework for supporting dbms-like indexes in thecloud. PVLDB, 4(11):702–713, 2011.
[13] J. Gao, X. Liu, B. C. Ooi, H. Wang, and G. Chen. Anonline cost sensitive decision-making method incrowdsourcing systems. In SIGMOD Conference, 2013.
[14] W. X. Goh and K. L. Tan. Katana: Generalized dataprocessing on peer-to-peer overlays. In IC2E, 2013.
[15] W. Huang, G. Li, K. L. Tan, and J. Feng. E±cientsafe-region construction for moving top-k spatialkeyword queries. In CIKM, pages 932–941, 2012.
[16] H. V. Jagadish, B. C. Ooi, and Q. H. Vu. Baton: Abalanced tree structure for peer-to-peer networks. InVLDB, pages 661–672, 2005.
[17] D. Jiang, B. C. Ooi, L. Shi, and S. Wu. Theperformance of mapreduce: An in-depth study.PVLDB, 3(1):472–483, 2010.
[18] D. Jiang, A. K. H. Tung, and G. Chen.Map-join-reduce: Toward scalable and e±cient dataanalysis on large clusters. IEEE Trans. Knowl. DataEng., 23(9):1299–1311, 2011.
[19] G. Li, N. Zhang, R. Zhong, W. Huang, K. L. Tan,J. Feng, and L. Zhou. TsingNUS: A location-basedservice system towards live city (demo). In SIGMOD,2013.
[20] Y. Lin, D. Agrawal, C. Chen, B. C. Ooi, and S. Wu.Llama: leveraging columnar storage for scalable joinprocessing in the mapreduce framework. In SIGMODConference, pages 961–972, 2011.
[21] C. Liu, B. Cui, and A. K. H. Tung. Integrating web 2.0resources by wikipedia. In ACM Multimedia, pages707–710, 2010.
[22] C. Liu, S. Wu, S. Jiang, and A. K. H. Tung. Crossdomain search by exploiting wikipedia. In ICDE, pages546–557, 2012.
[23] X. Liu, M. Lu, B. C. Ooi, Y. Shen, S. Wu, andM. Zhang. Cdas: A crowdsourcing data analyticssystem. PVLDB, 5(10):1040–1051, 2012.
[24] P. Lu, S. Wu, L. Shou, and K. L. Tan. An e±cient andcompact indexing scheme for large-scale data store. InICDE, 2013.
[25] W. Lu, Y. Shen, S. Chen, and B. C. Ooi. E±cientprocessing of k nearest neighbor joins usingmapreduce. PVLDB, 5(10):1016–1027, 2012.
[26] W. S. Ng, B. C. Ooi, K. L. Tan, and A. Zhou. Peerdb:A p2p-based system for distributed data sharing. InICDE, pages 633–644, 2003.
[27] D. Patel, W. Hsu, and M. L. Lee. Mining relationshipsamong interval-based events for classification. InSIGMOD Conference, pages 393–404, 2008.
[28] D. Patel, W. Hsu, and M. L. Lee. Integrating frequentpattern mining from multiple data domains forclassification. In ICDE, pages 1001–1012, 2012.
[29] D. Patel, W. Hsu, M. L. Lee, and S. Parthasarathy.Lag patterns in time series databases. In DEXA (2),pages 209–224, 2010.
[30] D. Patel, C. Sheng, W. Hsu, and M. L. Lee.Incorporating duration information for trajectoryclassification. In ICDE, pages 1132–1143, 2012.
[31] C. Sheng, W. Hsu, M. L. Lee, and A. K. H. Tung.Discovering spatial interaction patterns. In DASFAA,pages 95–109, 2008.
[32] C. Sheng, Y. Zheng, W. Hsu, M. L. Lee, and X. Xie.Answering top-k similar region queries. In DASFAA(1), pages 186–201, 2010.
[33] Q. T. Tran and C. Y. Chan. How to conquer why-notquestions. In SIGMOD Conference, pages 15–26, 2010.
[34] Q. T. Tran, C. Y. Chan, and S. Parthasarathy. Queryby output. In SIGMOD Conference, pages 535–548,2009.
[35] H. T. Vo, C. Chen, and B. C. Ooi. Towards elastictransactional cloud storage with range query support.PVLDB, 3(1):506–517, 2010.
[36] H. T. Vo, S. Wang, D. Agrawal, G. Chen, and B. C.Ooi. Logbase: A scalable log-structured databasesystem in the cloud. PVLDB, 5(10):1004–1015, 2012.
[37] J. Wang, S. Wu, H. Gao, J. Li, and B. C. Ooi.Indexing multi-dimensional data in a cloud system. InSIGMOD Conference, pages 591–602, 2010.
[38] N. Wang, S. Parthasarathy, K. Tan, and A. K. H.Tung. Csv: visualizing and mining cohesive subgraphs.In SIGMOD Conference, pages 445–458, 2008.
[39] S. Wu, D. Jiang, B. C. Ooi, and K. L. Wu. E±cientb-tree based indexing for cloud data processing.PVLDB, 3(1):1207–1218, 2010.
[40] S. Wu, F. Li, S. Mehrotra, and B. C. Ooi. Queryoptimization for massively parallel data processing. InACM SOCC, 2011.
[41] D. Zhang, C. Y. Chan, and K. L. Tan. Nearest groupqueries. In SSDBM, 2013.
[42] D. Zhang, K. L. Tan, and A. K. H. Tung. Scalabletop-k spatial keyword search. In EDBT, pages359–370, 2013.
[43] F. Zhao, G. Das, K. Tan, and A. K. H. Tung. Call toorder: a hierarchical browsing approach to elicitingusers’ preference. In SIGMOD Conference, pages27–38, 2010.
[44] F. Zhao and A. K. H. Tung. Large scale cohesivesubgraphs discovery for social network visual analysis.PVLDB, 6(2), 2012.
[45] R. Zhong, J. Fan, G. Li, K. L. Tan, and L. Zhou.Location-aware instant search. In CIKM, 2012.
SIGMOD Record, June 2013 (Vol. 42, No. 2) 51
What does an Associate Editor actually do?
Graham [email protected]
ABSTRACTWhat does a Associate Editor (AE) of a journal actuallydo? The answer may be far from obvious. This articledescribes the steps that one AE follows in handling asubmission. The aim is to shed light on the process, forthe benefit of authors, reviewers, and other AEs.
1. INTRODUCTIONJournal publications are an important part of the prop-
agation of results and ideas in computer science. Papersin prestigious journals reflect well on their authors, andserve to provide a full, detailed and peer-reviewed de-scription of their research. Yet, the process from sub-mission to decision is opaque. A researcher typicallysubmits their paper to a journal and then waits months(sometimes many months) before receiving a set of re-views and a decision on whether the journal will pursuepublication of the submission. It is far from obvious tothe researcher exactly what is going on during this time.
The purpose of this article is to shed more light on thisprocess, by describing the typical sequence of eventsfrom the perspective of the associate editor. The hopeis that this serves multiple purposes:
• To help authors understand the process, and allowthem to make their submissions with this knowl-edge.
• To help journal reviewers understand their role inthe process, and how they can be most effective inhelping to determine the right outcome for a sub-mission.
• To help me (and, by extension, other associate ed-itors) think of the process more clearly, and opti-mize our role within it.
The editorial structure of a journal varies between ti-tles, but in general there is an editorial board which con-sists of an Editor-in-Chief (EiC) and multiple AssociateEditors (AE). The role of this board is to determine whichpapers to accept for publication in the journal.
In general, the EiC receives new submissions and al-locates these to AEs for handling through the reviewand decision process. The complete range of tasks per-formed by the EiC is not necessarily known to the AE:there are many “behind-the-scenes” tasks performed thatthey do not get to see1.
This article focuses on the role of the AE in the ed-itorial process, in order to answer the question “Whatdoes an Associate Editor actually do?”. The answer isfar from obvious: for example, one thing the AE doesnot typically do is “edit” papers in the popular sense ofthe word2. Rather, the AE’s main task is to make edi-torial recommendations to the EiC about what decisionshould be made on submitted papers.
To accomplish this, the AE has a seemingly simple setof responsibilities: to obtain referee reports for each pa-per they are assigned, and use these to make their recom-mendation for the paper, in a timely fashion. The execu-tion of these tasks however requires quite a substantialamount of effort; moreover, this effort is concentratedin areas that might not be initially obvious. To explainthis, I will describe the detailed sequence of steps thatI follow between receiving a new assignment and pro-viding my recommendation. A standard caveat applies:this description reflects my perspective and processes,informed by input from others (for example, [5]). Dif-ferent AEs will no doubt have different approaches tothe job. The author takes no responsibility for any loss,damage, or injury that may result from following anyadvice in this article.
Outline. In Sections 2 and 3, I outline the two maincomponents of the AE’s job: initial handling and selec-tion of reviewers for a paper (Section 2), and obtaininga decision for a paper (Section 3). In Section 4, I offersome suggestions for reviewers, authors, and associateeditors in turn.
1In more blunt terms, I don’t fully know what the EiC does.2The person who does make edits to accepted papers is thesub-editor, although in my experience this primarily involvesthe insertion or removal of commas.
152 SIGMOD Record, June 2013 (Vol. 42, No. 2)
2. SECURING REVIEWERS
Step 0: pre-processing. When a paper is submitted to ajournal, it receives some attention before being assignedto an AE for handling. The EiC, and possibly an ed-itorial assistant, will look over the paper. The generalgoal of this step is to check that the paper is suitable forfurther processing: Does it meet the formatting require-ments? Is it generally on-topic for the journal? does ithave a clear, novel technical contribution? Is it possibleto open the files? Is it written in the language used bythe journal? If the paper passes these checks, then theEiC will identify an AE to handle the paper, and assignit to them. The choice of which AE will handle the pa-per may depend on many factors: whether it falls withinthe AE’s area of expertise, the relative workload of theAEs, avoiding potential conflicts of interest between theauthors and the AE, and so on3.
In most journals, the paper is handled via a web-basedmanuscript system (with a generic sounding name likeScholarCentral or ManuscriptOne), which tends to en-force a particular workflow. The web-based manuscriptsystem (WBMSS) will generate email alerts to each par-ticipant when they have a task to perform. So when apaper is assigned to me, the WBMSS will generate anemail message telling me that I have work to do.
You’ve got email. My process on receiving a new pa-per to handle is as follows: I first sigh4, realizing thatthis means more work to do. Then I am overcome withexcitement about the prospect of guiding a fresh paperthrough the journal submission process.
I next take a print out of the main paper and any coverletter. As soon as possible, I run a hot bath, and immersemyself in the water and in the paper5. I then read thepaper to get an idea of what it is about, roughly whattechniques is it using, and what papers are most relevantto the work in hand.
My objective in this phase of the process is to identifya set of researchers to contact and ask them to providea review of the submission. As such, my approach isquite different to when I am reviewing a paper myself.As an AE, I do not find it necessary to comprehend everylast detail of the paper, or even to grasp all of the ideaspresented. Rather, my goal is to find experts who canunderstand the paper in detail, and provide commentaryon its significance and novelty. Consequently, I try toavoid forming a strong opinion about whether the sub-mission should be accepted: the bulk of that work will
3I suspect that a whole new article could be written about thejob of the EiC, and I would encourage someone to do so.4Or, according to taste, shriek, cry out, rend my clothing, orask “Why me?”5People often ask me why I read papers in the bath. I patientlyexplain that it would be hopeless to try to do this in the shower.
be on the reviewers. However, based on my initial read-ing of the paper, I will have a sense of the general levelof the paper.
Sometimes it is clear that the paper does not meet thestandards of the journal. In such cases, an AE may pro-vide an “administrative reject” decision (also known asa “desk reject”). I do this when I am certain that thepaper stands almost no chance of eventually being ac-cepted. In particular, I want to be able to provide theauthors with a supportable reason for the reject deci-sion and feedback that they can make use of. ReasonsI consider suitable to motivate an administrative rejectinclude if the submission is presented so badly it is im-possible to understand any of what is being said; if theresults very clearly duplicate prior work; if the topic ofthe paper seems very much out of scope for the journal;or if the submission includes text that appear in otherpreviously published papers and thus violates the jour-nal’s plagiarism policy. In my experience, submissionsmeeting any of these criteria are not common, perhapsbecause the EiC catches them before they are assignedto an AE.
There are still some papers which I believe are bor-derline for the journal, but which do not match any ofthe above conditions. In these cases, I can invite review-ers to review the paper, even though I think its prospectsare poor. It is better to allow a seemingly poor paper afair chance with expert reviewers, than for an AE whois not an expert in its area to deny it any chance. Thisgives the authors of the paper a fuller set of reviews,which is hopefully of use to them. The tradeoff is thatI am asking reviewers to give their time to review whatmay be a poor paper. My rationale is that reviewing ispart of the service we owe the community in return forsubmitting our own papers, and we cannot always ex-pect high-quality papers to read. Moreover, it should bea relatively quick task for an expert if the submission isindeed of low quality to make an assessment and to pre-pare a short review highlighting the deficiencies. I caninvite fewer reviewers (say, two), if I think that there isa good chance that they will both provide negative re-views.
As a third option, I sometimes desk reject based on afixable issue, such as problems with figures or format-ting. In the feedback to authors, I let them know that itis permissible to resubmit a corrected version of the pa-per. I also indicate that I believe that such a revision isunlikely to meet the high standards of the journal. Thisleaves the door open for the authors to resubmit, whileindicating heavily that they would do well to reconsidertheir choice of venue.
Picking Reviewers. After getting a sense of the paper,my next step is to identify a set of potential reviewersto invite. I think about the paper as I understand it, and
2SIGMOD Record, June 2013 (Vol. 42, No. 2) 53
which researchers are active in that area or related areas.I cast my mind over papers I have read, presentations Ihave seen, and conversations I have had to identify whois suitably expert on the topic. There doesn’t have to bean exact match – perhaps the application is unusual, buta reviewer has used similar techniques.
I also draw ideas for reviewers from the paper. Doesthe paper make extensive reference to some prior work?Does it compare to a method described in a previous pa-per? Then there is a good chance that I will invite the au-thors of these papers (assuming that they do not overlapwith the authors of the current submission) to performthe review. I may do some speculative searching – arethere keywords or problem descriptions from the paperthat I can find other papers about online? In particular,can I find papers on similar topics published in the samejournal – since I feel the authors of those works owe areview back to the journal.
After brainstorming for a while, I usually have a listof half a dozen potential reviewers. I do some additionalresearch on them to ensure that they are well-placed tohelp. Before inviting each reviewer, I check their home-page and their entry on DBLP. I look at the titles andvenues of their papers, and years in which they havebeen active in this area, and also descriptions of theircurrent role and activities.
Other commitments. I tend to avoid asking people whoindicate that they are the head of a large research group,chair of their department and active in running a start-upat the same time. Such people tend to be too busy to per-form reviewing tasks6. Advanced graduate students canbe a good fit because they know their focus area verywell, and have very few other pressing demands on theirtime7; however, it is sometimes hard to tell which stu-dents are mature enough in their area without a personalrecommendation. So the bulk of reviewing falls uponfaculty and researchers who don’t appear too busy, ordon’t yet realize how busy they are.
I avoid asking EiCs and AEs of any journal to per-form a review: they are usually far too occupied withthe submissions for their own journal. In particular, Iavoid asking an AE from the same journal to assist 8.Still Active? The editor’s curse is to find someone whohas worked on some highly related topics, only to dis-cover that their last publication was in 1999. Usuallythis means that they have left research for another career,
6They often appear to be too busy even to respond to reviewrequests.7Graduation can wait.8I hope they realize that this is why I turn down their corre-sponding review requests. Ideally, the EiC would always as-sign the paper to the most expert AE on that topic. However,I have gradually come to realize that EiCs are less omniscientthan one might at first imagine them to be.
retired, or abandoned this area of study9. In some cases,I identify a reviewer who would be perfect to help witha paper, only to discover that they are no longer alive,which I find most inconsiderate.
Following this analysis of reviewers, I pick a shortlistof 3 or 4, and start to send out invitations. The WBMSStypically has a default invitation template describing theexpectations. I personalize this invitation, to give someindication of why I have invited the reviewer: for ex-ample, because I think the submission relates to theirexpertise on a topic, or because it compares to their sys-tem, for example. My hope is that this personal touchwill make them more likely to accept the invitation. Theinvitation can also indicate if the paper is a resubmis-sion, an invited submission or an extended version of aconference paper.
I might include the submitted manuscript with theinvitation. When I am invited to review, I often findit helpful to quickly scan the submission, to determinehow relevant it is and much effort it will be. Whensuitable, I like to give other reviewers this opportunity.However, I must admit, when a paper seems particularlylong and technically dense, I may avoid sending it, forfear of scaring off the potential reviewer.
Dealing with rejection. Inevitably, some invitations toreview will be met with rejection. Indeed, in my expe-rience about half of responses are negative. This can befor many reasons, of varying validity: the invitee is toobusy, does not consider themself an expert on the subjectmatter, does not find the paper interesting, or just doesn’tfeel like it on the day. A negative response does not an-noy me (unless I feel that the paper really was spot-onfor the reviewer). What does irk me are two things:Tardiness – it should not take a long time to respond toa review request. If people are actively at work, I wouldhope to hear a reply within a couple of days; if travelingor otherwise tied-up, I would still hope to hear withina week or so10. It pains me when an invitee sits on arequest for weeks, and then declines (possibly only aftera reminder). Even when the invitation is accepted aftera long pause, this can be a troubling sign, as it indicatesthat the review itself may be similarly delayed.Lack of alternative suggestions – my favourite type ofresponse is actually a very fast negative response thatcomes with a list of suggested alternate reviewers. Thismeans that the invitee has thought about the invitation,understands that they are unable to commit to it, but has9One does not like to name names, but on multiple occasions Ihave had papers which refer heavily to the work of S. Brin andL. Page. However, these two stopped publishing in the 1990’s,and have not responded to any of my requests for reviewing.I can only assume that these promising researchers have givenup on academia, and followed a less rewarding career in in-dustry.
10Everyone checks their email while on vacation, right?
354 SIGMOD Record, June 2013 (Vol. 42, No. 2)
considered it enough to come up with a list of otherswho may be able to help. This is particularly valuablewhen the area of the submission is less familiar to me.As a reviewer, I suggest alternates when I am unable toassist – unless I really don’t know the topic. As a result,when an subject matter expert declines, I often followup with an email pushing for some suggested alternatereviewers. I encourage people to feel obliged to providealternates when declining an invitation.
Adding more reviewers. When reviewers decline aninvitation, I need to find more reviewers to invite. Some-times I have some back-ups already picked, or can takeadvantage of suggestions from those who have declined.I avoid having more than four “active” invitations atone time, in case all reviewers accept: it is redundantto have a large number for one paper. Often though,I need to find some new candidates. This is perhapsthe toughest part of the job, as it means further headscratching to come up with good candidates. It is quitedispiriting when a large number of reviewers have de-clined to review a paper. The worst case is when thepaper is quite specialized, and all the natural candidateshave been tapped. It is particularly galling when, afterprompting for other reviewers, the suggestions consistof candidates who have already declined. At this stage,the AE can feel that the task of finding enough suitableexperts to evaluate a paper may be impossible. How-ever, with persistence, enough reviewers will eventuallyagree.
Reaching Acceptance. When sufficient reviewers haveagreed to review a paper (usually three or four), anddates for the review have been agreed, the initial phaseof the process is complete. I can sit back, relax, and waitfor the reviews to arrive.
3. GETTING TO A DECISION
The whooshing sound they make as they fly by. WhenI first started working as an AE, I imagined that the bulkof the effort was in weighing up the reviews for a paper,and synthesizing these to come up with a careful, con-sidered decision and rationale for it. This a much lesssignificant part of my work than I had thought. Indeed,it seems that much of the effort of the AE is in remind-ing, cajoling and threatening reviewers who have agreedto provide a review, but who fail to fulfil their promises.
In the ideal situation, reviewers will perform their taskwithin the allotted time (typically, six weeks to a fewmonths), and deliver a carefully thought-out, clearly ex-pressed review. Indeed, most reviewers do an excellentjob in this regard, and I am truly grateful to them. How-ever, there are many cases where things do not followthis outline, and more active involvement is required.
The WBMSS usually includes a “due date” for eachreview (which can be set by the AE), and may automat-ically remind the reviewer as the deadline approachesand is passed. In addition, around the time of the dead-line, I send a personalized reminder, as this is harder toignore than an automated message. I do not keep de-tailed statistics, but while many reviews are received ontime, it is a sad fact that a large fraction are late. A lit-tle tardiness is forgivable, but after more than a week,it starts to become a problem. Many journals strive tohave a rapid turnaround time for submissions, and de-layed reviews are the biggest obstacle to achieving thisgoal [4, 5].
Checking this requires more of my attention. I haveto keep an eye on which reviews are late, and send re-minders to reviewers, requesting that they make goodon their promise, and deliver their review. The pres-sures that I can bring to bear are limited: I can send in-creasingly plaintive requests, or express my displeasureor anguish at the continued delay; I can try to provokeguilt or regret in the reviewer; but there are few directactions I can take against the tardy reviewer. Persistenceis my only weapon. In a few cases I have given up onreceiving a review when the other reviews received weresufficient to reach a decision.
The reviews are in. When I do receive a review, I read itcarefully, and check that there are not any obvious prob-lems with it. Problems in reviews are rare, but occasion-ally it may be clear that the reviewer’s standards are notcalibrated for the venue (too harsh, or too lenient); orthat the recommendation does not align with the contentof review (e.g. many major flaws highlighted, but an“accept” recommendation). Reviews can sometimes beimproved by clarifying what is expected from a revision,and ensuring that the discussion is as objective as pos-sible. The AE can ask a reviewer to revise or elaboratetheir review. Very rarely, there may be inconsistenciesacross reviews that are resolved by an (email) discussionwith the AE in the middle.
The Big Decision. When there are sufficient reviewsfor a paper, I can make a decision. The typical num-ber is three, but more or fewer is possible. I am happyto recommend rejection for a paper on the basis of tworeviews which agree on this outcome, or even one in ex-treme cases. For a positive recommendation, I prefer tohave received three reviews, even if they are not unani-mous. Collecting four reviews is reasonable (and acts asinsurance against one reviewer going awol); more thanfour is unusual except for very selective journals.
I usually find it fairly swift to make a decision: re-views often agree on the general level of quality and in-terest in a submission. Some normalization is neededbased on the standards of the journal, but in general itis quick to weigh the comments and scores of the re-
4SIGMOD Record, June 2013 (Vol. 42, No. 2) 55
viewers, and reach a consensus. The process is guidedalmost exclusively by the reviews–my opinions of thepaper carry almost no weight at this point11. The firstdecision is a binary one: Is there any prospect of pub-lishing this paper in the journal? Does it show enoughpotential and interest? If not, then the recommendationis to “reject” the paper. This recommendation is accom-panied by a justification, summarizing the reasons forrejection: I identify the main reasons from reviews thatled to the decision. It may include more or less encour-agement to submit to another venue, especially if thesubmission was ultimately judged out of scope or be-low threshold for my journal. The authors may appeal areject decision, either to the AE or the EiC, but withoutevidence of serious unfairness this is unlikely to alter theoutcome. A rejected paper is sometimes resubmitted tothe same journal, after some revisions. Most journalswill try to catch this, and either reject automatically, orassign it to the same AE to handle.
If the paper is not rejected, there are three possiblerecommendations: “accept (as is)”, “minor revision”,and “major revision”. The exact semantics of this varydepending on the journal, but as a rough guide, a ma-jor revision will be returned to the same reviewers toget their opinion on the new version; a minor revisionwill be scrutinized by the AE; and an accept will movestraight into the publication queue. However, the AEhas a lot of leeway: a minor revision may be sent outto reviewers; and a major revision may be sent only toa subset of reviewers, or new reviewers may be added.I won’t spell out all the situations that can arise, but theunderlying issue is the same: before giving an “accept(as is)” decision, I want to be certain that the paper rep-resents a sufficient contribution for publication in thejournal. When the reviews indicate some notable ques-tions or concerns, I want to be assured that these aresuitably addressed before recommending the paper forpublication. Sometimes I can do this myself (based onthe revised submission, and any cover letter or list of re-visions, and comparing these to the original reviews); orI may seek the opinion of the original reviewers on suchquestions.
Recommendations and Decisions. You may notice thatan AE makes a “recommendation”, not a “decision”.This is deliberate terminology: it is the EiC who makesthe decision, not the AE, who merely recommends anoutcome. I will let you into a secret: I have not en-countered cases where the EiC’s decision did not followthe recommendation of the AE, although this does hap-pen. I find that this is a useful way of thinking about
11Occasionally, an AE may enter their own review for a paperthey are handling on a topic are familiar with, especially if theinvited reviewers have not done a timely job. Then this reviewis weighed up with the others.
the process. It reminds me that I have to justify my rec-ommendation both to the authors and to the EiC; I amnot making decisions at my whim. Once I submit myrecommendation on a paper to the EiC, I can again sitback: my work – for now – is done.
Revisions. For revisions, the process starts over again– selecting reviewers, obtaining reviews, and making arecommendation. Typically, one invites the same set ofreviewers, although there is the option to add new re-viewers (if additional input is needed), or drop some (forexample, if they were entirely satisfied with the previousversion). There can be multiple rounds of revision, butif major issues remain after a first revision, it is com-mon to move towards a reject. Once a reject or acceptis reached, the AE’s involvement with the paper is con-cluded.
4. RECOMMENDATIONSBased on this description of the process, I have a num-
ber of recommendations and requests for those involvedin the journal review process:
4.1 Recommendations to authors.It is easy to imagine that a journal will immediately
recognize the novelty and importance of a submitted pa-per, and that the editors will quickly identify expertswho can judge the merits of the submission. However,the reality is perhaps less ideal: there is no guaranteethat the EiC will be able to match the paper to the bestAE for the paper, or that the assigned AE will be able toidentify and secure the most expert reviewers. Authorscan help this process along:
Suggest suitable Associate Editors. It is often appro-priate to suggest an AE to handle the paper. Take a lookat the editorial board, and see which AEs have familiar-ity with the area. The suggestion usually can be commu-nicated to the EiC as part of the cover letter, or withinthe WBMSS.
Suggest suitable Reviewers. Before my experience asan AE, I did not think it was necessary to suggest re-viewers: the journal staff should easily be able to iden-tify an expert set of reviewers. Proffering suggestionsseemed to imply that the nominees were my cronies.Now I realize that it is very valuable to suggest review-ers: there is no guarantee that the AE will be a leadingexpert in the domain of the paper, and I find that re-viewer suggestions are useful input to me as an AE. Icarefully evaluate suggested reviewers, and only followup if it is clear that they are suited for the paper, and donot have conflicts of interest with the authors12. I tend toinvite only one or two suggested reviewers, and fill out
12In particular, it is important to avoid inviting the authorsto review their own paper, which is not unprecedented
556 SIGMOD Record, June 2013 (Vol. 42, No. 2)
the rest of the panel with “independent” reviewers, toavoid any issue of bias. Authors should realize that theirsuggestions may not accept the invitation, and there islittle value in suggesting a “big-name” researcher whois too busy. Lastly, some journals also allow authors toindicate “non-preferred” reviewers. I can think of fewsituations where this is of use to authors, and it seemsthat there should be some clearly articulated explana-tion.
Think about your citations. Think carefully about whichworks you cite, and whether there are any important ref-erences missing. An AE will often look to the bibli-ography for potential reviewers to invite. So authorsshould realize that their bibliography is another list of“suggested reviewers”. They should also reflect on howfairly they describe and compare to prior work, since theauthors of those works may be called upon to judge thesubmission.
Optimize your revisions. As noted above, the revisionwill be handled by the same AE as the original sub-mission, and will typically be read by the same review-ers. It is therefore sensible to optimize the revision ac-cordingly. Make a cover document containing each re-view, and indicate how you respond to each point: whatchanges were made, and where. It is OK to disagreewith a reviewer comment, so long as you explain why.It is also helpful to indicate which sections have changedin the paper, via highlighting13. This takes extra work,but this type of effort can make the review process gomuch more smoothly, and hence speed the paper to pub-lication.
4.2 Recommendations to Reviewers.These are perhaps less recommendations than pleas:
Respond swiftly and decisively to requests. As an AE,my goal is to provide well-informed decisions to authorsin a timely fashion. This starts with responding to theinitial review request. Please don’t sit on a review re-quest for weeks: it is usually only the work of a few mo-ments to determine one’s current level of commitments,and availability to accept a new task. As noted above, aswift response is often appreciated, even if it is negative.Please also provide alternate reviewer suggestions as amatter of course. Often, I receive a request and I think“Why are they asking me? Why don’t they ask X?”. Thereason may be that the AE does not know that X is theexpert on this topic – so please inform them of this! Youcan also use declining a review request as an opportunityhttp://barcorefblog.blogspot.com/2012/10/fake-peer-reviews.html
13This has the advantage that it will focus the attention of thereviewers on just those parts of the paper; otherwise, they mayre-read the whole paper, and come up with additional com-ments and things to change.
to advance the career of a more junior member of yourcommunity, by suggesting someone less well-known.
Honour your commitments. When you accept to per-form a review, you are making a commitment to deliverthe review by the date agreed. This commitment shouldbe taken seriously. It is easy to devalue the importanceof review work – after all, it is “voluntary” work. How-ever, I view reviewing as an obligation: when we sub-mit papers, we expect them to receive appropriate andtimely reviews, and so we should perform reviews simi-larly. It is tempting to think of reviews as less importantthan the many other demands on our time, (our own re-search, teaching, and funding deadlines) and allow thereview to get progressively later and later. But this isquite unprofessional. It delays the process for authors,who need to get timely decisions in order to publish theirwork and progress their careers.
It goes without saying that you should do a good,careful job in reviewing the paper. For guidance on this,there are several good articles on the topic [3, 6, 1]14.
You should always accept a request to review a re-vision of a paper. The work involved should be muchless than to perform an initial review (especially if theauthors have suitably optimized their revision). If youasked for changes, then you should at least look at theresponse.
Accept a reasonable number of requests. It is hardto load-balance incoming review requests: sometimes,many arrive in close proximity. However, as indicatedabove, it is important to be an active participant in thereview process, and do your fair share. One heuristic isto perform 3− 4 reviews for each submission you make(assuming that each paper does have multiple authors),but more senior people may need to do more.
Be aware that a journal review brings different ex-pectations to a conference review. A journal review isexpected to be in greater depth, and to more carefullyscrutinize the whole paper. Consequently, the reviewshould attempt to evaluate the paper in full, or be ex-plicit about which sections could not be verified. Journalpapers may also be (much) longer than a typical confer-ence submission, so one to several months is allotted toperform the review – do not interpret this as permissionto leave the review to the last minute.
4.3 Recommendations to Associate Editors.The above discussion has outlined the workflow I tend
to follow in handling a paper. Implicit in this are severalrecommendations and considerations:
Be considerate of authors. Your goal as an AE is tooversee a fair and timely handling of submissions toyour journal. So try to ensure that each submission has
14As well as some that are laughable, e.g. [2].
6SIGMOD Record, June 2013 (Vol. 42, No. 2) 57
a fair chance, by identifying and inviting suitable re-viewers, and using these to make good decisions on pa-pers. In some cases, the most considerate thing to dois to swiftly reject a paper, rather than enter it into alengthy review process, taking up reviewers’ effort, andultimately reaching the same outcome.
Be considerate of reviewers. Try to identify review-ers who are suited to the paper, and try to avoid askingthe same reviewers to help with a lot of papers. Be un-derstanding when reviewers need more time to review apaper, while firmly reminding them of their obligation.Remember that reviewing is a mark of service to thecommunity, and an indication of the esteem with whichthe opinion of the reviewer is held, so be sure to allowjunior researchers the opportunity to participate in thereview process. This can also be a learning opportunityfor them to see firsthand how peer review works in prac-tice, and to calibrate their opinions against the reviewsof others.
Be considerate of yourself. When I started as an AE, Ihad high aspirations: I would read each paper in detail,and provide my own review and comments in additionto those of the invited reviewers. This lasted for exactlyone paper. For journals with high throughput, you mayhandle 20-30 papers per year, on a wide variety of top-ics, and it simply is not practical, nor a good use of yourtime, to try to do too much. Stick to the core tasks, andyou will be doing the community a service.
By way of guidance, here are my estimated times forhandling a submission. Of course, these can vary: anobviously unsuitable paper may be faster to handle.
Read and think about paper: 1-2 hours
Search for and invite initial reviewers: 1 hour
Handle review responses, and find replacement re-viewers: 1-2 hours.
Receive and process reviews: 0.5 hours total
Chasing reviewers to deliver their reviews: 1 hour
Re-visit paper, and formulate recommendation: 1hour
5. CONCLUDING REMARKSThis is the end of what I have to say.
Acknowledgments. I thank Jian Pei for many helpfulcomments and suggestions.
6. REFERENCES[1] Mark Allman. Thoughts on reviewing. ACM
SIGCOMM Computer Communication Review(CCR), 38(2), April 2008.
[2] Graham Cormode. How not to review a paper: Thetools and techniques of the adversarial reviewer.SIGMOD Record, 37(4):100–104, December 2008.
[3] Ian Parberry. A guide for new referees intheoretical computer science. Information andComputation, 112(1):96–116, 1994.
[4] Richard Snodgrass. CMM and TODS. SIGMODRecord (ACM Special Interest Group onManagement of Data), 34(3):114–117, September2005.
[5] Richard T. Snodgrass. ACM TODS associate editormanual. http://tods.acm.org/editors/manualFeb2007.pdf, January 2007.
[6] Toby Walsh. How to write a review. http://www.cse.unsw.edu.au/˜tw/review.ppt,2001.
758 SIGMOD Record, June 2013 (Vol. 42, No. 2)
Report on the first Workshop onInnovative Querying of Streams
Michael BenediktUniversity of Oxford, [email protected]
Dan OlteanuUniversity of Oxford, UK
1. INTRODUCTIONThe first workshop on
INnovative QUErying of STreams (INQUEST)
was held on September 25-27, 2012 in the De-partment of Computer Science of the University ofOxford (UK). It was sponsored by the UK’s En-gineering and Physical Sciences Research Council(EPSRC), as part of the project “Enforcement ofConstraints on XML Streams”.
Stream processing represents a thriving area ofresearch across the algorithms, databases, network-ing, programming languages, and systems researchcommunities. Within the database community, a“classical” problem is query processing on streamsof discrete tuple-oriented data. One goal of theworkshop considers the way recent developmentsadd complexity to this problem:
• how does the setting change when data to beconsidered by queries is not relational, but hasnested structure, such as XML or JSON?
• conversely, how does the setting change whendata to be considered consists of RDF triples?
• how does the presence of noise in the data im-pact query processing?
• how does stream processing change when query-ing requires not only access to the data, butreference to external knowledge, which can alsobe changing?
• how does processing change in a large-scale de-centralized setting?
• what new demands on stream query processingarise from social media applications? Is it onlythe processing architecture that changes, or dothe queries change as well?
In addition to looking at new developments instream processing, the workshop aimed to bring
together researchers with different perspectives onthe topic. We solicited and received participationfrom researchers working primarily on stream ar-chitectures and systems as well as those workingon stream algorithms; the participants included re-searchers working on the computation of particu-lar aggregates in streaming fashion as well as thoselooking at high-level languages for describing queries.
The workshop was by invitation only. There were52 registered participants, ranging over 20 institu-tions. The formal part of the workshop programconsisted of 19 invited lectures, grouped by topic.
In what follows, we present the main ideas and is-sues proposed by the speakers. Finally, discussionsarisen during the workshop and concluding remarksare presented. The slides of workshop talks can befound on the current workshop web page:http://www.cs.ox.ac.uk/dan.olteanu/inquest12/pmwiki.php
2. STREAMING OF SOCIAL DATAThis session covered challenges in building scal-
able infrastructure for managing social media streamsand in extracting valuable information from socialmedia streams such as emergent topics.
Sebastian Michel considered the problem of emer-gent topics discovery by continuously monitoringcorrelations between pairs of tags (or social anno-tations) to identify major shifts in correlations ofpreviously uncorrelated tags in Twitter streams [1,2]. Such trends can be used as triggers for higher-level information retrieval tasks, expressed throughqueries across various information sources.
Mila Hardt gave two talks on aspects related tomanaging streams at Twitter, in particular on in-frastructure to enable processing of 400 million tweetsa day and real-time top queries. Mila explained howstream processing needs at Twitter eventually led tothe development of the open-source projects Stormand Trident1 for large-scale high-performance dis-tributed stream processing. She also pointed out
1https://github.com/nathanmarz/storm
SIGMOD Record, June 2013 (Vol. 42, No. 2) 59
current challenges at Twitter in providing supportfor fault tolerance, online machine learning by trad-ing off exploration and exploitation, and approxi-mating aggregates (such as counts). An interestingexercise involving the audience was on thinking howtopic ranking is done at Twitter.
Daniel Preotiuc-Pietro introduced the Trendminer2
system for real time analysis of social media streams[19]. Trendminer’s scalability relies on the MapRe-duce framework for distributed computing. Danielalso presented how to build regression models oftrends in streaming data using TrendMiner [21].
3. STREAMING AND THE SEMANTICWEB
Stream processing has emerged as an importantchallenge in the new field of managing linked and se-mantic data. The workshop featured three talks onefforts in managing streams of linked data: one byEmmanuel Della Valle, covering work done in Po-litecnico Milano, one by Manfred Hauswirth, cov-ering work done at DERI on platforms for linkeddata stream, and by Darko Anicic, covering jointwork with Sebastian Rudolph and others at Karl-sruhe Institute of Technology.
The requirements of a stream processing systemfor semantic data include support for “continuousquerying” – queries that remain in place, with an-swers evolving as new data arises – and support forreasoning with external knowledge. The approachpresented in Della Valle’s talk involves merging theapproach used for relational continuous query lan-guage with SPARQL. The resulting language, C-SPARQL [4], allows one to filter from a stream, us-ing continuous-query window commands to controlthe sampling method, but SPARQL graph patternscan now be used within the filters.
Anicic outlined a different language approach. TheETALIS system [3] supports stream reasoning byembedding both temporal relational rules within alogic programming formalism. To better supportthe standards suite of the semantic Web, ETALISsupports a proper extension of SPARQL for dealingwith event-processing on streams, EP-SPARQL.
Of course, using stream processing on large-scalelinked data involves more than just developing alanguage or even a query processing engine. Hauswirth’stalk outlined the entire set of issues needed to buildan application that integrates and processes sensoroutput using linked data. This includes a continu-ous query evaluation system specific to linked data,CQELS [18], but also addresses the modificationsneeded to storage, protocol, RESTFul services, date2https://github.com/sinjax/trendminer
interchange formats, and data integration technol-ogy needed to exploit these query languages in real-world applications.
4. STREAM MONITORINGMonitoring of streams is a good example of a sub-
area of streaming where different communities de-fine the objectives in radically different ways, andattack the problem using very different techniques.For the verification community, monitoring appearsin the form of run-time verification – for example,continuously monitoring reactive systems for viola-tion. The focus is normally on temporal constraints.Issues of space consumption are critical, as in moststream-processing applications, but there is also aneed to integrate the constraint language and themonitoring engine with data structures maintainedin the code being monitored. In databases both theconstraint languages and the monitoring model arenormally quite different; constraints naturally focuson properties of data values (e.g. as in classical de-pendencies), while monitoring occurs both in batchmode and in response to discrete updates. Bothof these communities have dealt with monitoringas a component with a very well-demarcated set offunctionality within a larger system. In contrast,monitoring data has a broad meaning within data-oriented applications, with integrity-constraint val-idation being only one aspect of it.
Felix Klaedtke’s talk came from the perspectiveof run-time verification. He focused on online moni-toring of integrity constraints, where the constraintsdeal with the evolution of data over time, and arethus expressed in a variant of first-order temporallogic. He explained both the system and a set of al-gorithms for efficiently monitoring these constraints[5]. In this work, ideas from runtime verificationand the database community (particularly, tempo-ral databases) interact.
Lukasz Golab looked at properties of streams ofrelational data, focusing on two natural set of con-straints that deal with both temporal and moretraditional relational aspects. He defined sequen-tial constraints, which generalize functional depen-dencies to account for order, and conservation laws[12] that are specific to the context of pairs of nu-meric streams corresponding to related quantities.He presented methods for checking these constraintsin off-line fashion, as well as methods for seeing theextent to which they are violated.
Mariano Consens talked about monitoring in thebroader sense – how can the quality and the accessesto data records be monitored off-line in the presenceof large volumes of linked data. His work focuses
60 SIGMOD Record, June 2013 (Vol. 42, No. 2)
on privacy issues in data, presenting an integritylanguage that allows one to formulate constraintsexpressing that a privacy violation has occurred.He also presented a system providing an end-to-end solution for auditing privacy constraints, in-cluding a means for integrating records from diversedatasources, for expressing privacy policies and con-straints, and for detecting violations.
5. XML STREAMSXML is notable for being a data model where very
strong notions of streamability can be formalizedfor very expressive query and schema languages.Joachim Niehren looked at one natural formaliza-tion for node-selecting queries: the ability to deter-mine at any point in an XML stream which nodes“must be” in the query result, where “must” meansthat they will be in the result in any possible exten-sion. Niehren presented automata-theoretic meth-ods of solving this “earliest answer problem”, alongwith lower bounds.
While Niehren’s talk focused on node-selectinglanguages such as XPath, Pavel LaBath looked atstream-processing of the World Wide Web consor-tium’s XML transformation language, XSLT. Hepresented a subset of the language that can be ef-fectively streamed [15]. A notable aspect of XSLTis that the W3C working group has looked to stan-dardize a subset of the language that is appropriatefor streaming applications.
6. UNCERTAIN STREAMSApplications like location-based services (RFID)
and text recognition (OCR) are driven by data thatis low-level, imprecise, and sequential. To effec-tively exploit this low-level data, it must be trans-formed into higher-level data that is meaningful to aparticular application. For example, in RFID appli-cations, a sequence of raw sensor readings is trans-formed into a sequence of physical locations. InOCR, the low-level sequence of images on a pageis transformed into a sequence of ASCII charac-ters. Often, this transformation uses a probabilis-tic model like a Hidden Markov Model for RFID,Kalman Filter for tracking, Stochastic Transducerfor Google’s Ocropus tool for OCR, or approximateslocation data by uncertain ranges defined using con-tinuous probability distributions over locations ofmoving objects. Besides the richness of data mod-els, applications also need a variety of querying andmonitoring facilities, such as continuous and prob-abilistic versions of spatial queries including near-est neighbour, range, and similarity queries, andqueries specified by finite automata that can exploit
the order of data items in the stream.This workshop session featured three talks that
covered complementary aspects of challenges in man-aging uncertain streams that are exemplary for mostof the existing efforts in this research area.
Chris Re overviewed work done in the Lahar [20]and Hazy research projects to effect transforma-tions from low-level to high-level high quality un-certain streams modelled by Markov Sequences andsubsequently to query such streams using trans-ducers (i.e., automata with output) [13]. He pre-sented several applications including a monitoringapplication based on uncertain RFID readings [20]and the GeoDeepDive application, which aims atunearthing data from the Geoscience literature bymodelling OCR output using Stochastic Transduc-ers and by integrating such models into relationaldatabase systems [14].
Reynold Cheng presented work on continuous near-est neighbour and range queries over imprecise lo-cation, where data is modelled by uncertain rangesdefined by continuous probability distributions overlocations of moving objects [7, 24]. In location-based services, saving communication bandwidthbetween servers and objects and mobile devices’battery is essential and Reynold showed how thiscan be effectively achieved by employing object fil-tering based on the probability that the object isclose to a given query point.
Themis Palpanas surveyed techniques for mod-eling and processing data series with value uncer-tainty, an important model for temporal data, whereeach data point in the series is represented by an in-dependent discrete or continuous random variable.He focused on the problem of answering similarityqueries on uncertain data series, and described anovel technique for this problem [9]. In addition, hediscussed the challenges of dealing with both valueand existential uncertainty in processing streaminguncertain data.
7. STREAMING FRAMEWORKS ANDSYSTEMS
A major goal of the workshop was to bring to-gether, on the one hand, computer scientists work-ing in particular stream-processing domains (XML,RDF, etc.) or particular streaming algorithms, withresearchers studying broad stream-processing sys-tems capable of expressing a wide range of appli-cations. Nesime Tatbul’s talk focused on relationalstream processing engines. This included an overviewof both language proposals, such as STREAM CQL,StreamSQL, and MATCH-RECOGNIZE, along con-tinuous querying architectures, such as the DBMS-
SIGMOD Record, June 2013 (Vol. 42, No. 2) 61
based architectures of systems like Truviso and na-tive streaming systems StreamBase. The ultimategoal would be to have an architecture that could ex-press the features of each of the differing approachesto relational stream-processing, along with a clearset of systems definitions and embeddings of eachengine into the “universal architecture”. Tatbul’stalk gave one step towards this goal, a versatileframework, SECRET [6], for describing the seman-tics of such systems, along with example descrip-tions of how some of the leading systems fit intothe framework.
Yanif Ahmad talked about a new architecture be-ing developed at Johns Hopkins for building next-generation streaming applications. Instead of be-ginning with “merely” data management infrastruc-ture, the approach described by Ahmad begins withK3 [22], an event-driven language for general-purposeprogramming, building into the language both sup-port for declarative data manipulation languages(e.g. for view definitions) and control structuresfor parallel and distributed programming.
8. DISTRIBUTED STREAMSBig data analytics requires partitioning of large
data streams into thousands of partitions accord-ing to specific set of keys so that different machinescan continuously process different data partitions inparallel. This workshop session focused on analyz-ing requirements of and on solutions for distributedstream processing systems in the face of machinefailure, pay-as-you-go models of computation, high-quality data partitioning, and low-overhead com-munication.
Peter Pietzuch discussed an approach to elasticand fault-tolerant stateful stream processing in thecloud, which was tested using the Linear Road Bench-mark on the Amazon EC2 cloud platform [10]. Thekey aspects of this approach are on-demand scalingby acquiring additional virtual machines and par-allelizing operators at runtime when the processingload increases, and fault-tolerance with fast recov-ery times yet low per-machine overheads.
Milan Vojnovic discussed the problem of rangepartitioning for big data analytics, where the goalis to produce approximately equal-sized partitionssince the job latency is determined by the mostloaded node [23]. The key challenge is to deter-mine cost-effectively and accurately the partitionboundaries in the absence of prior statistics aboutthe key distribution over machines for a given in-put dataset. Cosmos, the cloud infrastructure forbig data analytics used by Microsoft Online ServicesDivision, uses a solution to this problem based on
weighted sampling. Milan further presented a solu-tion to the problem of continuous distributed count-ing [16], which had been mentioned earlier by MilaHardt in her talk about Twitter.
Minos Garofalakis overviewed his recent work onapproximate query answering with error guaranteesin a distributed data streaming setting, where thefocus is on communication efficiency, in additionto the standard space and time-efficiency require-ments. In particular, Minos talked about sketchingfor distributed sliding windows [17], tracking com-plex aggregate queries [8], sketches based on the Ge-ometric method, and sketch prediction models [11].
9. ACKNOWLEDGMENTSWe would like to thank the Engineering and Phys-
ical Sciences Research Council of the UK, who havesponsored INQUEST as part of the project En-forcement of Constraints on XML Streams, EPSRCEP/G004021/1.
Many of the staff at University of Oxford’s com-puter science department were instrumental in mak-ing the workshop happen. In particular, we are verygrateful to Polly Dunlop and Elizabeth Walsh formanaging all of the arrangements for the meeting.We also thank Christoph Haase for being the web-master for INQUEST.
10. REFERENCES[1] Foteini Alvanaki, Sebastian Michel, Krithi
Ramamritham, and Gerhard Weikum.EnBlogue: emergent topic detection in web2.0 streams. In SIGMOD, 2011.
[2] Foteini Alvanaki, Sebastian Michel, KrithiRamamritham, and Gerhard Weikum. Seewhat’s enblogue: real-time emergent topicidentification in social media. In EDBT, 2012.
[3] Darko Anicic, Sebastian Rudolph, Paul Fodor,and Nenad Stojanovic. Stream reasoning andcomplex event processing in ETALIS.Semantic Web, 3(4), 2012.
[4] Davide Francesco Barbieri, Daniele Braga,Stefano Ceri, Emanuele Della Valle, andMichael Grossniklaus. C-SPARQL: acontinuous query language for RDF datastreams. Int. J. Semantic Comp., 4(1), 2010.
[5] David Basin, Felix Klaedtke, and SamuelMuller. Policy monitoring in first-ordertemporal logic. In CAV, 2010.
[6] Irina Botan, Roozbeh Derakhshan, NihalDindar, Laura M. Haas, Renee J. Miller, andNesime Tatbul. SECRET: a model foranalysis of the execution semantics of streamprocessing systems. PVLDB, 3(1), 2010.
62 SIGMOD Record, June 2013 (Vol. 42, No. 2)

[7] Jinchuan Chen, Reynold Cheng, Mohamed F.Mokbel, and Chi-Yin Chow. Scalableprocessing of snapshot and continuousnearest-neighbor queries over one-dimensionaluncertain data. VLDB J., 18(5), 2009.
[8] Graham Cormode and Minos N. Garofalakis.Streaming in a connected world: querying andtracking distributed data streams. In EDBT,2008.
[9] Michele Dallachiesa, Besmira Nushi,Katsiaryna Mirylenka, and Themis Palpanas.Uncertain time-series similarity: Return tothe basics. PVLDB, 5(11), 2012.
[10] Raul Castro Fernandez, Matteo Migliavacca,Evangelia Kalyvianaki, and Peter Pietzuch.Integrating scale out and fault tolerance instream processing using operator statemanagement. In SIGMOD, 2013.
[11] Nikos Giatrakos, Antonios Deligiannakis,Minos N. Garofalakis, Izchak Sharfman, andAssaf Schuster. Prediction-based geometricmonitoring over distributed data streams. InSIGMOD, 2012.
[12] Lukasz Golab, Howard J. Karloff, Flip Korn,Barna Saha, and Divesh Srivastava.Discovering conservation rules. In ICDE, 2012.
[13] Benny Kimelfeld and Christopher Re.Transducing markov sequences. In PODS,2010.
[14] Arun Kumar and Christopher Re.Probabilistic management of OCR data usingan RDBMS. PVLDB, 5(4), 2011.
[15] Pavel Labath. Xslt streamability analysis withrecursive schemas. In RCIS, 2012.
[16] Zhenming Liu, Bozidar Radunovic, and MilanVojnovic. Continuous distributed counting fornon-monotonic streams. In PODS, 2012.
[17] Odysseas Papapetrou, Minos N. Garofalakis,and Antonios Deligiannakis. Sketch-basedquerying of distributed sliding-window datastreams. PVLDB, 5(10), 2012.
[18] Danh Le Phuoc, Minh Dao-Tran,Josiane Xavier Parreira, and ManfredHauswirth. A native and adaptive approachfor unified processing of linked streams andlinked data. In ISWC, 2011.
[19] Daniel Preotiuc-Pietro, Sina Samangooei,Trevor Cohn, Nicholas Gibbins, and MahesanNiranjan. Trendminer: An architecture forreal time analysis of social media text. InICWSM, 2012.
[20] Christopher Re, Julie Letchner, MagdalenaBalazinska, and Dan Suciu. Event queries oncorrelated probabilistic streams. In SIGMOD,
2008.[21] Sina Samangooei, Daniel Preotiuc-Pietro,
Jing Li, Mahesan Niranjan, Nicholas Gibbins,and Trevor Cohn. Regression models of trendsin streaming data. Technical report,University of Sheffield, 2012.
[22] P. C. Shyamshankar, Zachary Palmer, andYanif Ahmad. K3: Language design forbuilding multi-platform, domain-specificruntimes. In XLDI, 2012.
[23] Milan Vojnovic, Fei Xu, and Jingren Zhou.Sampling based range partition methods forbig data analytics. Technical ReportMSR-TR-2012-18, Microsoft Research, 2012.
[24] Yinuo Zhang and Reynold Cheng.Probabilistic filters: A stream protocol forcontinuous probabilistic queries. Inf. Syst.,38(1), 2013.
SIGMOD Record, June 2013 (Vol. 42, No. 2) 63
The relational model is dead, SQL is dead,and I don’t feel so good myself
Paolo Atzeni Christian S. Jensen Giorgio Orsi Sudha RamLetizia Tanca Riccardo Torlone
ABSTRACTWe report the opinions expressed by well-knowndatabase researchers on the future of the relationalmodel and SQL during a panel at the InternationalWorkshop on Non-Conventional Data Access (NoCoDa2012), held in Florence, Italy in October 2012 in con-junction with the 31st International Conference on Con-ceptual Modeling. The panelists include: Paolo Atzeni(Università Roma Tre, Italy), Umeshwar Dayal (HPLabs, USA), Christian S. Jensen (Aarhus University,Denmark), and Sudha Ram (University of Arizona,USA). Quotations from movies are used as a playfulthough effective way to convey the dramatic changesthat database technology and research are currently un-dergoing.
1. INTRODUCTIONAs more and more information becomes available
to a growing multitude of people, the ways to man-age and access data are rapidly evolving as theymust take into consideration, on one front, the kindand volume of data available today and, on theother front, a new and larger population of prospec-tive users. This need on two opposite fronts hasoriginated a steadily growing set of proposals fornon-conventional ways to manage and access data,which fundamentally rethink the concepts, tech-niques, and tools conceived and developed in thedatabase field during the last forty years. Recently,these proposals have produced a new generation ofdata management systems, mostly non-relational,proposed as effective solutions to the needs of anincreasing number of large-scale applications forwhich traditional database technology is unsatisfac-tory.
Today, it is common to include all the non-relational technologies for data management underthe umbrella term of “NoSQL” databases. Still, itis appropriate to point out that SQL and relationalDBMSs are not synonymous. The former is a lan-guage, while the latter is a mechanism for manag-
ing data using the relational model. The debate onSQL vs. NoSQL is as much a debate on SQL, thelanguage, as on the relational model and its variousimplementations.
Relational database management systems havebeen around for more than thirty years. Duringthis time, several revolutions (such as the ObjectOriented database movement) have erupted, manyof which threatened to doom SQL and relationaldatabases. These revolutions eventually fizzled out,and none made even a small dent in the domi-nance of relational databases. The latest revolu-tion appears to be from NoSQL databases that aretouted to be non-relational, horizontally scalable,distributed and, for the most part, open source.
The big interest of academia and industry in theNoSQL movement gives birth, once more, to a num-ber of challenging questions on the future of SQLand of the relational approach to the managementof data. We discussed some of them during a livelypanel at the NoCoDa Workshop, an event held inFlorence, Italy in October 2012 organized by Gior-gio Orsi (Oxford University), Letizia Tanca (Po-litecnico di Milano) and Riccardo Torlone (Univer-sita Roma Tre). We have used a provocative title(paraphrasing a quote often attributed to WoodyAllen) and quotations from movies to elaborate onthree main issues:
• the possible decline of the relational model andof SQL as a consequence of the rise of the non-relational technology,
• the need for logical data models and theoreti-cal studies in the NoSQL world, and
• the possible consequences of sacrificing theACID properties in favor of system perfor-mance and data availability.
In the following sections we discuss these issues inturn and close the paper with a final discussion.Since a consensus was reached on most of the is-sues addressed in the panel, we synthesize shared
64 SIGMOD Record, June 2013 (Vol. 42, No. 2)
opinions, rather than report contributions to thediscussion by single individuals.
2. THE END OF AN ERA?
2.1 Relational databases
“The ship will sink.” “You’re certain?”“Yes. In an hour or so, all of this will beat the bottom of the Atlantic.”
(Titanic. 1997)
According to Stonebraker et al., RDBMS are 25-year-old legacy code lines that should be retired infavor of a collection of from-scratch specialized en-gines [9]. Are we really attending the sinking of therelational ship?
One needs to distinguish between the relationalmodel and its dominant query language, SQL, onthe one hand and relational database managementsystems on the other.
The relational model and SQL were invented ata time when data management targeted primarilyadministrative applications. The goal was to sup-port applications exemplified well by banking. Thedata is well structured: accounts, customers, loans,etc. And typical transactions include withdrawalsand deposits that alter account balances. The rela-tional model and SQL are well suited for managingthis kind of data and supporting workloads madeup from these kinds of transactions.
However, the data management landscape hasevolved, and today’s landscape of data managementapplications is much more diverse than it was whenthe relational model and SQL were born. Exam-ples of this diversity abound: semi-structured data,unstructured data, continuous data, sensor data,streaming data, uncertain data, graph data, andcomplexly structured data. Similar diversities canbe found in the workloads to be supported today.
Thus, while relational database systems were firstproposed as a way to store and manage struc-tured data, burgeoning NoSQL databases, such asCouchDB, MongoDB, Cassandra, and Hbase, haveemerged as a way to store unstructured data andother complex objects such as documents, datastreams, and graphs. With the rise of the real-timeweb, NoSQL databases were designed to deal withvery large volumes of data.
Moreover, while relational database systems areusually scaled up (i.e., moved to larger and morepowerful servers), NoSQL database systems are de-signed to scale out, i.e, the database is distributedacross multiple hosts as load increases. This is morein line with real time web traffic as transaction
rates and availability requirements increase and asdata stores move into the cloud. The new breedof NoSQL systems are designed so they can eas-ily scale up using low cost commodity processors toyield economic advantages.
Next, the data management applications have notjust grown to concern more diverse kinds and usesof data. They have also become more complex. Asingle application may involve diverse kinds of data.This means that it is generally not possible for anapplication to use the single model and query lan-guage that is best for a single kind of data.
There are indeed two different issues here, relatedto the model level and to the implementation. Interms of implementation, it is clear (and it has beenclear for more than a decade) that different appli-cations have different requirements, especially whenperformance is a concern. This has led for exam-ple to separating OLTP and OLAP applications,even when the latter makes use of data producedby the former. Further, different engines with dif-ferent capabilities have been developed for the twoworlds, with specific support, the ones with moresupport for throughput of transactions and the oth-ers with support for very complex queries. With re-spect to models, the point is that most applicationsdo need mainly simple operations over models thatare somehow more complex than the relational one.NoSQL systems try to respond to these needs: im-plementations are new and specialized, operationsare very simple, and diverse models (see the dis-cussion on heterogeneity below) share the idea ofbeing flexible (semistructured and with little or noschema).
2.2 SQL
“Whoa, lady, I only speak two languages,English and bad English.”
(The Fifth Element. 1997)
A variety of data models and access methodsare emerging and SQL is not suitable for any ofthem. Are we building the Babel Tower of querylanguages?
SQL has several advantages — it is a simple yetpowerful declarative language for set-oriented oper-ations. SQL captures the essential patterns of datamanipulation, including intersections/joins, filters,and aggregations or reductions. Programmers whoprofess a dislike for SQL appear to have been de-ceived by its simplicity. The existence of languagessuch as SQLDF [4], which allows SQL queries onR data frames, add SQL functionality for analyt-ics on Big Data. SQL’s declarative expressions are
SIGMOD Record, June 2013 (Vol. 42, No. 2) 65
frequently more readable and compact than their Rprogrammatic equivalents. Powerful extensions toSQL, based on window functions, provide a ”split-apply” functionality otherwise known as map func-tion. Combining these with SQL’s GROUP BY op-eration, which is in reality a reduce function, essen-tially provides the equivalent of operations such asthose in the Map Reduce framework.
However, in spite of the research and develop-ment, the relational model and SQL may not bethe best foundation for managing every new kindof data and workload. The SQL-86 standard wasa small and simple document. Then came SQL-89, SQL-92, SQL:1999, SQL:2003, SQL:2006, andSQL:2008. The current standard, SQL:2011, is verycomplex, and most data management professionalswill find it challenging to understand. How manypeople have read and understood the entire SQLstandard? Few claim that SQL is an elegant lan-guage characterized by orthogonality. Some call itan elephant on clay feet. With each addition, itsbody grows, and it becomes less stable. SQL stan-dardization is largely the domain of database ven-dors, not academic researchers without commercialinterests or users with user interests. Who is thatgood for?
Another aspect is that the SQL syntax requiresthe use of joins, considered ill-fit for, e.g., prefer-ences and data structures for complex objects orcompletely unstructured data: many programmerswould prefer to not do joins at all, keeping the datain a physical structure that fits the programmingtask as opposed to extracting it from a logical struc-ture that is relational. Complex objects that con-tain items and lists do not always map directly to asingle row in a single table, and writing SQL queriesto grab the data spread out across many tables,when all you want is a record, is inconsistent withthe belief that data should be persisted the way itis programmed.
On the other hand, the tumultuous developmentswe are observing have generated dozens of systemseach with its own modeling features and its ownAPIs [2, 8], and this is definitely generating con-fusion. Indeed, the lack of a standard is a greatconcern for companies interested in adopting anyof these systems [7]: applications and data are ex-pensive to convert and competencies and expertiseacquired on a specific system get wasted in caseof migration. Efforts that support interoperabilityand translation are definitely needed [1]. Originalapproaches in this direction are needed, given thesimplicity of operations and the almost total ab-sence of schemas.
3. MODEL, THEORY AND DESIGN
3.1 Logical data models
“Underneath, it’s a hyper-alloy combatchassis, microprocessor-controlled. Butoutside, it’s living human tissue: flesh,skin, hair, blood.” (Terminator. 1984)
Aren’t NoSQL database models too close to thephysical data structures? What about physical dataindependence?
The ANSI SPARC architecture for database sys-tems was defined in 1975 with the fundamentalgoal of setting a standard for data independencefor DBMS vendor implementations. It appears thatcurrent NoSQL systems make no distinction be-tween the logical and physical schema. Thus, thefundamental advantages of the ANSI SPARC ar-chitecture have been voided, which complicates themaintenance of these databases. Storing objects asthey are programmed essentially negates the dataindependence requirement that then remains to beadequately addressed for NoSQL database systems.Strong typing of relations also allows definition ofa variety of integrity constraints at the schemalevel, a very important consideration for transac-tion processing systems that support a variety ofread, write, delete, and update transactions.
Relational database systems are criticized for thestrong typing of relational schemas, which makesit difficult to alter the data model. Even mi-nor changes to the data model of a relationaldatabase have to be carefully managed and mayrequire downtime or reduced service levels. NoSQLdatabases have far more relaxed — or even nonexis-tent — data model restrictions. NoSQL Key Valuestores and document databases allow applicationsto store virtually any structure it wants in a dataelement. Even the more rigidly defined BigTable-based NoSQL databases (Cassandra, HBase) typ-ically allow new columns to be created with littleeffort. Actually, organizations should carefully eval-uate the advantages and limitations of each type ofsystems (i.e. relational and NoSQL) for Big Dataand then make an informed decision.
A common, high level interface could really be ofuse here. However it has to be simple, especiallyin terms of operations, as is the case for NoSQLsystems. It is also worth mentioning that developersof the various systems follow “best practices” thatsupport efficient execution of operations. An effortshould be made to design a common interface byusing the best practices of each system, with thegoal of re-achieving physical independence.
66 SIGMOD Record, June 2013 (Vol. 42, No. 2)
3.2 Database theory
“I’ve seen things you people wouldn’t be-lieve. [. . . ] All those moments, will belost in time, like tears in rain. Time todie.” (Blade Runner. 1982)
Do we still need theoretical research in the newworld? Has relational database theory become irrel-evant?
The introduction of the relational model in 1970marked a striking difference with respect to all theprevious research on databases. The main reasonfor this lies in the strong mathematical foundationsupon which this model is based, which providedthe database research community with the possibil-ity to approach the problems that were raised dur-ing the years by means of logical and mathematicaltools, and to ensure the correctness and effective-ness of the proposed solutions by solid mathemati-cal proofs.
This approach has caused the blooming of gen-erations of splendid theoreticians who have set thefoundations of the relational model, but have alsocontributed to adapting their experience to de-vise new methods and techniques for solving theproblems derived from the advent of new chal-lenges. Consider for instance the introductionof new paradigms for representing and queryingsemi-structured and unstructured data: since thenineties, invaluable theoretical research has laid thefoundations for dealing with XML and the relatedquery languages, with HTML Web data, with theSemantic Web, and with unstructured data like im-ages and videos. It would be interesting to see whatthe work on semi-structured data and XML (mod-elling and languages) can contribute in the settingof NoSQL databases, since after all many of theproblems rising from this new data model(s) havebeen discussed already within the semi-structureddata research.
The lessons learned from developing the re-lational database theory have probably laid themethodological foundations for approaching mostdata-related problems, since, however unstructuredand unkempt the datasets at hand, the understand-ing developed within the community will ever in-form its research strategies.
3.3 Database design
“They rent out rooms for old people,kill’em, bury’em in the yard, cash theirsocial security checks.”
(No Country for Old Men. 2007)
How is database design affected by the recentparadigm shifts on logical data modeling? Is concep-tual database design really too old for this country?
The methodological framework consisting of con-ceptual data modeling followed by the translationof the ER (or class-diagram) schema into a logical(relational) one can still be adopted: after all, thesesystems have to be accessed by applications. So,even if there is no schema in the data store, it isvery likely that the data objects belong to classes,whose definitions appear in the programs, so somecontribution could arise. At the same time, flexibil-ity is a must, as objects could come from classes inan inheritance hierarchy, so polymorphism shouldbe supported. The availability of a high-level rep-resentation of the data at hand, be it logical or con-ceptual, remains a fundamental tool for developersand users, since it makes understanding, managing,accessing, and integrating information sources mucheasier, independently of the technologies used.
4. ACID OR AVAILABLE?
“Ask me a question I would normally lieto.” (True Lies. 1994)
A relational database is a perfect world wheredata is always consistent (even if not true). Arethe ACID properties really less relevant in moderndatabase applications? Are we ready for a chaoticworld where data is always available but only “even-tually” consistent?
While preserving ACID properties may not beas important for databases that typically containappend only data, they are absolutely essential formost operational systems and online transactionprocessing systems, including retail, banking, andfinance. ACID compliance may not be importantto a search engine that may return different resultsto two users simultaneously, or to Amazon whenreturning sets of different reviews to two users. Inthese applications, speed and performance triumphthe consistency of the results. However, in a bank-ing application, two users of the same account needto see the same balance in their account. A utilitycompany needs to display the same “payment dueamount” to two or more users perusing an account.The idea of “eventual consistency” for such applica-tions could lead to chaos in the business world. Isit by chance that just those applications that needfull consistency are often those that better matchthe relational structure? Can we imagine a bank,a manufacturing or a commercial company whichwould rather use a complex-object data model torepresent their data? This is probably why many
SIGMOD Record, June 2013 (Vol. 42, No. 2) 67
people mix up the structure of the relational modelwith the ACID properties, which in principle arecompletely independent aspects.
A consequence of the choices made in some sys-tems about weak forms of consistency is that theburden is passed to applications developers, whenthey need to ensure more sophisticated transactionproperties.
An observation that has been recently madeabout transaction management (and other imple-mentation issues) is related to the fact that it canbe easy to omit features, as this simplifies the de-velopment, but it might be difficult to reintroducethem later. Mohan [6] points out that there wereexperiences in the past with similar simplifications,and it was later very complex to obtain more gen-eral and powerful systems— some features neededto be rewritten from scratch.
5. FINAL COMMENTS
“Look! It’s moving. It’s alive!!”(Frankenstein. 1931)
In spite of the shortcomings and inadequacies ofthe relational model and SQL, these technologiesare, however, still going strong. Why? A key rea-son is that the systems that implement these areplentiful and have proven their worth. Perhapsthe most important reason is that enormous in-vestments are sitting in applications built on topof such systems. Companies around the globe relyon these applications and their underlying databasemanagement systems for their day-to-day business.Actually, relational DBMS provide the most under-standable format for business application data, andat the same time guarantee the consistency prop-erties that are needed in business. In addition, theskill sets of their current and prospective employ-ees are targeted at these systems. It is not an easydecision to throw away relational and SQL technol-ogy and instead adopt new technology. Rather, itis much easier to extend the current applicationsand systems with no radical changes. Indeed, tothe extent applications involve standard adminis-trative data and “new” data, relational technologymay even be best suited.
Thus, when is it reasonable for an organizationto bet on a tool that is slightly incompatible withall the others, may be built by a community inopen source model, does not grant consistency andconcurrency control and is subject to change, ne-glect, and abandon at any point in time? The pointis that there are killer applications – e.g. storinghuge amounts of (read-only) social-network or sen-
sor data in clusters of commodity hardware – thatmay make it worthwhile.
Therefore, we all believe that relational andNoSQL database systems will continue to coexist.In the era of large, decentralized, distributed en-vironments where the amount of devices and dataand their heterogeneity is getting out of control,billions of sensors and devices collect, communicateand create data, while the Web and the social net-works are widening the number of data formats andproviders. NoSQL databases are most often appro-priate for such applications, which either do not re-quire ACID properties or need to deal with objectswhich are clumsily represented in relational terms.
As a conclusion, NoSQL data storage appears tobe additional equipment that business enterprisesmay choose to complete their assortment of storageservices.
With all these questions ahead the contributionthe database community can give is huge. Let ustake a full breath and start anew!
6. REFERENCES[1] P. Atzeni, F. Bugiotti, and L. Rossi. Uniform
access to non-relational database systems:The SOS platform. In CAiSE 2012, Springer,pages 160–174, 2012.
[2] R. Cattell. Scalable SQL and NoSQL datastores. SIGMOD Record, 39(4):12–27, 2010.
[3] M. Driscoll. SQL is Dead. Long Live SQL!http://www.dataspora.com/2009/11/
sql-is-dead-long-live-sql/, 2009.[4] G. Grothendieck. SQLDF: SQL select on R
data frames.http://code.google.com/p/sqldf/, 2012.
[5] G. Harrison. 10 things you should know aboutNoSQL databases. http://www.techrepublic.com/blog/10things/
10-things-you-should-know-about-nosql-
databases/1772, 2010.[6] C. Mohan. History repeats itself: sensible and
NonsenSQL aspects of the NoSQL hoopla. InEDBT 2013, ACM, pag. 11–16, 2013.
[7] M. Stonebraker. Stonebraker on NoSQL andenterprises. Commun. ACM, 54:10–11, 2011.
[8] M. Stonebraker and R. Cattell. 10 rules forscalable performance in ’simple operation’datastores. Commun. ACM, 54(6):72–80,2011.
[9] M. Stonebraker, S. Madden, D. J. Abadi, S.Harizopoulos, N. Hachem, and P. Helland.The end of an architectural era: (it’s time fora complete rewrite). In VLDB 2007, VLDBEndowment, pag. 1150-1160, 2007.
68 SIGMOD Record, June 2013 (Vol. 42, No. 2)
Related Documents