Welcome message from author
This document is posted to help you gain knowledge. Please leave a comment to let me know what you think about it! Share it to your friends and learn new things together.
Transcript

SIGCHI-Italy
The Italian ACM SIGCHI Chapter, called SIGCHI Italy, has been officially chartered on April 24, 1996. Its aim is to promote an increased knowledge and greater interest in the science, technology, design, development, and application of methods/tools/techniques for HCI. SIGCHI Italy has scientific and educational goals, and aims to provide a mean of communication between persons having interest in HCI. It also organizes meetings, conferences, discussion groups and workshops. SIGCHI, ACM's Special Interest Group on Computer-Human Interaction, brings together people working on the design, evaluation, and implementation of interactive computing systems for human use, and the study of major phenomena surrounding such systems. It embraces work on the hardware and software engineering of interactive systems, the structure of communications between human and machine, characterization of the use and context of use for interactive systems, methodology of design, and new designs themselves. It helps to organize and coordinate information through on line information, traditional publications, conferences, workshops, and symposia relating to human-computer interaction. SIGCHI members are interested in keeping up with changes in this rapidly evolving field - in research and development, or the design and evaluation of new user interfaces - making computers easier to use and extending technology into new domains for new users. More information on SIGCHI-Italy, and the membership application form can be found the SIGCHI-Italy web site: http://hcilab.uniud.it/sigchi/generalinfo.html
2

Foreword
“Invisible Computer […] is the end result, hiding the computer, hiding the technology so that it disappears from sight, disappears from consciousness, letting us concentrate upon our activities, upon learning, doing our jobs, and enjoying ourselves.” Donald Norman, The Invisible Computer [1] As pointed out by Norman, the current goal in the production of information appliances is to move from the current situation of complexity and frustration to one where technology serves human needs invisibly, unobtrusively: the human-centered, customer-centered way [1]. The role of the User Interface (UI) is hence becoming more and more important to the extent that, according to Raskin [2], its design should start once the product's task is known, while the rest of the system should be implemented to the interface design. In other words, the emphasis shifts from the application program to the user, who does not care about what is inside the box: as far as the customer is concerned, the interface is the product. Furthermore, not only is the UI changing its role in the system, but it is also changing in nature. While the interface between people and computation has traditionally been based on conventional input and output devices (such as screens, keyboards and mice), nowadays computation is increasingly moving off the desktop and becoming embedded in the world around us, a trend that can be traced back to a seminal article by Weiser [3], presenting a vision of “ubiquitous computing”, in which the traditional desktop computer is no longer the focus of computational interaction. The job of the designers of interactive systems becomes increasingly difficult. Complexity comes, among others, from the shift from single to multiple users, and from the variety of workplace settings and user population for which products are intended. Serving multiplicity and diversity of HCI actors is the key issue then, which demands systems guaranteeing access regardless of the situation, or circumstances, or any users' impairment. Proposals meeting these requirements can be found in the works presented at the fourth edition of the Italian Symposium on Human-Computer Interaction, HCItaly 2005, held in conjunction with INTERACT 2005 (the tenth IFIP TC13 International Conference on HCI). The HCItaly series aims at collecting, presenting and discussing the Italian experience achieved in all the HCI fields, both in industry and academy, providing a forum for researchers, experts and practitioners.
3
This volume contains the Proceedings of HCItaly 2005, which include 16 papers discussing issues, methods, prototypes, and applications in a broad spectrum of HCI relevant areas: design, multimodality, interaction and devices, virtual environments, accessibility, data retrieving and analysis, tourism and mobile systems. I wish to thank authors, reviewers, organizers and sponsors, who in different ways contributed to set up the Symposium. I am indebted to the Program Committee members who have helped in defining the scientific program of the Symposium. I have to acknowledge the cooperation of SIGCHI-Italy, and the financial support of the sponsoring organization. A special thank goes to Tania Di Mascio, for her work in the Scientific Secretariat and her invaluable support provided in the editing of these proceedings. Finally, I want to thank Simona and Giuseppina, for “making things (appear) simple”. Laura Tarantino HCItaly 2005 Coordinator References [1] Norman, D, 1998, The Invisible Computer, MIT Press. [2] Raskin, J, 2000, The Humane Interface: New directions for designing interactive systems, Addison Wesley. [3] Weiser, M, 1991, “The computer for the 21st century” in Scientific American, 265(3), 94-104.
4

Program Committee
Tarantino, Laura (HCItaly 2005 Coordinator) (University of L’Aquila, Italy) Ardissono, Liliana (University of Torino, Italy) Bagnara, Sebastiano (University of Siena, Italy) Bottoni, Paolo (University of Rome “La Sapienza”, Italy) Catarci, Tiziana (University of Rome “La Sapienza”, Italy) Chittaro, Luca (University of Udine, Italy) Costabile, Maria Francesca (University of Bari, Italy) De Angeli, Antonella (University of Manchester, UK) Del Bimbo, Alberto (University of Firenze, Italy) De Rosis, Fiorella (University of Bari, Italy) Garzotto, Franca (Polytechnic of Milano, Italy) Levialdi, Stefano (University of Rome “La Sapienza”, Italy) Mosconi, Mauro (University of Pavia, Italy) Mussio, Piero (University of Brescia, Italy) Natale, Domenico (SOGEI, Italy) Paternò, Fabio (IST-CNR, Pisa, Italy) Pittarello, Fabio (University of Venezia “Ca Foscari”, Italy) Polillo, Roberto (University of Milano, Italy) Santucci, Giuseppe (University of Rome “La Sapienza”, Italy) Tucci, Maurizio (University of Salerno, Italy)
Sponsoring Institution
Dipartimento di Ingegneria Elettrica, Università degli Studi dell’Aquila.
5
Table of contents
Multimodality and interaction with devices
Gennaro Costagliola, Sergio Di Martino, Filomena Ferrucci, Giuseppe Oliviero, Umberto Montemurro, Alessandro Paliotti
A Multimodal Interface for Automotive Information Systems 13 Antonio Camurri, Ginevra Castellano, Paolo Coletta, Alberto Massari, Barbara Mazzarino, Giovanna Varni, Gualtiero Volpe
Multimodal Interfaces for Expressive Interaction 18 Michela Terenzi, Francesco Di Nocera, Fabio Ferlazzo Action, not only Semantics, Underlies Expected Location for Interface Elements
23
Amalia de Gotzen, Davide Rocchesso Fitt's Law with Multimodal Feedback 28 Design issues
Maria Francesca Costabile, Daniela Fogli, Giuseppe Fresta, Andrea Marcante, Piero Mussio, Antonio Piccino
Meta-Design for Supporting Users to Shape their Software Solutions 35 Fabio Paternò, Silvia Berti, Giulio Mori, Carmen Santoro TERESA: An Environment for Designing Multi-Device 40 Virtual environments
Luca Chittaro, Lucio Ieronutti Visualizing Users’ Flow to Derive Information about Virtual Environments Usage
47
Luca Chittaro, Vijay Kumar Gatla, Subramanian Venkataraman A Navigation and Examination Aid for 3D VirtualBuildings 52
6
Applications: tourism and mobile systems
Anna Goy, Diego Magro Exploiting Problem Solving Techniques to Support Web Users in Complex Tasks
59
Stefano Burigat, Luca Chittaro Exploiting Location-Aware 3D Visualizations to Present Tourist Information on a PDA
64
Federica Cena, Luca Console, Cristina Gena, Anna Goy, Guido Levi, Sonia Modeo, Ilaria Torre
An Adaptive Tourist Guide in Mobile Context 69 Accessibility issues
Giorgio Brajnik Accessibility Assessments through Heuristic Walkthroughs 77 Silvia Gabrielli, Valeria Mirabella, Massimiliano Teso, Tiziana Catarci A Comprehensive Approach to Accessibility for e-Learning Design 82 Giorgio Brajnik, Daniela Cancila, Daniela Nicoli, Mery Pignatelli Do Dynamic Text-only Web Pages Improve Usability for Disabled Users? 87 Applications: data retrieving and analysis
Tiziana Catarci, Tania Di Mascio, Paolo Dongilli, Enrico Franconi, Giuseppe Santucci, Sergio Tessaris
SEWASIE (SEmantic Web and AgentS in Integrated Economies) Project: Usability Evaluation Tests
95
Paolo Buono, Maria Francesca Costabile How Visualization may help in Understanding Association Rules 100 POSTER
Emanuele Panizzi, Federica Patamia, Renata Sarno Product Page Usability Test in an Hotel Reservation Web Site 107
7

Author Index
Berti, Silvia....................................................................................................................... 40Brajnik, Giorgio..........................................................................................................77, 87Buono, Paolo..................................................................................................................100Burigat, Stefano................................................................................................................64Camurri, Antonio..............................................................................................................18Cancila, Daniela................................................................................................................87Castellano, Ginevra...........................................................................................................18Catarci, Tiziana.............................................................................................................82,95Cena, Federica.................................................................................................................. 69Chittaro, Luca.....................................................................................................................47Coletta, Paolo.....................................................................................................................18Console, Luca...................................................................................................................69Costabile, Maria Francesca........................................................................................35, 100Costagliola, Gennaro...........................................................................................................13De Gotzen, Amalia.............................................................................................................28Di Martino, Sergio............................................................................................................13Di Mascio, Tania...............................................................................................................95Di Nocera, Francesco........................................................................................................23Dongilli, Paolo....................................................................................................................95Ferlazzo, Fabio..................................................................................................................23Ferrucci, Filomena............................................................................................................ 13Fogli, Daniela................................................................................................................... 35Franconi, Enrico................................................................................................................95Fresta, Giuseppe................................................................................................................ 35Gabrielli, Silvia...................................................................................................................82Gatla, Vijay Kumar...........................................................................................................52Gena, Cristina.....................................................................................................................69Goy, Anna...................................................................................................................59, 69Ieronutti, Lucio...................................................................................................................47Levi, Guido.......................................................................................................................69Magro, Diego....................................................................................................................59Marcante, Andrea...............................................................................................................35Massari, Alberto................................................................................................................18Mazzarino, Barbara............................................................................................................18Mirabella, Valeria..............................................................................................................82Modeo, Sonia....................................................................................................................69Montemurro, Umberto......................................................................................................13
8
Mori, Giulio....................................................................................................................... 40Mussio, Piero....................................................................................................................35Nicoli, Daniela.................................................................................................................. 87Oliviero, Giuseppe............................................................................................................13Paliotti, Alessandro............................................................................................................ 13Panizzi, Emanuele...........................................................................................................107Patamia, Federica.............................................................................................................107Paternò, Fabio.................................................................................................................. 40Piccinno, Antonio..............................................................................................................35Pignatelli, Mery...................................................................................................................87Rocchesso, Davide.............................................................................................................28Santoro, Carmen............................................................................................................... 40Santucci, Giuseppe........................................................................................................... 95Sarno, Renata.................................................................................................................. 107Terenzi, Michela................................................................................................................23Teso Massimiliano.............................................................................................................82Tessaris, Sergio..................................................................................................................95Torre, Ilaria....................................................................................................................... 69Varni, Giovanna................................................................................................................ 18Venkataraman, Subramanian.............................................................................................52Volpe, Gualtiero.................................................................................................................18
9


Multimodality and interaction with devices
_____________________________________________________________________


A Multimodal Interface for Automotive Information Systems
G. Costagliola , S. Di Martino , F. Ferrucci , G. Oliviero , U. Montemurro , A. Paliotti
Dip. di Matematica e Informatica, Università degli Studi di Salerno , Italy Email: gcostagliola | sdimartino | [email protected]
Elasis S.C.p.A. - Veicolo SEE, Italy
Email: giuseppe.oliviero| umberto.montemurro | alessandro.paliotti@ elasis.it
1 Automotive Human Machine Interaction
In-car Telematics Systems (ITS) have achieved in the last few years very impressive enhancements in the number of provided functionality, and now the most advanced commercial systems (e.g.: BMW iDrive, Fiat Connect+ or GM onStar) allow drivers to exploit a plethora of services, such as web browsing, e-mail checking, phone calls, playing infotainment, and so on. Despite this improvement, interaction with ITSs is somehow far to be well understood. This problem has a fundamental relevance, because in the automotive domain the user is normally busy in the demanding and mission-critical task of the driving. If the system requires too much attention due to a bad design of the interface, the user can be distracted from his/her main activity, with potentially fatal consequences. Many studies conducted on this argument show that distraction is the most prevalent cause of crash, accounting till 56% in the USA [3]. Thus, currently there is a profound concern that these statistics will inflate as the potential for mental distraction increases with the growing diffusion of ITSs. Then, because safety is paramount, many institutions have identified as a short term priority the research on Human-Machine Interaction for the vehicular domain. The definition of UI in the automotive field is an open and demanding research field. Indeed, it is widely recognized that most HCI techniques and approaches established for traditional desktop applications turn out to be inadequate for the automotive domain [1]. This is due to many factors. The user/driver can dedicate only a few burst of his/her attention to interact with telematics system because (s)he is mainly focused on the primary demanding driving task [2], so UI designers cannot rely on a significant user’s concentration. Moreover, automotive hardware has very rigid limitations. Displays can show only a reduced amount of information, since they usually are between 5” and 7” and have a poor resolution, as well as Voice Recognition (VR) engines cannot rely on significant computational or memory resources. Finally, automotive telematics systems cannot use an input pointing device such as a mouse or a trackball, making the point-and-click paradigm no longer adequate. Instead, some new interaction devices, paradigms, and metaphors are required, which carefully take into account the “safety” issue, not only considering the user interaction with the interface, but also understanding the effects of this interaction on driver-vehicle performances. Nevertheless, since safety is
13

strongly affected by the amount of visual and cognitive resources needed to interact with the system, it can definitely benefit from some features such as usability, intuitiveness, consistency, and naturalness. Obviously the experience gained in traditional HCI is a valuable basis to tackle the problem.
2 The Proposal
In this context, the Elasis research centre of the Fiat group and the Department of Mathematics and Informatics of the University of Salerno jointly developed an EU granted project aimed to define an innovative interface for next-generation telematics systems. Such UI should present information in a simple and understandable way, make the ITS interaction easy to learn, easy to remember, and easy to use, distracting the user from driving as little as possible. Moreover, there were strong industrial constraints, denying us to propose futuristic solutions, like Head-Up Displays, continuous speech recognition, etc…
Our main rationale was to keep in highest priority the safety issues. To this aim, our proposal exploits various user’s senses in order to not overload driver’s visual channel, and to get the benefits deriving from the use of both the best suited modality to convey the specific information and the multiple representation of the same information [4]. The key issues of the resulting proposal are a multimodal user interface, encompassing visual, auditory and tactile sections, together with a novel interaction device, currently patent pending, named Handy.
2.1 The Handy Device The Handy interaction device has been meant to overcome the highly distracting
task where driver takes out the glance from the road and looks at the vehicle dashboard, searching for the specific control to handle. Indeed, Handy is characterized by an ergonomic, comfortable shape, recalling in some way hand’s palm (like the most advanced PC mice) and encompasses five controls: a rotary wheel, placed under the forefinger, and four buttons, placed under the other fingers.
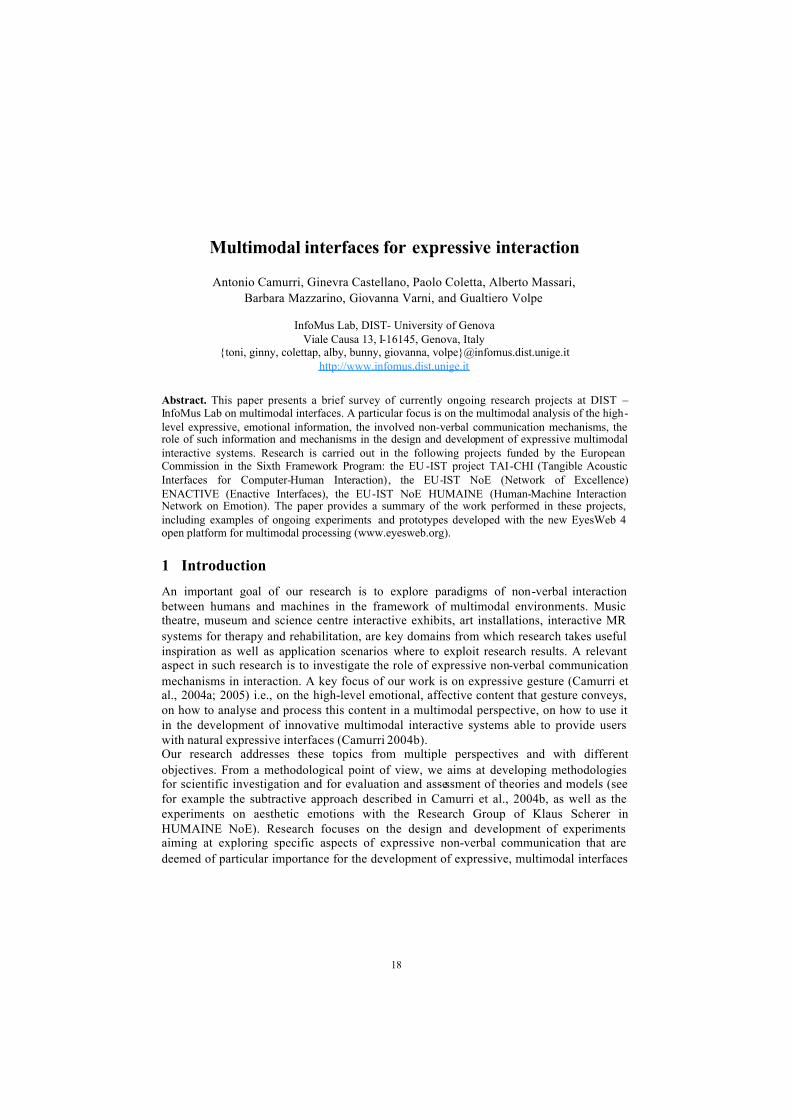
The natural seat for Handy is on the driver seat harm rest. So, to grasp it is an activity very similar to grip the gear lever, where driver does not have to allocate visual resources to accomplish the task since (s)he can reach it only relying on the spatial awareness and on the tactile channel. In particular, the main advantage inducted by Handy is that user is aware of both its position and of the displacement the interaction controls which are suitably positioned under fingers (see Fig. 1).
Special care has been devoted to design the set of controls embedded in Handy. The wheel can be clicked, and has two degrees of freedom, i.e. it can be rotated on the vertical axis and tilted on the horizontal one. The button placed under the thumb is always used to perform a Back or Escape functions, while the actions associated to the remaining three buttons depend on the active module and state of the system and are described by some labels placed in a specific zone of the GUI. Handy exploits also the driver’s tactile sensory channel, by providing some haptic feedbacks on the wheel, useful to enhance the user awareness of the system state and to help him/her in the navigation of the menu structure.
14
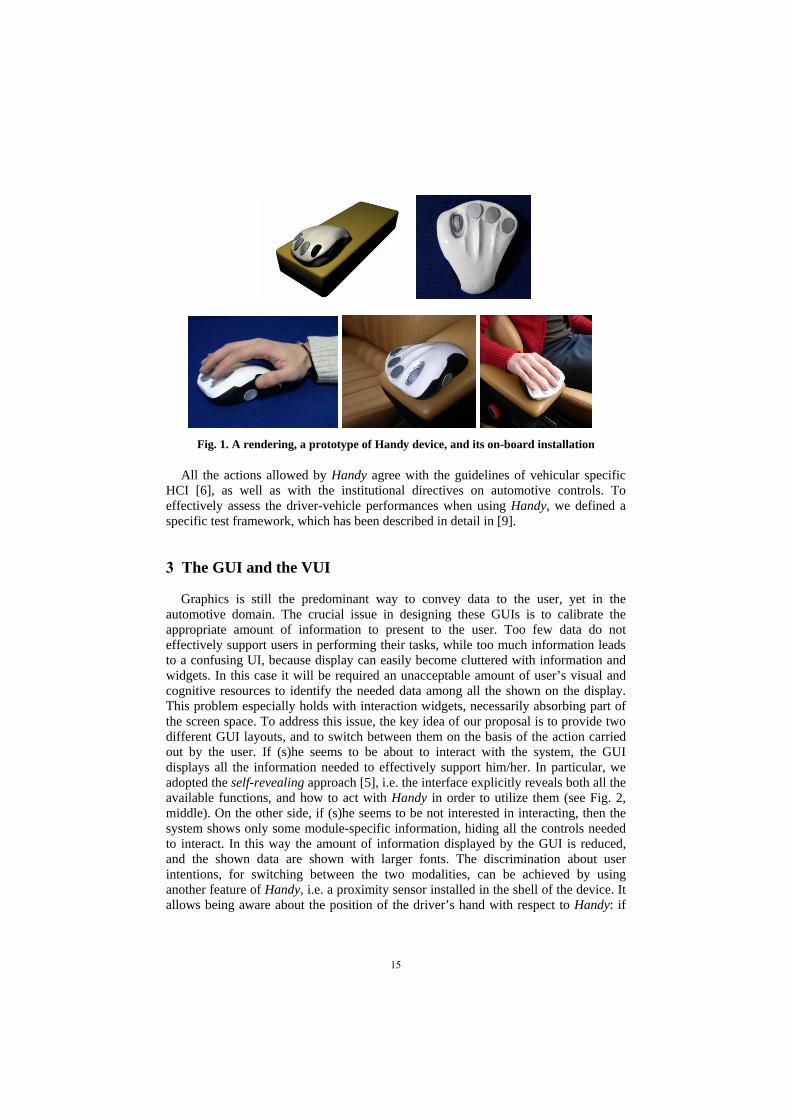
Fig. 1. A rendering, a prototype of Handy device, and its on-board installation
All the actions allowed by Handy agree with the guidelines of vehicular specific HCI [6], as well as with the institutional directives on automotive controls. To effectively assess the driver-vehicle performances when using Handy, we defined a specific test framework, which has been described in detail in [9].
3 The GUI and the VUI
Graphics is still the predominant way to convey data to the user, yet in the automotive domain. The crucial issue in designing these GUIs is to calibrate the appropriate amount of information to present to the user. Too few data do not effectively support users in performing their tasks, while too much information leads to a confusing UI, because display can easily become cluttered with information and widgets. In this case it will be required an unacceptable amount of user’s visual and cognitive resources to identify the needed data among all the shown on the display. This problem especially holds with interaction widgets, necessarily absorbing part of the screen space. To address this issue, the key idea of our proposal is to provide two different GUI layouts, and to switch between them on the basis of the action carried out by the user. If (s)he seems to be about to interact with the system, the GUI displays all the information needed to effectively support him/her. In particular, we adopted the self-revealing approach [5], i.e. the interface explicitly reveals both all the available functions, and how to act with Handy in order to utilize them (see Fig. 2, middle). On the other side, if (s)he seems to be not interested in interacting, then the system shows only some module-specific information, hiding all the controls needed to interact. In this way the amount of information displayed by the GUI is reduced, and the shown data are shown with larger fonts. The discrimination about user intentions, for switching between the two modalities, can be achieved by using another feature of Handy, i.e. a proximity sensor installed in the shell of the device. It allows being aware about the position of the driver’s hand with respect to Handy: if
15
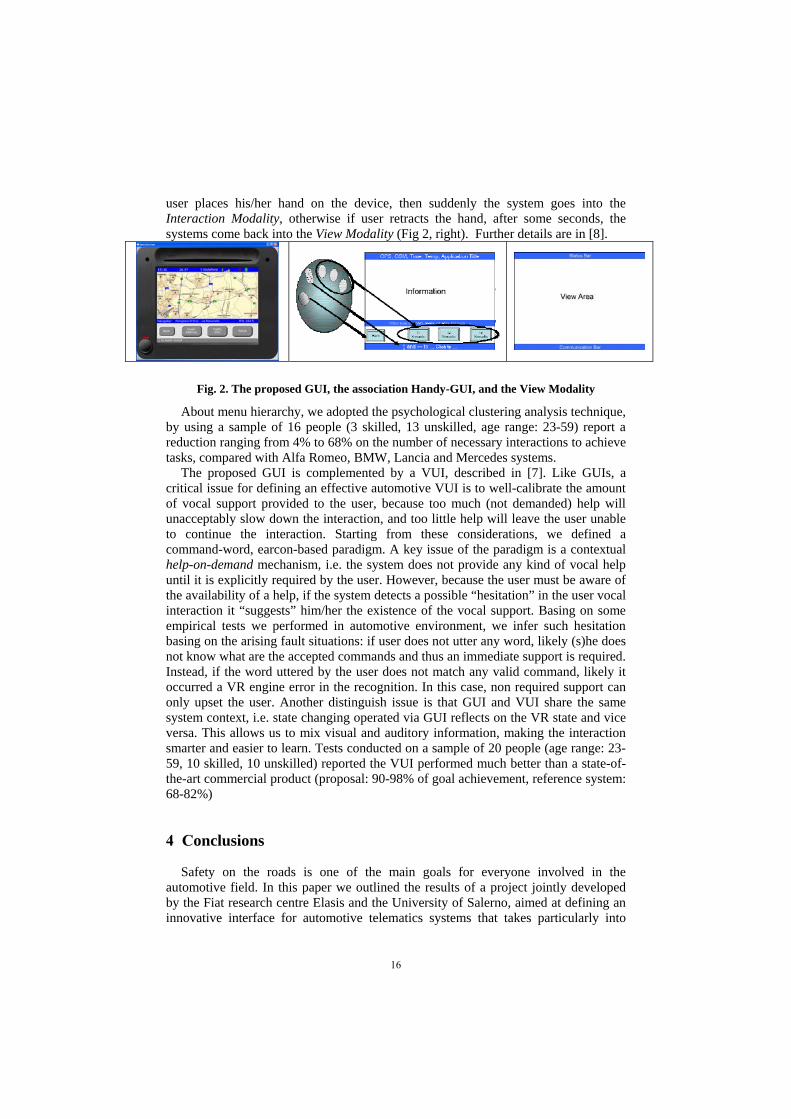
user places his/her hand on the device, then suddenly the system goes into the Interaction Modality, otherwise if user retracts the hand, after some seconds, the systems come back into the View Modality (Fig 2, right). Further details are in [8].
Fig. 2. The proposed GUI, the association Handy-GUI, and the View Modality
About menu hierarchy, we adopted the psychological clustering analysis technique, by using a sample of 16 people (3 skilled, 13 unskilled, age range: 23-59) report a reduction ranging from 4% to 68% on the number of necessary interactions to achieve tasks, compared with Alfa Romeo, BMW, Lancia and Mercedes systems.
The proposed GUI is complemented by a VUI, described in [7]. Like GUIs, a critical issue for defining an effective automotive VUI is to well-calibrate the amount of vocal support provided to the user, because too much (not demanded) help will unacceptably slow down the interaction, and too little help will leave the user unable to continue the interaction. Starting from these considerations, we defined a command-word, earcon-based paradigm. A key issue of the paradigm is a contextual help-on-demand mechanism, i.e. the system does not provide any kind of vocal help until it is explicitly required by the user. However, because the user must be aware of the availability of a help, if the system detects a possible “hesitation” in the user vocal interaction it “suggests” him/her the existence of the vocal support. Basing on some empirical tests we performed in automotive environment, we infer such hesitation basing on the arising fault situations: if user does not utter any word, likely (s)he does not know what are the accepted commands and thus an immediate support is required. Instead, if the word uttered by the user does not match any valid command, likely it occurred a VR engine error in the recognition. In this case, non required support can only upset the user. Another distinguish issue is that GUI and VUI share the same system context, i.e. state changing operated via GUI reflects on the VR state and vice versa. This allows us to mix visual and auditory information, making the interaction smarter and easier to learn. Tests conducted on a sample of 20 people (age range: 23-59, 10 skilled, 10 unskilled) reported the VUI performed much better than a state-of-the-art commercial product (proposal: 90-98% of goal achievement, reference system: 68-82%)
4 Conclusions
Safety on the roads is one of the main goals for everyone involved in the automotive field. In this paper we outlined the results of a project jointly developed by the Fiat research centre Elasis and the University of Salerno, aimed at defining an innovative interface for automotive telematics systems that takes particularly into
16
account the safety issues. The main component of the proposal is a new interaction device, named Handy and currently patent pending, suited to exploit the driver’s tactile channel. Thanks to its specific shape and positioning, the user has always within reach all the commands needed to interact with the system, and can rely on his/her tactile channel to identify the suited hardware controls, with a significant reduction of visual workload. The device is coupled with a specifically conceived GUI, based on the self-revealing approach, and able to reduce the amount of displayed information if the user seems not be interested in interacting with the system. The GUI is strictly related with a VUI, based on a command-word approach, and encompassing a simple but effective error-recovery strategy. Tests conducted on considerable sample of users show the proposal inducts significant reduction of visual and cognitive workload, compared with current state-of-the-art commercial systems.
References
1. Marcus A., Vehicle User Interfaces: the next revolution, Interactions, 1, 2004
2. Gellatly A., The use of speech recognition technology in automotive applications,
PhD thesis, Virginia Polytechnic Institute and State University, 1997.
3. Tijerina L., 2001. Issues in the Evaluation of Driver Distraction Associated with
In-Vehicle Information and Telecommunications Systems
4. Burnett G., Porter J., Ubiquitous computing within cars: designing controls for
non-visual use, Int. J. Human-Computer Studies (2001) 55, 521-531
5. Kurtenbach G., The design and the evaluation of marking menus, PhD thesis,
University of Toronto, 1993
6. Rogers, S. P., & Campbell, J. L. (1991). Guidelines for automobile hand control
locations and actuations based upon driver expectancies and ergonomic
principles (TR 947-1). Santa Barbara, CA: Anacapa Sciences, Inc.
7. Costagliola G. et al., An Innovative Vocal Interface for Automotive Information
Systems, in Proc of the 6th Intern. Conference on Enterprise Information
Systems (ICEIS 2004), Porto, Portogallo.
8. Costagliola G., Di Martino S., Ferrucci F., et al., “Handy: a new Interaction
Device for Vehicular Information Systems”. In “Mobile Human-Computer
Interaction - Mobile HCI 2004”, Lecture Notes in Computer Science, Vol. 3160.
9. Costagliola G., Di Martino S., Ferrucci F., “A Framework for the Evaluation of
Automotive Telematics Systems”, to appear in Proc. of the 7th International
Conference on Enterprise Information Systems (ICEIS 2005), Miami, USA.
17
Multimodal interfaces for expressive interaction
Antonio Camurri, Ginevra Castellano, Paolo Coletta, Alberto Massari, Barbara Mazzarino, Giovanna Varni, and Gualtiero Volpe
InfoMus Lab, DIST- University of Genova
Viale Causa 13, I-16145, Genova, Italy toni, ginny, colettap, alby, bunny, giovanna, [email protected]
http://www.infomus.dist.unige.it Abstract. This paper presents a brief survey of currently ongoing research projects at DIST – InfoMus Lab on multimodal interfaces. A particular focus is on the multimodal analysis of the high-level expressive, emotional information, the involved non-verbal communication mechanisms, the role of such information and mechanisms in the design and development of expressive multimodal interactive systems. Research is carried out in the following projects funded by the European Commission in the Sixth Framework Program: the EU -IST project TAI-CHI (Tangible Acoustic Interfaces for Computer-Human Interaction), the EU-IST NoE (Network of Excellence) ENACTIVE (Enactive Interfaces), the EU-IST NoE HUMAINE (Human-Machine Interaction Network on Emotion). The paper provides a summary of the work performed in these projects, including examples of ongoing experiments and prototypes developed with the new EyesWeb 4 open platform for multimodal processing (www.eyesweb.org). 1 Introduction An important goal of our research is to explore paradigms of non-verbal interaction between humans and machines in the framework of multimodal environments. Music theatre, museum and science centre interactive exhibits, art installations, interactive MR systems for therapy and rehabilitation, are key domains from which research takes useful inspiration as well as application scenarios where to exploit research results. A relevant aspect in such research is to investigate the role of expressive non-verbal communication mechanisms in interaction. A key focus of our work is on expressive gesture (Camurri et al., 2004a; 2005) i.e., on the high-level emotional, affective content that gesture conveys, on how to analyse and process this content in a multimodal perspective, on how to use it in the development of innovative multimodal interactive systems able to provide users with natural expressive interfaces (Camurri 2004b). Our research addresses these topics from multiple perspectives and with different objectives. From a methodological point of view, we aims at developing methodologies for scientific investigation and for evaluation and assessment of theories and models (see for example the subtractive approach described in Camurri et al., 2004b, as well as the experiments on aesthetic emotions with the Research Group of Klaus Scherer in HUMAINE NoE). Research focuses on the design and development of experiments aiming at exploring specific aspects of expressive non-verbal communication that are deemed of particular importance for the development of expressive, multimodal interfaces
18
(see for example the experiments on dance and music performances in Camurri et al., 2004a). From the point of view of exploitation of research outcomes in concrete application scenarios, the focus is on the development of a software platform for real-time multimodal processing and libraries enabling an immediate emp loyment of the results in prototypes of innovative multimodal interactive systems (e.g., see the work on the EyesWeb open platform, www.eyesweb.org, and the multimodal interactive systems described in Camurri et al., 2005). This paper provides a brief summary of the research activities at DIST – InfoMus Lab with reference to the EU funded projects in which such activities are carried out: the EU -IST project TAI-CHI (Tangible Acoustic Interfaces for Computer-Human Interaction), the EU-IST Network of Excellence ENACTIVE (Enactive Interfaces), and the EU-IST Network of Excellence HUMAINE (Human-Machine Interaction Network on Emotion). Three kinds of multimodal interfaces for expressive interaction are presented and discussed: tangible acoustic interfaces, enactive interfaces, and affective interfaces. 2 Tangible acoustic interfaces Research on Tangible Acoustic Interfaces (TAI) is carried out in the framework of the EU IST STREP project TAI-CHI (Tangible Acoustic Interfaces for Computer-Human Interaction, http://www.taichi.cf.ac.uk). This project aims at exploring how physical objects, augmented surfaces, and spaces can be transformed into tangible-acoustic embodiments of natural seamless unrestricted interfaces. The ultimate goal is to design tangible acoustic interfaces employing physical objects and space as media to bridge the gap between the virtual and physical worlds and to make information accessible through large size touchable objects as well as through ambient media. Our research in the TAI-CHI project mainly concerns the multimodal and expressive aspects involved in interaction with tangible acoustic interfaces. In particular, the work deals with the development of models and algorithms for multimodal high-level analysis and interpretation of integrated data extracted from video images, acoustic tangible interfaces, and acoustic localisation systems. A specific focus is on gestures performed by users and on the expressive content they convey. Three main directions have been followed for research on TAI: (i) the development of an open platform for integrated multimodal processing of TAI data, (ii) the developments of models and algorithm for analysis of expressive gesture in TAI, and (iii) the development of early prototypes integrating algorithms for in-solid acoustic localisation systems. In research on tangible acoustic interfaces, the need for fully integrated and supported multimodal processing of data streams from several channels (e.g., visual, auditory) led to a complete redesign of the EyesWeb open platform: EyesWeb version 4. A relevant aspect in the new EyesWeb platform is the explicit support to multimodality and cross-modality in the EyesWeb language. This is obtained through a new kernel, now providing (i) low-level scheduling mechanism for managing different data streams (e.g., auditory and visual data) at different sampling rates, and (ii) high-level extensions toward integration of gesture and audio processing, aimed at music performance analysis and
19

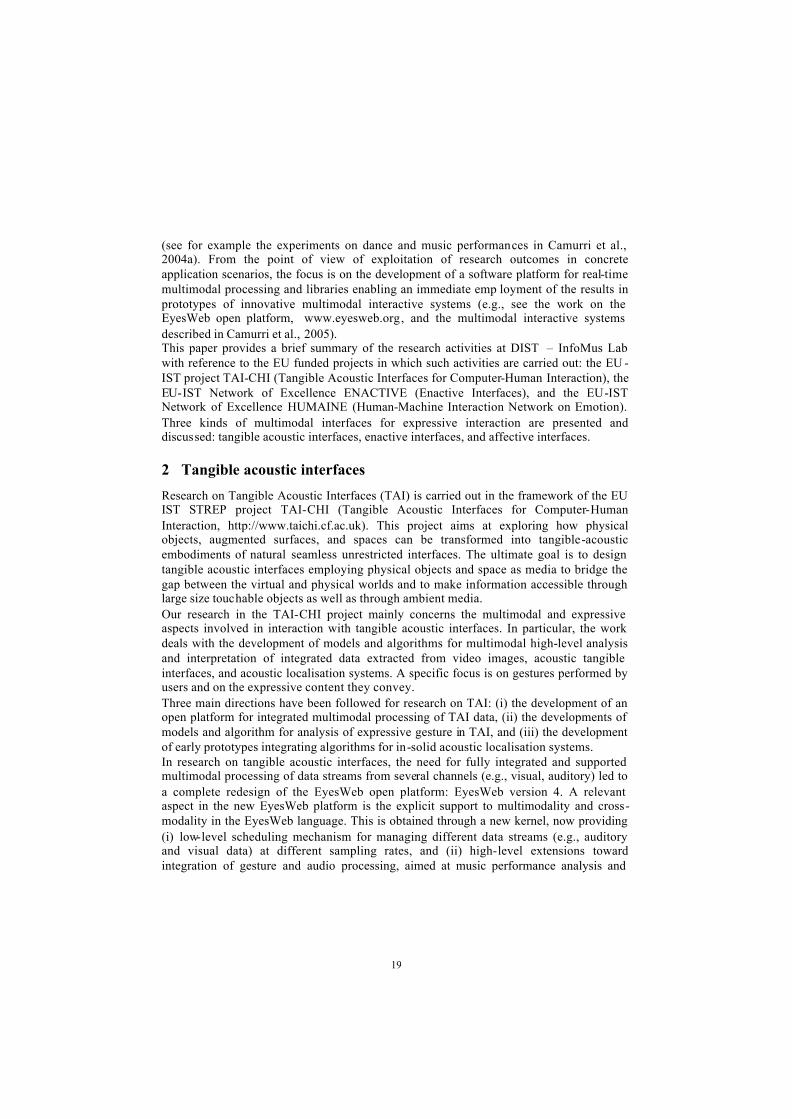
expressive information processing. Such support allows the development of algorithms based on the integrated analysis of sound and gesture, e.g., the sound produced by hands (tapping on a table, handwriting, etc.) and the hand gesture. It also allows cross-modal processing such as video processing of visual representations of acoustic signals (e.g., auditory display) and acoustic-inspired analysis of movement, gesture, and texture. A collection of further new features is described in (Camurri et al., 2004c). The new EyesWeb 4 has been employed as basic platform for the design and development of a collection of software modules for high-level analysis of interaction with TAI, including enhanced motion segmentation and tracking, contour extraction, convex hull, convexity defects, skeleton extraction, analysis of hand gestures, i.e., modules for finger localisation and for analysis of hand posture, analysis and processing of audio signals, e.g., auditory models for perceptual analysis of audio signals, real-time convolution of audio-signals. Figure 1 shows an example from the first version of s/w libraries for multimodal and cross-modal processing in EyesWeb 4. Hand gesture tracking and analysis is performed on a user interacting with a tangible acoustic interface. While the contact position is detected through an acoustic based localisation system, visual information is employed to get information on how the hand approaches and touches the interface (e.g., with a fluent movement, or in a hesitating way, or in a direct and quick way etc.). Moreover, the position and time of contact information obtained from audio analysis can be employed to trigger and control in a more precise way the video-based gesture analysis process: e.g., we are testing hi-speed and hi-res videocameras in EyesWeb 4 in which it is also possible to select the portion of the active ccd area using (x,y) information from a TAI interface.
Fig.1. Hand gesture analysis and tracking with EyesWeb 4 in tangible acoustic interfaces
20
3 Enactive interfaces The EU IST NoE ENACTIVE (Enactive Interfaces, http://www.enactivenetwork.org) addresses interfaces based on knowledge which is not simply multisensory mediated knowledge, but knowledge stored in the form of motor responses and acquired by the act of “doing”. In this perspective, an important focus of the network activities is on performing arts (e.g., dancing, playing an instrument) and on therapy and rehabilitation (e.g., enactive interfaces for therapeutic exercises for auditory, visual, and motor impaired people) with particular reference to the (expressive) gestural and motoric aspects. As an example of our research in this network, we provide a short description of a pilot experiment for testing and evaluating enactive interfaces in therapy and rehabilitation. The goal is to study new interaction modalities for users with disabilities and to develop new techniques for the compensation of motor abilities in impaired users. In particular we focus on the problem of balance with an approach based on sensory supplementation. The aim is to investigate whether it is possible to enhance the execution by a patient of a motor task by providing him/her with a suitable auditory feedback supplementing another missing modality (e.g., the visual channel). In a current experiment at our Lab we measure the balance of subjects on a basculating system under three different conditions: (i) with an auditory feedback related to the position of the basculating system (using EyesWeb 4 with videocameras and accelerometers to provide data to control audio feedback); (ii) with an auditory feedback not related to the position of the basculating system; (iii) without feedback. Preliminary results show a positive effect of the auditory feedback and of the employed enactive interface for the correct execution of the task. 4 Affective interfaces Since our focus on expressive gesture and its expressive, emotional content, a relevant aspect of our research is to exploit such mechanisms in the development of high-level affective interfaces. These focus on the “implicit channel” of the communication process in the framework of HCI (Cowie et al., 2001): they communicate emotions to users and recognize their emotional states. Several techniques are employed: voice analysis and synthesis, processing of facial expressions, movement analysis, sound and music computing. The investigation on how these aspects contribute to the development of affective interfaces and on how they correlate each other has therefore a relevant role in understanding the nature of emotion and in developing emotion-oriented systems. In the framework of the EU-IST NoE HUMAINE (Human Machine Interaction Network on Emotion, see also www.emotion-research.net), we performed some experiments aiming at exploring these topics. For example, in an experiment carried out in collaboration with the Geneva Emotion Research Group, we investigated Klaus Scherer’s component-process model of emotion (Scherer and Zentner, 2001). In particular, we focused on motor activation as a component of an emotional process induced by musical stimuli: a pilot experiment involving twenty subjects was performed aiming at verifying whether there are correlations between emotional characterizations of music excerpts and emotional engagement of subjects expressed through their movement (Castellano, 2004). In order to
21

measure the emotional engagement of subjects, we focused on measures that are halfway between conscious (e.g. mouse, slider, haptic interfaces) and unconscious (physiological, brain activity measures) conveyance. This was obtained by using a laser pointer as an affective interface through which listeners can communicate the experienced emotion by their expressive gestures. The analysis of the laser pointer trajectories showed for example that subjects, during listening to music excerpts whose tempo is “fast” move so that trajectories are angular rather than smooth. Therefore, there is a sort of resonance between music and movement: faster is the tempo of the piece of music, faster is the arm movement as well as its frequency of direction changes. This behaviour seems to be related to an emotional state felt by subjects characterized by a high dynamic. Further, we are investigating how rules can be established to recognize emotions of users: this may be helpful for the definition of the role of the attention in emotion-oriented systems such as Embodied Conversational Agents (ECAs). Acknowledgments We thank Anne-Marie Burns, Corrado Canepa, Matteo Ricchetti, Ilaria Vallone, and Isabelle Viaud Delmond for their precious contribute to this work. References 1. Camurri A., De Poli G., Leman M., Volpe G. (2005), “Toward Communicating Expressiveness
and Affect in Multimodal Interactive Systems for Performing Art and Cultural Applications”, IEEE Multimedia Magazine, 12(1): 43-53, IEEE CS Press, 2005.
2. Camurri, A., Mazzarino, B., Ricchetti, M., Timmers, R., and G. Volpe (2004a), “Multimodal analysis of expressive gesture in music and dance performances”, in A. Camurri, G. Volpe (Eds.), “Gesture-based Communication in Human-Computer Interaction”, LNAI 2915, Springer Verlag, 2004.
3. Camurri A., Mazzarino B., Volpe G. (2004b), “Expressive interfaces”, Cognition, Technology & Work, 6(1), pp. 15-22, Springer-Verlag, February 2004.
4. Camurri A., Coletta P., Massari A., Mazzarino B., Peri M., Ricchetti M., Ricci A., Volpe G. (2004c), “Toward real-time multimodal processing: EyesWeb 4.0”, in Proc. AISB 2004 Convention: Motion, Emotion and Cognition, Leeds, UK, March 2004.
5. Castellano G. (2004), “Experiments, Analysis, and Models of Motor Activation as a Component of an Emotional Process”, Master Thesis, DIST-University of Genoa, InfoMus Lab, October 2004.
6. Cowie, R., Douglas-Cowie, E., Tsapatsoulis, N., Votsis, G., Kollias, S., Fellenz, W. and Taylor, J.G., (2001), “Emotion recognition in human-computer interaction”, IEEE Signal Processing Magazine, January 2001.
7. Scherer K.R., Zentner M.R., (2001), “Emotional effects of music: production rules”, In P.N. Juslin & J.A.Sloboda (Eds). Music and emotion: Theory and research (pp. 361-392). Oxford: Oxford University Press.
22

Action, not Only Semantics, Underlies ExpectedLocation for Interface Elements
Michela Terenzi, Francesco Di Nocera, Fabio Ferlazzo
Cognitive Ergonomics Laboratory, Department of Psychology, University of Rome “LaSapienza”, Via dei Marsi 78 – 00185 Rome, Italy
michela.terenzi, francesco.dinocera, [email protected]
http://w3.uniroma1.it/ergolab
Abstract. Previous studies have provided support to the hypothesis thatboth spatially- and semantically-based schemata, as well as schemata basedon navigation experience, underlie the cognitive organization for webpages layout. However, these studies do not rule out the effect of other typeof information. The aim of present study is to investigate the effect of spa-tial and action-based information on expectations over interface layout. Re-sults indicate that expectations of web users for locating objects on webpages do not simply depend on the spatial location of objects, but rely onthe actions they have to perform on those objects.
1 Introduction
Assessing whether individuals might expect particular objects at specific locations in aweb page is a necessary step for effective design. Indeed, interfaces that are designed con-sistently with the type of organization the user expects will likely be more accessible, easyto browse, and satisfactory. Although this concern over users' expectations is commonamong designers, there is a lack of sound theory and methods, leaving this assessment torather casual approaches. Research attempts in this direction are sparse, and cannot beconsidered conclusive. Bernard [2], for example, asked a large number of subjects to arrangepictures of web objects (internal and external links, advertisement banners, and the like) ona depiction of a browser window, finding regularity in the arrangement of most of them, andno differences in the deployment between Internet experts and novices. Furthermore, theCognitive GeoConcept (CG) procedure [3] was introduced as a method for finding geometri-cal associations between meaningful objects (links or functions) in web pages. The CG issupposed to elicit users’ spatial schemata or representations underling the way people lookfor information within a web page, and allowing the optimization of users' behaviors innavigation tasks. Di Nocera et al. [3], using the CG procedure, found differences due toexpertise analyzing users’ click responses to verbal labels indicating web objects on alarge number of trials. Particularly, expert individuals responded to the verbal labels byclicking in a clearly interpretable, spatially ordered fashion, whereas novices showed amore variable and less meaningful pattern. Taken together, these results suggest that ex-pectations about the location of web objects exist and may be founded upon high-levelschemata or representations, mainly based on navigation experience. However, in thesestudies the activity of low-level, universally shared schemata was not ruled out. Yet, one
23

possible confounding was the type of response analyzed. Both picture placement andclicks, in fact, could have been affected by memory, context, and late processing effects. Asuccessive study [4] was carried out in order to investigate whether eye-movements con-firmed the users’ clicking pattern. Results have provided additional support to the hypothe-sis that both spatially- and semantically-based schemata, as well as schemata based onnavigation experience, underlie the cognitive organization for web pages layout. A generalpreference towards the middle part of the lateral portion of the screen was found, and theupper row and the leftmost column where the most important attractors for most labels. Ingeneral, only small differences between experts’ and novices’ spatial deployments werefound. Nevertheless, experts tried to organize the stimuli according to a typical interfacedeployment, whereas novices seemed to organize stimuli according to personal criteria thatgot lost in the overall pattern.
As reported above, the procedure employed in these studies [3,4] required responding asquickly as possible to the stimuli (presented centrally on the screen) by clicking on thearea of the blank screen where the subjects expected to find the corresponding link in theimaginary web page. The patterns showed by these studies seem to elicit the activity ofspatially and semantically-based schemata, but they do not rule out the effect of the othertype of schemata. For instance, the match found between fixations and clicking patternsmay suggest the existence of schemata based on visual-search strategies. Thus, the aim ofpresent study is to investigate the effect of spatial and action-based information. The pro-cedure used to test this hypothesis involves an opposite rationale respect to the previousexperiments: subjects were required to find the target label within a grid where the target andother stimuli were presented. In this case, clicking and fixation patterns should be affectedonly by visual and semantic information delivered by the stimuli, but action towards aspecific portion of the screen space has no role in this type of task. With that in mind, ifschemata involved in the original task [3,4] included action-based information, results ofthe present study should show a completely different pattern.
2 Method
Eighteen subjects (11 females; mean age 22.84 years) volunteered for this study. Allsubjects were undergraduate students and reported to be right-handed, with normal or cor-rected to normal vision.
Sixteen labels indicating links often found in Italian academic web sites were used asstimuli. The labels were presented centrally on the screen (white on black, Arial 66pt,capital).
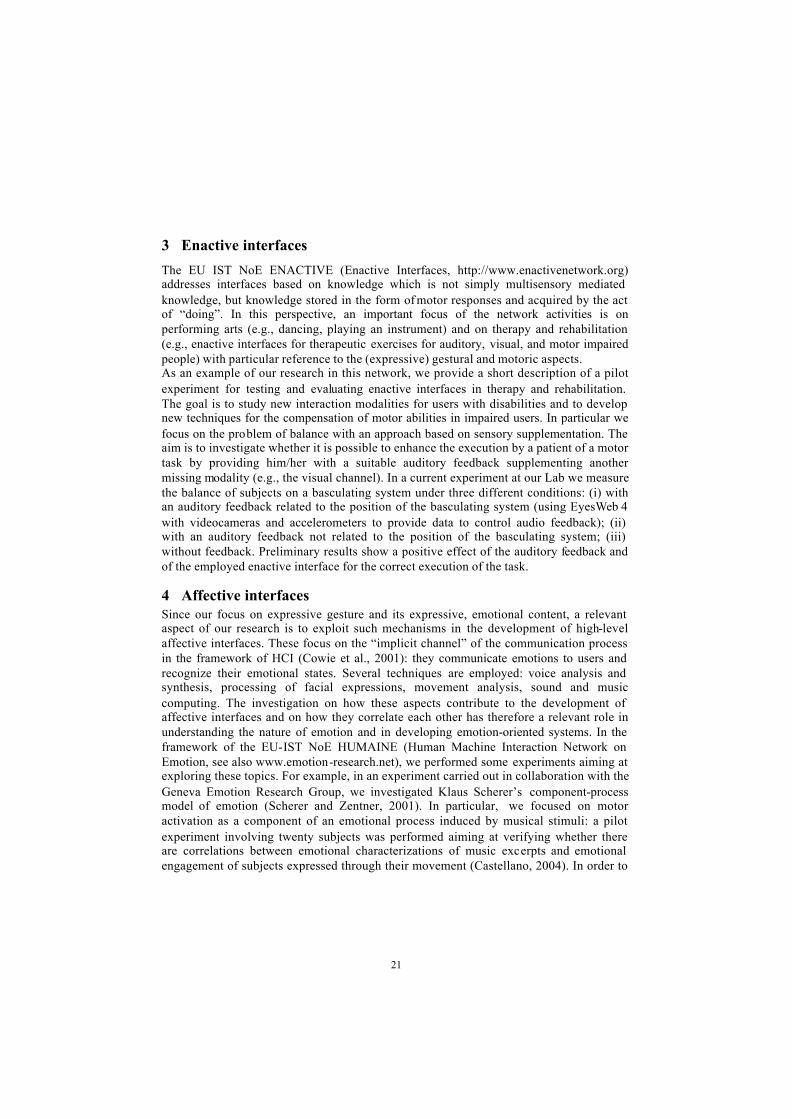
Participants sat in front of a 17” computer monitor and the Tobii x50 eye-tracking sys-tem and underwent to the calibration procedure. Right after they received instructions aboutthe task. They were requested to identify as quickly as possible the target stimulus inside ofa 4x4 grid (see Fig. 1) pressing a response key. The target stimulus was presented for 500ms, whereas the grid lasted on the screen 2000 ms.
Before the grid was presented, a yellow circle appeared for 300 ms in one of the 5 fol-lowing positions: upper-left, upper-right, lower-right, lower-left, and central. This ex-perimental manipulation has been introduced to avoid the systematic use of same searchstrategy. Subjects were informed to ignore this “distracter”. Experiment duration was about90 minutes (1280 trials, 5 blocks). Target presentation, target position inside the grid, anddistracter position were randomized across blocks. Moreover, subjects were randomlyassigned to two groups: a group was informed that the stimuli were simply "labels",
24
whereas the other was informed that the stimuli were "links" of an academic web site. Thismanipulation was introduced in order to investigate whether this information can be rele-vant for users. Indeed, the type of stimuli users should act on could affect behavior, leadingto differential strategies related to the action currently at hand or planned for the immediatefuture.Hannus and colleagues [7] suggested that if people have to find a target in visual space, thesearching process could be affected by the intentions they have about it. If stimuli arepresented as links then this information should become relevant for preparing future ac-tions (click on the links).
Fig. 1. The stimulus-distracter-grid sequence used in the present study. Subjects wererequired to find the target within the grid and to press a key as fast as possible.
3 Results and Discussion
Eye-movements were inspected prior to analyze the data. Dissociation between fixa-tions and correct recognitions was found. However, the target was always contiguous to thefixation area. This result is not surprising, it well known in the psychological literaturethat individuals can fixate one spatial location (for instance, the fixation point in a Posnerparadigm) and attend to another. Nevertheless, the dissociation found should be furtheranalyzed and will not be discussed in this paper.
Type of instruction (labels vs. links) x Quadrat (1 to 16) ANOVA mixed designs were runon the proportion of correct recognitions for each quadrant and on the target search time.Given the high number of tests run (the ANOVAs were run separately for each target cate-gory), the alpha level of each individual test was adjusted using the Bonferroni correctionprocedure. In order to verify the existence of specific patterns depending on the Distracterposition, two completely repeated ANOVA designs were run on the proportion of correctrecognitions and on the time needed to identify the target using the distracter location asfactor (upper-left vs. upper-right vs. lower-right vs. lower-left vs. central). Type of instruc-tion main effect and its interaction with Quadrat were not statistically significant.
Results of the analyses carried out on recognitions (successes and times) showed a maineffect of the quadrant for some stimuli. Post-hoc testing showed a significantly higherproportion of recognitions in quadrat 3 and a significantly lower proportion of recogni-tions in quadrat 10 for the stimulus “classes board” (F15,240=3.03, p<0.001). The stimulus
25

“schedule” showed a significantly higher proportion of recognition in quadrat 8(F15,240=2.48, p<0.01). The stimulus “advanced degree” showed a higher proportion ofrecognitions in quadrats 5, 11, and 13 (F15,240=3.51, p<0.0001). The stimulus “administra-tion open time” showed a higher proportion of recognitions in quadrats 3, 6, 7, and 13(F15,240=2.96, p<0.001). The stimulus “Faculty” showed a higher proportion of recogni-tions in quadrat 4 and a significantly lower proportion of recognitions in quadrat 10(F15,240=5.89, p<0.001). Moreover, this stimulus showed a significantly shorter recogni-tion time in quadrats 4, 11, 13, and 15 (F15,120=4.98, p<0.0001). The stimulus “basic de-gree” showed a significantly higher proportion of recognitions in quadrats 1, 4, and 7 aswell as a significantly lower proportion of recognitions in quadrat 5 (F15,240=5.89,p<0.0001). Moreover, this stimulus showed a significantly lower recognition time inquadrats 2, 3, and 5 (F15,90=3.20, p<0.001). The stimulus “final exam” showed a signifi-cantly higher proportion of recognitions in quadrats 6 and 14 (F15,240=2.68, p<0.001) and asignificantly shorter recognition time in quadrants 5, 6, 13, and 14 (F15,225=11.92,p<0.0001). Finally, the stimulus “dissertation” showed a significantly lower proportion ofrecognitions in quadrats 13 and 15 (F15,240=4.21, p<0.0001), as well as a significantlyshorter recognition time in quadrats 2, 7, 10, 14, 16 and a significantly longer recognitiontime in quadrat 13 (F15,180=15.54, p<0.0001). Overall, only half of the stimuli used showeda main effect of the quadrat, and patterns found were not univocally interpretable. Resultsare thus incompatible with those obtained in previous studies [2,3] and suggest that whatlacks in the present paradigm (namely, action towards specific locations) is the most im-portant information included in the schemata that users utilize.
Analyses run using the distracter location as factor showed a significant main effect(F4,68=6.16, p<0.001). Post-hoc testing showed that the central distracter provided a per-formance improvement (significantly higher proportion of recognitions) compared to theother locations. Moreover, the upper-left position provided a worse performance comparedto the upper-right position. The first result is easily interpretable: starting a visual searchfrom the center of the screen all the locations are uniformly distributed, thus producing anadvantage compared to the other conditions. Instead, the second result could be due to spe-cific costs related to the forced use of a strategy based on reading pattern (top to down, leftto right) which is probably inadequate for the execution of the present task. Confirmingthis pattern, a significant effect of distracter location (F4,68=2.70, p<0.05) was found onrecognition time. Particularly, the upper-left position showed a delay on target identifica-tion compared to the other positions.
4 Conclusions
The notion that visual processing of incoming information strongly depends on the motoractions the observer has planned and hence on his/her goals has gained increasing empiri-cal and theoretical support in recent years in both cognitive psychology and neuroscience.For instance, the model proposed by Goodale and Milner [5] distinguishes between a dorsaland a ventral divisions of the visual system involved in processing visual information foracting in the external world and for object recognition, respectively. Similarly, a growingbody of empirical evidence supports the hypothesis that action systems modulate cogni-tive processes such as memory, perception, and attention [6,8]. Recently, evidence of theimportance of intentions on visual selection processes was obtained in visual search stud-ies [1,7]. Particularly, it has been found that specific action intention about what to do withthe searched object (i.e. grasping the object or pointing at it) affects the way people search
26
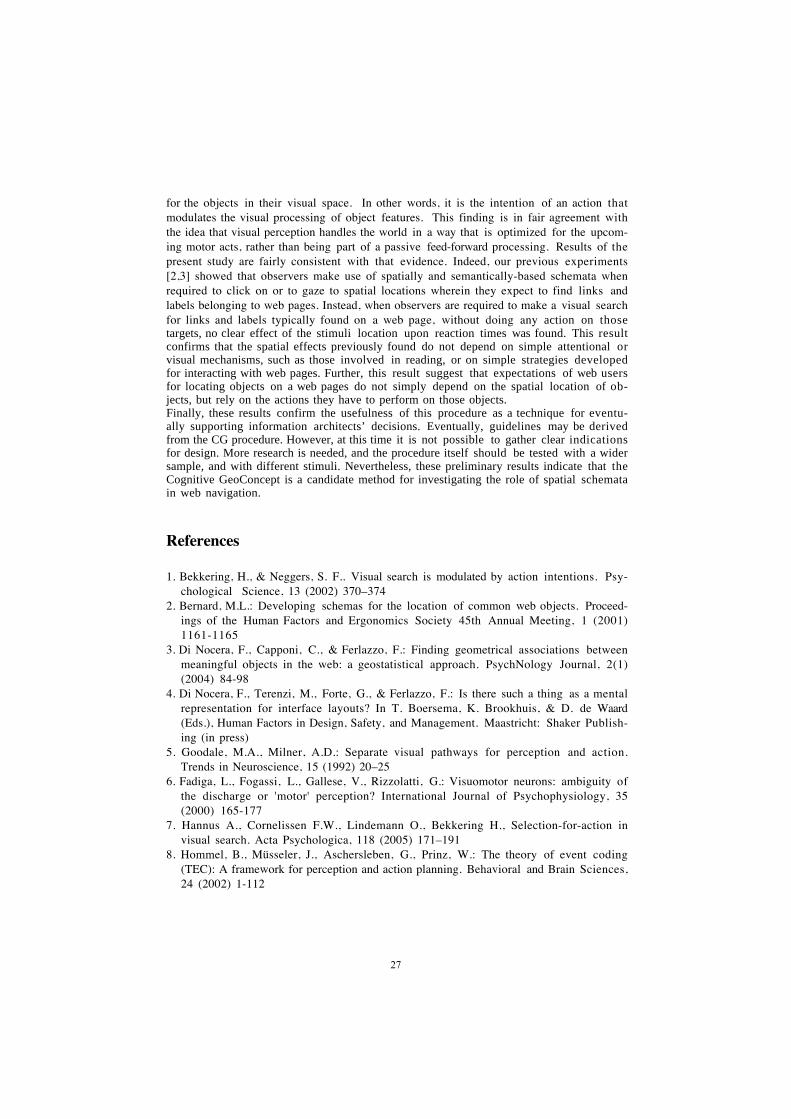
for the objects in their visual space. In other words, it is the intention of an action thatmodulates the visual processing of object features. This finding is in fair agreement withthe idea that visual perception handles the world in a way that is optimized for the upcom-ing motor acts, rather than being part of a passive feed-forward processing. Results of thepresent study are fairly consistent with that evidence. Indeed, our previous experiments[2,3] showed that observers make use of spatially and semantically-based schemata whenrequired to click on or to gaze to spatial locations wherein they expect to find links andlabels belonging to web pages. Instead, when observers are required to make a visual searchfor links and labels typically found on a web page, without doing any action on thosetargets, no clear effect of the stimuli location upon reaction times was found. This resultconfirms that the spatial effects previously found do not depend on simple attentional orvisual mechanisms, such as those involved in reading, or on simple strategies developedfor interacting with web pages. Further, this result suggest that expectations of web usersfor locating objects on a web pages do not simply depend on the spatial location of ob-jects, but rely on the actions they have to perform on those objects.Finally, these results confirm the usefulness of this procedure as a technique for eventu-ally supporting information architects’ decisions. Eventually, guidelines may be derivedfrom the CG procedure. However, at this time it is not possible to gather clear indicationsfor design. More research is needed, and the procedure itself should be tested with a widersample, and with different stimuli. Nevertheless, these preliminary results indicate that theCognitive GeoConcept is a candidate method for investigating the role of spatial schematain web navigation.
References
1. Bekkering, H., & Neggers, S. F.. Visual search is modulated by action intentions. Psy-chological Science, 13 (2002) 370–374
2. Bernard, M.L.: Developing schemas for the location of common web objects. Proceed-ings of the Human Factors and Ergonomics Society 45th Annual Meeting, 1 (2001)1161-1165
3. Di Nocera, F., Capponi, C., & Ferlazzo, F.: Finding geometrical associations betweenmeaningful objects in the web: a geostatistical approach. PsychNology Journal, 2(1)(2004) 84-98
4. Di Nocera, F., Terenzi, M., Forte, G., & Ferlazzo, F.: Is there such a thing as a mentalrepresentation for interface layouts? In T. Boersema, K. Brookhuis, & D. de Waard(Eds.), Human Factors in Design, Safety, and Management. Maastricht: Shaker Publish-ing (in press)
5. Goodale, M.A., Milner, A.D.: Separate visual pathways for perception and action.Trends in Neuroscience, 15 (1992) 20–25
6. Fadiga, L., Fogassi, L., Gallese, V., Rizzolatti, G.: Visuomotor neurons: ambiguity ofthe discharge or 'motor' perception? International Journal of Psychophysiology, 35(2000) 165-177
7. Hannus A., Cornelissen F.W., Lindemann O., Bekkering H., Selection-for-action invisual search. Acta Psychologica, 118 (2005) 171–191
8. Hommel, B., Müsseler, J., Aschersleben, G., Prinz, W.: The theory of event coding(TEC): A framework for perception and action planning. Behavioral and Brain Sciences,24 (2002) 1-112
27

Fitts’ law with multimodal feedback
Amalia de Gotzen and Davide Rocchesso
Dept. of Computer SciencesUniv. of Verona, Verona, Italy
Abstract. This paper explores the use of Fitts’ law in multimodal in-teraction under critical conditions. An audio-visual interactive displayhas been developed in which the user has to perform a simple tuningtask by hand movement. An experiment is done in order to evaluate theinteraction: Fitts’ law[1] is used to verify if the audio feedback can helpthe user to carry out the task. Early results suggest that the interactionis more effective in a multimodal context with continuous audio/visualfeedback.
1 Introduction
Fitts’ law is a very open field: considerable work has been carried out in HCIon Fitts’ law model but the literature on Fitts’ law with sound feedback andgestural control appears to be very scarce. This investigation is also suggestedby the big role played by multi-modality and multi-sensory communication inthe design of next generation interfaces: non-speech communication will play animportant role inside the information stream established between machines andusers. Gesture and sound seem naturally connected in a clear and obvious way:the image of instrument players learning to use their body in order to producesound is indeed widespread and compelling enough. While each instrument needsspecific gestures to be played in a correct and pleasant way, it is possible to findsome invariant laws regulating gestures across all instruments. Computers canbe thought as just another musical instrument, perhaps not new but still farfrom having a coded tradition related to musical gesture.
1.1 Fitts’ law: origins and recent developments
The origins of Fitts’ performance model, so useful in human-computer inter-action, must be kept in mind when considering Fitts’ law. The law takes itsname from its author whose innovative idea, in 1954[1], was to apply informa-tion theory to human-motor systems. The model is based on time and distance.It enables the prediction of human movement and human motion based on rapid,aimed movement (i.e. not drawing or writing). An intuitive idea is that move-ment time is affected by distance and by the precision required by the size of thetarget towards which one is moving. Fitts discovered that movement time wasa logarithmic function of distance when target size was held constant, and thatmovement time (MT ) was also a logarithmic function of target size (W ) whendistance (A) was held constant. Mathematically, Fitts’ law is stated as follows:
28

MT = a + blog2(2A/W ), where:
Here lies the innovative aspect of Fitts’ law: a quantitative way to measurethe difficulty of a motor task becomes available through it and a “new” way totransmit information is implicitly described through the definition of a humanchannel. Fitts defined some other indexes that clarify the analogy with the Shan-non formulation too: the index of difficulty ID = log2(2A/W ) and the index ofperformance IP = ID/MT , analogous to channel capacity C. In [4] there is adetailed analysis of all the variations on Fitts’ law, (i.e., Welford, MacKenzieformulation) derived from the need to correct the approximation by Fitts of theShannon theorem. Skipping the detailed analysis of the data done by MacKenzie,we show here the final result by direct analogy to the Shannon formula, whichis also the most frequently used because it fits better with empirical data:
MT = a + blog2(A/W + 1)
1.2 Fitts’ law in multi-modal interfaces
Most mutual communication between humans as well as the interaction betweenhumans and artifacts involve the visual, auditory, and tactile sensorial channels.In the last couple of decades research in virtual environments, augmented reality,and multimodal interfaces has tried to increase the effectiveness of communica-tion and the sense of presence by means of new technologies aimed at substitutingor augmenting the interaction that humans have with everyday objects or otherhumans. Focusing on auditory display the continuous sonification of processesand events can provide accurate feedback, especially if properly synchronizedwith visual highlighting. In general, auditory display is effective and inexpensivefor all aspects of interaction that are inherently temporal. This is another inter-esting perspective for our research about Fitts’ law and sound. Moreover, in thebroad field of human-machine interaction researchers are continuously proposingnew systems and paradigms, but a quantitative evaluation of the effectivenessof new interactions is often missing. In particular, multimodal communicationvia continuous interaction is still an area with many under-explored issues. Cer-tainly, the designer would benefit from predictive models (similar to Fitts’ law)and guidelines to support and complement intuitions and aesthetic concerns.The literature which concerns directly Fitts’ law and sound modelling is scarce.However, some previous results exploring the auditory feedback instead of vi-sual feedback in Fitts’ law are worth mentioning: [6], [2], [5]. In these works theauditory feedback proved to be useful as a navigation aid (in a timbre spacenavigation [6]) or for gestural control (in a mobile device [5]), or was even madeto respond to a linear model instead of Fitts’ model (in the non visual bullseyemodel [2]). However, all these works used traditional sound parameters: veryoften, these have to be learned (i.e. increasing pitch=next song), and Fitts’ lawis always used in a traditional way (in the pointing task).
Our exploratory work about Fitts’ law in multi-modal interaction intendsto be a first step in the study of the reaction of sounds to gestures: it will
29
lead to more sophisticated ways to produce sounds. The typical structure ofmusical/instrumental gesture (division between control and sound production,that is between audio feedback, haptic feedback and visual cues, and soundproduction) will be carefully studied and extended to lead to better (i.e. morenatural) uses of sound effects. In our work we will deal with sliding/tuninggestures which can carry many similarities in different contexts, the musical andthe interaction one.
2 Experiments
The aim of the following tests is to verify Fitts’ law using gestural interactionwith different kinds of feedback: the indexes of performance will be used tocompare visual, auditory and multi-modal (auditory and visual) feedbacks withthe same input device. The tests have been performed using Pure Data softwarepatches with pdp, pidip and GEM libraries. The user gesture is simply recognizedby color tracking: the system is able to recognize the hand movement, capturedby a simple webcam, while information about position and velocity are used tocontrol the ball horizontal movements on the screen. Each horizontal positionof the visual display represents a frequency: the task is to reach the frequencyrepresented by the vertical red section on the screen as quickly and accuratelyas possible. Seven subjects (between 20 and 54 years old) participated in bothexperiments 1 and 2, performing 13 trials. All participants reported normal hear-ing and sight, and normal motor capabilities in their hands. All of them werenaive as to the purpose and hypotheses of the test and all of them volunteered.
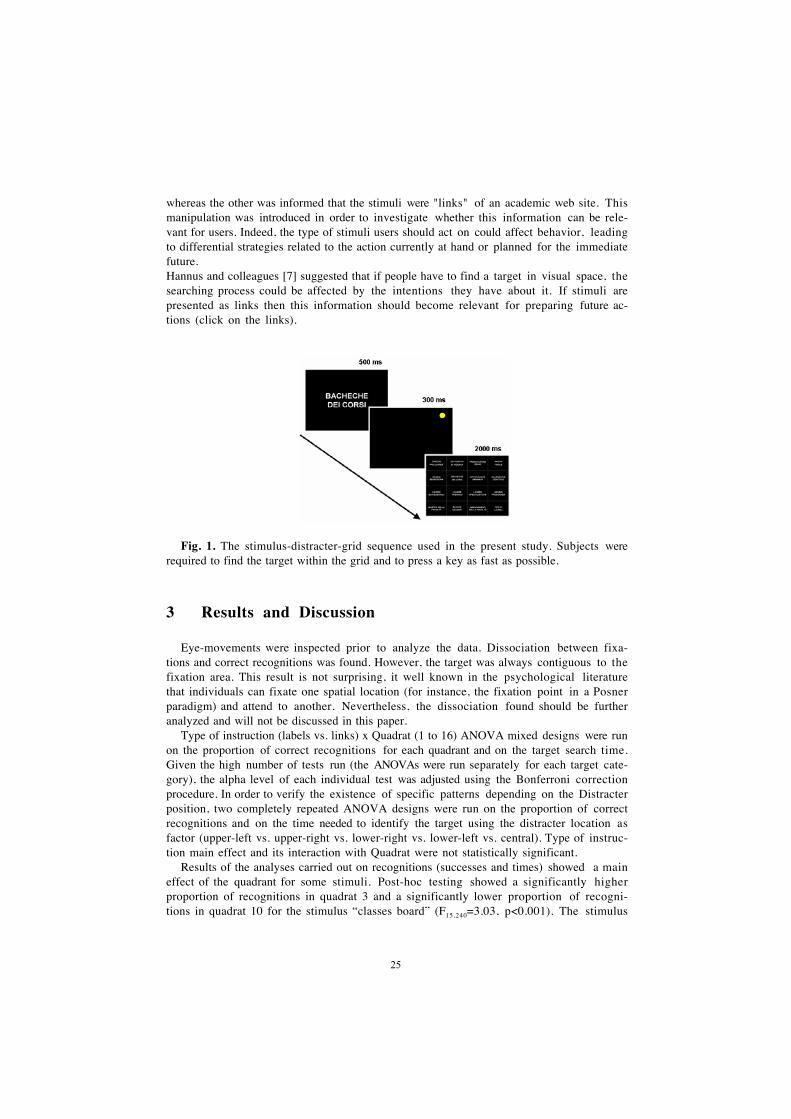
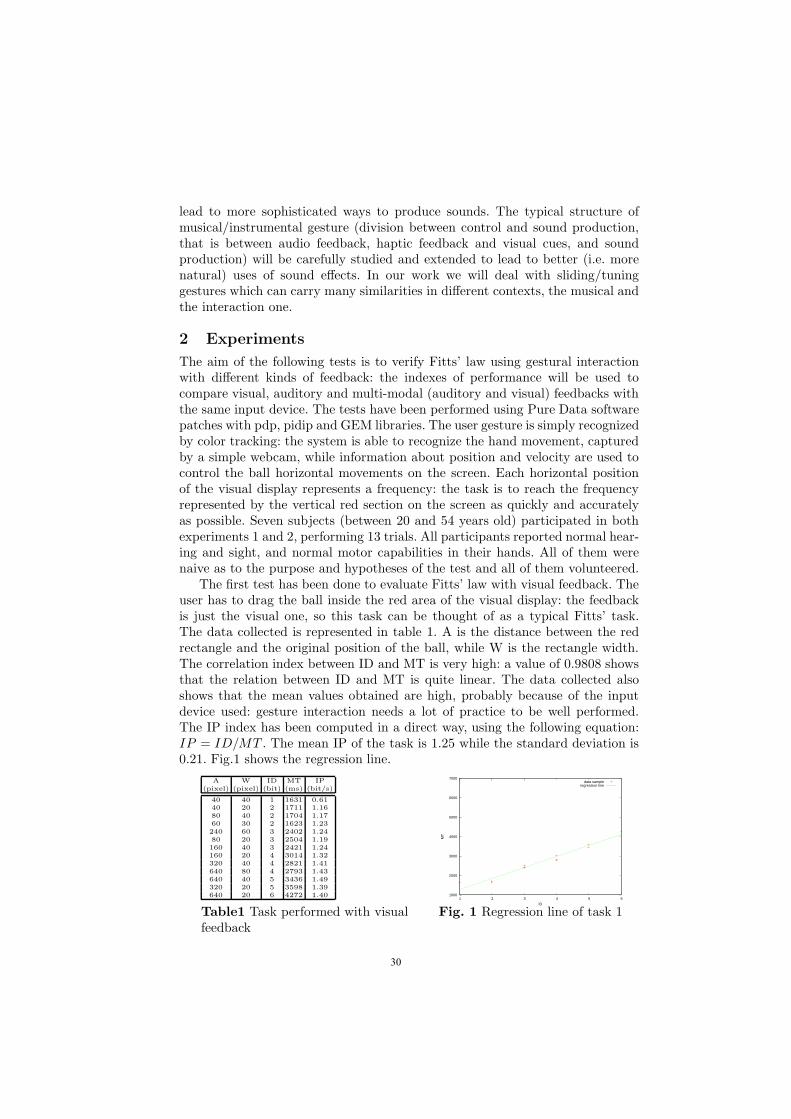
The first test has been done to evaluate Fitts’ law with visual feedback. Theuser has to drag the ball inside the red area of the visual display: the feedbackis just the visual one, so this task can be thought of as a typical Fitts’ task.The data collected is represented in table 1. A is the distance between the redrectangle and the original position of the ball, while W is the rectangle width.The correlation index between ID and MT is very high: a value of 0.9808 showsthat the relation between ID and MT is quite linear. The data collected alsoshows that the mean values obtained are high, probably because of the inputdevice used: gesture interaction needs a lot of practice to be well performed.The IP index has been computed in a direct way, using the following equation:IP = ID/MT . The mean IP of the task is 1.25 while the standard deviation is0.21. Fig.1 shows the regression line.
A W ID MT IP(pixel) (pixel) (bit) (ms) (bit/s)
40 40 1 1631 0.6140 20 2 1711 1.1680 40 2 1704 1.1760 30 2 1623 1.23240 60 3 2402 1.2480 20 3 2504 1.19160 40 3 2421 1.24160 20 4 3014 1.32320 40 4 2821 1.41640 80 4 2793 1.43640 40 5 3436 1.49320 20 5 3598 1.39640 20 6 4272 1.40 1000
2000
3000
4000
5000
6000
7000
1 2 3 4 5 6
MT
ID
data sampleregression line
Table1 Task performed with visualfeedback
Fig. 1 Regression line of task 1
30
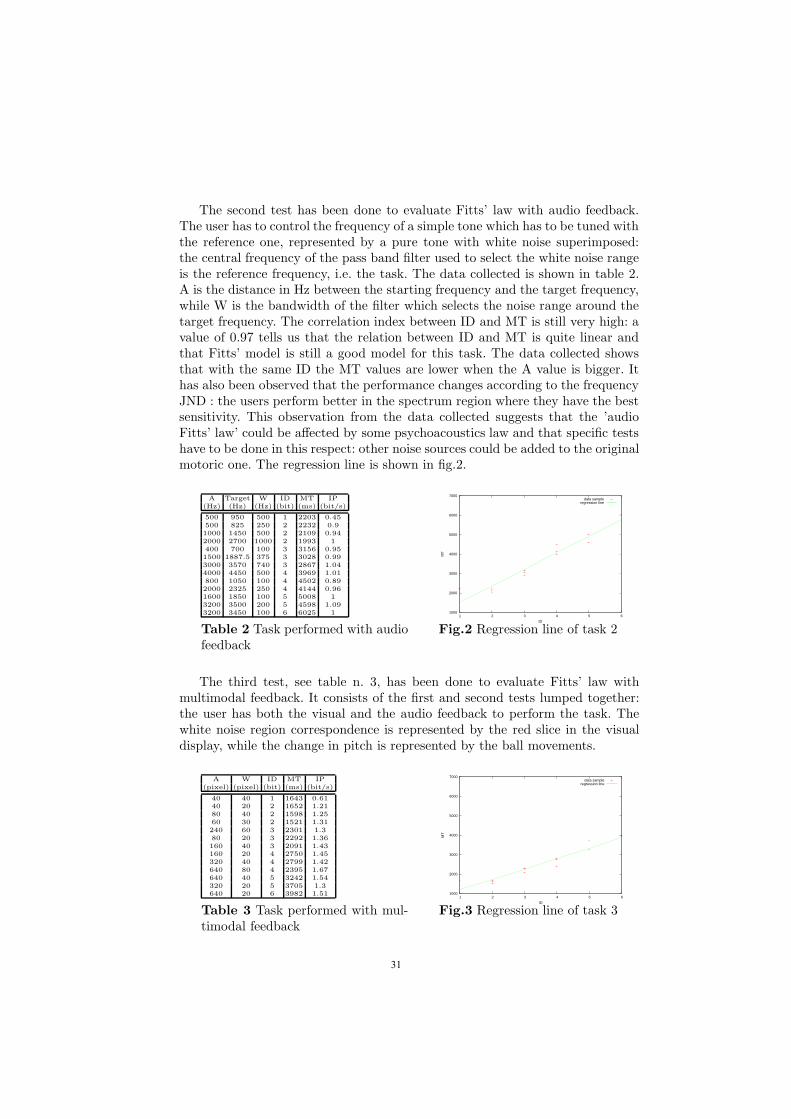
The second test has been done to evaluate Fitts’ law with audio feedback.The user has to control the frequency of a simple tone which has to be tuned withthe reference one, represented by a pure tone with white noise superimposed:the central frequency of the pass band filter used to select the white noise rangeis the reference frequency, i.e. the task. The data collected is shown in table 2.A is the distance in Hz between the starting frequency and the target frequency,while W is the bandwidth of the filter which selects the noise range around thetarget frequency. The correlation index between ID and MT is still very high: avalue of 0.97 tells us that the relation between ID and MT is quite linear andthat Fitts’ model is still a good model for this task. The data collected showsthat with the same ID the MT values are lower when the A value is bigger. Ithas also been observed that the performance changes according to the frequencyJND : the users perform better in the spectrum region where they have the bestsensitivity. This observation from the data collected suggests that the ’audioFitts’ law’ could be affected by some psychoacoustics law and that specific testshave to be done in this respect: other noise sources could be added to the originalmotoric one. The regression line is shown in fig.2.
A Target W ID MT IP(Hz) (Hz) (Hz) (bit) (ms) (bit/s)
500 950 500 1 2203 0.45500 825 250 2 2232 0.91000 1450 500 2 2109 0.942000 2700 1000 2 1993 1400 700 100 3 3156 0.951500 1887.5 375 3 3028 0.993000 3570 740 3 2867 1.044000 4450 500 4 3969 1.01800 1050 100 4 4502 0.892000 2325 250 4 4144 0.961600 1850 100 5 5008 13200 3500 200 5 4598 1.093200 3450 100 6 6025 1 1000
2000
3000
4000
5000
6000
7000
1 2 3 4 5 6
MT
ID
data sampleregression line
Table 2 Task performed with audiofeedback
Fig.2 Regression line of task 2
The third test, see table n. 3, has been done to evaluate Fitts’ law withmultimodal feedback. It consists of the first and second tests lumped together:the user has both the visual and the audio feedback to perform the task. Thewhite noise region correspondence is represented by the red slice in the visualdisplay, while the change in pitch is represented by the ball movements.
A W ID MT IP(pixel) (pixel) (bit) (ms) (bit/s)
40 40 1 1643 0.6140 20 2 1652 1.2180 40 2 1598 1.2560 30 2 1521 1.31240 60 3 2301 1.380 20 3 2292 1.36160 40 3 2091 1.43160 20 4 2750 1.45320 40 4 2799 1.42640 80 4 2395 1.67640 40 5 3242 1.54320 20 5 3705 1.3640 20 6 3982 1.51 1000
2000
3000
4000
5000
6000
7000
1 2 3 4 5 6
MT
ID
data sampleregression line
Table 3 Task performed with mul-timodal feedback
Fig.3 Regression line of task 3
31
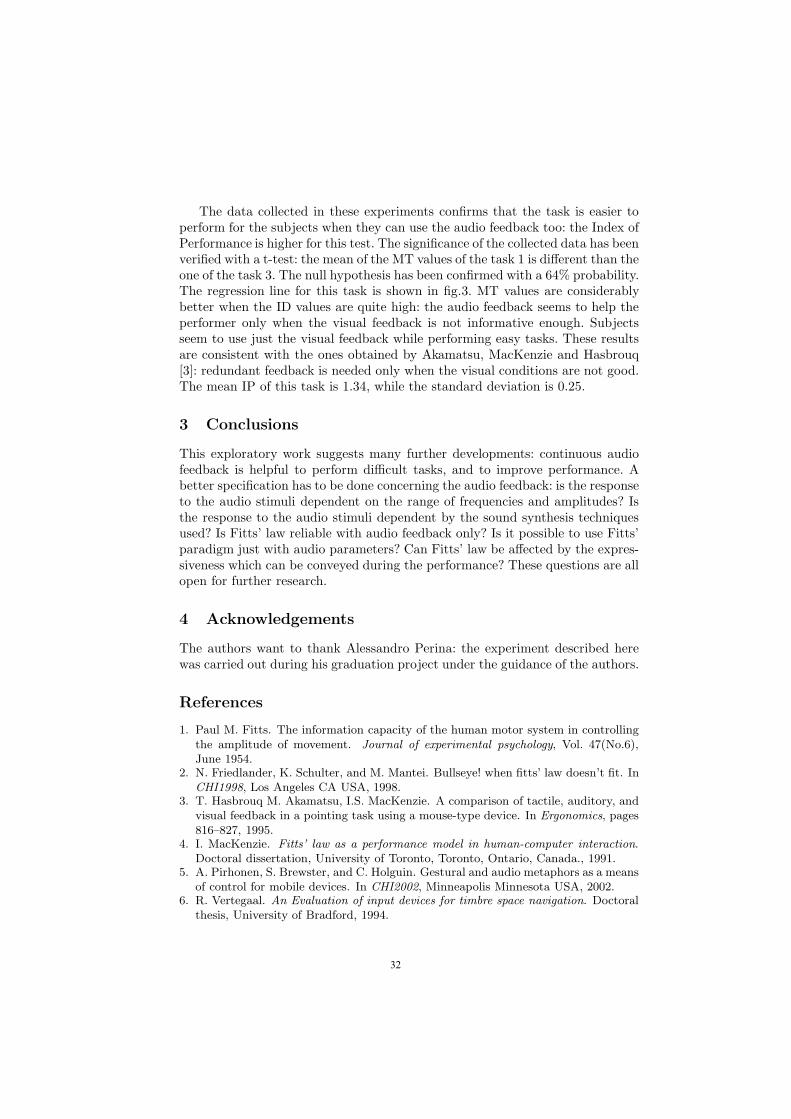
The data collected in these experiments confirms that the task is easier toperform for the subjects when they can use the audio feedback too: the Index ofPerformance is higher for this test. The significance of the collected data has beenverified with a t-test: the mean of the MT values of the task 1 is different than theone of the task 3. The null hypothesis has been confirmed with a 64% probability.The regression line for this task is shown in fig.3. MT values are considerablybetter when the ID values are quite high: the audio feedback seems to help theperformer only when the visual feedback is not informative enough. Subjectsseem to use just the visual feedback while performing easy tasks. These resultsare consistent with the ones obtained by Akamatsu, MacKenzie and Hasbrouq[3]: redundant feedback is needed only when the visual conditions are not good.The mean IP of this task is 1.34, while the standard deviation is 0.25.
3 Conclusions
This exploratory work suggests many further developments: continuous audiofeedback is helpful to perform difficult tasks, and to improve performance. Abetter specification has to be done concerning the audio feedback: is the responseto the audio stimuli dependent on the range of frequencies and amplitudes? Isthe response to the audio stimuli dependent by the sound synthesis techniquesused? Is Fitts’ law reliable with audio feedback only? Is it possible to use Fitts’paradigm just with audio parameters? Can Fitts’ law be affected by the expres-siveness which can be conveyed during the performance? These questions are allopen for further research.
4 Acknowledgements
The authors want to thank Alessandro Perina: the experiment described herewas carried out during his graduation project under the guidance of the authors.
References
1. Paul M. Fitts. The information capacity of the human motor system in controllingthe amplitude of movement. Journal of experimental psychology, Vol. 47(No.6),June 1954.
2. N. Friedlander, K. Schulter, and M. Mantei. Bullseye! when fitts’ law doesn’t fit. InCHI1998, Los Angeles CA USA, 1998.
3. T. Hasbrouq M. Akamatsu, I.S. MacKenzie. A comparison of tactile, auditory, andvisual feedback in a pointing task using a mouse-type device. In Ergonomics, pages816–827, 1995.
4. I. MacKenzie. Fitts’ law as a performance model in human-computer interaction.Doctoral dissertation, University of Toronto, Toronto, Ontario, Canada., 1991.
5. A. Pirhonen, S. Brewster, and C. Holguin. Gestural and audio metaphors as a meansof control for mobile devices. In CHI2002, Minneapolis Minnesota USA, 2002.
6. R. Vertegaal. An Evaluation of input devices for timbre space navigation. Doctoralthesis, University of Bradford, 1994.
32

Design issues
_____________________________________________________________________


Meta-design for supporting users to shape their software solutions
M.F. Costabile1, D. Fogli2, G. Fresta3, A. Marcante4, P. Mussio4, A. Piccinno1
1Dip. Informatica, Università di Bari, costabile, [email protected] 2 Dip. di Elettronica per l’Automazione, Università di Brescia, [email protected]
3 ISTI "A. Faedo", CNR, [email protected] 4 Dip. di Informatica e Comunicazione, Università di Milano,
marcante, [email protected]
Abstract. Computer users are evolving from passive consumers of computer tools and data to a more active role of information and software artifacts producers. Current work practices require end-users to tailor their software environments for better adapting them to their needs, and even to create or modify software artifacts. We describe our meta-design methodology that allows user representatives to be involved in the design of systems that will be used by all the end-users.
1 Introduction
The current strong technological push creates many expectations about the possibilities offered by software systems. Computer users are evolving from passive consumers of computer tools and data to a more active role of information and software artifacts producers [3]. In our work, we cooperate with professional people in participatory design projects to develop computer systems to support these people in their work practice. Professional people, such as physicians, geologists, mechanical engineers, are experts in a specific discipline (e.g. medicine, geology, etc.), not necessarily experts in computer science. Their work practice consists in activities that are “concrete and situated, complexly socially organized and technologically mediated” [7]. Current work practices require end-users to tailor their software environments for better adapting them to their needs, and even to create or modify software artifacts. These are defined activities of End-User Development (EUD), to which a lot of attention is currently devoted by various researchers in Europe and all over in the world [8].
In many domains, e.g. the medical domain, there are different communities of end-users that need to collaborate to reach a common goal. Our approach stresses the need of providing members of each community with an appropriate software environment, suitable to them to manage their own view of the activity to be performed. This environment is called “Software Shaping Workshop” (SSW), since it is developed by exploiting the metaphor of the artisan workshop, where an artisan finds all and only the tools necessary to carry out her/his activities and properly shapes various materials (wood, iron, etc.) into usable products. In analogy, people should find in the
35
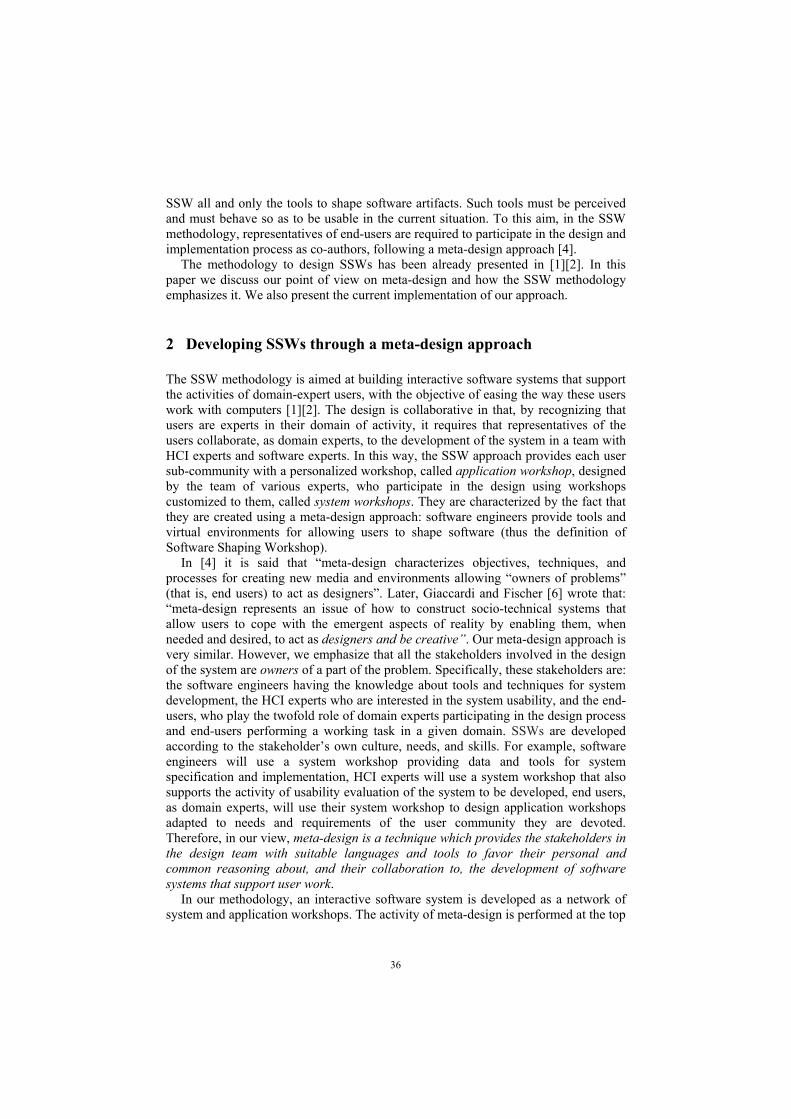
SSW all and only the tools to shape software artifacts. Such tools must be perceived and must behave so as to be usable in the current situation. To this aim, in the SSW methodology, representatives of end-users are required to participate in the design and implementation process as co-authors, following a meta-design approach [4].
The methodology to design SSWs has been already presented in [1][2]. In this paper we discuss our point of view on meta-design and how the SSW methodology emphasizes it. We also present the current implementation of our approach.
2 Developing SSWs through a meta-design approach
The SSW methodology is aimed at building interactive software systems that support the activities of domain-expert users, with the objective of easing the way these users work with computers [1][2]. The design is collaborative in that, by recognizing that users are experts in their domain of activity, it requires that representatives of the users collaborate, as domain experts, to the development of the system in a team with HCI experts and software experts. In this way, the SSW approach provides each user sub-community with a personalized workshop, called application workshop, designed by the team of various experts, who participate in the design using workshops customized to them, called system workshops. They are characterized by the fact that they are created using a meta-design approach: software engineers provide tools and virtual environments for allowing users to shape software (thus the definition of Software Shaping Workshop).
In [4] it is said that “meta-design characterizes objectives, techniques, and processes for creating new media and environments allowing “owners of problems” (that is, end users) to act as designers”. Later, Giaccardi and Fischer [6] wrote that: “meta-design represents an issue of how to construct socio-technical systems that allow users to cope with the emergent aspects of reality by enabling them, when needed and desired, to act as designers and be creative”. Our meta-design approach is very similar. However, we emphasize that all the stakeholders involved in the design of the system are owners of a part of the problem. Specifically, these stakeholders are: the software engineers having the knowledge about tools and techniques for system development, the HCI experts who are interested in the system usability, and the end-users, who play the twofold role of domain experts participating in the design process and end-users performing a working task in a given domain. SSWs are developed according to the stakeholder’s own culture, needs, and skills. For example, software engineers will use a system workshop providing data and tools for system specification and implementation, HCI experts will use a system workshop that also supports the activity of usability evaluation of the system to be developed, end users, as domain experts, will use their system workshop to design application workshops adapted to needs and requirements of the user community they are devoted. Therefore, in our view, meta-design is a technique which provides the stakeholders in the design team with suitable languages and tools to favor their personal and common reasoning about, and their collaboration to, the development of software systems that support user work.
In our methodology, an interactive software system is developed as a network of system and application workshops. The activity of meta-design is performed at the top
36

level of the network, where virtual tools and environments are generated to allow the activity of design and EUD at the levels below. Such a network is an example of the socio-technical environments mentioned in [4], which “empower users to engage actively in the continuous development of systems rather than being restricted to the use of existing systems”. To encourage designers to conceptualize their activity as meta-design, Fischer et al. propose the adoption of the SER (Seeding, Evolutionary Growth, Reseeding) model. In this model, two basic stages are identified in the design process: design time and use time. At design time, system developers (with or without user involvement) create environments and tools (seeds) that are used by end-users to create themselves the solutions at use time (evolutionary growth). Reseeding is finally performed as “a deliberate effort to organize, formalize, and generalize information and artifacts created during the evolutionary growth phase” [6]. In our approach, workshop design and evolution continue throughout the overall system life cycle, performed through the system workshops. Therefore, no reseeding is needed for our systems.
To accommodate unexpected issues at use time, systems must be underdesigned at design time [4]. On the other hand, we speak of developmental systems stressing that all systems, when released, are complete as far as the current knowledge of the problem permits, but have the potentiality to be evolved. Customization to the user community performed by the design team and tailoring performed by the end-users are the two techniques that allow users “to act as designers and be creative” [6].
We are currently working to a project with the physicians of the neurology ward of the “Giovanni XXIII” Paediatrical Hospital of Bari. In this project, different communities of physicians are involved, namely neurologists and neuro-radiologists, in the analysis of clinical cases and in the generation of the diagnosis.
The evolution of research and technology in the medical domain allows specialists to have the aid of medical examinations of different types, i.e. laboratory examinations, X-rays, MRI (Magnetic Resonance Imaging). A team of physicians with different specializations analyze the medical examinations giving their own contribution to the formulation of a diagnosis according to their “expertise”. This has contributed to change the medical culture asking physicians for finding new ways of communication and collaboration. The evolution of users needs has in turn determined new ways of using the information technology: for example, from the ethnographic study we performed, we found that, when physicians cannot physically meet to discuss the cases, collaboration is supported by different commercial software tools: if a physician needs a consultation on the analysis of MRI, s/he photographs with a digital camera the images that s/he believes useful for formulating a diagnosis and send them to a colleague by email requesting an opinion. This suggested us the need of evolving the existing software tools, in order to satisfy the evolved users, technology and working environment. We call this phenomenon co-evolution of users and systems [2].
According to the SSW methodology, a network of system and application workshops has been developed. The application workshops are customized to the physicians’ notation, language, culture, and background, and physicians themselves can further tailor them according to their needs. These workshops allow the specialists to cooperate in virtual meetings to reach an agreed diagnosis.
37

3 SSW implementation
The workshops in a SSW network are implemented as IM2L programs. IM2L (Interaction Multimodal Markup Language) is an XML-based language that provides the rules for the definition of components of the SSW: its markup tags encode a description of storage organization and logical structure of the components. Figure 1 sketches the workshop architecture. As shown by tick arrows in Figure 1, an IM2L program is interpreted by a web browser (Microsoft Explorer in our case), which coordinates the activities of a standard XML processor, an ECMAscript interpreter and a standard SVG viewer (in our case the Adobe SVG Viewer plugin). SVG is the W3C standard for vector graphics [9]. In the current implementation, an IM2L program is constituted by: 1) a starter SVG linking the IM2L document to its interpreter; 2) an IM2L document, composed of one or more IM2L fragments specifying the contents and the logical structure of the components of the SSW and of the SSW itself; 3) the set of SVG prototypes, specifying the physical materialization of the components of the SSW; 4) the set of javascript instantiation functions, which instantiate the SVG prototypes with the information included in the IM2L document and compute their materialization features, such as geometry, color, appearance; 5) the set of javascript interaction managing functions, which implement the behavior of the SSW as reactions to user activities. Details about the initial state instantiation of a SSW and how the interaction with it occurs can be found in [5]. Here, we discuss the generation of a child workshop while an expert is interacting with a system workshop, as illustrated in Figure 1. To this end, two special archives of data are exploited. Such archives contain IM2L fragments defining the components that the user will select to compose child workshops, and the interaction managing functions implementing the transformation rules of such components (see top left of Figure 1). The IM2L program implementing a child workshop is thus generated by the IM2L program implementing a system workshop in the following way: 1. The archives containing the SVG prototypes and the JavaScript instantiation
functions are simply replicated. The underlying hypothesis is that, at the moment, only the software engineers are in charge of preparing such kinds of information, since they are written by using computer-oriented languages that are not easily manageable by end-users and HCI experts.
2. The IM2L document is generated as a consequence of the selection of components from those available in suitable repositories and their combination into complex components up to the whole workshop. The user interacts with the system workshop by direct manipulation dragging components from repositories visualized on the screen to the working area; as a consequence, the IM2L fragments defining the selected components are automatically searched in the external archive of IM2L fragments.
3. The interaction managing functions of the child workshops are also searched in the data archive as a consequence of components selection: in fact, they implement the activities to be performed when the user interacts with the components in the child workshop, so links to them are present in the IM2L fragments defining the components. All interaction managing functions linked to the IM2L fragments, chosen during the child workshop composition, are therefore included in the archive of interaction managing functions.
38
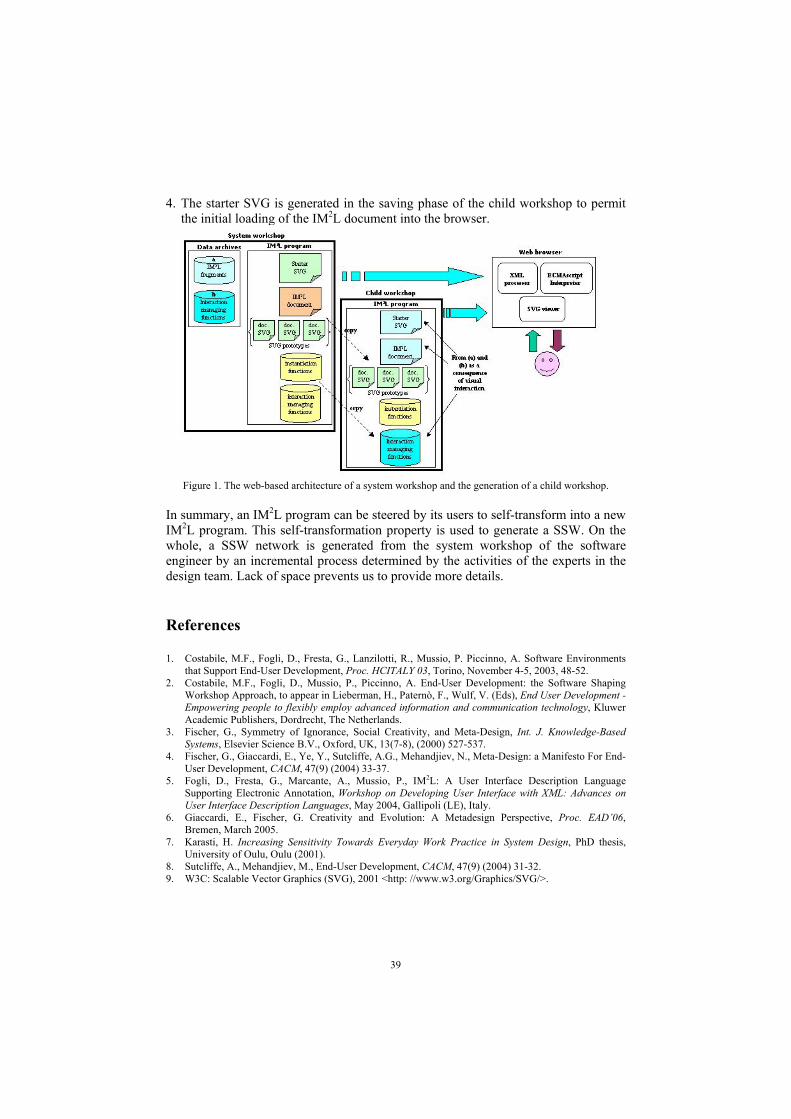
4. The starter SVG is generated in the saving phase of the child workshop to permit the initial loading of the IM2L document into the browser.
Figure 1. The web-based architecture of a system workshop and the generation of a child workshop.
In summary, an IM2L program can be steered by its users to self-transform into a new IM2L program. This self-transformation property is used to generate a SSW. On the whole, a SSW network is generated from the system workshop of the software engineer by an incremental process determined by the activities of the experts in the design team. Lack of space prevents us to provide more details.
References
1. Costabile, M.F., Fogli, D., Fresta, G., Lanzilotti, R., Mussio, P. Piccinno, A. Software Environments that Support End-User Development, Proc. HCITALY 03, Torino, November 4-5, 2003, 48-52.
2. Costabile, M.F., Fogli, D., Mussio, P., Piccinno, A. End-User Development: the Software Shaping Workshop Approach, to appear in Lieberman, H., Paternò, F., Wulf, V. (Eds), End User Development - Empowering people to flexibly employ advanced information and communication technology, Kluwer Academic Publishers, Dordrecht, The Netherlands.
3. Fischer, G., Symmetry of Ignorance, Social Creativity, and Meta-Design, Int. J. Knowledge-Based Systems, Elsevier Science B.V., Oxford, UK, 13(7-8), (2000) 527-537.
4. Fischer, G., Giaccardi, E., Ye, Y., Sutcliffe, A.G., Mehandjiev, N., Meta-Design: a Manifesto For End-User Development, CACM, 47(9) (2004) 33-37.
5. Fogli, D., Fresta, G., Marcante, A., Mussio, P., IM2L: A User Interface Description Language Supporting Electronic Annotation, Workshop on Developing User Interface with XML: Advances on User Interface Description Languages, May 2004, Gallipoli (LE), Italy.
6. Giaccardi, E., Fischer, G. Creativity and Evolution: A Metadesign Perspective, Proc. EAD’06, Bremen, March 2005.
7. Karasti, H. Increasing Sensitivity Towards Everyday Work Practice in System Design, PhD thesis, University of Oulu, Oulu (2001).
8. Sutcliffe, A., Mehandjiev, M., End-User Development, CACM, 47(9) (2004) 31-32. 9. W3C: Scalable Vector Graphics (SVG), 2001 <http: //www.w3.org/Graphics/SVG/>.
39

TERESA: An Environment for Designing Multi-Device Interactive Services
Silvia Berti, Giulio, Mori, Fabio Paternò, Carmen Santoro
ISTI-CNR, Via G. Moruzzi, 1 56100 Pisa, Italy
Silvia.Berti,Giulio.Mori,Fabio.Paterno,Carmen.Santoro @isti.cnr.it
http://giove.isti.cnr.it
Abstract. In this paper we illustrate TERESA, an authoring environment for the design of multi-device interfaces that are obtained using logical descriptions of interactive system in device-independent languages. The tool contains an in-telligent engine supporting a number of transformations in order to move across such logical descriptions and, consequently, generate the user interface for various types of platforms.
1 Introduction
With the advent of the wireless Internet and the rapidly expanding market of smart devices, designing interactive applications supporting multiple platforms has become a difficult issue. One fundamental issue is how to support software designers and developers in supporting nomadic users, who can access their applications through multiple devices from different locations.
Model-based approaches [7] could represent a feasible solution for addressing such issues: the basic idea is to identify useful abstractions highlighting the main aspects that should be considered when designing effective interactive applications. Indeed, the approach proposed in this paper extends previous work in the model-based design area in order to support development of multi-device user interfaces through logical descriptions and associated transformations.
TERESA (Transformation Environment for inteRactivE Systems representAtions) supports transformations in a top-down manner, providing the possibility of obtaining interfaces for different types of devices from logical descriptions. It differs from other approaches such as UIML [1], which mainly consider low-level models. XIML [9] has similar goals but there is no publicly available tool supporting it. Some usability criteria have been incorporated into the tool transformations from task to user inter-face. This means that the tool is able to provide suggestions for selecting the most appropriate interaction techniques and ways to compose them. Such transformations guarantee a consistent design because the same design criteria are applied in similar situations.
40
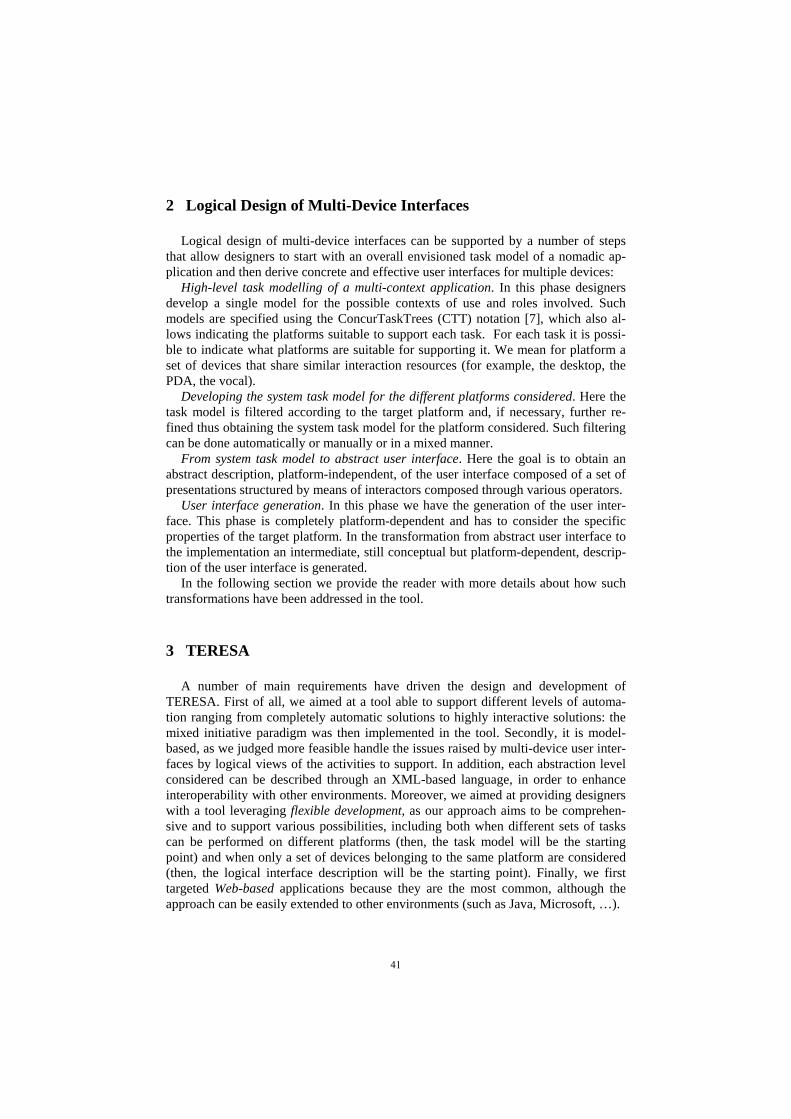
2 Logical Design of Multi-Device Interfaces
Logical design of multi-device interfaces can be supported by a number of steps that allow designers to start with an overall envisioned task model of a nomadic ap-plication and then derive concrete and effective user interfaces for multiple devices:
High-level task modelling of a multi-context application. In this phase designers develop a single model for the possible contexts of use and roles involved. Such models are specified using the ConcurTaskTrees (CTT) notation [7], which also al-lows indicating the platforms suitable to support each task. For each task it is possi-ble to indicate what platforms are suitable for supporting it. We mean for platform a set of devices that share similar interaction resources (for example, the desktop, the PDA, the vocal).
Developing the system task model for the different platforms considered. Here the task model is filtered according to the target platform and, if necessary, further re-fined thus obtaining the system task model for the platform considered. Such filtering can be done automatically or manually or in a mixed manner.
From system task model to abstract user interface. Here the goal is to obtain an abstract description, platform-independent, of the user interface composed of a set of presentations structured by means of interactors composed through various operators.
User interface generation. In this phase we have the generation of the user inter-face. This phase is completely platform-dependent and has to consider the specific properties of the target platform. In the transformation from abstract user interface to the implementation an intermediate, still conceptual but platform-dependent, descrip-tion of the user interface is generated.
In the following section we provide the reader with more details about how such transformations have been addressed in the tool.
3 TERESA
A number of main requirements have driven the design and development of TERESA. First of all, we aimed at a tool able to support different levels of automa-tion ranging from completely automatic solutions to highly interactive solutions: the mixed initiative paradigm was then implemented in the tool. Secondly, it is model-based, as we judged more feasible handle the issues raised by multi-device user inter-faces by logical views of the activities to support. In addition, each abstraction level considered can be described through an XML-based language, in order to enhance interoperability with other environments. Moreover, we aimed at providing designers with a tool leveraging flexible development, as our approach aims to be comprehen-sive and to support various possibilities, including both when different sets of tasks can be performed on different platforms (then, the task model will be the starting point) and when only a set of devices belonging to the same platform are considered (then, the logical interface description will be the starting point). Finally, we first targeted Web-based applications because they are the most common, although the approach can be easily extended to other environments (such as Java, Microsoft, …).
41

In TERESA some transformations are available in order to move from a task model specification to the generation of the user interface. More specifically, from the analysis of the CTT nomadic task model it is possible to derive an interactor-based description of the associated Abstract User Interface (AUI), composed of a number of presentations and connections. Each presentation defines a set of interaction tech-niques perceivable by the user at a given time, while the connections define the dy-namic behaviour of the UI, by indicating what interactions trigger a change of presen-tation and what the next presentation is. Each presentation is defined in terms of interactors classified depending on their semantics and possibly composed through some composition operators. Such operators have been defined depending on the communication effect that they support: grouping, indicating a set of interface ele-ments logically connected to each other; relation, highlighting a one-to-many relation among some elements; ordering, when some kind of ordering among a set of ele-ments can be highlighted; hierarchy, different levels of importance can be defined among a set of elements. The specification is in turn the input for another transforma-tion which yields the related concrete user interface for the specific media and inter-action platform selected (a number of parameters for customising the concrete user interface are made available to the designer in this phase). Lastly, the tool automati-cally generates the final UI for the target platform. In the following sections we fur-ther detail such a process. It is important to note that the various logical description used in the environment are defined through XML-based languages.
Fig. 1. : The environment for the composition operators and interactors properties.
The first step of the process is translating the CTT task model into an equivalent rep-resentation identifying sets of interactions that should be supported by each abstract
42

user interface presentation. Information in the CTT task model is used to derive the conditions for moving across various presentations and the composition operators used in the abstract user interface. The next transformation translates it into a concrete user interface, in which a specific technique is used for implementing each compo-nent of the presentations for the currently selected platform. Figure 1 shows the envi-ronment through which designers can customise the presentations that are going to be generated by the tool, if they want to modify the version automatically generated. For example, the designer can decide to implement the grouping operator by means of a fieldset (see Fig.1) or using the colour or aligning the elements vertically or horizon-tally, in the case of a desktop platform. The possible implementation techniques differ depending on the platforms. For instance, the global parameters that are available to designers for customising the user interface might vary according to the platform (in the desktop system parameters such as the background picture, colour of the text, etc. are available, whereas in vocal devices they can be used to define welcome messages, use of barge-in options, synthesis and recognition properties, etc.).
Fig. 2. The same application with different user interfaces depending on the platform.
Figure 2 shows examples of user interfaces derived by applying the described method to a museum application. There are some differences concerning the presenta-tions on the different platforms: for instance, for implementing the grouping operator
43
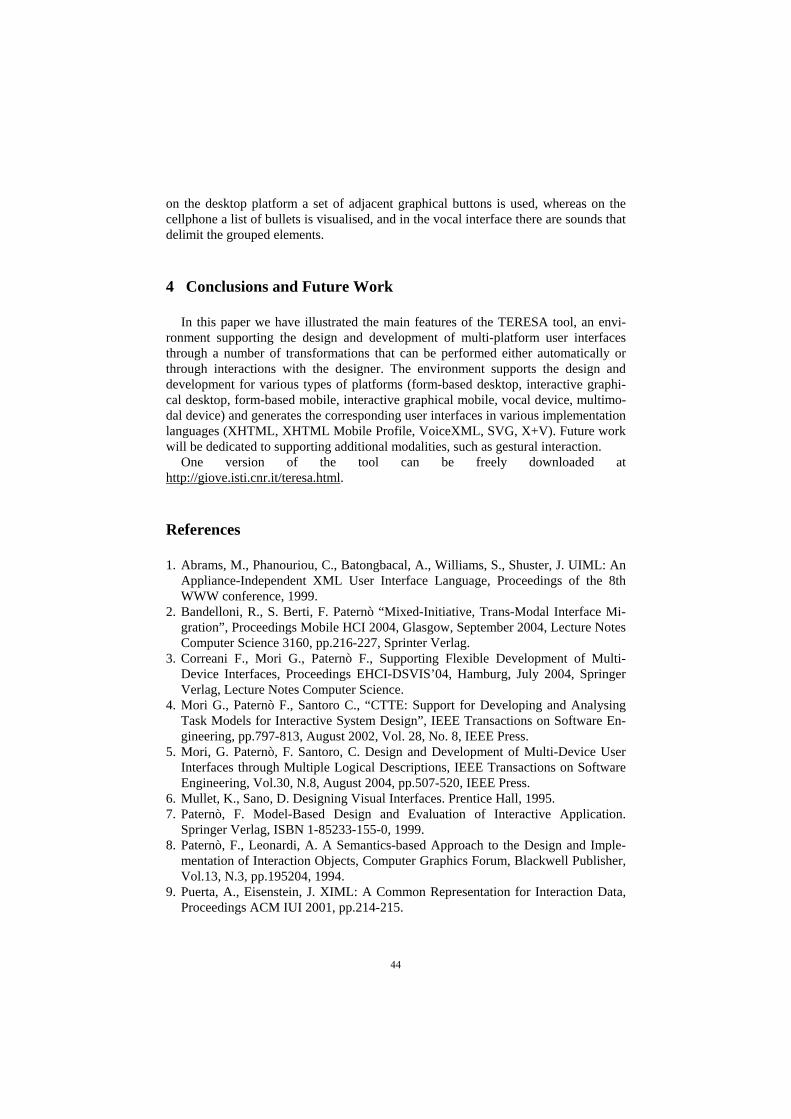
on the desktop platform a set of adjacent graphical buttons is used, whereas on the cellphone a list of bullets is visualised, and in the vocal interface there are sounds that delimit the grouped elements.
4 Conclusions and Future Work
In this paper we have illustrated the main features of the TERESA tool, an envi-ronment supporting the design and development of multi-platform user interfaces through a number of transformations that can be performed either automatically or through interactions with the designer. The environment supports the design and development for various types of platforms (form-based desktop, interactive graphi-cal desktop, form-based mobile, interactive graphical mobile, vocal device, multimo-dal device) and generates the corresponding user interfaces in various implementation languages (XHTML, XHTML Mobile Profile, VoiceXML, SVG, X+V). Future work will be dedicated to supporting additional modalities, such as gestural interaction.
One version of the tool can be freely downloaded at http://giove.isti.cnr.it/teresa.html.
References
1. Abrams, M., Phanouriou, C., Batongbacal, A., Williams, S., Shuster, J. UIML: An Appliance-Independent XML User Interface Language, Proceedings of the 8th WWW conference, 1999.
2. Bandelloni, R., S. Berti, F. Paternò “Mixed-Initiative, Trans-Modal Interface Mi-gration”, Proceedings Mobile HCI 2004, Glasgow, September 2004, Lecture Notes Computer Science 3160, pp.216-227, Sprinter Verlag.
3. Correani F., Mori G., Paternò F., Supporting Flexible Development of Multi-Device Interfaces, Proceedings EHCI-DSVIS’04, Hamburg, July 2004, Springer Verlag, Lecture Notes Computer Science.
4. Mori G., Paternò F., Santoro C., “CTTE: Support for Developing and Analysing Task Models for Interactive System Design”, IEEE Transactions on Software En-gineering, pp.797-813, August 2002, Vol. 28, No. 8, IEEE Press.
5. Mori, G. Paternò, F. Santoro, C. Design and Development of Multi-Device User Interfaces through Multiple Logical Descriptions, IEEE Transactions on Software Engineering, Vol.30, N.8, August 2004, pp.507-520, IEEE Press.
6. Mullet, K., Sano, D. Designing Visual Interfaces. Prentice Hall, 1995. 7. Paternò, F. Model-Based Design and Evaluation of Interactive Application.
Springer Verlag, ISBN 1-85233-155-0, 1999. 8. Paternò, F., Leonardi, A. A Semantics-based Approach to the Design and Imple-
mentation of Interaction Objects, Computer Graphics Forum, Blackwell Publisher, Vol.13, N.3, pp.195204, 1994.
9. Puerta, A., Eisenstein, J. XIML: A Common Representation for Interaction Data, Proceedings ACM IUI 2001, pp.214-215.
44
Virtual environments
_____________________________________________________________________

Visualizing Users’ Flow to Derive Information about Virtual Environments Usage
Lucio Ieronutti, Roberto Ranon and Luca Chittaro
HCI Lab, Dept. of Math and Computer Science, University of Udine, Via delle Scienze 206, 33100, Udine, Italy
ieronutt,ranon,[email protected] http://hcilab.uniud.it
Abstract. This paper presents the current status of VU-Flow (Visualization of Users’ Flow), a software tool that is able to automatically record usage data of Virtual Environments (VEs) and provide a set of 2D and 3D visualizations that make it easy for the VE designer to visually detect peculiar users' behaviors in the recorded data. In particular, the visualizations concern: (i) the detailed paths followed by single or groups of users in the VE, (ii) areas more/less traveled by users, (iii) areas where users spent more/less time, (iv) the parts of the VE more/less seen by users, (v) users’ predominant movement directions and (vi) areas where traffic congestions occurred.
1 Introduction
Analyzing how users navigate in electronic information spaces (e.g., identifying more/less accessed parts of the information space or recurrent navigation patterns) may help one in understanding the effects of design choices. Unfortunately, while several techniques and tools for such activity have been proposed in the contexts of Web sites or, more generally, hypermedia systems (e.g., see [1,2,3]), in the context of Virtual Environments (VEs) there are no established techniques and tools.
In this paper, we present a software tool, called VU-Flow (Visualization of Users’ Flow), which is able to record users’ movements in a VE and visualize them using various visualization techniques that help one in deriving information about how users navigate in the VE, highlighting navigability problems, and making hypotheses about interests or preferences of users. The paper is structured as follows. In Section 2, we survey related work and explain the main motivations of our research. Section 3 describes main functionalities of the tool. Finally, Section 4 concludes the paper by discussing ongoing or future developments of VU-Flow.
2 Related Work and Motivations
In the context of Web/Hypermedia systems, by analyzing users’ actions it is possible to understand how the site content is being used and thus derive usability-related
47

information. In particular, analyzing the number of accesses to Web pages and deriv-ing recurrent patterns of visit can provide information on the usability of the Web site. Some tools (e.g., [2][3]) facilitate analysis by presenting results in graphical formats. For example, the VISVIP tool [2] visually represents paths followed by users during a site visit; the tool visualizes the Web site as a directed graph (pages as nodes and links as edges), where different nodes are connected through colored lines representing links between pages. The VISVIP visualizes paths followed by users connecting vis-ited pages through smooth lines and using colors for representing paths followed by different users. Moreover, VISVIP visualizes the average time spent at each page as a the length of dotted vertical line starting at the corresponding node. A different graph-based visualization (again, where the graph matches the structure of the Web site) is provided by the WebQuilt tool [3]. In particular, the tool represents nodes of the graph by using screenshots of Web pages, and arrows connecting different nodes indicate traversed links, where the thickness of an arrow indicates how many times the corresponding link has been followed, while its color indicates the average amount of time spent before clicking the link.
The same motivations for studying users’ navigational behavior in Web/Hypermedia applications still holds in the context of VEs, because navigation is in both cases one of the fundamental user activities. Additionally, navigation in VEs is generally perceived as a difficult activity by users, and typical navigation problems, such as disorientation and difficulties in wayfinding, are exacerbated by well-known troubles in moving inside a 3D space. Navigational problems in VE are critical for usability, since they typically result in users becoming rapidly frustrated and leaving the VE, missing interesting parts of it, or completing the visit with the feeling of not having adequately explored it. Although some solutions to improve the navigability of VEs (e.g., following design guidelines [4] or providing users with electronic navi-gation aids, see e.g. [5][6]) have been proposed, in most cases, finding all usability problems related with navigation requires one to observe and analyze how users really navigate through the VE.
3 Main Functionalities of VU-Flow
VU-Flow samples the position and orientation of users in the VE at brief time inter-vals and then visualize them in formats that make it easy for the VE designer to visu-ally detect peculiar users' behaviors and thus better understand the effects of her de-sign choices. In particular, VU-Flow provides the evaluator with the following func-tionalities.
Replaying Users’ Visits. VU-Flow allows one to replay visits of single or groups of users to a VE and visualize them using either a 2D or a 3D visualization. In the 2D visualization, the current position of the user is drawn on the map as a point, while orientation is represented by two lines that delimit the user’s field of view. The 3D visualization (see Fig. 1a) replays users’ visit into the original VE, by using a differ-ent avatar model for each user. The evaluator can observe the replayed visits either through a freely controlled viewpoint, or directly “through the eyes” of one of the users by selecting a specific user’s viewpoint. The first solution allows the evaluator
48
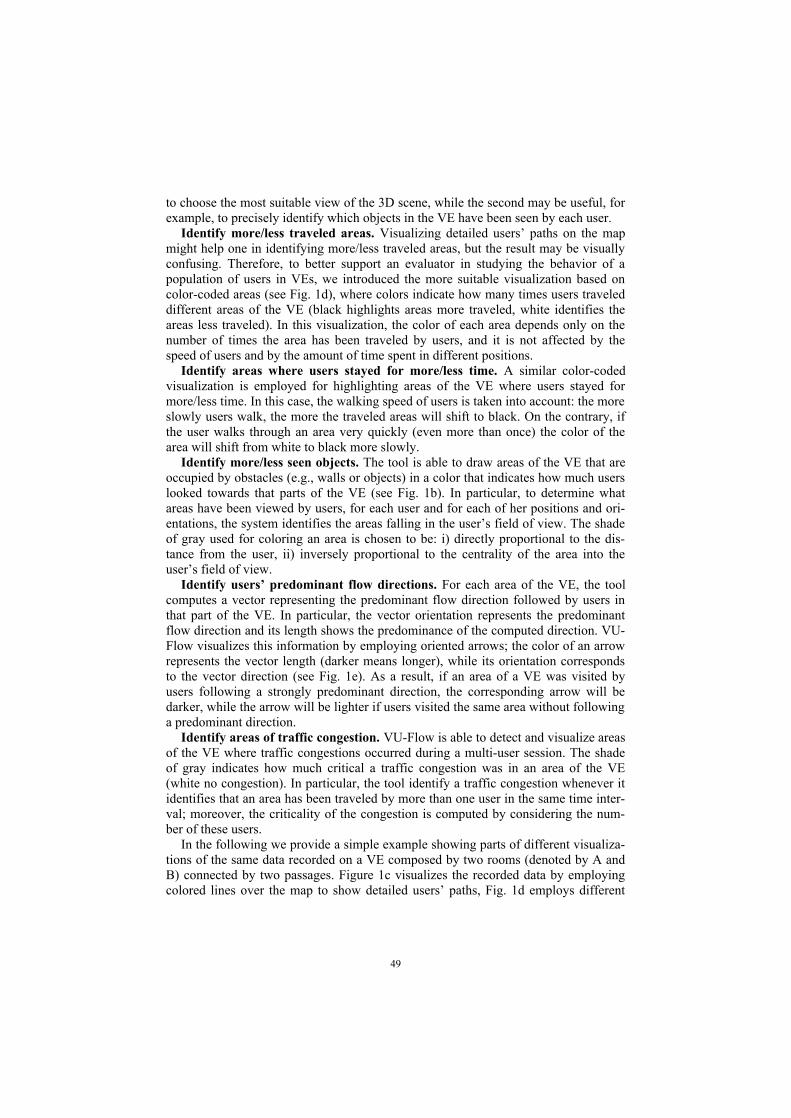
to choose the most suitable view of the 3D scene, while the second may be useful, for example, to precisely identify which objects in the VE have been seen by each user.
Identify more/less traveled areas. Visualizing detailed users’ paths on the map might help one in identifying more/less traveled areas, but the result may be visually confusing. Therefore, to better support an evaluator in studying the behavior of a population of users in VEs, we introduced the more suitable visualization based on color-coded areas (see Fig. 1d), where colors indicate how many times users traveled different areas of the VE (black highlights areas more traveled, white identifies the areas less traveled). In this visualization, the color of each area depends only on the number of times the area has been traveled by users, and it is not affected by the speed of users and by the amount of time spent in different positions.
Identify areas where users stayed for more/less time. A similar color-coded visualization is employed for highlighting areas of the VE where users stayed for more/less time. In this case, the walking speed of users is taken into account: the more slowly users walk, the more the traveled areas will shift to black. On the contrary, if the user walks through an area very quickly (even more than once) the color of the area will shift from white to black more slowly.
Identify more/less seen objects. The tool is able to draw areas of the VE that are occupied by obstacles (e.g., walls or objects) in a color that indicates how much users looked towards that parts of the VE (see Fig. 1b). In particular, to determine what areas have been viewed by users, for each user and for each of her positions and ori-entations, the system identifies the areas falling in the user’s field of view. The shade of gray used for coloring an area is chosen to be: i) directly proportional to the dis-tance from the user, ii) inversely proportional to the centrality of the area into the user’s field of view.
Identify users’ predominant flow directions. For each area of the VE, the tool computes a vector representing the predominant flow direction followed by users in that part of the VE. In particular, the vector orientation represents the predominant flow direction and its length shows the predominance of the computed direction. VU-Flow visualizes this information by employing oriented arrows; the color of an arrow represents the vector length (darker means longer), while its orientation corresponds to the vector direction (see Fig. 1e). As a result, if an area of a VE was visited by users following a strongly predominant direction, the corresponding arrow will be darker, while the arrow will be lighter if users visited the same area without following a predominant direction.
Identify areas of traffic congestion. VU-Flow is able to detect and visualize areas of the VE where traffic congestions occurred during a multi-user session. The shade of gray indicates how much critical a traffic congestion was in an area of the VE (white no congestion). In particular, the tool identify a traffic congestion whenever it identifies that an area has been traveled by more than one user in the same time inter-val; moreover, the criticality of the congestion is computed by considering the num-ber of these users.
In the following we provide a simple example showing parts of different visualiza-tions of the same data recorded on a VE composed by two rooms (denoted by A and B) connected by two passages. Figure 1c visualizes the recorded data by employing colored lines over the map to show detailed users’ paths, Fig. 1d employs different
49
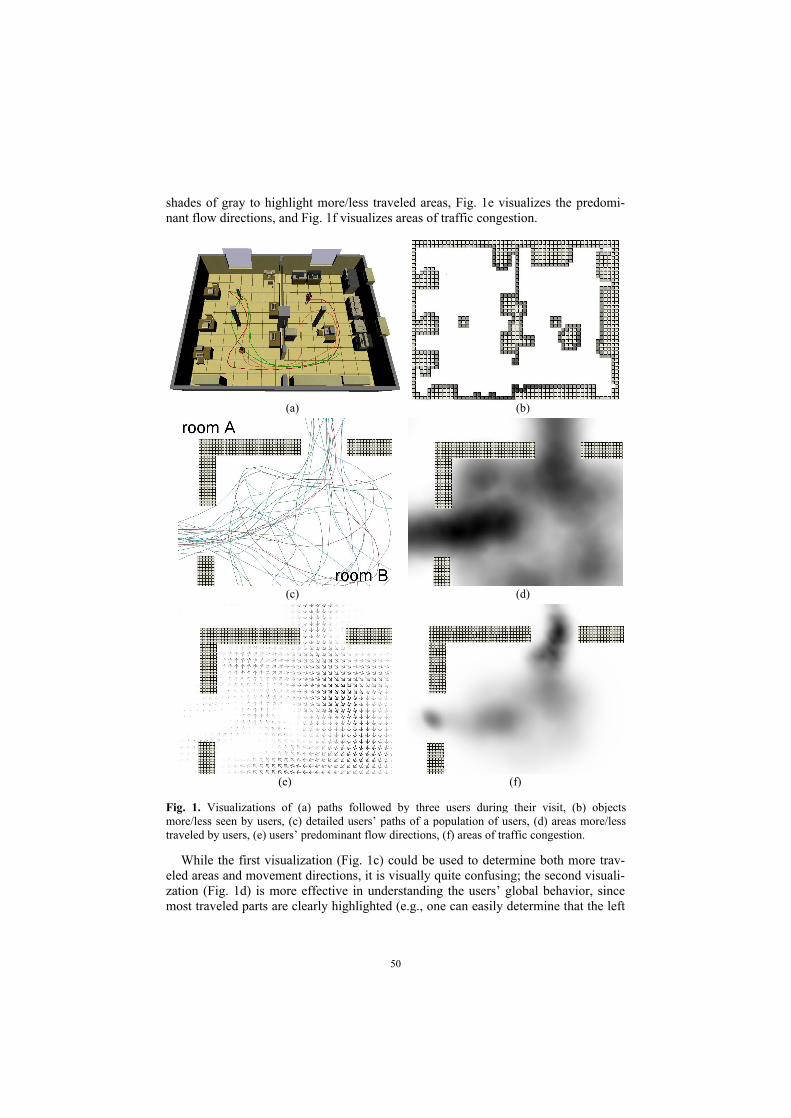
shades of gray to highlight more/less traveled areas, Fig. 1e visualizes the predomi-nant flow directions, and Fig. 1f visualizes areas of traffic congestion.
(a) (b)
(c) (d)
(e) (f)
Fig. 1. Visualizations of (a) paths followed by three users during their visit, (b) objects more/less seen by users, (c) detailed users’ paths of a population of users, (d) areas more/less traveled by users, (e) users’ predominant flow directions, (f) areas of traffic congestion.
While the first visualization (Fig. 1c) could be used to determine both more trav-eled areas and movement directions, it is visually quite confusing; the second visuali-zation (Fig. 1d) is more effective in understanding the users’ global behavior, since most traveled parts are clearly highlighted (e.g., one can easily determine that the left
50
passage was more traveled than the top one). By visualizing predominant flow direc-tions (Fig. 1e), one can easily discover that users predominantly entered room B through the top passage and visited room B following a clockwise direction, while a predominant direction through the left passage cannot be identified. By processing the same navigational data and considering that they refer to users navigating simultane-ously in the VE, the tool derives the visualization depicted in Fig. 1f. While for the left passage the light-gray areas shows that users traveled the corresponding part of the VE without traffic congestion problems, a serious traffic congestion problem is identified near the top passage. By using also information on more/less traveled areas and predominant flow directions, one can derive that: (i) several users tried to enter room B at the same time through the top passage, and (ii) several users walked through the left passage in opposite directions in different instants (then, without facing traffic congestion problems).
4 Conclusions
This paper presents a tool, called VU-Flow, that is able to automatically record usage data in VEs and then visualize them in formats that help an evaluator to understand the effects of VE design on users’ navigation.
With respect to future goals of this project, we plan to extend VU-Flow for study-ing users’ behavior in real environments. In this context, the Data Acquisition module should be modified to record information on users’ location through localization technologies, e.g., GPS. It must be noted, however, that while in VEs positions and orientations of users can be precisely determined, in real environments localization technologies usually provide partial and/or inaccurate positioning information.
References
1. Paganelli, L., Paternò, F.: Intelligent Analysis of User Interactions with Web Applications. In: Proc. Intelligent User Interfaces (IUI 02), ACM Press, New York (2002) 111-118
2. Cugini, J., Scholtz, J.: VISVIP: 3D visualization of paths through web sites. In: Proc. Data-base and Expert Systems Applications (DEXA 02), IEEE Press (2002) 259-263
3. Hong, J., Landay, J.: Webquilt: A Framework for Capturing and Visualizing the Web Ex-perience. In: Proc. World Wide Web. ACM Press, New York (2001) 717-724
4. Vinson, N. G.: Design Guidelines for Landmarks to Support Navigation in Virtual Envi-ronments. In: Proc. Conference on Human Factors in Computing Systems (CHI 99), ACM Press, New York (1999) 278-284
5. Chittaro, L., Burigat, S.: 3D Location-pointing as a Navigation Aid for Virtual Environ-ments. In: Proc. Advanced Visual Interfaces (AVI 04), ACM Press, New York (2004) 267-274
6. Darken, R. P., Cevik, H.: Map Usage in Virtual Environments: Orientation Issues. In: Proc. IEEE Virtual Reality 99, IEEE Press (1999) 133-140
51
A navigation and examination aid for 3D virtualbuildings
Luca Chittaro, Vijay Kumar Gatla, Subramanian Venkataraman
HCI Lab, Dept. of Math and Computer Science, University of UdineVia delle scienze 206, 33100, Udine, ITALY
chittaro,gatla,[email protected]
Abstract. In this paper, we present the Interactive 3D BreakAway Map(I3BAM) as an extension of the Worlds in Miniature (WIM) that works notonly as a navigation aid specifically aimed at supporting user navigation in vir-tual buildings but also provides a means of examining any floor of a buildingwithout having to necessarily navigate it. The aid provides users with informa-tion about the structure of a building in such a way that route and surveyknowledge may be easily gained.
1 Introduction
In some computer applications, users navigate in virtual environments (VEs) repre-senting buildings; common examples could be virtual museums [5], 3D games wherenavigation is not the main task [7], simulations where users learn routes and buildingstructure so that the knowledge gained may be applied in a real life emergency [1],virtual recreations of complex real buildings where physical structure modificationnecessary to rectify design defects is not feasible, thus creating the need for other so-lutions [2]. In this paper, we present the Interactive 3D BreakAway Map (I3BAM) asan extension of the WIM that works not only as a navigation aid specifically aimed atsupporting user navigation in virtual buildings but also provides a means of examin-ing any floor or a building without having to necessarily navigate it. The aid providesusers with information about the structure of a building in such a way that route andsurvey knowledge may be easily gained.
2 Related Work and Motivations
Several electronic aids have been proposed in the literature to provide navigation sup-port in small and large scale VEs (e.g., [3,5,6,9,10]). Examples might include urbanlandscapes, open ocean environments, abstract data representations and so on. Build-ings are one of the most common types of VEs that users have to deal with.
The I3BAM builds on the concept of the Worlds In Miniature (WIM) presented in[8]. A WIM is a 3D small scale version of the VE, floating in front of the user, as if itwere in her virtual hand. The user’s position and orientation are indicated in it. The
52
I3BAM tries to solve the problems that affect the WIM (e.g., presenting a WIM of anentire building would not be very helpful if there is no means of studying it’s internalstructure) which are explained in [8,9]. The WIM was originally proposed as a loco-motion device but subsequent studies have highlighted that users do not like to use itso [9]. Brooks [10] mentions that users must be able to use the WIM to place theirimmediate surroundings in the context of the overall configuration of the space, so forany moderately large or complex environment the techniques in [8,9] seem disadvan-tageous. These techniques do not provide a means of examining any section of theenvironment through the WIM.
People visiting virtual buildings want to reach a particular location, travel on aparticular route or more generally gain knowledge of the structure of that building.Moreover, navigating within the virtual building may not be the main task and thecognitive resources of the user may be required for other tasks such as object ma-nipulation, observing/listening to a presentation and so on.
We propose I3BAM as a navigation aid that can be usefully applied both in train-ing situations [1,4] which have shown that a route through a real building can belearned by rehearsing the route in a VE model of that building and in applicationswhere navigation is not the main task (e.g., Virtual shopping malls, 3D games [7] orvirtual museums [5]). The use of our navigation aid could make navigation easier sothat the user can concentrate on the other tasks.
3 The Interactive 3D BreakAway Map
The I3BAM is a miniature model of the building in which the user is navigating (withadditional features). It is a view centric object, constantly floating in front of the user.The size of the I3BAM is computed before it appears on the screen, but it can bemodified as necessary by the user to avoid occlusion. The I3BAM can also be posi-tioned within a restricted area (inside the viewport) and it can be flipped to providethe best possible view of the building to the user (Fig 1).
The overall idea is to provide the user not only with knowledge about the externaland overall structure of a building (how many floors it has, how many exits it has,…)but also the internal structure of the building (how the floors are connected by stair-cases, where these staircases are located, structural details of each floor,…). The im-portance of presenting both the internal and external structure of a building to a userhas been stressed in recent work in building structure visualization [7].
The I3BAM provides the user two views simultaneously: i) a view of a certain po-sition (including her own or that of a selected target) on some floor of the building inthe exocentric view - the “local” view (Fig 5) ii) a view of the same position in theentire building in the exocentric view - the “global” view (Fig 5).
The I3BAM can be generated easily for any building model provided it is built byfollowing certain guidelines. The building geometry must be hierarchically structured.Each floor and all its related geometry must be in one grouping node. Further, allfloors must be then placed into another top level grouping node, which represents thebuilding itself (The current implementation of the I3BAM is in VRML, although theapproach is not specifically restricted to VRML).
53

This allows changes like transparency or a translation to be applied to a floor as awhole. For instance, letting the user see through multiple floors can be achieved viause of transparency (Fig 5). A translation applied to the geometry of a floor can beused to slide it out and display the floor below it (Fig 2,3).
Fig. 1. The I3BAM interface with the related controls.
The I3BAM provides the following views:
Examine: In this view, the user can interact with the I3BAM via mouse clicks. Allfloors are visualized. Each floor can be made to slide out (horizontally) with a clickon its geometry. This provides the user with the ability to view the structure of anyfloor of the building without having to navigate that floor. The user can also get avery clear view of how the floors are organized to form the complete structure of thebuilding (Fig 2,3).
Fig. 2. Examine View (before click on floor 3). Fig. 3. Examine View (after click on floor 3).
For example: being on floor 1(enclosed with the white rectangular outline in Fig 2,3),the user is able to examine the structure of floors 2 and 3 without navigating them, the
54
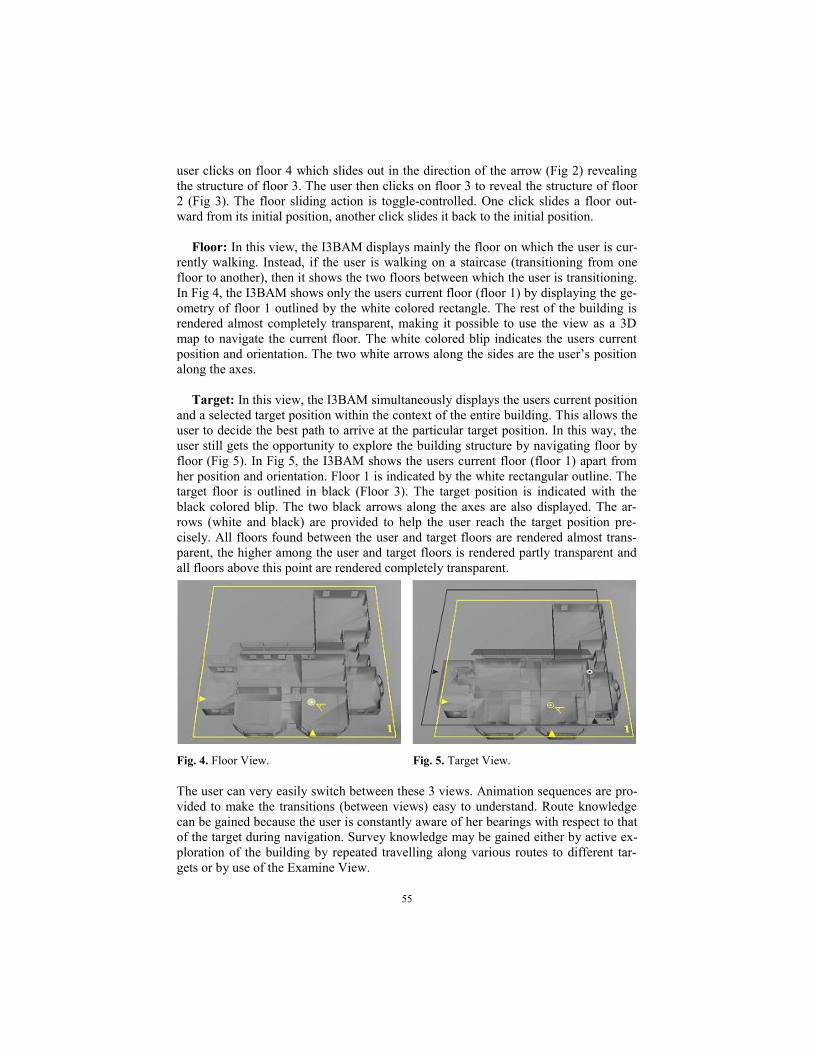
user clicks on floor 4 which slides out in the direction of the arrow (Fig 2) revealingthe structure of floor 3. The user then clicks on floor 3 to reveal the structure of floor2 (Fig 3). The floor sliding action is toggle-controlled. One click slides a floor out-ward from its initial position, another click slides it back to the initial position.
Floor: In this view, the I3BAM displays mainly the floor on which the user is cur-rently walking. Instead, if the user is walking on a staircase (transitioning from onefloor to another), then it shows the two floors between which the user is transitioning.In Fig 4, the I3BAM shows only the users current floor (floor 1) by displaying the ge-ometry of floor 1 outlined by the white colored rectangle. The rest of the building isrendered almost completely transparent, making it possible to use the view as a 3Dmap to navigate the current floor. The white colored blip indicates the users currentposition and orientation. The two white arrows along the sides are the user’s positionalong the axes.
Target: In this view, the I3BAM simultaneously displays the users current positionand a selected target position within the context of the entire building. This allows theuser to decide the best path to arrive at the particular target position. In this way, theuser still gets the opportunity to explore the building structure by navigating floor byfloor (Fig 5). In Fig 5, the I3BAM shows the users current floor (floor 1) apart fromher position and orientation. Floor 1 is indicated by the white rectangular outline. Thetarget floor is outlined in black (Floor 3). The target position is indicated with theblack colored blip. The two black arrows along the axes are also displayed. The ar-rows (white and black) are provided to help the user reach the target position pre-cisely. All floors found between the user and target floors are rendered almost trans-parent, the higher among the user and target floors is rendered partly transparent andall floors above this point are rendered completely transparent.
Fig. 4. Floor View. Fig. 5. Target View.
The user can very easily switch between these 3 views. Animation sequences are pro-vided to make the transitions (between views) easy to understand. Route knowledgecan be gained because the user is constantly aware of her bearings with respect to thatof the target during navigation. Survey knowledge may be gained either by active ex-ploration of the building by repeated travelling along various routes to different tar-gets or by use of the Examine View.
55

4 Conclusions and Future Work
The I3BAM attempts to overcome the shortcomings of the WIM while easily sup-porting user navigation in a virtual building. However, proper user evaluation isneeded to assess improvements in effectiveness. We are planning to use the I3BAM toconduct a training transfer evaluation study at our university building in the immedi-ate future. We also plan to integrate a path planning algorithm to enhance its func-tionality. Additionally we are working on the development of tools to help users applythe I3BAM to previously created building models.
References
[1] Bliss, J.P., Tidwell, P.D, Guest, M. The effectiveness of virtual reality for admin-istering spatial navigation training to firefighters. Presence: Teleoperators and VirtualEnvironments 6, 1, pp.73-86, 1997.[2] Kalkusch, M., Lidy, T., Knapp, M., Reitmayr, G.,Kaufmann, H.,Schmalstieg, D.Structured visual markers for indoor pathfinding. Proc. of 1st IEEE InternationalAugmented Reality Toolkit Workshop, IEEE Press, 2002.[3] LaViola Jr., J., Feliz, D., Keefe, D., Zeleznik, R. Hands free multi-scale navigationin virtual environments. Proc. of 2001 symposium on Interactive 3D Graphics, ACMPress, New York, pp.9-15, 2001.[4] Witmer, B., Bailey, J., Knerr, B. Virtual spaces and real world places : transfer ofroute knowledge. International Journal Of Human Computer Studies 45, pp.413-428,1996.[5] Chittaro, L., Ieronutti, L., Ranon, R. Navigating 3D Virtual Environments by fol-lowing embodied agents: a proposal and its informal evaluation on a virtual museumapplication, Psychnology Journal (Special issue on Human-Computer Interaction)2(1), pp.24-42 , 2004.[6] Ruddle, R.A., Payne, S.J., Jones, D.M. The effects of maps on navigation andsearch strategies in very-large-scale virtual environments. Journal Of ExperimentalPsychology: Applied 5, pp.54-75, 1999.[7] Niederauer, C., Houston, M., Agrawala, M., Humphreys, G. Non-invasive inter-active visualization of dynamic architectural environments. Proc. of the 2003 Sympo-sium on Interactive 3D Graphics, ACM Press, New York, pp.55-58, 2003.[8] Stoakley, R., Conway, M., Pausch, R. Virtual reality on a WIM: Interactive worldsin miniature. Proc. of CHI95, ACM Press, New York, pp.265-272, 1995.[9] Pausch, R., Burnette, T., Brockway, D., Weiblen, M.E. Navigation and Locomo-tion in virtual worlds via flight into hand held miniatures, ACM Press, New York,pp.399-400, 1995.[10] Brooks, A. Aids for training real-world spatial knowledge using virtual environ-ments. The university of Rochester press in association with the Link Foundation (3),2003.[11] Murphy, M. “Home 07”, (Public Domain) Building Model, www.pacranch.com
56
Applications: tourism and mobile systems _____________________________________________________________________

Exploiting Problem Solving Techniques to Support Web Users in Complex Tasks
Anna Goy and Diego Magro
Dipartimento di Informatica, Università di Torino, C. Svizzera 185, 10149 Torino, Italy
goy, [email protected]
Abstract. The large number of non-expert users of Web-based systems need an intelligent and flexible support, even in complex tasks, and we think that prob-lem solving techniques could be exploited to face this challenge. However, us-ers should not be exposed to the complexity of the implementation of the rea-soning mechanisms. In this paper, we present STAR, a Web-based system that exploits the configuration technology in order to support a tourist in organizing a personalized agenda for a tour in a city. We describe the overall architecture, focusing on the mechanisms that enable the system to hide the complexity of the underlying technology and to provide users with a user-friendly interaction.
1 Introduction
People surfing the Web require more and more an active and “intelligent” support, even in complex tasks (e.g., financial or medical advice, leasure and entertainment offers). Moreover, the large number of people interacting with the Web includes a lot of non-expert users, who need an intelligent and flexible support, coupled with a highly interactive user-friendly user interface. Finally, many current offers on the Web apply a “one-fits-all” approach (e.g. pre-packed travel solutions provided by on-line tour operators) which do not fulfill the requirements of users having different goals and looking for personalized solutions. In particular, tourist Web portals cur-rently present in the Internet make the access to tourist information and services much easier, but lack actual problem solving capabilities, that would significantly improve their usefulness for the users. However, the exploitation of advanced problem solving techniques in order to support the user in complex tasks, coupled with the fact that such a support should be provided to non-expert users, poses another important chal-lenge: the complexity of the technology must be hidden and the user interaction must be as natural as possible.
In the following Section we present STAR (Smart Tourist Agenda Recommender), a Web-based system which exploits a configuration engine to support the user in organizing a personalized tour in a given area, and we describe how it faces this chal-lenge. Then, in Section 3 we discuss related work and some possible improvements.
59
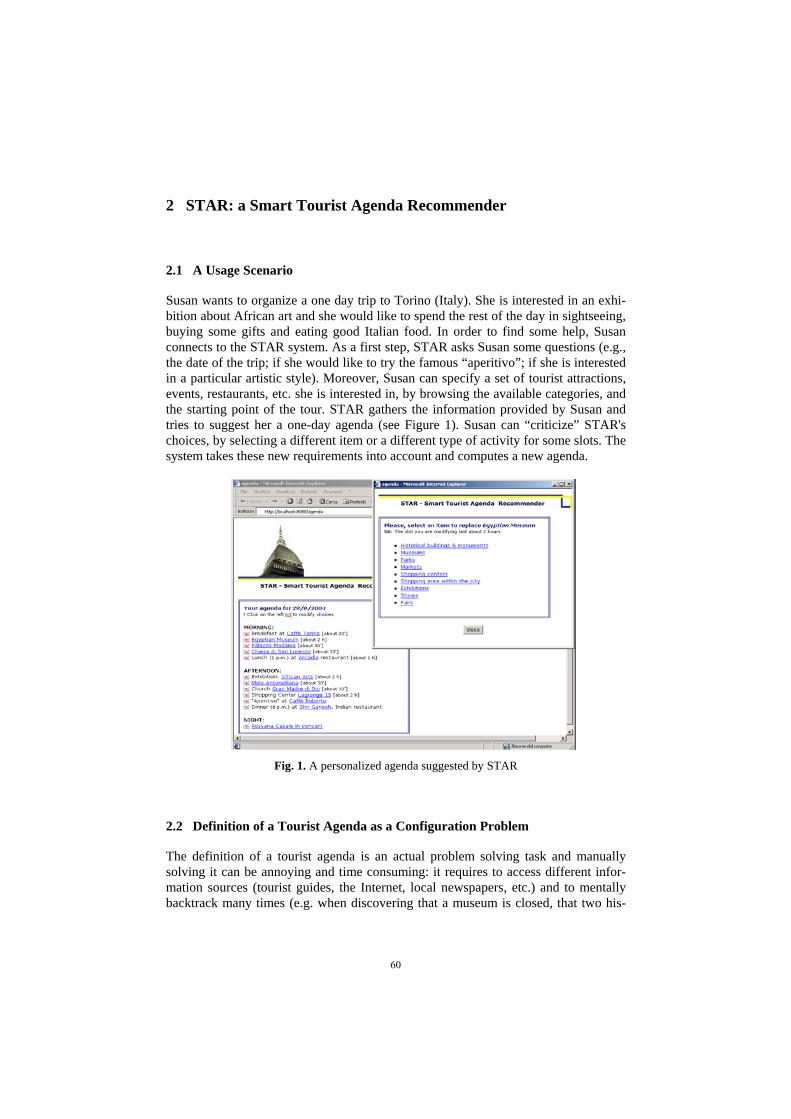
2 STAR: a Smart Tourist Agenda Recommender
2.1 A Usage Scenario
Susan wants to organize a one day trip to Torino (Italy). She is interested in an exhi-bition about African art and she would like to spend the rest of the day in sightseeing, buying some gifts and eating good Italian food. In order to find some help, Susan connects to the STAR system. As a first step, STAR asks Susan some questions (e.g., the date of the trip; if she would like to try the famous “aperitivo”; if she is interested in a particular artistic style). Moreover, Susan can specify a set of tourist attractions, events, restaurants, etc. she is interested in, by browsing the available categories, and the starting point of the tour. STAR gathers the information provided by Susan and tries to suggest her a one-day agenda (see Figure 1). Susan can “criticize” STAR's choices, by selecting a different item or a different type of activity for some slots. The system takes these new requirements into account and computes a new agenda.
Fig. 1. A personalized agenda suggested by STAR
2.2 Definition of a Tourist Agenda as a Configuration Problem
The definition of a tourist agenda is an actual problem solving task and manually solving it can be annoying and time consuming: it requires to access different infor-mation sources (tourist guides, the Internet, local newspapers, etc.) and to mentally backtrack many times (e.g. when discovering that a museum is closed, that two his-
60
torical buildings are too far from each other to be visited in the same morning). We think that this task can be automated by defining it as a configuration problem. Intui-tively, a configuration problem is the task of assembling a (sub)set of pre-defined components in order to build a complex entity that meets a set of requirements. Usu-ally, a set of constraints define the valid combinations of components (see [7]).
STAR exploits a configuration engine, based on the FPC framework (see [4]), to help tourists in defining their agenda. STAR’s reasoning mechanisms are based on a quite intuitive declarative representation of a generic agenda as a complex entity in which tourist items (e.g. buildings, restaurants) are the basic components and denote the corresponding activities (e.g. visiting a building, having lunch in a restaurant). The set of activities in a tourist agenda have to satisfy various constraints, that are encoded as FPC constraints: time constraints, taking into account the duration of the activities and the time actually available during the day; the daily opening hours and the actual tourist attractions availability in particular days; the distance between the physical locations in which the activities take place.
Using a configuration engine to support the user in a complex task such as defin-ing her tourist agenda imposes to system’s designer the need of making the techno-logical complexity totally transparent to the user, who should not be aware of the actual inference mechanisms behind the service. For this reason, we claim that an intermediation is needed, in order to fill the gap between the implementation-oriented view of the underlying configuration engine (in which the requirements are viewed as formal FPC constraints) and the user-oriented view (in which her requirements are viewed as characteristics of the activities planned in the agenda). In our architecture such a role is played by the Frontend Manager and the CP Generator modules.
2.3 System’s Architecture
STAR's architecture (shown in Figure 2), is composed by three main parts: the Frontend, the Backend and the Knowledge Base. The Backend includes: The Backend Manager (BE Mgr), which handles the interaction with the Frontend
and coordinates the activities of the others two Backend modules; The Configuration Problem Generator (CP Gen), which translates the user’s re-
quirements into a set of constraints (representing the “configuration problem”); The Configuration Engine (Conf Eng), which search a solution, i.e. computes an
agenda, satisfying the constraints representing user's requirements. The Knowledge Base represents the model of a generic agenda. It consists of three parts: (i) The Partonomy expresses the compositional knowledge, i.e. a daily agenda is modeled as a configurable object composed of a set of time slots (e.g. morning, afternoon and night). Since each time slot may be filled by different activities, it is modeled as a configurable object too. The Partonomy describes the relations between each configurable object and its parts, stating which time slots an agenda is parti-tioned in, and which activities may occur in each time slot. (ii) The Taxonomy de-scribes the entities involved in the tourist domain (buildings, restaurants, etc.). Each entity is described by a set of features (e.g., name, location, etc.) and the entities are grouped into classes, organized into a hierarchy. (iii) The Constraints restrict the set
61
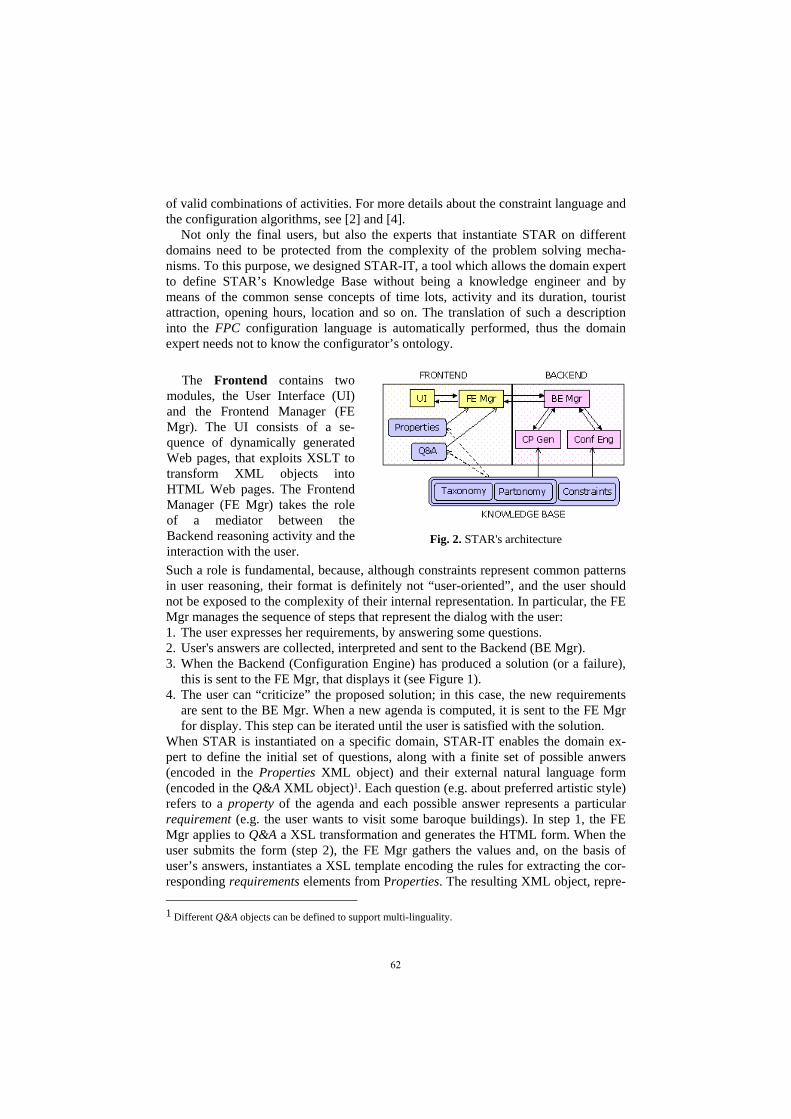
of valid combinations of activities. For more details about the constraint language and the configuration algorithms, see [2] and [4].
Not only the final users, but also the experts that instantiate STAR on different domains need to be protected from the complexity of the problem solving mecha-nisms. To this purpose, we designed STAR-IT, a tool which allows the domain expert to define STAR’s Knowledge Base without being a knowledge engineer and by means of the common sense concepts of time lots, activity and its duration, tourist attraction, opening hours, location and so on. The translation of such a description into the FPC configuration language is automatically performed, thus the domain expert needs not to know the configurator’s ontology.
Fig. 2. STAR's architecture
Such a role is fundamental, because, although constraints represent common patterns in user reasoning, their format is definitely not “user-oriented”, and the user should not be exposed to the complexity of their internal representation. In particular, the FE Mgr manages the sequence of steps that represent the dialog with the user: 1. The user expresses her requirements, by answering some questions. 2. User's answers are collected, interpreted and sent to the Backend (BE Mgr). 3. When the Backend (Configuration Engine) has produced a solution (or a failure),
this is sent to the FE Mgr, that displays it (see Figure 1). 4. The user can “criticize” the proposed solution; in this case, the new requirements
are sent to the BE Mgr. When a new agenda is computed, it is sent to the FE Mgr for display. This step can be iterated until the user is satisfied with the solution.
When STAR is instantiated on a specific domain, STAR-IT enables the domain ex-pert to define the initial set of questions, along with a finite set of possible anwers (encoded in the Properties XML object) and their external natural language form (encoded in the Q&A XML object)1. Each question (e.g. about preferred artistic style) refers to a property of the agenda and each possible answer represents a particular requirement (e.g. the user wants to visit some baroque buildings). In step 1, the FE Mgr applies to Q&A a XSL transformation and generates the HTML form. When the user submits the form (step 2), the FE Mgr gathers the values and, on the basis of user’s answers, instantiates a XSL template encoding the rules for extracting the cor-responding requirements elements from Properties. The resulting XML object, repre- 1 Different Q&A objects can be defined to support multi-linguality.
The Frontend contains two modules, the User Interface (UI) and the Frontend Manager (FE Mgr). The UI consists of a se-quence of dynamically generated Web pages, that exploits XSLT to transform XML objects into HTML Web pages. The Frontend Manager (FE Mgr) takes the role of a mediator between the Backend reasoning activity and the interaction with the user.
62
senting the user's requirements, is sent to the CP Generator in order to be traslated into the corresponding FPC constraints for the Configuration Engine.
The internal representation of a solution (exploited in steps 3 and 4) is based on the same language: we do not describe it here for space reasons.
3 Discussion of Related and Future Work
In the travel and tourist domain different systems have been implemented to sup-port the users to plan long trips, involving flights selection, hotel reservation and so on (e.g. [9], [3]). With respect to these systems, STAR has a different goal, i.e. it aims at supporting the tourist in profitably spending her time in a restrict area. Further-more, differently from travel bags in [6], STAR’s task requires problem solving ca-pabilities. Many recent projects focus their attention on providing a dynamic, context-aware support to the user during the tour (e.g. [1]; [8]; [5]). These projects focus their attention on mobility aspects by supporting the user mainly during the tour itself, but the organization of a coherent agenda is totally left to the user. Thus, we claim that STAR could be viewed as complementary with respect to these systems.
The prototype, based on STAR’s architecture, supporting the organization of tours in Torino, is currently under development. Since user evaluation is very important for this kind of systems, we plan to test it, as soon as the implementation is complete, in order to get feedback both on the configuration algorithms and on the interaction with the user. Various other aspects should be taken into account. Among them, failure handling and inclusion of a User Model which could provide input to the FE Mgr.
References
1. Cheverst, K., Davies, N., Mitchell, K., Friday, A. and Efstration, C.: Developing a context-aware electronic tourist guide: some issues and experiences. Proc. of CHI 2000: Human factors in computing systems (2000) 17-24
2. Goy, A. and Magro, D.: STAR: a Smart Tourist Agenda Recommender. Proc. Configuration Workshop at ECAI 2004, Valencia, Spain (2004)
3. Knoblock, C.: Building Software Agents for Planning, Monitoring, and Optimizing Travel. Proc. of ENTER 2004 (2004)
4. Magro, D. and Torasso, P.: Decomposition Strategies for Configuration Problems. AIEDAM, Special Issue on Configuration, 17(1) (2003) 51-73
5. Malaka, R. and Zipf, A.: DEEP MAP - Challenging IT research in the framework of a tourist information system. Proc. of ENTER 2000 (2000) 15-27
6. Ricci, F., Arslan, B., Mirzadeh, N., Venturini, A.: ITR: a Case-Based Travel Advisory Sys-tem. Proc. of ECCBR 2002 (2002) 613-627
7. Sabin, D. and Weigel, R.: Product Configuration Frameworks – a Survey. IEEE Intelligent Systems, July/August 1998 (1998) 42-49
8. Schmidt-Belz, B., Nick, A., Poslad, S. and Zipf, A.: Personalized and Location-based Mo-bile Tourism Services. Proc. of Mobile-HCI (2002)
9. Torrens, M., Faltings, B. and Pu, P.: SmartClients: Constraint satisfaction as a Paradigm for Scaleable Intelligent Information Systems. Int. Journal of Constraints, 7(1) (2002) 49-69
63
Exploiting Location-Aware 3D Visualizationsto Present Tourist Information on a PDA
Stefano Burigat and Luca Chittaro
HCI Lab, University of UdineVia delle Scienze 206, 33100, Udine, Italyburigat, [email protected]
Abstract. In this paper, we present LAMP3D, a system for the location-aware presentation of 3D content on PDAs. We explore the application ofLAMP3D in tourist mobile guides: the system is used to provide touristswith a 3D visualization of the environment they are exploring, synchro-nized with the physical world through the use of GPS data; tourists caneasily obtain information on the objects they see in the real world bydirectly selecting them in the 3D world. We also provide observationsobtained from the informal user testing we carried out.
1 Introduction
The recent appearance of powerful and feature-rich PDAs on the market canmake it easier for the research community to investigate the use of 3D graphicsto interact in new ways with mobile devices. Tourism is an application areathat could benefit from the availability of 3D content on mobile devices. Inrecent years, indeed, there has been a growing interest toward the development ofmobile tourist guides [1], applications that provide users with useful services (e.g.,navigation support, information delivery, ...) on lightweight portable devices.While these guides usually rely on graphical representations such as 2D maps,the use of 3D representations of the environment may be a more intuitive andeffective way to provide information on the explored area.
In this paper, we present LAMP3D (Location-Aware Mobile Presentationof 3D content), a system for the location-aware presentation of 3D content onPDAs. We explore the application of LAMP3D in mobile tourist guides: thesystem is used to provide tourists with a 3D visualization of the environmentthey are exploring, synchronized with the physical world through the analysis ofGPS data; tourists can easily obtain information on the objects they see in thereal world by directly pointing at them in the 3D world.
2 Related Work
Mobile guides have been progressively refined and improved since the first pi-oneering prototypes, developed in the Cyberguide [2] and GUIDE [3] projects.Current mobile guides exploit localization techniques such as GPS to provide
64
the user with useful location-aware services (e.g., navigation support, ...) anduse 2D maps to display the area where the user is located. Recently, some at-tempts have been made at exploring 3D graphics for mobile guides. Rakkolainenand Vainio [4] have proposed a system that combines a 2D map with the 3Drepresentation of an area, studying the effects of 3D graphics on navigation andwayfinding in a urban environment. They found that 3D models help users torecognize landmarks (i.e., distinctive features of an environment that can beused as reference points during navigation) and find routes in cities more eas-ily than traditional 2D maps. Unfortunately, the prototype was implementedon a laptop computer, not a PDA. 3D city models for route guidance have beentested also by Kulju and Kaasinen [5] who obtained similar results but highlight-ed the need for detailed modeling of buildings. Unfortunately, their prototypeuses only predefined animations and sequences of pictures, not interactive 3Dworlds. Moreover, both projects focused only on navigation support and no in-formation delivery service about points of interest (POIs) was provided. TheTellMarisGuide system [6] supports tourists when they are visiting harbors byvisualizing 3D maps of the environment along with more classical 2D maps: the3D maps support navigation in a city and route finding to POIs such as cityattractions or restaurants. Due to limitations in the mobile clients used, only alimited number of buildings is realistically represented by TellMarisGuide, and,to the best of our knowledge, there is no feature allowing users to directly obtainmore detailed information about the area they are visiting by interacting withthe objects visualized in the 3D representation.
3 The LAMP3D System
In current mobile guides, the effectiveness of using maps to provide certain ser-vices to users depends on the ease with which users can obtain the informationthey need. Automatically providing information to users without direct interac-tion with the guide could be useful when the information is complete and properbut, on the other side, this approach lacks flexibility and can be sometimes tooobtrusive. On the other hand, allowing users to request information when theyneed it is a more flexible but usually more complex approach for the user.
In the LAMP3D system, we combine a 3D representation of the currentlyvisited area with the possibility for the user to request additional information bydirectly selecting the POIs in the representation using a finger or the PDA stylus(Fig. 1). The available information about a selected POI is then provided in aseparate window. This solution aims at making it easier for the user to obtainthe desired information about a POI. Since a tourist is usually interested in thePOIs she is looking at, while information on other objects becomes more relevantonly later, the 3D representation provided by LAMP3D is location-aware, beingsynchronized with the physical world through the analysis of GPS data. In thisway, our system employs a natural filtering criteria based on proximity makingthe information about the closest POIs more easily accessible to the user.
65
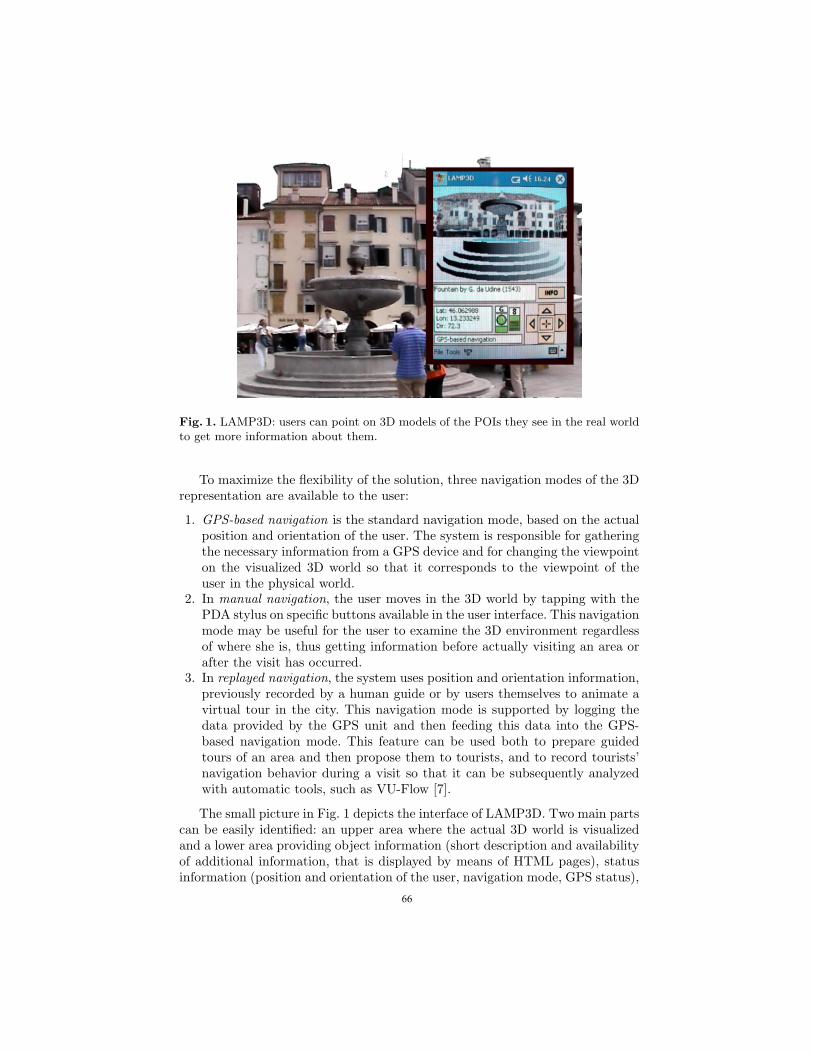
Fig. 1. LAMP3D: users can point on 3D models of the POIs they see in the real worldto get more information about them.
To maximize the flexibility of the solution, three navigation modes of the 3Drepresentation are available to the user:
1. GPS-based navigation is the standard navigation mode, based on the actualposition and orientation of the user. The system is responsible for gatheringthe necessary information from a GPS device and for changing the viewpointon the visualized 3D world so that it corresponds to the viewpoint of theuser in the physical world.
2. In manual navigation, the user moves in the 3D world by tapping with thePDA stylus on specific buttons available in the user interface. This navigationmode may be useful for the user to examine the 3D environment regardlessof where she is, thus getting information before actually visiting an area orafter the visit has occurred.
3. In replayed navigation, the system uses position and orientation information,previously recorded by a human guide or by users themselves to animate avirtual tour in the city. This navigation mode is supported by logging thedata provided by the GPS unit and then feeding this data into the GPS-based navigation mode. This feature can be used both to prepare guidedtours of an area and then propose them to tourists, and to record tourists’navigation behavior during a visit so that it can be subsequently analyzedwith automatic tools, such as VU-Flow [7].
The small picture in Fig. 1 depicts the interface of LAMP3D. Two main partscan be easily identified: an upper area where the actual 3D world is visualizedand a lower area providing object information (short description and availabilityof additional information, that is displayed by means of HTML pages), statusinformation (position and orientation of the user, navigation mode, GPS status),
66
buttons for manually navigating the 3D representation, and a menu for settingthe system.
4 LAMP3D Evaluation
To obtain information on the usefulness and usability of LAMP3D and, moregenerally, the use of 3D graphics on mobile scenarios, we informally tested thesystem in the field in a square of the city of Udine using a 400MHz PocketPC.The test was carried out on a limited group of users, thus providing only somepreliminary information. Users were free to move in the square and use the PDAstylus to tap on their POIs in the synchronized 3D world and obtain informationon them.
In general, users found the system easy to use because of the minimal effortneeded to interact with it in GPS-based navigation mode. Moreover, users hadno difficulty matching objects in the physical world with the 3D representation.While the comments of the users about the combination of 3D graphics andthe direct interaction with objects to get information were positive, some issuesemerged during the use of the system. The occasional low accuracy of the posi-tioning, due to poor precision of the GPS data, led sometimes to partial lack ofconsistency between the visualized 3D representation and the actual viewpointof the user in the physical world (however, users proved to be able to compen-sate for these inaccuracies). A related issue concerned the viewpoint: when theuser is moving, her current orientation can be obtained from the GPS data butwhen the user keeps still, estimating orientation can be more difficult, if not im-possible. To improve orientation accuracy, the best solution would be to employan electronic compass, even if this would increase weight and size of the mobiledevice (because current compact GPS units for PocketPC do not include anelectronic compass). With respect to the 3D representation, the frame rate (andthe users’ perception of smoothness of 3D animation) was heavily influenced bythe time interval between subsequent GPS position data. Indeed, manual nav-igation was smoother than GPS-based navigation but the frame rate of bothwas anyway much lower than desktop computers, and usually not higher than4-5fps. (A subsequent pilot test with a 624MHz PocketPC led to a much betterperformance of 7-8fps). Nevertheless, users found the graphic quality sufficientbut they pointed out some problems: when the user is near a building, the lowresolution of the textures becomes evident; it is difficult to easily examine a tallobject when the user is too close to it (because the system does not change thevertical orientation of the viewpoint); there is no visual indication about whichobjects have additional information associated (the user interface gives feedbackto the user only after selecting an object).
5 Conclusions and Future Work
From the experience with the system described in this paper, using 3D in mobileguides seems to be a promising direction. Having the possibility to actually see in
67
a mobile device what one is looking at in the physical world and to easily requestinformation on POIs by pointing at them are features which users find useful andnatural to use. Unfortunately, there are problems to be faced. Computationallimitations of current mobile devices do not allow for a sophisticated use of 3Dgraphics and a tradeoff must be reached between performance and quality of therepresentation. Moreover, the precision of the positional data must be improvedto provide a sufficient level of navigation assistance to users by means of 3Drepresentations. At the moment, we feel that the best solution for a mobile touristguide would be to integrate traditional procedures for navigation assistance (e.g.,2D maps) with very specific uses of 3D graphics (such as allowing users toexamine objects and obtaining information on them as we did in our system).We are currently improving the LAMP3D system by adding new features andimproving efficiency. We also aim at identifying areas (besides tourist guides)where the use of location-aware, mobile 3D graphics could be valuable. Indeed,the approach we propose could be applied to other domains as well (e.g., urbanplanning, resource management, emergency response, ...), where an interactivelocation-aware 3D visualization of the environment could be useful.
6 Acknowledgments
The work reported in this paper has been partially supported by the Italian Min-istry of Education, University and Research (MIUR) under the project “Web-based Management and Representation of Spatial and Geographical Data”, sub-project “User Interfaces for the Visualization of Geographical Data on MobileDevices”.
References
1. Baus, J., Cheverst, K., Kray, C.: A Survey of Map-based Mobile Guides. In: Map-based mobile services - Theories, Methods, and Implementations, Springer-Verlag(2005) 197–216
2. Abowd, G., Atkeson, C., Hong, J., Long, S., Kooper, R., Pinkerton, M.: Cyberguide:A Mobile Context-Aware Tour Guide. Baltzer/ACM Wireless Networks 3 (1997)421–433
3. Cheverst, K., Davies, N., Mitchell, K., Friday, A.: Experiences of Developing andDeploying a Context-Aware Tourist Guide: The GUIDE Project. In: Proc. MobiCom2000, ACM Press (2000) 20–31
4. Rakkolainen, I., Vainio, T.: A 3D City Info for Mobile Users. Computer & Graphics25 (2001) 619–625
5. Kulju, M., Kaasinen, E.: Route Guidance Using a 3D City Model on a MobileDevice. In: Mobile HCI 2002 Workshop on Mobile Tourism Support. (2002)
6. Laakso, K., Gjesdal, O., Sulebak, J.: Tourist Information and Navigation Support byUsing 3D Maps Displayed on Mobile Devices. In: Proc. Mobile HCI 2003 Workshopon HCI in Mobile Guides. (2003) 34–39
7. Chittaro, L., Ieronutti, L.: A Visual Tool for Tracing Users’ Behavior in VirtualEnvironments. In: Proc. AVI 2004, ACM Press (2004) 40–47
68
An adaptive tourist guide in mobile context*
Federica Cena1,2, Luca Console2, Cristina Gena2, Anna Goy2, Guido Levi1, Sonia Modeo1,2 , Ilaria Torre2
1 CSP Innovazione nelle ICT s.c. a r.l., Torino, Italy cena, levi, [email protected]
2 Dip. di Informatica, Università di Torino, Torino, Italy lconsole, cgena, goy, [email protected]
Abstract. In this paper we present the features of UbiquiTO, an adaptive mo-bile guide which helps tourists, and mobile workers, in organizing their free time. The system provides support adapting its advices to the features of the user, her location, her device and the current context conditions. A relevant as-pect of the adaptation is that the user can use the device she likes, choosing the modality of localization, managing her model.
1 Introduction
The convergence of pervasive computers and communication networks offers new opportunities and challenges for systems designers, which are being addressed in the fields of “pervasive”, “ubiquitous”, and “context-aware” computing. The exponential diffusion of devices such as PDAs, smart phones and new generation cellular phones drives in the same direction, but the opportunity to use and profit from digital services depends on the possibility to adapt such services to the mobile context which may include several aspects: adaptation to the input/output and power limitation of hand-held devices; to low bandwidth and discontinuous connection; to the actual goal and current location of the user. While the adaptation to the former parameters is very often a necessary requirement, the last one represents a real add-on feature to com-mon digital services, enabling the so-called location based services. Finally, one more set of parameters should be taken into account in order to make mobile services really useful and profitable: the specific characteristics and preferences of the users. In fact, in mobile environments, it is very difficult (or even impossible) for a user to browse and search for information/services she needs or she is most interested in: adaptation and personalization strategies can provide a solution to these problems and may allow the system to really become an intelligent personal assistant. Besides, like a personal assistant could become proactive, autonomously providing suggestions and support.
In this paper we describe UbiquiTO, an agent-based system that acts as an expert tourist guide for mobile users, filtering the information and delivering it in the most appropriate way, depending on the device and on the context. Sec. 2 of the paper * We are very grateful to Ilaria Amendola, Andrea Crevola, Valeria Grosso, Monica Perrero
and Andrea Toso.
69
introduces the main goals of the project, Sec. 3 presents some details about the differ-ent forms of adaptation, Sec. 4 presents some related works and sketches future direc-tions.
2 Goals and Usage Scenario
The UbiquiTO project has been developed from the University of Turin in collabora-tion with the CSP research center in order to help the local government in the expan-sion of tourist service, which need to be expanded in prevision of the 2006 Olympic Winter Games. The application is aimed at providing tourist services to heterogene-ous types of visitors, although the first prototype focuses on mobile workers that will come to Turin for the Olympic Games because we assume that they will be better technologically equipped. UbiquiTO aims at providing mobile support to business travelers visiting Turin by offering different types of adaptation: − User: the system maintains a profile of the user, including her interests, prefer-
ences and the history of her previous visits to Turin, and exploits this profile in or-der to tailor its suggestions to the user needs. The user profile can be updated ei-ther explicitly, by the user herself (a “modify your profile” link is available), or by means of automatic learning mechanisms.
− Device: the user interface adapts to different types of devices. The current proto-type is focused on personal computers and PDAs, and we are working for extend-ing the system to other devices, such as smart phones, vehicle on-board interaction systems, and DTT (Digital Terrestrial Television).
− Location: the tourist services are provided according to a location-based strategy, i.e., they depend on the specific area of the town where the user is (or is expected to be) at the time the service is provided.
− Context: the system considers a set of further parameters like the time of the day, the fact that the user is moving and adapts the interaction taking them into account.
Moreover, services are provided in two different ways: (a) explicit request from the user, who asks for a specific support, e.g., to find a hotel or a restaurant, or to get information about events or places of interests; (b) proactive activation: the system itself, in specific situations, depending on the adaptation strategies mentioned above, autonomously provides the user with tourist advices.
3 Adaptation Strategies
UbiquiTO is aimed at offering tourist information about Turin in a personalized way. The system adapts the recommendations and their presentation on the basis of the user model, the device, the localization, and the context. For a more detailed descrip-tion of the architecture see [2]. The current UM is structured in two parts: 1) explicit data: socio-demographic data (age, gender, profession); general interests (music, food, cinema, art); 2) inferred data: psychographic data (propensity to spend, life-style); specific interests (classical/rock/pop music, traditional food, fast food etc). In
70
part 1) socio-demographic data and general interests are represented as feature-value pairs, wherein the values are those ones selected by the user during the registration. While socio-demographic data are represented as alphanumeric values (e.g., age: 45; gender: male; profession: manager, etc), general interests take range between 0-1 (e.g., interest in food: 0.5, interest in music: 1, etc). The UM is initialized with this explicit information provided by the user (she has to fill in a brief registration form providing general information) in order to avoid the well known cold start problem of recommender system. Part 2) represents psychographic data and specific interests, which are inferred by inference rules1.
3.1. Adaptation of Content
UbiquiTO aims to suggest a set of places to visit, restaurants, accommodations and so on. The recommendation module gives a score to each item considering the UM (age, specific interests, propensity to spend) and the user location, and then orders the list of items presented according to the score. In the adaptive version (AV) of the system, the computation of this score takes into account: (i) the user’s interest in the category the item belongs to, provided by the UM; (ii) the proximity of the item to the user position, in case the user exploits a mobile device (e.g., a PDA). Moreover, in the AV, when the user selects an item, the system provides her a description and a list of suggestions (associated items) tailored to her model and to her location. For instance, if a young user who likes going out and drinking chooses a Mexican restaurant, a list of trendy bars for the ‘aperitivo’ (before dinner) and wineries (after dinner) close to the restaurant are suggested. In the non-adaptive version (NVA), the items are ranked only according to their popularity, on the basis of the average number of clicks that each item reached. The adaptation of the content has been evaluated by means of statistical recommendation accuracy metrics (in particular MAE).
3.2. Adaptation of the User Interface
The module in charge of the adaptation of the presentation performs the following actions by exploiting a set of adaptation rules: (i) automatically detects the user’s device; (ii) selects the most appropriate interface on the basis of the device; (iii) tai-lors the presentation to the user preferences; (iv) selects the amount of information to be displayed, according to the screen size of the user’s device; (v) changes font size and background colour according to context conditions (e.g., time of the day, move-ment). For a more detailed description of the user interface design see [2]. For in-stance, when the user selects an item to get more information about it, the pieces of information and the detail level are chosen on the basis of the user’s interest in the category the item belongs to: if the user is very interested in the category, the descrip-tion is more detailed. Moreover, the agent also changes the font size according to the user age and possible vision impairments. Finally, if the device used is a PDA or a smartphone, the agent suggests less items per pages and presents a shorter description 1 The production rules are implemented in JESS (Java Expert System Shell) version 6.1.
71

than in desktop environment (Fig. 1 shows an example of interface adaptation). In order to dynamically produce different user interfaces, the system generates an XML document which represents the content of the interaction. Then, to choose layout and display features, it exploits XSLT and transforms an XML structure into other lan-guages (HTML, XHTML, etc.) depending on the device. The adaptation of the inter-face has been evaluated with real users and the results analyzed by means of both quantitative and qualitative metrics.
Fig. 1. Comparison between desktop and PDA interface
3.3. Localization Strategies
User location is one of the dimensions used to personalize services to the user. The module in charge of localization acts in three ways: 1) non-automatic localization. The user has the possibility to provide her position to the system, in particular, by selecting a POI (Point Of Interest: a tourist attraction immediately recognizable) from a sensitive map or from a list of items. This method has two main reasons: allowing users which are not equipped with Wi-Fi or GPS receiver to achieve the same service, and to require information independent of their current position; 2) wireless LAN. If the user mobile terminal is equipped with a Wi-Fi receiver and enters in wireless modality, her position can be computed on the basis of the signals received from the different access points within the area (see [7]). 3) GPS . In this case the tourist’s device contains a GPS receiver that enables the system to calculate the user position with great accuracy. Independently of the method used, the user position is repre-sented by a pair of coordinates.
2
Given this information, the system retrieves, from the places DB, the coordinates of places to be recommended and calculates the distance between user position and every single place. On the basis of these results, UbiquiTO ranks the places and suggests to the user only the closest ones.
2 In the UbiquiTO prototype, we use TomTom Navigator (www.tomtom.com), SysOnChip
GPS receiver (http://www.sysonchip.co.kr/eng/prod/pro_gps_1.htm) and Navman GPS (http://www.navman.com/land/products/gps4410/index.html).
72

4 Conclusions and future works
In this paper we have presented UbiquiTO, an expert tourist guide for mobile users that adapts the content provided and the interaction to the user interest and physical location, as well as to the devices and context conditions. UbiquiTO combines tech-niques from User Modelling with wireless technologies. Moreover, the integration of different adaptation strategies is the most relevant aspect of the project. Several works (especially in the mobile guides area) are significantly related to the project: Cyber-guide [1], Guide [4], Lol@ [9], Crumpet [8], Real [3], SmartKom [10], Deep Map [6], as a sample of the main ones. For a comparison with those one that are most relevant with the main features of our system see [2]. In addition many aspects are being improved. Besides PC and PDA, different mobile devices are being taken into account (e.g., smart phones, on-board equipments, digital TV sets). In order to auto-matically update the user profiles, learning mechanisms are being studied and imple-mented, and a larger set of services will be included and we want to export UbiquiTO framework to other Italian cities. UbiquiTO services will be linked to the local gov-ernment web site.
References
1. Abowd, D. A., Atkeson, C. G., Hong, J., Long, S., Pinkerton, M.: Cyberguide: A Mobile Context-Aware Tour Guide. Wireless Networks 3(5) (1996) 421-433
2. Amendola, I., Cena, F., Console, L.. Crevola, A., Gena, C., Goy, A., Modeo, S., Perrero, M., Torre, I., Toso, A. UbiquiTO: a Multi-Device Adaptive Guide, in the proceedings of conference “MobileHCI’04”, Sept. 13–16, Glasgow, Scotland (2004) 409-114
3. Baus, J., Kray, C., Kruger, A.: Visualization of route descriptions in a resource-adaptive navigation aid. Cognitive Processing 2(2-3) (2001) 323-345
4. Cheverest, K., Davies, N., Mitchel,l K., Smyth, P.: Providing tailored context-aware infor-mation to city visitors. In Adaptive Hypermedia and Adaptive Web-Based Systems (AH 2000). LNCS Vol. 1892, Springer-Verlag, Berlin Heidelberg New York (2000) 73-85
5. Kray, C., Baus, J.: A survey of mobile guides. Workshop on HCI in mobile guides, 5th Int. Symposium on HCI with Mobile Devices and Services. Udine, Italy (2003)
6. Malaka, R. and Zipf, A.: DEEP MAP - Challenging IT research in the framework of a tourist information system. Information and Communication Technologies in Tourism. Proc. of ENTER 2000, Springer Computer Science, Wien New York (2000) 15-27
7. Marchioro, C.E., Ghittino, A., Ferri, D., Borri, R., Dovis, F.: Wireless Campus project. TERENA Networking Conference 2003. Zagreb, Croatia (2003)
8. Poslad, S., Laamanen, H., Malaka, R., Nick, A., Buckle, P., Zipf, A.: CRUMPET: Creation of User-Friendly Mobile Services Personalised for Tourism. 3G Mobile Communication Technologies. London, UK (2001) 26-29
9. Pospischil, G., Umlauft, M., Michlmayr, E.: Designing LoL@, a Mobile Tourist Guide for UMTS. Inf. Tech. & Tourism 5(3), Cognizant Communication Corporation (2003) 151-164
10. Wahlster W., Reithinger N., Blocher A.: SmartKom: Multimodal Communication with a Life-Like Character. 7th European Conference of Speech Communication and Technology (Eurospeech 2001), Vol. 3, Aalborg, Denmark (2001) 1547-1550
73


Accessibility issues _____________________________________________________________________

Accessibility assessments through heuristic
walkthroughs
Giorgio Brajnik
Dip. di Matematica e InformaticaUniversita di Udine
Italywww.dimi.uniud.it/giorgio
Abstract. Testing accessibility of a web site is still an art. The paperexamines the currently known definitions of accessibility and claims thatlack of appropriate standardization of definitions and testing methodsis one of the reasons explaining why web accessibility is so difficult toachieve.The paper suggests that a method based on heuristic walkthrough mighthelp evaluators in better assessing accessibility.
1 Introduction
In the last couple of years awareness of web accessibility has definitely increased.But knowledge of how to test a web site in order to determine its accessibility isstill an art.
One difficulty is deciding which method to apply and how to adapt methodsthat are used for testing usability. For example, one could employ a conformancetest to known standards (like WCAG 1.0, Section 508), or apply user testing [4]or even use other methods [11; 8; 6]).
A second facet of the problem are the several definitions of accessibility.Sometimes accessibility is defined in terms of effectiveness; now and then it isdefined in terms of usability; but unfortunately there are too often claims thata web site is accessible simply because an automatic accessibility testing toolyielded no error.
The consequence of these methodological problems is that practitioners andregulators are likely to be confused. For example, the current working draft ofan official document to be endorsed by the Italian government provides technicaladvice on how to ensure that a web site is accessible [3]. It suggests cognitivewalkthrough as an analytical method for assessing accessibility, but then it pro-vides 12 general usability principles to be used as in heuristic evaluations; finallyit suggests empirical usability methods that are suboptimal (e.g. subjective as-sessments). Given that even well established methods are not reliable [7], thelikelihood of suboptimal evaluations is very high.
The purpose of this paper is to survey several definitions of accessibility andthen propose a heuristic walkthrough method to fill what I consider to be a gapin the evaluation methods for accessibility assessment.
77

2 Accessibility definitions
The W3C/WAI in Web Content Accessibility Guidelines 1.0 does not give anexplicit definition of accessibility, but it mentions concepts like “graceful trans-formation of the pages despite . . . physical, sensory, and cognitive disabilities,work constraints, and technological barriers; understandable and navigable con-tent; clear and simple language.”. No definition is given either in the currentWCAG 2.0 working draft which says “web content that is perceivable, operable,and understandable by the broadest possible range of users and robust . . . ”.
The Italian accessibility law refers to “ the ability of computer systems . . . todeploy services and information so that they can be exploited, with no discrimi-nation, also by disabled persons . . . ”. In a more detailed document [2] the Ital-ian government mentions information that is exploitable in a way that is userfriendly, simple, efficient, multimodal, effective, satisfactory and compatible withguidelines.
A clear definition of accessibility is given by Slatin and Rush [13, p. 3]:“. . . websites are accessible when individuals with disabilities can access and use them aseffectively as people who don’t have disabilities”.
ISO–16071 explicitly defines accessibility as the “usability of a product, ser-vice, environment or facility by people with the widest range of capabilities”.
Finally, Thatcher et al. [14, p. 8] define the concept of “usable accessibility”in terms of “designing a user interface [of a web site] to be effective, efficient andsatisfying for more people in more situations.”
This quick overview shows that the meaning of accessibility is not unique.Notice how some definitions are based on measurable users’ performance param-eters, like effectiveness, productivity, satisfaction, rather than properties thatcannot be easily detected (e.g. understandability, or operability). Notice alsothat those properties are the ones that characterize usability.
3 Accessibility evaluation methods
Evaluation methods are important as they operationalize the way in which acces-sibility is measured and monitored. Several methods can be adopted, and mostof them derive from usability investigation methods [11; 6; 10; 8; 15; 9].
Conformance tests (called also Standard reviews) produce a list of guidelinesthat are violated. Since the method does not refer to users, tasks, nor scenarios,it cannot be used when usability has to be assessed, and in particular it cannotbe reliably used to rank violations. But ranking of defects is needed wheneverappropriate fixes have to be implemented in order to remove those defects, whichis one frequent reason to assess accessibility.
Heuristic evaluation requires practitioners to possess substantial knowledgeto be able to customize the heuristics to specific situations and users. Thismethod could be used for assessing accessibility (in the sense of usability fordisabled persons) provided that: (i) it refers to principles that address specifi-cally the interaction patterns that occur when disabled users visit web sites (e.g.
78
[8]), and (ii) evaluators are careful enough to consider all possible ways in whichthe interaction may violate every principle. Those principles are usually verygeneral, which puts a substantial effort on the evaluators shoulders.
User testing [12; 5] is probably the most effective method that can be used,but it requires access to a community of disabled persons that are representativeof different disabilities, that are representative of different levels of experience inusing the browser and assistive technology. Evaluators should also know how toconduct an experimental session to avoid common pitfalls [7].
Based on scenarios, heuristic walkthrough [6], because it constrains andguides the evaluator much more than heuristic evaluation, because it requiresless resources than user testing, and because it considers users, tasks, and con-texts, can be adopted more often, more reliably and also when one needs to gobeyond conformance to a standard.
4 An example of heuristic walkthrough for accessibility
The heuristic walkthrough method I propose is based on the concept of accessi-bility barrier, rather than scenario1. More details are given in [1], where a simpletaxonomy of barriers is suggested and a method for assigning them a severitylevel is described.
Based on a set of predefined barriers, evaluators examine each page to deter-mine if any of the barrier is likely to emerge. In the end they produce a list ofproblems, each associated to its severity and possibly the performance attributethat is affected (e.g. effectiveness, productivity, satisfaction, security).
Barriers to be considered are derived by interpretation of relevant guidelinesand principles (in this example barriers refer to WCAG 2.0 guidelines) coupledwith generic scenarios.
These are some examples:
1. Information failures
(a) A blind user using a screen reader that is unable to perceive the informationcontained in a diagram or chart; the cause is no textual description associ-ated to the image with any of the technical means (alt, longdesc, D-link,adjacent text).
(b) A low vision user of a screen magnifier that does not see the image becauselocated out of her field of vision.
(c) . . .
1 An accessibility barrier is any condition that makes it difficult to make progress orto achieve an objective by a disabled person using the web site through specifiedassistive technology. A barrier is described in terms of
– the type of disability,– the type of assistive technology being used,– the activity that is being hindered by the barrier, and– the features of the pages that raise the barrier.
79
2. Operability failures(a) Functional images (e.g. buttons) with no alt that prevent a blind person from
using a screen reader to know what to click. Similarly for Flash buttons.(b) Links with labels that are not informative (e.g. “click here”), that prevent a
low–vision user of a screen reader from selecting the correct link when usingthe link list function. . . .
3. Failures to understand(a) Data tables (like a bus schedule) not being appropriately coded (with TH,
scope, headers) that prevent a blind user of a screen reader from under-standing what is being read as she navigates through the cells.
(b) . . .4. No user control
(a) Missing access keys, that prevent a motor impaired user from quickly andaccurately activating certain links.
(b) Too many links listed in the page, that prevent a low–vision user of a screenmagnifier from quickly and reliably locating the needed one.
(c) . . .
When analyzing a web page it is easy to determine if the barrier applies tosome of the tasks supported by the pages. And if it does, it is easy to determinewhat the consequences with respect to the user activity are. The evaluator cantherefore easily assess the consequences of the barrier, and therefore its severity.
Compared to conformity assessments this method provides explicit sugges-tions to evaluators about which disabilities to consider, which operative scenariosto consider, and which are the possible barriers to look for. Secondly, since thebarriers, the scenarios and the activities refer to the actual web site, they canbe made much more specific than the techniques associated with public generalstandards, like WCAG 2.0.
It is also likely that, given the same barriers, two independent evaluationslead to a similar set of problems on the same web site. This assumption is jus-tified because this method is more constrained than conformance test, heuristicevaluation and user testing.
5 Conclusions
The existence of several incompatible definitions of accessibility, and the lack ofstandard accessibility assessment methods are two causes for the currently lowquality level of web sites in everybody’s daily experience.
Appropriate testing methods need to be formalized and adopted. A heuristicwalkthrough method based on barriers is proposed and claimed to be effectivebecause it can be used by evaluators that lack expertise in usability evaluations.
Future research aims at experimentally determining whether the method isreliable (i.e. it captures actual accessibility defects) and repeatable (i.e. indepen-dent applications lead to similar sets of defects). Another interesting question isto compare effectiveness of this method against other methods (e.g. conformitytesting or user testing).
80
Bibliography
[1] Giorgio Brajnik. Simulazione euristica per la verifica dell’accessibilita.
http://www.dimi.uniud.it/wq/metodo-barriere.html, Feb 2005. Vis-
ited April 2005.
[2] CNIPA. Schema del Regolamento di attuazione della legge Stanca.
www.pubbliaccesso.it/normative/schema_regolamento.htm, 2004. Vis-
ited Jan. 2005.
[3] CNIPA. Studio sulle linee guida recanti i requisiti tecnici e i di-
versi livelli per l’accessibilita e le metodologie tecniche per la ver-
ifica dell’accessibilita (legge 4 del 2004, art. 11 comma a e b).
www.pubbliaccesso.gov.it/biblioteca/documentazione/studio_lineeguida,
Dec 2005. Visited Jan. 2005.
[4] DRC. Formal investigation report: web accessibility. Disability Rights Com-
mission, www.drc-gb.org/publicationsandreports/report.asp, April
2004. Visited Jan. 2005.
[5] J. Dumas and J. Redish. A practical guide to usability testing. Intellect
Ltd., 1999.
[6] W.D. Gray and M.C. Salzman. Damaged merchandise: a review of ex-
periments that compare usability evaluation methods. Human–Computer
Interaction, 13(3):203–261, 1998.
[7] M. Hertzum and N.E. Jacobsen. The evaluator effect: a chilling fact about
usability evaluation methods. Int. Journal of Human–Computer Interac-
tion, 1(4):421–443, 2001.
[8] ITTATC. Evaluating for accessibility. Information
Technology Technical Assistance and Training Center,
www.ittatc.org/technical/access-ucd/evaluate.cfm#standards,
2004. Visited Jan. 2005.
[9] J. Nielsen. Heuristic evaluation. www.useit.com/papers/heuristic, 2002.
Visited Jan. 2005.
[10] Jakob Nielsen. Heuristic evaluation. In J. Nielsen and R.L. Mack, editors,
Usability Inspection Methods. John Wiley and Sons, 1994.
[11] J. Preece, Y. Rogers, and H. Sharp. Interaction design. John Wiley and
Sons, 2002.
[12] Jeffrey Rubin. Handbook of usability testing. Wiley, Technical Communica-
tion Library, 1994.
[13] John Slatin and Sharron Rush. Maximum Accessibility: Making Your Web
Site More Usable for Everyone. Addison-Wesley, 2003.
[14] Jim Thatcher, Cynthia Waddell, Shawn Henry, Sarah Swierenga, Mark Ur-
ban, Michael Burks, Bob Regan, and Paul Bohman. Constructing Accessible
Web Sites. Glasshouse, 2002.
[15] UsabilityNet. Methods table. www.usabilitynet.org/tools/methods.htm,
2003. Visited Jan. 2005.
81
A Comprehensive Approach to Accessibility for eLearning Design
Silvia Gabrielli, Valeria Mirabella, Massimiliano Teso, Tiziana Catarci
Università di Roma “La Sapienza”, Dipartimento di Informatica e Sistemistica, via Salaria 113, 00198 Roma, Italy
gabrielli, mirabell, teso, [email protected]
Abstract. This paper presents a comprehensive approach for supporting acces-sibility during eLearning design: it provides a set of indications and a tool aimed at enabling the creation of contents that, not only are technically accessi-ble by learners with special needs, but also preserve the didactic quality of the learning experience. The approach is based on a no-frills methodology and on a series of guidelines that are expected to ease and steer the authoring of acces-sible eLearning material. Also, to enable a more interactive deployment of our approach, we have designed aLearning, a tool specifically addressing didactical concerns of accessibility during the creation of eLearning contents. In the fol-lowing we sketch the main features of this tool and some future steps for its de-velopment.
1 Introduction
Since specific regulations were put into effect, such as Section 508 of the Rehabilita-tion Act in the United States [1] and Law 9/1/2004 N.4 in Italy [2], a greater com-mitment has been raised among IT vendors and developers towards delivering acces-sible web products and services. However, different organizations adopt accessibility for various and diverse reasons: because it has the potential to create a market oppor-tunity, it tends to be ultimately beneficial to all users, and it involves innovative tech-nology. Although accessibility has often been narrowly associated with special needs of the disabled, in a general sense, accessibility "implies the global requirement for access to information by individuals with different abilities, requirements and prefer-ences, in a variety of contexts of use (…)" [14].
This is of particular relevance for the eLearning field, where large repositories of Learning Objects and resources need to be created, shared, reused to deliver courses that would fit the requirements of different learners, including also students with some kinds of impairment or disability. A particular challenge is to address accessi-bility issues during the authoring of eLearning content. Here more research efforts and tools are currently needed if we want to support the preparation of accessible eLearning material, going beyond technical indications on how to make a web page ‘physically’ accessible by users with special needs, but providing clear indications to authors on how to transform critical contents into didactically effective alternatives
82

for disabled learners. We are currently investigating this design challenge as part of the VICE project [I], where we have first developed a methodological approach to cope with accessibility issues in the eLearning context (Section 2 below) and then moved to design an accessibility tool supporting the deployment of this approach during content preparation. In Section 3 we briefly sketch the current state of ad-vancement of this work, where we rely on HCI prototyping methods for better defin-ing and refining the interface features provided. Section 4 reports our conclusions and some future developments of this work.
2 Methodological Approach
Many recommendations for the design of accessible eLearning contents have recently been delivered by international standard organizations, as well as private educational initiatives worldwide [6][7][8][11]. However, the typical level of abstraction of ac-cessibility indications, as well as their quantity, can make it very hard for educators, who might not have prior expertise on accessibility, to effectively incorporate them into their authoring practices [9]. Also, compliance of a specific web content to guidelines, as it might be assessed by the most commonly used accessibility checkers, like Bobby [3], Lift [4], A-Prompt [5] etc., is not sufficient for eLearning material, since these checkers mainly perform a syntactic assessment of web pages, but say nothing about the adequacy of any equivalent-alternative content created, to enable effective access to this materials by disabled users during learning.
On the way to remove this type of difficulties our work has focused, initially, on developing a methodological approach and a set of eLearning-centred guidelines for accessibility, aimed at steering and simplifying the authoring process of accessible eLearning material; secondly, this work has been transferred into the design of an accessibility tool, enabling a more interactive and straightforward application of the methodology and indications provided, trying also to capitalize most on didactical and domain expertise of authors during the process.
The method developed, that we named a ‘no-frills’ approach [13], is based on prompting authors to remove any content that might be considered as not essential for reaching the objectives of a learning module, especially by learners with some level of impairment or disability. When this step has been performed and all relevant or mandatory content has been identified, the next move consists in checking if this is accessible from a technical point of view (like, an image described to become acces-sible by visually impaired learners) as well as from a didactic point of view (i.e., if the content description provided does not deteriorate, in some way, the overall quality of the learning experience of a disabled learner). Specific guidelines or indications are required to lead authors towards the creation of more effective equivalent-alternative representations of critical types of contents. Among these Learning Resource Types we started by analysing and selecting contents from the IEEE Learning Object Meta-data (LOM) classification scheme [12], that were compliant with the criteria of format independence, such as: diagram, figure, graph and table. From the classification of learning content types provided by the CPB/WGBH National Centre for Accessible Media (NCAM) [11] we also identified and selected multimedia and math-scientific
83

expressions, by following the same criteria. For each of these types of learning re-sources we analysed its impact with respect to the main typologies of impairment-disabilities that may be found in the learners’ population, like visual, hearing, physi-cal, cognitive-language ones. Each relevant match identified was then elaborated in the form of guidelines specifying, in detail, what kinds of equivalent-alternative ver-sions of critical contents could be created by authors, and how these could be devel-oped to become didactically effective for disabled students. The methodology and guidelines provided were evaluated by a formative study we conducted in summer 2004 [10], whose main findings were fed into the design of aLearning prototype.
3 The User-Centred Design of aLearning Prototype
Design of aLearning took place as a collaborative activity that was also informed by several comments and hints provided during the development process by didactical experts and colleagues at our university department. In the design framework we also took into account indications contained into the guidelines for authoring tools deliv-ered by W3C [15].
A main motivation of our work was to develop an accessibility tool for eLearning environments that was intuitive to use even for authors without specific expertise on accessibility and/or that might not have a technical kind of background. The tool was meant to facilitate their creation of more accessible and usable eLearning contents, by making automatic or semiautomatic any technical step of the methodology that would not benefit from human intervention or expertise (such as the identification of critical contents within the eLearning material), but prompting, informing and capitalizing on authors’ knowledge and decision making when addressing the non technical (but didactically relevant) steps of the method (e.g., how to create an effective alternative-equivalent version of critical content).
In the following, we provide an overview of the features implemented in our tool that exemplify this process and highlight differences with other accessibility checkers currently available.
3.1 Overview of aLearning Prototype
Basically, aLearning interface supports authors in: • automatically identifying and marking any critical and inaccessible content
within the eLearning material. Differently from other accessibility tools, it con-siders didactically relevant categories of contents (such as diagrams, figures, graphs, etc.), according to the current state of development of our approach and eLearning accessibility guidelines. As in a learning process what you learn is more important than what you can see, aLearning aims to focus authors’ atten-tion and expertise to address accessibility issues related both to didactic contents presentation (what you see) and to their didactical contribute (what you should learn from them).
84

• Enabling the user to select and start repairing that content (e.g., a graph) by choosing among three alternative modalities: i) directly clicking on the critical content as marked within the course pages, ii) selecting that content from the list of learning resource categories reported on a frame window of the interface, iii) starting a step-by-step repairing procedure for the whole sequence of inaccessible contents identified. These different modalities are expected to provide authors more flexibility on how to complete the repairing process (also in terms of its timescale) and differ from other accessibility tools that mainly enable a file-by-file repairing procedure.
• Explaining to the user why a specific content is inaccessible, prompting the user to classify it as optional or mandatory for the objectives of the course (according to the ‘no-frills’ approach mentioned before), supporting different ways of creat-ing alternative versions of the content if it is mandatory, providing links to more detailed information (eLearning guidelines) on how to create an appropriate al-ternative representation of it (see an example in Fig. 1).
Guidelines and examples provided to authors by aLearning are specifically tailored to didactical contents, they differ or are much more detailed than WCAG 2.0 [6], on which typically rely most tools for web accessibility check and repair. We are currently working at refining and improving, as much as possible, the quality of user-system communication implemented so far, to speed up not only any repairing process performed by the user, but also authors’ acquisition of expertise on accessi-bility by means of use and navigation through aLearning functionalities. The tool is being developed in Java, it will integrate a content management system which receives XML pages as input and transforms them into XHTML.
Fig. 1. Example of aLearning repairing functionalities
85

4 Conclusions and Future Work
We are planning to carry out empirical user studies, involving different authors work-ing on different topics and types of Learning Objects, to evaluate the effectiveness, quality of performance, and user satisfaction during the authoring of accessible eLearning materials supported by our prototype. We will also encourage eLearning authors, within and beyond the VICE community, to comment on our proposal so as to make its design more participatory and empirically grounded. In addition, we are investigating if other accessibility features should be added, like for instance, authors’ specification of accessibility metadata for the materials they have created or modified, or further editing features required by eLearning course development.
We expect that all these future steps will enable us to improve our design proposal in terms of its usability and level of contribution to the accessibility research field. Acknowledgments. This work is supported by the VICE project [Comunità Virtuali per la Formazione, CNR-MIUR, Italy].
References
1. Section 508 of the Rehabilitation Act; see http://www.section508.gov2. Law 9 January 2004, n. 4; http://www.pubbliaccesso.it/normative/legge_20040109_n4.htm3. Bobby, Watchfire Corporation; see http://bobby.watchfire.com/4. LiFT, http://www.usablenet.com/5. A-Prompt, University of Toronto, http://aprompt.snow.utoronto.ca/6. Web Content Accessibility Guidelines 2.0, W3C Recommendations, Working Draft 19
November 2004, http://www.w3.org/TR/WCAG20 7. Advanced Distributed Learning , http://www.adlnet.org/8. IMS Guidelines for Developing Accessible Learning Applications, Version 1.0, White Paper
2002, http://www.imsproject.org/accessibility 9. Bennett, S., Hewitt, J., Kraithman, D., Britton, C.: Making Chalk and Talk Accessible. Proc.
of the ACM Conf. on Universal Usability (2003) 119-125 10. Gabrielli, S., Mirabella, V., Kimani, S., Catarci, T.: Steering the Development of Accessi-
ble e-Learning Content. In Proc. of the 3rd ECEL Conf. (2004) Paris (F) 517-526 11. Freed, G., Rothberg M., Wlodkowski T. (Eds.): Making Educational Software and Web
Sites Accessible. Design Guidelines Including Math and Science Solutions (2003), http://ncam.wgbh.org/cdrom/guideline
12. Hodgins, W. & Duval, E. (Eds.): IEEE LTSC Learning Object Meta-data LOM_1484_12_1_v1_Final_Draft, (2002), http://ltsc.ieee.org/wg12/files/
13. Mirabella, V., Kimani, S., Gabrielli, S., Catarci, T.: Accessible e-Learning Material: A No-Frills Avenue for Didactical Experts, The New Review of Hypermedia and Multimedia, Vol.10 N.2 (Dec. 2004) 1-16
14. Stephanidis, C., Akoumianakis, D., Sfyrakis, M., Paramythis, A.. Universal accessibility in HCI: Process-oriented design guidelines and tool requirements. 4th ERCIM Workshop on "User Interfaces for All", Stockholm, Sweden, 19-21 October (1998)
15. Treviranus, J., McCathieNevile, C., Jacobs, I., Richards, J. (Eds.): Authoring Tool Accessi-bility Guidelines 1.0. W3C Recommendation (2000), http://www.w3.org/TR/ATAG10/
86
Do dynamic text–only web pagesimprove usability for disabled users?
Giorgio Brajnik?, Daniela Cancila, Daniela Nicoli, Mery Pignatelli
Dip. di Matematica e InformaticaUniversit di Udine
www.dimi.uniud.it/giorgio
Abstract. Although the potential benefits of text transcoders are mul-tifaceted, at the moment their impact on disabled web users is not clear.
This paper describes an experiment aimed at evaluating usability of webpages processed by a text transcoder and used by disabled persons. Re-sults based on subjective and objective data show how usability changes.
1 Introduction
Transcoders are proxy–like systems that respond to requests sent by the user’sbrowsers; they relay these requests to an ordinary web server, collect the re-quested pages, transform and finally return transformed pages to the browser. Inparticular, they strip images, multimedia objects, JavaScript code from the page,and change its layout. Text transcoders have been promoted as tools that can bedeployed to automatically yield text–only version of web pages (hence the web-master does not have to cope with the burden of maintaining redundant copies),and they can produce pages that are more accessible than the original ones.While not being ruled out by accessibility guidelines (e.g. WCAG 1.0; Section508) text transcoders have renewed discussions on the role and appropriatenessof text–only pages, seen by many as second–level pages for second–level users.As a consequence, the adoption of text transcoders is often discouraged (e.g. thecurrent draft of the accessibility requirements issued by the Italian government[5] explicitly rules out text–only pages, regardless whether they are dynamic ornot). However, so far, limited studies exist on usability of text transcoders.
Text transcoders are a technically viable solution when translation of a webuser interface is needed. For example, normal graphical pages can be transformedso that the visual layout, and possibly the interaction structure, can better adaptto specific devices used by visitors (e.g. using screen readers or mobile devices).This happens because user bandwidth [10] can be increased by removing, re-arranging or modifying the page contents or the interaction structure (e.g. bymodifying the sequence of steps, decisions and actual actions that are neededto accomplish a goal). In fact a text–only version of the web site can be an? Scientific advisor for the manufacturer of the transcoder used in the study described
in this paper.
87
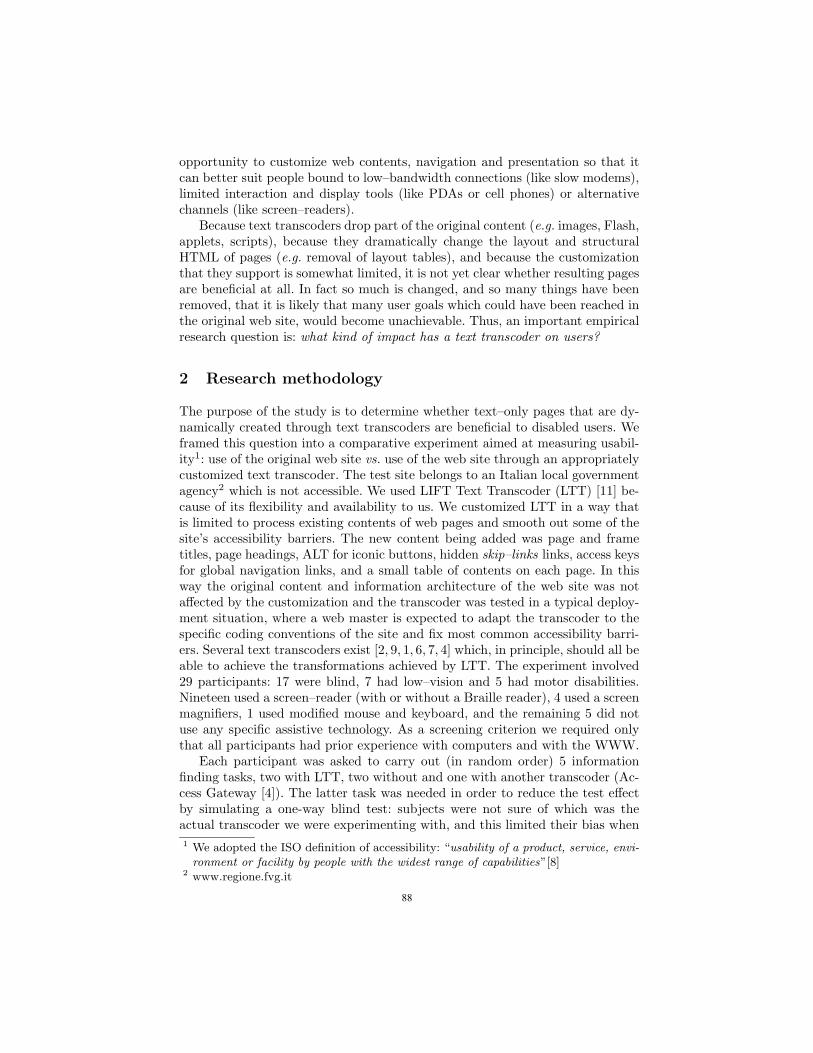
opportunity to customize web contents, navigation and presentation so that itcan better suit people bound to low–bandwidth connections (like slow modems),limited interaction and display tools (like PDAs or cell phones) or alternativechannels (like screen–readers).
Because text transcoders drop part of the original content (e.g. images, Flash,applets, scripts), because they dramatically change the layout and structuralHTML of pages (e.g. removal of layout tables), and because the customizationthat they support is somewhat limited, it is not yet clear whether resulting pagesare beneficial at all. In fact so much is changed, and so many things have beenremoved, that it is likely that many user goals which could have been reached inthe original web site, would become unachievable. Thus, an important empiricalresearch question is: what kind of impact has a text transcoder on users?
2 Research methodology
The purpose of the study is to determine whether text–only pages that are dy-namically created through text transcoders are beneficial to disabled users. Weframed this question into a comparative experiment aimed at measuring usabil-ity1: use of the original web site vs. use of the web site through an appropriatelycustomized text transcoder. The test site belongs to an Italian local governmentagency2 which is not accessible. We used LIFT Text Transcoder (LTT) [11] be-cause of its flexibility and availability to us. We customized LTT in a way thatis limited to process existing contents of web pages and smooth out some of thesite’s accessibility barriers. The new content being added was page and frametitles, page headings, ALT for iconic buttons, hidden skip–links links, access keysfor global navigation links, and a small table of contents on each page. In thisway the original content and information architecture of the web site was notaffected by the customization and the transcoder was tested in a typical deploy-ment situation, where a web master is expected to adapt the transcoder to thespecific coding conventions of the site and fix most common accessibility barri-ers. Several text transcoders exist [2, 9, 1, 6, 7, 4] which, in principle, should all beable to achieve the transformations achieved by LTT. The experiment involved29 participants: 17 were blind, 7 had low–vision and 5 had motor disabilities.Nineteen used a screen–reader (with or without a Braille reader), 4 used a screenmagnifiers, 1 used modified mouse and keyboard, and the remaining 5 did notuse any specific assistive technology. As a screening criterion we required onlythat all participants had prior experience with computers and with the WWW.
Each participant was asked to carry out (in random order) 5 informationfinding tasks, two with LTT, two without and one with another transcoder (Ac-cess Gateway [4]). The latter task was needed in order to reduce the test effectby simulating a one-way blind test: subjects were not sure of which was theactual transcoder we were experimenting with, and this limited their bias when1 We adopted the ISO definition of accessibility: “usability of a product, service, envi-
ronment or facility by people with the widest range of capabilities”[8]2 www.regione.fvg.it
88

variable factor type NO LTTmean(sd)
LTTmean(sd)
NO LTTmedian
LTTmedian
p–value
Q1 I easily found the re-quired information
E,S S 3.5 (1.68) 2.2 (1.45) 4 2 < 0.001
E,S C 3.8 (1.68) 3.1 (1.45) 4 2 < 0.048
E,S all 3.69 (1.61) 2.64 (1.57) 5 2 < 0.001
Q2 I was tempted to goelsewhere to find theanswer
E,S S 2.6 (1.84) 3.6 (1.88) 1 5 < 0.033
E,S C 2.2 (1.65) 3.4 (1.80) 1 5 < 0.003
E,S all 2.40 (1.75) 3.5 (1.83) 1 5 < 0.002
Q4 I’m satisfied with thesolution I found
E,S S 3.1 (1.88) 2.0 (1.37) 3 1 < 0.005
E,S all 3.2 (1.81) 2.3 (1.68) 4 2 < 0.002
Q5 Assess the effort re-quired
P,S all 2.5 (1.32) 4 (1.03) 2 4 < 0.001
Q6 Evaluate the presen-tation quality
S all 3.5 (1.4) 5.4 (1.18) 3 6 < 0.001
Q7 Rank the tasks by dif-ficulty
E S 2.38 (1.11) 3.24 (1.02) 3 4 < 0.008
E all 2.17 (0.55) 2.81 (0.54) 2 3 < 0.004
Q8 Proportion of usersthat would choose . . .for a next visit
E,S all 0.28 0.72 < 0.001
CL Completion level E S 0.48 (0.41) 0.74 (0.41) 0.5 1 < 0.003
E all 0.46 (0.40) 0.65 (0.42) 0.5 1 < 0.002
PR Proportion of taskswhen completionlevel > 50%
E S 0.31 0.68 < 0.005
E all 0.65 0.79 < 0.013
GU Proportion of taskswhen completion rea-son = subject gave up
E C 0.51 0.24 < 0.030
Table 1. Dependent variables, their associated usability factor and results. (Qi meansquestion, E,P and S stand for effectiveness, productivity and satisfaction). Type rep-resents the type of tasks being used: simple (S), complex (C) or both (all). Statisticalsignificance was tested with the Wilcoxon test for paired samples; the maximum ac-cepted significance level is p < 0.05. For questions Q1 . . . Q4 the answer is a 5–pointLikert scale: 1=strongly agree, . . . 5=strongly disagree; for Q5: 1=high . . . 5=low ; forQ6: 1=very bad . . . 7=very good ; for Q7: 1=difficult . . . 4=easy ; for CL: 0, 0.2, 0.4,0.6, 0.8, 1. Other variables and questions did not produce a statistically significantdifference and they are not shown.
89
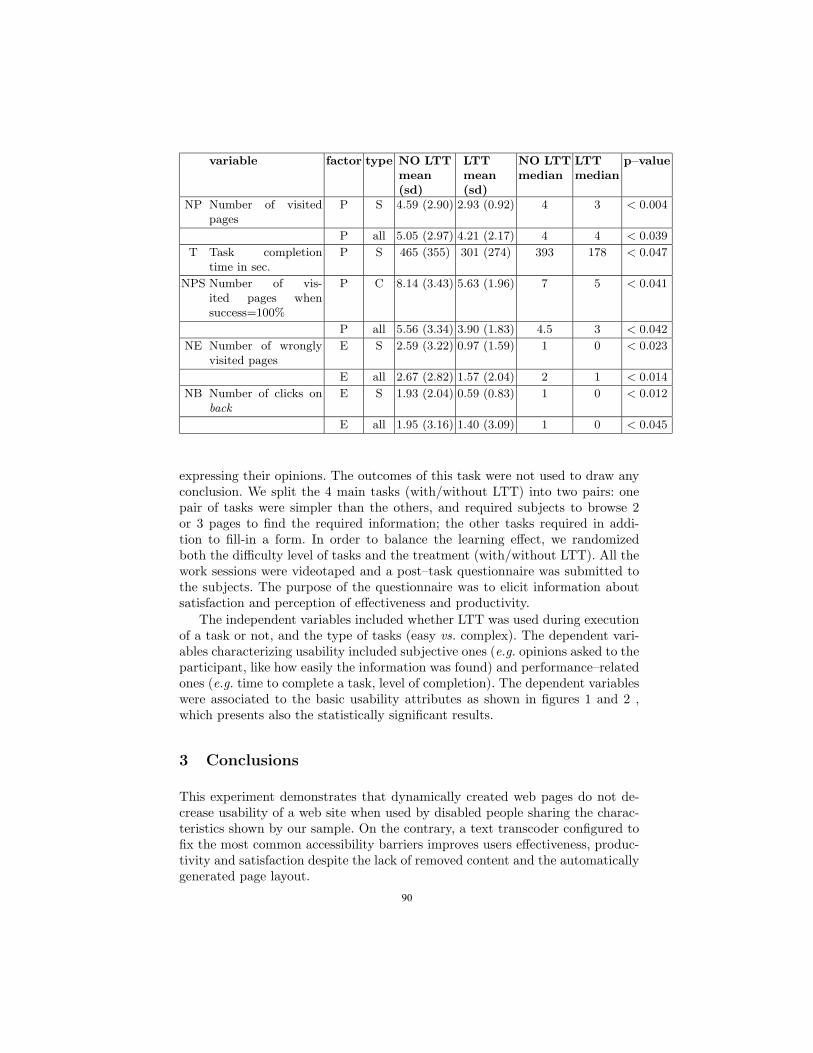
variable factor type NO LTTmean(sd)
LTTmean(sd)
NO LTTmedian
LTTmedian
p–value
NP Number of visitedpages
P S 4.59 (2.90) 2.93 (0.92) 4 3 < 0.004
P all 5.05 (2.97) 4.21 (2.17) 4 4 < 0.039
T Task completiontime in sec.
P S 465 (355) 301 (274) 393 178 < 0.047
NPS Number of vis-ited pages whensuccess=100%
P C 8.14 (3.43) 5.63 (1.96) 7 5 < 0.041
P all 5.56 (3.34) 3.90 (1.83) 4.5 3 < 0.042
NE Number of wronglyvisited pages
E S 2.59 (3.22) 0.97 (1.59) 1 0 < 0.023
E all 2.67 (2.82) 1.57 (2.04) 2 1 < 0.014
NB Number of clicks onback
E S 1.93 (2.04) 0.59 (0.83) 1 0 < 0.012
E all 1.95 (3.16) 1.40 (3.09) 1 0 < 0.045
expressing their opinions. The outcomes of this task were not used to draw anyconclusion. We split the 4 main tasks (with/without LTT) into two pairs: onepair of tasks were simpler than the others, and required subjects to browse 2or 3 pages to find the required information; the other tasks required in addi-tion to fill-in a form. In order to balance the learning effect, we randomizedboth the difficulty level of tasks and the treatment (with/without LTT). All thework sessions were videotaped and a post–task questionnaire was submitted tothe subjects. The purpose of the questionnaire was to elicit information aboutsatisfaction and perception of effectiveness and productivity.
The independent variables included whether LTT was used during executionof a task or not, and the type of tasks (easy vs. complex). The dependent vari-ables characterizing usability included subjective ones (e.g. opinions asked to theparticipant, like how easily the information was found) and performance–relatedones (e.g. time to complete a task, level of completion). The dependent variableswere associated to the basic usability attributes as shown in figures 1 and 2 ,which presents also the statistically significant results.
3 Conclusions
This experiment demonstrates that dynamically created web pages do not de-crease usability of a web site when used by disabled people sharing the charac-teristics shown by our sample. On the contrary, a text transcoder configured tofix the most common accessibility barriers improves users effectiveness, produc-tivity and satisfaction despite the lack of removed content and the automaticallygenerated page layout.
90
Although the same increase in usability is likely to be achievable by retrofittingaccessibility to the original web site, this result is important because (i) texttranscoders can be applied to inaccessible web sites to offer a temporary accessi-ble user interface, and (ii) they can be applied to offer an alternative accessibleuser interface that is more suited to these kinds of users. In fact we believe thatany specific adaptation of transcoded pages to the needs of disabled users (e.g.by suitable use of colored sections and icons, by arranging differently the pagecontents) is likely to dramatically improve usability, according to the claims in[3].
We believe the key features of LTT that support these findings are: simulta-neous rendering of frames, liquid layout with resizable text, customizability forhorizontally laying out navigation bars, for adding ALT text to image buttonsand images in general, for adding page headings, and for labeling form con-trols. We would expect to find similar result using other transcoders capable ofimplementing the transformations we relied upon using LTT, and on users ofinformation–based web sites similar to the one we tested.
References
[1] BBC Education. Betsie Home Page. www.bbc.co.uk/education/betsie. VisitedNov. 2004.
[2] Mark R. Boyns. MUFFIN World Wide Web Filtering System: Documentations.http://muffin.doit.org. Visited Nov. 2004.
[3] Giorgio Brajnik. Achieving universal web access through specialized user interfaces.In C. Stephanidis, editor, Lecture Notes in Computer Science Proc. of the 8th ERCIMUI4ALL Workshop, Vienna, June 2004. Springer Verlag.http://www.dimi.uniud.it/giorgio/publications.html]specui.
[4] Silas S. Brown. About the web access gateway.www.cl.cam.ac.uk/∼ssb22/access.html, Visited Nov. 2004.
[5] CNIPA. Studio sulle linee guida recanti i requisiti tecnici e i di-versi livelli per l’accessibilita e le metodologie tecniche per la ver-ifica dell’accessibilita (legge 4 del 2004, art. 11 comma a e b).www.pubbliaccesso.gov.it/biblioteca/documentazione/studio lineeguida,Dec 2005. Visited Jan. 2005.
[6] codix.net. Web accessibility: textualise. aquinas.venus.co.uk/solutions/∼products/textualise/index.html. Visited Nov. 2004.
[7] IBM Research. IBM transcoding technology. www.research.ibm.com/networkeddata systems/transcoding. Visited Nov. 2004.
[8] ISO. Ergonomics of human–system interaction — guidance on accessibility forhuman–computer interfaces. ISO/TS 16071. Technical report, International Stan-dards Organization, 2003. www.iso.ch.
[9] Nick Kew. mod accessibility for Apache 2.www.miswebdesign.com/resources/articles/mod accessibility.html, 2003.
[10] S. MacKenzie. Fitts’ law as a performance model in human-computer interaction.PhD thesis, University of Toronto, Ontario, Canada, 1991. www.york.ca/mack.
[11] UsableNet Inc. LIFT Text Transcoder.www.usablenet.com/products services/text transcoder/text transcoder.html,Feb 2005. Demo version available at demott.usablenet.com:8080/tt.
91


Applications: data retrieving and analysis _____________________________________________________________________


An Ontology-Based Query Manager: Usability Evaluation
Tiziana Catarci1, Tania Di Mascio1, Paolo Dongilli2, Enrico Franconi2, Giuseppe Santucci1, and Sergio Tessaris2
1 Dipartimento di Informatica e Sistemistica, Università La Sapienza, Roma, Via Salaria 113, I-00198, Roma, Italy
catarci,dimascio,[email protected] 2 Faculty of Computer Science, Free University of Bozen-Bolzano,
Piazza Domenicani 3, I-39100 Bozen-Bolzano, Italy dongilli,franconi,[email protected]
Abstract. In this paper, we describe the usability evaluation experiments of an ontology-based Query manager, which is part of the SEWASIE system (SEmantic Webs and AgentS in Integrated Economies). The usability evaluation is an important step of the User-Centered Design Methodology, followed to develop the entire project that aims at enabling a uniform access to heterogeneous data sources through an integrated ontology. The Query Manager allows the user to construct the query by a diagrammatic interface generating precise and unambiguous query expressions. The main goal of our experiment is to demonstrate the ease of use of the Query Manager independently of the domain user expertise. This study confirms that the Query Manager is usable as for the end-users (domain-expert users) as for the non-domain expert users.
1 Introduction
In this paper, we describe the usability evaluation experiments of the Query Manager done in the context of the SEWASIE project. The overall project strictly follows the User-Centered Design Methodology (UCDM, see e.g. [1]) involving users from the very beginning both in the design and test steps. From an architectural point of view, the entire project aims at providing an open and distributed architecture based on intelligent agents (e.g., query agent and brokering agent) facing scalability and flexibility issues, i.e. the ability to fit in changing and growing environments and to interoperate with other systems, while offering one central point of access to the user. In the SEWASIE architecture, we highlight the major components. The Interaction Layer is a crucial component of the overall architecture, is composed of tools, which work together, to offer an integrated, easy to use user interaction with the system. In particular, the Query Manager allows the user to construct the query generating precise and unambiguous query expressions; moreover, the interface presentation and behaviour are entirely guided by the ontology. The User Profile, based on a domain-interest model, is used to offer the most appropriate set of tools depending on the
95

user's expertise, goals, and interests. In the Core System, we identify, as repository of the local ontology, the Sewasie Information Nodes (SINodes), which work to define and maintain a single administrative or logical node of information presented to the network. The brokering agent is responsible for maintaining a view of the knowledge handled by the network, as well as the information on the content of some SINodes. The query agent is the carrier of the user query from the Interaction Layer to the SINodes, and it solves a query, interacting with the brokering agent. This paper is organized as follow, Section 2 defines the general guidelines followed in the experiment’s project, Section 3 describes the Query Manager experiments, and the Section 4 collects the conclusions.
2 Usability Evaluation Methods and Guidelines
Several different definitions of usability exist (e.g. [2] and [3]). A very comprehensive definition of usability is given as "the extent to which a product can be used with efficiency, effectiveness, and satisfaction by specific users to achieve specific goals in specific environments”. There are many ways to evaluate the interaction quality between the users and the system, and then there are many Usability Evaluation Methods (UEMs). A common difference among UEMs is based on skill of evaluators. In the Expert-based criteria, experts are requested to evaluate a prototype, comparing it w.r.t. existing rules and guidelines; in the User-based criteria, evaluators assess usability through real users, having them “using” a prototype. In particular, while the Expert-based Criteria UEMs include, among others, Heuristic Evaluation method and Expert-based method; the User-based Criteria UEMs includes, among others, Survey evaluation method and Observational evaluation method (we focus on Verbal and Think Aloud Protocols). For a complete UEMs description, we refer to [4]. Since our project follows the UCDM, we decide using the UEMs assessing usability through real users, in particular, we use for the Query Manager experiments the Think Aloud and Verbal Protocols, recording the tests with a video camera to valuate rigorously many pieces of information, e.g., the time a user spends to perform a task. Several test sessions were made to evaluate the usability of the Query Manager. In particular, during the first session [5] we measured the effectiveness and the efficiency of the query-building process; in the second test [6] we performed the designed query-model complexity, the third and the fourth experiment sessions [6], we appreciated the user satisfaction after the improvements made to the Query Manager. Since the main goal of this paper is to demonstrate the ease of use of the Query Manager independently of the domain user expertise, hereinafter we refer to the last two sessions of the evaluation process, adopting the main schema described in [5]. It is composed by the following steps: user analysis, experiment design, user teaching, experiment execution, and usability analysis
96
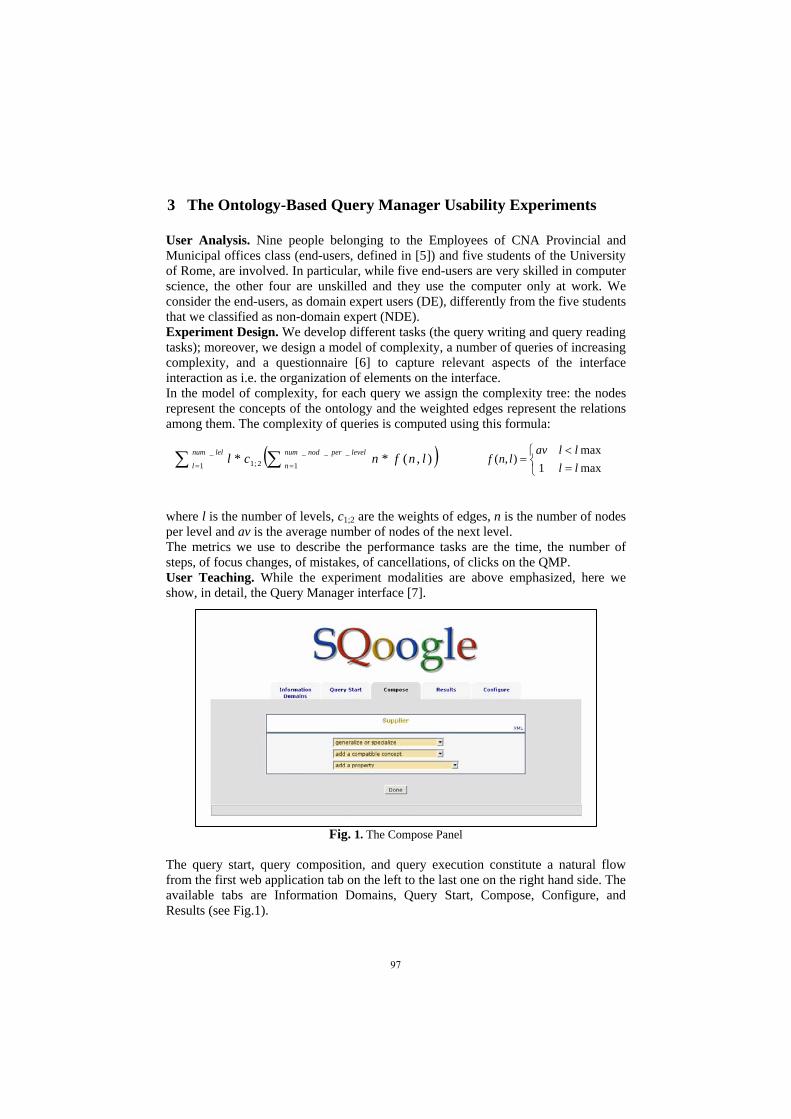
3 The Ontology-Based Query Manager Usability Experiments
User Analysis. Nine people belonging to the Employees of CNA Provincial and Municipal offices class (end-users, defined in [5]) and five students of the University of Rome, are involved. In particular, while five end-users are very skilled in computer science, the other four are unskilled and they use the computer only at work. We consider the end-users, as domain expert users (DE), differently from the five students that we classified as non-domain expert (NDE). Experiment Design. We develop different tasks (the query writing and query reading tasks); moreover, we design a model of complexity, a number of queries of increasing complexity, and a questionnaire [6] to capture relevant aspects of the interface interaction as i.e. the organization of elements on the interface. In the model of complexity, for each query we assign the complexity tree: the nodes represent the concepts of the ontology and the weighted edges represent the relations among them. The complexity of queries is computed using this formula:
( )∑∑ ==
levelpernodnum
n
lelnum
llnfncl ___
12;1_
1),(**
⎩⎨⎧
=<
=max1max
),(llllav
lnf
where l is the number of levels, c1;2 are the weights of edges, n is the number of nodes per level and av is the average number of nodes of the next level. The metrics we use to describe the performance tasks are the time, the number of steps, of focus changes, of mistakes, of cancellations, of clicks on the QMP. User Teaching. While the experiment modalities are above emphasized, here we show, in detail, the Query Manager interface [7].
Fig. 1. The Compose Panel The query start, query composition, and query execution constitute a natural flow from the first web application tab on the left to the last one on the right hand side. The available tabs are Information Domains, Query Start, Compose, Configure, and Results (see Fig.1).
97
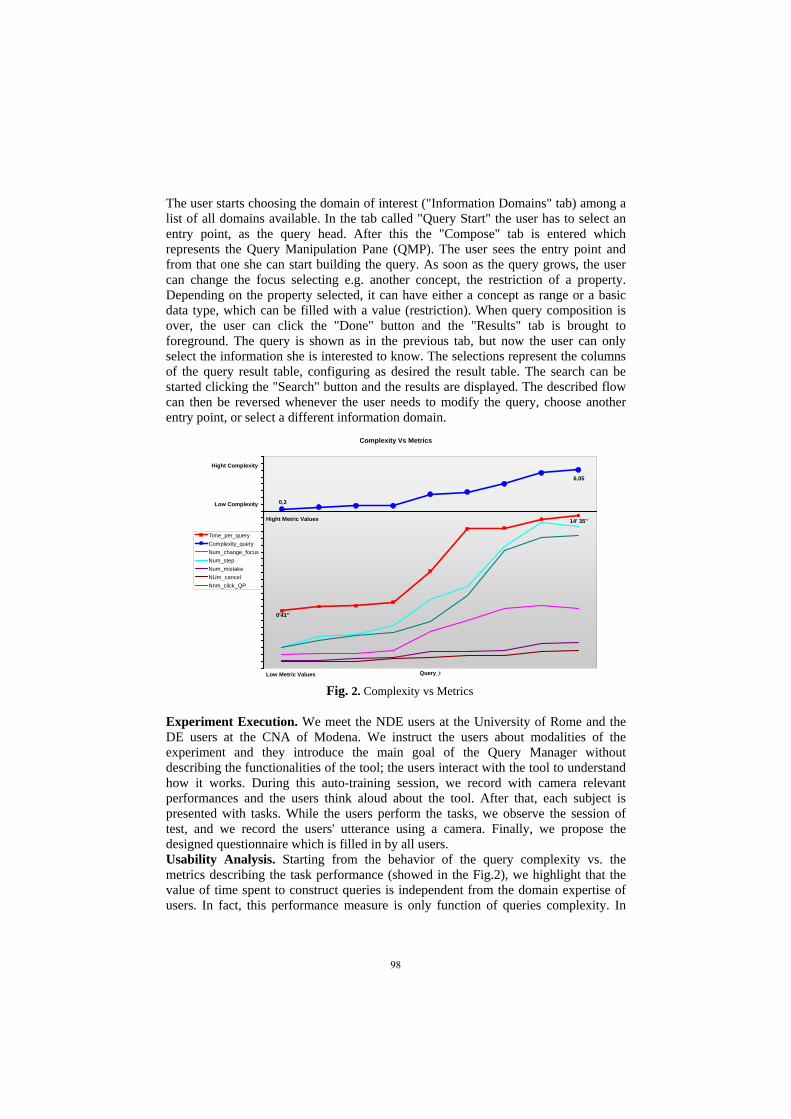
The user starts choosing the domain of interest ("Information Domains" tab) among a list of all domains available. In the tab called "Query Start" the user has to select an entry point, as the query head. After this the "Compose" tab is entered which represents the Query Manipulation Pane (QMP). The user sees the entry point and from that one she can start building the query. As soon as the query grows, the user can change the focus selecting e.g. another concept, the restriction of a property. Depending on the property selected, it can have either a concept as range or a basic data type, which can be filled with a value (restriction). When query composition is over, the user can click the "Done" button and the "Results" tab is brought to foreground. The query is shown as in the previous tab, but now the user can only select the information she is interested to know. The selections represent the columns of the query result table, configuring as desired the result table. The search can be started clicking the "Search" button and the results are displayed. The described flow can then be reversed whenever the user needs to modify the query, choose another entry point, or select a different information domain.
Fig. 2. Complexity vs Metrics
Complexity Vs Metrics
Query_i
Time_per_queryComplexity_queryNum_change_focusNum_stepNum_mistakeNUm_cancelNnm_click_QP
Hight Complexity
Low Complexity
Hight Metric Values
Low Metric Values
0,3
6,05
0'41''
14' 35''
Experiment Execution. We meet the NDE users at the University of Rome and the DE users at the CNA of Modena. We instruct the users about modalities of the experiment and they introduce the main goal of the Query Manager without describing the functionalities of the tool; the users interact with the tool to understand how it works. During this auto-training session, we record with camera relevant performances and the users think aloud about the tool. After that, each subject is presented with tasks. While the users perform the tasks, we observe the session of test, and we record the users' utterance using a camera. Finally, we propose the designed questionnaire which is filled in by all users. Usability Analysis. Starting from the behavior of the query complexity vs. the metrics describing the task performance (showed in the Fig.2), we highlight that the value of time spent to construct queries is independent from the domain expertise of users. In fact, this performance measure is only function of queries complexity. In
98
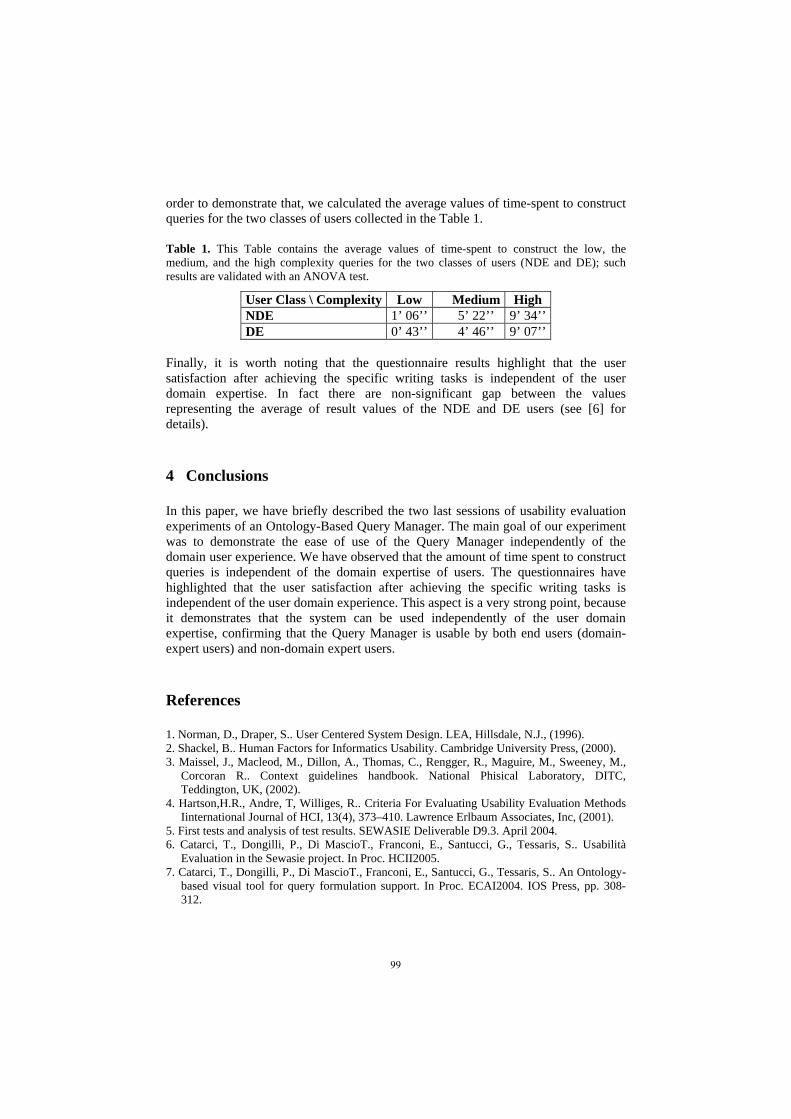
order to demonstrate that, we calculated the average values of time-spent to construct queries for the two classes of users collected in the Table 1.
Table 1. This Table contains the average values of time-spent to construct the low, the medium, and the high complexity queries for the two classes of users (NDE and DE); such results are validated with an ANOVA test.
User Class \ Complexity Low Medium High NDE 1’ 06’’ 5’ 22’’ 9’ 34’’DE 0’ 43’’ 4’ 46’’ 9’ 07’’
Finally, it is worth noting that the questionnaire results highlight that the user satisfaction after achieving the specific writing tasks is independent of the user domain expertise. In fact there are non-significant gap between the values representing the average of result values of the NDE and DE users (see [6] for details).
4 Conclusions
In this paper, we have briefly described the two last sessions of usability evaluation experiments of an Ontology-Based Query Manager. The main goal of our experiment was to demonstrate the ease of use of the Query Manager independently of the domain user experience. We have observed that the amount of time spent to construct queries is independent of the domain expertise of users. The questionnaires have highlighted that the user satisfaction after achieving the specific writing tasks is independent of the user domain experience. This aspect is a very strong point, because it demonstrates that the system can be used independently of the user domain expertise, confirming that the Query Manager is usable by both end users (domain-expert users) and non-domain expert users.
References
1. Norman, D., Draper, S.. User Centered System Design. LEA, Hillsdale, N.J., (1996). 2. Shackel, B.. Human Factors for Informatics Usability. Cambridge University Press, (2000). 3. Maissel, J., Macleod, M., Dillon, A., Thomas, C., Rengger, R., Maguire, M., Sweeney, M.,
Corcoran R.. Context guidelines handbook. National Phisical Laboratory, DITC, Teddington, UK, (2002).
4. Hartson,H.R., Andre, T, Williges, R.. Criteria For Evaluating Usability Evaluation Methods Iinternational Journal of HCI, 13(4), 373–410. Lawrence Erlbaum Associates, Inc, (2001).
5. First tests and analysis of test results. SEWASIE Deliverable D9.3. April 2004. 6. Catarci, T., Dongilli, P., Di MascioT., Franconi, E., Santucci, G., Tessaris, S.. Usabilità
Evaluation in the Sewasie project. In Proc. HCII2005. 7. Catarci, T., Dongilli, P., Di MascioT., Franconi, E., Santucci, G., Tessaris, S.. An Ontology-
based visual tool for query formulation support. In Proc. ECAI2004. IOS Press, pp. 308-312.
99
How Visualization May Help in Understanding
Association Rules
Paolo Buono and Maria Francesca Costabile
Dipartimento di Informatica, Universita degli Studi di Bari, Italybuono,[email protected]
Abstract. The enormous amount of data available today must be ade-quately exploited by decision makers in order to improve their activities.Various techniques are available today for extracting useful information.Traditionally, these are data mining techniques based on either statisticalmethods or machine learning methods. In this paper it is shown how theuse of a classical data mining algorithm that extracts association rulescan be enhanced with the use of a visualization technique that allowsusers to explore and interact with the detected rules.
1 Introduction
The enormous amount of data available today must be adequately exploited bydecision makers in order to improve their activities. In the data mining research,very little attention has been devoted so far to human-computer interaction(HCI). HCI might allow the user to get inside the data or to steer the datamining algorithm; it might also help to represent prior knowledge, so that thedata mining algorithm does not rediscover what is already known. Visual DataMining (VDM) is emerging area in explorative data analysis and mining thatmay provide a good contribution along this direction. VDM refers to methodsfor supporting exploration of large data sets by allowing users to directly interactwith visual representations of data and dynamically modify parameters to seehow they affect the visualized data.
Shneiderman calls computational tools for discovery both data mining toolsand information visualization tools [6]. They have advanced dramatically in re-cent years, but they have been developed by largely separate communities withdifferent philosophies. Data mining and machine learning researchers tend tobelieve in the power of statistical methods to identify interesting patterns with-out human intervention. Information visualization researchers tend to believein the importance of user control by domain experts to produce useful visualpresentations that provide unexpected insights.
Visual Data Mining is essentially a combined approach that exploits bothclassical data mining algorithms and visual representation techniques. We agreethat this combined approach could lead to discovery tools that enable effectivedata navigation and interpretation, preserves user control, and provides the pos-sibility to discover anything interesting or unusual without the need to know inadvance what kind of phenomena should be observed.
100

In this paper we describe multi-level association rules and present a visual-ization technique that aims at helping data miners in understanding associationrules generated by classical data mining algorithms (Section 2). The results ofsome preliminary evaluations of the proposed technique with users are reportedin Section 3, that concludes the paper.
2 Exploring Multi-level Association Rules
While a lot of research has been conducted on designing visualizations to exploreamong association rules [3], no work, to our knowledge, properly deal with multi-level spatial association rules. In this paper we propose an extension of the graph-based visualization tool, presented in [2, 4], in order to enable the user to easilyinteract with multi-level association rules.
Association rules can be defined as follows: let I = i1, i2, . . . , in be a set ofitems (in the market basket analysis the items could be the products sold in thesupermarket. The database consists of a set of transactions T = τi, A1, . . . , Am
where τi is the identifier of the transaction, m ≤ n,Aj ∈ I, j = 1, . . . ,m, andgiven Aj ∈ I and Ak ∈ I,Aj 6= Ak. Each transaction τ ⊆ T is a set of items,such that τi ∈ T . An association rule is a condition of the form X → Y (s, c),where X ⊆ I and Y ⊆ I, X ∩ Y = ⊘, s and c are called respectively supportand confidence. The support s of the rule R is s = nR
n, where nR is the number
of transaction in τ holding X ∪ Y and n is the total number of transaction. Thesupport represent the proportion of transactions containing both the antecedentand the consequent, and does not consider the possible relationships between theantecedent and the consequent. The confidence c of a rule R is c = nR
nX
where nX
is the number of transactions containing X. The confidence is a measure of theconditional probability of the consequent, given the antecedent, in some way theconfidence expresses the strength of the logical implication described by the rule.The main goal of researcher working in this area is to mine association rules, i.e., to produce as many significant rules as possible. This means that they haveto produce the maximum number of rule, discarding less or non significant ones.The task of discarding rules is called pruning. Many data mining applicationsmake pruning taking into account only confidence and support thresholds. Someauthors have introduced other parameters to improve the pruning phase andkeep interesting patterns, see for example the Difference of Confidence [5] or theItem Utility [3].
Multi-level association rules differ from generalized association rules in de-scribing items in association rules at different levels of granularity. This allow abetter analysis of the problem. A set R of multi-level association rules can benaturally partitioned into M × N groups denoted by Rij , where i (1 ≤ i ≤ M)denotes the level of granularity in the hierarchies Hk, while j (2 ≤ j ≤ N) isthe number of refinement steps performed to obtain the pattern (i.e. number ofatoms in the pattern). Each set Rij can be visualized as a graph by representingantecedent and consequent of rules as nodes and relationships among them asedges. This graph-based visualization is formally defined as follows: Given an
101

association rules set R, a directed graph G = (N,E) can be built from R, suchthat:
– N is a set of couples (l, t), named nodes, where l denotes the conjunctionof atoms representing the antecedent (A) or consequent (C) of a rule A →
C ∈ R, while t is a flag denoting the node role (i.e. antecedent, consequentor both of them).
– E is a set of 4-tuples (nA, nC , s, c), named edges, where nA is a node withthe role of antecedent; nC is a node with the role of consequent, while s andc are the support and confidence of the rule nA → nC ∈ R respectively.
Each node of G is visualized as a colored circle1: a red circle represents anode n with the role of antecedent while a green circle represents a node n withthe role of consequent. If the node has the role of antecedent for a rule andconsequent for a different rule, it appears half red and half green. The label l ofa node n is visualized in a rectangular frame close to the circle representing n.Conversely, each edge in G can be visualized by a straight segment connectingthe node nA with the node nC . It corresponds with the rule nA → nC that existsin R. The confidence of this rule is coded by the length of the edge, the greater isthe confidence, the longer is the edge. Conversely, the support is coded by colorsaturation of the edge: from light blue (low support) to black (high support).Support and/or confidence can be also visualized in a text label close to the edge(see Figure 1).
Fig. 1. Visualizing the graph of spatial association rules
As discussed in [2], this graph representation is beneficial in exploring hugeamount of association rules in order to pick interesting and useful patterns,since it takes advantages from human perceptual and cognitive capabilities toimmediately highlight which association rules share the same antecedent or con-sequent with respect to the overall distribution of rules. Filtering mechanismswhich permit to hide a sub-graph of G (i.e. subset of rules in R) according toeither minimal values of support and confidence or the absence of one or morepredicates in the rule provide a better interaction.
The graph-based visualization has been further extended in order to enabledata miners to navigate among several graphs Gij according to either the levelsof granularity i or the number of refinement steps j [1].
1 Node color may be customized by the user
102

Fig. 2. ARVis Interface
The current ARVis interface is shown in Fig. 2. The visualization imple-mented what Shneiderman calls Information Visualization Mantra: “Overviewfirst, then zoom and filter, details on demand” [7]. Several mechanisms are im-plemented in order to allow users to filter data and concentrate only on dataof interest. A prototype of ARVis is available for demo and has been used forevaluation with users, as discussed in next section. Lack of space prevents us toshow in details how ARVis works. The interested reader may refer to [1].
3 ARVis usability
Evaluation is not a single phase of the development process of an application,but is an iterative process deployed across a set of prototypes. Early evaluationhas the advantage that problems can be identified as soon as possible and canthen be corrected easier and with minimum cost. In the ARVis development weadopted evaluation techniques that are comprehensive and cost-effective. Theevaluation process is based on user and task observation, scenarios, simplifiedthinking aloud, heuristic evaluation. In particular heuristic evaluation has beenperformed by three inspectors since early prototypes were available. It provideduseful indications of some problems, that were discussed with developers to de-cide the modifications to be performed in the successive versions. The current
103
prototype, shown in Fig. 2 has been used for thinking aloud, that has beencarried out with four users.
Users appreciated the possibility offered by the tool to directly interact withthe data by using the graph representation of the rules. In particular, the as-sociation rules overview, the detail on demand about some selected rules andthe filtering features were appreciated very much. Users provided also feedbacksfor new features to be included in future versions, for instance the possibility toorder rules based on the antecedent or consequent cardinality, or the possibilityto follow rules when changing rule granularity.
References
1. A. Appice and P. Buono. Analyzing multi-level spatial association rules through agraph-based visualization. In proc. IEA/AIE 2005 - 18th International Conferenceon Industrial & Engineering Applications of Artificial Intelligence & Expert Systems,page accepted, 2005.
2. D. Bruzzese and P. Buono. Combining visual techniques for association rules ex-ploration. In M. F. Costabile, editor, Proceedings of the Working Conference onAdvanced Visual Interfaces AVI 2004, pages 381–384. ACM Press, 2004.
3. D. Bruzzese and C. Davino. Visual post analysis of association rules. Journal ofVisual Languages and Computing, 14(6):621–635, 2003.
4. P. Buono. Analysing association rules with an interactive graph-based technique.In HCI International 2003, pages 675–679, Crete, Greece, 22-27 June 2003.
5. H. Hofmann and A. F. X. Wilhelm. Visual comparison of association rules. Com-putational Statistics, 16(3):399–415, 2001.
6. B. Shneiderman. Inventing discovery tools: combining information visualization withdata mining. Information Visualization, 1(1):5–12, 2002.
7. B. Shneiderman and C. Plaisant. Designing user interfaces. Addison Wesley, Wash-ington, D.C., 2004.
104

POSTER _____________________________________________________________________

Product page usability test in an hotel reservation website
Emanuele Panizzi, Università di Roma La Sapienza, Italy, [email protected]
Federica Patamia, Renata Sarno, Venere Net SpA, Italy, patamia,[email protected]
Abstract. We describe the experience of usability testing in Venere, an italian firm in the online hotel reservation business. The product pages in the venere.com web site, consisting in the description of hotels with their services, location, room availability and price, have been analyzed in order to improve their usability. After a heuristic evaluation of the existing page, a new page has been developed and 100 usability tests have been conducted with fifty users to compare the two pages. The results of these tests have shown some enhancement of the new product page with respect to the previous version, although they highlighted several problems to be addressed. The solution to these problems led to a final version that is currently online and has proved to perform well both in terms of the number of exits and of an increase in the conversion rate.
1 Introduction
One of the main problems of e-commerce is the great number of users that leave the website before purchasing. Although the reason of this behaviour is to be attributed in part to the search of offers on other websites (and therefore to the intrinsic characteristics of the product or of the offer), in other cases the user leaves the website since he does not find the information on the product that he wants to purchase and (or he finds it with much difficulty) on how to make the purchase. In other words, he experiences a usability problem [1].
It is therefore of fundamental importance to have a usable website in order to reduce its abandonment and to allow the users/customers to decide on their purchase. In particular, it is important to focus on the usability of the product page, i.e., of that part of the website dedicated to introducing the details of a single product, including the descriptive text, the images and the information for the purchase, such as availability and price. This study, relative to the product page of the hotel reservation website of Venere Net SpA (www.venere.com), has pinpointed and resolved various critical aspects allowing the realization of a new product page and has brought significant results to the overall conversion rate of website [2].
This article is organized as follows: the next section describes the general requirements of a product page, the organization of the venere.com product page and the project of an intermediate version based on a heuristic analysis; section 3 describes the planning of usability tests; section 4 describes the field test and the analysis of the results; the conclusions describe the definition of the final product page, currently online, and the overall improvements of the service of e-commerce.
107
2 The Venere.com Product Page
The product of an online hotel reservation system like venere.com’s is represented by the availability of one or more rooms in a given property for a given number of nights. The product page is, therefore, a page that describes the property supplying users with all the necessary information such as the location and directions, the quality and quantity of services offered, the availability of bookable properties for a particular date and their relative prices. Venere.com commonly calls these pages hotel templates, or simply “template”.
Some guidelines have emerged for the planning of a usable product page from a study carried out by Nielsen on 20 e-commerce websites [3]. By applying these guidelines to online hotel reservations, we have determined the following main characteristics that a product page should have, furthermore, we have verified the presence of these characteristics in the existing hotel templates as far as a heuristic analysis is concerned.
The main characteristics that a hotel reservation product page must have are the following: 1. logo of the society that distributes the service; 2. logo of the hotel; 3. detailed images of the facilities offered and of the rooms; 4. room and service rates; 5. room availability in the period requested; 6. cancellation policies; 7. user reviews; 8. detailed description of directions to the hotel.
We found that the existing hotel templates lacked the characteristics described in points 3, 4, 6, 7 and 8 and furthermore did not satisfy many of the "Nielsen heuristics" [4].
Prior to the heuristic evaluation, we carried out a cognitive walkthrough session with all those who were responsable for the project and realization of the new template. During this session many modifications were made to the rough draft until we reached the new version that satisfied Nielsen's heuristics and all the requirements indicated in the previous paragraph.
3 Test Project
The aim of the test is to verify the overall improvement of the usability from the old product page to the new one and therefore the usefullness of these changes on the website. Particular attention was made to quality of the photos, to the maps, to the information on the facilities and their costs, to the quality of the graphic layout, to how much the website is remembered and the company's logo is recognized.
For the test, each user was given the same task twice, once with the initial template and once with the new template.
We chose six hotels, three of which had a new template. We decided to show a hotel with old template and one with the new template in random order, so as to limit the effects of a normal learning process.
108
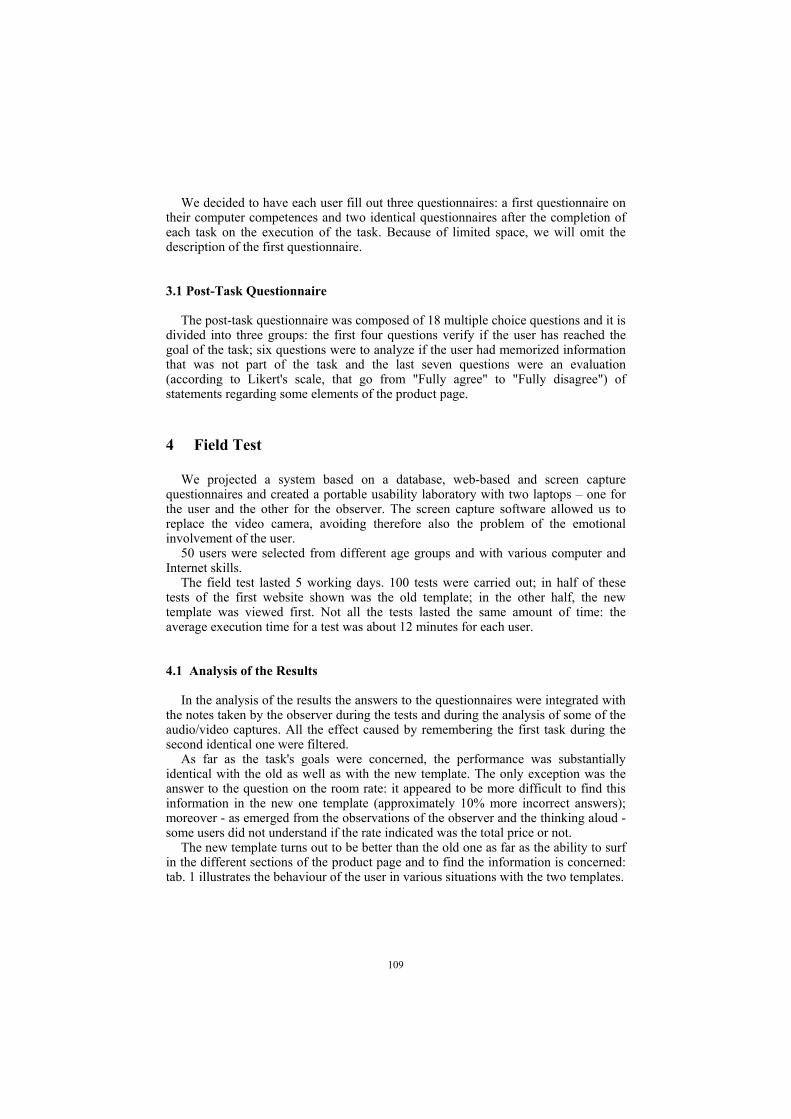
We decided to have each user fill out three questionnaires: a first questionnaire on their computer competences and two identical questionnaires after the completion of each task on the execution of the task. Because of limited space, we will omit the description of the first questionnaire.
3.1 Post-Task Questionnaire
The post-task questionnaire was composed of 18 multiple choice questions and it is divided into three groups: the first four questions verify if the user has reached the goal of the task; six questions were to analyze if the user had memorized information that was not part of the task and the last seven questions were an evaluation (according to Likert's scale, that go from "Fully agree" to "Fully disagree") of statements regarding some elements of the product page.
4 Field Test
We projected a system based on a database, web-based and screen capture questionnaires and created a portable usability laboratory with two laptops – one for the user and the other for the observer. The screen capture software allowed us to replace the video camera, avoiding therefore also the problem of the emotional involvement of the user.
50 users were selected from different age groups and with various computer and Internet skills.
The field test lasted 5 working days. 100 tests were carried out; in half of these tests of the first website shown was the old template; in the other half, the new template was viewed first. Not all the tests lasted the same amount of time: the average execution time for a test was about 12 minutes for each user.
4.1 Analysis of the Results
In the analysis of the results the answers to the questionnaires were integrated with the notes taken by the observer during the tests and during the analysis of some of the audio/video captures. All the effect caused by remembering the first task during the second identical one were filtered.
As far as the task's goals were concerned, the performance was substantially identical with the old as well as with the new template. The only exception was the answer to the question on the room rate: it appeared to be more difficult to find this information in the new one template (approximately 10% more incorrect answers); moreover - as emerged from the observations of the observer and the thinking aloud - some users did not understand if the rate indicated was the total price or not.
The new template turns out to be better than the old one as far as the ability to surf in the different sections of the product page and to find the information is concerned: tab. 1 illustrates the behaviour of the user in various situations with the two templates.
109
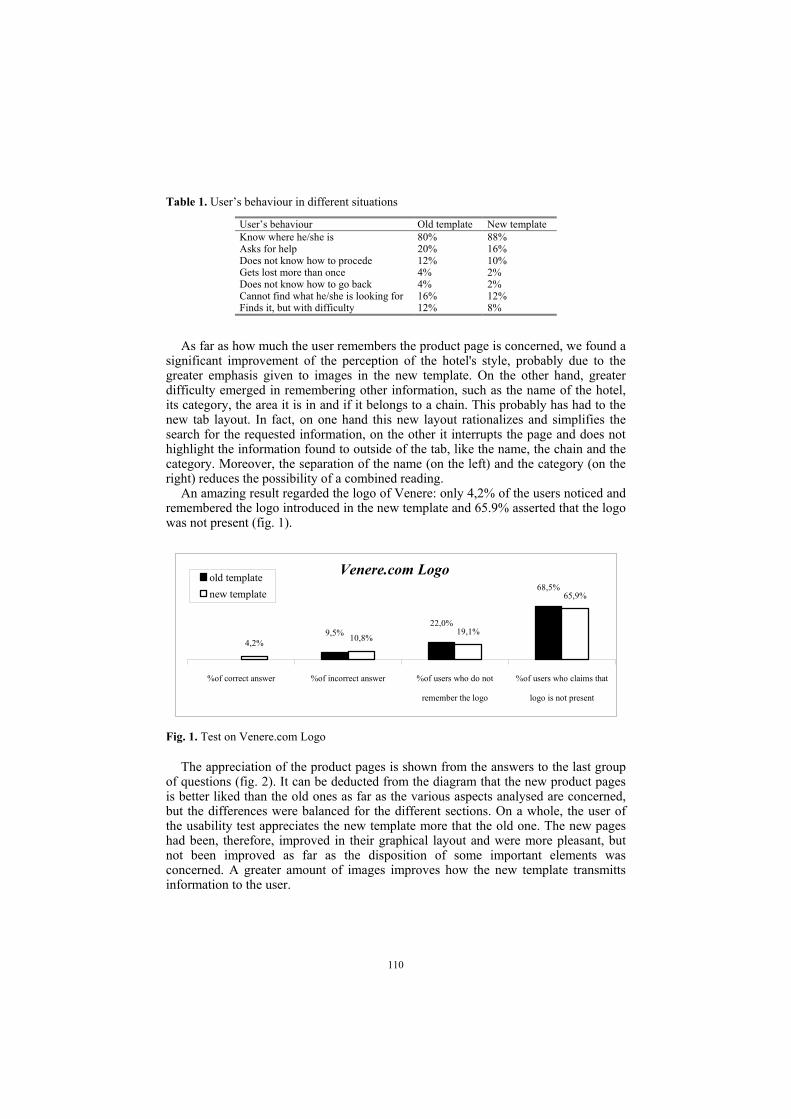
Table 1. User’s behaviour in different situations
User’s behaviour Old template New template Know where he/she is Asks for help Does not know how to procede Gets lost more than once Does not know how to go back Cannot find what he/she is looking for Finds it, but with difficulty
80% 20% 12% 4% 4% 16% 12%
88% 16% 10% 2% 2% 12% 8%
As far as how much the user remembers the product page is concerned, we found a
significant improvement of the perception of the hotel's style, probably due to the greater emphasis given to images in the new template. On the other hand, greater difficulty emerged in remembering other information, such as the name of the hotel, its category, the area it is in and if it belongs to a chain. This probably has had to the new tab layout. In fact, on one hand this new layout rationalizes and simplifies the search for the requested information, on the other it interrupts the page and does not highlight the information found to outside of the tab, like the name, the chain and the category. Moreover, the separation of the name (on the left) and the category (on the right) reduces the possibility of a combined reading.
An amazing result regarded the logo of Venere: only 4,2% of the users noticed and remembered the logo introduced in the new template and 65.9% asserted that the logo was not present (fig. 1).
Venere.com Logo
9,5%22,0%
68,5%
4,2% 10,8%19,1%
65,9%
%of correct answer %of incorrect answer %of users who do not
remember the logo
%of users who claims that
logo is not present
old templatenew template
Fig. 1. Test on Venere.com Logo
The appreciation of the product pages is shown from the answers to the last group of questions (fig. 2). It can be deducted from the diagram that the new product pages is better liked than the old ones as far as the various aspects analysed are concerned, but the differences were balanced for the different sections. On a whole, the user of the usability test appreciates the new template more that the old one. The new pages had been, therefore, improved in their graphical layout and were more pleasant, but not been improved as far as the disposition of some important elements was concerned. A greater amount of images improves how the new template transmitts information to the user.
110

User's Appreciation
0
1
2
3
4
5
GRAPHICS INFORMATIONS CONTENTS MAPS FONTS COLOURS SURFING
OLD TEMPLATE
NEW TEMPLATE
Fig. 2. User’s appreciation of the template
Based on this analysis a final version of the product page was elaborated. The Venere logo was restylied the text “venere.com” was added to the logo; the tabs were replaced with a button-menu to reduce the effect of an interruption of the page; the name of the property, the category and the chain was put together up on the left of the page under the logo; the availability information was moved above the button-menu. This information does not vary in the different sections of the product page. Corrections were made to all problems evidenced from the tests. This final version1 of the product page was put online with excellent results: statistics elaborated on the accesses to the website have evidenced an inferior number of users leaving the product page (exit page) and an increase of conversion rate of approximately 20%, confirming therefore the usefullness of the project.
5 Conclusions
The project has turned out to be highly usefull for the company with reduced costs i.e., only 5 days of user-testing, plus the preparation and the analysis, in fact it brought about an increase of 20% of the hotel reservations. Reference 1. Nielsen, J., Designing Web Usability, (italian edition) APOGEO 2000, ISBN 88-7303-686-4 2. Patamia, F., Analisi di usabilità delle pagine di prodotto di un sito di e-commerce
alberghiera, field test e interpretazione dei risultati, Tesi di laurea, Università di Roma La Sapienza, 2004
3. Nielsen Norman Group, E-Commerce User Experience – Product Pages, 2000 Nielsen Norman Group, www.nngroup.com/reports/ecommerce
4. Nielsen, J., Usability Engineering, Academic Press, 1993, ISBN 0-12-518405-0
1 The images of the three versions of the template can be found at
http://hci.uniroma1.it/panizzi/hcitaly05fi/
111


Finito di stampare: Luglio 2005
Studio Grafico Pierpaolo Ceccarelli
Related Documents