Monitoring the situation of children and women Sierra Leone Multiple Indicator Cluster Survey 2005 Statistics Sierra Leone United Nations Children’s Fund

Welcome message from author
This document is posted to help you gain knowledge. Please leave a comment to let me know what you think about it! Share it to your friends and learn new things together.
Transcript
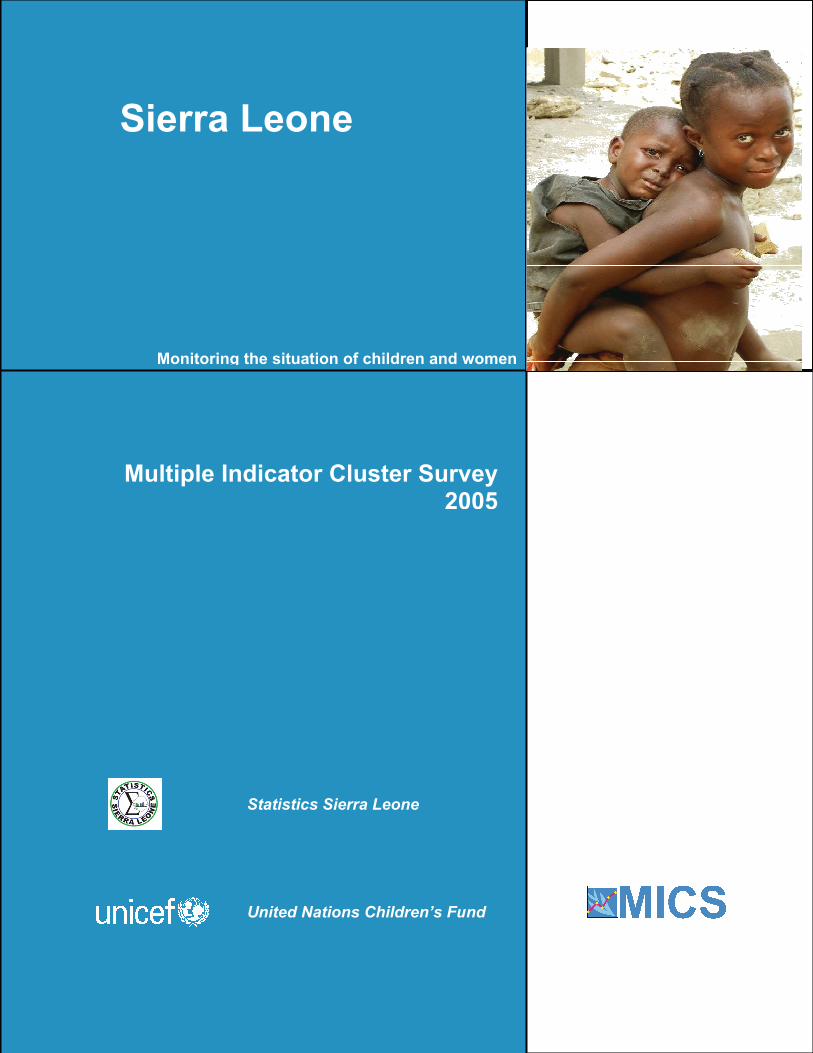
Monitoring the situation of children and women
Sierra Leone
Multiple Indicator Cluster Survey 2005
Statistics Sierra Leone
United Nations Children’s Fund
Sierra Leone Multiple Indicator Cluster Survey
2005
Statistics Sierra Leone
UNICEF United Nations Children’s Fund
In collaboration with members of the MICS3 Steering Committee, including representatives of the Ministry of Health and Sanitation and
the Ministry of Education, Science and Technology
August 2007
Contributors to the report include UNICEF-Sierra Leone Project Officers in Health, Education, Water and Sanitation, and HIV/AIDS sections; and, Paul Sengeh, UNICEF-Sierra Leone M&E Officer. The Sierra Leone Multiple Indicator Cluster Survey (MICS) was conducted by Statistics Sierra Leone in collaboration with UNICEF-Sierra Leone. Financial and technical support was provided by the United Nations Children’s Fund (UNICEF) and the Government of Sierra Leone (through Statistics Sierra Leone). The survey has been conducted as part of the third round of MICS surveys (MICS3) that were carried out around the world in more than 50 countries in 2005-2006. The MICS3 follows the first two rounds of MICS surveys that were conducted in 1995 and 2000. Survey tools are based on the models and standards developed by the global MICS project and are designed to collect information on the situation of children and women in countries around the world. Additional information on the global MICS project may be obtained from www.childinfo.org. Suggested citation: Statistics Sierra Leone and UNICEF-Sierra Leone 2007. Sierra Leone Multiple Indicator Cluster Survey 2005, Final Report. Freetown, Sierra Leone: Statistics Sierra Leone and UNICEF-Sierra Leone.
i
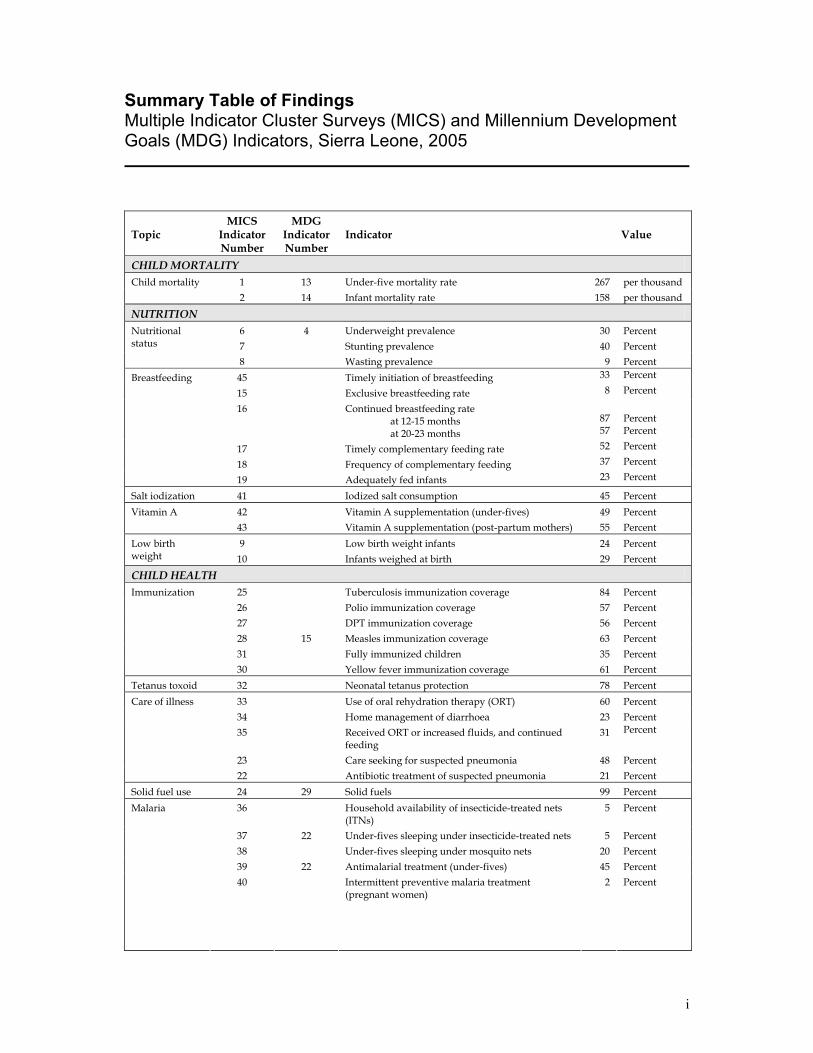
Summary Table of Findings Multiple Indicator Cluster Surveys (MICS) and Millennium Development Goals (MDG) Indicators, Sierra Leone, 2005
Topic MICS
Indicator Number
MDG Indicator Number
Indicator Value
CHILD MORTALITY 1 13 Under-five mortality rate 267 per thousand Child mortality 2 14 Infant mortality rate 158 per thousand
NUTRITION 6 4 Underweight prevalence 30 Percent 7 Stunting prevalence 40 Percent
Nutritional status
8 Wasting prevalence 9 Percent 45 Timely initiation of breastfeeding 33 Percent
15 Exclusive breastfeeding rate 8 Percent
16 Continued breastfeeding rate at 12-15 months at 20-23 months
87 57
Percent Percent
17 Timely complementary feeding rate 52 Percent
18 Frequency of complementary feeding 37 Percent
Breastfeeding
19 Adequately fed infants 23 Percent
Salt iodization 41 Iodized salt consumption 45 Percent 42 Vitamin A supplementation (under-fives) 49 Percent Vitamin A 43 Vitamin A supplementation (post-partum mothers) 55 Percent 9 Low birth weight infants 24 Percent Low birth
weight 10 Infants weighed at birth 29 Percent CHILD HEALTH
25 Tuberculosis immunization coverage 84 Percent 26 Polio immunization coverage 57 Percent 27 DPT immunization coverage 56 Percent 28 15 Measles immunization coverage 63 Percent 31 Fully immunized children 35 Percent
Immunization
30 Yellow fever immunization coverage 61 Percent Tetanus toxoid 32 Neonatal tetanus protection 78 Percent
33 Use of oral rehydration therapy (ORT) 60 Percent 34 Home management of diarrhoea 23 Percent 35 Received ORT or increased fluids, and continued
feeding 31 Percent
23 Care seeking for suspected pneumonia 48 Percent
Care of illness
22 Antibiotic treatment of suspected pneumonia 21 Percent Solid fuel use 24 29 Solid fuels 99 Percent
36 Household availability of insecticide-treated nets (ITNs)
5 Percent
37 22 Under-fives sleeping under insecticide-treated nets 5 Percent 38 Under-fives sleeping under mosquito nets 20 Percent 39 22 Antimalarial treatment (under-fives) 45 Percent
Malaria
40 Intermittent preventive malaria treatment (pregnant women)
2 Percent
ii
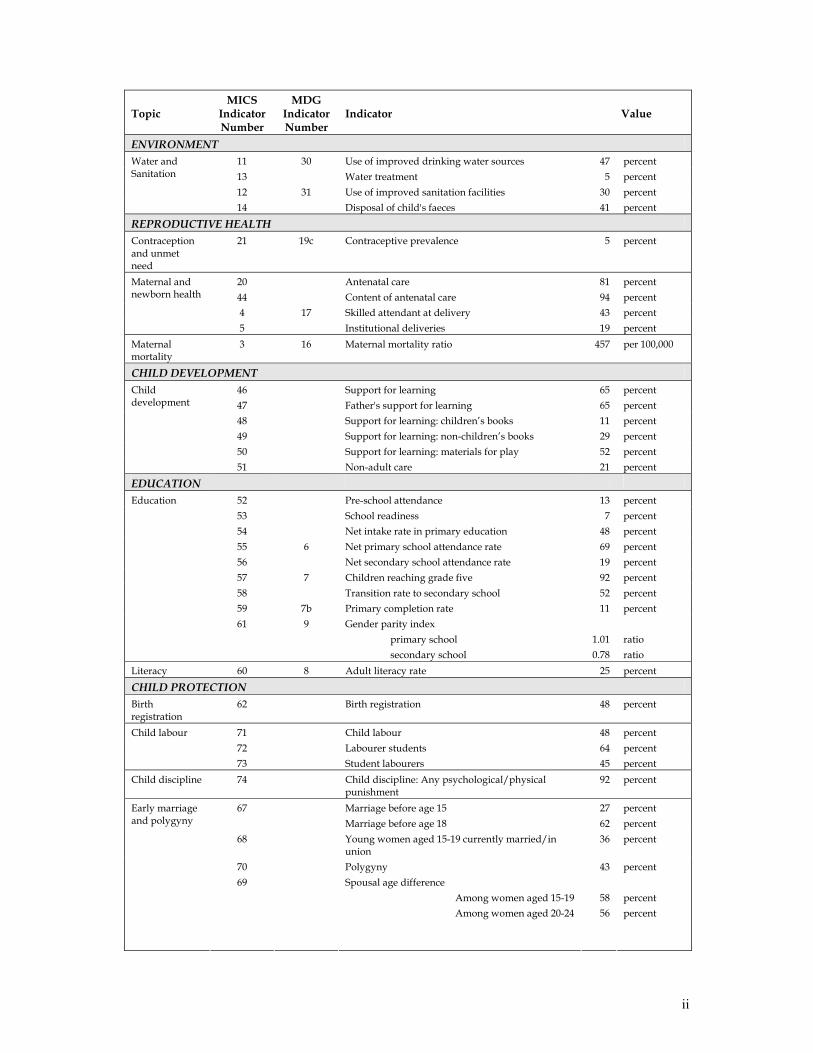
Topic MICS
Indicator Number
MDG Indicator Number
Indicator Value
ENVIRONMENT 11 30 Use of improved drinking water sources 47 percent 13 Water treatment 5 percent 12 31 Use of improved sanitation facilities 30 percent
Water and Sanitation
14 Disposal of child's faeces 41 percent
REPRODUCTIVE HEALTH Contraception and unmet need
21 19c Contraceptive prevalence 5 percent
20 Antenatal care 81 percent 44 Content of antenatal care 94 percent 4 17 Skilled attendant at delivery 43 percent
Maternal and newborn health
5 Institutional deliveries 19 percent Maternal mortality
3 16 Maternal mortality ratio 457 per 100,000
CHILD DEVELOPMENT 46 Support for learning 65 percent 47 Father's support for learning 65 percent 48 Support for learning: children’s books 11 percent 49 Support for learning: non-children’s books 29 percent 50 Support for learning: materials for play 52 percent
Child development
51 Non-adult care 21 percent
EDUCATION
52 Pre-school attendance 13 percent 53 School readiness 7 percent 54 Net intake rate in primary education 48 percent 55 6 Net primary school attendance rate 69 percent 56 Net secondary school attendance rate 19 percent 57 7 Children reaching grade five 92 percent 58 Transition rate to secondary school 52 percent 59 7b Primary completion rate 11 percent
Education
61 9 Gender parity index primary school secondary school
1.01 0.78
ratio ratio
Literacy 60 8 Adult literacy rate 25 percent
CHILD PROTECTION Birth registration
62 Birth registration 48 percent
71 Child labour 48 percent 72 Labourer students 64 percent
Child labour
73 Student labourers 45 percent Child discipline 74 Child discipline: Any psychological/physical
punishment 92 percent
67 Marriage before age 15 Marriage before age 18
27 62
percent percent
68 Young women aged 15-19 currently married/in union
36 percent
70 Polygyny 43 percent
Early marriage and polygyny
69 Spousal age difference Among women aged 15-19 Among women aged 20-24
58 56
percent percent
iii
Topic MICS
Indicator Number
MDG Indicator Number
Indicator Value
66 Approval for continuation of secret societies 86 percent 63 Prevalence of membership in secret societies 94 percent
Membership in secret societies (proxy for female genital cutting)
65 Prevalence of membership in secret societies among daughters
34 percent
Domestic violence
100 Attitudes towards domestic violence 85 percent
Disability 101 Child disability 23 percent
HIV/AIDS, SEXUAL BEHAVIOUR, AND ORPHANED AND VULNERABLE CHILDREN 82 19b Comprehensive knowledge about HIV prevention
among young people 17 percent
89 Knowledge of mother- to-child transmission of HIV 54 percent 86 Positive attitude towards people with HIV/AIDS 5 percent 87 Women who know where to be tested for HIV 18 percent 88 Women who have been tested for HIV 6 percent 90 Counselling coverage for the prevention of mother-
to-child transmission of HIV 41 percent
HIV/AIDS knowledge and attitudes
91 Testing coverage for the prevention of mother-to-child transmission of HIV
5 percent
84 Age at first sex among young people 25 percent 92 Age-mixing among sexual partners 39 percent 83 19a Condom use with non-regular partners 20 percent
Sexual behaviour
85 Higher-risk sex in the last year 43 percent 75 Prevalence of orphans 11 percent 78 Children’s living arrangements 20 percent 76 Prevalence of vulnerable children 18 percent 77 20 School attendance of orphans versus non-orphans 0.83 ratio 81 External support to children orphaned and made
vulnerable by HIV/AIDS 1.3 percent
79 Malnutrition among children orphaned and made vulnerable by HIV/AIDS
0.96 ratio
Support to orphaned and vulnerable children
80 Early sex among children orphaned and made vulnerable by HIV/AIDS
1.51 ratio
iv
Table of Contents
Summary Table of Findings ...................................................................................................................................i Table of Contents................................................................................................................................................... iv List of Tables .......................................................................................................................................................... vi List of Figures ......................................................................................................................................................viii List of Abbreviations ............................................................................................................................................ ix Acknowledgements ................................................................................................................................................x Executive Summary .............................................................................................................................................. xi I. Introduction ..........................................................................................................................................................1 Background................................................................................................................................................1 Survey Objectives .....................................................................................................................................2 II. Sample and Survey Methodology ...................................................................................................................3 Sample Design...........................................................................................................................................3 Questionnaires ..........................................................................................................................................3 Training and Fieldwork...........................................................................................................................4 Data Processing.........................................................................................................................................5 III. Sample Coverage and the Characteristics of Households and Respondents .........................................6 Sample Coverage ......................................................................................................................................6 Characteristics of Households................................................................................................................7 Characteristics of Respondents ..............................................................................................................8 IV. Child Mortality................................................................................................................................................10 V. Nutrition Nutritional Status ...................................................................................................................................12 Breastfeeding...........................................................................................................................................14 Salt Iodization..........................................................................................................................................18 Vitamin A Supplements ........................................................................................................................20 Low Birth Weight ...................................................................................................................................22 VI. Child Health.....................................................................................................................................................24 Immunization..........................................................................................................................................24 Tetanus Toxoid........................................................................................................................................27 Oral Rehydration Therapy....................................................................................................................29 Care Seeking and Antibiotic Treatment of Pneumonia ...................................................................32 Solid Fuel Use..........................................................................................................................................33 Malaria......................................................................................................................................................34 VII. Environment...................................................................................................................................................37 Water and Sanitation..............................................................................................................................37 VIII. Reproductive Health ...................................................................................................................................41 Contraception..........................................................................................................................................41 Antenatal Care ........................................................................................................................................42 Assistance at Delivery............................................................................................................................43 Maternal Mortality .................................................................................................................................44 IX. Child Development.........................................................................................................................................46
v
X. Education ...........................................................................................................................................................49 Pre-School Attendance and School Readiness...................................................................................49 Primary and Secondary School Participation ....................................................................................50 Adult Literacy .........................................................................................................................................54 XI. Child Protection...............................................................................................................................................55 Birth Registration....................................................................................................................................55 Child Labour ...........................................................................................................................................56 Child Discipline ......................................................................................................................................58 Early Marriage and Polygyny ..............................................................................................................59 Membership in Secret Societies............................................................................................................62 Domestic Violence ..................................................................................................................................64 Child Disability .......................................................................................................................................65 XII. HIV/AIDS, Sexual Behaviour, and Orphaned and Vulnerable Children ...........................................66 Knowledge of HIV Transmission and Condom Use........................................................................66 Sexual Behaviour Related to HIV Transmission ..............................................................................70 Orphans and Vulnerable Children ......................................................................................................72 List of References...................................................................................................................................................75 Appendix A. Sample Design............................................................................................................................. A1 Appendix B. List of Personnel Involved in the Survey ................................................................................ A8 Appendix C. Estimates of Sampling Errors.................................................................................................. A11 Appendix D. Data Quality Tables .................................................................................................................. A20 Appendix E. MICS Indicators: Numerators and Denominators............................................................... A29 Appendix F. Questionnaires............................................................................................................................ A35
vi
List of Tables
Table HH.1: Results of household and individual interviews............................................................... T1 Table HH.2: Household age distribution by sex ...................................................................................... T2 Table HH.3: Household composition......................................................................................................... T3 Table HH.4: Women's background characteristics .................................................................................. T4 Table HH.5: Children's background characteristics ................................................................................ T5 Table CM.1: Child mortality ........................................................................................................................ T6 Table CM.2: Children ever born and proportion dead ........................................................................... T6 Table NU.1: Child malnourishment........................................................................................................... T7 Table NU.2: Initial breastfeeding................................................................................................................ T8 Table NU.3: Breastfeeding ........................................................................................................................... T9 Table NU.4: Adequately fed infants......................................................................................................... T10 Table NU.5: Iodized salt consumption .................................................................................................... T11 Table NU.6: Children's vitamin A supplementation............................................................................. T12 Table NU.7: Post-partum mothers' vitamin A supplementation ........................................................ T13 Table NU.8: Low birth weight infants ..................................................................................................... T14 Table CH.1: Vaccinations in first year of life ......................................................................................... T15 Table CH.2: Vaccinations by background characteristics .................................................................... T16 Table CH.3: Neonatal tetanus protection................................................................................................ T17 Table CH.4: Oral rehydration treatment ................................................................................................. T18 Table CH.5: Home management of diarrhoea ...................................................................................... T19 Table CH.6: Care seeking for suspected pneumonia ............................................................................ T20 Table CH.7: Antibiotic treatment of pneumonia ................................................................................... T21 Table CH.7A: Knowledge of the two danger signs of pneumonia........................................................ T22 Table CH.8: Solid fuel use.......................................................................................................................... T23 Table CH.9: Solid fuel use by type of stove or fire ................................................................................ T24 Table CH.10: Availability of insecticide treated nets .............................................................................. T25 Table CH.11: Children sleeping under bednets ....................................................................................... T26 Table CH.12: Treatment of children with anti-malarial drugs.............................................................. T27 Table CH.13: Intermittent preventive treatment for malaria................................................................. T29 Table EN.1: Use of improved water sources ......................................................................................... T30 Table EN.1b: Use of unimproved water sources .................................................................................... T31 Table EN.2: Household water treatment ............................................................................................... T32 Table EN.3: Time to source of water ....................................................................................................... T34 Table EN.4: Person collecting water ....................................................................................................... T35 Table EN.5: Use of sanitary means of excreta disposal ........................................................................ T36 Table EN.6: Disposal of child's faeces ..................................................................................................... T38 Table EN.7: Use of improved water sources and improved sanitation ............................................ T39 Table RH.1: Use of contraception............................................................................................................. T40 Table RH.2: Antenatal care provider ....................................................................................................... T42 Table RH.3: Antenatal care Content ........................................................................................................ T43 Table RH.4: Assistance during delivery.................................................................................................. T44 Table RH.5: Maternal mortality ratio....................................................................................................... T45 Table CD.1: Family support for learning ................................................................................................ T46 Table CD.2: Learning materials ................................................................................................................ T47 Table CD.3: Children left alone or with other children........................................................................ T48 Table ED.1: Early childhood education .................................................................................................. T49 Table ED.2: Primary school entry ............................................................................................................ T50 Table ED.3: Primary school net attendance ratio .................................................................................. T51 Table ED.4: Secondary school net attendance ratio.............................................................................. T52 Table ED 4W Secondary school age children attending primary school ............................................ T53
vii
Table ED.5: Children reaching grade 5 ................................................................................................... T54 Table ED.6: Primary school completion and transition to secondary education ............................ T55 Table ED.7: Education gender parity ...................................................................................................... T56 Table ED.8: Adult literacy......................................................................................................................... T57 Table CP.1: Birth registration ................................................................................................................... T58 Table CP.2: Child labour ........................................................................................................................... T59 Table CP.3: Labourer students and student labourers ........................................................................ T60 Table CP.4: Child discipline ..................................................................................................................... T61 Table CP.5: Early marriage and polygyny............................................................................................. T62 Table CP.6: Spousal age difference.......................................................................................................... T63 Table CP.7: Membership in secret societies ........................................................................................... T64 Table CP.8: Membership in secret societies among daughters .......................................................... T65 Table CP.8A: Membership in secret societies among daughters .......................................................... T66 Table CP.9: Attitudes toward domestic violence.................................................................................. T67 Table CP.10: Child disability ...................................................................................................................... T68 Table HA.1: Knowledge of preventing HIV transmission ................................................................... T69 Table HA.2: Identifying misconceptions about HIV/AIDS................................................................. T70 Table HA.3: Comprehensive knowledge of HIV/AIDS transmission............................................... T71 Table HA.4: Knowledge of mother-to-child HIV transmission........................................................... T72 Table HA.5: Attitudes toward people living with HIV/AIDS............................................................ T73 Table HA.6: Knowledge of a facility for HIV testing ............................................................................ T74 Table HA.7: HIV testing and counselling coverage during antenatal care ....................................... T75 Table HA.8: Sexual behaviour that increases risk of HIV infection.................................................... T76 Table HA.9: Condom use at last high-risk sex ....................................................................................... T77 Table HA.10: Children's living arrangements and orphanhood........................................................... T78 Table HA.11: Prevalence of orphanhood and vulnerability among children..................................... T79 Table HA.12: School attendance of orphaned and vulnerable children .............................................. T80 Table HA.13: Support for children orphaned and vulnerable due to AIDS ....................................... T81 Table HA.14: Malnutrition among orphans and vulnerable children.................................................. T82 Table HA.15: Sexual behaviour among young women by orphanhood and vulnerability status due to AIDS................................................................................ T82
viii
List of Figures
Figure HH.1: Age and sex distribution of household population .............................................................7 Figure CM.1: Under-5 mortality rates by background and demographic characteristics ...................11 Figure NU.1: Percentage of children under-5 who are undernourished................................................14 Figure NU.2: Percentage of mothers who started breastfeeding within one hour and within one day
of birth........................................................................................................................................15 Figure NU.3: Infant feeding patterns by age: Percent distribution of children aged under 3 years by
feeding pattern and age group ..............................................................................................16 Figure NU.4: Percentage of households consuming adequately iodized salt .......................................19 Figure NU.5: Percentage of infants weighing less than 2500 grams at birth .........................................23 Figure CH.1: Percentage of children aged 12-23 months who received the recommended
vaccinations by 12 months .....................................................................................................25 Figure CH.2: Percentage of women with a live birth in the last 12 months who are protected
against neonatal tetanus .........................................................................................................28 Figure CH.3: Percentage of children aged 0-59 months with diarrhoea who received oral
rehydration treatment ............................................................................................................30 Figure CH.4: Percentage of children aged 0-59 months with diarrhoea who received ORT or
increased fluids, AND continued feeding ...........................................................................31 Figure EN.1: Percentage distribution of household members by source of drinking water..............38 Figure HA.1: Percent of women who have comprehensive knowledge of HIV/AIDS transmission
.....................................................................................................................................................69 Figure HA.2: Sexual behaviour that increases risk of HIV infection.......................................................72
ix
List of Abbreviations
AIDS Acquired Immune Deficiency Syndrome ANC Antenatal care ARI Acute respiratory infection BCG Bacillus-Cereus-Geuerin (Tuberculosis) CBIMCI Community-Based Integrated Management of Childhood Illnesses DD Diarrhoeal disease DPT Diphtheria Pertussis Tetanus EA Enumeration area ECD Early child development EPI Expanded Programme on Immunization FGC Female genital cutting GoSL Government of Sierra Leone HIV Human Immunodeficiency Virus IDD Iodine deficiency disorders IMCI Integrated Management of Childhood Illnesses IMR Infant mortality ratio IPT Intermittent preventive treatment (for malaria) ITN Insecticide-treated net IUD Intrauterine device LAM Lactational amenorrhea method LBW Low birth weight MDG Millennium Development Goals MICS Multiple Indicator Cluster Survey MMR Maternal mortality ratio MoH Ministry of Health MTCT Mother-to-child transmission NAR Net attendance rate NGO Non-governmental Organization ORS Oral rehydration solution ORT Oral rehydration therapy OPV Oral polio vaccine OVC Orphans and vulnerable children PMTCT Prevention of mother-to-child transmission ppm Parts per million PPVAS Postpartum vitamin A supplementation PRSP Poverty Reduction Strategy Paper RHF Recommended home fluid SBA Skilled birth attendant SPSS Statistical Package for Social Sciences SSL Statistics Sierra Leone STI Sexually transmitted infection TT Tetanus toxoid UFMR Under-five mortality rate UNAIDS United Nations Programme on HIV/AIDS UNDP United Nations Development Programme UNFPA United Nations Population Fund UNGASS United Nations General Assembly Special Session on HIV/AIDS UNICEF United Nations Children’s Fund VAS Vitamin A supplementation WCA Western and Central Africa WFFC World Fit For Children WHO World Health Organization
x
Acknowledgements
The people of Sierra Leone are acknowledged for the time they gave to provide information to surveyors and for the hospitality they showed towards survey personnel. The surveyors and their supervisors are acknowledged for their diligence and hard work, particularly while accessing hard-to-reach areas in the field by foot. Colleagues in the UNICEF regional and headquarters offices and the external consultant are acknowledged for their contributions to the design and conduct of the MICS3 survey and the production of the survey report. The MICS3 survey would not have achieved success without the support of many partner institutions and their dedicated personnel. Statistics Sierra Leone and UNICEF Sierra Leone acknowledge the following organizations and agencies for logistical and/or technical support that they provided to the MICS3 survey: Government of Sierra Leone Ministry of Development and Economic Planning Ministry of Education, Science and Technology Ministry of Energy and Power (Water Division) Ministry of Health and Sanitation Ministry of Information and Broadcasting Ministry of Local Government and Rural Development Ministry of Women, Gender and Children’s Affairs United Nations Agencies FAO UNFPA UNHCR WHO Non-governmental organizations Action Aid-Sierra Leone Christian Children’s Fund (CCF) Christian Health Association of Sierra Leone (CHASL) World Vision
xi
Executive Summary
The 2005 Sierra Leone Multiple Indicator Cluster Survey (MICS3) is a nationally representative survey of households, women, and children. The main objectives of the survey are (i) to provide current information for assessing the present situation of women and children in Sierra Leone; (ii) to produce data to monitor progress toward the achievement of targets and goals that include the Millennium Development Goals (MDGs); and, (iii) to contribute to the improvement of data and monitoring systems in Sierra Leone. Interviews were successfully completed in 7,078 households drawn from all districts of Sierra Leone. The main results from the survey are summarized below. Child Mortality
The MICS3 survey measured child mortality by using a methodology that produced retrospective estimates of the infant mortality rate (IMR) and under-five mortality rate (UFMR). The survey estimated the IMR to be 158 per 1000 and the UFMR to be 267 per 1000 with 2002 as the reference year. These estimates are little changed from those generated during the MICS2 survey in 2000 that produced estimates for 1997. It appears that child mortality in Sierra Leone has not decreased substantially between 1997 and 2002—although perhaps it should not have been expected to, given the conflict that was raging in the republic during that time. Nutrition
Nutritional Status Thirty percent of children under age five in Sierra Leone are underweight or too thin for their age. Forty percent of children are stunted or too short for their age, while nine percent are wasted, or too thin for their height. The prevalence of undernourished children in Sierra Leone has increased modestly since 2000 and is slightly higher than norms in West and Central Africa. Breastfeeding Only 33 percent of newborns are given breastmilk within one hour of birth while a mere eight percent of children less than four months of age are exclusively breastfed. Fifty-two percent of children aged 6-9 months receive breast milk and solid or semi-solid foods. Continued breastfeeding rates are 88 and 57 percent among children 12-15 months and 20-23 months of age, respectively. All indicators except for continued breastfeeding fall well short of desired levels. Salt Iodization The percentage of households that consume adequately iodized salt in Sierra Leone has doubled in the past five years as 45 percent of households now consume salt that is adequately iodized. The lack of in-country facilities to iodize salt continues to hamper efforts to achieve universal salt iodization in Sierra Leone. Vitamin A Supplementation Forty-nine percent of children aged 6-59 months received a high dose vitamin A supplement during the six months prior to the MICS3 survey. The ten percent drop in the level of this indicator since 2000 is attributed to the termination of national vitamin A supplementation
xii
(VAS) campaigns and incorporation of VAS into the routine health services. VAS coverage among postpartum women has improved markedly during the past five years and is now estimated at 55 percent. Low Birth Weight The prevalence of low birth weight (LBW) infants was estimated to be 24 percent in the MICS3, a level that is well above the regional norm of 15 percent. Child Health
Immunization Eighty-four percent of children aged 12-23 months were found to have received BCG vaccination by their first birthday. Vaccination coverage for these same children at age 12 months was 56 percent for DPT3, 57 percent for OPV3, 63percent for measles, and 61 percent for yellow fever. Only 35 percent of children received all recommended vaccinations by their first birthday. Comparison of these findings with MICS2 results shows that clear gains have been made in improving vaccination status of children in Sierra Leone during the past five years. Vaccination coverage in Sierra Leone is 8 to 21 percent above regional norms, suggesting that the EPI program is a relatively strong component of the health system in Sierra Leone. Vaccination rates are still far short of the UNICEF goal of 90 percent of children fully immunized at one year of age. Tetanus Toxoid Seventy-five percent of surveyed women who gave birth during the year prior to the MICS3 survey received at least two doses of tetanus toxoid (TT) vaccine during their pregnancy while an additional three percent were protected against neonatal tetanus due to previous TT vaccinations. This encouraging result represents a twenty percent increase in TT coverage over the past five years and is much higher than the regional norm. Oral Rehydration Treatment Approximately 60 percent of children with diarrhoea received either oral rehydration solution (ORS) and/or a recommended home fluid—a 26 percent decrease compared to the MICS2 result. Thirty-one percent of children with diarrhoea received home treatment as recommended: that is, they either received ORT or increased their fluid intake, while continuing feeding at the same time. Shortages in the supply of packaged ORS, on which Sierra Leonean caretakers appear to be over-reliant, may have been contributed to these results, along with low levels of awareness and knowledge among household members regarding the need for children to continue taking fluids and food while ill with diarrhoea. Care Seeking and Antibiotic Treatment of Pneumonia Forty-eight percent of surveyed children with suspected pneumonia during the two weeks preceding the survey were taken to an appropriate provider while only 21 percent were treated with an antibiotic. Just 14 percent of surveyed mothers knew the two key danger signs of pneumonia—fast and difficult breathing. Care for pneumonia is highly inequitable: children living in the poorest areas of the country, in the poorest households, and in households where the education level is the lowest, have the lowest access to services and antibiotics.
xiii
Solid Fuel Use Households in Sierra Leone make nearly universal (99 percent) use of solid fuels—primarily wood—for cooking purposes. Stoves that limit indoor pollution that are used in Sierra Leone include closed stoves with chimneys (used by less than one percent of households) and open stoves with chimneys or hoods (used by nine percent of households). Malaria MICS3 findings indicate that five percent of children under the age of five slept under an insecticide-treated mosquito net (ITN) the night prior to the survey while 20 percent slept under either an ITN or an untreated net. One-third of surveyed children were ill with fever in the two weeks prior to the MICS3. Among these children, 45 percent were treated with an appropriate anti-malarial drug within 24 hours of onset of symptoms and an additional 7 percent were treated at a later time. These findings suggest that caretakers of children in Sierra Leone emphasize a curative, rather than preventive, approach to malaria control. Environment
Water and Sanitation The MICS3 estimates of the Sierra Leonean population’s access to improved sources of drinking water (47 percent) and improved sanitation facilities (30 percent) are lower than previous estimates. Enumerators were carefully trained on the different definitions of improved water and sanitation facilities and may have collected more accurate data than have been collected in the past. In addition, the low estimates may be due to a gradual population movement from urban areas (where improved sources are more readily available) to rural locations following the end of the conflict in 2002. Only 24 percent of households have both an improved source of drinking water and improved sanitation facilities. Differences in the level of this indicator vary widely among provinces, ranging from 13 percent in the North to 63 percent in the Western Area. Reproductive Health
Contraception Current use of modern contraception was reported by four percent of surveyed women who were married or in union while one percent reported using a traditional method. The only methods with a notable level of use are the pill and injections. The prevalence of contraceptive-use in Sierra Leone even lags behind the low norms of the region (17 percent), suggesting that adequate efforts have not been made in Sierra Leone to promote contraception. Antenatal Care Eighty-one percent of pregnant women in Sierra Leone receive antenatal care from a skilled health provider (i.e., a doctor, nurse, or midwife) at least once during their pregnancies. The utilization of antenatal care is approximately 15 percentage points higher than regional estimates and the MICS2 estimate from 2000. Assistance at Delivery About 43 percent of births in Sierra Leone that occurred in the year prior to the MICS3 survey were delivered by skilled personnel—that is, a doctor, nurse, or midwife. This level of utilization, which is highest in the Western Area at 83 percent and lowest in the Northern province at 25 percent, remains unchanged since last measured in 2000 and is in line with
xiv
the regional value of 45 percent. Nineteen percent of deliveries in Sierra Leone take place in health facilities. Maternal Mortality Ratio The MMR in Sierra Leone was measured in the MICS3 using the indirect sisterhood method and estimated to be 457 maternal deaths per 100,000 live births. While this estimate of the MMR is substantially lower than the MICS2 estimate of 1,800 deaths per 100,000 live births, caution should be exercised while drawing conclusions from the comparison of these estimates due to the low precision of the estimates and the different methodologies used to calculate them. Child Development
An adult engaged in at least five activities that promote learning and school readiness during the three days preceding the survey for two-thirds of surveyed under-five children. The same percentage of children engaged in these activities at least one time with their fathers during the same time period. Twenty-nine percent of children live in households where at least three non-children’s books are present while only 11 percent live in households where at least three children’s books are found. Fifty-two percent of children aged 0-59 months had three or more playthings to play with in their homes. Twenty percent of children aged 0-59 months were left in the care of other children under ten years of age during the week preceding the interview while six percent of children were left alone. Education
Pre-School Attendance and School Readiness Thirteen percent of children aged 3-4 years attend pre-school. Among children who were aged six years and also attended the first grade of primary school at the time of the survey, merely seven percent attended pre-school the previous year. These levels represent a decrease from MICS2 estimates, suggesting a decline in the use of pre-school in Sierra Leone. Primary and Secondary School Participation School attendance in Sierra Leone among children of primary school age has increased notably during the past five years and now stands at 69 percent. Forty-eight percent of children in Sierra Leone begin to attend primary school at the stipulated school entry age (six years), foreshadowing the delayed educational status of many children. Ninety-two percent of children who enter the first grade of primary school eventually reach grade five. Many children leave school at this point; only 52 percent of children who successfully complete the last grade of primary school attend the first year of secondary school the following year. The picture regarding secondary education in Sierra Leone is much bleaker. Only 19 percent of children of secondary school age (12-17 years) attend secondary school while 46 percent attend primary school when they should be attending secondary school. The ratio of girls to boys attending primary school at the national level is 1.01. However, the indicator drops to 0.78 for secondary education. Adult Literacy The MICS3 found that 25 percent of women in Sierra Leone aged 15-24 are literate—well below the regional norm. A woman’s literacy status is positively associated with urban residence, higher levels of education, and higher household wealth.
xv
Child Protection
Birth Registration Just under half of the births of children under five years of age in Sierra Leone have been registered, a level identical to that found in the MICS2 survey in 2000. There are no significant variations in birth registration across gender or age categories. Child Labour The MICS3 survey found that 48 percent of children aged 5-14 years in Sierra Leone perform child labour. Forty-one percent work for a family business while only two percent work on household chores for more than 28 hours per week. Some child protection specialists in Sierra Leone question the accuracy of the latter estimate. The percentage of children who perform child labour is equal among students (45 percent) and all children (48 percent). Sixty-eight percent of all children aged 5-14 attend school while 64 percent of children aged 5-14 who work also attend school, indicating that child labourers and non-labourers have equal access to school-based education. Child Discipline MICS3 findings clearly illustrate the punitive nature of child discipline techniques that are practiced in Sierra Leone. Ninety-two percent of children aged 2-14 years were subjected to at least one form of psychological or physical punishment by a household member during the month preceding the survey. Twenty-two percent of children experienced severe physical punishment while 76 percent received minor physical punishment. Fifty-six percent of surveyed caretakers stated that children should be punished physically. Early Marriage and Polygyny Early marriage, polygyny, and large spousal age differences are common in Sierra Leone. Twenty-seven percent of women aged 15-49 marry before fifteen years of age. The level of this indicator is lowest (15 percent) among women currently aged 15-19 years, suggesting that this practice is decreasing. Sixty-two percent of surveyed women aged 15-49 married before eighteen years of age. Forty-three percent of women who are currently married or in union report that their husband/partner has another wife. Among women aged 15-19 who are married or in union, 58 percent are with a man who is senior to them by ten or more years. Membership in Secret Societies The practice of female genital cutting (FGC) is deeply entrenched in societal norms in Sierra Leone, where it is conducted as an initiation rite by the secret Bondo Society. Given the secrecy that surrounds FGC, it was decided to use “membership in the Bondo Society” as a proxy for “have undergone FGC” in the MICS3 survey. Ninety-four percent of women aged 15-49 stated that they belong to the Bondo Society, which is interpreted to mean that the prevalence of FGC among this population is approximately 94 percent. Thirty-four percent of mothers reported that their daughters had been initiated into the Bondo Society. Domestic Violence Women aged 15-49 years were asked whether husbands are justified in hitting or beating their wives or partners under five different scenarios. Women who agree that their partners are justified in beating them tend to themselves be victims of domestic violence. For each of the five situations that were described, over half of the respondents said that beating is justified; the percent who felt so ranged from 54 percent for “if she burns the food” to 74
xvi
percent for “if she neglects the children.” A full 85 percent of respondents felt that beating was justified under one or more of the scenarios. Child Disability A series of questions was asked to assess the prevalence of nine disabilities including sight impairment, deafness, and difficulties with speech in children aged two to nine years. Caretakers reported that 23 percent of their children suffer from at least one of the nine disabilities. This rate is higher than expected and should be confirmed through further research. HIV/AIDS, Sexual Behaviour, and Orphaned and Vulnerable Children
Knowledge of HIV Transmission and Utilization of HIV Testing Services Only 17 percent of young women aged 15-24 years have “comprehensive correct knowledge of HIV”: that is, they correctly identify two ways of avoiding HIV infection and reject three common misconceptions about HIV transmission. Two-thirds of women aged 15-49 years have heard of AIDS. Sixty-three percent of respondents know that HIV can be transmitted from mother to child while 54 percent know all three ways that transmission can occur. Ninety-five percent of respondents agreed with at least one of four discriminatory statements regarding people living with HIV/AIDS (PLHA), a sign of high levels of discrimination towards PLHA. Only 16 percent of women could identify a HIV test site while six percent reported that they have been tested for HIV. Among respondents who received ANC from a trained provider during their pregnancy, 51 percent were provided with information about HIV prevention during the ANC visit. Seven percent of these same respondents were tested for HIV during an ANC visit while five percent received the results of their HIV test at an ANC visit. Sexual Behaviour Related to HIV Transmission Young women in Sierra Leone are at substantial risk of contracting HIV. Two in five sexually active women aged 15-24 report having engaged in high-risk sex during the year prior to the survey; among those women, only one in five reports that a condom was used during sex with the high-risk partner. Twenty-five percent of girls aged 15-19 first had sex before 15 years of age. Thirty-nine percent of women aged 15-24 stated that they had sex in the 12 months preceding the survey with a man who was ten or more years their senior, a practice that increases their risk of contracting HIV. Orphans and Vulnerable Children The MICS3 survey found that 11 percent of children aged 0-17 years are orphans (i.e., one or both parents dead) while 20 percent do not live with a biological parent. Twenty-seven percent of children aged 0-17 in Sierra Leone are classified as orphans or vulnerable children (OVC)1. Only one percent of households that provide care to OVC report receiving support from the government or outside agencies for their efforts. While the survey found that there is little or no difference in the nutritional status between OVC and non-OVC, girl OVC were found to be more likely to be sexually exploited than girls who are not OVC. Double-orphans—that is, children aged 10-14 years who have lost both parents—were found to be
1 OVC is defined as children under age 18 who are either (i) orphans; (ii) have a chronically ill parent; (iii) live in a household where an adult aged 18-59 years has died in the past year; or, (iv) live in a household where an adult aged 18-59 years has been chronically ill in the past year.
xvii
disadvantaged compared to children who are not orphans with respect to their access to educational opportunities.
1
I. Introduction
Background This report is based on the Sierra Leone Multiple Indicator Cluster Survey that was conducted in 2005 by Statistics Sierra Leone with financial and technical support from UNICEF Sierra Leone. The survey provides valuable information on the situation of children and women in Sierra Leone and was based, in large part, on the need to monitor progress towards goals and targets emanating from recent international agreements: the Millennium Declaration that was adopted by all 191 United Nations Member States in September 2000 and the Plan of Action of A World Fit For Children that was adopted by 189 Member States at the United Nations Special Session on Children in May 2002. Both of these commitments build upon promises made by the international community at the 1990 World Summit for Children. In signing these international agreements, governments committed themselves to realize the rights of children enshrined in them, improve conditions for children and to monitor progress towards these ends. UNICEF was assigned a supporting role in this task (see box below).
A Commitment to Action: National and International Reporting Responsibilities The governments that signed the Millennium Declaration and the World Fit for Children Declaration and Plan of Action also committed themselves to monitor progress towards the goals and objectives they contained: “We will monitor regularly at the national level and, where appropriate, at the regional level and assess progress towards the goals and targets of the present Plan of Action at the national, regional and global levels. Accordingly, we will strengthen our national statistical capacity to collect, analyse and disaggregate data, including by sex, age and other relevant factors that may lead to disparities, and support a wide range of child-focused research. We will enhance international cooperation to support statistical capacity-building efforts and build community capacity for monitoring, assessment and planning.” (A World Fit for Children, paragraph 60) “…We will conduct periodic reviews at the national and sub-national levels of progress in order to address obstacles more effectively and accelerate actions.…” (A World Fit for Children, paragraph 61) The Plan of Action (paragraph 61) also calls for the specific involvement of UNICEF in the preparation of periodic progress reports: “… As the world’s lead agency for children, the United Nations Children’s Fund is requested to continue to prepare and disseminate, in close collaboration with Governments, relevant funds, programmes and the specialized agencies of the United Nations system, and all other relevant actors, as appropriate, information on the progress made in the implementation of the Declaration and the Plan of Action.” Similarly, the Millennium Declaration (paragraph 31) calls for periodic reporting on progress: “…We request the General Assembly to review on a regular basis the progress made in implementing the provisions of this Declaration, and ask the Secretary-General to issue periodic reports for consideration by the General Assembly and as a basis for further action.”
2
The Government of Sierra Leone (GoSL), in collaboration with its development partners, is implementing several policies and strategies aimed at achieving national and international goals. The GoSL has recently developed its Poverty Reduction Strategy, the main goals of which are in line with the Millennium Development Goals (MDGs). MICS3 has been identified as a major effort to generate valid and reliable data and information that will be used to monitor key indicators that are being tracked by the GoSL to ensure the realization of major international commitments that include World Fit for Children (WFFC) goals, the Millennium Development Goals (MDGs), the UNGASS on HIV/AIDS, and the Abuja targets for malaria. Roughly 20 of the 48 MDG indicators have been estimated in the MICS3, offering the largest single source of data for MDG monitoring. The MICS3 effort will also contribute to the development of a monitoring and evaluation system for Sierra Leone’s Poverty Reduction Strategy and the United Nations Development Framework (UNDAF). This final report presents indicator estimates for the different topics covered in the survey. Survey Objectives The 2005 Sierra Leone Multiple Indicator Cluster Survey has the following primary objectives: 1. To provide up-to-date information for assessing the situation of children and women in
Sierra Leone; 2. To furnish data needed for monitoring progress toward goals established by the
Millennium Development Goals and the goals of A World Fit For Children (WFFC) as a basis for future action;
3. To contribute to the improvement of data and monitoring systems in Sierra Leone and to
strengthen technical expertise in the design and implementation of these systems and analysis of the information they generate.
3
II. Sample and Survey Methodology
Sample Design The sample for the 2005 Sierra Leone MICS3 Survey was designed to provide estimates of MICS3 indicators at the national level, for urban and rural areas, and for the four provinces. —Northern, Southern, Eastern and Western Areas. The sample was selected in two stages using a stratified cluster sampling methodology. In the first stage, 320 enumeration areas (EAs) were selected, using probability proportional to size methodology, through systematic sampling from a sample frame of all EAs in Sierra Leone that was ordered by province and, within provinces, by district. Using the comprehensive EA-level household lists that had been developed in the 2004 Sierra Leone national census, a random sample of 25 households was drawn within each of the 320 selected EAs to yield an overall sample of 8,000 households. A household was defined as “a group of people who all eat from the same pot”. The resulting sample was theoretically self-weighting, although sample weights have been employed to adjust for minor variations among provinces and rural/urban EAs with regards to the proportion of households, women, and children for whom the MICS3 interview was completed among sampled households found to be occupied and the eligible women and children who lived in them. Questionnaires Three questionnaires were used in the survey: the Household Questionnaire, the Questionnaire for Individual Women, and the Questionnaire for Children under Five. The questionnaires were based on the MICS3 model questionnaires. Within each interviewed household, the Household Questionnaire was used to collect information about all de jure household members, the household and the dwelling. The respondent for this questionnaire was the head-of-household or another adult who lived in the household. This questionnaire included the following modules:
o Household listing o Education o Water and sanitation o Household characteristics o Insecticide treated bednets o Support to children orphaned and made vulnerable by HIV/AIDS o Child labour o Child discipline o Child disability o Maternal mortality o Salt iodization
The Questionnaire for Individual Women was administered in each household to all women aged 15-49 years living in the households. This questionnaire included the following modules:
o Child mortality
4
o Tetanus toxoid o Maternal and newborn health o Marriage/Union o Contraception o Female secret society (i.e., genital cutting) o Domestic violence o Sexual behaviour o HIV/AIDS
The Questionnaire for Children Under Five was administered to mothers or caretakers of children under 5 years of age2 living in surveyed households. Normally, the questionnaire was administered to mothers of under-5 children; in cases when the mother was not listed in the household roster, a primary caretaker for the child was identified and interviewed. This questionnaire included the following modules:
o Birth registration and early learning o Child development o Vitamin A o Breastfeeding o Care of illness o Malaria o Immunization o Anthropometry
English is the only written language in Sierra Leone; for this reason, questionnaires were written in English and verbally translated by enumerators into the language preferred by the respondent (generally Krio, Timne, Mende or Limba), using standardized, pre-tested key words. The questionnaires were pre-tested in the Western Area in September 2005. Based on the results of the pre-test, modifications were made to the wording of the questions, the response categories, and the key words. The Sierra Leone MICS questionnaires can be found in Appendix F. In addition to the administration of questionnaires, fieldwork teams tested the salt used for cooking in the households for iodine content and measured the weights and heights of children age under 5 years. Details and findings of these measurements are provided in the respective sections of the report. Training and Fieldwork Fourteen supervisors and sixty-one enumerators were trained for ten days in early October 2005. Training included lectures on interviewing techniques and the contents of the questionnaires and mock interviews between trainees to gain practice in asking questions. During the training period, trainees spent three days conducting practice interviews in Freetown and rural parts of the Western Area.
2 The terms “children under 5”, “children age 0-4 years”, and “children aged 0-59 months” are used interchangeably in this report.
5
The data were collected by fourteen teams, each composed of one or two female enumerators, two or three male enumerators, one driver and a supervisor. The fieldwork began in October 2005 and concluded in November 2005. Data Processing Completed questionnaires were checked in the field by supervisors and then transported to Freetown, where data entry personnel checked each questionnaire to make sure that it had been clearly and correctly completed. Data were entered on 30 microcomputers by 30 data entry operators and two data entry supervisors using CSPro software. In order to ensure quality control, all questionnaires were double-entered and internal consistency checks were performed. Procedures and standard programs developed using CSPro software under the global MICS3 project and adapted to the Sierra Leone questionnaire were used throughout. Data entry and processing began in November 2005 and were completed in April 2006. Data were analysed using the Statistical Package for Social Sciences (SPSS) software program, Version 14, and the model syntax and tabulation plans developed for by UNICEF for this purpose.
6
III. Sample Coverage and the Characteristics of Households and Respondents
Sample Coverage Of the 8,000 households selected for the sample, only 7,125 were found to be occupied. This surprisingly low rate of occupation is due to the following reasons: 1. The sample frame of households that was used to randomly select 25 households in each
selected EA contained many households that consisted of people who had returned to their original homes at the time of the census only for the purpose of being registered there (for political reasons). Once the census was completed, they moved back to their “real homes” elsewhere. Sub-optimal performance of the task of verifying the presence of all households sampled for the MICS3 survey compounded this problem and led to many houses being classified as “not found / destroyed” at the time of data collection.
2. Names and/or addresses on the lists of sampled households were at times not adequately descriptive to permit identification of the households.
3. Some households had, after the census, dissipated following the death of the head of household.
4. The diamond mining clusters in the Eastern province had household heads who were miners and had moved from their places of registration in search of new areas where diamonds could be found.
5. Sample frames in EAs in border villages along the Sierra Leone/Liberia border included households that had returned to Liberia for registration in their national elections.
6. During the verification of households, some communities did not provide accurate information on existing households, thinking that the households may benefit from possible humanitarian assistance after the MICS3 exercise. During data collection, such households did not meet the standard definition of households.
Of the 7,125 occupied households, 7,078 were successfully interviewed for a household response rate of 99.3 per cent. In the interviewed households, 9,257 eligible women (aged 15-49) were identified. Of these, 7,654 were successfully interviewed, yielding a response rate of 82.7 per cent. The response rate for the Questionnaire for Children Under Five was 88.9 per cent; mothers/caretakers of 5,246 children under five were successfully interviewed, from among 5,904 children under five who were identified in the interviewed households. Overall response rates of 82.1 percent and 88.3 percent are calculated for the women’s and under-5’s interviews, respectively (Table HH.1). These rates, however, vary widely by province. Response rates for women’s interviews range from 70 percent in the East to 97 percent in the Western Area. Similarly, rates for children’s interviews vary from 78 percent in the East to 99.6 percent in the Western Area. Response rates in the Western Area were higher than in other provinces due to increased accessibility to respondents. Call-backs were easy to conduct there as most of the households were in Freetown and enumerators were able to make as many visits as necessary—even at night—without hampering their travel schedule. Difficulty in making follow-up visits in other provinces was the primary reason for lower response rates. Response rates were especially low in Kailahun and Kono districts in the Eastern province. MICS3 supervisors
7
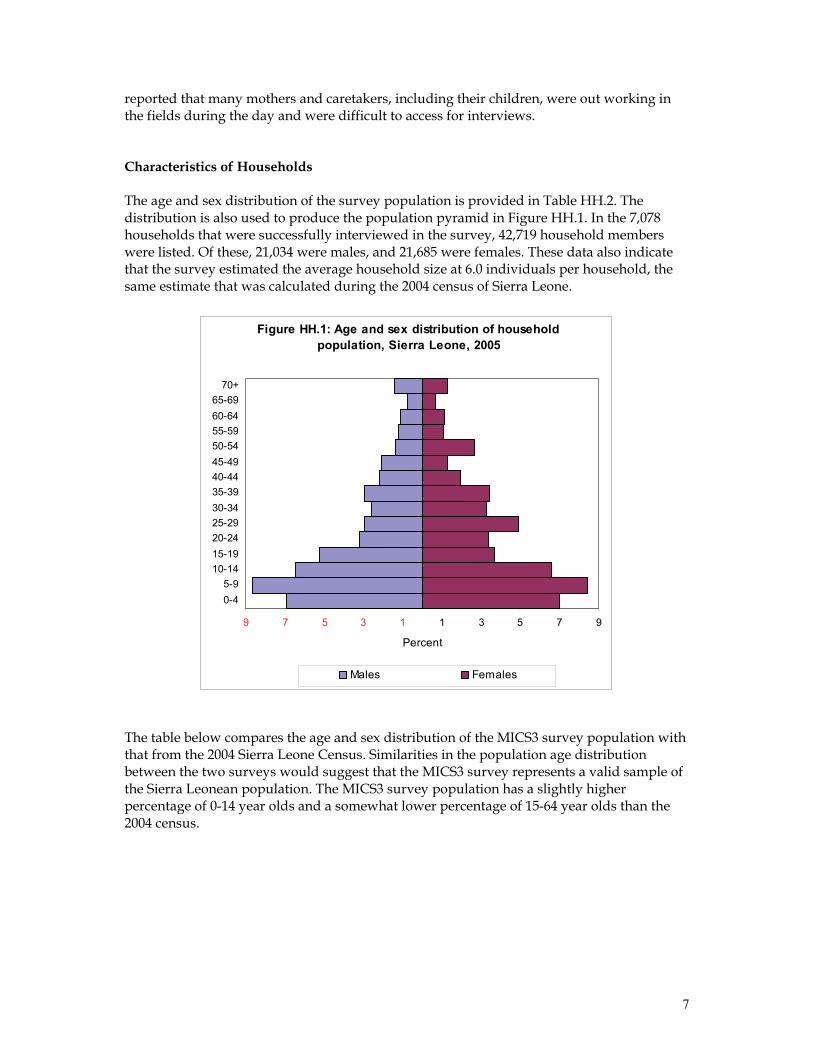
reported that many mothers and caretakers, including their children, were out working in the fields during the day and were difficult to access for interviews. Characteristics of Households The age and sex distribution of the survey population is provided in Table HH.2. The distribution is also used to produce the population pyramid in Figure HH.1. In the 7,078 households that were successfully interviewed in the survey, 42,719 household members were listed. Of these, 21,034 were males, and 21,685 were females. These data also indicate that the survey estimated the average household size at 6.0 individuals per household, the same estimate that was calculated during the 2004 census of Sierra Leone.
Figure HH.1: Age and sex distribution of household population, Sierra Leone, 2005
9 7 5 3 1 1 3 5 7 9
0-45-9
10-1415-1920-2425-2930-3435-3940-4445-4950-5455-5960-6465-69
70+
Percent
Males Females
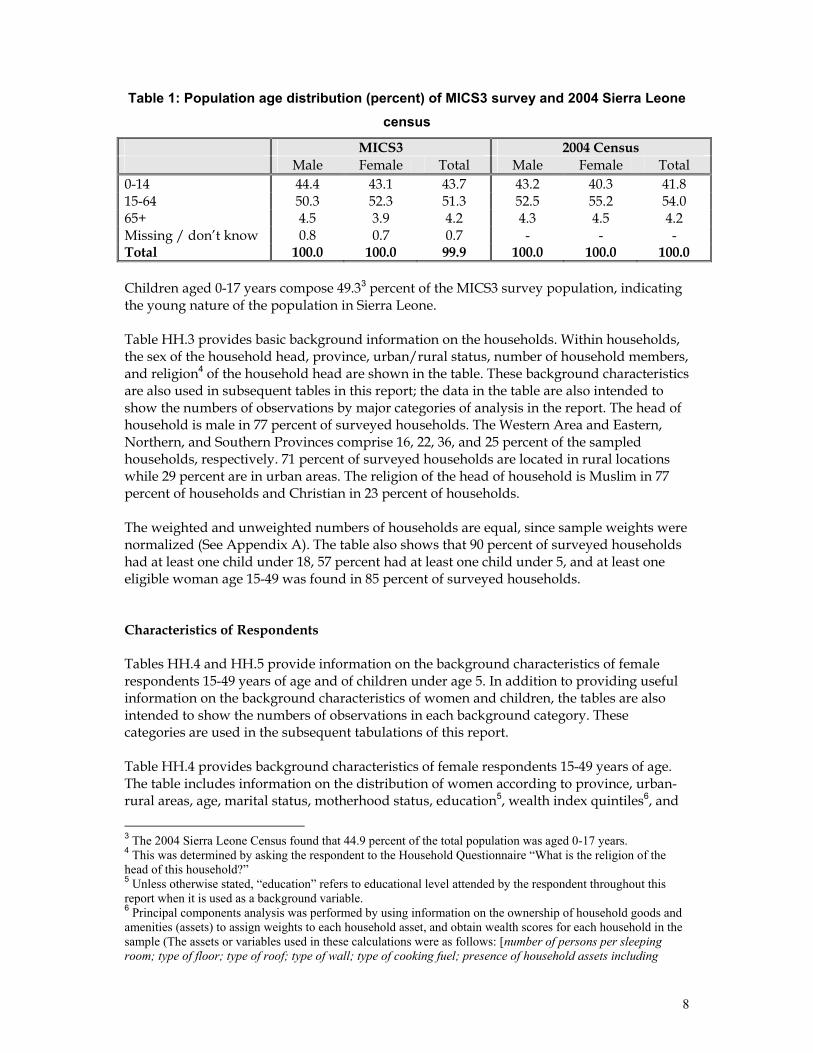
The table below compares the age and sex distribution of the MICS3 survey population with that from the 2004 Sierra Leone Census. Similarities in the population age distribution between the two surveys would suggest that the MICS3 survey represents a valid sample of the Sierra Leonean population. The MICS3 survey population has a slightly higher percentage of 0-14 year olds and a somewhat lower percentage of 15-64 year olds than the 2004 census.
8
Table 1: Population age distribution (percent) of MICS3 survey and 2004 Sierra Leone census
MICS3 2004 Census Male Female Total Male Female Total 0-14 44.4 43.1 43.7 43.2 40.3 41.8 15-64 50.3 52.3 51.3 52.5 55.2 54.0 65+ 4.5 3.9 4.2 4.3 4.5 4.2 Missing / don’t know 0.8 0.7 0.7 - - - Total 100.0 100.0 99.9 100.0 100.0 100.0 Children aged 0-17 years compose 49.33 percent of the MICS3 survey population, indicating the young nature of the population in Sierra Leone. Table HH.3 provides basic background information on the households. Within households, the sex of the household head, province, urban/rural status, number of household members, and religion4 of the household head are shown in the table. These background characteristics are also used in subsequent tables in this report; the data in the table are also intended to show the numbers of observations by major categories of analysis in the report. The head of household is male in 77 percent of surveyed households. The Western Area and Eastern, Northern, and Southern Provinces comprise 16, 22, 36, and 25 percent of the sampled households, respectively. 71 percent of surveyed households are located in rural locations while 29 percent are in urban areas. The religion of the head of household is Muslim in 77 percent of households and Christian in 23 percent of households. The weighted and unweighted numbers of households are equal, since sample weights were normalized (See Appendix A). The table also shows that 90 percent of surveyed households had at least one child under 18, 57 percent had at least one child under 5, and at least one eligible woman age 15-49 was found in 85 percent of surveyed households. Characteristics of Respondents Tables HH.4 and HH.5 provide information on the background characteristics of female respondents 15-49 years of age and of children under age 5. In addition to providing useful information on the background characteristics of women and children, the tables are also intended to show the numbers of observations in each background category. These categories are used in the subsequent tabulations of this report. Table HH.4 provides background characteristics of female respondents 15-49 years of age. The table includes information on the distribution of women according to province, urban-rural areas, age, marital status, motherhood status, education5, wealth index quintiles6, and
3 The 2004 Sierra Leone Census found that 44.9 percent of the total population was aged 0-17 years. 4 This was determined by asking the respondent to the Household Questionnaire “What is the religion of the head of this household?” 5 Unless otherwise stated, “education” refers to educational level attended by the respondent throughout this report when it is used as a background variable. 6 Principal components analysis was performed by using information on the ownership of household goods and amenities (assets) to assign weights to each household asset, and obtain wealth scores for each household in the sample (The assets or variables used in these calculations were as follows: [number of persons per sleeping room; type of floor; type of roof; type of wall; type of cooking fuel; presence of household assets including
9
religion of household head. 80 percent of sampled women are married or in union and 83 percent have given birth to at least one child. 74 percent of respondents are uneducated while 11 percent have completed primary education and 15 percent have completed secondary education. Some background characteristics of children under 5 are presented in Table HH.5. These include distribution of children by several attributes: sex, province and area of residence, age in months, mother’s or caretaker’s education, wealth, and religion of household head. 50.3 percent of the children represented in the MICS3 survey are female. The percentage of children aged 0, 1, 2, 3, and 4 years in the sample is 19, 21, 20, 23, and 17, respectively.
electricity supply, radio, TV, mobile phone, phone, refrigerator, watch, bicycle, motorcycle, cart, car, and boat; source of drinking water; and, type of sanitary facility]). Each household was then weighted by the number of household members, and the household population was divided into five groups of equal size, from the poorest quintile to the richest quintile, based on the wealth scores of households they were living in. The wealth index is assumed to capture the underlying long-term wealth through information on the household assets, and is intended to produce a ranking of households by wealth, from poorest to richest. The wealth index does not provide information on absolute poverty, current income or expenditure levels, and the wealth scores calculated are applicable for only the particular data set they are based on. Further information on the construction of the wealth index can be found in Rutstein and Johnson, 2004, and Filmer and Pritchett, 2001.
10
IV. Child Mortality
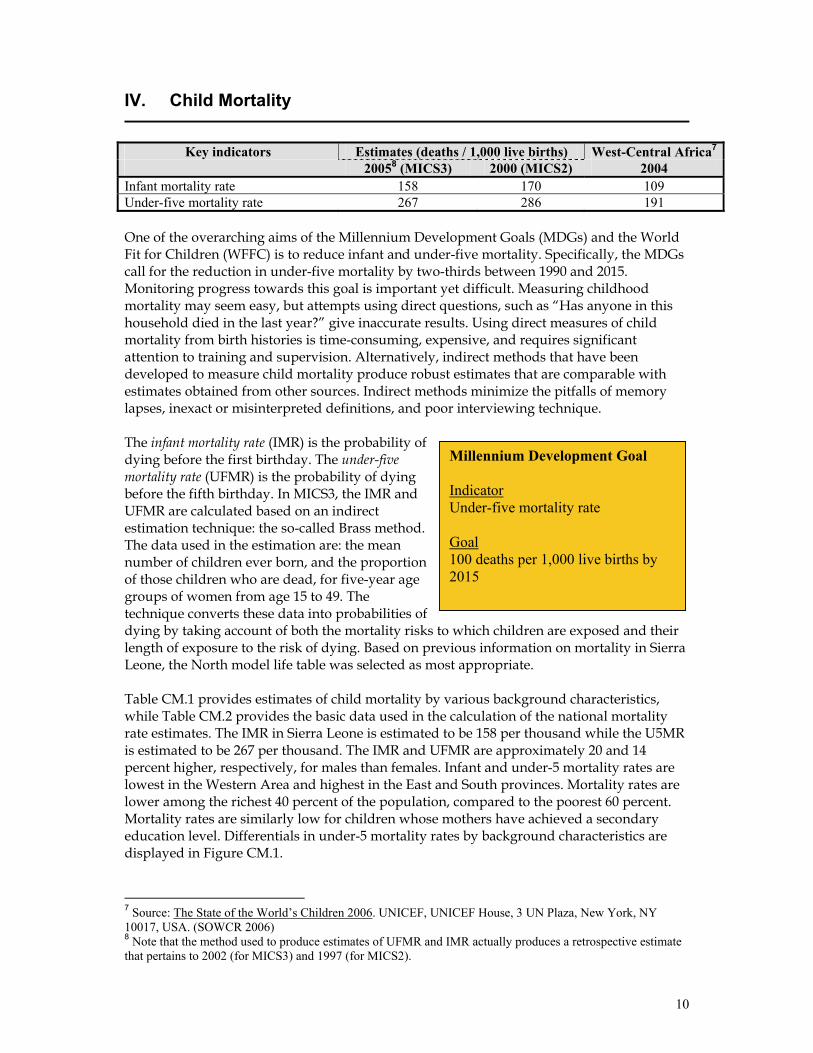
Key indicators Estimates (deaths / 1,000 live births) West-Central Africa7
20058 (MICS3) 2000 (MICS2) 2004 Infant mortality rate 158 170 109 Under-five mortality rate 267 286 191 One of the overarching aims of the Millennium Development Goals (MDGs) and the World Fit for Children (WFFC) is to reduce infant and under-five mortality. Specifically, the MDGs call for the reduction in under-five mortality by two-thirds between 1990 and 2015. Monitoring progress towards this goal is important yet difficult. Measuring childhood mortality may seem easy, but attempts using direct questions, such as “Has anyone in this household died in the last year?” give inaccurate results. Using direct measures of child mortality from birth histories is time-consuming, expensive, and requires significant attention to training and supervision. Alternatively, indirect methods that have been developed to measure child mortality produce robust estimates that are comparable with estimates obtained from other sources. Indirect methods minimize the pitfalls of memory lapses, inexact or misinterpreted definitions, and poor interviewing technique. The infant mortality rate (IMR) is the probability of dying before the first birthday. The under-five mortality rate (UFMR) is the probability of dying before the fifth birthday. In MICS3, the IMR and UFMR are calculated based on an indirect estimation technique: the so-called Brass method. The data used in the estimation are: the mean number of children ever born, and the proportion of those children who are dead, for five-year age groups of women from age 15 to 49. The technique converts these data into probabilities of dying by taking account of both the mortality risks to which children are exposed and their length of exposure to the risk of dying. Based on previous information on mortality in Sierra Leone, the North model life table was selected as most appropriate. Table CM.1 provides estimates of child mortality by various background characteristics, while Table CM.2 provides the basic data used in the calculation of the national mortality rate estimates. The IMR in Sierra Leone is estimated to be 158 per thousand while the U5MR is estimated to be 267 per thousand. The IMR and UFMR are approximately 20 and 14 percent higher, respectively, for males than females. Infant and under-5 mortality rates are lowest in the Western Area and highest in the East and South provinces. Mortality rates are lower among the richest 40 percent of the population, compared to the poorest 60 percent. Mortality rates are similarly low for children whose mothers have achieved a secondary education level. Differentials in under-5 mortality rates by background characteristics are displayed in Figure CM.1.
7 Source: The State of the World’s Children 2006. UNICEF, UNICEF House, 3 UN Plaza, New York, NY 10017, USA. (SOWCR 2006) 8 Note that the method used to produce estimates of UFMR and IMR actually produces a retrospective estimate that pertains to 2002 (for MICS3) and 1997 (for MICS2).
Millennium Development Goal Indicator Under-five mortality rate Goal 100 deaths per 1,000 live births by 2015
11
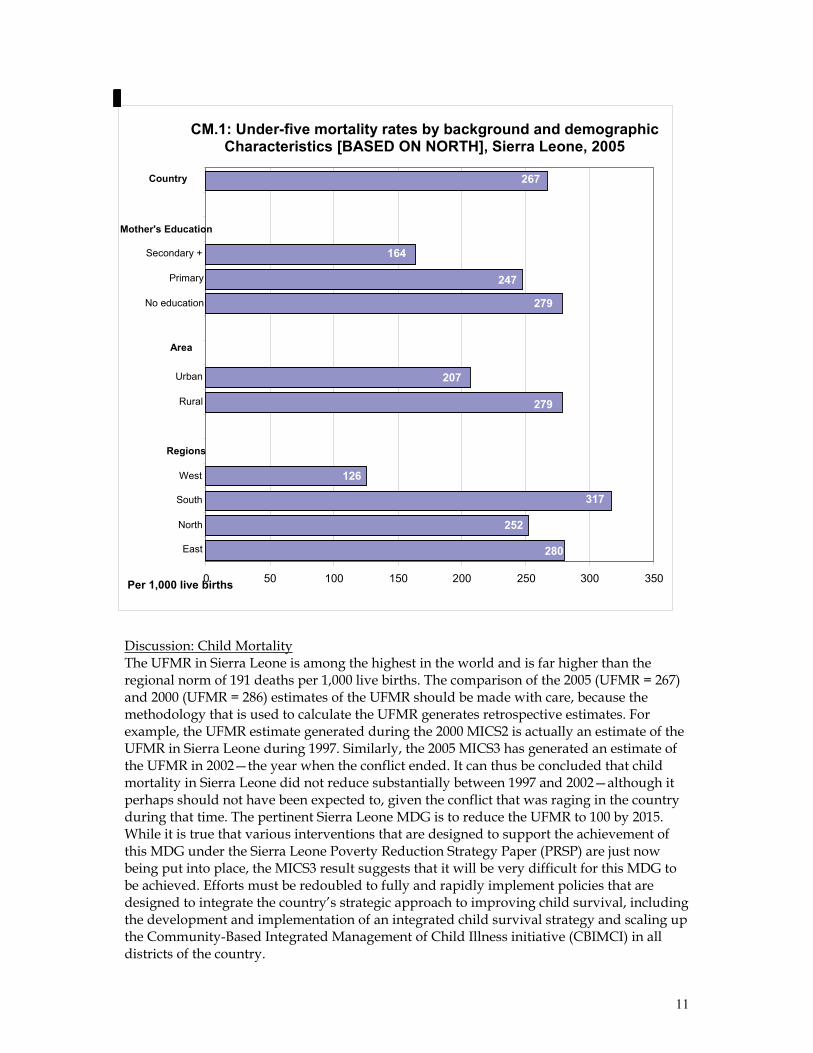
Discussion: Child Mortality The UFMR in Sierra Leone is among the highest in the world and is far higher than the regional norm of 191 deaths per 1,000 live births. The comparison of the 2005 (UFMR = 267) and 2000 (UFMR = 286) estimates of the UFMR should be made with care, because the methodology that is used to calculate the UFMR generates retrospective estimates. For example, the UFMR estimate generated during the 2000 MICS2 is actually an estimate of the UFMR in Sierra Leone during 1997. Similarly, the 2005 MICS3 has generated an estimate of the UFMR in 2002—the year when the conflict ended. It can thus be concluded that child mortality in Sierra Leone did not reduce substantially between 1997 and 2002—although it perhaps should not have been expected to, given the conflict that was raging in the country during that time. The pertinent Sierra Leone MDG is to reduce the UFMR to 100 by 2015. While it is true that various interventions that are designed to support the achievement of this MDG under the Sierra Leone Poverty Reduction Strategy Paper (PRSP) are just now being put into place, the MICS3 result suggests that it will be very difficult for this MDG to be achieved. Efforts must be redoubled to fully and rapidly implement policies that are designed to integrate the country’s strategic approach to improving child survival, including the development and implementation of an integrated child survival strategy and scaling up the Community-Based Integrated Management of Child Illness initiative (CBIMCI) in all districts of the country.
CM.1: Under-five mortality rates by background and demographicCharacteristics [BASED ON NORTH], Sierra Leone, 2005
280
279
279
252
317
126
207
247
164
267
0 50 100 150 200 250 300 350
East North
South West
Regions
Rural
Urban
Area
No education
Primary
Secondary + Mother's Education
Country
Per 1,000 live births
12
V. Nutrition
Nutritional Status
Key indicators Estimates (percent) West-Central Africa 2005 (MICS3) 2000 (MICS2) 1996-2004 Underweight prevalence (2 SD ≤ / 3 SD ≤) 30 / 8 27 / 9 28 / 9 Stunting prevalence (2 SD ≤ / 3 SD ≤) 40 / 20 34 / 16 35 / -- Wasting prevalence (2 SD ≤ / 3 SD ≤) 9 / 2 10 / 2 10 / -- Children’s nutritional status is a reflection of their overall health. When children have access to an adequate food supply, are not exposed to repeated illness, and are well cared for, they reach their growth potential and are considered well nourished. Malnutrition is associated with more than half of all child deaths worldwide. Undernourished children are more likely to die from common childhood ailments. Undernourished children who survive these illnesses often suffer from chronic disease and faltering growth. Three-quarters of the children who die from causes related to malnutrition are only mildly or moderately malnourished—and thus do not show outward signs of their vulnerability. A key Millennium Development Goal is to reduce the percentage of people who suffer from hunger by half between 1990 and 2015. The World Fit for Children goal is to reduce the prevalence of malnutrition among children under five years of age by at least one-third (between 2000 and 2010), with special attention to children under 2 years of age. A reduction in the prevalence of malnutrition supports the goal of reducing child mortality. There is a reference distribution of height and weight for children under age five in a well-nourished population. The extent of under-nourishment in a given population of children can be estimated by comparing their nutritional status to that of a reference population. The reference population used in the MICS3 analysis is the WHO/CDC/NCHS reference, which was recommended for use by UNICEF and the World Health Organization at the time the survey was implemented. Each of the three nutritional status indicators—underweight, stunting, and wasting—is expressed in standard deviation units (z-scores) from the median of this reference population. Weight-for-age is a measure of both acute and chronic malnutrition. Children whose weight-for-age is more than two standard deviations below the median of the reference population are considered to be moderately or severely underweight while those whose weight-for-age is more than three standard deviations below the median are classified as severely underweight. Height-for-age is a measure of linear growth. Children whose height-for-age is more than two standard deviations below the median of the reference population are considered short for their age and are classified as moderately or severely stunted. Those whose height-for-age is more than three standard deviations below the median are classified as severely stunted.
Millennium Development Goal Indicator Percentage of children under five years that are underweight Goal 12 percent by 2015 Source: SL PRSP 2004
13
Stunting is a reflection of chronic malnutrition as a result of failure to receive adequate nutrition over a long period and recurrent or chronic illness. Finally, children whose weight-for-height is more than two standard deviations below the median of the reference population are classified as moderately or severely wasted, while those who fall more than three standard deviations below the median are severely wasted. Wasting is usually the result of a recent nutritional deficiency. The indicator may exhibit significant seasonal shifts associated with changes in the availability of food or disease prevalence. During the MICS3 survey, weights and heights of all children under 5 years of age were measured using anthropometric equipment recommended by UNICEF (UNICEF, 2006). Findings in this section are based on the results of these measurements. Table NU.1 shows percentages of children classified into each of these categories, based on the anthropometric measurements that were taken during fieldwork. Additionally, the table includes the percentage of children who are overweight, which takes into account those children whose weight for height is above 2 standard deviations from the median of the reference population. The results shown in Table NU.1 do not include the 23 percent of children who were excluded from the analysis. These children were excluded for reasons that include “not measured” (4 percent), “missing weight or height” (0.2 percent), “missing month or year of birth” (12 percent), and “other flagged cases9” (6 percent). The percentage of cases that has been excluded is quite high and may affect the generalizability of the anthropometric results. About three in ten children (30 percent) under five years of age in Sierra Leone are moderately underweight and eight percent are classified as severely underweight (Table NU.1). Forty percent of children are stunted or too short for their age and nine percent are wasted or too thin for their height. The three indicators of malnutrition are similarly high in the Northern, Eastern and Southern provinces and are markedly lower in the Western Area. Those children whose mothers have secondary or higher education are less likely to be malnourished than children of mothers with no or primary-only education. Boys appear to be slightly more likely to be underweight, stunted, and wasted than girls. The age pattern shows that a higher percentage of children aged 12-23 months are undernourished according to all three indices in comparison to children who are younger and older10 (Figure NU.1). This pattern is expected and is related to the age at which many children cease to be breastfed and begin to be more broadly exposed to contamination in water, food, and environment.
9 For example, those cases for which the measurements are outside of a plausible range. 10 The exception to this pattern is an unusually high level of stunting among children aged 36-47 months.
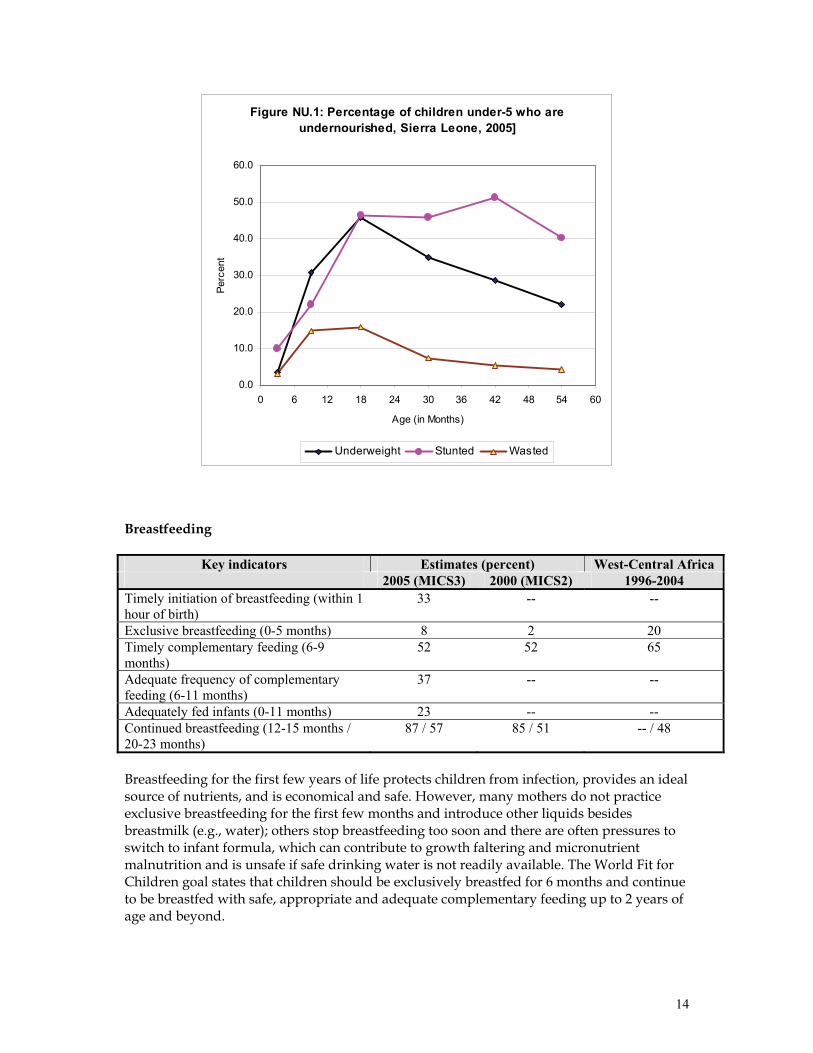
14
Figure NU.1: Percentage of children under-5 who are undernourished, Sierra Leone, 2005]
0.0
10.0
20.0
30.0
40.0
50.0
60.0
0 6 12 18 24 30 36 42 48 54 60
Age (in Months)
Perc
ent
Underweight Stunted Wasted
Breastfeeding
Key indicators Estimates (percent) West-Central Africa 2005 (MICS3) 2000 (MICS2) 1996-2004 Timely initiation of breastfeeding (within 1 hour of birth)
33 -- --
Exclusive breastfeeding (0-5 months) 8 2 20 Timely complementary feeding (6-9 months)
52 52 65
Adequate frequency of complementary feeding (6-11 months)
37 -- --
Adequately fed infants (0-11 months) 23 -- -- Continued breastfeeding (12-15 months / 20-23 months)
87 / 57 85 / 51 -- / 48
Breastfeeding for the first few years of life protects children from infection, provides an ideal source of nutrients, and is economical and safe. However, many mothers do not practice exclusive breastfeeding for the first few months and introduce other liquids besides breastmilk (e.g., water); others stop breastfeeding too soon and there are often pressures to switch to infant formula, which can contribute to growth faltering and micronutrient malnutrition and is unsafe if safe drinking water is not readily available. The World Fit for Children goal states that children should be exclusively breastfed for 6 months and continue to be breastfed with safe, appropriate and adequate complementary feeding up to 2 years of age and beyond.
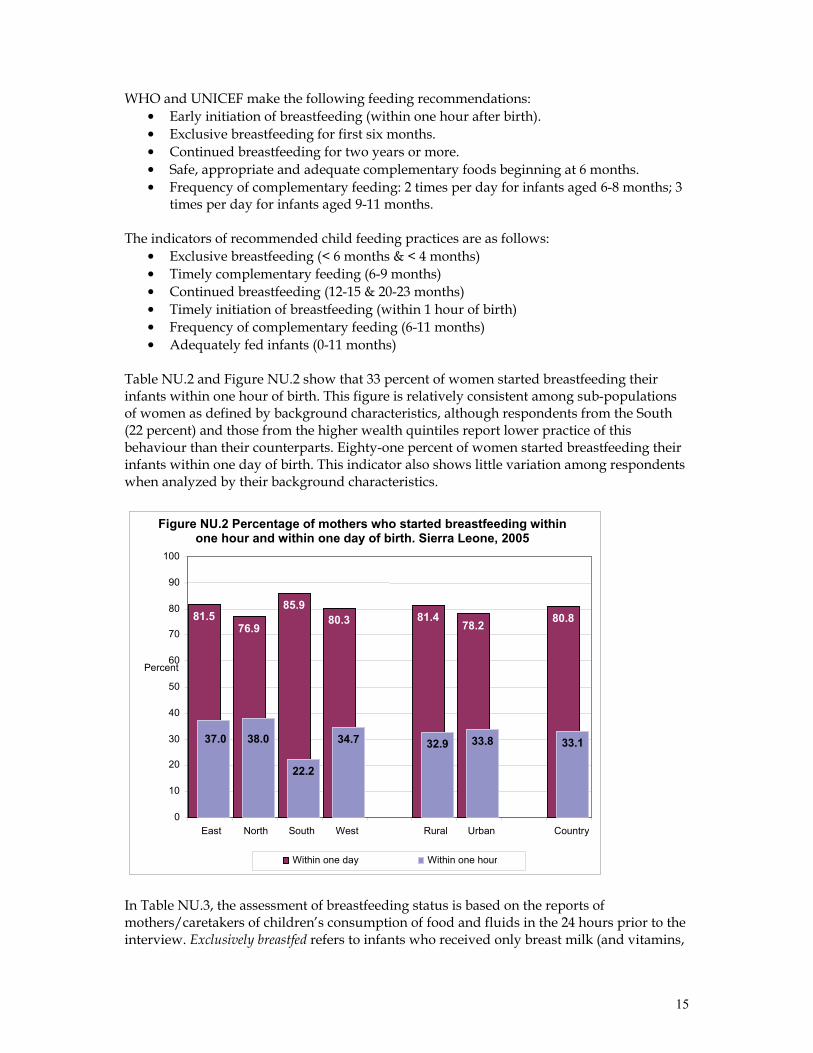
15
WHO and UNICEF make the following feeding recommendations: • Early initiation of breastfeeding (within one hour after birth). • Exclusive breastfeeding for first six months. • Continued breastfeeding for two years or more. • Safe, appropriate and adequate complementary foods beginning at 6 months. • Frequency of complementary feeding: 2 times per day for infants aged 6-8 months; 3
times per day for infants aged 9-11 months. The indicators of recommended child feeding practices are as follows: • Exclusive breastfeeding (< 6 months & < 4 months) • Timely complementary feeding (6-9 months) • Continued breastfeeding (12-15 & 20-23 months) • Timely initiation of breastfeeding (within 1 hour of birth) • Frequency of complementary feeding (6-11 months) • Adequately fed infants (0-11 months)
Table NU.2 and Figure NU.2 show that 33 percent of women started breastfeeding their infants within one hour of birth. This figure is relatively consistent among sub-populations of women as defined by background characteristics, although respondents from the South (22 percent) and those from the higher wealth quintiles report lower practice of this behaviour than their counterparts. Eighty-one percent of women started breastfeeding their infants within one day of birth. This indicator also shows little variation among respondents when analyzed by their background characteristics.
In Table NU.3, the assessment of breastfeeding status is based on the reports of mothers/caretakers of children’s consumption of food and fluids in the 24 hours prior to the interview. Exclusively breastfed refers to infants who received only breast milk (and vitamins,
Figure NU.2 Percentage of mothers who started breastfeeding withinone hour and within one day of birth. Sierra Leone, 2005
81.5 76.9
85.9 80.3 81.4
78.2 80.8
37.0 38.0
22.2
34.7 32.9 33.8 33.1
0
10
20
30
40
50
60
70
80
90
100
East North South West Rural Urban Country
Percent
Within one day Within one hour
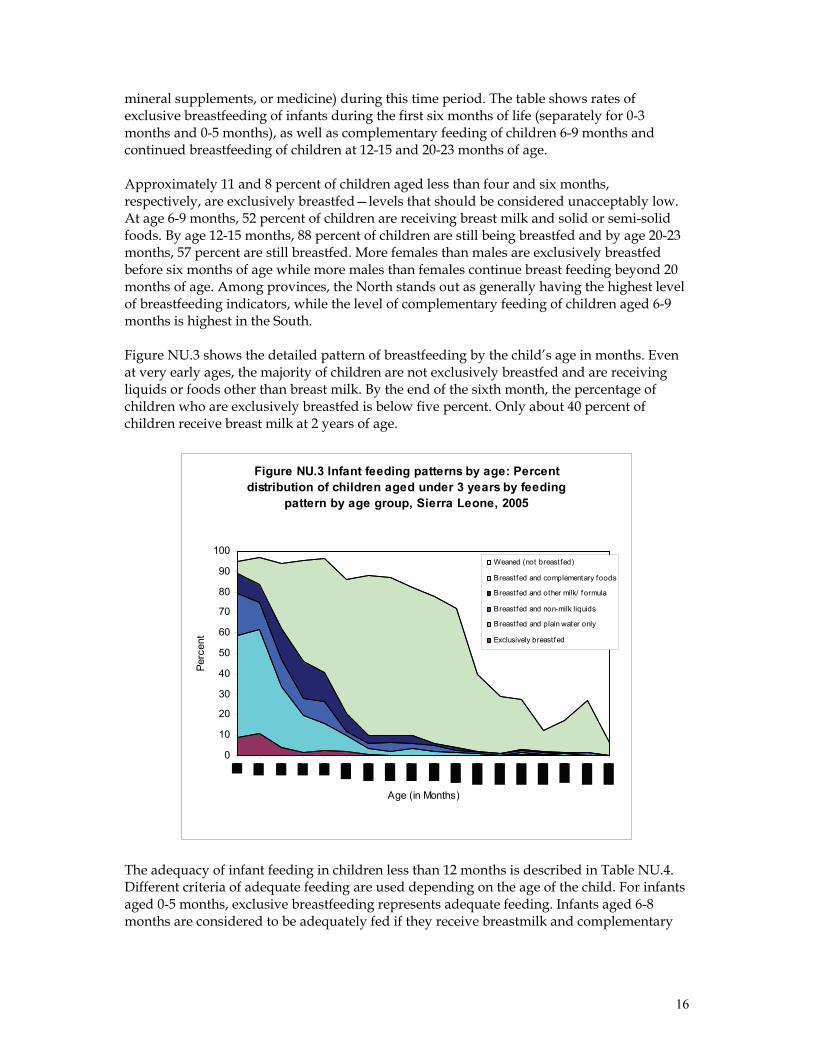
16
mineral supplements, or medicine) during this time period. The table shows rates of exclusive breastfeeding of infants during the first six months of life (separately for 0-3 months and 0-5 months), as well as complementary feeding of children 6-9 months and continued breastfeeding of children at 12-15 and 20-23 months of age. Approximately 11 and 8 percent of children aged less than four and six months, respectively, are exclusively breastfed—levels that should be considered unacceptably low. At age 6-9 months, 52 percent of children are receiving breast milk and solid or semi-solid foods. By age 12-15 months, 88 percent of children are still being breastfed and by age 20-23 months, 57 percent are still breastfed. More females than males are exclusively breastfed before six months of age while more males than females continue breast feeding beyond 20 months of age. Among provinces, the North stands out as generally having the highest level of breastfeeding indicators, while the level of complementary feeding of children aged 6-9 months is highest in the South. Figure NU.3 shows the detailed pattern of breastfeeding by the child’s age in months. Even at very early ages, the majority of children are not exclusively breastfed and are receiving liquids or foods other than breast milk. By the end of the sixth month, the percentage of children who are exclusively breastfed is below five percent. Only about 40 percent of children receive breast milk at 2 years of age.
Figure NU.3 Infant feeding patterns by age: Percent distribution of children aged under 3 years by feeding
pattern by age group, Sierra Leone, 2005
0
10
20
30
40
50
60
70
80
90
100
Age (in Months)
Perc
ent
Weaned (not breast fed)
Breastfed and complementary foods
Breastfed and other milk/ formula
Breastfed and non-milk liquids
Breastfed and plain water only
Exclusively breastfed
The adequacy of infant feeding in children less than 12 months is described in Table NU.4. Different criteria of adequate feeding are used depending on the age of the child. For infants aged 0-5 months, exclusive breastfeeding represents adequate feeding. Infants aged 6-8 months are considered to be adequately fed if they receive breastmilk and complementary
17
food at least two times per day, while infants aged 9-11 months are considered to be adequately fed if they receive breastmilk and complementary food at least three times a day. The low level of adequate feeding among infants aged 0-5 months has been described above in the discussion of exclusive breastfeeding. Among infants aged 6-8 and 9-11 months, only 41 and 31 percent, respectively, are adequately fed according to the definitions above. Levels of adequate feeding for infants aged 6-8 months are lowest in the North (30 percent) and in the Western Area (28 percent) and highest among children of poorer, uneducated mothers. The level of adequate feeding of infants aged 9-11 months is less than levels for infants aged 6-8 months in all provinces except for the Western Area, where it is higher. Higher levels of adequate feeding for infants aged 9-11 months are associated with urban residence, higher levels of maternal education, and very high (as well as very low) wealth status. Overall, 37 percent of children aged 6-11 months are adequately fed. Adequate feeding among all infants (aged 0-11 months) is only 23 percent. There is relatively little variation in this latter indicator among infants with different background characteristics. Discussion: Nutritional status and breastfeeding The prevalence of underweight, stunting and wasting among children under five years of age in Sierra Leone in 2005 is slightly higher than prevalence levels in Sierra Leone in 2000 and West and Central Africa (WCA) norms. This decline in nutritional status may be due to a variety of factors that include the limited awareness of mothers about proper child feeding and nutrition; lack of food and lack of food diversification linked to poverty; food insecurity; cultural misconceptions about breastfeeding; and, cultural practices and values relating to distribution of food within the family at household level. The practice of exclusive breastfeeding in Sierra Leone has improved from the meagre level of 2 percent in 2000 but remains extremely low at 8 percent, comparing unfavourably with the WCA norm of 20 percent. MICS3 estimates of complementary feeding and continued breastfeeding rates remain virtually unchanged from 2000 and are similar to WCA norms. Indicators that measure adequate feeding and timely initiation of breastfeeding fall well short of desired levels. There remains ample room for improvement of infant and young child feeding practices and promotion of growth monitoring and promotion in line with the life cycle of young children in Sierra Leone. Policy makers should focus on creating a conducive environment for national food production, income generation, and implementation of the food security component of the PRSP. Programmatic approaches that integrate nutritional interventions into other child survival strategies are called for. The Family Package—which includes interventions such as insecticide treated bednets, exclusive breastfeeding, immunizations, complementary feeding, nutritional supplements, etc.—should be promoted and introduced at the household level, especially through outreach services.
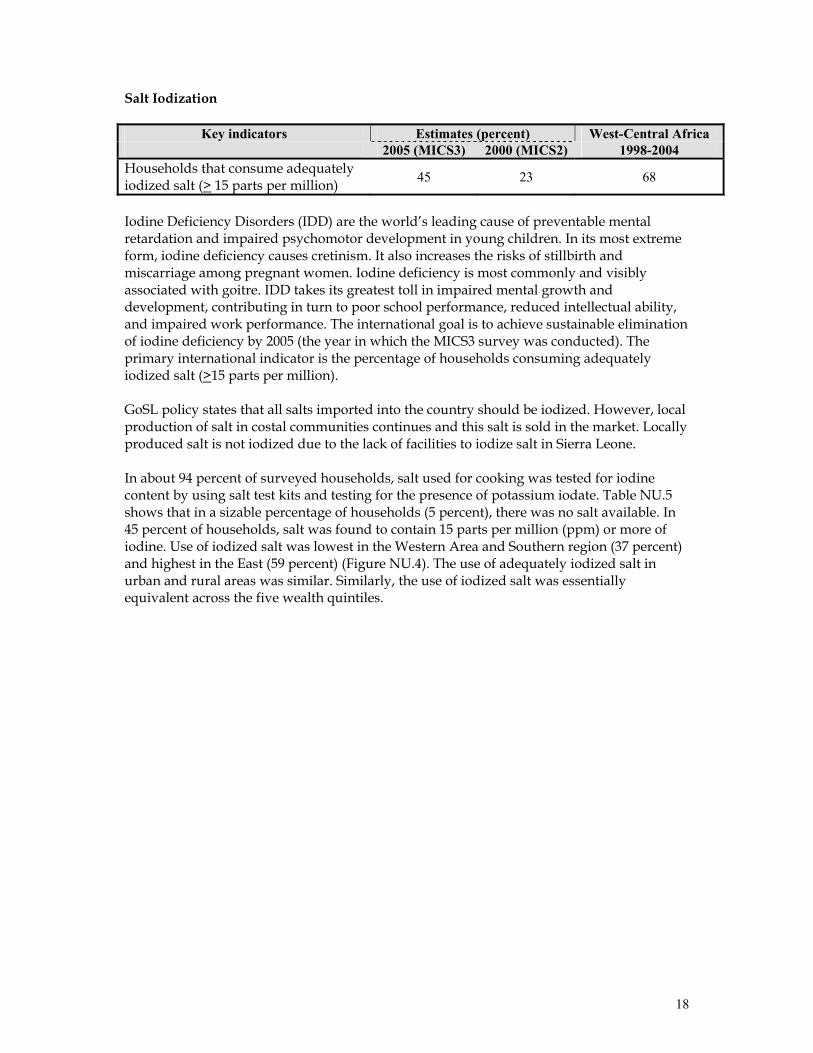
18
Salt Iodization
Key indicators Estimates (percent) West-Central Africa 2005 (MICS3) 2000 (MICS2) 1998-2004 Households that consume adequately iodized salt (> 15 parts per million) 45 23 68
Iodine Deficiency Disorders (IDD) are the world’s leading cause of preventable mental retardation and impaired psychomotor development in young children. In its most extreme form, iodine deficiency causes cretinism. It also increases the risks of stillbirth and miscarriage among pregnant women. Iodine deficiency is most commonly and visibly associated with goitre. IDD takes its greatest toll in impaired mental growth and development, contributing in turn to poor school performance, reduced intellectual ability, and impaired work performance. The international goal is to achieve sustainable elimination of iodine deficiency by 2005 (the year in which the MICS3 survey was conducted). The primary international indicator is the percentage of households consuming adequately iodized salt (>15 parts per million). GoSL policy states that all salts imported into the country should be iodized. However, local production of salt in costal communities continues and this salt is sold in the market. Locally produced salt is not iodized due to the lack of facilities to iodize salt in Sierra Leone. In about 94 percent of surveyed households, salt used for cooking was tested for iodine content by using salt test kits and testing for the presence of potassium iodate. Table NU.5 shows that in a sizable percentage of households (5 percent), there was no salt available. In 45 percent of households, salt was found to contain 15 parts per million (ppm) or more of iodine. Use of iodized salt was lowest in the Western Area and Southern region (37 percent) and highest in the East (59 percent) (Figure NU.4). The use of adequately iodized salt in urban and rural areas was similar. Similarly, the use of iodized salt was essentially equivalent across the five wealth quintiles.
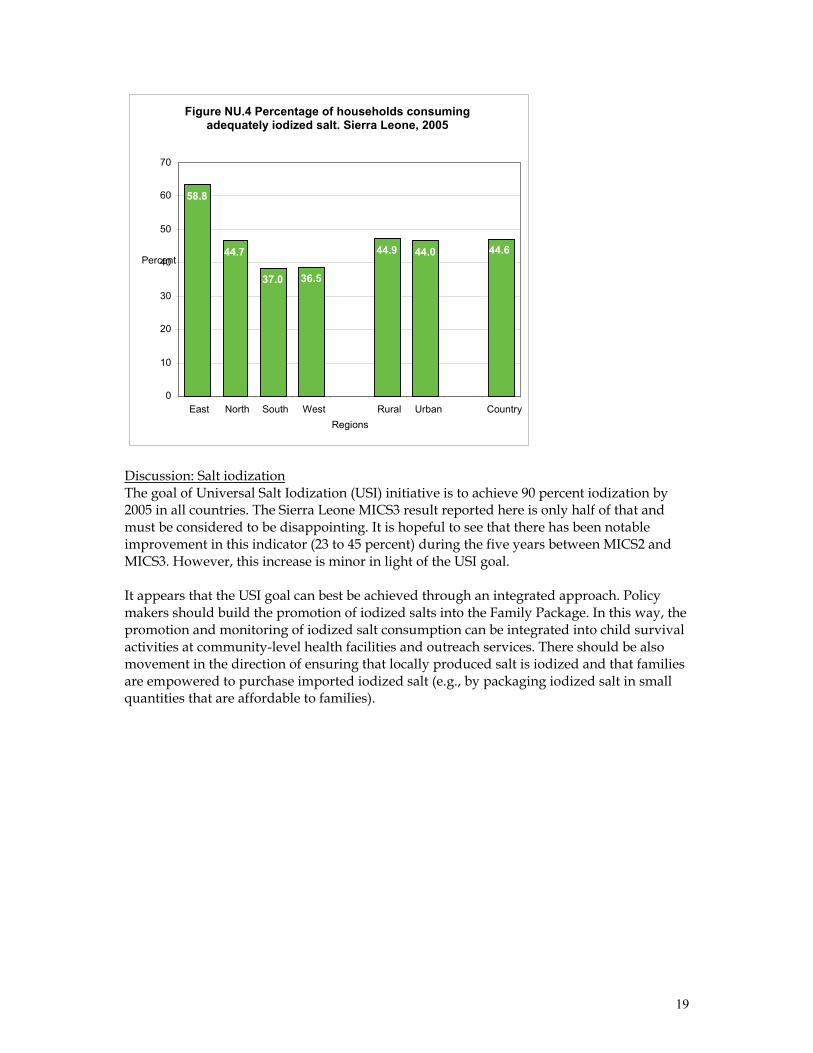
19
Discussion: Salt iodization The goal of Universal Salt Iodization (USI) initiative is to achieve 90 percent iodization by 2005 in all countries. The Sierra Leone MICS3 result reported here is only half of that and must be considered to be disappointing. It is hopeful to see that there has been notable improvement in this indicator (23 to 45 percent) during the five years between MICS2 and MICS3. However, this increase is minor in light of the USI goal. It appears that the USI goal can best be achieved through an integrated approach. Policy makers should build the promotion of iodized salts into the Family Package. In this way, the promotion and monitoring of iodized salt consumption can be integrated into child survival activities at community-level health facilities and outreach services. There should be also movement in the direction of ensuring that locally produced salt is iodized and that families are empowered to purchase imported iodized salt (e.g., by packaging iodized salt in small quantities that are affordable to families).
Figure NU.4 Percentage of households consumingadequately iodized salt. Sierra Leone, 2005
58.8
44.7
37.0 36.5
44.9 44.0 44.6
0
10
20
30
40
50
60
70
East North South West Rural Urban CountryRegions
Percent
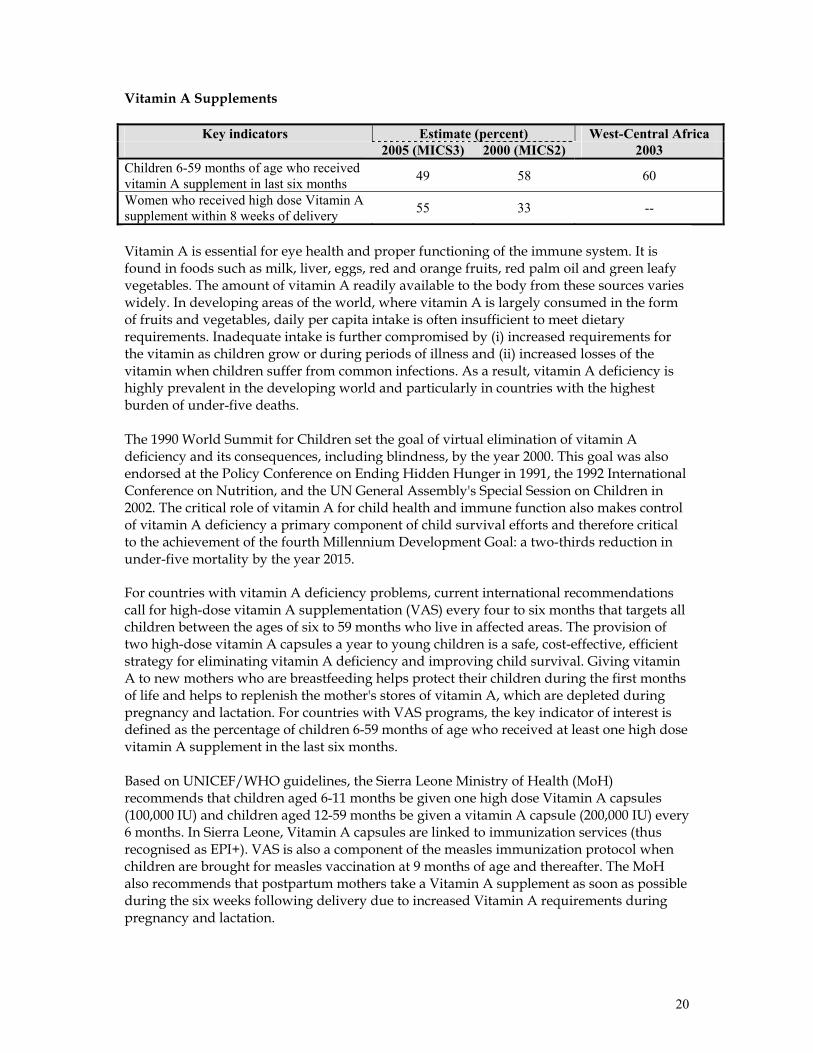
20
Vitamin A Supplements
Key indicators Estimate (percent) West-Central Africa 2005 (MICS3) 2000 (MICS2) 2003 Children 6-59 months of age who received vitamin A supplement in last six months 49 58 60
Women who received high dose Vitamin A supplement within 8 weeks of delivery 55 33 --
Vitamin A is essential for eye health and proper functioning of the immune system. It is found in foods such as milk, liver, eggs, red and orange fruits, red palm oil and green leafy vegetables. The amount of vitamin A readily available to the body from these sources varies widely. In developing areas of the world, where vitamin A is largely consumed in the form of fruits and vegetables, daily per capita intake is often insufficient to meet dietary requirements. Inadequate intake is further compromised by (i) increased requirements for the vitamin as children grow or during periods of illness and (ii) increased losses of the vitamin when children suffer from common infections. As a result, vitamin A deficiency is highly prevalent in the developing world and particularly in countries with the highest burden of under-five deaths. The 1990 World Summit for Children set the goal of virtual elimination of vitamin A deficiency and its consequences, including blindness, by the year 2000. This goal was also endorsed at the Policy Conference on Ending Hidden Hunger in 1991, the 1992 International Conference on Nutrition, and the UN General Assembly's Special Session on Children in 2002. The critical role of vitamin A for child health and immune function also makes control of vitamin A deficiency a primary component of child survival efforts and therefore critical to the achievement of the fourth Millennium Development Goal: a two-thirds reduction in under-five mortality by the year 2015. For countries with vitamin A deficiency problems, current international recommendations call for high-dose vitamin A supplementation (VAS) every four to six months that targets all children between the ages of six to 59 months who live in affected areas. The provision of two high-dose vitamin A capsules a year to young children is a safe, cost-effective, efficient strategy for eliminating vitamin A deficiency and improving child survival. Giving vitamin A to new mothers who are breastfeeding helps protect their children during the first months of life and helps to replenish the mother's stores of vitamin A, which are depleted during pregnancy and lactation. For countries with VAS programs, the key indicator of interest is defined as the percentage of children 6-59 months of age who received at least one high dose vitamin A supplement in the last six months. Based on UNICEF/WHO guidelines, the Sierra Leone Ministry of Health (MoH) recommends that children aged 6-11 months be given one high dose Vitamin A capsules (100,000 IU) and children aged 12-59 months be given a vitamin A capsule (200,000 IU) every 6 months. In Sierra Leone, Vitamin A capsules are linked to immunization services (thus recognised as EPI+). VAS is also a component of the measles immunization protocol when children are brought for measles vaccination at 9 months of age and thereafter. The MoH also recommends that postpartum mothers take a Vitamin A supplement as soon as possible during the six weeks following delivery due to increased Vitamin A requirements during pregnancy and lactation.
21
Within the six months prior to the Sierra Leone MICS3, 49 percent of children aged 6-59 months received a high dose Vitamin A supplement (Table NU.6). Approximately 18 percent did not receive the supplement in the last 6 months but did receive one prior to that time. Approximately 15 percent of children received a Vitamin A supplement at some time in the past but their mother/caretaker was unable to specify when. VAS coverage among the provinces of Sierra Leone ranges from 42 percent in the South province to 55 percent in the East. The age pattern of VAS shows that supplementation in the last six months is highest among children aged 6-11 months at 58 percent and then declines steadily with age to its lowest level of 42 percent among children aged 48-59 months. The mother’s level of education does not appear to be associated with the likelihood of VAS. The degree of variation of VAS rates among the wealth quintiles is modest although rates are slightly higher in the wealthiest three quintiles compared to the lower two. Approximately 55 percent of mothers with a birth in the previous two years before the MICS3 survey received a Vitamin A supplement within eight weeks following the birth (Table NU.7). This percentage is highest in the Western Area (70 percent) and lowest in the South (51 percent). Vitamin A coverage is higher among mothers living in urban areas (63 percent) as compared to rural areas (52 percent) and is higher among women with secondary or higher education (70 percent) versus women with primary education or no education ( 52 and 53 percent, respectively). This indicator is also clearly associated with the wealth level of the family as it is lowest (49 percent) among mothers from the poorest wealth quintile and increases steadily to its highest level (69 percent) among mothers from the wealthiest quintile. Discussion: Vitamin A supplements VAS coverage among children in Sierra Leone needs to be improved. The coverage rate has dropped almost ten percent in the past five years and is below regional norms. Part of the reason for this decline is probably due to the recent inclusion of VAS in the routine service package, under which its provision has still not been fully established. Program managers in Sierra Leone should intensify efforts to standardize the routine provision of VAS as part of the Family Package and integrate the provision of VAS through outreach activities. Greater promotion of VAS is required at the community level given the observed drop in coverage. In contrast to VAS coverage among children, VAS coverage among postpartum women (PPVAS) has markedly improved during the past five years—although ample room remains for further gains. This increase may be due to increased sensitization for maternal VAS since the integration of PPVAS into the routine health services. Policy makers should consider further strengthening the coverage of this important service through the integration of PPVAS into the MCH postnatal package and the engagement of other health services delivery points (e.g., TBAs). Program managers should continue to monitor the coverage of PPVAS at the health facility and community and outreach levels while promoting PPVAS through outreach services.
22
Low Birth Weight
Key indicators Estimates (percent) West-Central Africa 2005 (MICS3) 2000 (MICS2) 1998-2004 Infants weighed at birth 29 6 -- Low birth weight infants 24 --11 15 Weight at birth is a good indicator not only of a mother's health and nutritional status but also of the newborn's potential for survival, growth, long-term health and psychosocial development. Low birth weight (LBW: defined as less than 2,500 grams at birth) carries a range of grave health risks for children. Babies who are undernourished in the womb face a greatly increased risk of dying during the early months and years of their lives. Those who survive often have impaired immune function and increased risk of disease. LBW infants are likely to remain undernourished, with reduced muscle strength, throughout their lives and suffer a higher incidence of diabetes and heart disease in later life. Children born underweight also tend to have a lower IQ and cognitive disabilities, affecting their performance in school and their job opportunities as adults. In the developing world, LBW stems primarily from the mother's poor health and nutrition. Three factors have been found to predispose a newborn to be born with LBW: 1) the mother's poor nutritional status before conception, 2) her short stature (due mostly to poor nutrition and infections during her childhood), and 3) poor nutrition during the pregnancy. Inadequate weight gain during pregnancy is particularly important since it accounts for a large percentage of foetal growth retardation. Moreover, diseases such as diarrhoea and malaria, which are common in many developing countries, can significantly impair foetal growth if the mother becomes infected while pregnant. In the industrialized world, cigarette smoking during pregnancy is the leading cause of low birth weight. In developed and developing countries alike, teenagers who give birth when their own bodies have yet to finish growing run a higher risk of bearing LBW babies than do fully-developed individuals. One of the major challenges in measuring the incidence of low birth weight is the fact that more than half of infants in the developing world are not weighed at birth. In the past, most estimates of low birth weight for developing countries were based on data compiled from health facilities. However, these estimates are biased in most developing countries because the majority of newborns are not delivered in facilities; those who are born in facilities represent a select sample of all births that is not representative of the overall population. Because many infants are not weighed at birth and those who are weighed are not representative of all infants, reported birth weights usually cannot be used to estimate the prevalence of LBW among all children. Therefore, the percentage of births weighing below 2500 grams is estimated from two items in the MICS questionnaire: (i) the mother’s assessment of the child’s size at birth (i.e., very small, smaller than average, average, larger than average, very large), and (ii) the mother’s recall of the child’s weight or the weight as recorded on a health card (if the child was weighed at birth12). Mothers are asked these questions regarding their most recent live birth.
11 A different technique was used to estimate this indicator in the MICS2 survey. The MICS2 estimate of this indicator, which is not comparable to the MICS3 estimate, was 52 percent. 12 For a detailed description of the methodology, see Boerma, Weinstein, Rutstein and Sommerfelt, 1996.
23
A total of 2,375 women provided information about weighing practices and size at birth regarding their most recently born child during the 2 years preceding the survey. Overall, 29 percent of these children were weighed at birth. The probability of a child being weighed at birth was strongly associated with urban residence, higher levels of maternal education, and higher levels of wealth. Combining information on the measured birth weights and mothers’ perceptions on the size of the baby, it is estimated that 24 percent of the 2,375 respondents had a low birth weight baby. (Table NU.8). There was no significant variation in this latter indicator by any background characteristic (Figure NU.5). The approach used for the estimation of low birth weight prevalence assumes that the relationship between the measured birth weight and the mothers’ perceptions for these babies holds true for those whose birth weight was not measured but their mothers were asked to provide their perception on the size of the baby. In some categories, the proportion of babies measured are quite low – for these, the results should be regarded with caution.
Figure NU.5 Percentage of Infants Weighing Less Than 2500 Grams at Birth, Sierra Leone, 2005
23.1 24.3 23.321.2
23.5
0.0
5.0
10.0
15.0
20.0
25.0
30.0
East North South West Country
Regions
Perc
ent
Discussion: Low birth weight The high prevalence of LBW newborns in Sierra Leone is well above the regional norm and represents a serious problem for public health officials. There is no simple solution to this issue. Efforts to lower the incidence of LBW should focus on advocacy for and implementation of the antenatal package, which contains interventions such as deworming, insecticide-treated bednets, and iron-folate supplementation that can have a positive influence on the incidence of LBW. Efforts should continue to address important topics that can positively contribute to reduction of LBW such as birth spacing and delayed age of pregnancy.
24
VI. Child Health
Immunization
Estimates (percent) 2005 (MICS3)
2005 (MICS3)
2000 (MICS2)
West-Central Africa (2004)
Numerator Imm. Status at first birthday
Imm. Status at time of survey
Imm. Status at time of survey
Unclear
Denominator # of 1-year-olds # of 1-year-olds # of 1-year-olds Unclear Column # 1 2 3 4
BCG coverage 84 86 73 67 Polio coverage (OPV3) 57 65 61 57 DPT coverage (DPT3) 56 64 46 52 Measles coverage 63 77 62 55 Yellow fever coverage 61 76 -- -- Fully immunized children 35 54 39 -- Note: Only estimates in columns 2 and 3 are directly comparable. The Millennium Development Goal (MDG) Number 4 is to reduce child mortality by two-thirds between 1990 and 2015. Immunization plays a key role in reaching this goal. Immunizations have saved the lives of millions of children in the three decades since the launch of the Expanded Programme on Immunization (EPI) in 1974. Worldwide there are still 27 million children who do not receive routine immunizations. As a result, vaccine-preventable diseases cause more than 2 million deaths every year. The goal of A World Fit for Children with regards to EPI is to achieve full immunization for 90 percent of children under one year of age at the national level and corresponding coverage levels of at least 80 percent in every district or equivalent administrative unit. According to UNICEF and WHO guidelines, a child should receive a BCG vaccination to protect against tuberculosis; three doses of vaccine to protect against diphtheria, pertussis, and tetanus (DPT); three doses of oral polio vaccine (OPV); and, a measles vaccination—all by the age of 12 months. All of these vaccinations are provided in Sierra Leone through the Ministry of Health (MoH) and--together with the yellow fever vaccine—form the basic EPI package in Sierra Leone. The vaccine schedule is described in the table below.
Table 2: EPI package and schedule in Sierra Leone Vaccine Age at vaccination
BCG At birth OPV 0 At birth OPV1/DPT1 6 weeks after delivery OPV2/DPT2 10 weeks after delivery OPV3/DPT3 14 weeks after delivery Measles 9 months after delivery Yellow fever 9 months after delivery Caretakers of children under the age of five who were interviewed as part of the MICS3 were asked to show interviewers their children’s vaccination cards. When these cards were available, interviewers copied vaccination information from the cards onto the MICS3
25
questionnaire. When cards were not available, vaccination status was assessed through a structured oral history taken from the mother / caretaker. Overall, interviewers were shown health cards for 53 percent of children included in the MICS3 survey (Table CH.2). The percentage of children aged 12 to 23 months who received each of the vaccinations is shown in Table CH.1 and Figure CH.1. The denominator for the estimates presented in the table and figure is comprised of 1074 children aged 12-23 months; this approach ensures that only children who are old enough to be fully vaccinated are counted. In the coverage estimate presented in the third row of Table CH.1, the numerator includes all children who were vaccinated at any time before the survey according to the vaccination card or the mother’s report. In order to generate the coverage estimate presented in the bottom row, only those children who were vaccinated before their first birthday are included. For children without vaccination cards, the percentage of vaccinations given before the first birthday is assumed to be the same as for children with vaccination cards.
Approximately 84 percent of children aged 12-23 months received a BCG vaccination by the age of 12 months and the first dose of DPT was given to 79 percent. The percentage declines for subsequent doses of DPT to 74 percent for the second dose and 56 percent for the third dose (Table CH.1). Similarly, 84percent of children received the first dose of polio vaccine (OPV1) by age 12 months and this declines to 57 percent for the third dose. The coverage for measles vaccine by 12 months is—at 63 percent—higher than for OPV3 or DPT3. Coverage for yellow fever vaccine at age 12 months is 61 percent. The percentage of children aged 12-
Figure CH.1 Percentage of children aged 12-23 monthswho received the recommended vaccinations by
12 Months. Sierra Leone, 2005
84 79
74
56
84
76
5763
35
0
10
20
30
40
50
60
70
80
90
BCG DPT1 DPT2 DPT3 OPV1OPV2OPV3 Measles All
Percent
Millennium Development Goal Indicator Percentage of children under one year immunized against measles Goal 100 percent by 2015
26
23 months who received all eight recommended vaccinations excluding yellow fever (BCG, DPT x 3, OPV x 3, and measles) by their first birthday is 35 percent. Table CH.2 shows vaccination coverage rates among children 12-23 months by background characteristics. These estimates represent coverage rates among surveyed children at the time of the survey (regardless of the age at which the vaccine was received) and are based on information from both the vaccination cards and mothers’/caretakers’ reports. Coverage rates among male children are slightly higher than for females. A comparison across provinces shows that coverage rates of polio are lowest in the more developed Western Area. For other antigens, coverage is generally higher in the South and in the Western Area. Coverage levels are slightly higher in urban areas as compared to rural locations for all antigens. The association of coverage and the education level of the mother does not follow a linear trend, as vaccination rates for most antigens are highest among women with primary education, followed by mothers with secondary education or higher. Coverage is lowest among children of uneducated women. Finally, there is a clear positive association between increasing wealth status and higher coverage levels. Coverage rates for most antigens are markedly lower for the two lowest wealth quintiles as compared with the three higher quintiles. Discussion: Immunization The MICS3 survey has introduced an approach to the measurement of immunization rates that differs from the approach taken during MICS2. Timely immunization—that is, completion of basic immunizations by an infant’s first birthday, as measured among 12-23 month-olds—is the basis of the MICS3 EPI assessment. This contrasts with the approach taken during MICS2, when indicators were defined based on current immunization status among surveyed 12-23 month-olds. This latter approach aggregates the vaccination status of children of different ages (between 12 and 23 months) in the calculation. Estimates of timely immunization are not available from MICS2; it is therefore necessary to examine current immunization status as measured during MICS3 and MICS2 (columns 2 and 3 in the table that can be found at the beginning of this section) in order to examine trends in vaccination status over time. A comparison of these data suggests that clear gains have been made in improving vaccination status of children in Sierra Leone during the past five years. This finding, along with data that show immunization rates in Sierra Leone to be 8-to-21 percent above regional norms (measles), suggests that the EPI program in Sierra Leone is a relatively strong component of the health system. Vaccination rates in Sierra Leone are still far short of the UNICEF goal of 90 percent of children fully immunized at one year of age or the MDG for measles vaccination of 100 percent at one year of age. Policy recommendations to strengthen the EPI program in Sierra Leone include prioritizing the placement of adequate personnel at the community-level to carry out EPI programs and supporting the integration of EPI activities in the broader Integrated Child Survival Strategies. EPI program managers should continue to focus on strengthening outreach EPI services and establishing appropriate technology for cold chain maintenance.
27
Tetanus Toxoid
Key indicators Estimates (percent) West-Central Africa 2005 (MICS3) 2000 (MICS2) 2004 Mothers given at least two doses of tetanus toxoid vaccine within appropriate interval 75 58 57
A central MDG is to reduce the maternal mortality ratio by three-quarters. A key strategy to help reach this goal is to eliminate maternal tetanus. In addition, the global standard is to ensure that neonatal tetanus is reduced to less than one case of neonatal tetanus per 1000 live births in every district. A World Fit for Children goal is to eliminate maternal and neonatal tetanus by 2005. The best way to prevent maternal and neonatal tetanus is to ensure that all pregnant women receive at least two doses of tetanus toxoid vaccine. However, if women have not received two doses of the vaccine during their current pregnancy, they (and their newborn) are also considered to be protected if any of the following conditions are met: • Received at least two doses of tetanus toxoid vaccine during lifetime, the last within the
prior three years; • received at least three doses during lifetime, the last within the prior five years; • received at least four doses during lifetime, the last within ten years; or, • received at least five doses during lifetime Table CH.3 shows that 75 percent of surveyed women who had a live birth within 12 months prior to the survey received at least two doses of TT vaccine during their last pregnancy and 78 percent of surveyed women were protected against neonatal tetanus according to the conditions outlined directly above. Figure CH.2 below shows the protection status from tetanus of women by major background characteristics. Coverage of protection against tetanus is highest in the Western Area and East and notably lower in the North. Coverage levels are higher in urban than in rural areas. There is little difference in vaccination rates among different age groups of women; rates range from 75 percent (among 25-29 year-olds) to 82 percent (among 20-24 year-olds). Those differences that do exist among age groups do not follow a discernible trend. There is a direct association between higher levels of mothers’ education and higher vaccination rates. Similarly, increasing wealth status is positively associated with higher coverage levels.
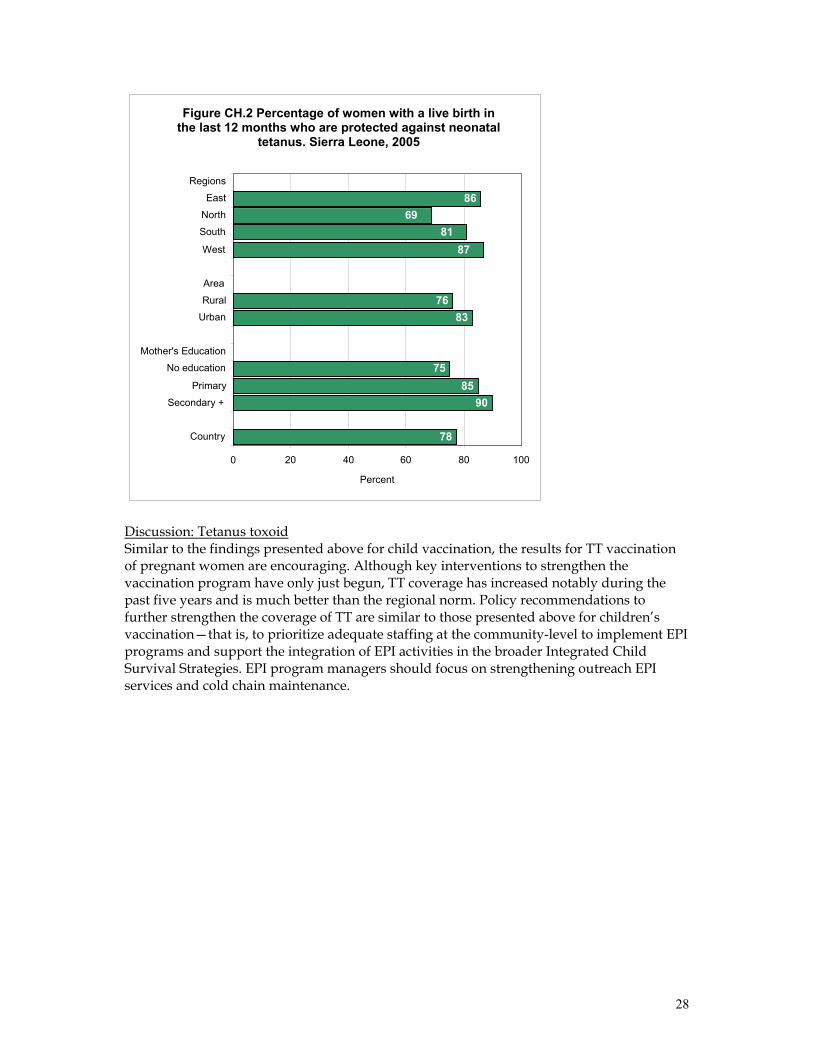
28
Discussion: Tetanus toxoid Similar to the findings presented above for child vaccination, the results for TT vaccination of pregnant women are encouraging. Although key interventions to strengthen the vaccination program have only just begun, TT coverage has increased notably during the past five years and is much better than the regional norm. Policy recommendations to further strengthen the coverage of TT are similar to those presented above for children’s vaccination—that is, to prioritize adequate staffing at the community-level to implement EPI programs and support the integration of EPI activities in the broader Integrated Child Survival Strategies. EPI program managers should focus on strengthening outreach EPI services and cold chain maintenance.
Figure CH.2 Percentage of women with a live birth inthe last 12 months who are protected against neonatal
tetanus. Sierra Leone, 2005
8669
8187
7683
7585
90
78
0 20 40 60 80 100
Regions East
North South West
Area Rural
Urban
Mother's Education
No education Primary
Secondary +
Country
Percent
29
Oral Rehydration Therapy
Key indicators Estimates West-Central Africa 2005 (MICS3) 2000 (MICS2) 1996-2004 Prevalence of diarrhoea 14 25 -- Oral rehydration therapy (ORT) Children with diarrhoea that received oral rehydration solution and/or household solution
60 86 --
Home management of diarrhoea Children with diarrhoea that received more fluids AND continued eating food
23 28 --
ORT or increased fluids AND continued feeding 31 -- 30
Diarrhoea is the second leading cause of death worldwide among children under five years of age. Most diarrhoea-related deaths in children are due to dehydration from loss of large quantities of water and electrolytes from the body in liquid stools. Management of diarrhoea—either through oral rehydration solution (ORS) or a recommended home fluid (RHF)—can prevent many of these deaths. Preventing dehydration and malnutrition by increasing fluid intake and continuing to feed the child during diarrhoeal episodes are also important strategies for managing diarrhoea. The goals with regards to diarrhoeal disease and management are to: 1) reduce deaths due to diarrhoea among children under five by one-half by 2010 compared to 2000 (A World Fit for Children); and, 2) reduce the mortality rate among children under five by two-thirds by 2015 compared to 1990 (Millennium Development Goal). In addition, the World Fit for Children calls for a reduction in the incidence of diarrhoea by 25 percent. The primary indicators with regards to diarrhoeal disease and management that have been measured through the MICS3 are the following:
• Prevalence of diarrhoea • Oral rehydration therapy (ORT) • Home management of diarrhoea • (ORT or increased fluids) AND continued feeding
In the MICS3 questionnaire, mothers (or caretakers) were asked to report whether their child had diarrhoea in the two weeks prior to the survey. If yes, the mother was asked a series of questions about what the child had to drink and eat during the episode and whether this was more or less than the child usually ate and drank. Overall, 14 percent of children under five had diarrhoea in the two weeks preceding the survey (Table CH.4). Diarrhoea prevalence was lowest in the South and Western Area (11 percent) and highest in the North (18 percent). Among children of different age groups, the peak of diarrhoea prevalence (22 percent) occurs during the weaning period (i.e., among children aged 12-23 months). Table CH.4 also shows the percentage of children receiving various types of recommended liquids during diarrhoeal episodes. Since mothers were able to name more than one type of liquid, the percentages add to more than 100. About 51 percent received fluids from ORS
30
packets; 7 percent received pre-packaged ORS fluids; and, 12 percent received recommended homemade fluids. Approximately 60 percent of children with diarrhoea received one or more of the recommended home treatments (i.e., were treated with ORS or RHF), while 40 percent received no treatment. Figure CH.3 shows the disparities, by selected background variables, in the percentage of children with diarrhoea who received ORT. The use of ORT was found to be lowest in the North and South (55 and 58 percent, respectively) and highest in the Western Area (79 percent). Children of mothers with no education are less likely to receive ORT than children of mothers with primary or secondary-plus education. The utilization of ORT was higher in urban than rural areas (77 versus 55 percent) and much higher among children from households in the upper two wealth quintiles, as compared to the lower three quintiles. There was little variation in ORT use rates among children from different age groups.
Slightly more than one-half (51 percent) of under-five children with diarrhoea drank more than usual during their illness while 47 percent drank the same or less (Table CH.5). Forty percent ate somewhat less, the same or more than usual (continued feeding) while sixty percent ate much less than usual or almost nothing. Combining these findings, only 23 percent of children with diarrhoea received increased fluids and at the same time continued feeding. Thirty-one percent of children received home treatment according to the recommendation: that is, they either received ORT or increased their fluid intake, and at the same time, continued feeding. There are modest differences by background characteristics in the percentage of children who received ORT or increased fluids and continued feeding. Among provinces, the percentage of children ranges from 30 to 37 percent in all provinces except for the Western Area, where it is a meagre 16 percent. Differences by gender, location (rural/urban), and mother’s education level are unremarkable and do not exceed five percent (see Figure CH.4). Children aged 24-48 months have a much higher level of appropriate management than do children of other age groups. Analysis of this indicator by household wealth status reveals
Figure CH.3 Percentage of children aged 0-59 months with diarrhoea whoreceived oral rehydration treatment. Sierra Leone, 2005
67
5558
79
58
70 69
60
0
10 20 30 40 50
60 70
80 90
East North South West None Primary Secondary + Country
Percent
31
that mothers in the poorest quintile demonstrate a somewhat higher level of appropriate management as compared to mothers from the other four quintiles.
Discussion: Oral rehydration therapy Due to a major decrease in the use of ORT over the last five years and steadily low levels of home management of diarrhoeal disease (DD), the results presented above are not encouraging. Child health specialists note that there have been shortages in the supply of ORT recently that may have contributed to the result. It appears that there may be an over-reliance on packaged ORS in Sierra Leone (it is easily caretakers’ preferred method of treatment) and that household members do not readily prepare homemade ORS if the packets are not available. The negative effects of this practice are exacerbated by low levels of awareness and knowledge among household members regarding the need for children to continue taking fluids and food during DD. Policy and programming recommendations with regards to improving the situation include considering the establishment of ORT corners in health centres and training Blue Flag Volunteers and community members regarding their use. The use of locally-made ORS formulas should be promoted in these corners as should the importance of increased fluid intake and continued feeding.
3031
3716
3227
3130
34
31
0 5 10 15 20 25 30 35 40
Regions East
North South West
Area Rural
Urban
Mother's Education
No education Primary
Secondary +
Country
Percent
Figure CH.4 Percentage of children aged 0-59 months withdiarrhoea who received ORT or increased fluids AND
continued feeding. Sierra Leone, 2005
32
Care Seeking and Antibiotic Treatment of Pneumonia
Key indicators Estimates (percent) West-Central Africa 2005 (MICS3) 2000 (MICS2) 1998-2004 Prevalence of suspected pneumonia 11 9 10 Knowledge of danger signs of pneumonia 14 -- -- Care seeking for suspected pneumonia 48 50 35 Antibiotic treatment of suspected pneumonia 21 -- -- At the global level, pneumonia is the leading cause of death in children and the treatment of under-5s who have suspected pneumonia with antibiotics is an important intervention. A World Fit for Children goal is to reduce by one-third the deaths due to acute respiratory infections. In the MICS3 survey, a child with suspected pneumonia is defined as a child whose caretaker reported that s/he had an illness with a cough accompanied by rapid or difficult breathing and whose symptoms were NOT due to a problem in the chest and a blocked nose. The analysis below was limited to children who had suspected pneumonia during the two weeks prior to the survey. The indicators of interest are the following:
• Prevalence of suspected pneumonia • Knowledge of the danger signs of pneumonia • Care seeking for suspected pneumonia • Antibiotic treatment for suspected pneumonia
Table CH.6 presents the prevalence of suspected pneumonia and—if care was sought outside the home—the site of care. Eleven percent of children aged 0-59 months were reported to have had symptoms of pneumonia during the two weeks preceding the survey. Of these children, 48 percent were taken to an appropriate provider. The types of facilities that provided services to a substantial percentage of children with suspected pneumonia include government hospitals (9 percent), health centers (22 percent) and health posts (7 percent), village health workers (6 percent), and private health centers ( 5 percent). The use of appropriate providers is somewhat higher for male children (50 percent) than female children (45 percent). Caretakers in the South make the highest use of appropriate providers (50 percent) while the lowest rate of use is in the Western Area (42 percent). Younger children are more likely to be taken to be seen by an appropriate provider than are older children. The association of the utilization of an appropriate provider with the variables mother’s education and wealth status is mixed and does not follow a linear trend. Table CH.7 presents data that describe the use of antibiotics for the treatment of suspected pneumonia in under-5s by sex, age, province, residence, and socioeconomic status. In Sierra Leone, 21 percent of under-5 children with suspected pneumonia during the two weeks prior to the survey were treated with an antibiotic. The percentage treated with an antibiotic was highest (47 percent) in the Western Area and varied among the other provinces from 27 percent in the East to 13 percent in the North. The table also shows that antibiotic treatment of suspected pneumonia is highest among children from the two highest wealth quintiles and among children whose mothers/caretakers have secondary education or higher. Mothers’ knowledge of danger signs of pneumonia is an important determinant of care-seeking behaviour. Issues related to knowledge of danger signs of pneumonia are presented in Table CH.7A. Only 14 percent of women knew both of the two key danger signs of pneumonia—fast breathing and difficult breathing. The most commonly identified symptom
33
for taking a child to a health facility is fever (83 percent). Twenty-one percent of mothers identified fast breathing and 27 percent of mothers identified difficult breathing as symptoms that require taking a sick child to see a health care provider immediately. Differences in the level of this indicator vary little by all background characteristics except for province, where huge variation is seen: three percent of mothers in the East and seven percent of mothers in the North demonstrate correct knowledge, as compared to 15 and 33 percent in the Western Area and South, respectively. Discussion: Care seeking and antibiotic treatment of pneumonia The results presented above suggest that the status of care for children with pneumonia in Sierra Leone is dismal. Caretakers do not know key symptoms of the disease, more than half of children with suspected pneumonia are not seen by a trained provider, and only ten percent (0.48 x 0.21) of children with suspected pneumonia receive antibiotics. Key indicators suggest that the situation is highly inequitable: children living in the poorest areas of the country, in the poorest households, and in households where the education level is the lowest, have the lowest access to services and antibiotics. The indicators antibiotic treatment of suspected pneumonia and knowledge of danger signs of pneumonia were not measured in the 2000 MICS2, making it impossible to assess trends in their level over time. A related indicator—the percentage of children with ARI taken to an appropriate health provider—was measured in the MICS2, and its value has remained static over the past five years (see table above). The value of this latter indicator remains higher in Sierra Leone than the WCA norm, suggesting that programs to raise awareness of Sierra Leonean caretakers regarding the need to seek care for severe ARI may have achieved a relative level of “success”. Policy makers should seek to increase demand for ARI services while also ensuring that quality ARI services are provided at the nation’s community-level health facilities. There is an urgent need to increase the access to treatment and antibiotics for children from disadvantaged households. Solid Fuel Use
Key indicators Estimate (percent) 2005 (MICS3) Households using solid fuels as primary source of domestic energy for cooking 99
More than 3 billion people around the world rely on solid fuels (biomass and coal) for their basic energy needs, including cooking and heating. Cooking and heating with solid fuels leads to high levels of indoor pollution and is a major cause of ill-health in the world—particularly among under-5 children—through its contribution to acute respiratory illness. The main problem with the use of solid fuels is that it creates by-products of incomplete combustion that include CO, polyaromatic hydrocarbons, SO2, and other toxic elements. The use of solid fuels increases the risks of acute respiratory illness, pneumonia, chronic obstructive lung disease, cancer, low birth weight, cataracts, asthma and possibly tuberculosis. The primary MICS3 indicator with regard to solid fuel use is the percentage of the population using solid fuels as the primary source of domestic energy for cooking.
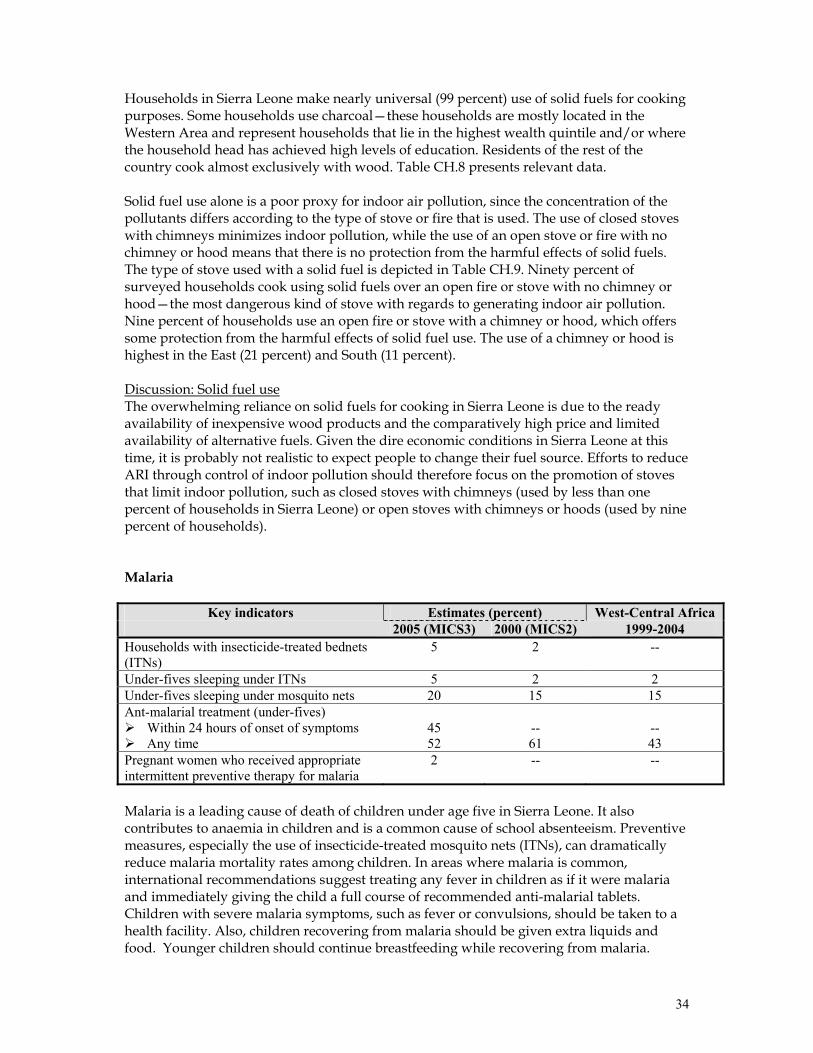
34
Households in Sierra Leone make nearly universal (99 percent) use of solid fuels for cooking purposes. Some households use charcoal—these households are mostly located in the Western Area and represent households that lie in the highest wealth quintile and/or where the household head has achieved high levels of education. Residents of the rest of the country cook almost exclusively with wood. Table CH.8 presents relevant data. Solid fuel use alone is a poor proxy for indoor air pollution, since the concentration of the pollutants differs according to the type of stove or fire that is used. The use of closed stoves with chimneys minimizes indoor pollution, while the use of an open stove or fire with no chimney or hood means that there is no protection from the harmful effects of solid fuels. The type of stove used with a solid fuel is depicted in Table CH.9. Ninety percent of surveyed households cook using solid fuels over an open fire or stove with no chimney or hood—the most dangerous kind of stove with regards to generating indoor air pollution. Nine percent of households use an open fire or stove with a chimney or hood, which offers some protection from the harmful effects of solid fuel use. The use of a chimney or hood is highest in the East (21 percent) and South (11 percent). Discussion: Solid fuel use The overwhelming reliance on solid fuels for cooking in Sierra Leone is due to the ready availability of inexpensive wood products and the comparatively high price and limited availability of alternative fuels. Given the dire economic conditions in Sierra Leone at this time, it is probably not realistic to expect people to change their fuel source. Efforts to reduce ARI through control of indoor pollution should therefore focus on the promotion of stoves that limit indoor pollution, such as closed stoves with chimneys (used by less than one percent of households in Sierra Leone) or open stoves with chimneys or hoods (used by nine percent of households). Malaria
Key indicators Estimates (percent) West-Central Africa 2005 (MICS3) 2000 (MICS2) 1999-2004 Households with insecticide-treated bednets (ITNs)
5 2 --
Under-fives sleeping under ITNs 5 2 2 Under-fives sleeping under mosquito nets 20 15 15 Ant-malarial treatment (under-fives)
Within 24 hours of onset of symptoms Any time
45 52
-- 61
-- 43
Pregnant women who received appropriate intermittent preventive therapy for malaria
2 -- --
Malaria is a leading cause of death of children under age five in Sierra Leone. It also contributes to anaemia in children and is a common cause of school absenteeism. Preventive measures, especially the use of insecticide-treated mosquito nets (ITNs), can dramatically reduce malaria mortality rates among children. In areas where malaria is common, international recommendations suggest treating any fever in children as if it were malaria and immediately giving the child a full course of recommended anti-malarial tablets. Children with severe malaria symptoms, such as fever or convulsions, should be taken to a health facility. Also, children recovering from malaria should be given extra liquids and food. Younger children should continue breastfeeding while recovering from malaria.
35
The MICS3 questionnaire incorporates questions on the availability and use of bed nets, both at household level and among children under five years of age. Other questions assess anti-malarial treatment and intermittent preventive therapy for malaria. Survey results indicate that only five percent of households in Sierra Leone have at least one ITN (Table CH.10). The ITNs that are available in Sierra Leone are the long-lasting variety that do not require treatment with an insecticide for five years. Results also indicate that 20 percent of children under the age of five slept under any type of mosquito net (i.e., treated or untreated) the night prior to the survey while 5 percent slept under an ITN (Table CH.11). The use of ITNs as well as the use of untreated bed nets by children under five declines steadily with increasing age of the child. There were no significant gender disparities in use of ITNs / bed nets among children under five. Questions on the prevalence of fever and its treatment were asked for all children under age five. Slightly more than one in three (35 percent) children were ill with fever in the two weeks prior to the MICS3 (Table CH.12). Fever prevalence was highest among children aged 12-23 months (41 percent) and thereafter declined slowly with increasing age. The prevalence of fever was relatively similar across all levels of mother’s education and wealth quintiles. Among provinces, fever was least prevalent in the Western Area (26 percent) and most prevalent in the North (39 percent). Among children who experienced fever in the two weeks prior to the survey, caretakers were asked to report all of the medicines that were given to their children to treat the fever, including medicines given at home and medicines given or prescribed at a health facility. Overall, 52 percent of children with fever in the last two weeks were treated with an “appropriate” anti-malarial drug and 45 percent received anti-malarial drugs within 24 hours of onset of symptoms. “Appropriate” anti-malarial drugs include Chloroquine, Fansidar, and artimisine combination drugs. In Sierra Leone, 46 percent of children with fever were given Chloroquine and 5 percent were given quinine. Only one percent received artimisine combination therapy. More than two-thirds of children with malaria (68 percent) were given other types of medicines that are not anti-malarials, including anti-pyretics such as paracetamol, aspirin or ibuprofen. Overall, children with fever in the East (54 percent) and South (53 percent) are the most likely to have received an appropriate anti-malarial drug within 24 hours of the onset of symptoms while those in the North, where malaria is most prevalent, are the least likely (35 percent) to receive an appropriate anti-malarial drug in timely fashion. Urban children are slightly more likely than rural children to be treated appropriately as are the children of mothers with secondary or higher education. Little difference was noted between the percentage of boys and girls receiving appropriate anti-malarial drugs. Pregnant women living in places where malaria is highly prevalent are four times more likely than other adults to get malaria and twice as likely to die of the disease. Once infected, pregnant women risk anemia, premature delivery and stillbirth. Their babies are more likely to be of low birth weight, which increases the risk that they may not survive their first year of life. For this reason, steps are taken to protect pregnant women by distributing ITNs and treatment during antenatal check-ups with drugs that prevent malaria infection (intermittent preventive treatment or IPT). In the Sierra Leone MICS3 survey, women were questioned
36
regarding the medicines they had received in their last pregnancy during the 2 years preceding the survey. Women are considered to have received IPT if they have received at least 2 doses of SP/Fansidar during the pregnancy. Data regarding the percentage of pregnant women who gave birth in the two years preceding the survey and who received IPT for malaria are presented in Table CH.13. Only two percent of eligible women received IPT. The few women who received IPT tended to be from the Western Area or from urban locations, to have been educated up through the secondary level or above, and to come from the highest wealth quintile. Discussion: Malaria One in six children in Sierra Leone takes malaria medication every two weeks. Since 2000, the use of mosquito nets—both ITNs as well as normal bednets—has increased slightly due to the program that distributes ITNs free of charge to families with pregnant women and children. However, the percentage of households that use bednets is still low. These findings suggest that the people of Sierra Leone continue to emphasize a curative, rather than preventive, approach to malaria control among children. Organizations and individuals working in child public health issues in Sierra Leone must make it a priority to change this approach and emphasize prevention over cure. Among the four provinces of Sierra Leone, the North has the highest level of malaria morbidity and highest use of bednets—but the lowest level of treatment of febrile children with an appropriate anti-malaria drug. These differences between the North and the other provinces are less stark than during MICS2—when the North had the highest morbidity but lowest use of antibiotics and bednets—suggesting that the emphasis on targeting the Northern Province with additional resources to control malaria has achieved some success and should be continued. Policy makers and programmers should allocate more resources to interventions that prevent malaria. Roughly equal disease burden and bednet use in the East, South and North suggest that resources be distributed equitably among these three provinces. ITNs must be made much more widely available to the public at the lowest possible cost through a sustainable mechanism. This process could be aided by tax waivers for ITNs and additional funding to support an increase in the coverage of ITN distribution programs and other strategies to prevent malaria. The promotion of ITNs for use by pregnant women and children under five should also be emphasized. On the curative side, malaria in children should be dealt with through an integrated approach to management of sick children—that is, through CBIMCI, the national roll-out of which should be prioritized.
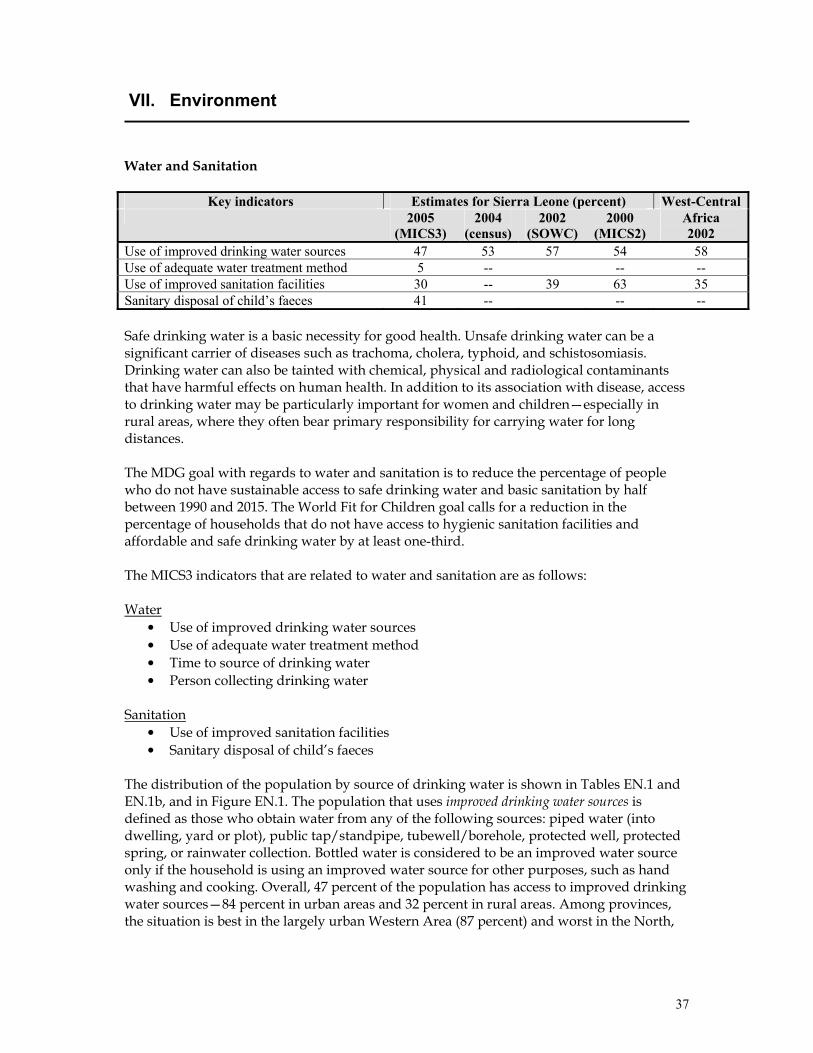
37
VII. Environment
Water and Sanitation
Key indicators Estimates for Sierra Leone (percent) West-Central 2005
(MICS3) 2004
(census)2002
(SOWC) 2000
(MICS2) Africa 2002
Use of improved drinking water sources 47 53 57 54 58 Use of adequate water treatment method 5 -- -- -- Use of improved sanitation facilities 30 -- 39 63 35 Sanitary disposal of child’s faeces 41 -- -- -- Safe drinking water is a basic necessity for good health. Unsafe drinking water can be a significant carrier of diseases such as trachoma, cholera, typhoid, and schistosomiasis. Drinking water can also be tainted with chemical, physical and radiological contaminants that have harmful effects on human health. In addition to its association with disease, access to drinking water may be particularly important for women and children—especially in rural areas, where they often bear primary responsibility for carrying water for long distances. The MDG goal with regards to water and sanitation is to reduce the percentage of people who do not have sustainable access to safe drinking water and basic sanitation by half between 1990 and 2015. The World Fit for Children goal calls for a reduction in the percentage of households that do not have access to hygienic sanitation facilities and affordable and safe drinking water by at least one-third. The MICS3 indicators that are related to water and sanitation are as follows: Water • Use of improved drinking water sources • Use of adequate water treatment method • Time to source of drinking water • Person collecting drinking water
Sanitation • Use of improved sanitation facilities • Sanitary disposal of child’s faeces
The distribution of the population by source of drinking water is shown in Tables EN.1 and EN.1b, and in Figure EN.1. The population that uses improved drinking water sources is defined as those who obtain water from any of the following sources: piped water (into dwelling, yard or plot), public tap/standpipe, tubewell/borehole, protected well, protected spring, or rainwater collection. Bottled water is considered to be an improved water source only if the household is using an improved water source for other purposes, such as hand washing and cooking. Overall, 47 percent of the population has access to improved drinking water sources—84 percent in urban areas and 32 percent in rural areas. Among provinces, the situation is best in the largely urban Western Area (87 percent) and worst in the North,
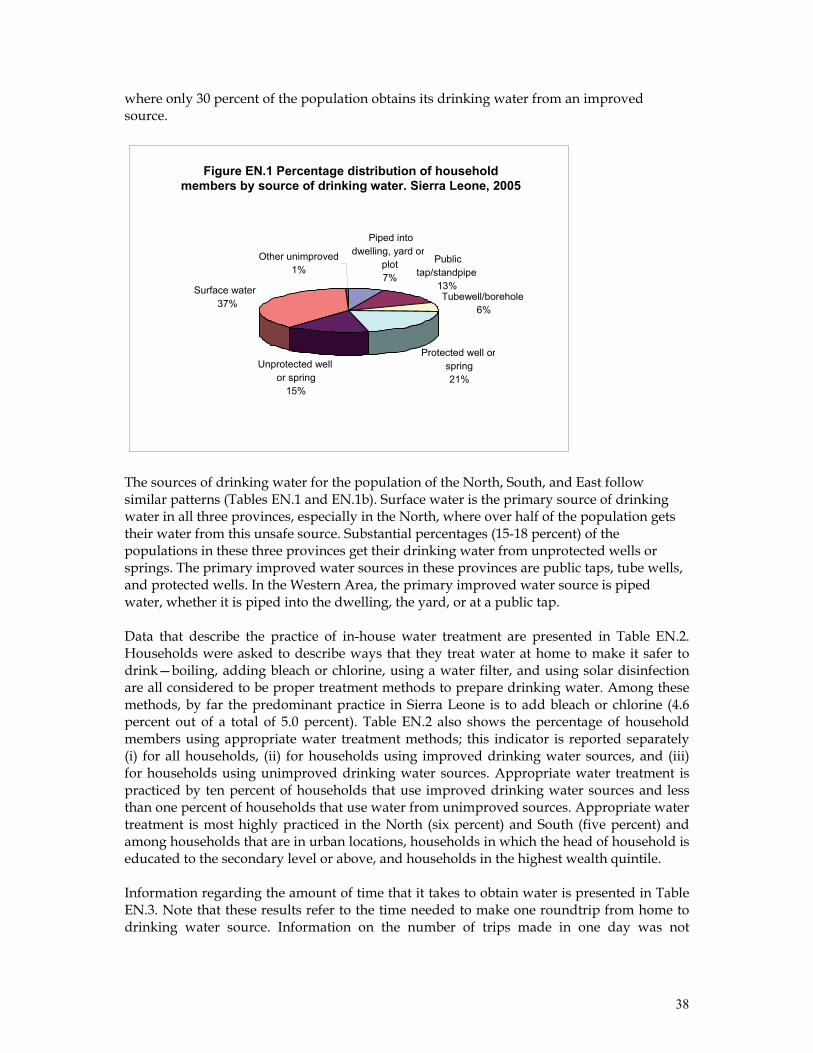
38
where only 30 percent of the population obtains its drinking water from an improved source.
The sources of drinking water for the population of the North, South, and East follow similar patterns (Tables EN.1 and EN.1b). Surface water is the primary source of drinking water in all three provinces, especially in the North, where over half of the population gets their water from this unsafe source. Substantial percentages (15-18 percent) of the populations in these three provinces get their drinking water from unprotected wells or springs. The primary improved water sources in these provinces are public taps, tube wells, and protected wells. In the Western Area, the primary improved water source is piped water, whether it is piped into the dwelling, the yard, or at a public tap. Data that describe the practice of in-house water treatment are presented in Table EN.2. Households were asked to describe ways that they treat water at home to make it safer to drink—boiling, adding bleach or chlorine, using a water filter, and using solar disinfection are all considered to be proper treatment methods to prepare drinking water. Among these methods, by far the predominant practice in Sierra Leone is to add bleach or chlorine (4.6 percent out of a total of 5.0 percent). Table EN.2 also shows the percentage of household members using appropriate water treatment methods; this indicator is reported separately (i) for all households, (ii) for households using improved drinking water sources, and (iii) for households using unimproved drinking water sources. Appropriate water treatment is practiced by ten percent of households that use improved drinking water sources and less than one percent of households that use water from unimproved sources. Appropriate water treatment is most highly practiced in the North (six percent) and South (five percent) and among households that are in urban locations, households in which the head of household is educated to the secondary level or above, and households in the highest wealth quintile. Information regarding the amount of time that it takes to obtain water is presented in Table EN.3. Note that these results refer to the time needed to make one roundtrip from home to drinking water source. Information on the number of trips made in one day was not
Figure EN.1 Percentage distribution of householdmembers by source of drinking water. Sierra Leone, 2005
Piped into dwelling, yard or
plot7%
Public tap/standpipe
13%Tubewell/borehole
6%
Protected well or spring21%
Unprotected wellor spring
15%
Surface water 37%
Other unimproved1%
39
collected. Related data that describe the person who usually collects the water are presented in Table EN.4. Result in Table EN.3 shows that the drinking water source on the premises is only nine percent of households. It takes less than 30 minutes to get to the water source and bring water in almost seventy percent of all households, while another 18 percent of households spend 30-60 minutes for this purpose. Excluding those households with water on the premises, the average time for a roundtrip to the source of drinking water is more than 17 minutes. There is little variation in this figure when it is analyzed by background characteristics. The time spent collecting water in rural and urban areas is equal. Result in Table EN.4 shows that an adult female collects the water (when the source of drinking water is not on the premises) in 70 percent of households. Adult men collect water in only nine percent of households, children under age 15 collect water in the remaining households (21 percent). Children and men play a much greater role collecting water in the Western Area than in other provinces. Inadequate disposal of human excreta and poor personal hygiene are associated with a range of diseases including diarrhoeal diseases and polio. Improved sanitation facilities for excreta disposal include the following: flush or pour flush to a piped sewer system, septic tank, or latrine; ventilated improved pit latrine or pit latrine with slab; and, composting toilet. Thirty percent of the population of Sierra Leone lives in households that use improved sanitation facilities (Table EN.5). This percentage is 64 in urban areas and 17 percent in rural areas. Residents of the East (20 percent) and North (22 percent) are the least likely to use improved facilities. In the East and South most of the population uses rivers, bush, fields, or has no facilities. In contrast, in the North the most common facility is a pit latrine without slab or an open pit. Fifty-four percent of the population in the Western Area uses a pit latrine with slab. The table indicates that use of improved sanitation facilities is strongly correlated with location (urban versus rural), increasing wealth status, and increasing educational level of the head of household. In the MICS3 survey, a child’s faeces are considered to be safely disposed of if the child’s last stool was rinsed into a toilet or latrine or if the child used a toilet to defecate. Data that describe the disposal of faeces of children 0-2 years of age are presented in Table EN.6. The table reveals that the stools of forty-one percent of surveyed children were disposed of safely. The practice of safe disposal was lowest in the South (28 percent) and highest in the Western Area (90 percent). The practice is strongly correlated with urban residence and increasing socioeconomic status. An overview of the percentage of households with improved sources of drinking water and sanitary means of excreta disposal is presented in Table EN.7. A combination indicator has been formed that measures the percentage of households that have both an improved source of drinking water and sanitary means of excreta disposal. Twenty-four percent of households in Sierra Leone meet this standard, ranging from 13 percent in the North to 63 percent in the Western Area. Similar to other water and sanitation indicators, high levels of
Millennium Development Goal Indicator Population with access to safe drinking water Goal 82.5 percent by 2015
40
this indicator are associated with urban residence, increasing levels of education of the head of household, and increasing socioeconomic status. Discussion: Water and sanitation The MICS3 estimates of the Sierra Leonean population’s access to improved sources of drinking water (46 percent) and sanitation facilities (30 percent) are lower than previous estimates. Enumerators were carefully trained on the different definitions of improved water and sanitation facilities and may have collected more accurate data than have been collected in the past. Other reasons that the MICS3 estimates may be lower than previous estimates include the following: 1. There has been a gradual movement of population from urban (where improved sources
are more readily available) to rural locations following the end of the conflict. The MICS2 survey was conducted in 2000 at the height of the war, when many people had moved temporarily to urban locations. There was massive destruction of water and sanitation facilities during the war until it ended in 2002.
2. Interviewers’ access to remote and rural locations (where improved sources of water and sanitation are less readily available) in MICS2 was limited, which may have led to an overestimation of access to improved sources of water and sanitation in that survey.
The results above suggest that policy makers should consider prioritizing the allocation of resources to provide potable water to rural communities while emphasizing sustainability through support to community-based water system maintenance structures. Water and sanitation programs in Sierra Leone should emphasize the development of improved water sources while raising the public’s awareness regarding good hygiene practices. Policy makers should consider revitalizing and enforcing the GoSL act that stipulates that a house owner must first construct a latrine before building a house. Policies that provide incentives for the private sector to produce materials used to build basic sanitation facilities (e.g., latrine slabs, etc.) may also contribute to the improvement of the public’s access to improved sanitary facilities. The conduct of programs that promote and facilitate the construction of low-cost family latrines in rural communities would help to raise the percentage of households with access to improved sanitary facilities.
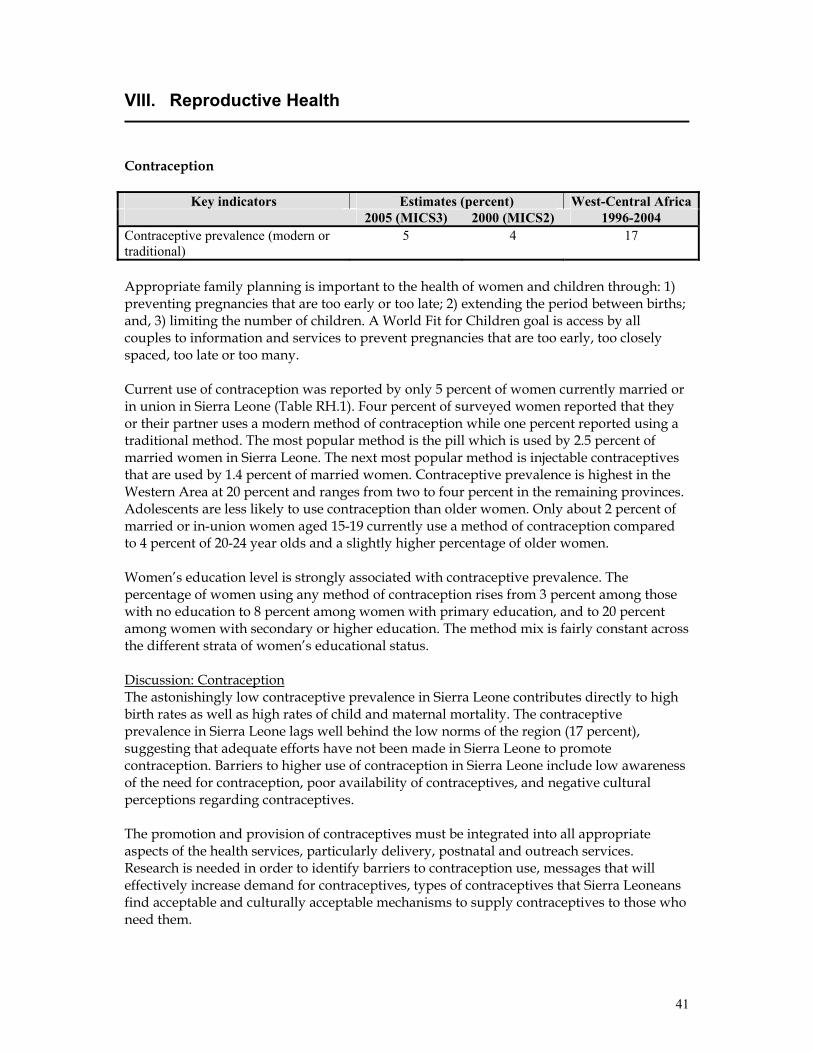
41
VIII. Reproductive Health
Contraception
Key indicators Estimates (percent) West-Central Africa 2005 (MICS3) 2000 (MICS2) 1996-2004 Contraceptive prevalence (modern or traditional)
5 4 17
Appropriate family planning is important to the health of women and children through: 1) preventing pregnancies that are too early or too late; 2) extending the period between births; and, 3) limiting the number of children. A World Fit for Children goal is access by all couples to information and services to prevent pregnancies that are too early, too closely spaced, too late or too many. Current use of contraception was reported by only 5 percent of women currently married or in union in Sierra Leone (Table RH.1). Four percent of surveyed women reported that they or their partner uses a modern method of contraception while one percent reported using a traditional method. The most popular method is the pill which is used by 2.5 percent of married women in Sierra Leone. The next most popular method is injectable contraceptives that are used by 1.4 percent of married women. Contraceptive prevalence is highest in the Western Area at 20 percent and ranges from two to four percent in the remaining provinces. Adolescents are less likely to use contraception than older women. Only about 2 percent of married or in-union women aged 15-19 currently use a method of contraception compared to 4 percent of 20-24 year olds and a slightly higher percentage of older women. Women’s education level is strongly associated with contraceptive prevalence. The percentage of women using any method of contraception rises from 3 percent among those with no education to 8 percent among women with primary education, and to 20 percent among women with secondary or higher education. The method mix is fairly constant across the different strata of women’s educational status. Discussion: Contraception The astonishingly low contraceptive prevalence in Sierra Leone contributes directly to high birth rates as well as high rates of child and maternal mortality. The contraceptive prevalence in Sierra Leone lags well behind the low norms of the region (17 percent), suggesting that adequate efforts have not been made in Sierra Leone to promote contraception. Barriers to higher use of contraception in Sierra Leone include low awareness of the need for contraception, poor availability of contraceptives, and negative cultural perceptions regarding contraceptives. The promotion and provision of contraceptives must be integrated into all appropriate aspects of the health services, particularly delivery, postnatal and outreach services. Research is needed in order to identify barriers to contraception use, messages that will effectively increase demand for contraceptives, types of contraceptives that Sierra Leoneans find acceptable and culturally acceptable mechanisms to supply contraceptives to those who need them.
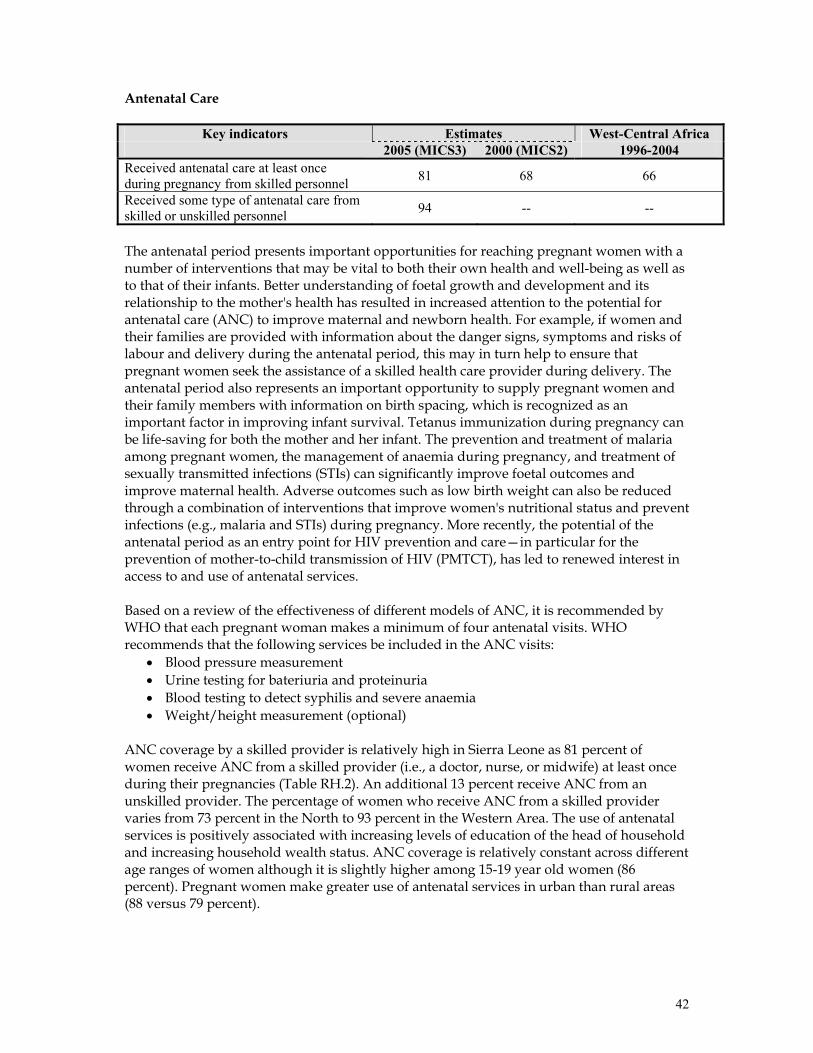
42
Antenatal Care
Key indicators Estimates West-Central Africa 2005 (MICS3) 2000 (MICS2) 1996-2004 Received antenatal care at least once during pregnancy from skilled personnel 81 68 66
Received some type of antenatal care from skilled or unskilled personnel 94 -- --
The antenatal period presents important opportunities for reaching pregnant women with a number of interventions that may be vital to both their own health and well-being as well as to that of their infants. Better understanding of foetal growth and development and its relationship to the mother's health has resulted in increased attention to the potential for antenatal care (ANC) to improve maternal and newborn health. For example, if women and their families are provided with information about the danger signs, symptoms and risks of labour and delivery during the antenatal period, this may in turn help to ensure that pregnant women seek the assistance of a skilled health care provider during delivery. The antenatal period also represents an important opportunity to supply pregnant women and their family members with information on birth spacing, which is recognized as an important factor in improving infant survival. Tetanus immunization during pregnancy can be life-saving for both the mother and her infant. The prevention and treatment of malaria among pregnant women, the management of anaemia during pregnancy, and treatment of sexually transmitted infections (STIs) can significantly improve foetal outcomes and improve maternal health. Adverse outcomes such as low birth weight can also be reduced through a combination of interventions that improve women's nutritional status and prevent infections (e.g., malaria and STIs) during pregnancy. More recently, the potential of the antenatal period as an entry point for HIV prevention and care—in particular for the prevention of mother-to-child transmission of HIV (PMTCT), has led to renewed interest in access to and use of antenatal services. Based on a review of the effectiveness of different models of ANC, it is recommended by WHO that each pregnant woman makes a minimum of four antenatal visits. WHO recommends that the following services be included in the ANC visits:
• Blood pressure measurement • Urine testing for bateriuria and proteinuria • Blood testing to detect syphilis and severe anaemia • Weight/height measurement (optional)
ANC coverage by a skilled provider is relatively high in Sierra Leone as 81 percent of women receive ANC from a skilled provider (i.e., a doctor, nurse, or midwife) at least once during their pregnancies (Table RH.2). An additional 13 percent receive ANC from an unskilled provider. The percentage of women who receive ANC from a skilled provider varies from 73 percent in the North to 93 percent in the Western Area. The use of antenatal services is positively associated with increasing levels of education of the head of household and increasing household wealth status. ANC coverage is relatively constant across different age ranges of women although it is slightly higher among 15-19 year old women (86 percent). Pregnant women make greater use of antenatal services in urban than rural areas (88 versus 79 percent).
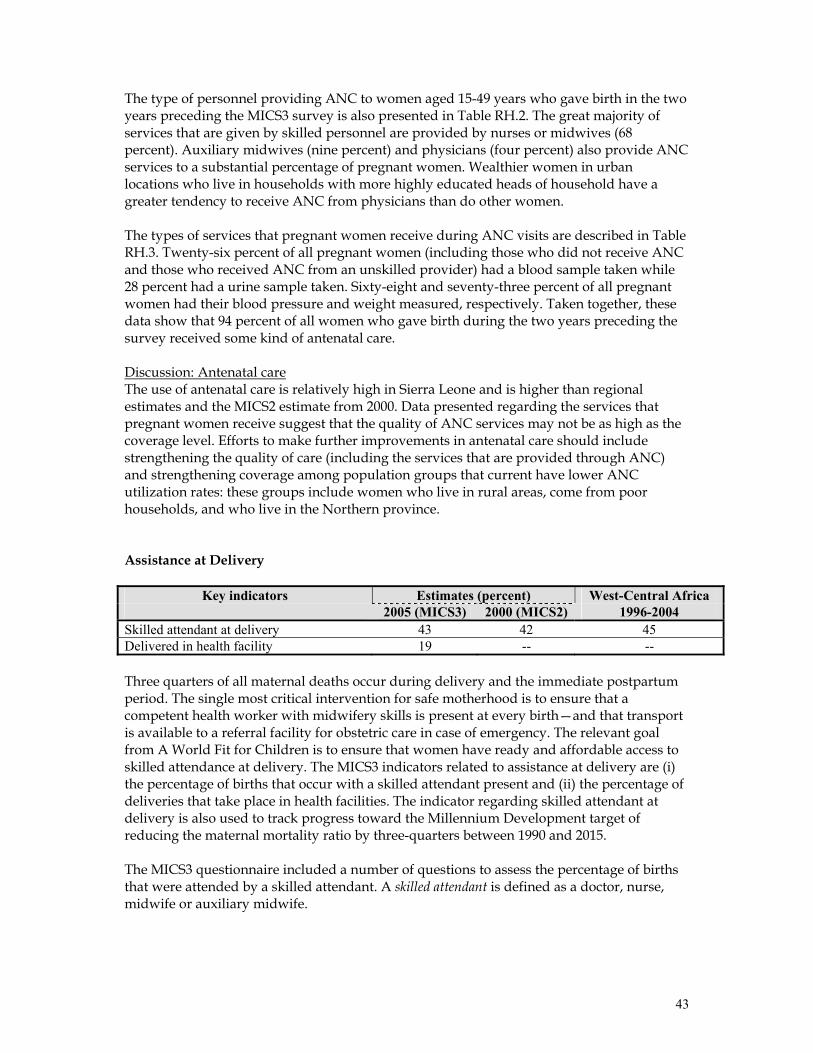
43
The type of personnel providing ANC to women aged 15-49 years who gave birth in the two years preceding the MICS3 survey is also presented in Table RH.2. The great majority of services that are given by skilled personnel are provided by nurses or midwives (68 percent). Auxiliary midwives (nine percent) and physicians (four percent) also provide ANC services to a substantial percentage of pregnant women. Wealthier women in urban locations who live in households with more highly educated heads of household have a greater tendency to receive ANC from physicians than do other women. The types of services that pregnant women receive during ANC visits are described in Table RH.3. Twenty-six percent of all pregnant women (including those who did not receive ANC and those who received ANC from an unskilled provider) had a blood sample taken while 28 percent had a urine sample taken. Sixty-eight and seventy-three percent of all pregnant women had their blood pressure and weight measured, respectively. Taken together, these data show that 94 percent of all women who gave birth during the two years preceding the survey received some kind of antenatal care. Discussion: Antenatal care The use of antenatal care is relatively high in Sierra Leone and is higher than regional estimates and the MICS2 estimate from 2000. Data presented regarding the services that pregnant women receive suggest that the quality of ANC services may not be as high as the coverage level. Efforts to make further improvements in antenatal care should include strengthening the quality of care (including the services that are provided through ANC) and strengthening coverage among population groups that current have lower ANC utilization rates: these groups include women who live in rural areas, come from poor households, and who live in the Northern province. Assistance at Delivery
Key indicators Estimates (percent) West-Central Africa 2005 (MICS3) 2000 (MICS2) 1996-2004 Skilled attendant at delivery 43 42 45 Delivered in health facility 19 -- -- Three quarters of all maternal deaths occur during delivery and the immediate postpartum period. The single most critical intervention for safe motherhood is to ensure that a competent health worker with midwifery skills is present at every birth—and that transport is available to a referral facility for obstetric care in case of emergency. The relevant goal from A World Fit for Children is to ensure that women have ready and affordable access to skilled attendance at delivery. The MICS3 indicators related to assistance at delivery are (i) the percentage of births that occur with a skilled attendant present and (ii) the percentage of deliveries that take place in health facilities. The indicator regarding skilled attendant at delivery is also used to track progress toward the Millennium Development target of reducing the maternal mortality ratio by three-quarters between 1990 and 2015. The MICS3 questionnaire included a number of questions to assess the percentage of births that were attended by a skilled attendant. A skilled attendant is defined as a doctor, nurse, midwife or auxiliary midwife.
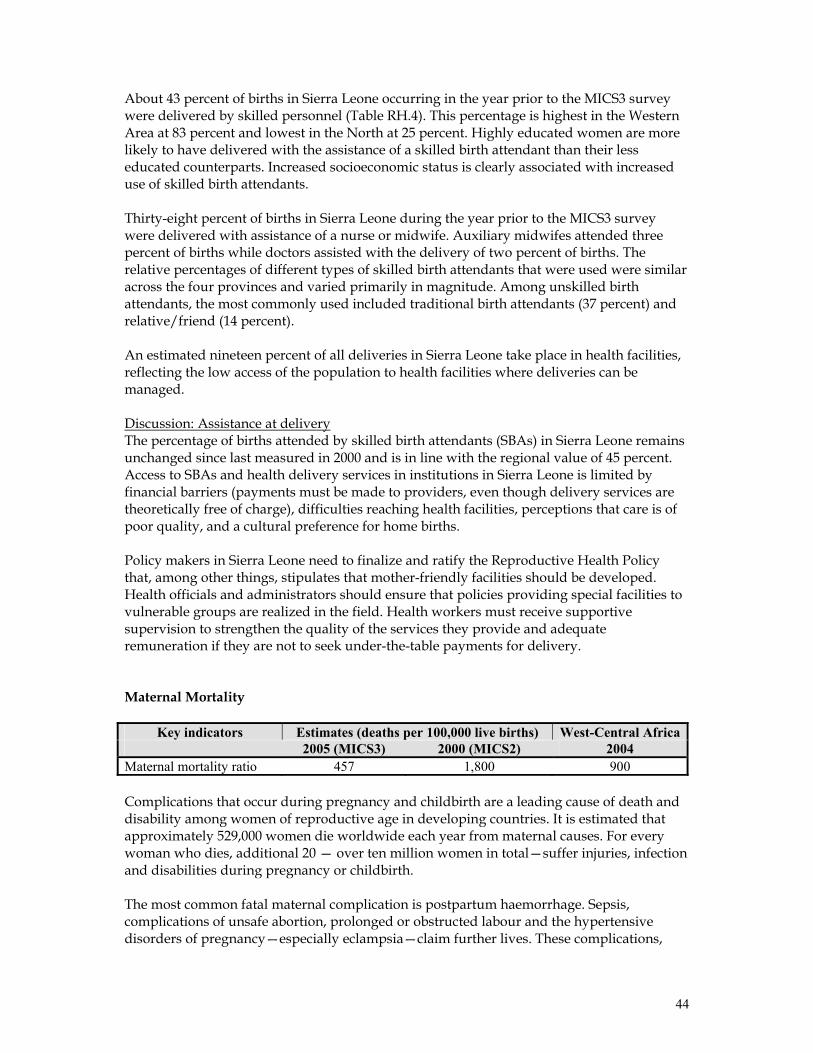
44
About 43 percent of births in Sierra Leone occurring in the year prior to the MICS3 survey were delivered by skilled personnel (Table RH.4). This percentage is highest in the Western Area at 83 percent and lowest in the North at 25 percent. Highly educated women are more likely to have delivered with the assistance of a skilled birth attendant than their less educated counterparts. Increased socioeconomic status is clearly associated with increased use of skilled birth attendants. Thirty-eight percent of births in Sierra Leone during the year prior to the MICS3 survey were delivered with assistance of a nurse or midwife. Auxiliary midwifes attended three percent of births while doctors assisted with the delivery of two percent of births. The relative percentages of different types of skilled birth attendants that were used were similar across the four provinces and varied primarily in magnitude. Among unskilled birth attendants, the most commonly used included traditional birth attendants (37 percent) and relative/friend (14 percent). An estimated nineteen percent of all deliveries in Sierra Leone take place in health facilities, reflecting the low access of the population to health facilities where deliveries can be managed. Discussion: Assistance at delivery The percentage of births attended by skilled birth attendants (SBAs) in Sierra Leone remains unchanged since last measured in 2000 and is in line with the regional value of 45 percent. Access to SBAs and health delivery services in institutions in Sierra Leone is limited by financial barriers (payments must be made to providers, even though delivery services are theoretically free of charge), difficulties reaching health facilities, perceptions that care is of poor quality, and a cultural preference for home births. Policy makers in Sierra Leone need to finalize and ratify the Reproductive Health Policy that, among other things, stipulates that mother-friendly facilities should be developed. Health officials and administrators should ensure that policies providing special facilities to vulnerable groups are realized in the field. Health workers must receive supportive supervision to strengthen the quality of the services they provide and adequate remuneration if they are not to seek under-the-table payments for delivery. Maternal Mortality
Key indicators Estimates (deaths per 100,000 live births) West-Central Africa 2005 (MICS3) 2000 (MICS2) 2004 Maternal mortality ratio 457 1,800 900 Complications that occur during pregnancy and childbirth are a leading cause of death and disability among women of reproductive age in developing countries. It is estimated that approximately 529,000 women die worldwide each year from maternal causes. For every woman who dies, additional 20 — over ten million women in total—suffer injuries, infection and disabilities during pregnancy or childbirth. The most common fatal maternal complication is postpartum haemorrhage. Sepsis, complications of unsafe abortion, prolonged or obstructed labour and the hypertensive disorders of pregnancy—especially eclampsia—claim further lives. These complications,
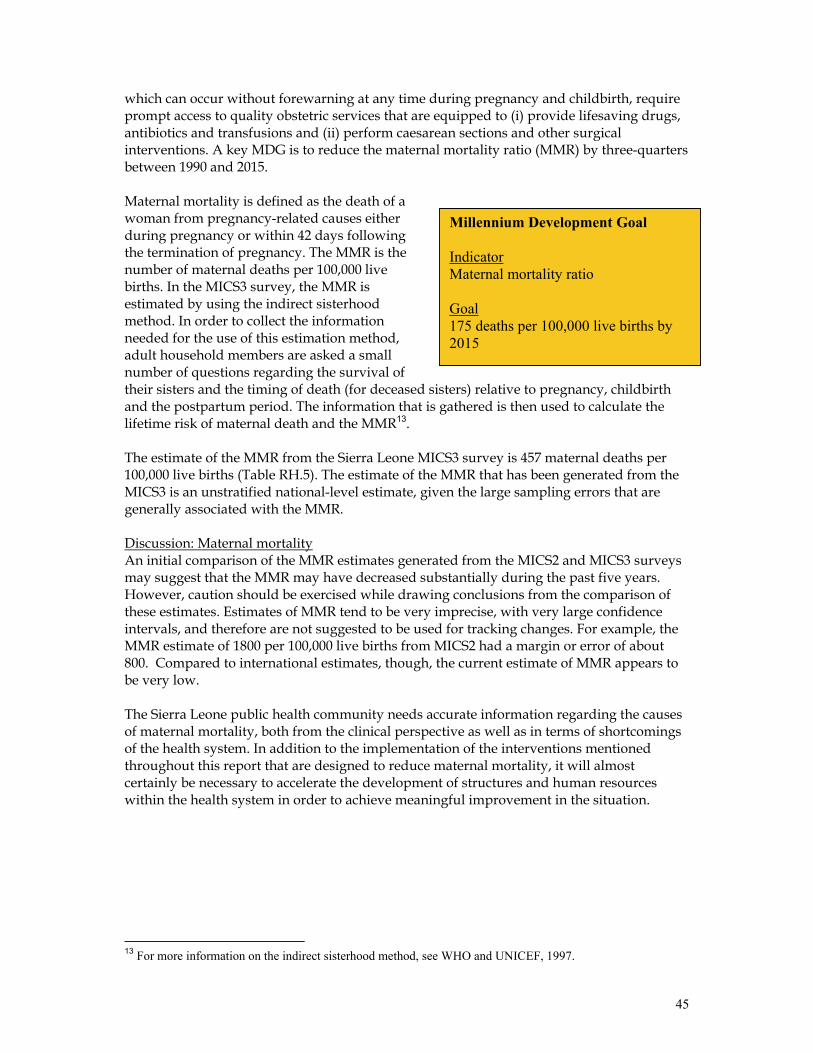
45
which can occur without forewarning at any time during pregnancy and childbirth, require prompt access to quality obstetric services that are equipped to (i) provide lifesaving drugs, antibiotics and transfusions and (ii) perform caesarean sections and other surgical interventions. A key MDG is to reduce the maternal mortality ratio (MMR) by three-quarters between 1990 and 2015. Maternal mortality is defined as the death of a woman from pregnancy-related causes either during pregnancy or within 42 days following the termination of pregnancy. The MMR is the number of maternal deaths per 100,000 live births. In the MICS3 survey, the MMR is estimated by using the indirect sisterhood method. In order to collect the information needed for the use of this estimation method, adult household members are asked a small number of questions regarding the survival of their sisters and the timing of death (for deceased sisters) relative to pregnancy, childbirth and the postpartum period. The information that is gathered is then used to calculate the lifetime risk of maternal death and the MMR13. The estimate of the MMR from the Sierra Leone MICS3 survey is 457 maternal deaths per 100,000 live births (Table RH.5). The estimate of the MMR that has been generated from the MICS3 is an unstratified national-level estimate, given the large sampling errors that are generally associated with the MMR. Discussion: Maternal mortality An initial comparison of the MMR estimates generated from the MICS2 and MICS3 surveys may suggest that the MMR may have decreased substantially during the past five years. However, caution should be exercised while drawing conclusions from the comparison of these estimates. Estimates of MMR tend to be very imprecise, with very large confidence intervals, and therefore are not suggested to be used for tracking changes. For example, the MMR estimate of 1800 per 100,000 live births from MICS2 had a margin or error of about 800. Compared to international estimates, though, the current estimate of MMR appears to be very low. The Sierra Leone public health community needs accurate information regarding the causes of maternal mortality, both from the clinical perspective as well as in terms of shortcomings of the health system. In addition to the implementation of the interventions mentioned throughout this report that are designed to reduce maternal mortality, it will almost certainly be necessary to accelerate the development of structures and human resources within the health system in order to achieve meaningful improvement in the situation.
13 For more information on the indirect sisterhood method, see WHO and UNICEF, 1997.
Millennium Development Goal Indicator Maternal mortality ratio Goal 175 deaths per 100,000 live births by 2015
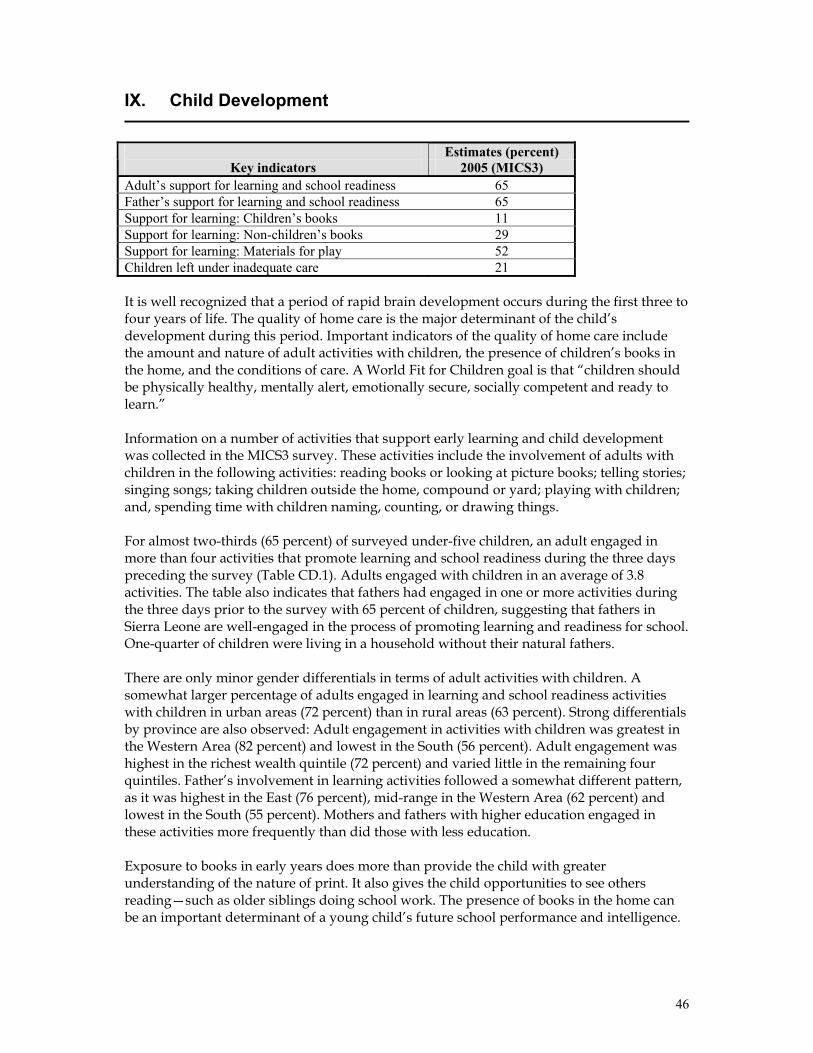
46
IX. Child Development
Estimates (percent)
Key indicators 2005 (MICS3) Adult’s support for learning and school readiness 65 Father’s support for learning and school readiness 65 Support for learning: Children’s books 11 Support for learning: Non-children’s books 29 Support for learning: Materials for play 52 Children left under inadequate care 21 It is well recognized that a period of rapid brain development occurs during the first three to four years of life. The quality of home care is the major determinant of the child’s development during this period. Important indicators of the quality of home care include the amount and nature of adult activities with children, the presence of children’s books in the home, and the conditions of care. A World Fit for Children goal is that “children should be physically healthy, mentally alert, emotionally secure, socially competent and ready to learn.” Information on a number of activities that support early learning and child development was collected in the MICS3 survey. These activities include the involvement of adults with children in the following activities: reading books or looking at picture books; telling stories; singing songs; taking children outside the home, compound or yard; playing with children; and, spending time with children naming, counting, or drawing things. For almost two-thirds (65 percent) of surveyed under-five children, an adult engaged in more than four activities that promote learning and school readiness during the three days preceding the survey (Table CD.1). Adults engaged with children in an average of 3.8 activities. The table also indicates that fathers had engaged in one or more activities during the three days prior to the survey with 65 percent of children, suggesting that fathers in Sierra Leone are well-engaged in the process of promoting learning and readiness for school. One-quarter of children were living in a household without their natural fathers. There are only minor gender differentials in terms of adult activities with children. A somewhat larger percentage of adults engaged in learning and school readiness activities with children in urban areas (72 percent) than in rural areas (63 percent). Strong differentials by province are also observed: Adult engagement in activities with children was greatest in the Western Area (82 percent) and lowest in the South (56 percent). Adult engagement was highest in the richest wealth quintile (72 percent) and varied little in the remaining four quintiles. Father’s involvement in learning activities followed a somewhat different pattern, as it was highest in the East (76 percent), mid-range in the Western Area (62 percent) and lowest in the South (55 percent). Mothers and fathers with higher education engaged in these activities more frequently than did those with less education. Exposure to books in early years does more than provide the child with greater understanding of the nature of print. It also gives the child opportunities to see others reading—such as older siblings doing school work. The presence of books in the home can be an important determinant of a young child’s future school performance and intelligence.
47
In Sierra Leone, 29 percent of children live in households where at least three non-children’s books are present (Table CD.2). Only 11 percent of children aged 0-59 months live in households where at least three children’s books can be found. While no gender differentials are observed, urban children live in households where there is significantly more access to both types of books than exists in rural households. Fifty-five percent of under-5 children living in urban areas live in households with more than three non-children’s books, while the figure is 22 percent in rural households. The percentage of under-5 children who live in households with three or more children’s books is 27 percent in urban areas, compared to seven percent in rural areas. The presence of both non-children’s and children’s books does not differ significantly by child’s age. Fifty-two percent of children aged 0-59 months had 3 or more playthings to play with in their homes, while 12 percent did not have any of the playthings that were described to respondents (Table CD.2). The playthings that were read off to respondents by MICS3 enumerators included household objects (78 percent), homemade toys (50 percent), toys that came from a store (37 percent), and objects and materials found outside the home (71 percent). The percentage of children who have 3 or more playthings to play with differs by only two percentage points among male and female children. No urban-rural differentials are observed while only small differences are observed in terms of mother’s education. Differences in the value of this indicator are negligible among the five wealth quintiles but do vary notably by province from a high of 64 percent in the East to 40 percent in the North. The background variable age of child is strongly correlated with the number of playthings that a child has, as children aged 24-59 months are significantly more likely to have 3 or more playthings than are children less than two years of age. Leaving children alone or under the care of other young children is known to increase the risk of accidents. In the MICS3 survey, questions were asked to find out whether children aged 0-59 months were left alone during the week preceding the interview and whether they were left in the care of other children under 10 years of age. Table CD.3 shows that 20 percent of children aged 0-59 months were left in the care of other children under ten years of age during the week preceding the interview while six percent of children were left alone. Combining these two indicators, it is calculated that 21 percent of children were left under inadequate care during the week preceding the survey. This indicator does not differ among male and female children and varies only modestly by location (rural/urban). Inadequate care was more prevalent among children whose mothers had no education (21 percent) or a primary-level education (24 percent) as opposed to children whose mothers had studied to the secondary level or beyond (16 percent). Children aged 24-59 months were left with inadequate care more (24 percent) than those who were aged 0-23 months (15 percent). Differences in this indicator with regards to socioeconomic status of the household are minor. Discussion: Child development The survey results presented above present a mixed picture of the state of child development in Sierra Leone. If the data that describe adults’ support for learning and school readiness are accurate, they represent an encouraging finding regarding adults’ interest in and dedication to furthering their children’s education. The findings that describe the availability of books in households are discouraging, if predictable, and reflect the low literacy rate in Sierra Leone, ignorance regarding the value of reading materials, poverty and a general unavailability of children’s books. The low
48
availability of materials for children to play with is predictable, given that most families in Sierra Leone are simply trying to deal with poverty and survive, with the result that children’s toys are not considered a priority issue. Parental responsibility is a critical component of child protection; the levels of inadequate care of small children reflect families that are engrossed with survival issues, exacerbated by a breakdown in the extended family support system. Relevant policy makers in the GoSL should ensure that due priority is given to early child development (ECD) within the national development agenda. Educational policies should recognize and build on the links between adult literacy, ECD and parenting education. A thorough understanding of gender roles in the promotion of child learning in Sierra Leone is crucial for the strengthening of ECD. Policies should encourage the participation of both parents in parental education programs. The government should explore strategies to create an enabling environment for the provision of children’s books at minimal or no cost to needy children and schools; for example, they could remove all tariffs related to the import of children’s books. Policies related to child development should articulate the link between play and readiness for school, and also reinforce parental responsibility for child care despite difficult economic circumstances. Programmers should put in place interventions that build parenting skills into adult literacy and ECD programs. They should focus on the development of innovative approaches to strengthening parenting skills to ensure the involvement of men in ECD. Local authors should receive support to develop children’s books that are culturally relevant and interesting to the children of Sierra Leone.
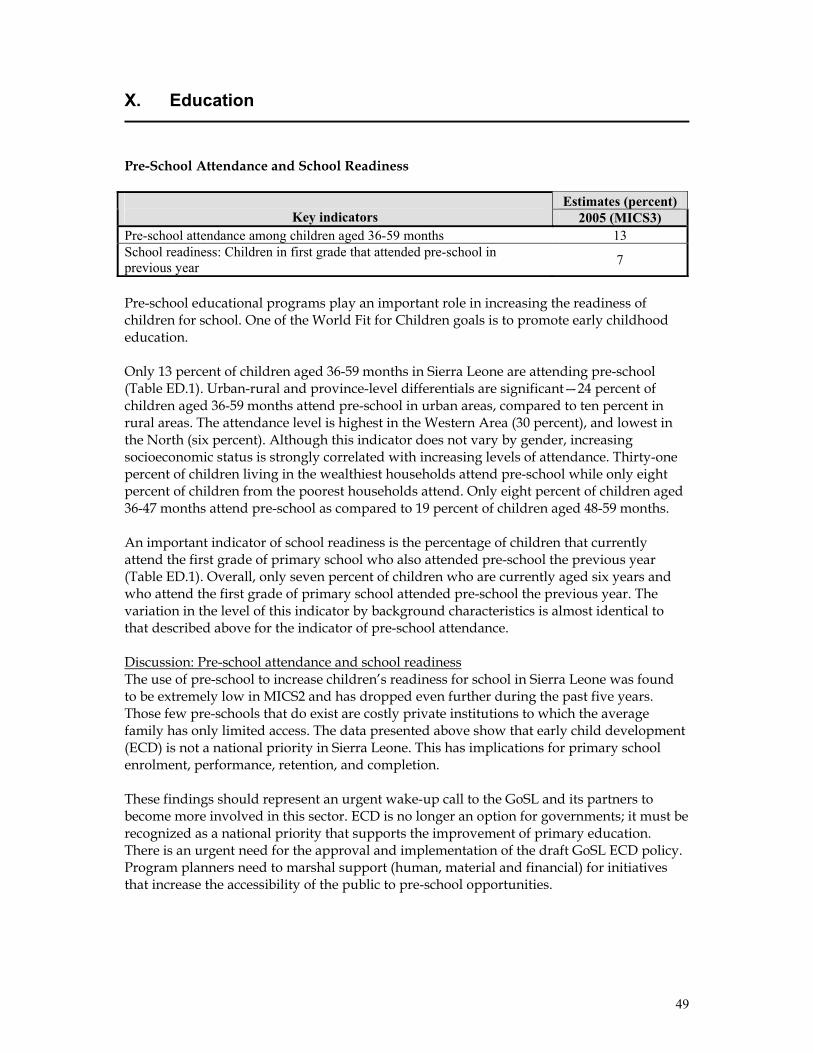
49
X. Education
Pre-School Attendance and School Readiness
Estimates (percent) Key indicators 2005 (MICS3)
Pre-school attendance among children aged 36-59 months 13 School readiness: Children in first grade that attended pre-school in previous year 7
Pre-school educational programs play an important role in increasing the readiness of children for school. One of the World Fit for Children goals is to promote early childhood education. Only 13 percent of children aged 36-59 months in Sierra Leone are attending pre-school (Table ED.1). Urban-rural and province-level differentials are significant—24 percent of children aged 36-59 months attend pre-school in urban areas, compared to ten percent in rural areas. The attendance level is highest in the Western Area (30 percent), and lowest in the North (six percent). Although this indicator does not vary by gender, increasing socioeconomic status is strongly correlated with increasing levels of attendance. Thirty-one percent of children living in the wealthiest households attend pre-school while only eight percent of children from the poorest households attend. Only eight percent of children aged 36-47 months attend pre-school as compared to 19 percent of children aged 48-59 months. An important indicator of school readiness is the percentage of children that currently attend the first grade of primary school who also attended pre-school the previous year (Table ED.1). Overall, only seven percent of children who are currently aged six years and who attend the first grade of primary school attended pre-school the previous year. The variation in the level of this indicator by background characteristics is almost identical to that described above for the indicator of pre-school attendance. Discussion: Pre-school attendance and school readiness The use of pre-school to increase children’s readiness for school in Sierra Leone was found to be extremely low in MICS2 and has dropped even further during the past five years. Those few pre-schools that do exist are costly private institutions to which the average family has only limited access. The data presented above show that early child development (ECD) is not a national priority in Sierra Leone. This has implications for primary school enrolment, performance, retention, and completion. These findings should represent an urgent wake-up call to the GoSL and its partners to become more involved in this sector. ECD is no longer an option for governments; it must be recognized as a national priority that supports the improvement of primary education. There is an urgent need for the approval and implementation of the draft GoSL ECD policy. Program planners need to marshal support (human, material and financial) for initiatives that increase the accessibility of the public to pre-school opportunities.
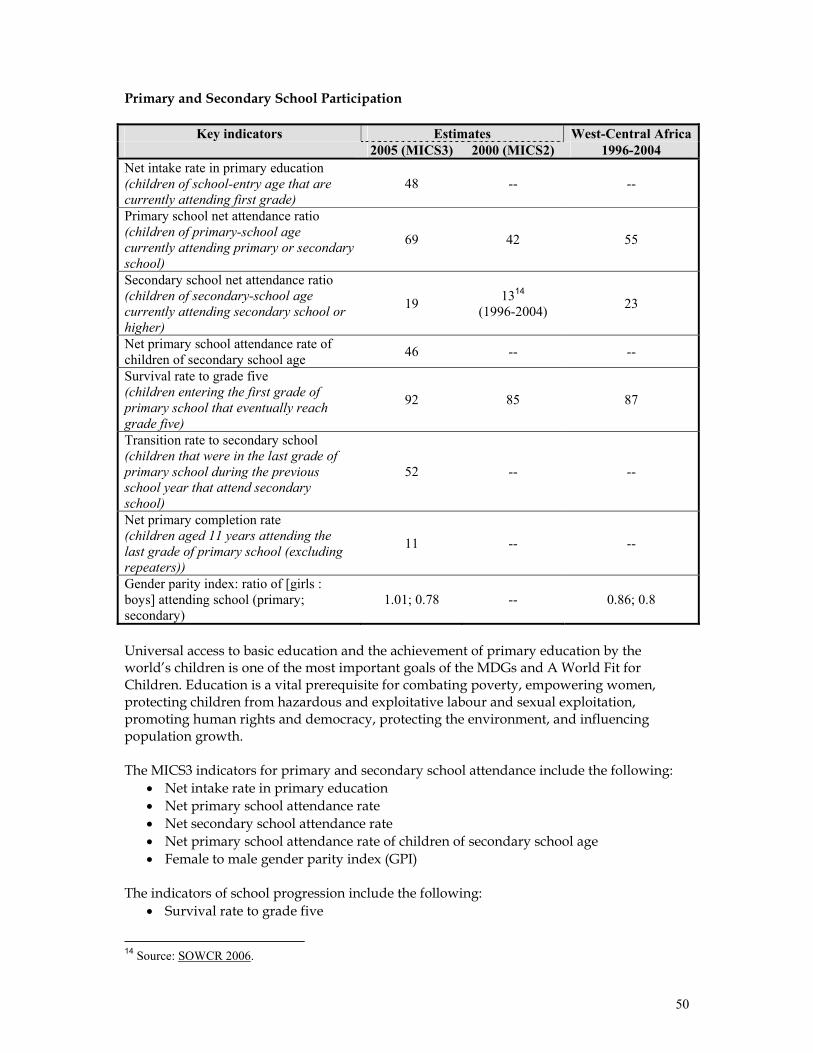
50
Primary and Secondary School Participation
Key indicators Estimates West-Central Africa 2005 (MICS3) 2000 (MICS2) 1996-2004 Net intake rate in primary education (children of school-entry age that are currently attending first grade)
48 -- --
Primary school net attendance ratio (children of primary-school age currently attending primary or secondary school)
69 42 55
Secondary school net attendance ratio (children of secondary-school age currently attending secondary school or higher)
19 1314 (1996-2004) 23
Net primary school attendance rate of children of secondary school age 46 -- --
Survival rate to grade five (children entering the first grade of primary school that eventually reach grade five)
92 85 87
Transition rate to secondary school (children that were in the last grade of primary school during the previous school year that attend secondary school)
52 -- --
Net primary completion rate (children aged 11 years attending the last grade of primary school (excluding repeaters))
11 -- --
Gender parity index: ratio of [girls : boys] attending school (primary; secondary)
1.01; 0.78 -- 0.86; 0.8
Universal access to basic education and the achievement of primary education by the world’s children is one of the most important goals of the MDGs and A World Fit for Children. Education is a vital prerequisite for combating poverty, empowering women, protecting children from hazardous and exploitative labour and sexual exploitation, promoting human rights and democracy, protecting the environment, and influencing population growth. The MICS3 indicators for primary and secondary school attendance include the following:
• Net intake rate in primary education • Net primary school attendance rate • Net secondary school attendance rate • Net primary school attendance rate of children of secondary school age • Female to male gender parity index (GPI)
The indicators of school progression include the following:
• Survival rate to grade five
14 Source: SOWCR 2006.
51
• Transition rate to secondary school • Net primary completion rate
Primary and secondary school attendance The degree to which children attend primary school in a timely manner is defined in the MICS3 survey as the percentage of children who are of primary school entry age (6 years) and who attend the first grade of primary school. The value of this indicator in Sierra Leone is 48 percent (Table ED.2). Differentials by gender do not exist; however, significant differentials are present by province and urban-rural areas. In the Western Area, for instance, the value of the indicator reaches 67 percent, while it is 40 percent in the North. Children’s participation to primary school is timelier in urban areas (60 percent) than in rural areas (44 percent). A positive correlation between this indicator and mother’s education and socioeconomic status is observed; for children age six whose mothers have at least primary school education, an estimated 69 percent attend the first grade. In households in the highest wealth quintile, the percentage is around 67 percent, while it is 36 percent among children living in the least wealthy households. Data presented in Table ED.3 show that 69 percent of children of primary school age in Sierra Leone (defined for this analysis as children aged 6-11 years) attend primary or secondary school. Eighty-five percent of children attend school in urban areas while 63 percent attend in rural areas. School attendance is highest in the Western Area at 89 percent and elsewhere ranges from 63 percent in the North to 72 percent in the East. There is no meaningful difference between male and female primary school attendance at any level or within any strata. The secondary school net attendance ratio is presented in Table ED.4. A huge decrease in this measure of age-appropriate attendance between primary and secondary school can be seen as only 19 percent of children of secondary school age (defined for this analysis as children aged 12-17 years) are attending secondary school. There is a huge gap in the value of this indicator between the Western Area (54 percent) and the remaining three provinces of the country (11-14 percent). The value of the indicator increases steadily by age of child from 10 percent for children aged 12 to 32 percent for children aged 17. Higher levels of this indicator are strongly associated with urban residence, high levels of mother’s education, and high socioeconomic status. Among the remaining 81 percent of children of secondary school age who do not attend secondary school, 46 percent attend primary school and 35 percent are out of school (see below for further details). The primary school net attendance ratio of children of secondary school age in Sierra Leone is presented in Table ED.4W. Almost half (46 percent) of the children of secondary school age are attending primary school when they should be attending secondary school. When we consider that 19 percent of children of secondary school age are attending secondary school, we can conclude that 35 percent of children in this age group do not attend school at all. Values of this indicator are highest outside of the Western Area and in rural locations. This indicator is negatively associated with the age of the child—65 percent of children aged 12 are in primary school, while only 19 percent of 17-year-olds are in primary school.
Millennium Development Goal Indicator Net primary school attendance rate Goal 100 percent by 2015 Source: SL-PRSP, 2004.
52
Data presented in Table ED.5 show that 92 percent of all children who start grade one in Sierra Leone eventually reach grade five. This estimate includes children that repeat grades but persevere and eventually move up to reach grade five. The percentage of children passing to the subsequent grade between grades one and five varies between 97 and 99 percent. There is little variation in the “survival rate to grade five” by background characteristics such as sex of child, area (urban/rural), and household socioeconomic status. This variable ranges from 87 percent in the East to 96 percent in the Western Area. Primary school completion and transition to secondary school Data regarding the net primary school completion rate are presented in Table ED.6. This indicator is defined as the percentage of children of primary completion age (11 years) who are attending the last grade of primary education (grade six). As such, it is a measure of the percentage of children who are on a “normal track” to complete their primary school education on time. Data from MICS3 show that the estimate for the net primary school completion rate is 11 percent in Sierra Leone, suggesting that most children are either delayed in the completion of their primary education or are not attending school at all. There is little difference in the rate between boys (12 percent) and girls (10 percent). The rate is 28 percent in the Western Area and varies between six and nine percent in the other three provinces. This indicator is strongly positively correlated with urban residence, high levels of mother’s education and high socioeconomic status. Data that describe the transition rate to secondary education are also presented in Table ED.6. Slightly over half (52 percent) of surveyed children who successfully completed the last grade of primary school during the year prior to the MICS3 survey were attending the first year of secondary school at the time of the survey. This rate varies little by gender but does vary notably among provinces; its value is 34 percent in the East, 43 percent in the South, 48 percent in the North, and 78 percent in the Western Area. Higher levels of the rate are strongly associated with urban residence, households where the mother’s education is secondary level or higher and high socioeconomic status. The ratio of girls to boys attending primary and secondary education is provided in Table ED.7. This ratio is better known as the Gender Parity Index (GPI). It should be noted that the results presented here are obtained from net attendance rates rather than gross attendance rates. The table shows that gender parity for primary school is 1.01, indicating virtually no difference in the attendance of girls and boys to primary school. However, the indicator drops to 0.78 at the national level for secondary education. This represents a divide between rural and urban locations—and perhaps even more so, between Freetown and the rest of Sierra Leone. The value of the GPI is 0.64 in all three provinces other than the Western Area (where it is 0.90) and 0.56 in rural areas as opposed to 0.82 in urban areas. Increasing wealth status of households is strongly associated with increases in gender parity for secondary school attendance. Discussion: Primary and secondary school participation Primary school attendance in Sierra Leone has increased substantially over the past five years and has now surged ahead of the regional norm. This is most likely due to improved access to education in areas that were held by the rebels at the time of the MICS2 survey as well as increased support to primary education throughout the country. Only half of the children six years of age enter primary school “on time”, foreshadowing the “late” or “delayed” educational status of most children in Sierra Leone. The MICS3 result showing an extremely high survival rate to grade five is questioned by some education experts in Sierra Leone who note that their experience from the field suggests that the drop-out rate is still
53
very high between grades one and five, especially among girls. Educational policy as it pertains to primary education appears to be achieving success and should be continued. Policies related to increasing school enrolment—especially among girls—should be strengthened while the abolition of all hidden costs that create barriers to school enrolment must be pursued. Current policy calls for an effective coordination mechanism to be established as responsibility for educational programs is devolved from the Ministry of Education (MoE) to district and local councils. The GoSL and its partners supporting primary education in Sierra Leone must ensure that the coordination mechanism functions effectively and resources are distributed equitably if the goal of universal primary education by 2015 is to be met. The results above present a much bleaker picture regarding secondary education in Sierra Leone. Not even one in five children of secondary school age attends secondary school—the remaining four are either delayed in primary school or do not attend school altogether. One-half of the children attending grade six do not advance to secondary school, due to factors that include limited physical access to secondary schools, cost-related factors, and the difficult secondary school entrance examination. The need now is to undertake a strategic reorientation in program planning and implementation for secondary education. Most of the current support for education in Sierra Leone goes to the primary level with little reaching the secondary and tertiary levels. The GoSL and its partners must intensify the development and implementation of diversified programs and activities for the secondary sector nationwide. The gender parity index shows an encouraging situation at the primary level, with equivalent attendance rates for girls and boys. Although past figures are not available in Sierra Leone to assess trends, gender parity for primary education in Sierra Leone appears to be ahead of the rest of the region. Support for girls’ education has been strongest at the primary level and gender parity at the secondary level may have suffered as a result. The MoE needs to enforce the Girls Education policy—especially at the second and tertiary levels—and otherwise intensify efforts that promote secondary and tertiary-level girls’ education.
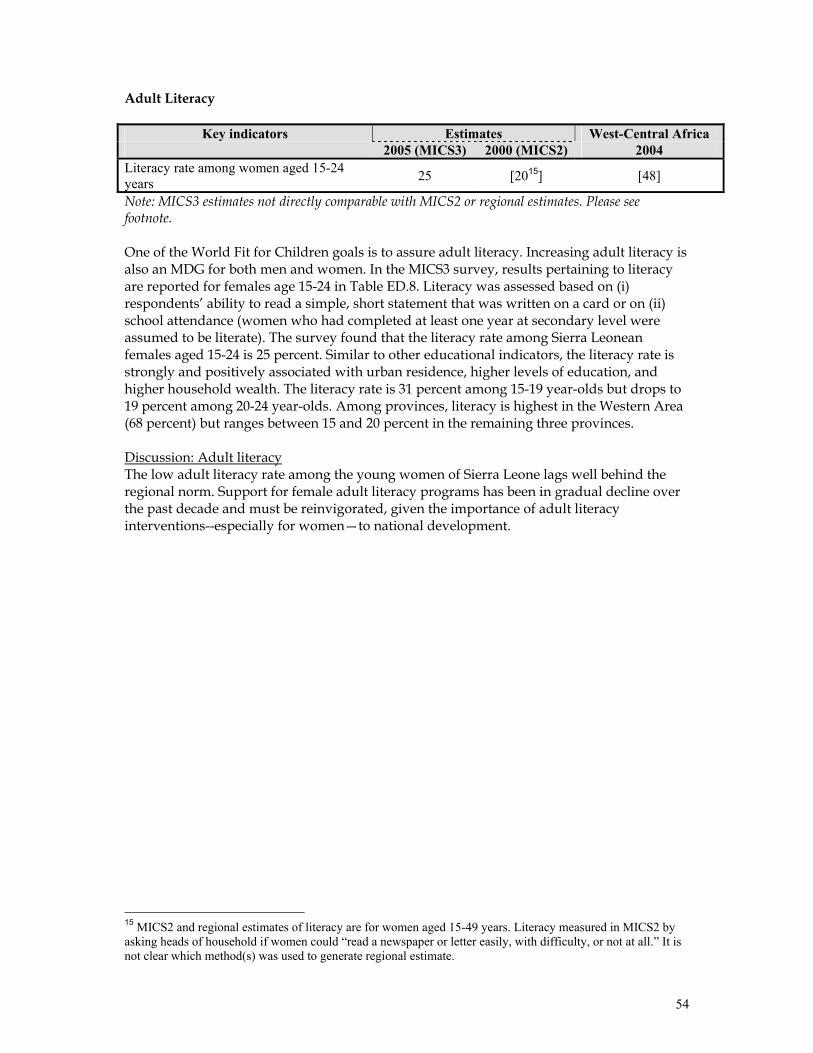
54
Adult Literacy
Key indicators Estimates West-Central Africa 2005 (MICS3) 2000 (MICS2) 2004 Literacy rate among women aged 15-24 years 25 [2015] [48]
Note: MICS3 estimates not directly comparable with MICS2 or regional estimates. Please see footnote. One of the World Fit for Children goals is to assure adult literacy. Increasing adult literacy is also an MDG for both men and women. In the MICS3 survey, results pertaining to literacy are reported for females age 15-24 in Table ED.8. Literacy was assessed based on (i) respondents’ ability to read a simple, short statement that was written on a card or on (ii) school attendance (women who had completed at least one year at secondary level were assumed to be literate). The survey found that the literacy rate among Sierra Leonean females aged 15-24 is 25 percent. Similar to other educational indicators, the literacy rate is strongly and positively associated with urban residence, higher levels of education, and higher household wealth. The literacy rate is 31 percent among 15-19 year-olds but drops to 19 percent among 20-24 year-olds. Among provinces, literacy is highest in the Western Area (68 percent) but ranges between 15 and 20 percent in the remaining three provinces. Discussion: Adult literacy The low adult literacy rate among the young women of Sierra Leone lags well behind the regional norm. Support for female adult literacy programs has been in gradual decline over the past decade and must be reinvigorated, given the importance of adult literacy interventions--especially for women—to national development.
15 MICS2 and regional estimates of literacy are for women aged 15-49 years. Literacy measured in MICS2 by asking heads of household if women could “read a newspaper or letter easily, with difficulty, or not at all.” It is not clear which method(s) was used to generate regional estimate.
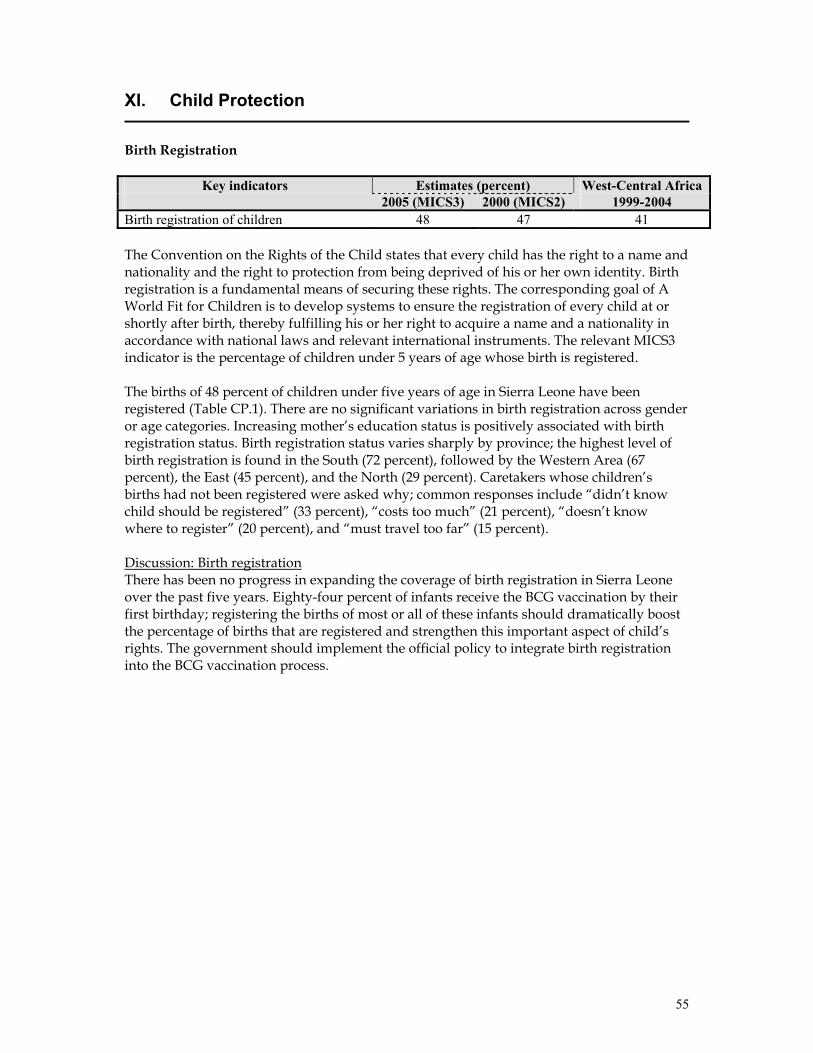
55
XI. Child Protection
Birth Registration
Key indicators Estimates (percent) West-Central Africa 2005 (MICS3) 2000 (MICS2) 1999-2004 Birth registration of children 48 47 41 The Convention on the Rights of the Child states that every child has the right to a name and nationality and the right to protection from being deprived of his or her own identity. Birth registration is a fundamental means of securing these rights. The corresponding goal of A World Fit for Children is to develop systems to ensure the registration of every child at or shortly after birth, thereby fulfilling his or her right to acquire a name and a nationality in accordance with national laws and relevant international instruments. The relevant MICS3 indicator is the percentage of children under 5 years of age whose birth is registered. The births of 48 percent of children under five years of age in Sierra Leone have been registered (Table CP.1). There are no significant variations in birth registration across gender or age categories. Increasing mother’s education status is positively associated with birth registration status. Birth registration status varies sharply by province; the highest level of birth registration is found in the South (72 percent), followed by the Western Area (67 percent), the East (45 percent), and the North (29 percent). Caretakers whose children’s births had not been registered were asked why; common responses include “didn’t know child should be registered” (33 percent), “costs too much” (21 percent), “doesn’t know where to register” (20 percent), and “must travel too far” (15 percent). Discussion: Birth registration There has been no progress in expanding the coverage of birth registration in Sierra Leone over the past five years. Eighty-four percent of infants receive the BCG vaccination by their first birthday; registering the births of most or all of these infants should dramatically boost the percentage of births that are registered and strengthen this important aspect of child’s rights. The government should implement the official policy to integrate birth registration into the BCG vaccination process.
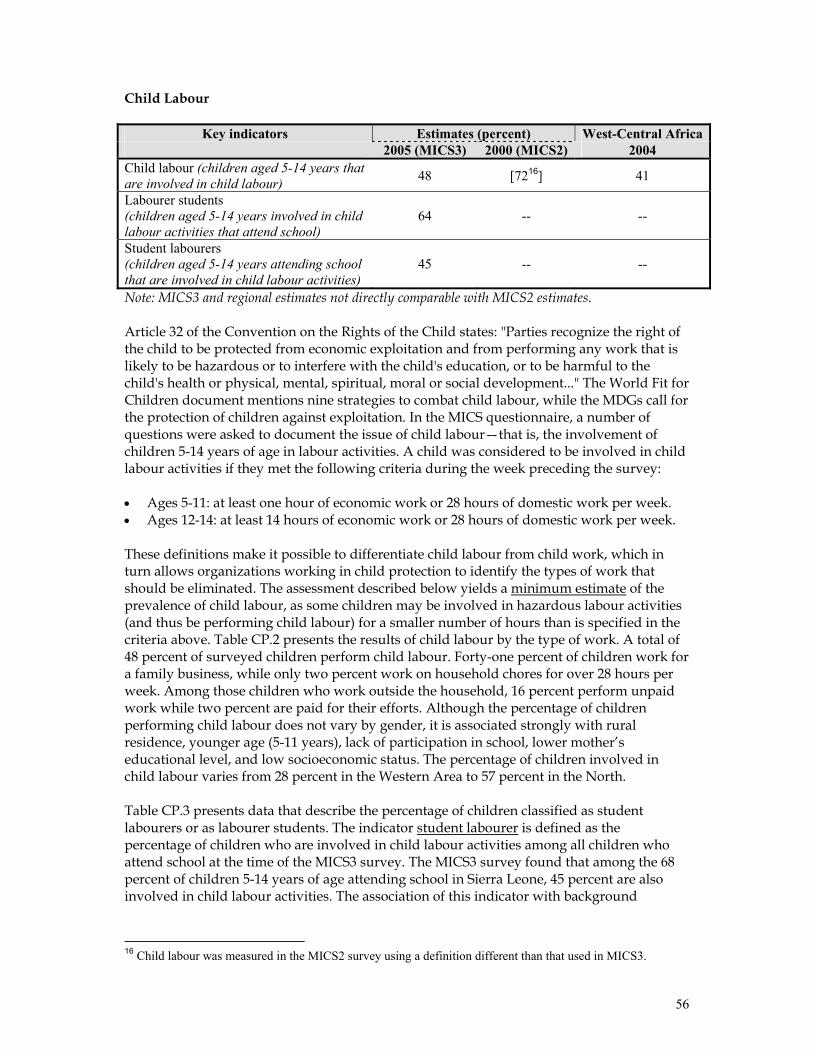
56
Child Labour
Key indicators Estimates (percent) West-Central Africa 2005 (MICS3) 2000 (MICS2) 2004 Child labour (children aged 5-14 years that are involved in child labour) 48 [7216] 41
Labourer students (children aged 5-14 years involved in child labour activities that attend school)
64 -- --
Student labourers (children aged 5-14 years attending school that are involved in child labour activities)
45 -- --
Note: MICS3 and regional estimates not directly comparable with MICS2 estimates. Article 32 of the Convention on the Rights of the Child states: "Parties recognize the right of the child to be protected from economic exploitation and from performing any work that is likely to be hazardous or to interfere with the child's education, or to be harmful to the child's health or physical, mental, spiritual, moral or social development..." The World Fit for Children document mentions nine strategies to combat child labour, while the MDGs call for the protection of children against exploitation. In the MICS questionnaire, a number of questions were asked to document the issue of child labour—that is, the involvement of children 5-14 years of age in labour activities. A child was considered to be involved in child labour activities if they met the following criteria during the week preceding the survey: • Ages 5-11: at least one hour of economic work or 28 hours of domestic work per week. • Ages 12-14: at least 14 hours of economic work or 28 hours of domestic work per week. These definitions make it possible to differentiate child labour from child work, which in turn allows organizations working in child protection to identify the types of work that should be eliminated. The assessment described below yields a minimum estimate of the prevalence of child labour, as some children may be involved in hazardous labour activities (and thus be performing child labour) for a smaller number of hours than is specified in the criteria above. Table CP.2 presents the results of child labour by the type of work. A total of 48 percent of surveyed children perform child labour. Forty-one percent of children work for a family business, while only two percent work on household chores for over 28 hours per week. Among those children who work outside the household, 16 percent perform unpaid work while two percent are paid for their efforts. Although the percentage of children performing child labour does not vary by gender, it is associated strongly with rural residence, younger age (5-11 years), lack of participation in school, lower mother’s educational level, and low socioeconomic status. The percentage of children involved in child labour varies from 28 percent in the Western Area to 57 percent in the North. Table CP.3 presents data that describe the percentage of children classified as student labourers or as labourer students. The indicator student labourer is defined as the percentage of children who are involved in child labour activities among all children who attend school at the time of the MICS3 survey. The MICS3 survey found that among the 68 percent of children 5-14 years of age attending school in Sierra Leone, 45 percent are also involved in child labour activities. The association of this indicator with background
16 Child labour was measured in the MICS2 survey using a definition different than that used in MICS3.
57
variables is very similar to that described in the preceding paragraph for the indicator of child labour. The indicator labourer student is defined as the percentage of children who attend school among all children who are involved in child labour activities at the time of the MICS3 survey. In Sierra Leone, among the 48 percent of the children classified as child labourers, the majority of them (64 percent) also attend school. The association of this indicator with background variables is essentially the inverse of that described for student labourers; while it does not vary notably by gender or age of child, it is associated strongly with urban residence, higher levels of mother’s education, and higher socioeconomic status. The percentage of labourer students varies from 88 percent in the Western Area to 58 percent in the North. Discussion: Child labour Child protection experts in Sierra Leone find the estimate of children performing labour (48 percent) to be lower than they had expected. Particularly surprising is the finding that only two percent of children work 28+ hours per week on household chores. This may reflect a systematic underestimation by respondents of the time children spend on household chores. At the same time, it should be noted that the overall estimate of child labour is higher than regional norm. The percentage of children who participate in child labour is approximately equal among students (45 percent) and among the general population of children (48 percent). This suggests that being a student does not stop children from working. Perhaps more important is the question: Does being a child labourer stop children from going to school? Table CP.3 shows that among all children aged 5-14, 68 percent are currently attending school, as compared to a 64 percent attendance rate among labourer students. This latter finding suggests that child labourers and non-labourers alike have roughly equal attendance rates at school. One conclusion that might be drawn here is that performing labour is so firmly entrenched in the lives of the children of Sierra Leone that it does not affect other activities such as school attendance—many children somehow manage to attend school despite the burden of their jobs. In order to protect children from being exploited as labourers, the GoSL should ratify the International Labour Organization conventions 138 (regarding the minimum age that a child should reach before being eligible for labour) and 182 (which requires countries to commit themselves to take immediate action to prohibit and eliminate the worst forms of child labour and reflect this in both criminal and labour laws). It should also ensure alignment and harmonization between the laws and policies in the labour, education and social welfare sectors and the enactment of the Child Rights Bill. With regards to students and labour, the GoSL must maintain and enhance all children’s access to school. This involves the creation of a school environment that caters to children who are involved in labour and that support child labourers’ attendance in school. The amount of non-school-related labour that is performed by students should be limited; fully half of the children who attend school perform labour, a situation that demands a response.
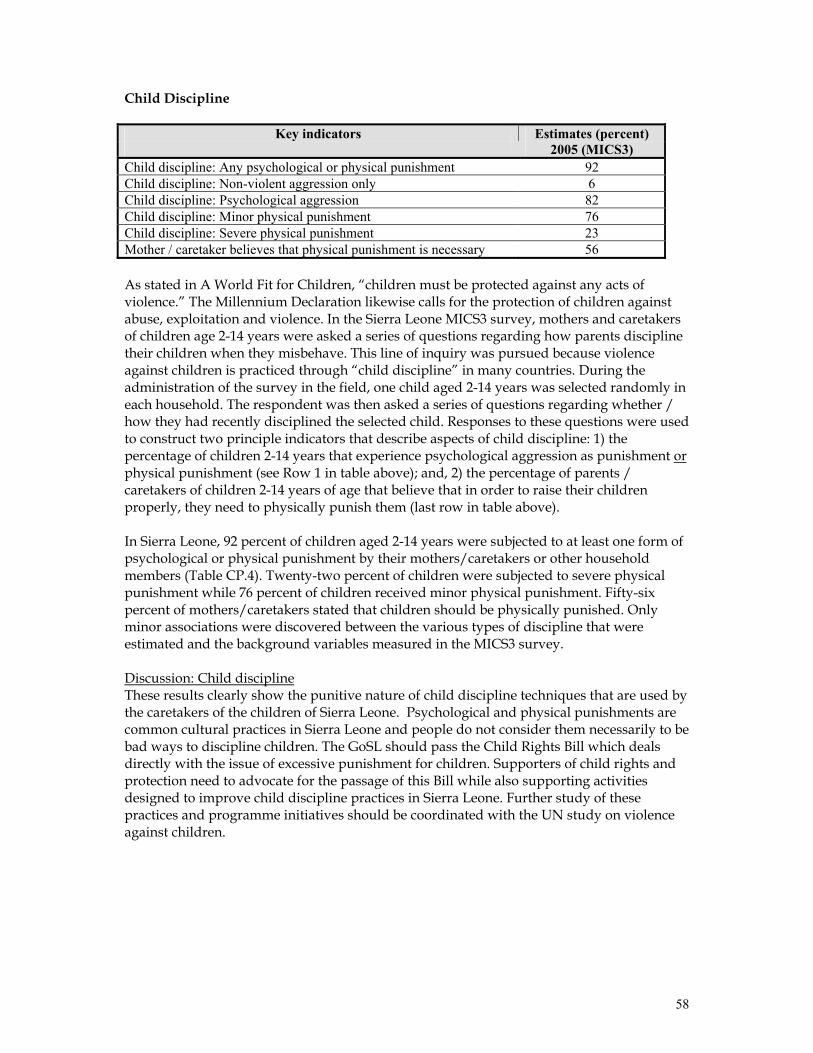
58
Child Discipline
Key indicators Estimates (percent) 2005 (MICS3) Child discipline: Any psychological or physical punishment 92 Child discipline: Non-violent aggression only 6 Child discipline: Psychological aggression 82 Child discipline: Minor physical punishment 76 Child discipline: Severe physical punishment 23 Mother / caretaker believes that physical punishment is necessary 56 As stated in A World Fit for Children, “children must be protected against any acts of violence.” The Millennium Declaration likewise calls for the protection of children against abuse, exploitation and violence. In the Sierra Leone MICS3 survey, mothers and caretakers of children age 2-14 years were asked a series of questions regarding how parents discipline their children when they misbehave. This line of inquiry was pursued because violence against children is practiced through “child discipline” in many countries. During the administration of the survey in the field, one child aged 2-14 years was selected randomly in each household. The respondent was then asked a series of questions regarding whether / how they had recently disciplined the selected child. Responses to these questions were used to construct two principle indicators that describe aspects of child discipline: 1) the percentage of children 2-14 years that experience psychological aggression as punishment or physical punishment (see Row 1 in table above); and, 2) the percentage of parents / caretakers of children 2-14 years of age that believe that in order to raise their children properly, they need to physically punish them (last row in table above). In Sierra Leone, 92 percent of children aged 2-14 years were subjected to at least one form of psychological or physical punishment by their mothers/caretakers or other household members (Table CP.4). Twenty-two percent of children were subjected to severe physical punishment while 76 percent of children received minor physical punishment. Fifty-six percent of mothers/caretakers stated that children should be physically punished. Only minor associations were discovered between the various types of discipline that were estimated and the background variables measured in the MICS3 survey. Discussion: Child discipline These results clearly show the punitive nature of child discipline techniques that are used by the caretakers of the children of Sierra Leone. Psychological and physical punishments are common cultural practices in Sierra Leone and people do not consider them necessarily to be bad ways to discipline children. The GoSL should pass the Child Rights Bill which deals directly with the issue of excessive punishment for children. Supporters of child rights and protection need to advocate for the passage of this Bill while also supporting activities designed to improve child discipline practices in Sierra Leone. Further study of these practices and programme initiatives should be coordinated with the UN study on violence against children.
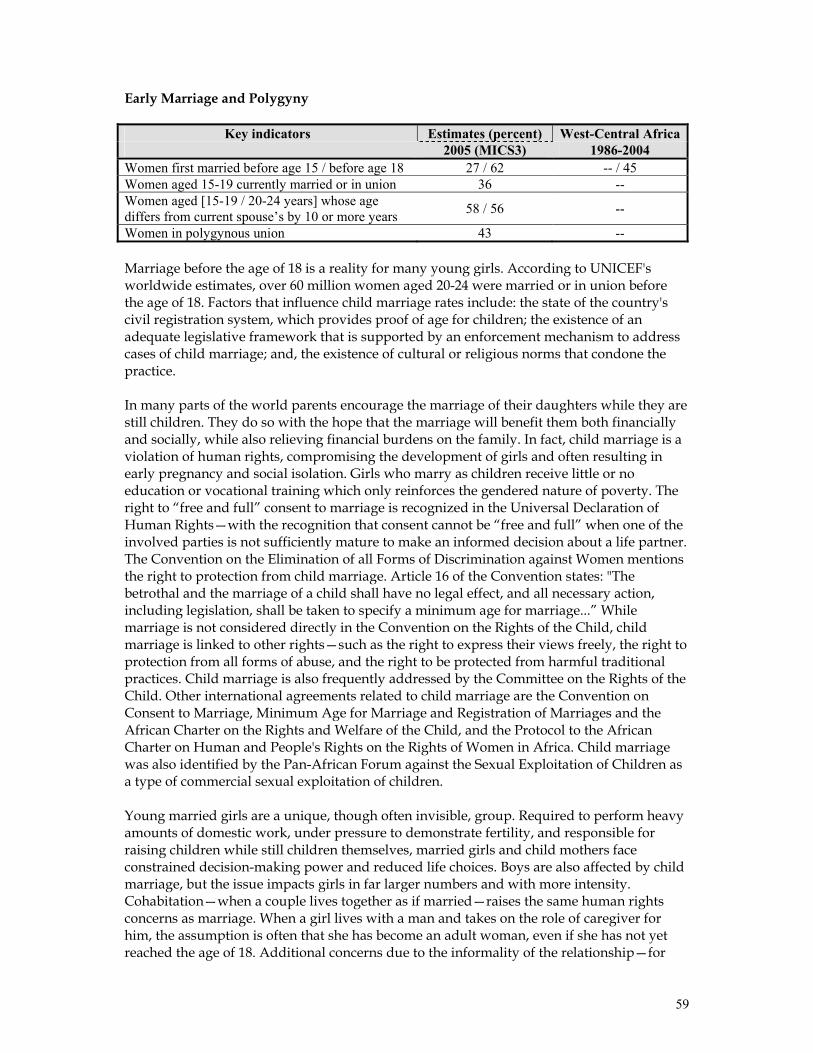
59
Early Marriage and Polygyny
Key indicators Estimates (percent) West-Central Africa 2005 (MICS3) 1986-2004 Women first married before age 15 / before age 18 27 / 62 -- / 45 Women aged 15-19 currently married or in union 36 -- Women aged [15-19 / 20-24 years] whose age differs from current spouse’s by 10 or more years 58 / 56 --
Women in polygynous union 43 -- Marriage before the age of 18 is a reality for many young girls. According to UNICEF's worldwide estimates, over 60 million women aged 20-24 were married or in union before the age of 18. Factors that influence child marriage rates include: the state of the country's civil registration system, which provides proof of age for children; the existence of an adequate legislative framework that is supported by an enforcement mechanism to address cases of child marriage; and, the existence of cultural or religious norms that condone the practice. In many parts of the world parents encourage the marriage of their daughters while they are still children. They do so with the hope that the marriage will benefit them both financially and socially, while also relieving financial burdens on the family. In fact, child marriage is a violation of human rights, compromising the development of girls and often resulting in early pregnancy and social isolation. Girls who marry as children receive little or no education or vocational training which only reinforces the gendered nature of poverty. The right to “free and full” consent to marriage is recognized in the Universal Declaration of Human Rights—with the recognition that consent cannot be “free and full” when one of the involved parties is not sufficiently mature to make an informed decision about a life partner. The Convention on the Elimination of all Forms of Discrimination against Women mentions the right to protection from child marriage. Article 16 of the Convention states: "The betrothal and the marriage of a child shall have no legal effect, and all necessary action, including legislation, shall be taken to specify a minimum age for marriage...” While marriage is not considered directly in the Convention on the Rights of the Child, child marriage is linked to other rights—such as the right to express their views freely, the right to protection from all forms of abuse, and the right to be protected from harmful traditional practices. Child marriage is also frequently addressed by the Committee on the Rights of the Child. Other international agreements related to child marriage are the Convention on Consent to Marriage, Minimum Age for Marriage and Registration of Marriages and the African Charter on the Rights and Welfare of the Child, and the Protocol to the African Charter on Human and People's Rights on the Rights of Women in Africa. Child marriage was also identified by the Pan-African Forum against the Sexual Exploitation of Children as a type of commercial sexual exploitation of children. Young married girls are a unique, though often invisible, group. Required to perform heavy amounts of domestic work, under pressure to demonstrate fertility, and responsible for raising children while still children themselves, married girls and child mothers face constrained decision-making power and reduced life choices. Boys are also affected by child marriage, but the issue impacts girls in far larger numbers and with more intensity. Cohabitation—when a couple lives together as if married—raises the same human rights concerns as marriage. When a girl lives with a man and takes on the role of caregiver for him, the assumption is often that she has become an adult woman, even if she has not yet reached the age of 18. Additional concerns due to the informality of the relationship—for
60
example, inheritance, citizenship and social recognition—might make girls in informal unions vulnerable in different ways than those who are in formally recognized marriages. Research suggests that many factors interact to place a child at risk of marriage. Poverty, protection of girls, family honour and the provision of stability during unstable social periods are considered to be significant factors that help to determine a girl's risk of becoming married while still a child. Women who marry at young ages are more likely to believe that it is sometimes acceptable for a husband to beat his wife and are more likely to experience domestic violence themselves. The age gap between partners is thought to contribute to abusive power dynamics and to increase the risk of untimely widowhood. Closely related to the issue of child marriage is the age at which girls become sexually active. Women who are married before the age of 18 tend to have more children than those who marry later in life. Pregnancy-related deaths are known to be a leading cause of mortality for both married and unmarried girls between the ages of 15 and 19, particularly among the younger members of this cohort. There is evidence to suggest that girls who marry at young ages are more likely to marry older men, which puts them at increased risk of HIV infection. Parents may seek to marry off their girls to protect their honour, and men often seek younger women (or girls) as wives as a means to avoid choosing a wife who may already be infected. The pressure on this young wife to reproduce combined with the power imbalance that results from the age differential between husband and wife can contribute to very low levels of condom use among such couples. Two of the indicators that are widely used to measure the degree to which early marriage is practiced are (i) the percentage of women married before 15 years of age, and (ii) the percentage married before 18 years of age. Twenty-seven percent of women interviewed during the MICS3 were married before fifteen years of age (Table CP.5). Among different age strata of respondents, this indicator is lowest among women currently aged 15-19 years (15 percent), indicating that the practice of early marriage in Sierra Leone is declining. The percentage of women married before fifteen years of age is highest in rural areas, in households that have low socioeconomic status, and where the mother’s educational level is lower. Sixty-two percent of all women interviewed during the MICS3 were married before eighteen years of age while thirty-six percent of women respondents currently aged 15-19 years reported that they were currently married or in union. The patterns of these two indicators among different sub-populations (e.g., rural/urban, by province, etc.) are similar to those described in the paragraph above for marriage below fifteen years of age. Data presented in Table CP.5 also show that polygyny is widely practiced in Sierra Leone. Forty-three percent of the women interviewed during the MICS3 who are currently married or in union reported that their husband/partner has another wife. Among provinces, the practice of polygyny is by far the lowest in the Western Area (12 percent)—in the remaining provinces, it ranges from 38 percent in the East to 53 percent in the North. The percentage of women whose partners are in polygynous relationships increases with the increasing age category of the women. Increasing women’s educational status is associated with a decreasing percentage of women reporting polygyny. Women in the richest wealth quintile report the lowest prevalence of polygyny (27 percent). The percentage of women reporting polygyny in the remaining four quintiles is similar, ranging from 43 to 48 percent.
61
The dangers inherent in the practice of marriage between young girls and older men were discussed above. The indicator that has been constructed to measure spousal age difference is the percentage of women who are currently married/in union with a man older by ten or more years than them (see Table CP.6). The estimate of this indicator among women aged 15-19 is 58 percent while it is 56 percent among women aged 20-24. Among women aged 15-19 years, the practice is lowest in the Western Area (43 percent) and highest in the South (61 percent). Higher levels of high spousal age difference are found in rural communities and households where the head of household is uneducated. The practice of women marrying men who are ten or more years senior to them is clearly widespread across all strata of society in Sierra Leone. Discussion: Early marriage and polygyny The data presented above paint a disturbing picture of early marriage, widespread polygyny, and a common practice of women marrying men who are much senior to them. Local experts concur that cultural norms, early pregnancy and forced marriage are all likely contributing factors to these practices in Sierra Leone. Efforts to estimate the indicators reported above have only recently begun at the global level. The MICS3 survey has generated the first estimate of many of these indicators in Sierra Leone. Levels of marriage before age 18 are higher in Sierra Leone than the regional average, suggesting that this aspect of child protection has been inadequately addressed by policy makers and program managers. The Child Rights Bill of the GoSL makes marriage illegal below the age of 18. Concerned organizations need to advocate for the passage of this act. Although legislation alone will not eliminate early marriage, the Child Rights Bill is an important first step that establishes an age for informed consent and responsibility. Policies are also required to prevent or discourage children and young women from entering into polygynous unions. A woman’s educational status is positively correlated with a reduced probability that she will marry early or be in a polygynous union, suggesting that efforts to promote education of girls and young women may contribute to reducing these practices.
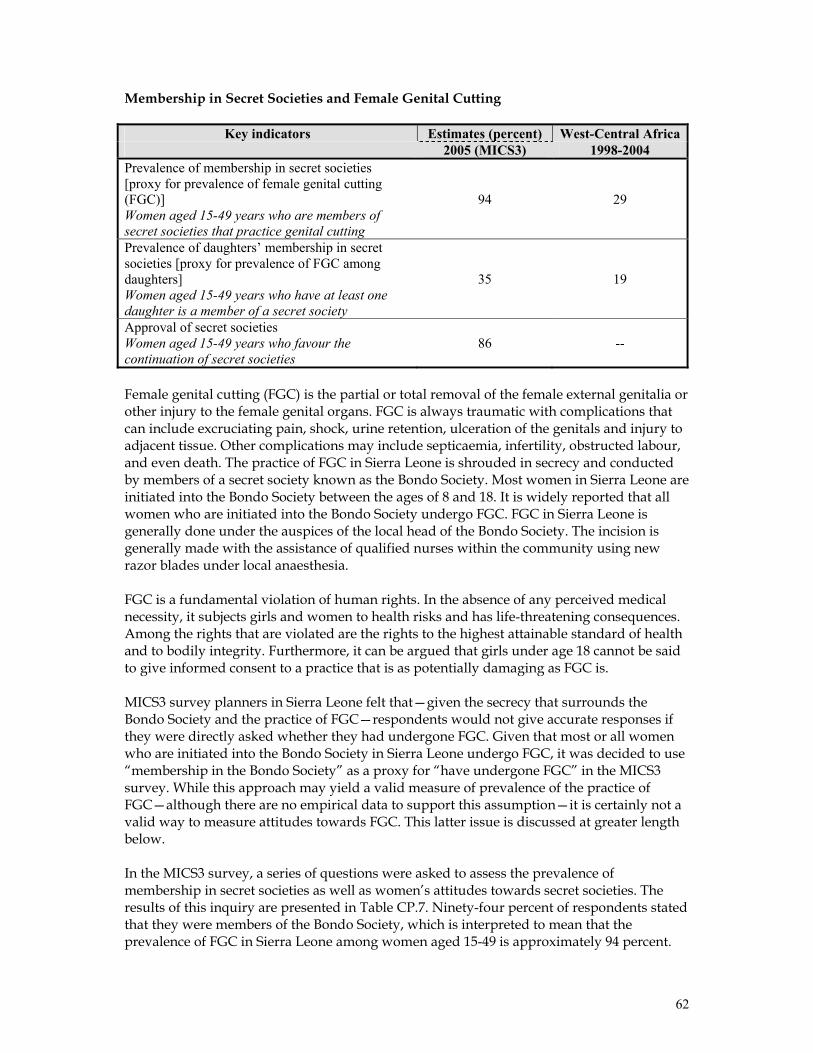
62
Membership in Secret Societies and Female Genital Cutting
Key indicators Estimates (percent) West-Central Africa 2005 (MICS3) 1998-2004 Prevalence of membership in secret societies [proxy for prevalence of female genital cutting (FGC)] Women aged 15-49 years who are members of secret societies that practice genital cutting
94 29
Prevalence of daughters’ membership in secret societies [proxy for prevalence of FGC among daughters] Women aged 15-49 years who have at least one daughter is a member of a secret society
35 19
Approval of secret societies Women aged 15-49 years who favour the continuation of secret societies
86 --
Female genital cutting (FGC) is the partial or total removal of the female external genitalia or other injury to the female genital organs. FGC is always traumatic with complications that can include excruciating pain, shock, urine retention, ulceration of the genitals and injury to adjacent tissue. Other complications may include septicaemia, infertility, obstructed labour, and even death. The practice of FGC in Sierra Leone is shrouded in secrecy and conducted by members of a secret society known as the Bondo Society. Most women in Sierra Leone are initiated into the Bondo Society between the ages of 8 and 18. It is widely reported that all women who are initiated into the Bondo Society undergo FGC. FGC in Sierra Leone is generally done under the auspices of the local head of the Bondo Society. The incision is generally made with the assistance of qualified nurses within the community using new razor blades under local anaesthesia. FGC is a fundamental violation of human rights. In the absence of any perceived medical necessity, it subjects girls and women to health risks and has life-threatening consequences. Among the rights that are violated are the rights to the highest attainable standard of health and to bodily integrity. Furthermore, it can be argued that girls under age 18 cannot be said to give informed consent to a practice that is as potentially damaging as FGC is. MICS3 survey planners in Sierra Leone felt that—given the secrecy that surrounds the Bondo Society and the practice of FGC—respondents would not give accurate responses if they were directly asked whether they had undergone FGC. Given that most or all women who are initiated into the Bondo Society in Sierra Leone undergo FGC, it was decided to use “membership in the Bondo Society” as a proxy for “have undergone FGC” in the MICS3 survey. While this approach may yield a valid measure of prevalence of the practice of FGC—although there are no empirical data to support this assumption—it is certainly not a valid way to measure attitudes towards FGC. This latter issue is discussed at greater length below. In the MICS3 survey, a series of questions were asked to assess the prevalence of membership in secret societies as well as women’s attitudes towards secret societies. The results of this inquiry are presented in Table CP.7. Ninety-four percent of respondents stated that they were members of the Bondo Society, which is interpreted to mean that the prevalence of FGC in Sierra Leone among women aged 15-49 is approximately 94 percent.
63
Lower levels of membership in the Bondo Society were found in the Western Area, in urban areas, among women aged 15-19 years, among more educated women, and among women with higher socioeconomic status. Although 86 percent of respondents stated that they thought that the Bondo Society should be continued, this should not be interpreted to mean that most or all of them think that the practice of FGC should be continued. It is very possible that a substantial percentage of respondents who stated that they think the Bondo Society should be continued either (i) value some aspects of the Bondo Society but do not approve of the practice of FGC, and/or (ii) do not feel comfortable stating to interviewers that the Bondo Society should be discontinued. Data that are presented in Table CP.8 show that 34 percent of the daughters of respondents are members of the Bondo Society (a result that is interpreted as meaning that the prevalence of FGC is at least 34 percent among this population). Lower prevalence levels are associated with residence in the Western Area or urban locations, younger age of mother, and mother’s education at the primary or secondary-plus level. This indicator does not vary according to household socioeconomic status. Table CP.8A shows the distribution of daughters by age at the time of initiation to the secret society (age at which FGM/C was performed). Relatively lower numbers of daughters are initiated during the first five years of life (10 percent), while during ages 5-7, 19 percent are initiated. Of particular interest is age 10, when 14 percent of daughters are initiated. A significant proportion of daughters are initiated after age 15 (14 percent). Discussion: Female genital cutting and membership in the Bondo Society The practice of FGC is deeply entrenched in societal norms in Sierra Leone. Prevalence is lower among the younger generation and younger mothers appear to be less likely to have their own daughters undergo FGC. These findings suggest that there is an increasing—albeit extremely modest—trend to not practice FGC among the young generation in Sierra Leone. This creates an opportunity for interventions to stop this harmful practice. Leading organizations that work in the field of child protection, including UNICEF, should advocate with the GoSL to pass the Child Rights Bill that bans harmful cultural practices. Further information is required regarding why women have their daughters undergo FGC. Given this information, program planners can design appropriate programs to reduce the practice of FGC. Partnerships should be created with appropriate groups to combat FGC. Community-based action, including declarations by chiefs and communities, will certainly be part of an overall strategy to change people’s attitude and behavior with regards to FGC. The findings presented here regarding the prevalence of FGC were obtained based on the assumption that “membership in the Bondo Society” implies “has undergone FGC.” This assumption needs to be validated through small-scale field research before it is accepted as fact. A respondent’s statement that she supports the continuation of the Bondo Society should not be interpreted as support for the practice of FGC—even though she may, in fact, support its practice. Further research is required to measure the extent of support for the continuation of both the Bondo Society as well as for the practice of FGC in Sierra Leone.
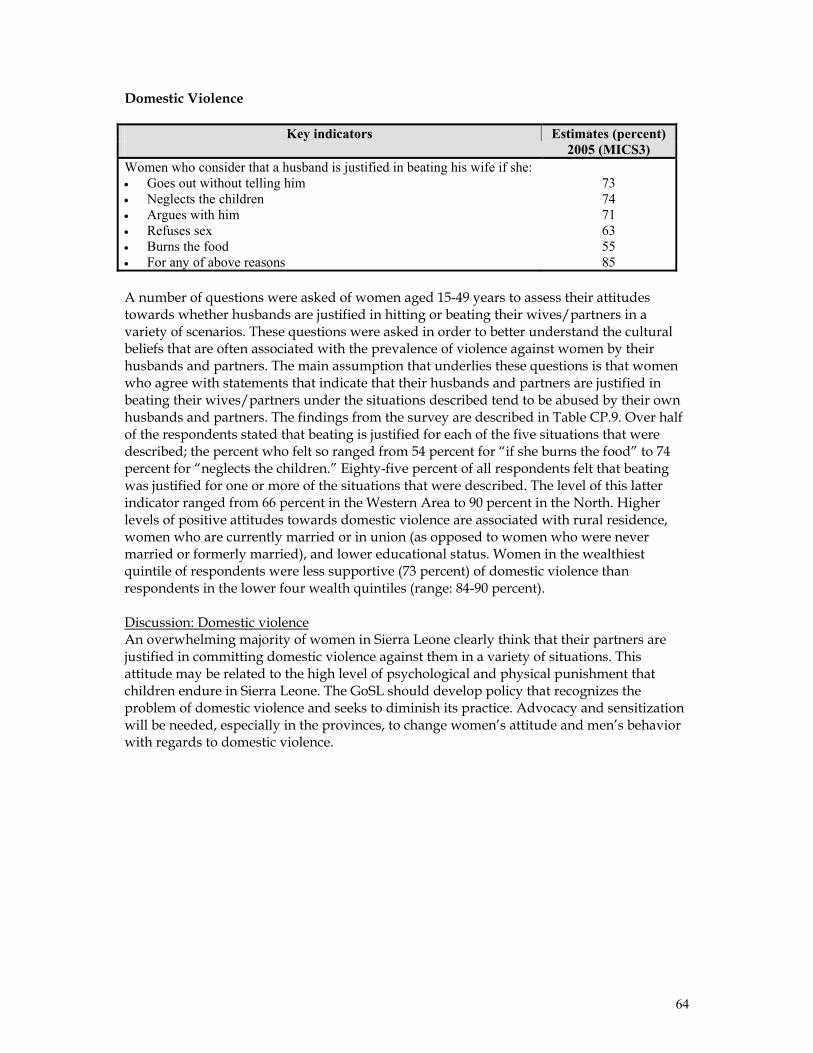
64
Domestic Violence
Key indicators Estimates (percent) 2005 (MICS3) Women who consider that a husband is justified in beating his wife if she: • Goes out without telling him • Neglects the children • Argues with him • Refuses sex • Burns the food • For any of above reasons
73 74 71 63 55 85
A number of questions were asked of women aged 15-49 years to assess their attitudes towards whether husbands are justified in hitting or beating their wives/partners in a variety of scenarios. These questions were asked in order to better understand the cultural beliefs that are often associated with the prevalence of violence against women by their husbands and partners. The main assumption that underlies these questions is that women who agree with statements that indicate that their husbands and partners are justified in beating their wives/partners under the situations described tend to be abused by their own husbands and partners. The findings from the survey are described in Table CP.9. Over half of the respondents stated that beating is justified for each of the five situations that were described; the percent who felt so ranged from 54 percent for “if she burns the food” to 74 percent for “neglects the children.” Eighty-five percent of all respondents felt that beating was justified for one or more of the situations that were described. The level of this latter indicator ranged from 66 percent in the Western Area to 90 percent in the North. Higher levels of positive attitudes towards domestic violence are associated with rural residence, women who are currently married or in union (as opposed to women who were never married or formerly married), and lower educational status. Women in the wealthiest quintile of respondents were less supportive (73 percent) of domestic violence than respondents in the lower four wealth quintiles (range: 84-90 percent). Discussion: Domestic violence An overwhelming majority of women in Sierra Leone clearly think that their partners are justified in committing domestic violence against them in a variety of situations. This attitude may be related to the high level of psychological and physical punishment that children endure in Sierra Leone. The GoSL should develop policy that recognizes the problem of domestic violence and seeks to diminish its practice. Advocacy and sensitization will be needed, especially in the provinces, to change women’s attitude and men’s behavior with regards to domestic violence.
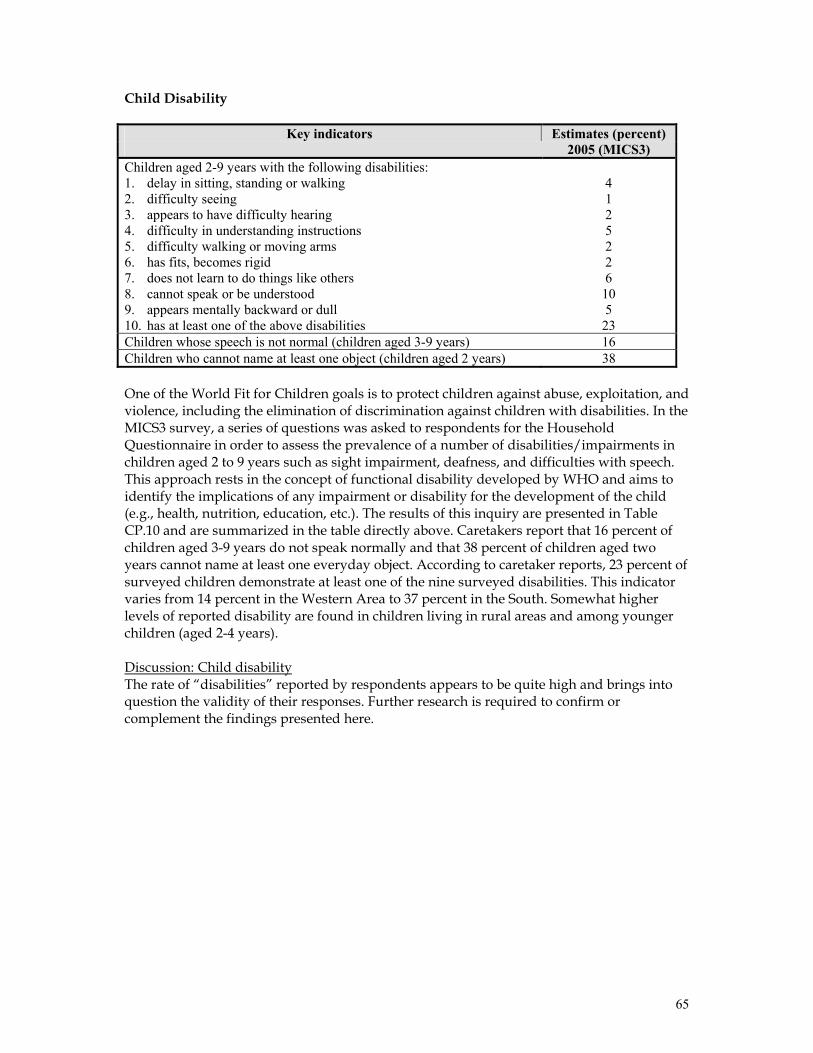
65
Child Disability
Key indicators Estimates (percent) 2005 (MICS3) Children aged 2-9 years with the following disabilities: 1. delay in sitting, standing or walking 2. difficulty seeing 3. appears to have difficulty hearing 4. difficulty in understanding instructions 5. difficulty walking or moving arms 6. has fits, becomes rigid 7. does not learn to do things like others 8. cannot speak or be understood 9. appears mentally backward or dull 10. has at least one of the above disabilities
4 1 2 5 2 2 6 10 5 23
Children whose speech is not normal (children aged 3-9 years) 16 Children who cannot name at least one object (children aged 2 years) 38 One of the World Fit for Children goals is to protect children against abuse, exploitation, and violence, including the elimination of discrimination against children with disabilities. In the MICS3 survey, a series of questions was asked to respondents for the Household Questionnaire in order to assess the prevalence of a number of disabilities/impairments in children aged 2 to 9 years such as sight impairment, deafness, and difficulties with speech. This approach rests in the concept of functional disability developed by WHO and aims to identify the implications of any impairment or disability for the development of the child (e.g., health, nutrition, education, etc.). The results of this inquiry are presented in Table CP.10 and are summarized in the table directly above. Caretakers report that 16 percent of children aged 3-9 years do not speak normally and that 38 percent of children aged two years cannot name at least one everyday object. According to caretaker reports, 23 percent of surveyed children demonstrate at least one of the nine surveyed disabilities. This indicator varies from 14 percent in the Western Area to 37 percent in the South. Somewhat higher levels of reported disability are found in children living in rural areas and among younger children (aged 2-4 years). Discussion: Child disability The rate of “disabilities” reported by respondents appears to be quite high and brings into question the validity of their responses. Further research is required to confirm or complement the findings presented here.
66
XII. HIV/AIDS, Sexual Behaviour, and Orphaned and Vulnerable Children
Knowledge of HIV Transmission and Utilization of HIV Testing Services
Key indicators Estimates (percent) West-Central Africa 2005 (MICS3) 2000 (MICS2) 1998-2004 Comprehensive knowledge about HIV prevention among young people
17
--
18
Knowledge of 2 ways of prevention Knowledge of 3 ways of prevention Rejection of 3 misconceptions
44 35 21
-- 21 19
-- --
Knowledge of all three ways of mother-to-child transmission of HIV 54 27 --
Positive attitude towards people with HIV/AIDS 5 -- --
Women who know where to be tested for HIV 18 9 --
Women who have been tested for HIV 6 2 -- Counselling coverage for the prevention of mother-to-child transmission of HIV 41 -- --
Testing coverage for the prevention of mother-to-child transmission of HIV 5 -- --
One of the most important prerequisites for reducing the rate of HIV infection is for the general population to have accurate knowledge of how HIV is transmitted and how to prevent transmission. Correct information is the first step toward raising awareness and giving young people the tools they need to protect themselves from infection. Misconceptions about HIV are common and can confuse young people and hinder prevention efforts. Populations in different countries are likely to have variations in misconceptions although some appear to be universal (for example, that HIV can be transmitted through sharing food or from mosquito bites). The UN General Assembly Special Session on HIV/AIDS (UNGASS) has called on governments to improve the knowledge and skills of young people to protect themselves from HIV. The indicators that have been identified to measure progress towards the achievement of both this goal—as well as measure achievement of the MDG that states that HIV infections should be reduced by half—describe (i) the level of knowledge of HIV and its prevention and (ii) the level of practice of behaviours that prevent further spread of the disease. This section of the MICS3 survey report describes the current status of knowledge regarding HIV transmission as well as the utilization of HIV testing services. The MICS3 HIV module was administered to all women 15-49 years of age who participated in the survey. Knowledge of HIV prevention and transmission The percentage of young women who have comprehensive and correct knowledge of HIV prevention and transmission—defined as women aged 15-24 years that correctly identify two ways of avoiding HIV infection and reject three common misconceptions about HIV transmission—is a key indicator for both an MDG as well as for UNGASS. Respondents were asked questions to determine whether they knew of the three main ways of HIV
67
transmission—having only one faithful uninfected partner, using a condom every time, and abstaining from sex. The results of this inquiry are presented in Tables HA.1 and HA.3. In Sierra Leone, two-thirds of the interviewed women (67 percent) have heard of AIDS. Forty-four percent of respondents know two ways of preventing HIV transmission while 35 percent know all three ways. Eighty-one per cent of women living in the Western Area know two prevention methods; among women in the other three provinces, the percentage of women with this knowledge ranges from 34 percent in the North to 42 percent in the South. As expected, the percentage of women who know two prevention methods increases with women’s educational level and wealth status. Table HA.2 presents data that describe the percentage of women who can correctly identify two common misconceptions concerning HIV. This indicator is based on the misconceptions that HIV can be transmitted by sharing food and mosquito bites. The table also provides information on whether women know that HIV cannot be transmitted by supernatural means and that HIV can be transmitted by sharing needles. Forty-one percent of women know that HIV cannot be transmitted by sharing food and 41 percent of women know that HIV cannot be transmitted by mosquito bites, while 42 percent know that a healthy-looking person can be infected. Of the interviewed women, only 21 percent both reject the two common misconceptions and know that a healthy-looking person can be infected. As with other HIV-related indicators, the level of this measure is much higher in the Western Area (59 percent) than in the remaining three provinces (range: 11 to 20 percent). Higher levels of knowledge are associated with urban residence, higher levels of education, and higher socioeconomic status. Table HA.3 summarizes information from Tables HA.1 and HA.2 and presents the percentage of women aged 15-49 who have comprehensive correct knowledge of HIV: that is, who (i) know two methods of preventing HIV, (ii) reject two common misconceptions regarding HIV, and (iii) know that a healthy looking person can have HIV. Only 15 percent of respondents have comprehensive correct knowledge of HIV. Among young women aged 15-24 years, 17 percent have comprehensive correct knowledge of HIV transmission. Fifty-two percent of respondents in the Western Area demonstrated comprehensive correct knowledge of HIV. In the remainder of the country, the value of this indicator ranges from five percent in the North to 16 percent in the East. Level of education (see Figure HA.1), residence, and socioeconomic status are all highly associated with the level of this indicator. Knowledge of mother-to-child transmission (MTCT) of HIV is also an important prerequisite for women if they are to seek HIV testing when they are pregnant in order to avoid potential infection of the child. Women need to know that HIV can be transmitted from the mother to the child during pregnancy, delivery, and through breastfeeding. The level of knowledge among women age 15-49 years concerning MTCT is presented in Table HA.4. Overall, 63 percent of women know that HIV can be transmitted from mother to child. Fifty-four percent of women know all three ways that MTCT can take place. The level of this indicator is notably higher in the Western Area (81 percent) than in the other three provinces (range: 44 to 60 percent). Higher levels of knowledge are associated with urban residence, higher levels of education, and higher socioeconomic status.
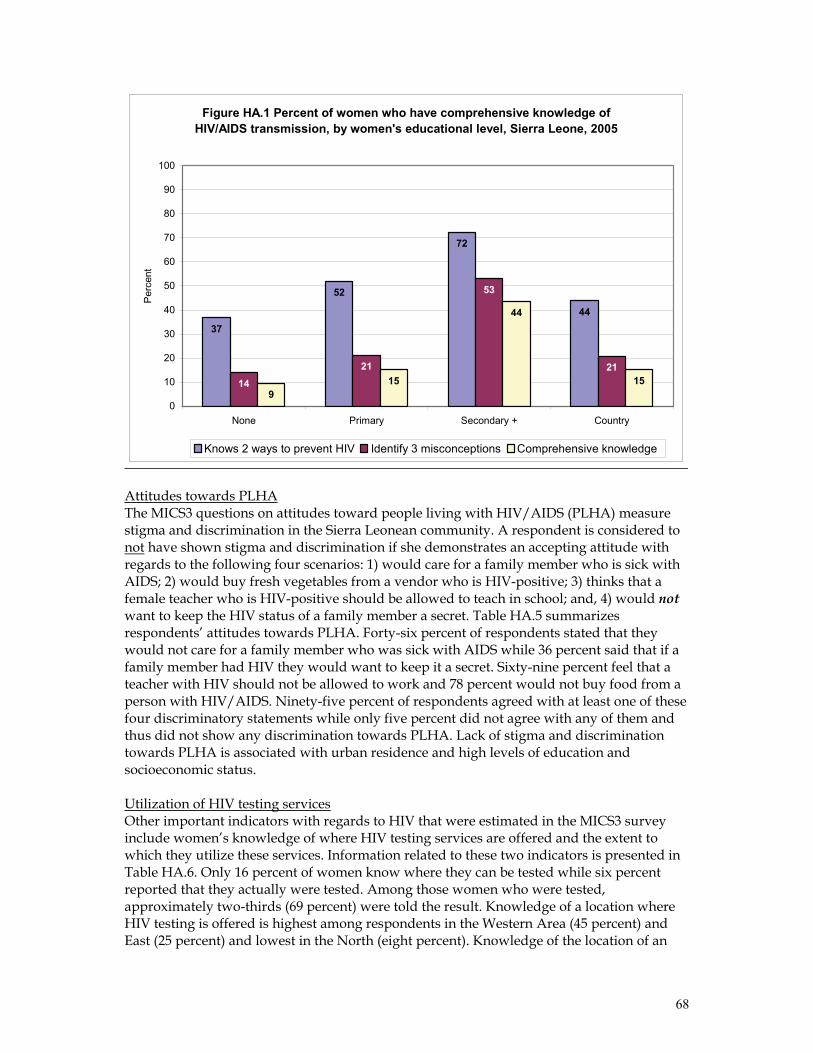
68
Figure HA.1 Percent of women who have comprehensive knowledge of HIV/AIDS transmission, by women's educational level, Sierra Leone, 2005
37
52
72
44
1421
53
21
915
44
15
0
10
20
30
40
50
60
70
80
90
100
None Primary Secondary + Country
Per
cent
Knows 2 ways to prevent HIV Identify 3 misconceptions Comprehensive knowledge
Attitudes towards PLHA The MICS3 questions on attitudes toward people living with HIV/AIDS (PLHA) measure stigma and discrimination in the Sierra Leonean community. A respondent is considered to not have shown stigma and discrimination if she demonstrates an accepting attitude with regards to the following four scenarios: 1) would care for a family member who is sick with AIDS; 2) would buy fresh vegetables from a vendor who is HIV-positive; 3) thinks that a female teacher who is HIV-positive should be allowed to teach in school; and, 4) would not want to keep the HIV status of a family member a secret. Table HA.5 summarizes respondents’ attitudes towards PLHA. Forty-six percent of respondents stated that they would not care for a family member who was sick with AIDS while 36 percent said that if a family member had HIV they would want to keep it a secret. Sixty-nine percent feel that a teacher with HIV should not be allowed to work and 78 percent would not buy food from a person with HIV/AIDS. Ninety-five percent of respondents agreed with at least one of these four discriminatory statements while only five percent did not agree with any of them and thus did not show any discrimination towards PLHA. Lack of stigma and discrimination towards PLHA is associated with urban residence and high levels of education and socioeconomic status. Utilization of HIV testing services Other important indicators with regards to HIV that were estimated in the MICS3 survey include women’s knowledge of where HIV testing services are offered and the extent to which they utilize these services. Information related to these two indicators is presented in Table HA.6. Only 16 percent of women know where they can be tested while six percent reported that they actually were tested. Among those women who were tested, approximately two-thirds (69 percent) were told the result. Knowledge of a location where HIV testing is offered is highest among respondents in the Western Area (45 percent) and East (25 percent) and lowest in the North (eight percent). Knowledge of the location of an
69
HIV test site is associated with urban residence, high levels of education, and high socioeconomic status. The patterns of association of background variables with the indicator percentage of women who have been tested for HIV are identical except that the level of the indicator is highest in the Western Area (16 percent) and South (six percent) and lowest in the East (three percent). Data were gathered from women who had given birth within the two years preceding the survey regarding any HIV counselling and testing that they may have received during antenatal care (ANC) visits. Results from this inquiry are presented in Table HA.7. Eighty-one percent of respondents utilized ANC and 41 percent were provided with information about HIV prevention during the visit; this signifies that slightly over half (41/81 = 51 percent) of respondents who utilized ANC received information about HIV prevention. The percentage of women who received information about HIV prevention during the ANC visit was highest in the East (54 percent) and Western Area (53 percent) and lowest in the South (33 percent). Higher levels of this indicator are associated with urban residence, high educational status, and high socioeconomic status. Seven percent of these same respondents were tested for HIV at an ANC visit and five percent received the results of their HIV test at an ANC visit. Similar to other results discussed above, although the practice of counselling women during the ANC visit regarding HIV prevention was highest in the East, the percentage of women in the East who were tested for HIV at the ANC visit was the lowest (four percent) among all four provinces. The indicator was highest in the Western Area (22 percent). Discussion: Knowledge of HIV prevention and transmission and utilization of HIV testing Relatively few of the MICS3 indicators presented in this section have been measured previously in Sierra Leone. Two components of the indicator comprehensive knowledge about HIV/AIDS were measured in both MICS2 and MICS3 —knowledge of 3 ways of prevention and rejection of 3 misconceptions—and the modest positive trends in these indicators can be seen in the table above. Although there has been improvement in these two indicators, the overall percentage of women with comprehensive knowledge remains disturbingly low. HIV/AIDS prevention can be most effectively addressed at the policy level through the establishment of policies that empower women, such as girls education, income generation, etc. IEC programs that educate the public about HIV/AIDS should attempt to improve knowledge about both prevention as well as misconceptions and should be gender-sensitive with a specific focus on women. The North province stands out as the area of the country where knowledge regarding HIV prevention and testing sites is lowest. MICS3 results with regards to attitudes towards PLHA suggest that widespread stigma and discrimination towards PLHA is a huge problem in Sierra Leone. Officials working in HIV prevention and control should intensify efforts to address this burning issue so that people at risk of HIV will feel more comfortable seeking testing and—if they are found to be HIV-positive—treatment and support. Although half of pregnant women receive counselling on HIV at ANC visits, very few know where they can be tested and even fewer are actually tested. Public health officials should continue to promote HIV counselling during ANC visits while providing health workers with specific information regarding where testing services are found. Indicators that measure knowledge of testing sites and HIV test coverage among all women aged 15-49 show modest improvement since 2000 but remain extremely low.
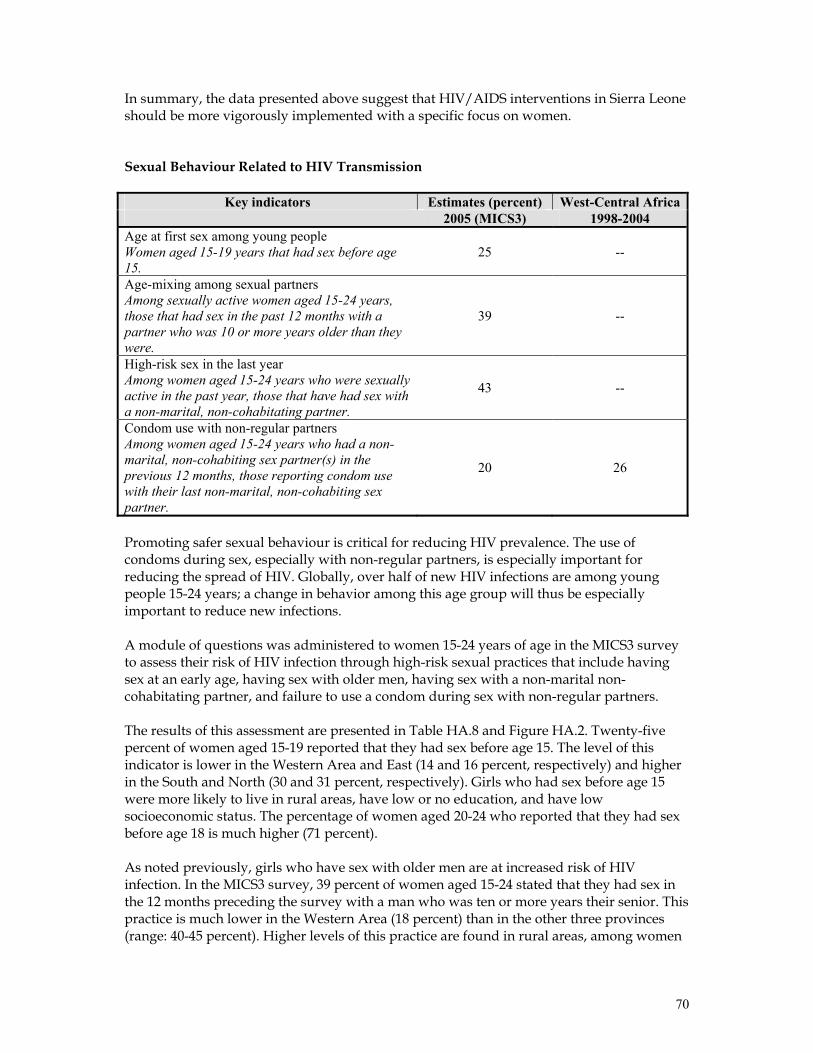
70
In summary, the data presented above suggest that HIV/AIDS interventions in Sierra Leone should be more vigorously implemented with a specific focus on women. Sexual Behaviour Related to HIV Transmission
Key indicators Estimates (percent) West-Central Africa 2005 (MICS3) 1998-2004 Age at first sex among young people Women aged 15-19 years that had sex before age 15.
25 --
Age-mixing among sexual partners Among sexually active women aged 15-24 years, those that had sex in the past 12 months with a partner who was 10 or more years older than they were.
39 --
High-risk sex in the last year Among women aged 15-24 years who were sexually active in the past year, those that have had sex with a non-marital, non-cohabitating partner.
43 --
Condom use with non-regular partners Among women aged 15-24 years who had a non-marital, non-cohabiting sex partner(s) in the previous 12 months, those reporting condom use with their last non-marital, non-cohabiting sex partner.
20 26
Promoting safer sexual behaviour is critical for reducing HIV prevalence. The use of condoms during sex, especially with non-regular partners, is especially important for reducing the spread of HIV. Globally, over half of new HIV infections are among young people 15-24 years; a change in behavior among this age group will thus be especially important to reduce new infections. A module of questions was administered to women 15-24 years of age in the MICS3 survey to assess their risk of HIV infection through high-risk sexual practices that include having sex at an early age, having sex with older men, having sex with a non-marital non-cohabitating partner, and failure to use a condom during sex with non-regular partners. The results of this assessment are presented in Table HA.8 and Figure HA.2. Twenty-five percent of women aged 15-19 reported that they had sex before age 15. The level of this indicator is lower in the Western Area and East (14 and 16 percent, respectively) and higher in the South and North (30 and 31 percent, respectively). Girls who had sex before age 15 were more likely to live in rural areas, have low or no education, and have low socioeconomic status. The percentage of women aged 20-24 who reported that they had sex before age 18 is much higher (71 percent). As noted previously, girls who have sex with older men are at increased risk of HIV infection. In the MICS3 survey, 39 percent of women aged 15-24 stated that they had sex in the 12 months preceding the survey with a man who was ten or more years their senior. This practice is much lower in the Western Area (18 percent) than in the other three provinces (range: 40-45 percent). Higher levels of this practice are found in rural areas, among women
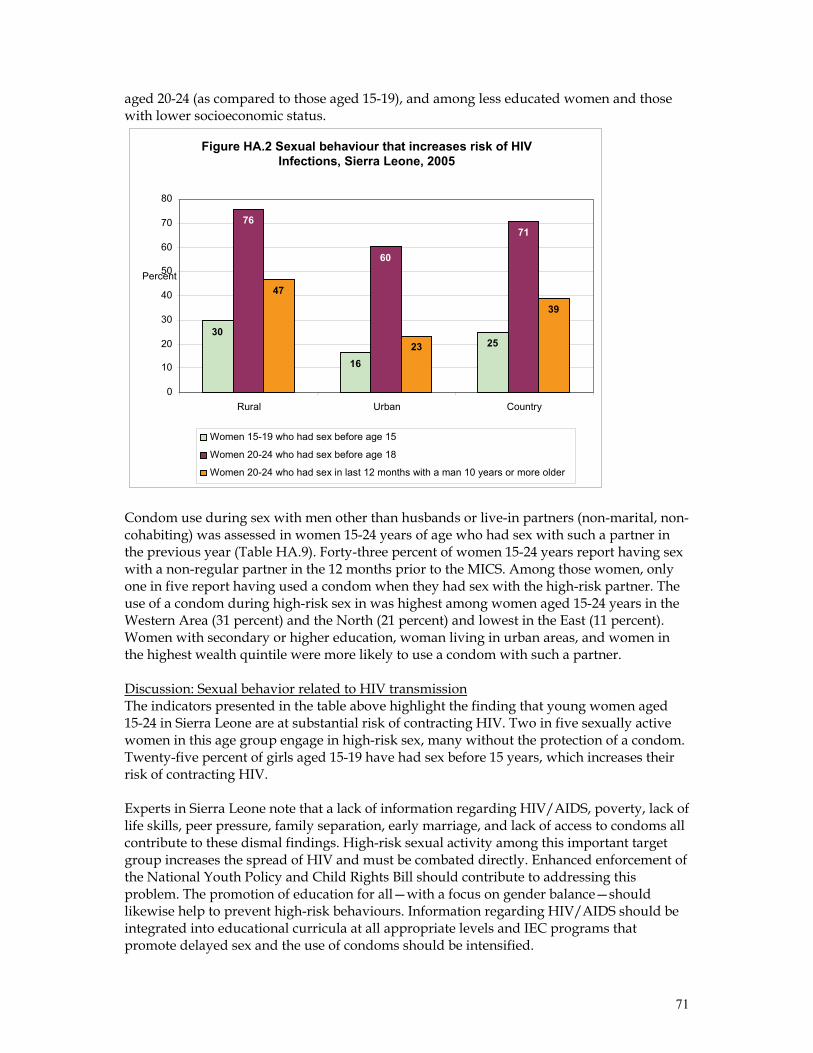
71
aged 20-24 (as compared to those aged 15-19), and among less educated women and those with lower socioeconomic status.
Condom use during sex with men other than husbands or live-in partners (non-marital, non-cohabiting) was assessed in women 15-24 years of age who had sex with such a partner in the previous year (Table HA.9). Forty-three percent of women 15-24 years report having sex with a non-regular partner in the 12 months prior to the MICS. Among those women, only one in five report having used a condom when they had sex with the high-risk partner. The use of a condom during high-risk sex in was highest among women aged 15-24 years in the Western Area (31 percent) and the North (21 percent) and lowest in the East (11 percent). Women with secondary or higher education, woman living in urban areas, and women in the highest wealth quintile were more likely to use a condom with such a partner. Discussion: Sexual behavior related to HIV transmission The indicators presented in the table above highlight the finding that young women aged 15-24 in Sierra Leone are at substantial risk of contracting HIV. Two in five sexually active women in this age group engage in high-risk sex, many without the protection of a condom. Twenty-five percent of girls aged 15-19 have had sex before 15 years, which increases their risk of contracting HIV. Experts in Sierra Leone note that a lack of information regarding HIV/AIDS, poverty, lack of life skills, peer pressure, family separation, early marriage, and lack of access to condoms all contribute to these dismal findings. High-risk sexual activity among this important target group increases the spread of HIV and must be combated directly. Enhanced enforcement of the National Youth Policy and Child Rights Bill should contribute to addressing this problem. The promotion of education for all—with a focus on gender balance—should likewise help to prevent high-risk behaviours. Information regarding HIV/AIDS should be integrated into educational curricula at all appropriate levels and IEC programs that promote delayed sex and the use of condoms should be intensified.
Figure HA.2 Sexual behaviour that increases risk of HIVInfections, Sierra Leone, 2005
30
16
25
76
60
71
47
23
39
0 10
20
30
40
50
60
70
80
Rural Urban Country
Percent
Women 15-19 who had sex before age 15
Women 20-24 who had sex before age 18
Women 20-24 who had sex in last 12 months with a man 10 years or more older
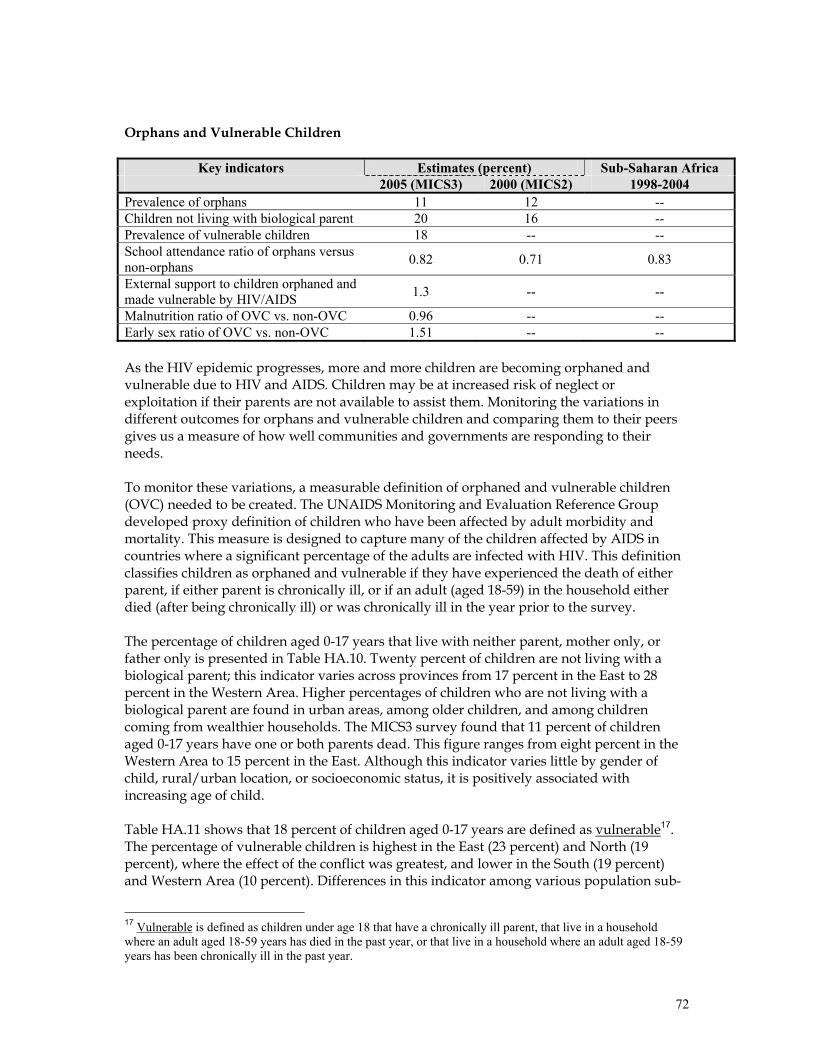
72
Orphans and Vulnerable Children
Key indicators Estimates (percent) Sub-Saharan Africa 2005 (MICS3) 2000 (MICS2) 1998-2004 Prevalence of orphans 11 12 -- Children not living with biological parent 20 16 -- Prevalence of vulnerable children 18 -- -- School attendance ratio of orphans versus non-orphans 0.82 0.71 0.83
External support to children orphaned and made vulnerable by HIV/AIDS 1.3 -- --
Malnutrition ratio of OVC vs. non-OVC 0.96 -- -- Early sex ratio of OVC vs. non-OVC 1.51 -- -- As the HIV epidemic progresses, more and more children are becoming orphaned and vulnerable due to HIV and AIDS. Children may be at increased risk of neglect or exploitation if their parents are not available to assist them. Monitoring the variations in different outcomes for orphans and vulnerable children and comparing them to their peers gives us a measure of how well communities and governments are responding to their needs. To monitor these variations, a measurable definition of orphaned and vulnerable children (OVC) needed to be created. The UNAIDS Monitoring and Evaluation Reference Group developed proxy definition of children who have been affected by adult morbidity and mortality. This measure is designed to capture many of the children affected by AIDS in countries where a significant percentage of the adults are infected with HIV. This definition classifies children as orphaned and vulnerable if they have experienced the death of either parent, if either parent is chronically ill, or if an adult (aged 18-59) in the household either died (after being chronically ill) or was chronically ill in the year prior to the survey. The percentage of children aged 0-17 years that live with neither parent, mother only, or father only is presented in Table HA.10. Twenty percent of children are not living with a biological parent; this indicator varies across provinces from 17 percent in the East to 28 percent in the Western Area. Higher percentages of children who are not living with a biological parent are found in urban areas, among older children, and among children coming from wealthier households. The MICS3 survey found that 11 percent of children aged 0-17 years have one or both parents dead. This figure ranges from eight percent in the Western Area to 15 percent in the East. Although this indicator varies little by gender of child, rural/urban location, or socioeconomic status, it is positively associated with increasing age of child. Table HA.11 shows that 18 percent of children aged 0-17 years are defined as vulnerable17. The percentage of vulnerable children is highest in the East (23 percent) and North (19 percent), where the effect of the conflict was greatest, and lower in the South (19 percent) and Western Area (10 percent). Differences in this indicator among various population sub-
17 Vulnerable is defined as children under age 18 that have a chronically ill parent, that live in a household where an adult aged 18-59 years has died in the past year, or that live in a household where an adult aged 18-59 years has been chronically ill in the past year.
73
groups as defined by the background variables are minor except when rural/urban differences are explored; a higher percentage of vulnerable children is found in rural areas (20 percent) than in urban areas (14 percent). Combining the indicators discussed in the previous two paragraphs reveals that a total of 27 percent of children aged 0-17 in Sierra Leone is classified as OVC. A key measure that has been developed to assess the status of OVC relative to their peers describes the school attendance of children 10-14 who have lost both parents (double orphans) versus children whose parents are alive (and who live with at least one of these parents). If children whose parents have died do not have the same access to school as their peers, then families, schools and communities are not ensuring that these children’s rights are being met. In Sierra Leone, 2.1 percent of children aged 10-14 years have lost both parents (Table HA.12). Among those children, only 63.5 per cent are currently attending school. Among children ages 10-14 who have not lost a parent and who live with at least one parent, 76.5 percent are attending school. These two figures can be used to form a ratio—double orphans to non-orphans school attendance ratio—that has a value of 0.83. This would suggest that double orphans are disadvantaged compared to children who are not orphans with respect to their access to educational opportunities. In many countries there are few services that are available to families that have taken in OVC. Community-based organizations and governments need to ensure that families receive support to care for these children. Information on the level and types of support (medical; emotional and psychosocial; social/material; and, educational) that are provided to households caring for OVC is presented in Table HA.13. Only 1.3 percent of households that provide care to orphans and vulnerable children report receiving any material support for their efforts. Higher levels of support are reported by households in the East (2.3 percent) and South (1.8 percent), by households of low socioeconomic status, and by households caring for younger children. The prevalence of malnutrition among OVC under five years of age is presented in Table HA.14. The key indicator tracked by the MICS3 survey is the ratio of the prevalence of underweight nutritional status among OVC to the prevalence of underweight nutritional status among non-OVC. A value of one signifies that there is no difference between the two groups for this indicator, a value of greater than one that OVC are more malnourished than non-OVC, and a value of less than one that non-OVC are more malnourished than OVC. The MICS3 survey has calculated the value of this indicator to be 0.98, indicating that there is little or no difference in the nutritional status of OVC and non-OVC. Research suggests that orphans are more likely to be exploited sexually and have poorer sexual and reproductive health outcomes than other children. Table HA.15 presents information on the sexual behaviour of orphaned and vulnerable women aged 15-17 years. Thirty-five percent of female OVC aged 15-17 had sex before age 15 compared to 23.2 percent among non-OVC. The ratio of these two percentages is estimated at 1.51 (35.0: 23.2).
74
Discussion: Orphans and vulnerable children The high prevalence of orphans and vulnerable children as identified through this survey demonstrates that a substantial percentage of the children in Sierra Leone are at risk of experiencing violations and abuse of their rights as children as well as exposure to HIV and other problems. The results presented above conclusively demonstrate that OVC have less access to education and participate to a greater extent in early sex than do their peers in the general population. As has been discussed in previous sections of this report, the GoSL must enact and enforce the Child Rights Bill. HIV-related policy in the education sector should be disseminated and enforced. Give the low levels of support that caretakers of OVC report receiving, it is clear that support for programs that protect and support OVC must be increased. The GoSL and its partners should ensure that a policy and strategic plan of action on OVC is developed and that policy frameworks and appropriate mechanisms are put in place to guarantee to OVC their rights to life, development, and protection. Special attention should be given to ensure that OVC are supported at the community level and not within institutionalized settings.
75
List of References
Boerma, J. T., Weinstein, K. I., Rutstein, S.O., and Sommerfelt, A. E. , 1996. Data on Birth Weight in Developing Countries: Can Surveys Help? Bulletin of the World Health Organization, 74(2), 209-16.
Blanc, A. and Wardlaw, T. 2005. "Monitoring Low Birth Weight: An Evaluation of International Estimates and an Updated Estimation Procedure". WHO Bulletin, 83 (3), 178-185.
Filmer, D. and Pritchett, L., 2001. Estimating wealth effects without expenditure data – or tears: An application to educational enrolments in states of India. Demography 38(1): 115-132.
Government of Sierra Leone, 2005. Sierra Leone Poverty Reduction Strategy Paper.
Rutstein, S.O. and Johnson, K., 2004. The DHS Wealth Index. DHS Comparative Reports No. 6. Calverton, Maryland: ORC Macro.
UNICEF, 2006. Monitoring the Situation of Children and Women. Multiple Indicator Cluster Survey Manual, New York.
United Nations, 1983. Manual X: Indirect Techniques for Demographic Estimation (United Nations publication, Sales No. E.83.XIII.2).
United Nations, 1990a. QFIVE, United Nations Program for Child Mortality Estimation. New York, UN Pop Division
United Nations, 1990b. Step-by-step Guide to the Estimation of Child Mortality. New York, UN
WHO and UNICEF, 1997. The Sisterhood Method for Estimating Maternal Mortality. Guidance notes for potential users, Geneva.
www.Childinfo.org.
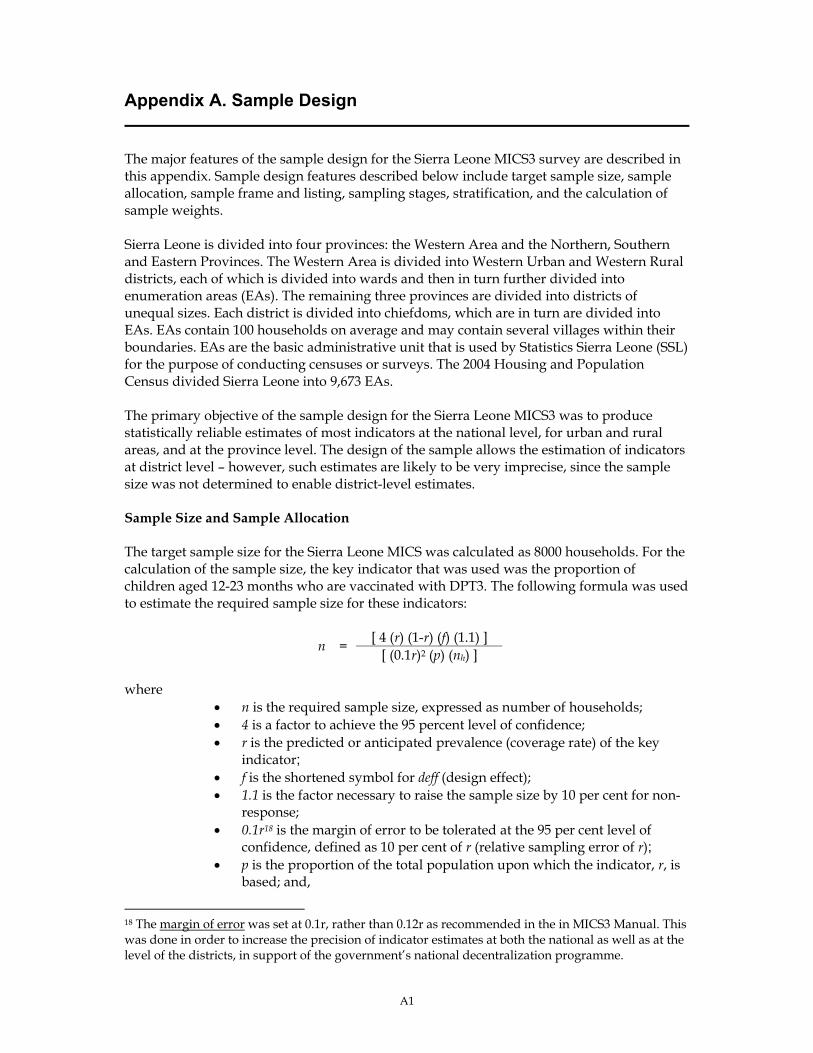
A1
Appendix A. Sample Design
The major features of the sample design for the Sierra Leone MICS3 survey are described in this appendix. Sample design features described below include target sample size, sample allocation, sample frame and listing, sampling stages, stratification, and the calculation of sample weights. Sierra Leone is divided into four provinces: the Western Area and the Northern, Southern and Eastern Provinces. The Western Area is divided into Western Urban and Western Rural districts, each of which is divided into wards and then in turn further divided into enumeration areas (EAs). The remaining three provinces are divided into districts of unequal sizes. Each district is divided into chiefdoms, which are in turn are divided into EAs. EAs contain 100 households on average and may contain several villages within their boundaries. EAs are the basic administrative unit that is used by Statistics Sierra Leone (SSL) for the purpose of conducting censuses or surveys. The 2004 Housing and Population Census divided Sierra Leone into 9,673 EAs. The primary objective of the sample design for the Sierra Leone MICS3 was to produce statistically reliable estimates of most indicators at the national level, for urban and rural areas, and at the province level. The design of the sample allows the estimation of indicators at district level – however, such estimates are likely to be very imprecise, since the sample size was not determined to enable district-level estimates. Sample Size and Sample Allocation The target sample size for the Sierra Leone MICS was calculated as 8000 households. For the calculation of the sample size, the key indicator that was used was the proportion of children aged 12-23 months who are vaccinated with DPT3. The following formula was used to estimate the required sample size for these indicators:
[ 4 (r) (1-r) (f) (1.1) ] n = [ (0.1r)2 (p) (nh) ] where
• n is the required sample size, expressed as number of households; • 4 is a factor to achieve the 95 percent level of confidence; • r is the predicted or anticipated prevalence (coverage rate) of the key
indicator; • f is the shortened symbol for deff (design effect); • 1.1 is the factor necessary to raise the sample size by 10 per cent for non-
response; • 0.1r18 is the margin of error to be tolerated at the 95 per cent level of
confidence, defined as 10 per cent of r (relative sampling error of r); • p is the proportion of the total population upon which the indicator, r, is
based; and,
18 The margin of error was set at 0.1r, rather than 0.12r as recommended in the in MICS3 Manual. This was done in order to increase the precision of indicator estimates at both the national as well as at the level of the districts, in support of the government’s national decentralization programme.
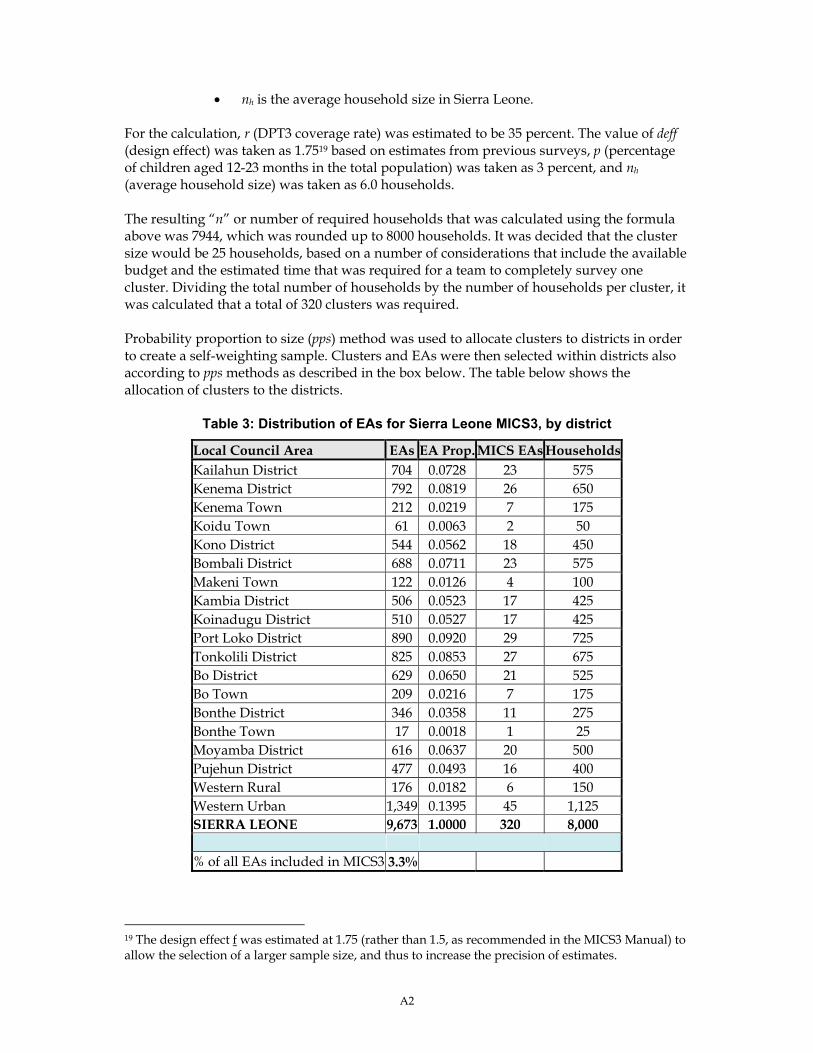
A2
• nh is the average household size in Sierra Leone. For the calculation, r (DPT3 coverage rate) was estimated to be 35 percent. The value of deff (design effect) was taken as 1.7519 based on estimates from previous surveys, p (percentage of children aged 12-23 months in the total population) was taken as 3 percent, and nh (average household size) was taken as 6.0 households. The resulting “n” or number of required households that was calculated using the formula above was 7944, which was rounded up to 8000 households. It was decided that the cluster size would be 25 households, based on a number of considerations that include the available budget and the estimated time that was required for a team to completely survey one cluster. Dividing the total number of households by the number of households per cluster, it was calculated that a total of 320 clusters was required. Probability proportion to size (pps) method was used to allocate clusters to districts in order to create a self-weighting sample. Clusters and EAs were then selected within districts also according to pps methods as described in the box below. The table below shows the allocation of clusters to the districts.
Table 3: Distribution of EAs for Sierra Leone MICS3, by district
Local Council Area EAs EA Prop. MICS EAs HouseholdsKailahun District 704 0.0728 23 575 Kenema District 792 0.0819 26 650 Kenema Town 212 0.0219 7 175 Koidu Town 61 0.0063 2 50 Kono District 544 0.0562 18 450 Bombali District 688 0.0711 23 575 Makeni Town 122 0.0126 4 100 Kambia District 506 0.0523 17 425 Koinadugu District 510 0.0527 17 425 Port Loko District 890 0.0920 29 725 Tonkolili District 825 0.0853 27 675 Bo District 629 0.0650 21 525 Bo Town 209 0.0216 7 175 Bonthe District 346 0.0358 11 275 Bonthe Town 17 0.0018 1 25 Moyamba District 616 0.0637 20 500 Pujehun District 477 0.0493 16 400 Western Rural 176 0.0182 6 150 Western Urban 1,349 0.1395 45 1,125 SIERRA LEONE 9,673 1.0000 320 8,000 % of all EAs included in MICS3 3.3%
19 The design effect f was estimated at 1.75 (rather than 1.5, as recommended in the MICS3 Manual) to allow the selection of a larger sample size, and thus to increase the precision of estimates.
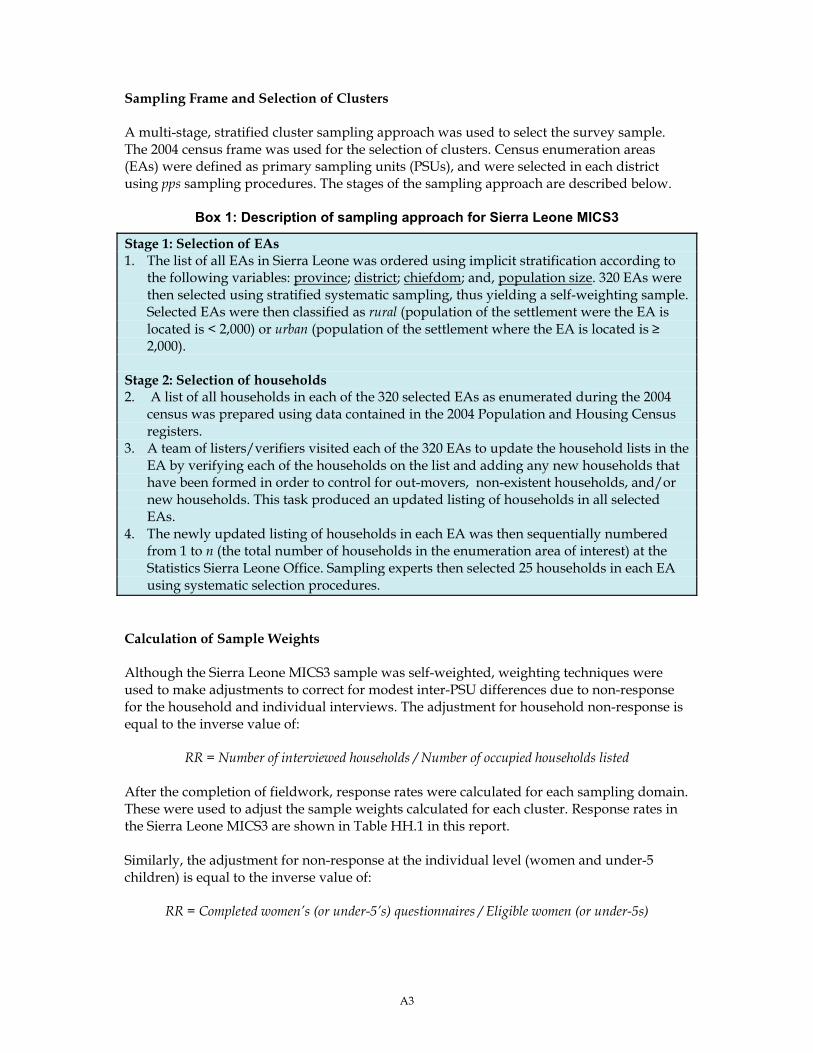
A3
Sampling Frame and Selection of Clusters A multi-stage, stratified cluster sampling approach was used to select the survey sample. The 2004 census frame was used for the selection of clusters. Census enumeration areas (EAs) were defined as primary sampling units (PSUs), and were selected in each district using pps sampling procedures. The stages of the sampling approach are described below.
Box 1: Description of sampling approach for Sierra Leone MICS3
Stage 1: Selection of EAs 1. The list of all EAs in Sierra Leone was ordered using implicit stratification according to
the following variables: province; district; chiefdom; and, population size. 320 EAs were then selected using stratified systematic sampling, thus yielding a self-weighting sample. Selected EAs were then classified as rural (population of the settlement were the EA is located is < 2,000) or urban (population of the settlement where the EA is located is ≥ 2,000).
Stage 2: Selection of households 2. A list of all households in each of the 320 selected EAs as enumerated during the 2004
census was prepared using data contained in the 2004 Population and Housing Census registers.
3. A team of listers/verifiers visited each of the 320 EAs to update the household lists in the EA by verifying each of the households on the list and adding any new households that have been formed in order to control for out-movers, non-existent households, and/or new households. This task produced an updated listing of households in all selected EAs.
4. The newly updated listing of households in each EA was then sequentially numbered from 1 to n (the total number of households in the enumeration area of interest) at the Statistics Sierra Leone Office. Sampling experts then selected 25 households in each EA using systematic selection procedures.
Calculation of Sample Weights Although the Sierra Leone MICS3 sample was self-weighted, weighting techniques were used to make adjustments to correct for modest inter-PSU differences due to non-response for the household and individual interviews. The adjustment for household non-response is equal to the inverse value of:
RR = Number of interviewed households / Number of occupied households listed After the completion of fieldwork, response rates were calculated for each sampling domain. These were used to adjust the sample weights calculated for each cluster. Response rates in the Sierra Leone MICS3 are shown in Table HH.1 in this report. Similarly, the adjustment for non-response at the individual level (women and under-5 children) is equal to the inverse value of:
RR = Completed women’s (or under-5’s) questionnaires / Eligible women (or under-5s)
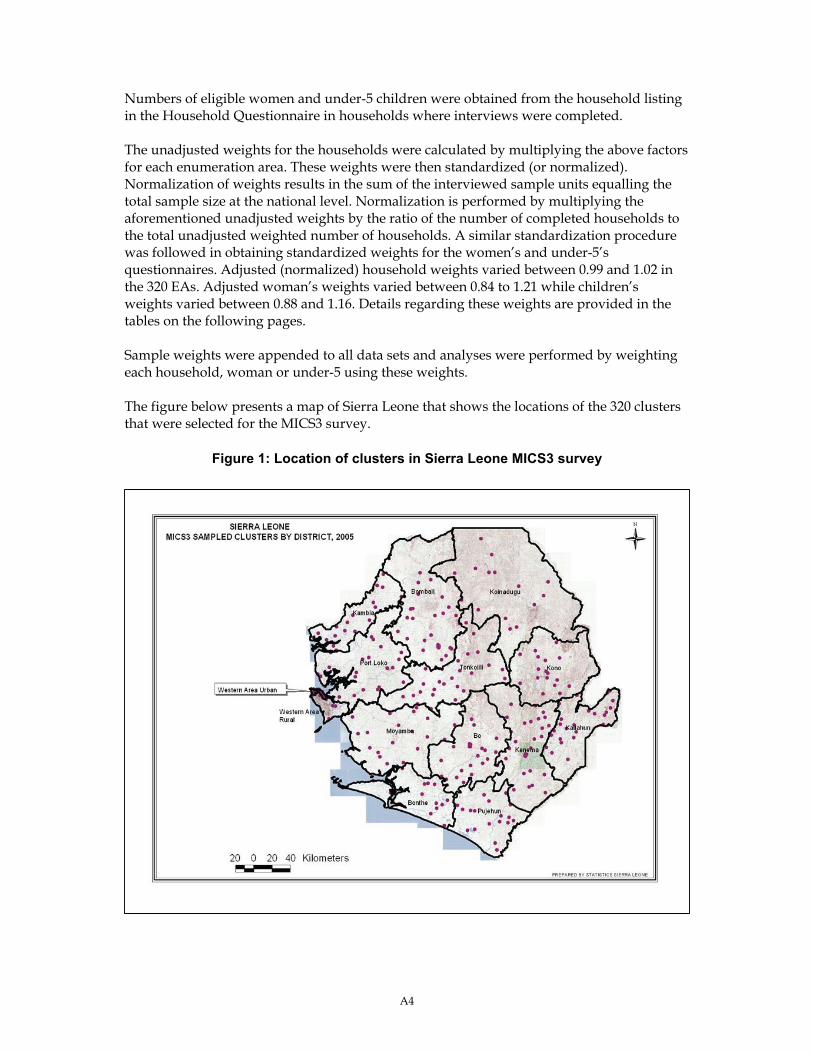
A4
Numbers of eligible women and under-5 children were obtained from the household listing in the Household Questionnaire in households where interviews were completed. The unadjusted weights for the households were calculated by multiplying the above factors for each enumeration area. These weights were then standardized (or normalized). Normalization of weights results in the sum of the interviewed sample units equalling the total sample size at the national level. Normalization is performed by multiplying the aforementioned unadjusted weights by the ratio of the number of completed households to the total unadjusted weighted number of households. A similar standardization procedure was followed in obtaining standardized weights for the women’s and under-5’s questionnaires. Adjusted (normalized) household weights varied between 0.99 and 1.02 in the 320 EAs. Adjusted woman’s weights varied between 0.84 to 1.21 while children’s weights varied between 0.88 and 1.16. Details regarding these weights are provided in the tables on the following pages. Sample weights were appended to all data sets and analyses were performed by weighting each household, woman or under-5 using these weights. The figure below presents a map of Sierra Leone that shows the locations of the 320 clusters that were selected for the MICS3 survey.
Figure 1: Location of clusters in Sierra Leone MICS3 survey
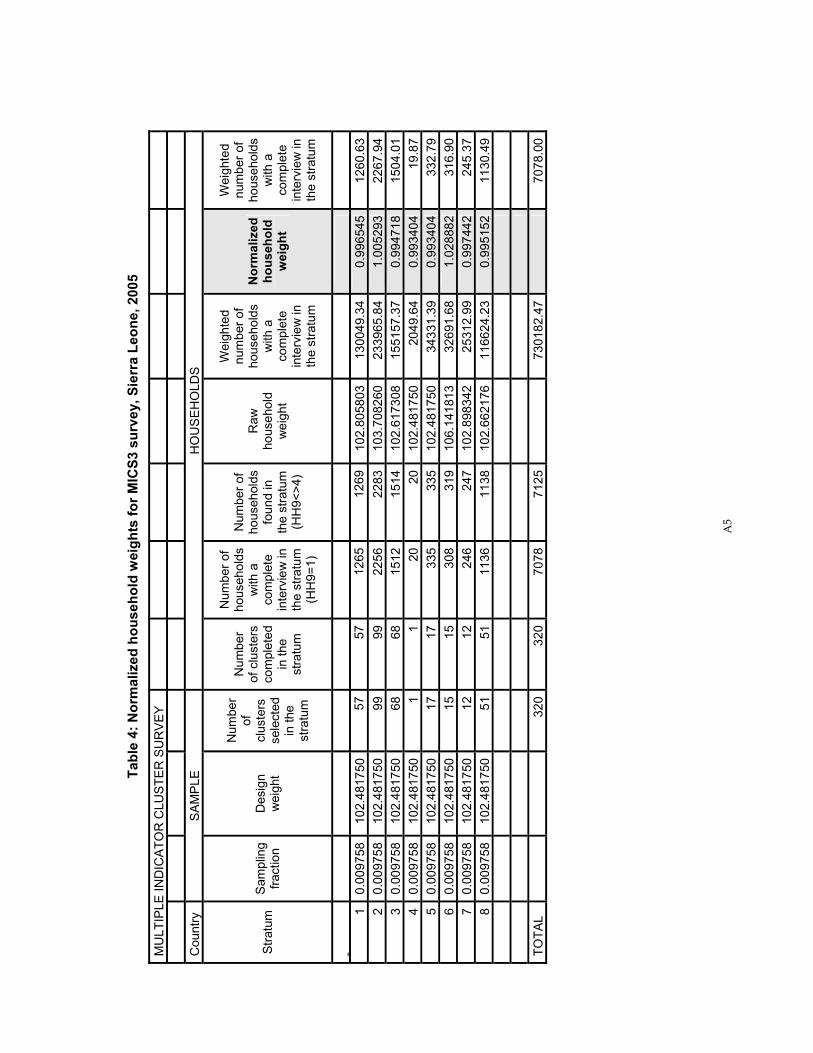
A5
Tabl
e 4:
Nor
mal
ized
hou
seho
ld w
eigh
ts fo
r MIC
S3 s
urve
y, S
ierr
a Le
one,
200
5
MU
LTIP
LE IN
DIC
ATO
R C
LUST
ER
SU
RV
EY
Cou
ntry
S
AM
PLE
H
OU
SE
HO
LDS
Stra
tum
S
ampl
ing
fract
ion
Des
ign
wei
ght
Num
ber
of
clus
ters
se
lect
ed
in th
e st
ratu
m
Num
ber
of c
lust
ers
com
plet
ed
in th
e st
ratu
m
Num
ber o
f ho
useh
olds
w
ith a
co
mpl
ete
inte
rvie
w in
th
e st
ratu
m
(HH
9=1)
Num
ber o
f ho
useh
olds
fo
und
in
the
stra
tum
(H
H9<
>4)
Raw
ho
useh
old
wei
ght
Wei
ghte
d nu
mbe
r of
hous
ehol
ds
with
a
com
plet
e in
terv
iew
in
the
stra
tum
Nor
mal
ized
ho
useh
old
wei
ght
Wei
ghte
d nu
mbe
r of
hous
ehol
ds
with
a
com
plet
e in
terv
iew
in
the
stra
tum
1
0.00
9758
10
2.48
1750
57
5712
6512
6910
2.80
5803
1300
49.3
40.
9965
4512
60.6
32
0.00
9758
10
2.48
1750
99
9922
5622
8310
3.70
8260
2339
65.8
41.
0052
9322
67.9
43
0.00
9758
10
2.48
1750
68
6815
1215
1410
2.61
7308
1551
57.3
70.
9947
1815
04.0
14
0.00
9758
10
2.48
1750
1
120
2010
2.48
1750
2049
.64
0.99
3404
19.8
75
0.00
9758
10
2.48
1750
17
1733
533
510
2.48
1750
3433
1.39
0.99
3404
332.
796
0.00
9758
10
2.48
1750
15
1530
831
910
6.14
1813
3269
1.68
1.02
8882
316.
907
0.00
9758
10
2.48
1750
12
1224
624
710
2.89
8342
2531
2.99
0.99
7442
245.
378
0.00
9758
10
2.48
1750
51
5111
3611
3810
2.66
2176
1166
24.2
30.
9951
5211
30.4
9
TO
TAL
320
320
7078
7125
73
0182
.47
70
78.0
0
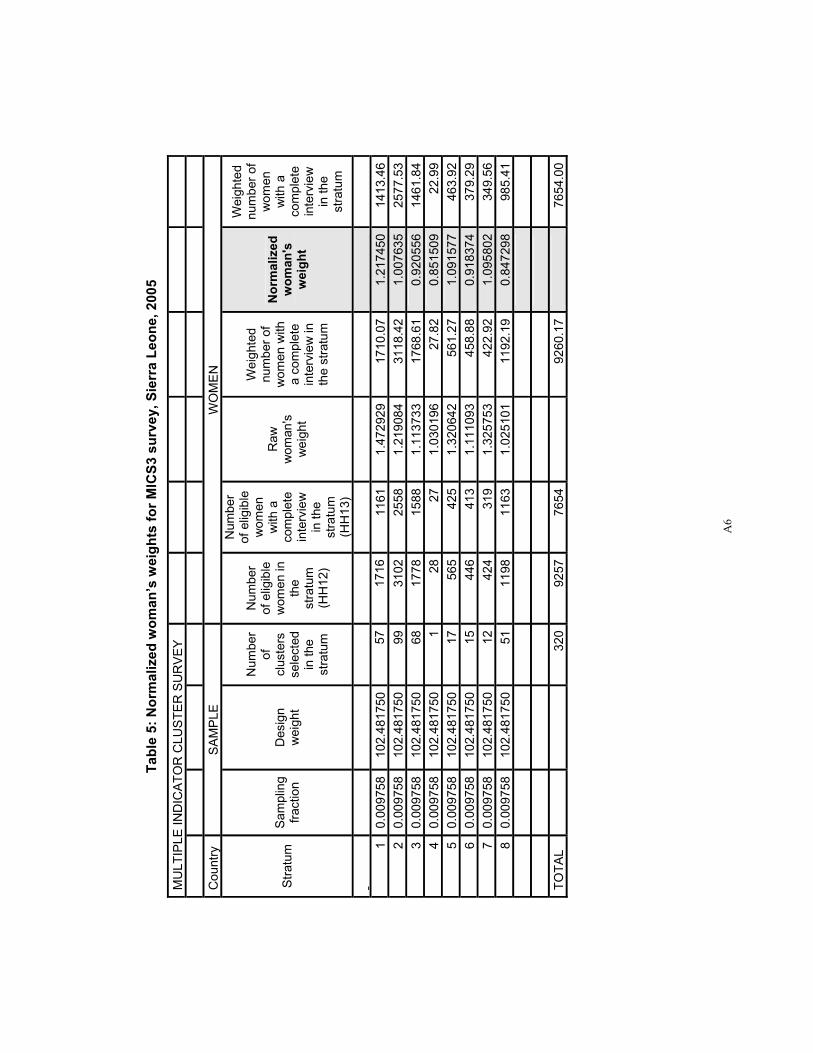
A6
Ta
ble
5: N
orm
aliz
ed w
oman
’s w
eigh
ts fo
r MIC
S3 s
urve
y, S
ierr
a Le
one,
200
5
MU
LTIP
LE IN
DIC
ATO
R C
LUST
ER
SU
RV
EY
Cou
ntry
S
AM
PLE
W
OM
EN
Stra
tum
S
ampl
ing
fract
ion
Des
ign
wei
ght
Num
ber
of
clus
ters
se
lect
ed
in th
e st
ratu
m
Num
ber
of e
ligib
le
wom
en in
th
e st
ratu
m
(HH
12)
Num
ber
of e
ligib
le
wom
en
with
a
com
plet
e in
terv
iew
in
the
stra
tum
(H
H13
)
Raw
w
oman
's
wei
ght
Wei
ghte
d nu
mbe
r of
wom
en w
ith
a co
mpl
ete
inte
rvie
w in
th
e st
ratu
m
Nor
mal
ized
w
oman
's
wei
ght
Wei
ghte
d nu
mbe
r of
wom
en
with
a
com
plet
e in
terv
iew
in
the
stra
tum
1 0.
0097
58
102.
4817
5057
1716
1161
1.47
2929
17
10.0
71.
2174
5014
13.4
62
0.00
9758
10
2.48
1750
9931
0225
581.
2190
84
3118
.42
1.00
7635
2577
.53
3 0.
0097
58
102.
4817
5068
1778
1588
1.11
3733
17
68.6
10.
9205
5614
61.8
44
0.00
9758
10
2.48
1750
128
271.
0301
96
27.8
20.
8515
0922
.99
5 0.
0097
58
102.
4817
5017
565
425
1.32
0642
56
1.27
1.09
1577
463.
926
0.00
9758
10
2.48
1750
1544
641
31.
1110
93
458.
880.
9183
7437
9.29
7 0.
0097
58
102.
4817
5012
424
319
1.32
5753
42
2.92
1.09
5802
349.
568
0.00
9758
10
2.48
1750
5111
9811
631.
0251
01
1192
.19
0.84
7298
985.
41
TO
TAL
320
9257
7654
92
60.1
7
7654
.00

A7
Ta
ble
6: N
orm
aliz
ed c
hild
ren’
s w
eigh
ts fo
r MIC
S3 s
urve
y, S
ierr
a Le
one,
200
5
MU
LTIP
LE IN
DIC
ATO
R C
LUST
ER
SU
RV
EY
Cou
ntry
S
AM
PLE
C
HIL
DR
EN
Stra
tum
S
ampl
ing
fract
ion
Des
ign
wei
ght
Num
ber
of
clus
ters
se
lect
ed
in th
e st
ratu
m
Num
ber
of e
ligib
le
child
ren
in
the
stra
tum
(H
H14
)
Num
ber
of e
ligib
le
child
ren
with
a
com
plet
e in
terv
iew
in
the
stra
tum
(H
H15
)
Raw
ch
ildre
n's
wei
ght
Wei
ghte
d nu
mbe
r of
child
ren
with
a
com
plet
e in
terv
iew
in
the
stra
tum
Nor
mal
ized
ch
ildre
n's
wei
ght
Wei
ghte
d nu
mbe
r of
child
ren
with
a
com
plet
e in
terv
iew
in
the
stra
tum
1 0.
0097
58
102.
4817
5057
1204
913
1.31
4173
11
99.8
41.
1674
6510
65.9
02
0.00
9758
10
2.48
1750
9920
2918
601.
0966
34
2039
.74
0.97
4211
1812
.03
3 0.
0097
58
102.
4817
5068
1423
1289
1.09
8125
14
15.4
80.
9755
3612
57.4
74
0.00
9758
10
2.48
1750
114
140.
9934
04
13.9
10.
8825
0512
.36
5 0.
0097
58
102.
4817
5017
274
236
1.15
3358
27
2.19
1.02
4603
241.
816
0.00
9758
10
2.48
1750
1524
423
91.
0504
07
251.
050.
9331
4522
3.02
7 0.
0097
58
102.
4817
5012
215
196
1.09
4133
21
4.45
0.97
1989
190.
518
0.00
9758
10
2.48
1750
5150
149
90.
9991
41
498.
570.
8876
0244
2.91
TOTA
L
32
059
0452
46
5905
.23
52
46.0
0
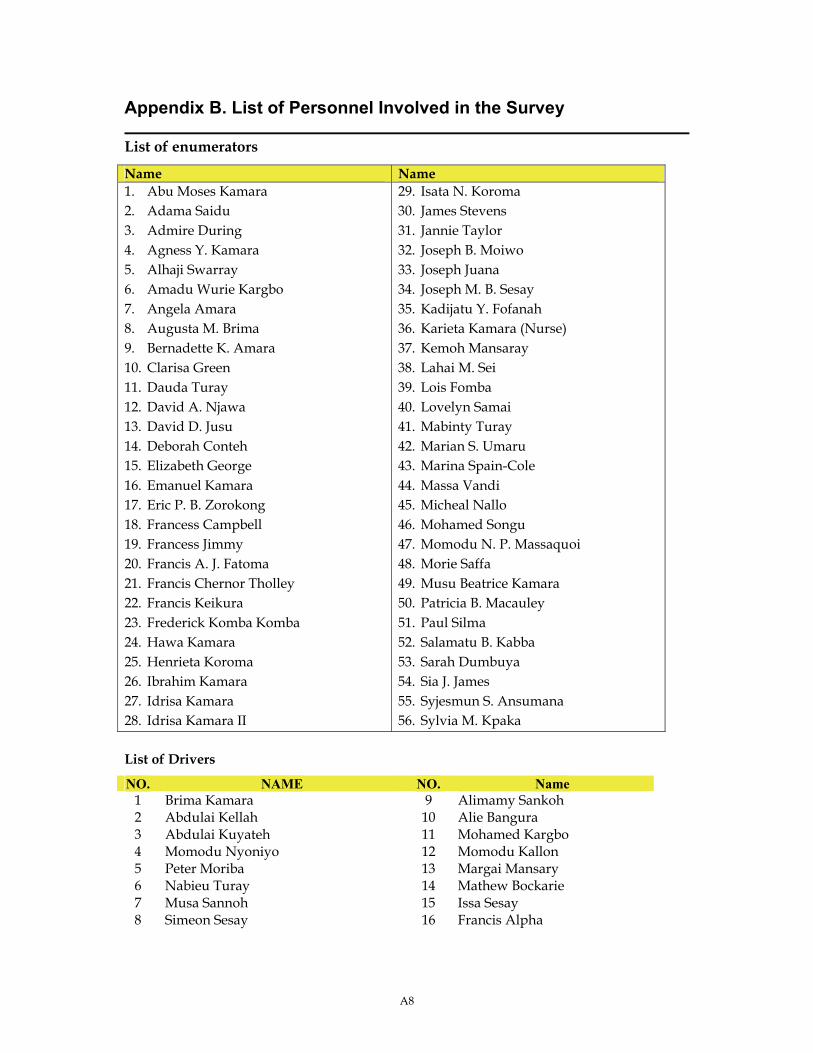
A8
Appendix B. List of Personnel Involved in the Survey
List of enumerators
Name Name 1. Abu Moses Kamara 2. Adama Saidu 3. Admire During 4. Agness Y. Kamara 5. Alhaji Swarray 6. Amadu Wurie Kargbo 7. Angela Amara 8. Augusta M. Brima 9. Bernadette K. Amara 10. Clarisa Green 11. Dauda Turay 12. David A. Njawa 13. David D. Jusu 14. Deborah Conteh 15. Elizabeth George 16. Emanuel Kamara 17. Eric P. B. Zorokong 18. Francess Campbell 19. Francess Jimmy 20. Francis A. J. Fatoma 21. Francis Chernor Tholley 22. Francis Keikura 23. Frederick Komba Komba 24. Hawa Kamara 25. Henrieta Koroma 26. Ibrahim Kamara 27. Idrisa Kamara 28. Idrisa Kamara II
29. Isata N. Koroma 30. James Stevens 31. Jannie Taylor 32. Joseph B. Moiwo 33. Joseph Juana 34. Joseph M. B. Sesay 35. Kadijatu Y. Fofanah 36. Karieta Kamara (Nurse) 37. Kemoh Mansaray 38. Lahai M. Sei 39. Lois Fomba 40. Lovelyn Samai 41. Mabinty Turay 42. Marian S. Umaru 43. Marina Spain-Cole 44. Massa Vandi 45. Micheal Nallo 46. Mohamed Songu 47. Momodu N. P. Massaquoi 48. Morie Saffa 49. Musu Beatrice Kamara 50. Patricia B. Macauley 51. Paul Silma 52. Salamatu B. Kabba 53. Sarah Dumbuya 54. Sia J. James 55. Syjesmun S. Ansumana 56. Sylvia M. Kpaka
List of Drivers
NO. NAME NO. Name 1 Brima Kamara 9 Alimamy Sankoh 2 Abdulai Kellah 10 Alie Bangura 3 Abdulai Kuyateh 11 Mohamed Kargbo 4 Momodu Nyoniyo 12 Momodu Kallon 5 Peter Moriba 13 Margai Mansary 6 Nabieu Turay 14 Mathew Bockarie 7 Musa Sannoh 15 Issa Sesay 8 Simeon Sesay 16 Francis Alpha
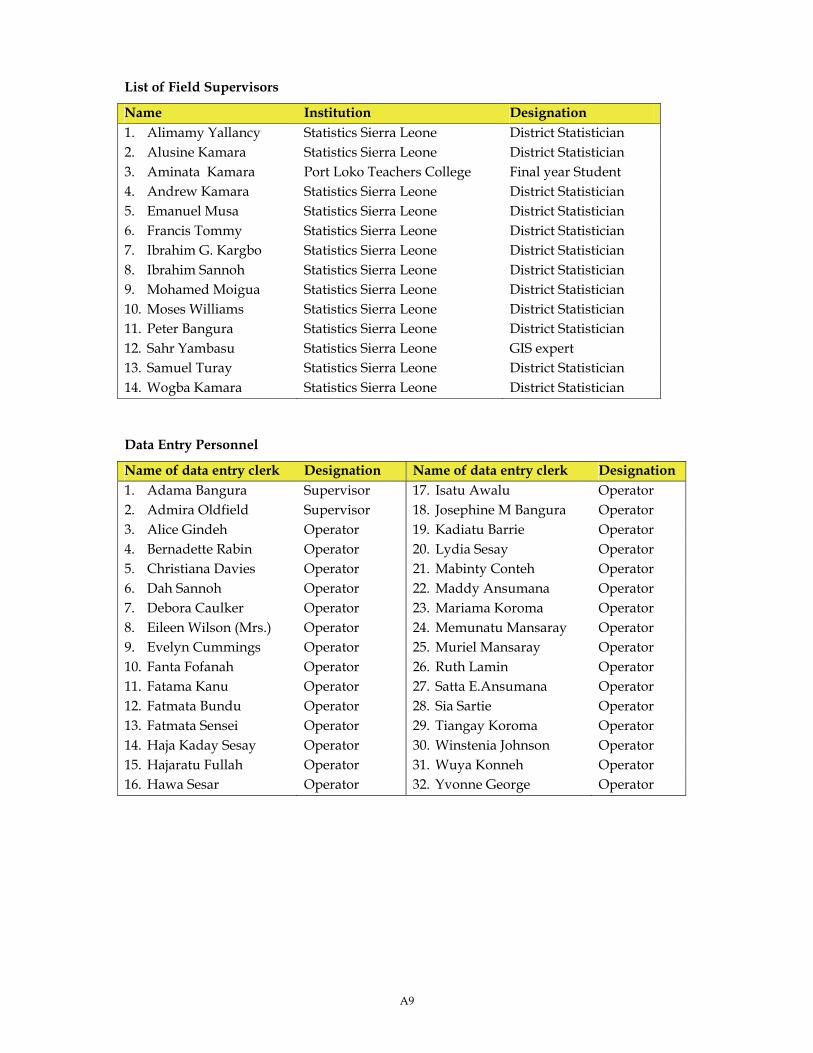
A9
List of Field Supervisors
Name Institution Designation 1. Alimamy Yallancy Statistics Sierra Leone District Statistician 2. Alusine Kamara Statistics Sierra Leone District Statistician 3. Aminata Kamara Port Loko Teachers College Final year Student 4. Andrew Kamara Statistics Sierra Leone District Statistician 5. Emanuel Musa Statistics Sierra Leone District Statistician 6. Francis Tommy Statistics Sierra Leone District Statistician 7. Ibrahim G. Kargbo Statistics Sierra Leone District Statistician 8. Ibrahim Sannoh Statistics Sierra Leone District Statistician 9. Mohamed Moigua Statistics Sierra Leone District Statistician 10. Moses Williams Statistics Sierra Leone District Statistician 11. Peter Bangura Statistics Sierra Leone District Statistician 12. Sahr Yambasu Statistics Sierra Leone GIS expert 13. Samuel Turay Statistics Sierra Leone District Statistician 14. Wogba Kamara Statistics Sierra Leone District Statistician Data Entry Personnel
Name of data entry clerk Designation Name of data entry clerk Designation 1. Adama Bangura Supervisor 17. Isatu Awalu Operator 2. Admira Oldfield Supervisor 18. Josephine M Bangura Operator 3. Alice Gindeh Operator 19. Kadiatu Barrie Operator 4. Bernadette Rabin Operator 20. Lydia Sesay Operator 5. Christiana Davies Operator 21. Mabinty Conteh Operator 6. Dah Sannoh Operator 22. Maddy Ansumana Operator 7. Debora Caulker Operator 23. Mariama Koroma Operator 8. Eileen Wilson (Mrs.) Operator 24. Memunatu Mansaray Operator 9. Evelyn Cummings Operator 25. Muriel Mansaray Operator 10. Fanta Fofanah Operator 26. Ruth Lamin Operator 11. Fatama Kanu Operator 27. Satta E.Ansumana Operator 12. Fatmata Bundu Operator 28. Sia Sartie Operator 13. Fatmata Sensei Operator 29. Tiangay Koroma Operator 14. Haja Kaday Sesay Operator 30. Winstenia Johnson Operator 15. Hajaratu Fullah Operator 31. Wuya Konneh Operator 16. Hawa Sesar Operator 32. Yvonne George Operator
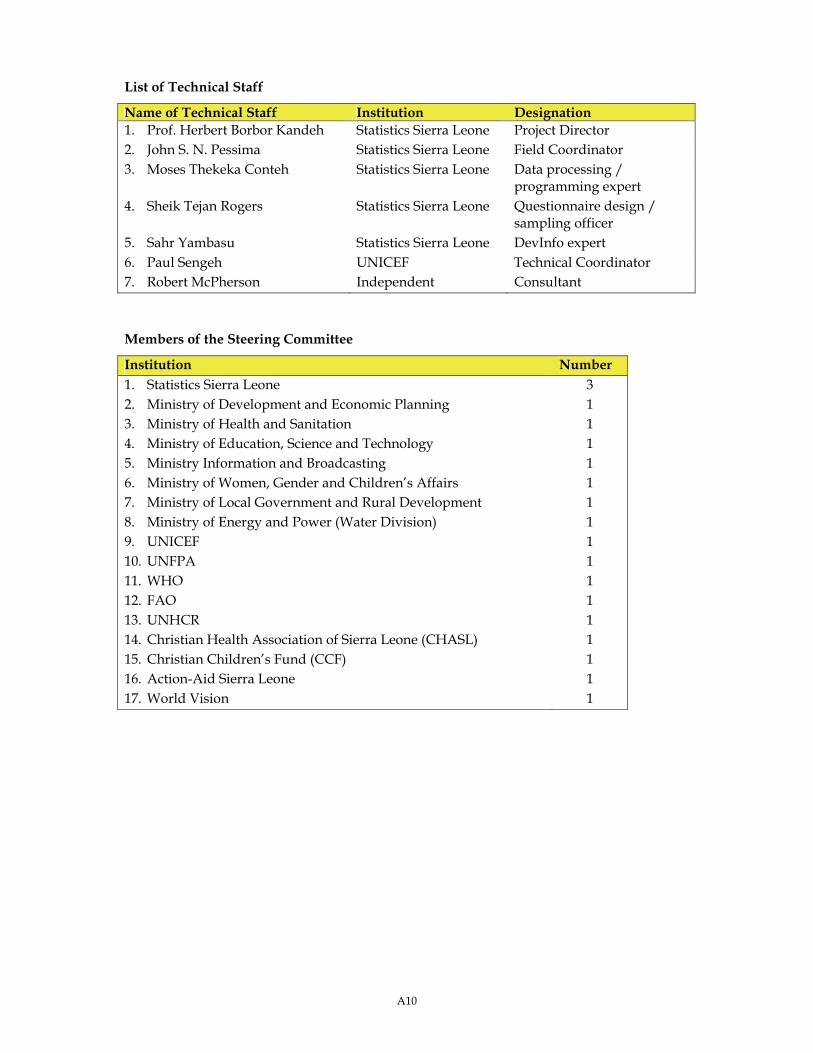
A10
List of Technical Staff
Name of Technical Staff Institution Designation 1. Prof. Herbert Borbor Kandeh Statistics Sierra Leone Project Director 2. John S. N. Pessima Statistics Sierra Leone Field Coordinator 3. Moses Thekeka Conteh Statistics Sierra Leone Data processing /
programming expert 4. Sheik Tejan Rogers Statistics Sierra Leone Questionnaire design /
sampling officer 5. Sahr Yambasu Statistics Sierra Leone DevInfo expert 6. Paul Sengeh UNICEF Technical Coordinator 7. Robert McPherson Independent Consultant Members of the Steering Committee
Institution Number 1. Statistics Sierra Leone 3 2. Ministry of Development and Economic Planning 1 3. Ministry of Health and Sanitation 1 4. Ministry of Education, Science and Technology 1 5. Ministry Information and Broadcasting 1 6. Ministry of Women, Gender and Children’s Affairs 1 7. Ministry of Local Government and Rural Development 1 8. Ministry of Energy and Power (Water Division) 1 9. UNICEF 1 10. UNFPA 1 11. WHO 1 12. FAO 1 13. UNHCR 1 14. Christian Health Association of Sierra Leone (CHASL) 1 15. Christian Children’s Fund (CCF) 1 16. Action-Aid Sierra Leone 1 17. World Vision 1
A11
Appendix C. Estimates of Sampling Errors
The sample of respondents selected in the Sierra Leone MICS3 survey is only one of the samples that could have been selected from the same population, using the same design and size. Each of these samples would yield results that differ somewhat from the results of the actual sample that was selected. Sampling errors are a measure of the variability between all possible samples. The extent of variability is not known exactly, but can be estimated statistically from the survey results. The following sampling error measures are presented in this appendix for selected core indicators: Standard error (se): Sampling errors are usually measured in terms of standard errors for
particular indicators (means, proportions, etc.). Standard error is the square root of the variance. The Taylor linearization method is used for the estimation of standard errors.
Coefficient of variation (se/r) is the ratio of the standard error to the value of the indicator.
Design effect (deff) is the ratio of the actual variance of an indicator, under the sampling method used in the survey, to the variance calculated under the assumption of simple random sampling. The square root of the design effect (deft) is used to show the efficiency of the sample design. A deft value of 1.0 indicates that the sample design is as efficient as a simple random sample, while a deft value above 1.0 indicates the magnitude of the increase in the standard error due to the use of a more complex sample design.
Confidence limits are calculated to show the interval within which the true value for the population can be reasonably assumed to fall. For any given statistic calculated from the survey, the value of that statistic will fall within a range of plus or minus two times the standard error (p + 2.se or p – 2.se) of the statistic in 95 percent of all possible samples of identical size and design.
For the calculation of sampling errors from MICS3 data, SPSS Version 14 Complex Samples module has been used. The results are shown in the tables that follow. In addition to the sampling error measures described above, the tables also include weighted and unweighted counts of denominators for each indicator. Sampling errors are calculated for indicators of primary interest at the national level, for each of the provinces, and for urban and rural areas. Three of the selected indicators are based on households, eight are based on household members, 13 are based on women, and 15 are based on children under five. All indicators presented here are in the form of proportions. Table SE.1 shows the list of indicators for which sampling errors are calculated, including the base population (denominator) for each indicator. Tables SE.2 to SE.8 show the calculated sampling errors.
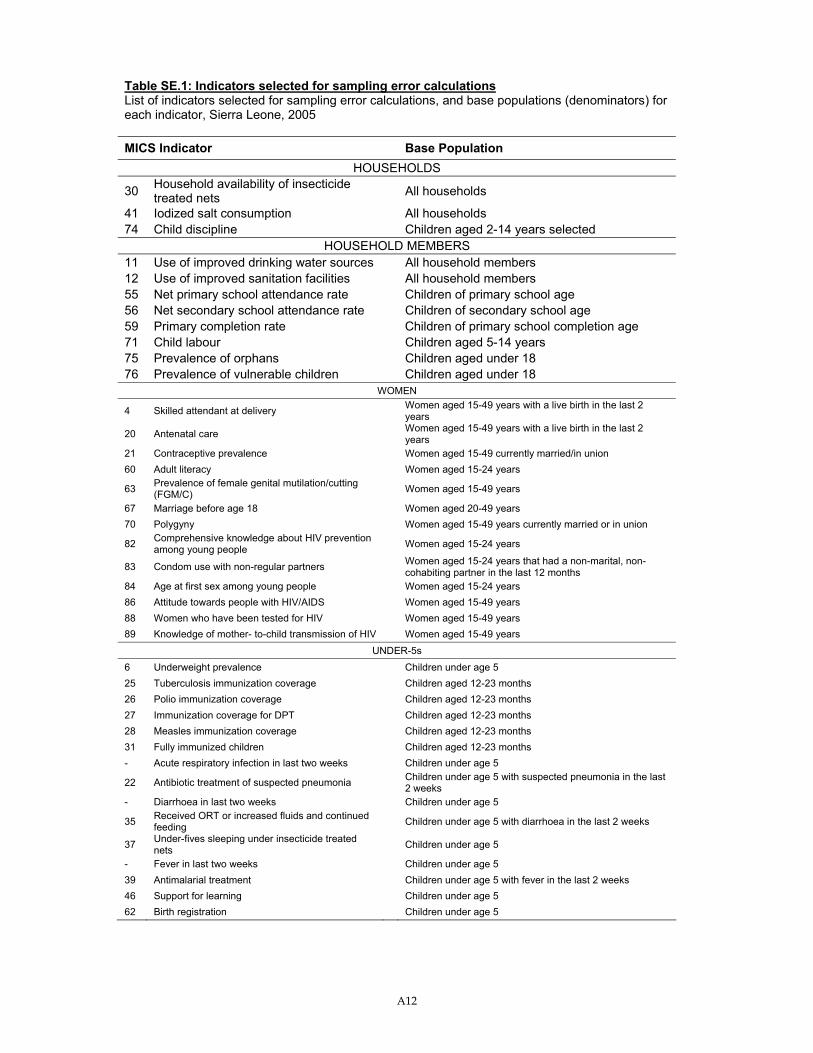
A12
Table SE.1: Indicators selected for sampling error calculations List of indicators selected for sampling error calculations, and base populations (denominators) for each indicator, Sierra Leone, 2005 MICS Indicator Base Population
HOUSEHOLDS
30 Household availability of insecticide treated nets All households
41 Iodized salt consumption All households 74 Child discipline Children aged 2-14 years selected
HOUSEHOLD MEMBERS 11 Use of improved drinking water sources All household members 12 Use of improved sanitation facilities All household members 55 Net primary school attendance rate Children of primary school age 56 Net secondary school attendance rate Children of secondary school age 59 Primary completion rate Children of primary school completion age 71 Child labour Children aged 5-14 years 75 Prevalence of orphans Children aged under 18 76 Prevalence of vulnerable children Children aged under 18
WOMEN
4 Skilled attendant at delivery Women aged 15-49 years with a live birth in the last 2 years
20 Antenatal care Women aged 15-49 years with a live birth in the last 2 years
21 Contraceptive prevalence Women aged 15-49 currently married/in union 60 Adult literacy Women aged 15-24 years
63 Prevalence of female genital mutilation/cutting (FGM/C) Women aged 15-49 years
67 Marriage before age 18 Women aged 20-49 years 70 Polygyny Women aged 15-49 years currently married or in union
82 Comprehensive knowledge about HIV prevention among young people Women aged 15-24 years
83 Condom use with non-regular partners Women aged 15-24 years that had a non-marital, non-cohabiting partner in the last 12 months
84 Age at first sex among young people Women aged 15-24 years 86 Attitude towards people with HIV/AIDS Women aged 15-49 years 88 Women who have been tested for HIV Women aged 15-49 years 89 Knowledge of mother- to-child transmission of HIV Women aged 15-49 years
UNDER-5s 6 Underweight prevalence Children under age 5 25 Tuberculosis immunization coverage Children aged 12-23 months 26 Polio immunization coverage Children aged 12-23 months 27 Immunization coverage for DPT Children aged 12-23 months 28 Measles immunization coverage Children aged 12-23 months 31 Fully immunized children Children aged 12-23 months - Acute respiratory infection in last two weeks Children under age 5
22 Antibiotic treatment of suspected pneumonia Children under age 5 with suspected pneumonia in the last 2 weeks
- Diarrhoea in last two weeks Children under age 5
35 Received ORT or increased fluids and continued feeding Children under age 5 with diarrhoea in the last 2 weeks
37 Under-fives sleeping under insecticide treated nets Children under age 5
- Fever in last two weeks Children under age 5 39 Antimalarial treatment Children under age 5 with fever in the last 2 weeks 46 Support for learning Children under age 5 62 Birth registration Children under age 5
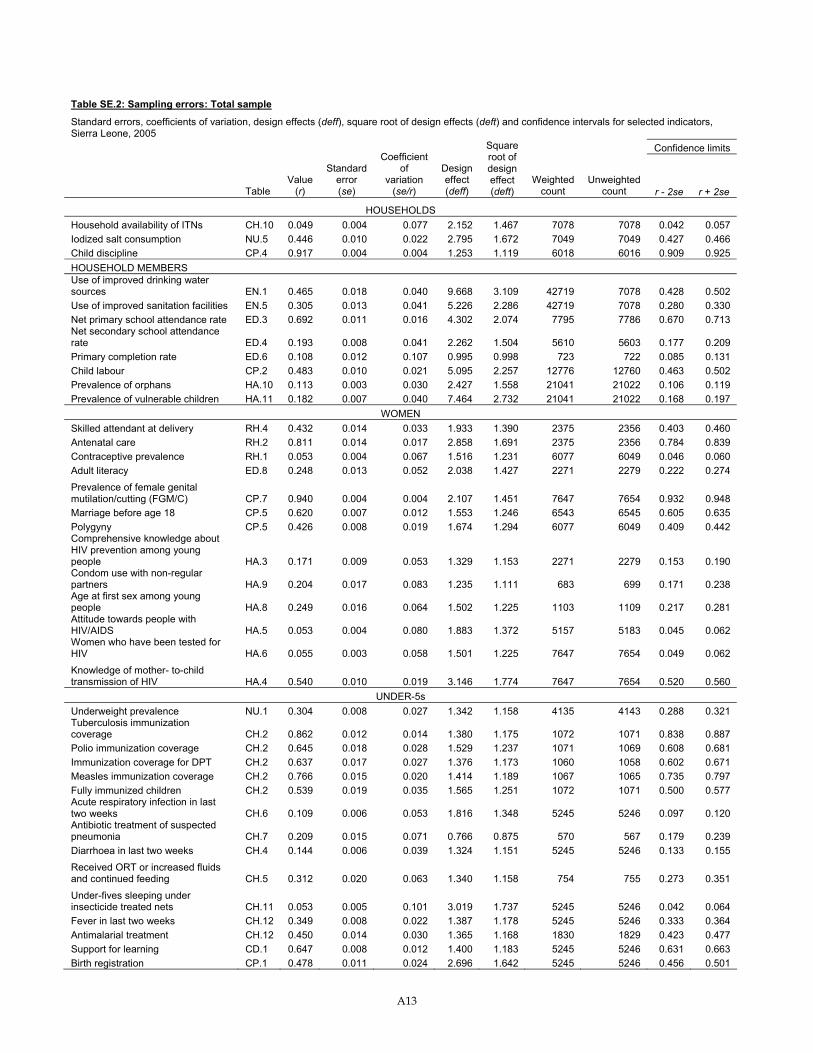
A13
Table SE.2: Sampling errors: Total sample
Standard errors, coefficients of variation, design effects (deff), square root of design effects (deft) and confidence intervals for selected indicators, Sierra Leone, 2005
Confidence limits
Table Value
(r)
Standard error (se)
Coefficient of
variation (se/r)
Design effect (deff)
Square root of design effect (deft)
Weighted count
Unweighted count r - 2se r + 2se
HOUSEHOLDS Household availability of ITNs CH.10 0.049 0.004 0.077 2.152 1.467 7078 7078 0.042 0.057 Iodized salt consumption NU.5 0.446 0.010 0.022 2.795 1.672 7049 7049 0.427 0.466 Child discipline CP.4 0.917 0.004 0.004 1.253 1.119 6018 6016 0.909 0.925 HOUSEHOLD MEMBERS Use of improved drinking water sources EN.1 0.465 0.018 0.040 9.668 3.109 42719 7078 0.428 0.502 Use of improved sanitation facilities EN.5 0.305 0.013 0.041 5.226 2.286 42719 7078 0.280 0.330 Net primary school attendance rate ED.3 0.692 0.011 0.016 4.302 2.074 7795 7786 0.670 0.713 Net secondary school attendance rate ED.4 0.193 0.008 0.041 2.262 1.504 5610 5603 0.177 0.209 Primary completion rate ED.6 0.108 0.012 0.107 0.995 0.998 723 722 0.085 0.131 Child labour CP.2 0.483 0.010 0.021 5.095 2.257 12776 12760 0.463 0.502 Prevalence of orphans HA.10 0.113 0.003 0.030 2.427 1.558 21041 21022 0.106 0.119 Prevalence of vulnerable children HA.11 0.182 0.007 0.040 7.464 2.732 21041 21022 0.168 0.197
WOMEN Skilled attendant at delivery RH.4 0.432 0.014 0.033 1.933 1.390 2375 2356 0.403 0.460 Antenatal care RH.2 0.811 0.014 0.017 2.858 1.691 2375 2356 0.784 0.839 Contraceptive prevalence RH.1 0.053 0.004 0.067 1.516 1.231 6077 6049 0.046 0.060 Adult literacy ED.8 0.248 0.013 0.052 2.038 1.427 2271 2279 0.222 0.274 Prevalence of female genital mutilation/cutting (FGM/C) CP.7 0.940 0.004 0.004 2.107 1.451 7647 7654 0.932 0.948 Marriage before age 18 CP.5 0.620 0.007 0.012 1.553 1.246 6543 6545 0.605 0.635 Polygyny CP.5 0.426 0.008 0.019 1.674 1.294 6077 6049 0.409 0.442 Comprehensive knowledge about HIV prevention among young people HA.3 0.171 0.009 0.053 1.329 1.153 2271 2279 0.153 0.190 Condom use with non-regular partners HA.9 0.204 0.017 0.083 1.235 1.111 683 699 0.171 0.238 Age at first sex among young people HA.8 0.249 0.016 0.064 1.502 1.225 1103 1109 0.217 0.281 Attitude towards people with HIV/AIDS HA.5 0.053 0.004 0.080 1.883 1.372 5157 5183 0.045 0.062 Women who have been tested for HIV HA.6 0.055 0.003 0.058 1.501 1.225 7647 7654 0.049 0.062
Knowledge of mother- to-child transmission of HIV HA.4 0.540 0.010 0.019 3.146 1.774 7647 7654 0.520 0.560
UNDER-5s Underweight prevalence NU.1 0.304 0.008 0.027 1.342 1.158 4135 4143 0.288 0.321 Tuberculosis immunization coverage CH.2 0.862 0.012 0.014 1.380 1.175 1072 1071 0.838 0.887 Polio immunization coverage CH.2 0.645 0.018 0.028 1.529 1.237 1071 1069 0.608 0.681 Immunization coverage for DPT CH.2 0.637 0.017 0.027 1.376 1.173 1060 1058 0.602 0.671 Measles immunization coverage CH.2 0.766 0.015 0.020 1.414 1.189 1067 1065 0.735 0.797 Fully immunized children CH.2 0.539 0.019 0.035 1.565 1.251 1072 1071 0.500 0.577 Acute respiratory infection in last two weeks CH.6 0.109 0.006 0.053 1.816 1.348 5245 5246 0.097 0.120 Antibiotic treatment of suspected pneumonia CH.7 0.209 0.015 0.071 0.766 0.875 570 567 0.179 0.239 Diarrhoea in last two weeks CH.4 0.144 0.006 0.039 1.324 1.151 5245 5246 0.133 0.155 Received ORT or increased fluids and continued feeding CH.5 0.312 0.020 0.063 1.340 1.158 754 755 0.273 0.351 Under-fives sleeping under insecticide treated nets CH.11 0.053 0.005 0.101 3.019 1.737 5245 5246 0.042 0.064 Fever in last two weeks CH.12 0.349 0.008 0.022 1.387 1.178 5245 5246 0.333 0.364 Antimalarial treatment CH.12 0.450 0.014 0.030 1.365 1.168 1830 1829 0.423 0.477 Support for learning CD.1 0.647 0.008 0.012 1.400 1.183 5245 5246 0.631 0.663 Birth registration CP.1 0.478 0.011 0.024 2.696 1.642 5245 5246 0.456 0.501
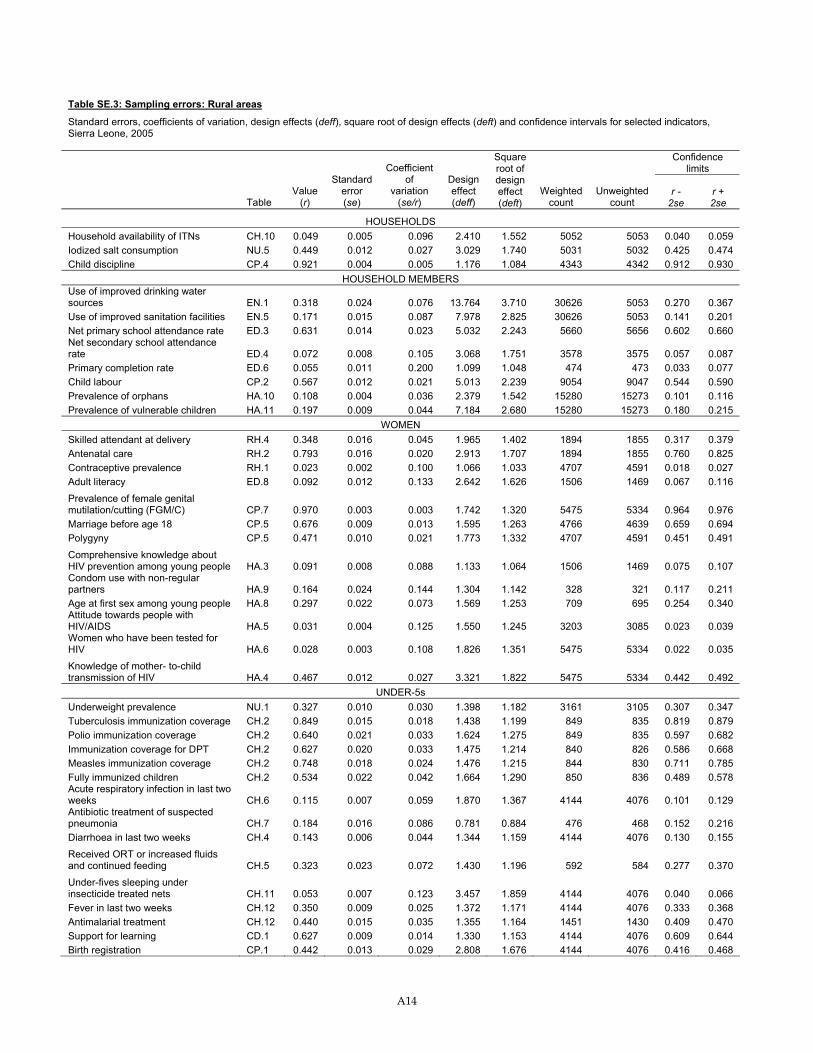
A14
Table SE.3: Sampling errors: Rural areas
Standard errors, coefficients of variation, design effects (deff), square root of design effects (deft) and confidence intervals for selected indicators, Sierra Leone, 2005
Confidence limits
Table Value
(r)
Standard error (se)
Coefficient of
variation (se/r)
Design effect (deff)
Square root of design effect (deft)
Weighted count
Unweighted count
r - 2se
r + 2se
HOUSEHOLDS Household availability of ITNs CH.10 0.049 0.005 0.096 2.410 1.552 5052 5053 0.040 0.059 Iodized salt consumption NU.5 0.449 0.012 0.027 3.029 1.740 5031 5032 0.425 0.474 Child discipline CP.4 0.921 0.004 0.005 1.176 1.084 4343 4342 0.912 0.930
HOUSEHOLD MEMBERS Use of improved drinking water sources EN.1 0.318 0.024 0.076 13.764 3.710 30626 5053 0.270 0.367 Use of improved sanitation facilities EN.5 0.171 0.015 0.087 7.978 2.825 30626 5053 0.141 0.201 Net primary school attendance rate ED.3 0.631 0.014 0.023 5.032 2.243 5660 5656 0.602 0.660 Net secondary school attendance rate ED.4 0.072 0.008 0.105 3.068 1.751 3578 3575 0.057 0.087 Primary completion rate ED.6 0.055 0.011 0.200 1.099 1.048 474 473 0.033 0.077 Child labour CP.2 0.567 0.012 0.021 5.013 2.239 9054 9047 0.544 0.590 Prevalence of orphans HA.10 0.108 0.004 0.036 2.379 1.542 15280 15273 0.101 0.116 Prevalence of vulnerable children HA.11 0.197 0.009 0.044 7.184 2.680 15280 15273 0.180 0.215
WOMEN Skilled attendant at delivery RH.4 0.348 0.016 0.045 1.965 1.402 1894 1855 0.317 0.379 Antenatal care RH.2 0.793 0.016 0.020 2.913 1.707 1894 1855 0.760 0.825 Contraceptive prevalence RH.1 0.023 0.002 0.100 1.066 1.033 4707 4591 0.018 0.027 Adult literacy ED.8 0.092 0.012 0.133 2.642 1.626 1506 1469 0.067 0.116
Prevalence of female genital mutilation/cutting (FGM/C) CP.7 0.970 0.003 0.003 1.742 1.320 5475 5334 0.964 0.976 Marriage before age 18 CP.5 0.676 0.009 0.013 1.595 1.263 4766 4639 0.659 0.694 Polygyny CP.5 0.471 0.010 0.021 1.773 1.332 4707 4591 0.451 0.491
Comprehensive knowledge about HIV prevention among young people HA.3 0.091 0.008 0.088 1.133 1.064 1506 1469 0.075 0.107 Condom use with non-regular partners HA.9 0.164 0.024 0.144 1.304 1.142 328 321 0.117 0.211 Age at first sex among young people HA.8 0.297 0.022 0.073 1.569 1.253 709 695 0.254 0.340 Attitude towards people with HIV/AIDS HA.5 0.031 0.004 0.125 1.550 1.245 3203 3085 0.023 0.039 Women who have been tested for HIV HA.6 0.028 0.003 0.108 1.826 1.351 5475 5334 0.022 0.035
Knowledge of mother- to-child transmission of HIV HA.4 0.467 0.012 0.027 3.321 1.822 5475 5334 0.442 0.492
UNDER-5s Underweight prevalence NU.1 0.327 0.010 0.030 1.398 1.182 3161 3105 0.307 0.347 Tuberculosis immunization coverage CH.2 0.849 0.015 0.018 1.438 1.199 849 835 0.819 0.879 Polio immunization coverage CH.2 0.640 0.021 0.033 1.624 1.275 849 835 0.597 0.682 Immunization coverage for DPT CH.2 0.627 0.020 0.033 1.475 1.214 840 826 0.586 0.668 Measles immunization coverage CH.2 0.748 0.018 0.024 1.476 1.215 844 830 0.711 0.785 Fully immunized children CH.2 0.534 0.022 0.042 1.664 1.290 850 836 0.489 0.578 Acute respiratory infection in last two weeks CH.6 0.115 0.007 0.059 1.870 1.367 4144 4076 0.101 0.129 Antibiotic treatment of suspected pneumonia CH.7 0.184 0.016 0.086 0.781 0.884 476 468 0.152 0.216 Diarrhoea in last two weeks CH.4 0.143 0.006 0.044 1.344 1.159 4144 4076 0.130 0.155
Received ORT or increased fluids and continued feeding CH.5 0.323 0.023 0.072 1.430 1.196 592 584 0.277 0.370 Under-fives sleeping under insecticide treated nets CH.11 0.053 0.007 0.123 3.457 1.859 4144 4076 0.040 0.066 Fever in last two weeks CH.12 0.350 0.009 0.025 1.372 1.171 4144 4076 0.333 0.368 Antimalarial treatment CH.12 0.440 0.015 0.035 1.355 1.164 1451 1430 0.409 0.470 Support for learning CD.1 0.627 0.009 0.014 1.330 1.153 4144 4076 0.609 0.644 Birth registration CP.1 0.442 0.013 0.029 2.808 1.676 4144 4076 0.416 0.468
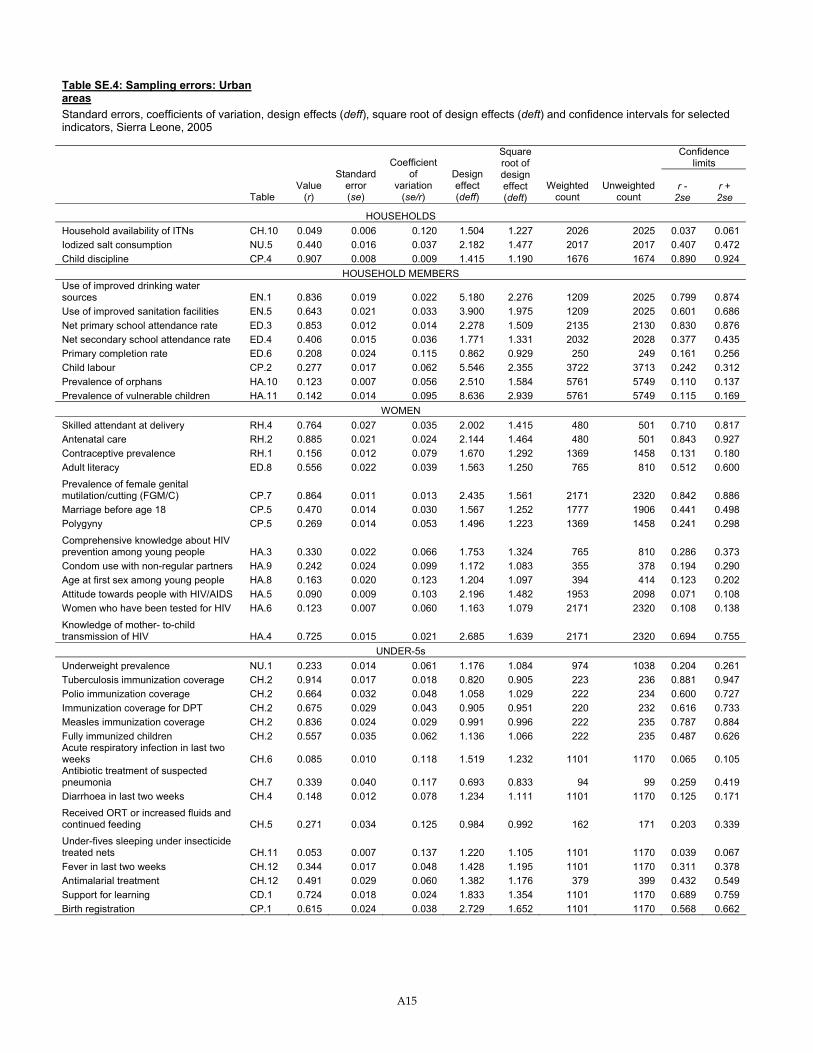
A15
Table SE.4: Sampling errors: Urban areas Standard errors, coefficients of variation, design effects (deff), square root of design effects (deft) and confidence intervals for selected indicators, Sierra Leone, 2005
Confidence limits
Table Value
(r)
Standard error (se)
Coefficient of
variation (se/r)
Design effect (deff)
Square root of design effect (deft)
Weighted count
Unweighted count
r - 2se
r + 2se
HOUSEHOLDS Household availability of ITNs CH.10 0.049 0.006 0.120 1.504 1.227 2026 2025 0.037 0.061 Iodized salt consumption NU.5 0.440 0.016 0.037 2.182 1.477 2017 2017 0.407 0.472 Child discipline CP.4 0.907 0.008 0.009 1.415 1.190 1676 1674 0.890 0.924
HOUSEHOLD MEMBERS Use of improved drinking water sources EN.1 0.836 0.019 0.022 5.180 2.276 1209 2025 0.799 0.874 Use of improved sanitation facilities EN.5 0.643 0.021 0.033 3.900 1.975 1209 2025 0.601 0.686 Net primary school attendance rate ED.3 0.853 0.012 0.014 2.278 1.509 2135 2130 0.830 0.876 Net secondary school attendance rate ED.4 0.406 0.015 0.036 1.771 1.331 2032 2028 0.377 0.435 Primary completion rate ED.6 0.208 0.024 0.115 0.862 0.929 250 249 0.161 0.256 Child labour CP.2 0.277 0.017 0.062 5.546 2.355 3722 3713 0.242 0.312 Prevalence of orphans HA.10 0.123 0.007 0.056 2.510 1.584 5761 5749 0.110 0.137 Prevalence of vulnerable children HA.11 0.142 0.014 0.095 8.636 2.939 5761 5749 0.115 0.169
WOMEN Skilled attendant at delivery RH.4 0.764 0.027 0.035 2.002 1.415 480 501 0.710 0.817 Antenatal care RH.2 0.885 0.021 0.024 2.144 1.464 480 501 0.843 0.927 Contraceptive prevalence RH.1 0.156 0.012 0.079 1.670 1.292 1369 1458 0.131 0.180 Adult literacy ED.8 0.556 0.022 0.039 1.563 1.250 765 810 0.512 0.600
Prevalence of female genital mutilation/cutting (FGM/C) CP.7 0.864 0.011 0.013 2.435 1.561 2171 2320 0.842 0.886 Marriage before age 18 CP.5 0.470 0.014 0.030 1.567 1.252 1777 1906 0.441 0.498 Polygyny CP.5 0.269 0.014 0.053 1.496 1.223 1369 1458 0.241 0.298
Comprehensive knowledge about HIV prevention among young people HA.3 0.330 0.022 0.066 1.753 1.324 765 810 0.286 0.373 Condom use with non-regular partners HA.9 0.242 0.024 0.099 1.172 1.083 355 378 0.194 0.290 Age at first sex among young people HA.8 0.163 0.020 0.123 1.204 1.097 394 414 0.123 0.202 Attitude towards people with HIV/AIDS HA.5 0.090 0.009 0.103 2.196 1.482 1953 2098 0.071 0.108 Women who have been tested for HIV HA.6 0.123 0.007 0.060 1.163 1.079 2171 2320 0.108 0.138
Knowledge of mother- to-child transmission of HIV HA.4 0.725 0.015 0.021 2.685 1.639 2171 2320 0.694 0.755
UNDER-5s Underweight prevalence NU.1 0.233 0.014 0.061 1.176 1.084 974 1038 0.204 0.261 Tuberculosis immunization coverage CH.2 0.914 0.017 0.018 0.820 0.905 223 236 0.881 0.947 Polio immunization coverage CH.2 0.664 0.032 0.048 1.058 1.029 222 234 0.600 0.727 Immunization coverage for DPT CH.2 0.675 0.029 0.043 0.905 0.951 220 232 0.616 0.733 Measles immunization coverage CH.2 0.836 0.024 0.029 0.991 0.996 222 235 0.787 0.884 Fully immunized children CH.2 0.557 0.035 0.062 1.136 1.066 222 235 0.487 0.626 Acute respiratory infection in last two weeks CH.6 0.085 0.010 0.118 1.519 1.232 1101 1170 0.065 0.105 Antibiotic treatment of suspected pneumonia CH.7 0.339 0.040 0.117 0.693 0.833 94 99 0.259 0.419 Diarrhoea in last two weeks CH.4 0.148 0.012 0.078 1.234 1.111 1101 1170 0.125 0.171 Received ORT or increased fluids and continued feeding CH.5 0.271 0.034 0.125 0.984 0.992 162 171 0.203 0.339 Under-fives sleeping under insecticide treated nets CH.11 0.053 0.007 0.137 1.220 1.105 1101 1170 0.039 0.067 Fever in last two weeks CH.12 0.344 0.017 0.048 1.428 1.195 1101 1170 0.311 0.378 Antimalarial treatment CH.12 0.491 0.029 0.060 1.382 1.176 379 399 0.432 0.549 Support for learning CD.1 0.724 0.018 0.024 1.833 1.354 1101 1170 0.689 0.759 Birth registration CP.1 0.615 0.024 0.038 2.729 1.652 1101 1170 0.568 0.662
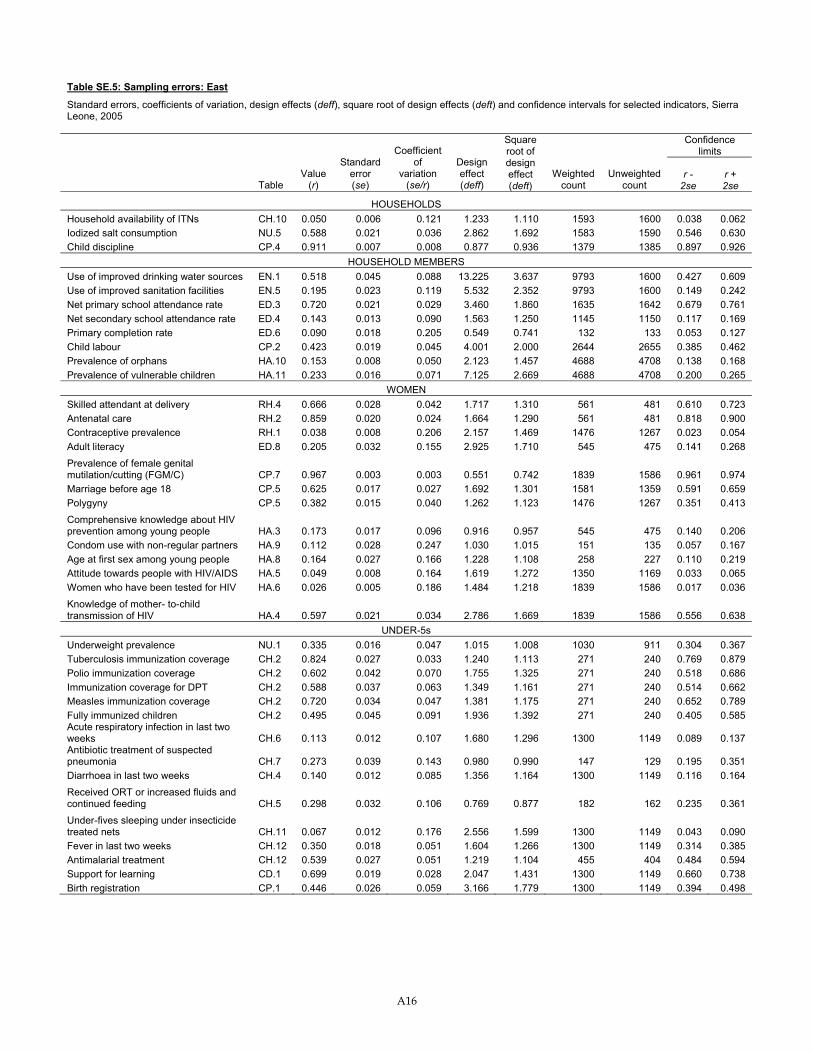
A16
Table SE.5: Sampling errors: East
Standard errors, coefficients of variation, design effects (deff), square root of design effects (deft) and confidence intervals for selected indicators, Sierra Leone, 2005
Confidence limits
Table Value
(r)
Standard error (se)
Coefficient of
variation (se/r)
Design effect (deff)
Square root of design effect (deft)
Weighted count
Unweighted count
r - 2se
r + 2se
HOUSEHOLDS Household availability of ITNs CH.10 0.050 0.006 0.121 1.233 1.110 1593 1600 0.038 0.062 Iodized salt consumption NU.5 0.588 0.021 0.036 2.862 1.692 1583 1590 0.546 0.630 Child discipline CP.4 0.911 0.007 0.008 0.877 0.936 1379 1385 0.897 0.926
HOUSEHOLD MEMBERS Use of improved drinking water sources EN.1 0.518 0.045 0.088 13.225 3.637 9793 1600 0.427 0.609 Use of improved sanitation facilities EN.5 0.195 0.023 0.119 5.532 2.352 9793 1600 0.149 0.242 Net primary school attendance rate ED.3 0.720 0.021 0.029 3.460 1.860 1635 1642 0.679 0.761 Net secondary school attendance rate ED.4 0.143 0.013 0.090 1.563 1.250 1145 1150 0.117 0.169 Primary completion rate ED.6 0.090 0.018 0.205 0.549 0.741 132 133 0.053 0.127 Child labour CP.2 0.423 0.019 0.045 4.001 2.000 2644 2655 0.385 0.462 Prevalence of orphans HA.10 0.153 0.008 0.050 2.123 1.457 4688 4708 0.138 0.168 Prevalence of vulnerable children HA.11 0.233 0.016 0.071 7.125 2.669 4688 4708 0.200 0.265
WOMEN Skilled attendant at delivery RH.4 0.666 0.028 0.042 1.717 1.310 561 481 0.610 0.723 Antenatal care RH.2 0.859 0.020 0.024 1.664 1.290 561 481 0.818 0.900 Contraceptive prevalence RH.1 0.038 0.008 0.206 2.157 1.469 1476 1267 0.023 0.054 Adult literacy ED.8 0.205 0.032 0.155 2.925 1.710 545 475 0.141 0.268 Prevalence of female genital mutilation/cutting (FGM/C) CP.7 0.967 0.003 0.003 0.551 0.742 1839 1586 0.961 0.974 Marriage before age 18 CP.5 0.625 0.017 0.027 1.692 1.301 1581 1359 0.591 0.659 Polygyny CP.5 0.382 0.015 0.040 1.262 1.123 1476 1267 0.351 0.413 Comprehensive knowledge about HIV prevention among young people HA.3 0.173 0.017 0.096 0.916 0.957 545 475 0.140 0.206 Condom use with non-regular partners HA.9 0.112 0.028 0.247 1.030 1.015 151 135 0.057 0.167 Age at first sex among young people HA.8 0.164 0.027 0.166 1.228 1.108 258 227 0.110 0.219 Attitude towards people with HIV/AIDS HA.5 0.049 0.008 0.164 1.619 1.272 1350 1169 0.033 0.065 Women who have been tested for HIV HA.6 0.026 0.005 0.186 1.484 1.218 1839 1586 0.017 0.036 Knowledge of mother- to-child transmission of HIV HA.4 0.597 0.021 0.034 2.786 1.669 1839 1586 0.556 0.638
UNDER-5s Underweight prevalence NU.1 0.335 0.016 0.047 1.015 1.008 1030 911 0.304 0.367 Tuberculosis immunization coverage CH.2 0.824 0.027 0.033 1.240 1.113 271 240 0.769 0.879 Polio immunization coverage CH.2 0.602 0.042 0.070 1.755 1.325 271 240 0.518 0.686 Immunization coverage for DPT CH.2 0.588 0.037 0.063 1.349 1.161 271 240 0.514 0.662 Measles immunization coverage CH.2 0.720 0.034 0.047 1.381 1.175 271 240 0.652 0.789 Fully immunized children CH.2 0.495 0.045 0.091 1.936 1.392 271 240 0.405 0.585 Acute respiratory infection in last two weeks CH.6 0.113 0.012 0.107 1.680 1.296 1300 1149 0.089 0.137 Antibiotic treatment of suspected pneumonia CH.7 0.273 0.039 0.143 0.980 0.990 147 129 0.195 0.351 Diarrhoea in last two weeks CH.4 0.140 0.012 0.085 1.356 1.164 1300 1149 0.116 0.164 Received ORT or increased fluids and continued feeding CH.5 0.298 0.032 0.106 0.769 0.877 182 162 0.235 0.361 Under-fives sleeping under insecticide treated nets CH.11 0.067 0.012 0.176 2.556 1.599 1300 1149 0.043 0.090 Fever in last two weeks CH.12 0.350 0.018 0.051 1.604 1.266 1300 1149 0.314 0.385 Antimalarial treatment CH.12 0.539 0.027 0.051 1.219 1.104 455 404 0.484 0.594 Support for learning CD.1 0.699 0.019 0.028 2.047 1.431 1300 1149 0.660 0.738 Birth registration CP.1 0.446 0.026 0.059 3.166 1.779 1300 1149 0.394 0.498
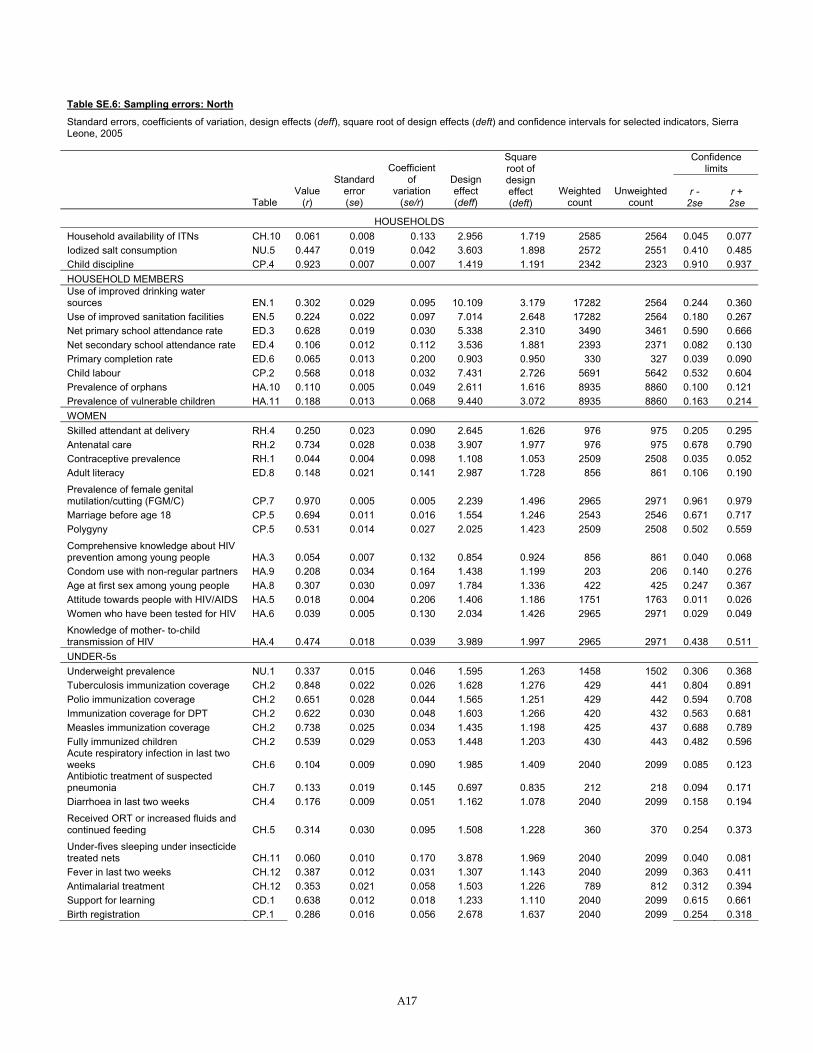
A17
Table SE.6: Sampling errors: North
Standard errors, coefficients of variation, design effects (deff), square root of design effects (deft) and confidence intervals for selected indicators, Sierra Leone, 2005
Confidence limits
Table Value
(r)
Standard error (se)
Coefficient of
variation (se/r)
Design effect (deff)
Square root of design effect (deft)
Weighted count
Unweighted count
r - 2se
r + 2se
HOUSEHOLDS Household availability of ITNs CH.10 0.061 0.008 0.133 2.956 1.719 2585 2564 0.045 0.077 Iodized salt consumption NU.5 0.447 0.019 0.042 3.603 1.898 2572 2551 0.410 0.485 Child discipline CP.4 0.923 0.007 0.007 1.419 1.191 2342 2323 0.910 0.937 HOUSEHOLD MEMBERS Use of improved drinking water sources EN.1 0.302 0.029 0.095 10.109 3.179 17282 2564 0.244 0.360 Use of improved sanitation facilities EN.5 0.224 0.022 0.097 7.014 2.648 17282 2564 0.180 0.267 Net primary school attendance rate ED.3 0.628 0.019 0.030 5.338 2.310 3490 3461 0.590 0.666 Net secondary school attendance rate ED.4 0.106 0.012 0.112 3.536 1.881 2393 2371 0.082 0.130 Primary completion rate ED.6 0.065 0.013 0.200 0.903 0.950 330 327 0.039 0.090 Child labour CP.2 0.568 0.018 0.032 7.431 2.726 5691 5642 0.532 0.604 Prevalence of orphans HA.10 0.110 0.005 0.049 2.611 1.616 8935 8860 0.100 0.121 Prevalence of vulnerable children HA.11 0.188 0.013 0.068 9.440 3.072 8935 8860 0.163 0.214 WOMEN Skilled attendant at delivery RH.4 0.250 0.023 0.090 2.645 1.626 976 975 0.205 0.295 Antenatal care RH.2 0.734 0.028 0.038 3.907 1.977 976 975 0.678 0.790 Contraceptive prevalence RH.1 0.044 0.004 0.098 1.108 1.053 2509 2508 0.035 0.052 Adult literacy ED.8 0.148 0.021 0.141 2.987 1.728 856 861 0.106 0.190 Prevalence of female genital mutilation/cutting (FGM/C) CP.7 0.970 0.005 0.005 2.239 1.496 2965 2971 0.961 0.979 Marriage before age 18 CP.5 0.694 0.011 0.016 1.554 1.246 2543 2546 0.671 0.717 Polygyny CP.5 0.531 0.014 0.027 2.025 1.423 2509 2508 0.502 0.559 Comprehensive knowledge about HIV prevention among young people HA.3 0.054 0.007 0.132 0.854 0.924 856 861 0.040 0.068 Condom use with non-regular partners HA.9 0.208 0.034 0.164 1.438 1.199 203 206 0.140 0.276 Age at first sex among young people HA.8 0.307 0.030 0.097 1.784 1.336 422 425 0.247 0.367 Attitude towards people with HIV/AIDS HA.5 0.018 0.004 0.206 1.406 1.186 1751 1763 0.011 0.026 Women who have been tested for HIV HA.6 0.039 0.005 0.130 2.034 1.426 2965 2971 0.029 0.049 Knowledge of mother- to-child transmission of HIV HA.4 0.474 0.018 0.039 3.989 1.997 2965 2971 0.438 0.511 UNDER-5s Underweight prevalence NU.1 0.337 0.015 0.046 1.595 1.263 1458 1502 0.306 0.368 Tuberculosis immunization coverage CH.2 0.848 0.022 0.026 1.628 1.276 429 441 0.804 0.891 Polio immunization coverage CH.2 0.651 0.028 0.044 1.565 1.251 429 442 0.594 0.708 Immunization coverage for DPT CH.2 0.622 0.030 0.048 1.603 1.266 420 432 0.563 0.681 Measles immunization coverage CH.2 0.738 0.025 0.034 1.435 1.198 425 437 0.688 0.789 Fully immunized children CH.2 0.539 0.029 0.053 1.448 1.203 430 443 0.482 0.596 Acute respiratory infection in last two weeks CH.6 0.104 0.009 0.090 1.985 1.409 2040 2099 0.085 0.123 Antibiotic treatment of suspected pneumonia CH.7 0.133 0.019 0.145 0.697 0.835 212 218 0.094 0.171 Diarrhoea in last two weeks CH.4 0.176 0.009 0.051 1.162 1.078 2040 2099 0.158 0.194 Received ORT or increased fluids and continued feeding CH.5 0.314 0.030 0.095 1.508 1.228 360 370 0.254 0.373 Under-fives sleeping under insecticide treated nets CH.11 0.060 0.010 0.170 3.878 1.969 2040 2099 0.040 0.081 Fever in last two weeks CH.12 0.387 0.012 0.031 1.307 1.143 2040 2099 0.363 0.411 Antimalarial treatment CH.12 0.353 0.021 0.058 1.503 1.226 789 812 0.312 0.394 Support for learning CD.1 0.638 0.012 0.018 1.233 1.110 2040 2099 0.615 0.661 Birth registration CP.1 0.286 0.016 0.056 2.678 1.637 2040 2099 0.254 0.318
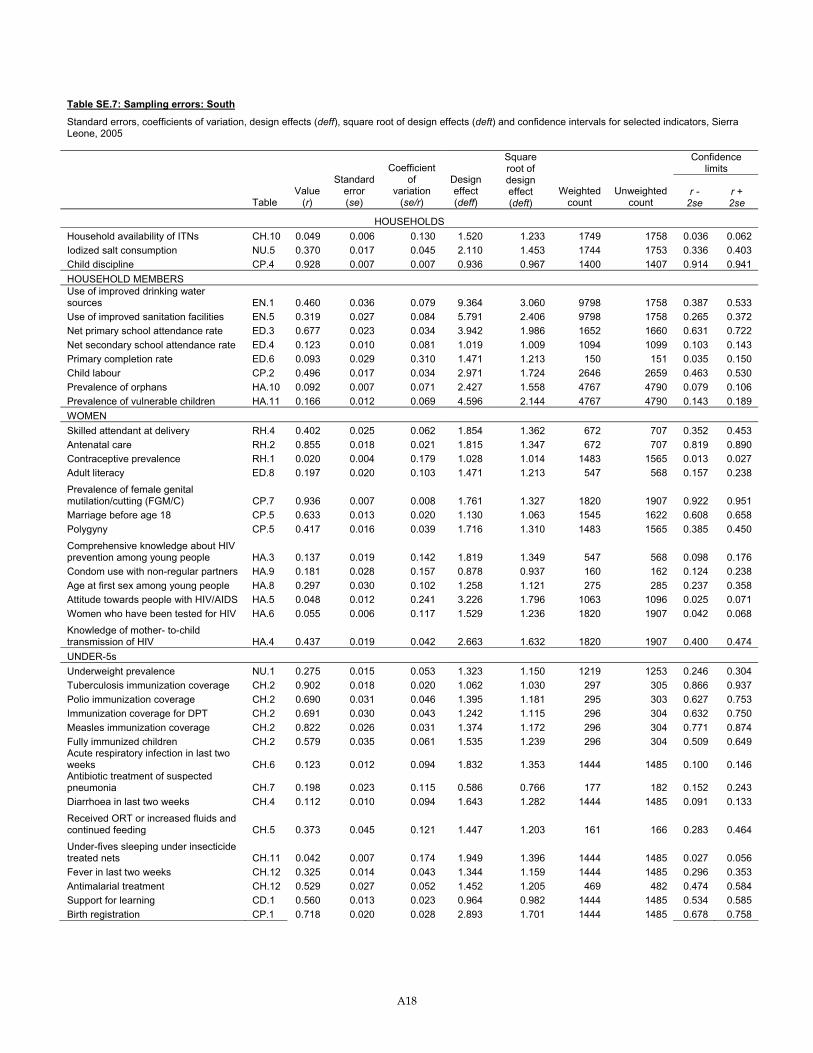
A18
Table SE.7: Sampling errors: South
Standard errors, coefficients of variation, design effects (deff), square root of design effects (deft) and confidence intervals for selected indicators, Sierra Leone, 2005
Confidence limits
Table Value
(r)
Standard error (se)
Coefficient of
variation (se/r)
Design effect (deff)
Square root of design effect (deft)
Weighted count
Unweighted count
r - 2se
r + 2se
HOUSEHOLDS Household availability of ITNs CH.10 0.049 0.006 0.130 1.520 1.233 1749 1758 0.036 0.062 Iodized salt consumption NU.5 0.370 0.017 0.045 2.110 1.453 1744 1753 0.336 0.403 Child discipline CP.4 0.928 0.007 0.007 0.936 0.967 1400 1407 0.914 0.941 HOUSEHOLD MEMBERS Use of improved drinking water sources EN.1 0.460 0.036 0.079 9.364 3.060 9798 1758 0.387 0.533 Use of improved sanitation facilities EN.5 0.319 0.027 0.084 5.791 2.406 9798 1758 0.265 0.372 Net primary school attendance rate ED.3 0.677 0.023 0.034 3.942 1.986 1652 1660 0.631 0.722 Net secondary school attendance rate ED.4 0.123 0.010 0.081 1.019 1.009 1094 1099 0.103 0.143 Primary completion rate ED.6 0.093 0.029 0.310 1.471 1.213 150 151 0.035 0.150 Child labour CP.2 0.496 0.017 0.034 2.971 1.724 2646 2659 0.463 0.530 Prevalence of orphans HA.10 0.092 0.007 0.071 2.427 1.558 4767 4790 0.079 0.106 Prevalence of vulnerable children HA.11 0.166 0.012 0.069 4.596 2.144 4767 4790 0.143 0.189 WOMEN Skilled attendant at delivery RH.4 0.402 0.025 0.062 1.854 1.362 672 707 0.352 0.453 Antenatal care RH.2 0.855 0.018 0.021 1.815 1.347 672 707 0.819 0.890 Contraceptive prevalence RH.1 0.020 0.004 0.179 1.028 1.014 1483 1565 0.013 0.027 Adult literacy ED.8 0.197 0.020 0.103 1.471 1.213 547 568 0.157 0.238 Prevalence of female genital mutilation/cutting (FGM/C) CP.7 0.936 0.007 0.008 1.761 1.327 1820 1907 0.922 0.951 Marriage before age 18 CP.5 0.633 0.013 0.020 1.130 1.063 1545 1622 0.608 0.658 Polygyny CP.5 0.417 0.016 0.039 1.716 1.310 1483 1565 0.385 0.450 Comprehensive knowledge about HIV prevention among young people HA.3 0.137 0.019 0.142 1.819 1.349 547 568 0.098 0.176 Condom use with non-regular partners HA.9 0.181 0.028 0.157 0.878 0.937 160 162 0.124 0.238 Age at first sex among young people HA.8 0.297 0.030 0.102 1.258 1.121 275 285 0.237 0.358 Attitude towards people with HIV/AIDS HA.5 0.048 0.012 0.241 3.226 1.796 1063 1096 0.025 0.071 Women who have been tested for HIV HA.6 0.055 0.006 0.117 1.529 1.236 1820 1907 0.042 0.068 Knowledge of mother- to-child transmission of HIV HA.4 0.437 0.019 0.042 2.663 1.632 1820 1907 0.400 0.474 UNDER-5s Underweight prevalence NU.1 0.275 0.015 0.053 1.323 1.150 1219 1253 0.246 0.304 Tuberculosis immunization coverage CH.2 0.902 0.018 0.020 1.062 1.030 297 305 0.866 0.937 Polio immunization coverage CH.2 0.690 0.031 0.046 1.395 1.181 295 303 0.627 0.753 Immunization coverage for DPT CH.2 0.691 0.030 0.043 1.242 1.115 296 304 0.632 0.750 Measles immunization coverage CH.2 0.822 0.026 0.031 1.374 1.172 296 304 0.771 0.874 Fully immunized children CH.2 0.579 0.035 0.061 1.535 1.239 296 304 0.509 0.649 Acute respiratory infection in last two weeks CH.6 0.123 0.012 0.094 1.832 1.353 1444 1485 0.100 0.146 Antibiotic treatment of suspected pneumonia CH.7 0.198 0.023 0.115 0.586 0.766 177 182 0.152 0.243 Diarrhoea in last two weeks CH.4 0.112 0.010 0.094 1.643 1.282 1444 1485 0.091 0.133 Received ORT or increased fluids and continued feeding CH.5 0.373 0.045 0.121 1.447 1.203 161 166 0.283 0.464 Under-fives sleeping under insecticide treated nets CH.11 0.042 0.007 0.174 1.949 1.396 1444 1485 0.027 0.056 Fever in last two weeks CH.12 0.325 0.014 0.043 1.344 1.159 1444 1485 0.296 0.353 Antimalarial treatment CH.12 0.529 0.027 0.052 1.452 1.205 469 482 0.474 0.584 Support for learning CD.1 0.560 0.013 0.023 0.964 0.982 1444 1485 0.534 0.585 Birth registration CP.1 0.718 0.020 0.028 2.893 1.701 1444 1485 0.678 0.758
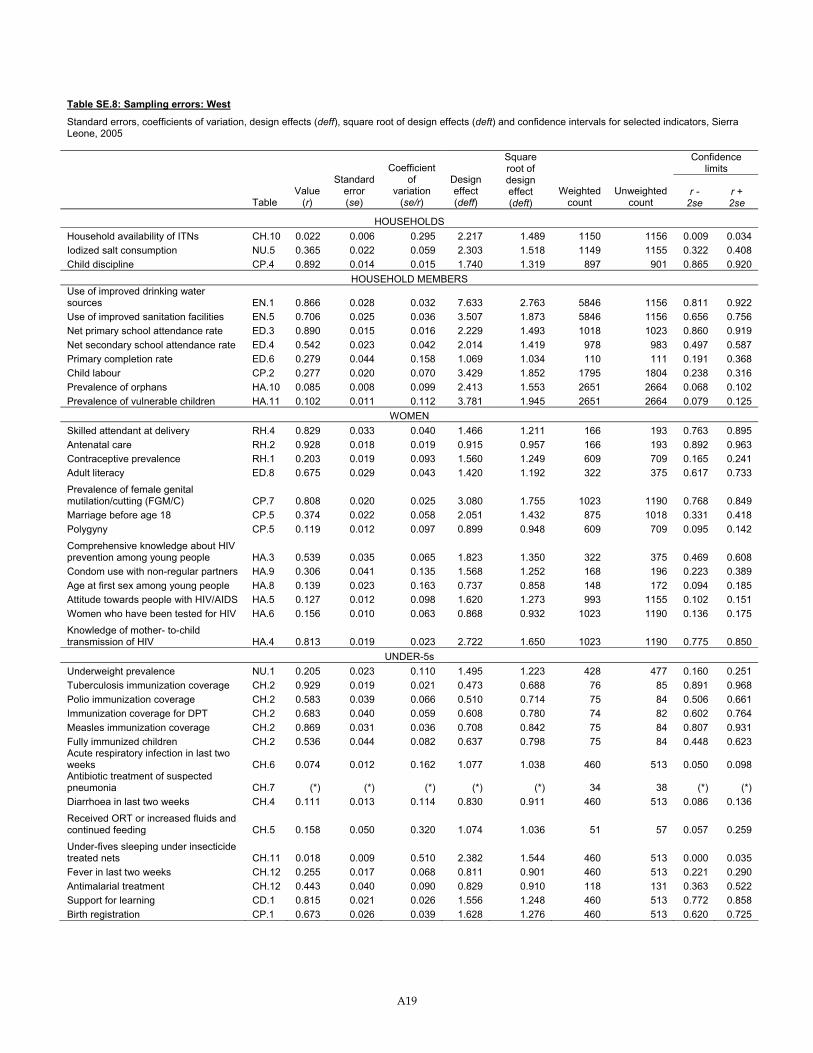
A19
Table SE.8: Sampling errors: West
Standard errors, coefficients of variation, design effects (deff), square root of design effects (deft) and confidence intervals for selected indicators, Sierra Leone, 2005
Confidence limits
Table Value
(r)
Standard error (se)
Coefficient of
variation (se/r)
Design effect (deff)
Square root of design effect (deft)
Weighted count
Unweighted count
r - 2se
r + 2se
HOUSEHOLDS Household availability of ITNs CH.10 0.022 0.006 0.295 2.217 1.489 1150 1156 0.009 0.034 Iodized salt consumption NU.5 0.365 0.022 0.059 2.303 1.518 1149 1155 0.322 0.408 Child discipline CP.4 0.892 0.014 0.015 1.740 1.319 897 901 0.865 0.920
HOUSEHOLD MEMBERS Use of improved drinking water sources EN.1 0.866 0.028 0.032 7.633 2.763 5846 1156 0.811 0.922 Use of improved sanitation facilities EN.5 0.706 0.025 0.036 3.507 1.873 5846 1156 0.656 0.756 Net primary school attendance rate ED.3 0.890 0.015 0.016 2.229 1.493 1018 1023 0.860 0.919 Net secondary school attendance rate ED.4 0.542 0.023 0.042 2.014 1.419 978 983 0.497 0.587 Primary completion rate ED.6 0.279 0.044 0.158 1.069 1.034 110 111 0.191 0.368 Child labour CP.2 0.277 0.020 0.070 3.429 1.852 1795 1804 0.238 0.316 Prevalence of orphans HA.10 0.085 0.008 0.099 2.413 1.553 2651 2664 0.068 0.102 Prevalence of vulnerable children HA.11 0.102 0.011 0.112 3.781 1.945 2651 2664 0.079 0.125
WOMEN Skilled attendant at delivery RH.4 0.829 0.033 0.040 1.466 1.211 166 193 0.763 0.895 Antenatal care RH.2 0.928 0.018 0.019 0.915 0.957 166 193 0.892 0.963 Contraceptive prevalence RH.1 0.203 0.019 0.093 1.560 1.249 609 709 0.165 0.241 Adult literacy ED.8 0.675 0.029 0.043 1.420 1.192 322 375 0.617 0.733 Prevalence of female genital mutilation/cutting (FGM/C) CP.7 0.808 0.020 0.025 3.080 1.755 1023 1190 0.768 0.849 Marriage before age 18 CP.5 0.374 0.022 0.058 2.051 1.432 875 1018 0.331 0.418 Polygyny CP.5 0.119 0.012 0.097 0.899 0.948 609 709 0.095 0.142 Comprehensive knowledge about HIV prevention among young people HA.3 0.539 0.035 0.065 1.823 1.350 322 375 0.469 0.608 Condom use with non-regular partners HA.9 0.306 0.041 0.135 1.568 1.252 168 196 0.223 0.389 Age at first sex among young people HA.8 0.139 0.023 0.163 0.737 0.858 148 172 0.094 0.185 Attitude towards people with HIV/AIDS HA.5 0.127 0.012 0.098 1.620 1.273 993 1155 0.102 0.151 Women who have been tested for HIV HA.6 0.156 0.010 0.063 0.868 0.932 1023 1190 0.136 0.175 Knowledge of mother- to-child transmission of HIV HA.4 0.813 0.019 0.023 2.722 1.650 1023 1190 0.775 0.850
UNDER-5s Underweight prevalence NU.1 0.205 0.023 0.110 1.495 1.223 428 477 0.160 0.251 Tuberculosis immunization coverage CH.2 0.929 0.019 0.021 0.473 0.688 76 85 0.891 0.968 Polio immunization coverage CH.2 0.583 0.039 0.066 0.510 0.714 75 84 0.506 0.661 Immunization coverage for DPT CH.2 0.683 0.040 0.059 0.608 0.780 74 82 0.602 0.764 Measles immunization coverage CH.2 0.869 0.031 0.036 0.708 0.842 75 84 0.807 0.931 Fully immunized children CH.2 0.536 0.044 0.082 0.637 0.798 75 84 0.448 0.623 Acute respiratory infection in last two weeks CH.6 0.074 0.012 0.162 1.077 1.038 460 513 0.050 0.098 Antibiotic treatment of suspected pneumonia CH.7 (*) (*) (*) (*) (*) 34 38 (*) (*) Diarrhoea in last two weeks CH.4 0.111 0.013 0.114 0.830 0.911 460 513 0.086 0.136 Received ORT or increased fluids and continued feeding CH.5 0.158 0.050 0.320 1.074 1.036 51 57 0.057 0.259 Under-fives sleeping under insecticide treated nets CH.11 0.018 0.009 0.510 2.382 1.544 460 513 0.000 0.035 Fever in last two weeks CH.12 0.255 0.017 0.068 0.811 0.901 460 513 0.221 0.290 Antimalarial treatment CH.12 0.443 0.040 0.090 0.829 0.910 118 131 0.363 0.522 Support for learning CD.1 0.815 0.021 0.026 1.556 1.248 460 513 0.772 0.858 Birth registration CP.1 0.673 0.026 0.039 1.628 1.276 460 513 0.620 0.725
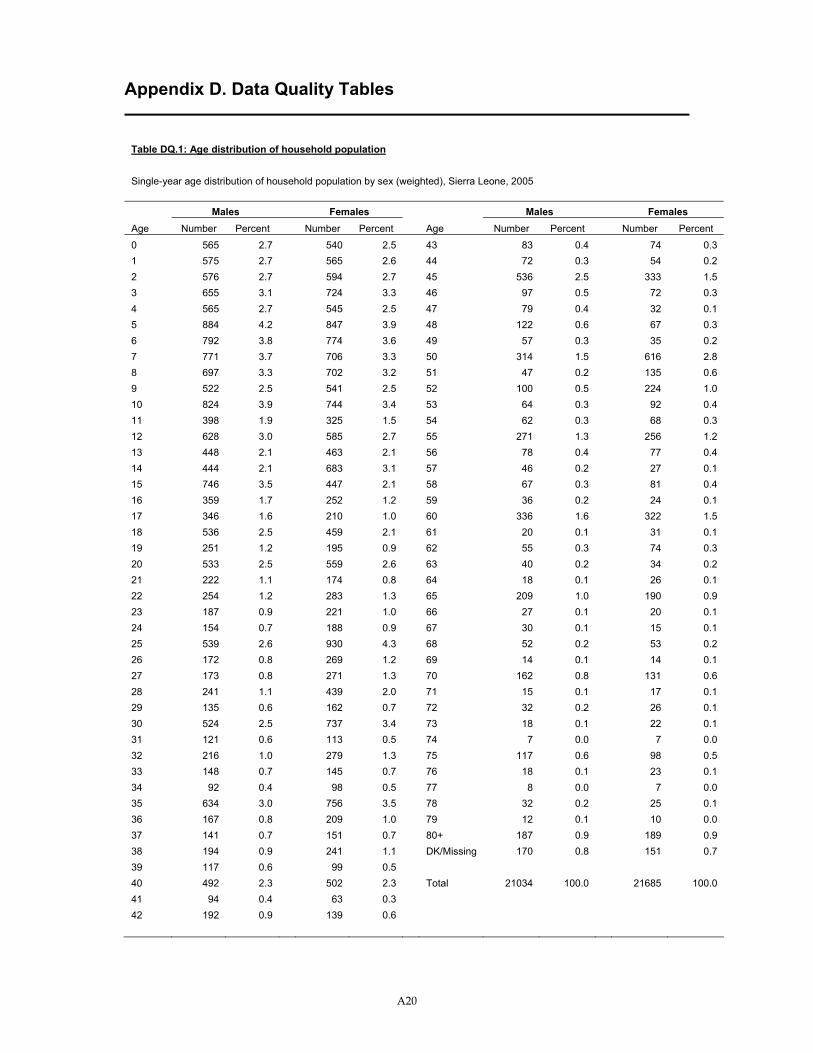
A20
Appendix D. Data Quality Tables
Table DQ.1: Age distribution of household population
Single-year age distribution of household population by sex (weighted), Sierra Leone, 2005
Males Females Males Females Age Number Percent Number Percent Age Number Percent Number Percent 0 565 2.7 540 2.5 43 83 0.4 74 0.3 1 575 2.7 565 2.6 44 72 0.3 54 0.2 2 576 2.7 594 2.7 45 536 2.5 333 1.5 3 655 3.1 724 3.3 46 97 0.5 72 0.3 4 565 2.7 545 2.5 47 79 0.4 32 0.1 5 884 4.2 847 3.9 48 122 0.6 67 0.3 6 792 3.8 774 3.6 49 57 0.3 35 0.2 7 771 3.7 706 3.3 50 314 1.5 616 2.8 8 697 3.3 702 3.2 51 47 0.2 135 0.6 9 522 2.5 541 2.5 52 100 0.5 224 1.0 10 824 3.9 744 3.4 53 64 0.3 92 0.4 11 398 1.9 325 1.5 54 62 0.3 68 0.3 12 628 3.0 585 2.7 55 271 1.3 256 1.2 13 448 2.1 463 2.1 56 78 0.4 77 0.4 14 444 2.1 683 3.1 57 46 0.2 27 0.1 15 746 3.5 447 2.1 58 67 0.3 81 0.4 16 359 1.7 252 1.2 59 36 0.2 24 0.1 17 346 1.6 210 1.0 60 336 1.6 322 1.5 18 536 2.5 459 2.1 61 20 0.1 31 0.1 19 251 1.2 195 0.9 62 55 0.3 74 0.3 20 533 2.5 559 2.6 63 40 0.2 34 0.2 21 222 1.1 174 0.8 64 18 0.1 26 0.1 22 254 1.2 283 1.3 65 209 1.0 190 0.9 23 187 0.9 221 1.0 66 27 0.1 20 0.1 24 154 0.7 188 0.9 67 30 0.1 15 0.1 25 539 2.6 930 4.3 68 52 0.2 53 0.2 26 172 0.8 269 1.2 69 14 0.1 14 0.1 27 173 0.8 271 1.3 70 162 0.8 131 0.6 28 241 1.1 439 2.0 71 15 0.1 17 0.1 29 135 0.6 162 0.7 72 32 0.2 26 0.1 30 524 2.5 737 3.4 73 18 0.1 22 0.1 31 121 0.6 113 0.5 74 7 0.0 7 0.0 32 216 1.0 279 1.3 75 117 0.6 98 0.5 33 148 0.7 145 0.7 76 18 0.1 23 0.1 34 92 0.4 98 0.5 77 8 0.0 7 0.0 35 634 3.0 756 3.5 78 32 0.2 25 0.1 36 167 0.8 209 1.0 79 12 0.1 10 0.0 37 141 0.7 151 0.7 80+ 187 0.9 189 0.9 38 194 0.9 241 1.1 DK/Missing 170 0.8 151 0.7 39 117 0.6 99 0.5 40 492 2.3 502 2.3 Total 21034 100.0 21685 100.0 41 94 0.4 63 0.3 42 192 0.9 139 0.6
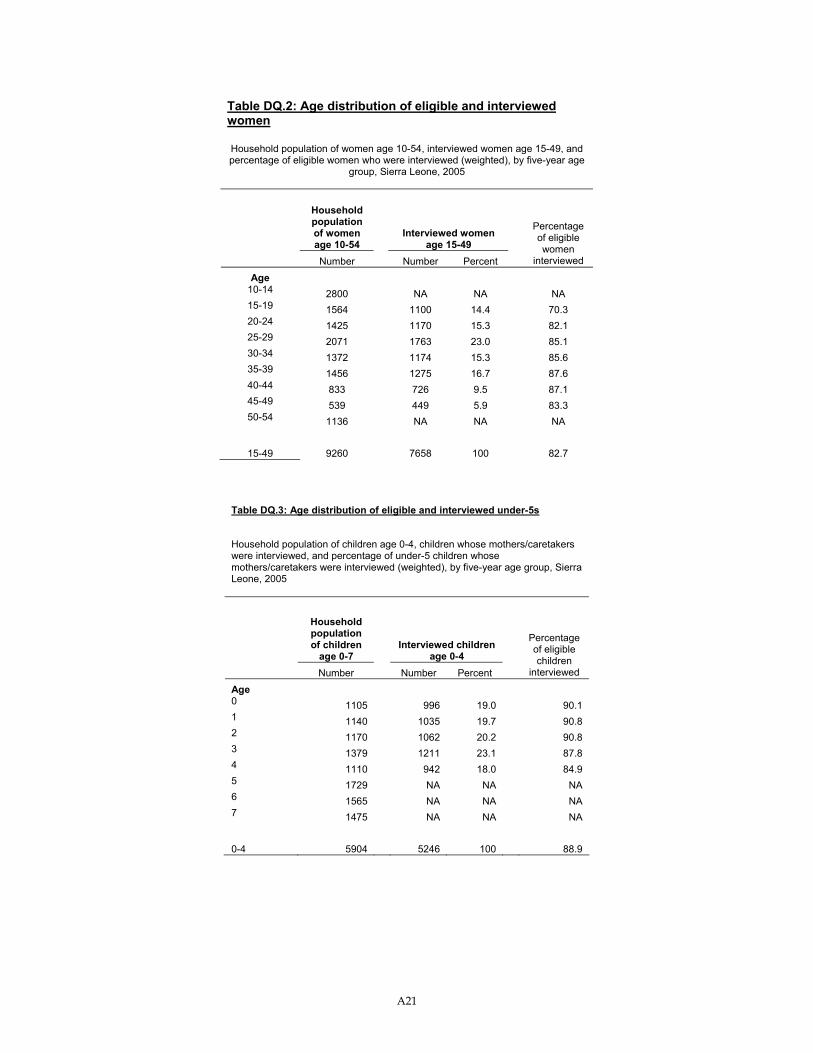
A21
Table DQ.2: Age distribution of eligible and interviewed women
Household population of women age 10-54, interviewed women age 15-49, and percentage of eligible women who were interviewed (weighted), by five-year age
group, Sierra Leone, 2005
Household population of women age 10-54
Interviewed women age 15-49
Number Number Percent
Percentage of eligible women
interviewed
Age 10-14 2800 NA NA NA 15-19 1564 1100 14.4 70.3 20-24 1425 1170 15.3 82.1 25-29 2071 1763 23.0 85.1 30-34 1372 1174 15.3 85.6 35-39 1456 1275 16.7 87.6 40-44 833 726 9.5 87.1 45-49 539 449 5.9 83.3 50-54 1136 NA NA NA
15-49 9260 7658 100 82.7
Table DQ.3: Age distribution of eligible and interviewed under-5s
Household population of children age 0-4, children whose mothers/caretakers were interviewed, and percentage of under-5 children whose mothers/caretakers were interviewed (weighted), by five-year age group, Sierra Leone, 2005
Household population of children
age 0-7 Interviewed children
age 0-4 Number Number Percent
Percentage of eligible children
interviewed
Age 0 1105 996 19.0 90.1 1 1140 1035 19.7 90.8 2 1170 1062 20.2 90.8 3 1379 1211 23.1 87.8 4 1110 942 18.0 84.9 5 1729 NA NA NA 6 1565 NA NA NA 7 1475 NA NA NA 0-4 5904 5246 100 88.9
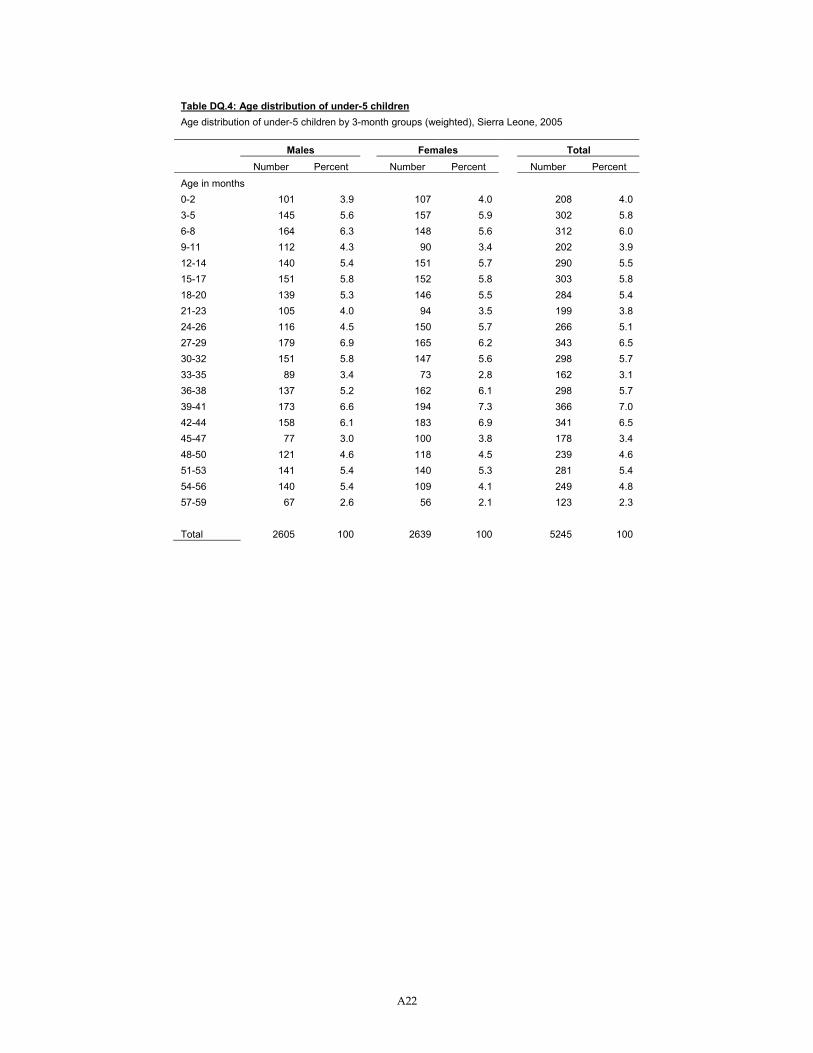
A22
Table DQ.4: Age distribution of under-5 children Age distribution of under-5 children by 3-month groups (weighted), Sierra Leone, 2005 Males Females Total Number Percent Number Percent Number Percent Age in months 0-2 101 3.9 107 4.0 208 4.0 3-5 145 5.6 157 5.9 302 5.8 6-8 164 6.3 148 5.6 312 6.0 9-11 112 4.3 90 3.4 202 3.9 12-14 140 5.4 151 5.7 290 5.5 15-17 151 5.8 152 5.8 303 5.8 18-20 139 5.3 146 5.5 284 5.4 21-23 105 4.0 94 3.5 199 3.8 24-26 116 4.5 150 5.7 266 5.1 27-29 179 6.9 165 6.2 343 6.5 30-32 151 5.8 147 5.6 298 5.7 33-35 89 3.4 73 2.8 162 3.1 36-38 137 5.2 162 6.1 298 5.7 39-41 173 6.6 194 7.3 366 7.0 42-44 158 6.1 183 6.9 341 6.5 45-47 77 3.0 100 3.8 178 3.4 48-50 121 4.6 118 4.5 239 4.6 51-53 141 5.4 140 5.3 281 5.4 54-56 140 5.4 109 4.1 249 4.8 57-59 67 2.6 56 2.1 123 2.3 Total 2605 100 2639 100 5245 100
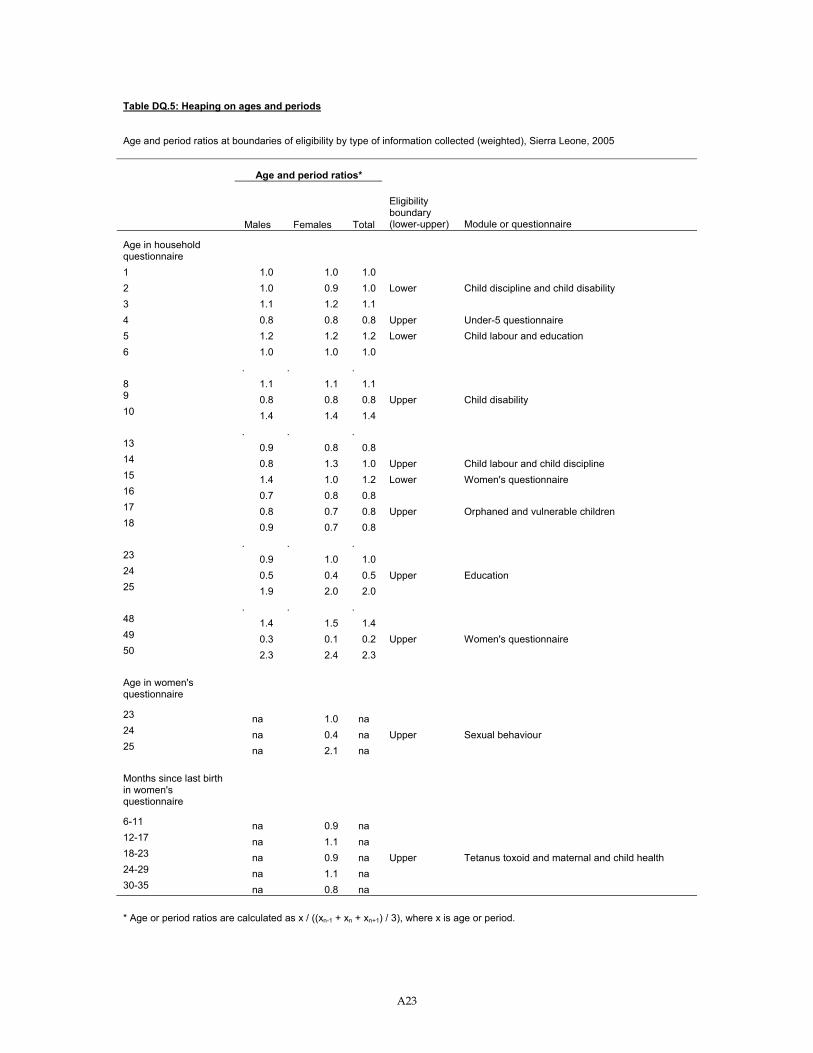
A23
Table DQ.5: Heaping on ages and periods
Age and period ratios at boundaries of eligibility by type of information collected (weighted), Sierra Leone, 2005
Age and period ratios*
Males Females Total
Eligibility boundary (lower-upper) Module or questionnaire
Age in household questionnaire 1 1.0 1.0 1.0 2 1.0 0.9 1.0 Lower Child discipline and child disability 3 1.1 1.2 1.1 4 0.8 0.8 0.8 Upper Under-5 questionnaire 5 1.2 1.2 1.2 Lower Child labour and education 6 1.0 1.0 1.0 . . . 8 1.1 1.1 1.1 9 0.8 0.8 0.8 Upper Child disability 10 1.4 1.4 1.4 . . . 13 0.9 0.8 0.8 14 0.8 1.3 1.0 Upper Child labour and child discipline 15 1.4 1.0 1.2 Lower Women's questionnaire 16 0.7 0.8 0.8 17 0.8 0.7 0.8 Upper Orphaned and vulnerable children 18 0.9 0.7 0.8 . . . 23 0.9 1.0 1.0 24 0.5 0.4 0.5 Upper Education 25 1.9 2.0 2.0 . . . 48 1.4 1.5 1.4 49 0.3 0.1 0.2 Upper Women's questionnaire 50 2.3 2.4 2.3 Age in women's questionnaire
23 na 1.0 na 24 na 0.4 na Upper Sexual behaviour 25 na 2.1 na
Months since last birth in women's questionnaire
6-11 na 0.9 na 12-17 na 1.1 na 18-23 na 0.9 na Upper Tetanus toxoid and maternal and child health 24-29 na 1.1 na 30-35 na 0.8 na * Age or period ratios are calculated as x / ((xn-1 + xn + xn+1) / 3), where x is age or period.
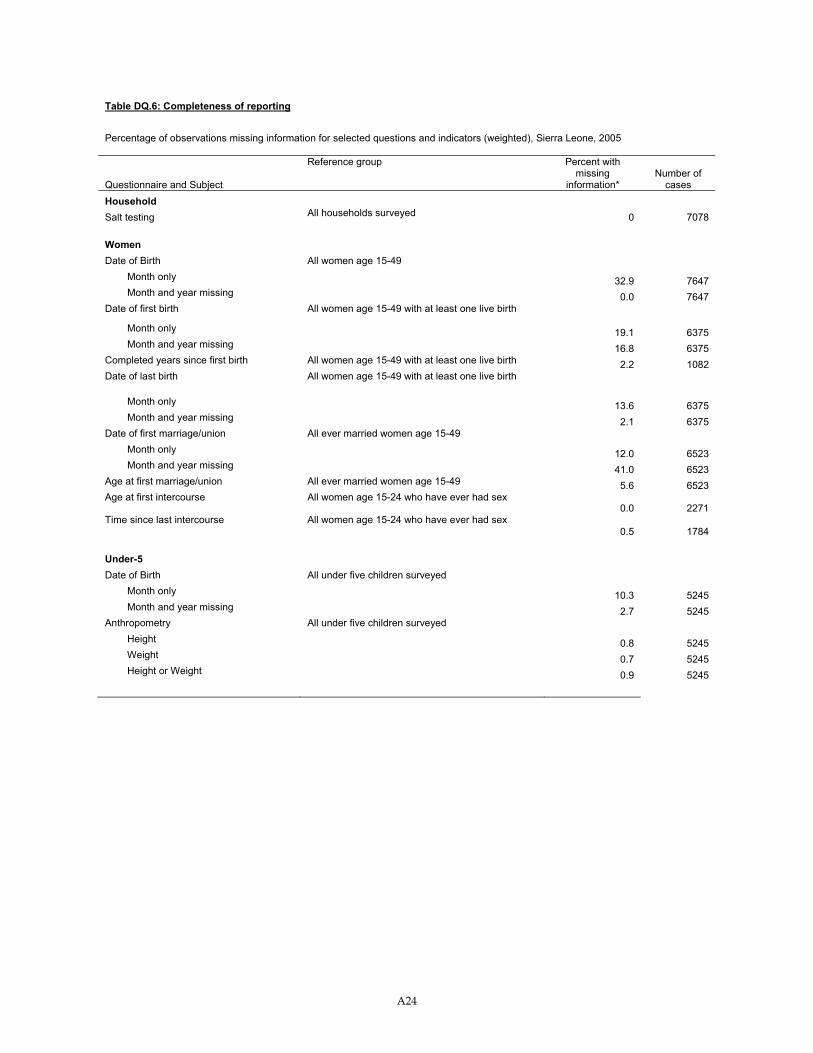
A24
Table DQ.6: Completeness of reporting
Percentage of observations missing information for selected questions and indicators (weighted), Sierra Leone, 2005
Questionnaire and Subject
Reference group Percent with missing
information* Number of
cases Household Salt testing All households surveyed 0 7078 Women Date of Birth All women age 15-49 Month only 32.9 7647 Month and year missing 0.0 7647 Date of first birth All women age 15-49 with at least one live birth
Month only 19.1 6375 Month and year missing 16.8 6375 Completed years since first birth All women age 15-49 with at least one live birth 2.2 1082 Date of last birth All women age 15-49 with at least one live birth
Month only 13.6 6375 Month and year missing 2.1 6375 Date of first marriage/union All ever married women age 15-49 Month only 12.0 6523 Month and year missing 41.0 6523 Age at first marriage/union All ever married women age 15-49 5.6 6523 Age at first intercourse All women age 15-24 who have ever had sex
0.0 2271 Time since last intercourse All women age 15-24 who have ever had sex
0.5 1784 Under-5 Date of Birth All under five children surveyed Month only 10.3 5245 Month and year missing 2.7 5245 Anthropometry All under five children surveyed Height 0.8 5245 Weight 0.7 5245 Height or Weight 0.9 5245
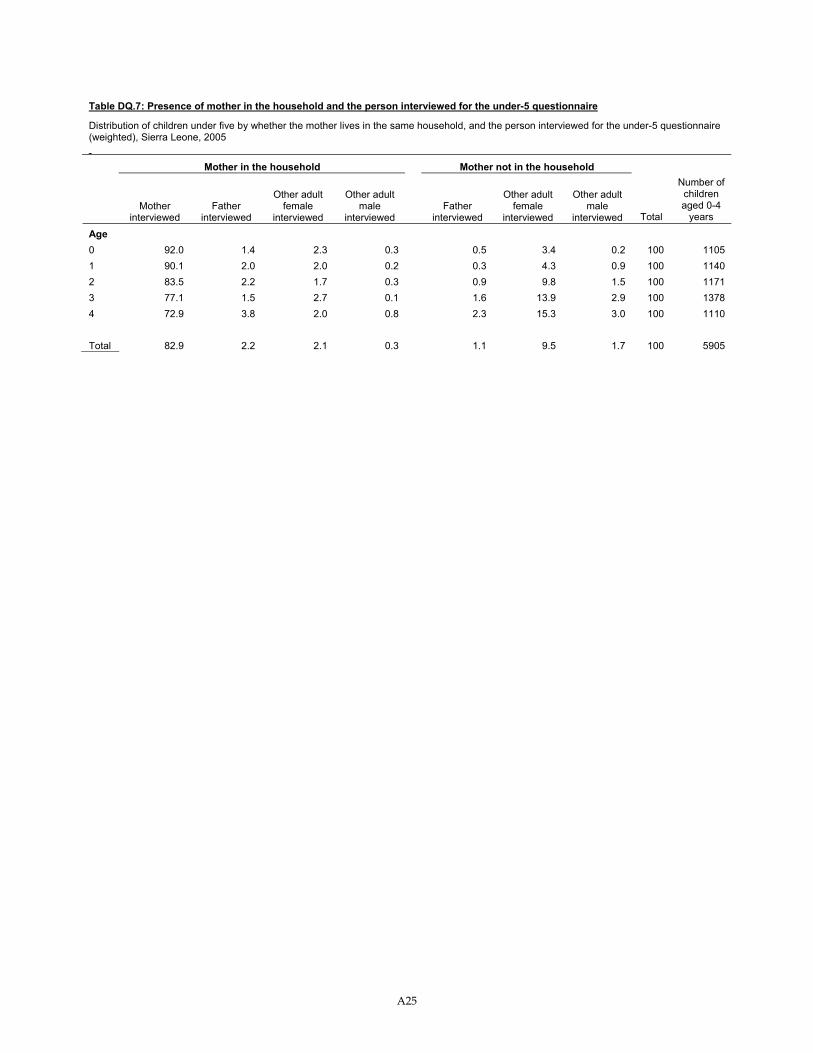
A25
Table DQ.7: Presence of mother in the household and the person interviewed for the under-5 questionnaire
Distribution of children under five by whether the mother lives in the same household, and the person interviewed for the under-5 questionnaire (weighted), Sierra Leone, 2005
Mother in the household Mother not in the household
Mother
interviewed Father
interviewed
Other adult female
interviewed
Other adult male
interviewed Father
interviewed
Other adult female
interviewed
Other adult male
interviewed Total
Number of children aged 0-4
years
Age 0 92.0 1.4 2.3 0.3 0.5 3.4 0.2 100 1105 1 90.1 2.0 2.0 0.2 0.3 4.3 0.9 100 1140 2 83.5 2.2 1.7 0.3 0.9 9.8 1.5 100 1171 3 77.1 1.5 2.7 0.1 1.6 13.9 2.9 100 1378 4 72.9 3.8 2.0 0.8 2.3 15.3 3.0 100 1110 Total 82.9 2.2 2.1 0.3 1.1 9.5 1.7 100 5905
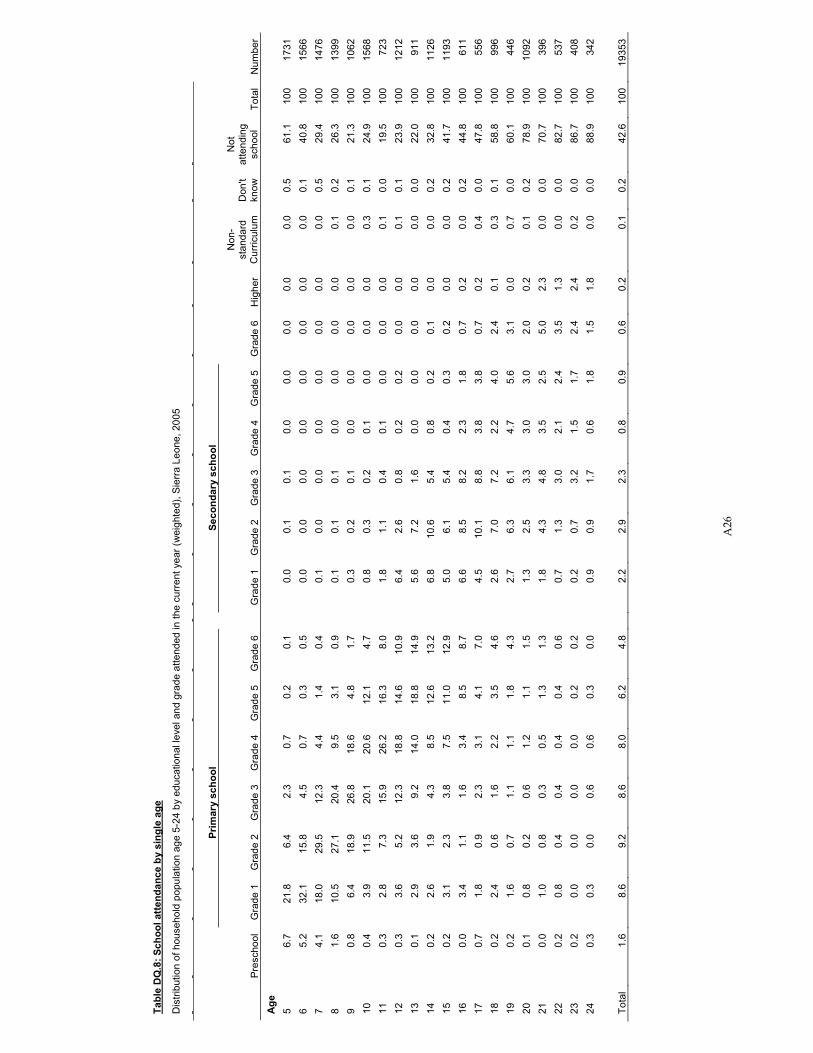
A26
Tabl
e D
Q.8
: Sch
ool a
ttend
ance
by
sing
le a
ge
Dis
tribu
tion
of h
ouse
hold
pop
ulat
ion
age
5-24
by
educ
atio
nal l
evel
and
gra
de a
ttend
ed in
the
curr
ent y
ear (
wei
ghte
d), S
ierr
a Le
one,
200
5
Prim
ary
scho
ol
Seco
ndar
y sc
hool
Pr
esch
ool
Gra
de 1
G
rade
2
Gra
de 3
G
rade
4
Gra
de 5
G
rade
6
G
rade
1
Gra
de 2
G
rade
3
Gra
de 4
G
rade
5
Gra
de 6
H
ighe
r
Non
-st
anda
rd
Cur
ricul
um
Don
't kn
ow
Not
at
tend
ing
scho
ol
Tota
l N
umbe
r A
ge
5 6.
7 21
.8
6.4
2.3
0.7
0.2
0.1
0.
0 0.
1 0.
1 0.
0 0.
0 0.
0 0.
0 0.
0 0.
5 61
.1
100
1731
6
5.2
32.1
15
.8
4.5
0.7
0.3
0.5
0.
0 0.
0 0.
0 0.
0 0.
0 0.
0 0.
0 0.
0 0.
1 40
.8
100
1566
7
4.1
18.0
29
.5
12.3
4.
4 1.
4 0.
4
0.1
0.0
0.0
0.0
0.0
0.0
0.0
0.0
0.5
29.4
10
0 14
76
8 1.
6 10
.5
27.1
20
.4
9.5
3.1
0.9
0.
1 0.
1 0.
1 0.
0 0.
0 0.
0 0.
0 0.
1 0.
2 26
.3
100
1399
9
0.8
6.4
18.9
26
.8
18.6
4.
8 1.
7
0.3
0.2
0.1
0.0
0.0
0.0
0.0
0.0
0.1
21.3
10
0 10
62
10
0.4
3.9
11.5
20
.1
20.6
12
.1
4.7
0.
8 0.
3 0.
2 0.
1 0.
0 0.
0 0.
0 0.
3 0.
1 24
.9
100
1568
11
0.
3 2.
8 7.
3 15
.9
26.2
16
.3
8.0
1.
8 1.
1 0.
4 0.
1 0.
0 0.
0 0.
0 0.
1 0.
0 19
.5
100
723
12
0.3
3.6
5.2
12.3
18
.8
14.6
10
.9
6.
4 2.
6 0.
8 0.
2 0.
2 0.
0 0.
0 0.
1 0.
1 23
.9
100
1212
13
0.
1 2.
9 3.
6 9.
2 14
.0
18.8
14
.9
5.
6 7.
2 1.
6 0.
0 0.
0 0.
0 0.
0 0.
0 0.
0 22
.0
100
911
14
0.2
2.6
1.9
4.3
8.5
12.6
13
.2
6.
8 10
.6
5.4
0.8
0.2
0.1
0.0
0.0
0.2
32.8
10
0 11
26
15
0.2
3.1
2.3
3.8
7.5
11.0
12
.9
5.
0 6.
1 5.
4 0.
4 0.
3 0.
2 0.
0 0.
0 0.
2 41
.7
100
1193
16
0.
0 3.
4 1.
1 1.
6 3.
4 8.
5 8.
7
6.6
8.5
8.2
2.3
1.8
0.7
0.2
0.0
0.2
44.8
10
0 61
1 17
0.
7 1.
8 0.
9 2.
3 3.
1 4.
1 7.
0
4.5
10.1
8.
8 3.
8 3.
8 0.
7 0.
2 0.
4 0.
0 47
.8
100
556
18
0.2
2.4
0.6
1.6
2.2
3.5
4.6
2.
6 7.
0 7.
2 2.
2 4.
0 2.
4 0.
1 0.
3 0.
1 58
.8
100
996
19
0.2
1.6
0.7
1.1
1.1
1.8
4.3
2.
7 6.
3 6.
1 4.
7 5.
6 3.
1 0.
0 0.
7 0.
0 60
.1
100
446
20
0.1
0.8
0.2
0.6
1.2
1.1
1.5
1.
3 2.
5 3.
3 3.
0 3.
0 2.
0 0.
2 0.
1 0.
2 78
.9
100
1092
21
0.
0 1.
0 0.
8 0.
3 0.
5 1.
3 1.
3
1.8
4.3
4.8
3.5
2.5
5.0
2.3
0.0
0.0
70.7
10
0 39
6 22
0.
2 0.
8 0.
4 0.
4 0.
4 0.
4 0.
6
0.7
1.3
3.0
2.1
2.4
3.5
1.3
0.0
0.0
82.7
10
0 53
7 23
0.
2 0.
0 0.
0 0.
0 0.
0 0.
2 0.
2
0.2
0.7
3.2
1.5
1.7
2.4
2.4
0.2
0.0
86.7
10
0 40
8 24
0.
3 0.
3 0.
0 0.
6 0.
6 0.
3 0.
0
0.9
0.9
1.7
0.6
1.8
1.5
1.8
0.0
0.0
88.9
10
0 34
2
Tota
l 1.
6 8.
6 9.
2 8.
6 8.
0 6.
2 4.
8
2.2
2.9
2.3
0.8
0.9
0.6
0.2
0.1
0.2
42.6
10
0 19
353
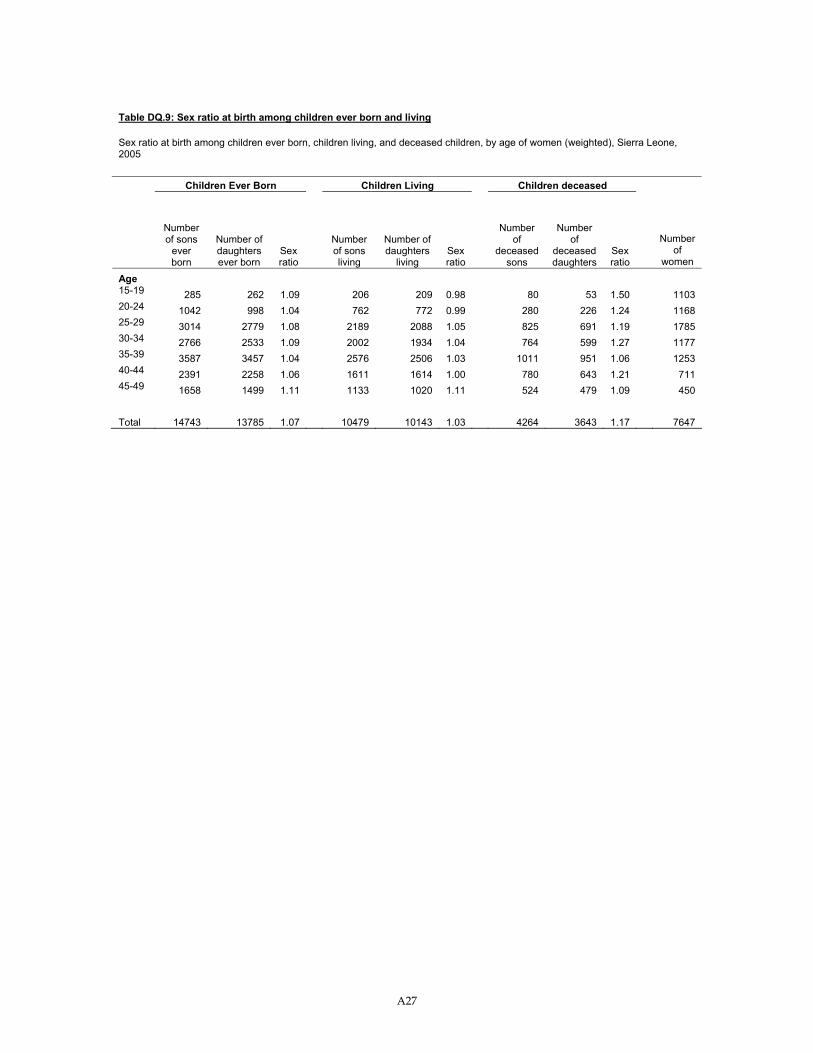
A27
Table DQ.9: Sex ratio at birth among children ever born and living
Sex ratio at birth among children ever born, children living, and deceased children, by age of women (weighted), Sierra Leone, 2005
Children Ever Born Children Living Children deceased
Number of sons
ever born
Number of daughters ever born
Sex ratio
Number of sons living
Number of daughters
living Sex ratio
Number of
deceased sons
Number of
deceased daughters
Sex ratio
Number of
women
Age 15-19 285 262 1.09 206 209 0.98 80 53 1.50 1103 20-24 1042 998 1.04 762 772 0.99 280 226 1.24 1168 25-29 3014 2779 1.08 2189 2088 1.05 825 691 1.19 1785 30-34 2766 2533 1.09 2002 1934 1.04 764 599 1.27 1177 35-39 3587 3457 1.04 2576 2506 1.03 1011 951 1.06 1253 40-44 2391 2258 1.06 1611 1614 1.00 780 643 1.21 711 45-49 1658 1499 1.11 1133 1020 1.11 524 479 1.09 450 Total 14743 13785 1.07 10479 10143 1.03 4264 3643 1.17 7647
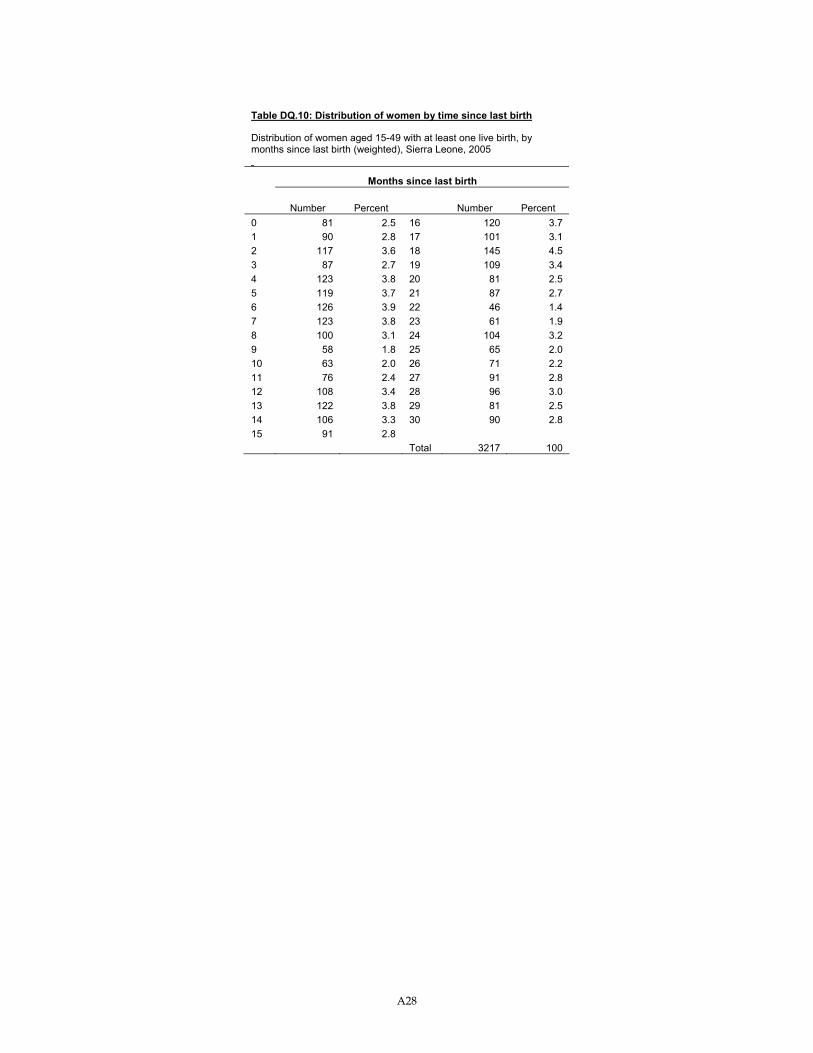
A28
Table DQ.10: Distribution of women by time since last birth
Distribution of women aged 15-49 with at least one live birth, by months since last birth (weighted), Sierra Leone, 2005
Months since last birth
Number Percent Number Percent 0 81 2.5 16 120 3.7 1 90 2.8 17 101 3.1 2 117 3.6 18 145 4.5 3 87 2.7 19 109 3.4 4 123 3.8 20 81 2.5 5 119 3.7 21 87 2.7 6 126 3.9 22 46 1.4 7 123 3.8 23 61 1.9 8 100 3.1 24 104 3.2 9 58 1.8 25 65 2.0 10 63 2.0 26 71 2.2 11 76 2.4 27 91 2.8 12 108 3.4 28 96 3.0 13 122 3.8 29 81 2.5 14 106 3.3 30 90 2.8 15 91 2.8 Total 3217 100
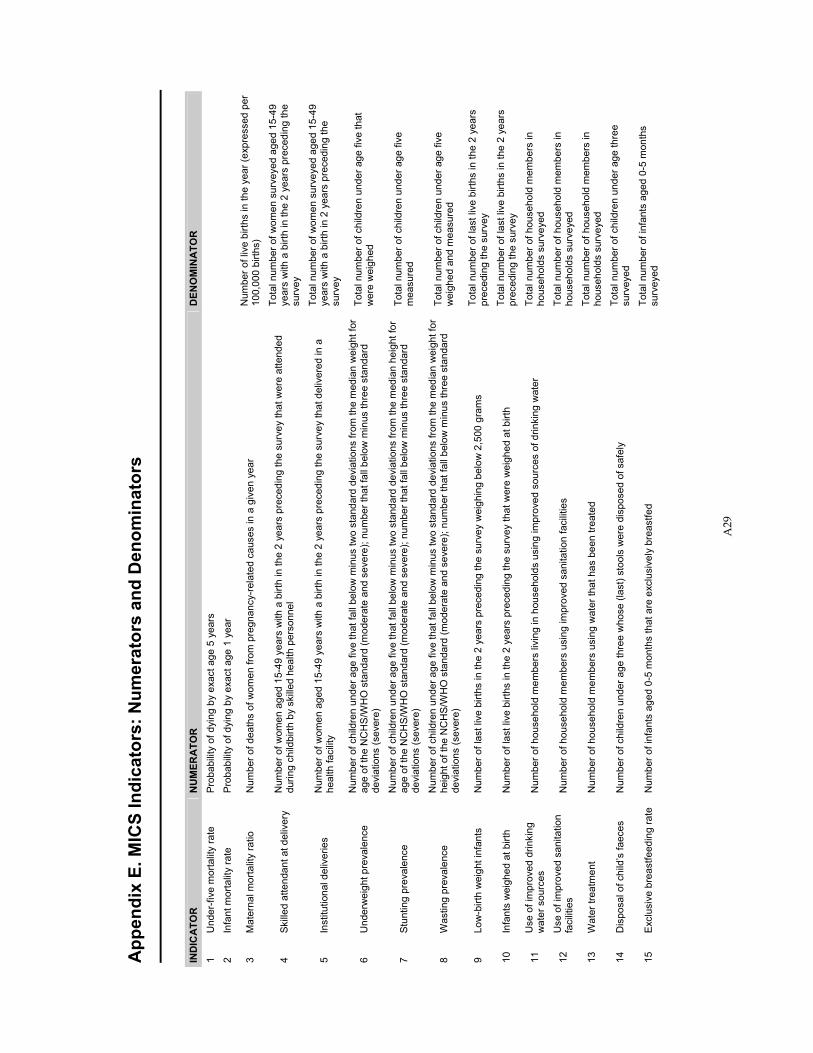
A29
App
endi
x E.
MIC
S In
dica
tors
: Num
erat
ors
and
Den
omin
ator
s
IND
ICA
TOR
N
UM
ERA
TOR
D
ENO
MIN
ATO
R
1 U
nder
-five
mor
talit
y ra
te
Prob
abili
ty o
f dyi
ng b
y ex
act a
ge 5
yea
rs
2 In
fant
mor
talit
y ra
te
Prob
abili
ty o
f dyi
ng b
y ex
act a
ge 1
yea
r
3 M
ater
nal m
orta
lity
ratio
N
umbe
r of d
eath
s of
wom
en fr
om p
regn
ancy
-rel
ated
cau
ses
in a
giv
en y
ear
Num
ber o
f liv
e bi
rths
in th
e ye
ar (e
xpre
ssed
per
10
0,00
0 bi
rths)
4 Sk
illed
atte
ndan
t at d
eliv
ery
Num
ber o
f wom
en a
ged
15-4
9 ye
ars
with
a b
irth
in th
e 2
year
s pr
eced
ing
the
surv
ey th
at w
ere
atte
nded
du
ring
child
birth
by
skill
ed h
ealth
per
sonn
el
Tota
l num
ber o
f wom
en s
urve
yed
aged
15-
49
year
s w
ith a
birt
h in
the
2 ye
ars
prec
edin
g th
e su
rvey
5 In
stitu
tiona
l del
iver
ies
Num
ber o
f wom
en a
ged
15-4
9 ye
ars
with
a b
irth
in th
e 2
year
s pr
eced
ing
the
surv
ey th
at d
eliv
ered
in a
he
alth
faci
lity
Tota
l num
ber o
f wom
en s
urve
yed
aged
15-
49
year
s w
ith a
birt
h in
2 y
ears
pre
cedi
ng th
e su
rvey
6 U
nder
wei
ght p
reva
lenc
e N
umbe
r of c
hild
ren
unde
r age
five
that
fall
belo
w m
inus
two
stan
dard
dev
iatio
ns fr
om th
e m
edia
n w
eigh
t for
ag
e of
the
NC
HS
/WH
O s
tand
ard
(mod
erat
e an
d se
vere
); nu
mbe
r tha
t fal
l bel
ow m
inus
thre
e st
anda
rd
devi
atio
ns (s
ever
e)
Tota
l num
ber o
f chi
ldre
n un
der a
ge fi
ve th
at
wer
e w
eigh
ed
7 St
untin
g pr
eval
ence
N
umbe
r of c
hild
ren
unde
r age
five
that
fall
belo
w m
inus
two
stan
dard
dev
iatio
ns fr
om th
e m
edia
n he
ight
for
age
of th
e N
CH
S/W
HO
sta
ndar
d (m
oder
ate
and
seve
re);
num
ber t
hat f
all b
elow
min
us th
ree
stan
dard
de
viat
ions
(sev
ere)
Tota
l num
ber o
f chi
ldre
n un
der a
ge fi
ve
mea
sure
d
8 W
astin
g pr
eval
ence
N
umbe
r of c
hild
ren
unde
r age
five
that
fall
belo
w m
inus
two
stan
dard
dev
iatio
ns fr
om th
e m
edia
n w
eigh
t for
he
ight
of t
he N
CH
S/W
HO
sta
ndar
d (m
oder
ate
and
seve
re);
num
ber t
hat f
all b
elow
min
us th
ree
stan
dard
de
viat
ions
(sev
ere)
Tota
l num
ber o
f chi
ldre
n un
der a
ge fi
ve
wei
ghed
and
mea
sure
d
9 Lo
w-b
irth
wei
ght i
nfan
ts
Num
ber o
f las
t liv
e bi
rths
in th
e 2
year
s pr
eced
ing
the
surv
ey w
eigh
ing
belo
w 2
,500
gra
ms
Tota
l num
ber o
f las
t liv
e bi
rths
in th
e 2
year
s pr
eced
ing
the
surv
ey
10
Infa
nts
wei
ghed
at b
irth
Num
ber o
f las
t liv
e bi
rths
in th
e 2
year
s pr
eced
ing
the
surv
ey th
at w
ere
wei
ghed
at b
irth
Tota
l num
ber o
f las
t liv
e bi
rths
in th
e 2
year
s pr
eced
ing
the
surv
ey
11
Use
of i
mpr
oved
drin
king
w
ater
sou
rces
N
umbe
r of h
ouse
hold
mem
bers
livi
ng in
hou
seho
lds
usin
g im
prov
ed s
ourc
es o
f drin
king
wat
er
Tota
l num
ber o
f hou
seho
ld m
embe
rs in
ho
useh
olds
sur
veye
d
12
Use
of i
mpr
oved
san
itatio
n fa
cilit
ies
Num
ber o
f hou
seho
ld m
embe
rs u
sing
impr
oved
san
itatio
n fa
cilit
ies
Tota
l num
ber o
f hou
seho
ld m
embe
rs in
ho
useh
olds
sur
veye
d
13
Wat
er tr
eatm
ent
Num
ber o
f hou
seho
ld m
embe
rs u
sing
wat
er th
at h
as b
een
treat
ed
Tota
l num
ber o
f hou
seho
ld m
embe
rs in
ho
useh
olds
sur
veye
d
14
Dis
posa
l of c
hild
’s fa
eces
N
umbe
r of c
hild
ren
unde
r age
thre
e w
hose
(las
t) st
ools
wer
e di
spos
ed o
f saf
ely
Tota
l num
ber o
f chi
ldre
n un
der a
ge th
ree
surv
eyed
15
Excl
usiv
e br
east
feed
ing
rate
N
umbe
r of i
nfan
ts a
ged
0-5
mon
ths
that
are
exc
lusi
vely
bre
astfe
d To
tal n
umbe
r of i
nfan
ts a
ged
0-5
mon
ths
surv
eyed
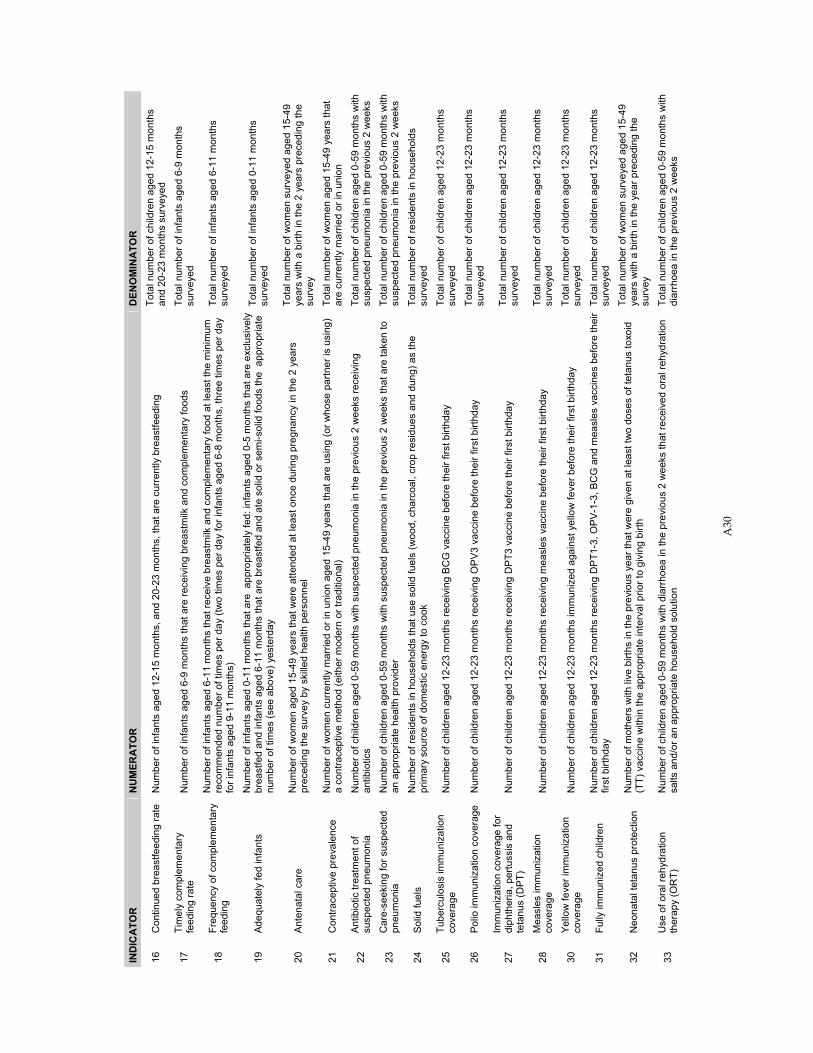
A30
IND
ICA
TOR
N
UM
ERA
TOR
D
ENO
MIN
ATO
R
16
Con
tinue
d br
east
feed
ing
rate
N
umbe
r of i
nfan
ts a
ged
12-1
5 m
onth
s, a
nd 2
0-23
mon
ths,
that
are
cur
rent
ly b
reas
tfeed
ing
Tota
l num
ber o
f chi
ldre
n ag
ed 1
2-15
mon
ths
and
20-2
3 m
onth
s su
rvey
ed
17
Tim
ely
com
plem
enta
ry
feed
ing
rate
N
umbe
r of i
nfan
ts a
ged
6-9
mon
ths
that
are
rece
ivin
g br
east
milk
and
com
plem
enta
ry fo
ods
Tota
l num
ber o
f inf
ants
age
d 6-
9 m
onth
s su
rvey
ed
18
Freq
uenc
y of
com
plem
enta
ry
feed
ing
Num
ber o
f inf
ants
age
d 6-
11 m
onth
s th
at re
ceiv
e br
east
milk
and
com
plem
enta
ry fo
od a
t lea
st th
e m
inim
um
reco
mm
ende
d nu
mbe
r of t
imes
per
day
(tw
o tim
es p
er d
ay fo
r inf
ants
age
d 6-
8 m
onth
s, th
ree
times
per
day
fo
r inf
ants
age
d 9-
11 m
onth
s)
Tota
l num
ber o
f inf
ants
age
d 6-
11 m
onth
s su
rvey
ed
19
Adeq
uate
ly fe
d in
fant
s N
umbe
r of i
nfan
ts a
ged
0-11
mon
ths
that
are
app
ropr
iate
ly fe
d: in
fant
s ag
ed 0
-5 m
onth
s th
at a
re e
xclu
sive
ly
brea
stfe
d an
d in
fant
s ag
ed 6
-11
mon
ths
that
are
bre
astfe
d an
d at
e so
lid o
r sem
i-sol
id fo
ods
the
app
ropr
iate
nu
mbe
r of t
imes
(see
abo
ve) y
este
rday
Tota
l num
ber o
f inf
ants
age
d 0-
11 m
onth
s su
rvey
ed
20
Ante
nata
l car
e N
umbe
r of w
omen
age
d 15
-49
year
s th
at w
ere
atte
nded
at l
east
onc
e du
ring
preg
nanc
y in
the
2 ye
ars
prec
edin
g th
e su
rvey
by
skill
ed h
ealth
per
sonn
el
Tota
l num
ber o
f wom
en s
urve
yed
aged
15-
49
year
s w
ith a
birt
h in
the
2 ye
ars
prec
edin
g th
e su
rvey
21
Con
trace
ptiv
e pr
eval
ence
N
umbe
r of w
omen
cur
rent
ly m
arrie
d or
in u
nion
age
d 15
-49
year
s th
at a
re u
sing
(or w
hose
par
tner
is u
sing
) a
cont
race
ptiv
e m
etho
d (e
ither
mod
ern
or tr
aditi
onal
) To
tal n
umbe
r of w
omen
age
d 15
-49
year
s th
at
are
curre
ntly
mar
ried
or in
uni
on
22
Antib
iotic
trea
tmen
t of
susp
ecte
d pn
eum
onia
N
umbe
r of c
hild
ren
aged
0-5
9 m
onth
s w
ith s
uspe
cted
pne
umon
ia in
the
prev
ious
2 w
eeks
rece
ivin
g an
tibio
tics
Tota
l num
ber o
f chi
ldre
n ag
ed 0
-59
mon
ths
with
su
spec
ted
pneu
mon
ia in
the
prev
ious
2 w
eeks
23
Car
e-se
ekin
g fo
r sus
pect
ed
pneu
mon
ia
Num
ber o
f chi
ldre
n ag
ed 0
-59
mon
ths
with
sus
pect
ed p
neum
onia
in th
e pr
evio
us 2
wee
ks th
at a
re ta
ken
to
an a
ppro
pria
te h
ealth
pro
vide
r To
tal n
umbe
r of c
hild
ren
aged
0-5
9 m
onth
s w
ith
susp
ecte
d pn
eum
onia
in th
e pr
evio
us 2
wee
ks
24
Solid
fuel
s N
umbe
r of r
esid
ents
in h
ouse
hold
s th
at u
se s
olid
fuel
s (w
ood,
cha
rcoa
l, cr
op re
sidu
es a
nd d
ung)
as
the
prim
ary
sour
ce o
f dom
estic
ene
rgy
to c
ook
Tota
l num
ber o
f res
iden
ts in
hou
seho
lds
surv
eyed
25
Tube
rcul
osis
imm
uniz
atio
n co
vera
ge
Num
ber o
f chi
ldre
n ag
ed 1
2-23
mon
ths
rece
ivin
g B
CG
vac
cine
bef
ore
thei
r firs
t birt
hday
To
tal n
umbe
r of c
hild
ren
aged
12-
23 m
onth
s su
rvey
ed
26
Polio
imm
uniz
atio
n co
vera
ge
Num
ber o
f chi
ldre
n ag
ed 1
2-23
mon
ths
rece
ivin
g O
PV3
vac
cine
bef
ore
thei
r firs
t birt
hday
To
tal n
umbe
r of c
hild
ren
aged
12-
23 m
onth
s su
rvey
ed
27
Imm
uniz
atio
n co
vera
ge fo
r di
phth
eria
, per
tuss
is a
nd
teta
nus
(DPT
) N
umbe
r of c
hild
ren
aged
12-
23 m
onth
s re
ceiv
ing
DP
T3 v
acci
ne b
efor
e th
eir f
irst b
irthd
ay
Tota
l num
ber o
f chi
ldre
n ag
ed 1
2-23
mon
ths
surv
eyed
28
Mea
sles
imm
uniz
atio
n co
vera
ge
Num
ber o
f chi
ldre
n ag
ed 1
2-23
mon
ths
rece
ivin
g m
easl
es v
acci
ne b
efor
e th
eir f
irst b
irthd
ay
Tota
l num
ber o
f chi
ldre
n ag
ed 1
2-23
mon
ths
surv
eyed
30
Yello
w fe
ver i
mm
uniz
atio
n co
vera
ge
Num
ber o
f chi
ldre
n ag
ed 1
2-23
mon
ths
imm
uniz
ed a
gain
st y
ello
w fe
ver b
efor
e th
eir f
irst b
irthd
ay
Tota
l num
ber o
f chi
ldre
n ag
ed 1
2-23
mon
ths
surv
eyed
31
Fully
imm
uniz
ed c
hild
ren
Num
ber o
f chi
ldre
n ag
ed 1
2-23
mon
ths
rece
ivin
g D
PT1
-3, O
PV-1
-3, B
CG
and
mea
sles
vac
cine
s be
fore
thei
r fir
st b
irthd
ay
Tota
l num
ber o
f chi
ldre
n ag
ed 1
2-23
mon
ths
surv
eyed
32
Neo
nata
l tet
anus
pro
tect
ion
N
umbe
r of m
othe
rs w
ith li
ve b
irths
in th
e pr
evio
us y
ear t
hat w
ere
give
n at
leas
t tw
o do
ses
of te
tanu
s to
xoid
(T
T) v
acci
ne w
ithin
the
appr
opria
te in
terv
al p
rior t
o gi
ving
birt
h
Tota
l num
ber o
f wom
en s
urve
yed
aged
15-
49
year
s w
ith a
birt
h in
the
year
pre
cedi
ng th
e su
rvey
33
Use
of o
ral r
ehyd
ratio
n th
erap
y (O
RT)
N
umbe
r of c
hild
ren
aged
0-5
9 m
onth
s w
ith d
iarr
hoea
in th
e pr
evio
us 2
wee
ks th
at re
ceiv
ed o
ral r
ehyd
ratio
n sa
lts a
nd/o
r an
appr
opria
te h
ouse
hold
sol
utio
n To
tal n
umbe
r of c
hild
ren
aged
0-5
9 m
onth
s w
ith
diar
rhoe
a in
the
prev
ious
2 w
eeks
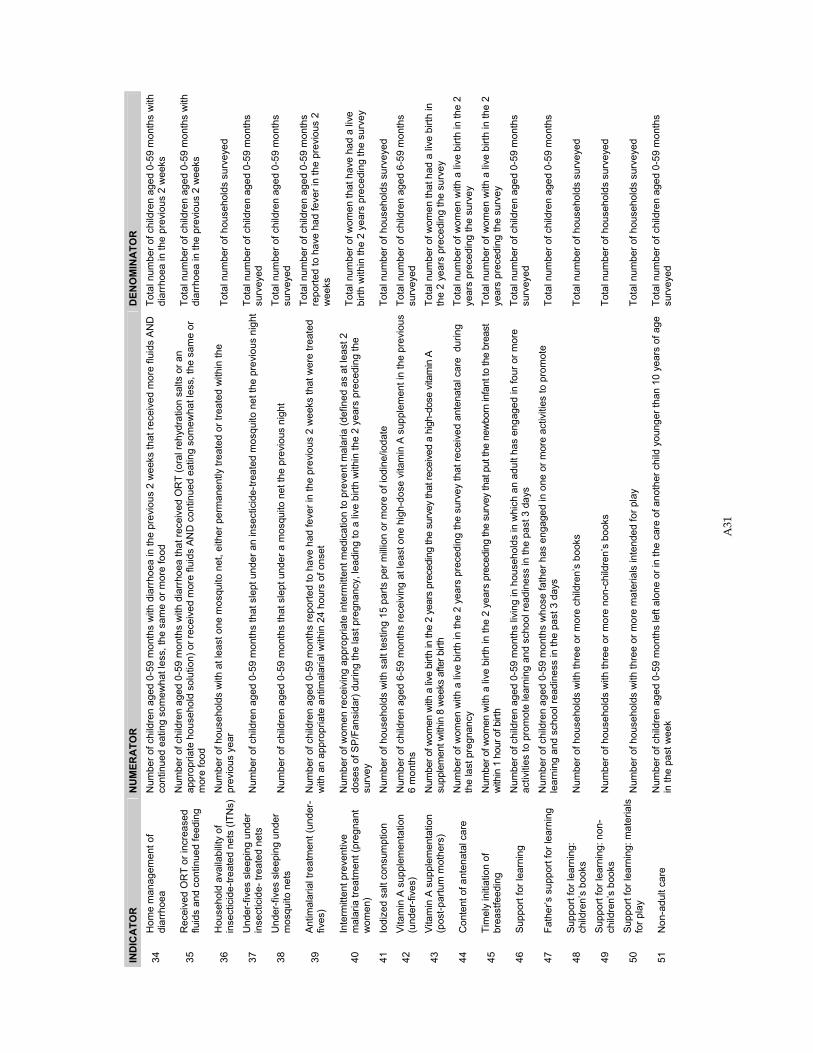
A31
IND
ICA
TOR
N
UM
ERA
TOR
D
ENO
MIN
ATO
R
34
Hom
e m
anag
emen
t of
diar
rhoe
a N
umbe
r of c
hild
ren
aged
0-5
9 m
onth
s w
ith d
iarr
hoea
in th
e pr
evio
us 2
wee
ks th
at re
ceiv
ed m
ore
fluid
s AN
D
cont
inue
d ea
ting
som
ewha
t les
s, th
e sa
me
or m
ore
food
To
tal n
umbe
r of c
hild
ren
aged
0-5
9 m
onth
s w
ith
diar
rhoe
a in
the
prev
ious
2 w
eeks
35
Rec
eive
d O
RT
or in
crea
sed
fluid
s an
d co
ntin
ued
feed
ing
Num
ber o
f chi
ldre
n ag
ed 0
-59
mon
ths
with
dia
rrho
ea th
at re
ceiv
ed O
RT
(ora
l reh
ydra
tion
salts
or a
n ap
prop
riate
hou
seho
ld s
olut
ion)
or r
ecei
ved
mor
e flu
ids
AND
con
tinue
d ea
ting
som
ewha
t les
s, th
e sa
me
or
mor
e fo
od
Tota
l num
ber o
f chi
ldre
n ag
ed 0
-59
mon
ths
with
di
arrh
oea
in th
e pr
evio
us 2
wee
ks
36
Hou
seho
ld a
vaila
bilit
y of
in
sect
icid
e-tre
ated
net
s (IT
Ns)
Num
ber o
f hou
seho
lds
with
at l
east
one
mos
quito
net
, eith
er p
erm
anen
tly tr
eate
d or
trea
ted
with
in th
e pr
evio
us y
ear
Tota
l num
ber o
f hou
seho
lds
surv
eyed
37
Und
er-fi
ves
slee
ping
und
er
inse
ctic
ide-
trea
ted
nets
N
umbe
r of c
hild
ren
aged
0-5
9 m
onth
s th
at s
lept
und
er a
n in
sect
icid
e-tre
ated
mos
quito
net
the
prev
ious
nig
htTo
tal n
umbe
r of c
hild
ren
aged
0-5
9 m
onth
s su
rvey
ed
38
Und
er-fi
ves
slee
ping
und
er
mos
quito
net
s N
umbe
r of c
hild
ren
aged
0-5
9 m
onth
s th
at s
lept
und
er a
mos
quito
net
the
prev
ious
nig
ht
Tota
l num
ber o
f chi
ldre
n ag
ed 0
-59
mon
ths
surv
eyed
39
Antim
alar
ial t
reat
men
t (un
der-
fiv
es)
Num
ber o
f chi
ldre
n ag
ed 0
-59
mon
ths
repo
rted
to h
ave
had
feve
r in
the
prev
ious
2 w
eeks
that
wer
e tre
ated
w
ith a
n ap
prop
riate
ant
imal
aria
l with
in 2
4 ho
urs
of o
nset
Tota
l num
ber o
f chi
ldre
n ag
ed 0
-59
mon
ths
repo
rted
to h
ave
had
feve
r in
the
prev
ious
2
wee
ks
40
Inte
rmitt
ent p
reve
ntiv
e m
alar
ia tr
eatm
ent (
preg
nant
w
omen
)
Num
ber o
f wom
en re
ceiv
ing
appr
opria
te in
term
itten
t med
icat
ion
to p
reve
nt m
alar
ia (d
efin
ed a
s at
leas
t 2
dose
s of
SP/
Fans
idar
) dur
ing
the
last
pre
gnan
cy, l
eadi
ng to
a li
ve b
irth
with
in th
e 2
year
s pr
eced
ing
the
surv
ey
Tota
l num
ber o
f wom
en th
at h
ave
had
a liv
e bi
rth w
ithin
the
2 ye
ars
prec
edin
g th
e su
rvey
41
Iodi
zed
salt
cons
umpt
ion
Num
ber o
f hou
seho
lds
with
sal
t tes
ting
15 p
arts
per
milli
on o
r mor
e of
iodi
ne/io
date
To
tal n
umbe
r of h
ouse
hold
s su
rvey
ed
42
Vita
min
A s
uppl
emen
tatio
n (u
nder
-five
s)
Num
ber o
f chi
ldre
n ag
ed 6
-59
mon
ths
rece
ivin
g at
leas
t one
hig
h-do
se v
itam
in A
sup
plem
ent i
n th
e pr
evio
us
6 m
onth
s To
tal n
umbe
r of c
hild
ren
aged
6-5
9 m
onth
s su
rvey
ed
43
Vita
min
A s
uppl
emen
tatio
n (p
ost-p
artu
m m
othe
rs)
Num
ber o
f wom
en w
ith a
live
birth
in th
e 2
year
s pr
eced
ing
the
surv
ey th
at re
ceiv
ed a
hig
h-do
se v
itam
in A
su
pple
men
t with
in 8
wee
ks a
fter b
irth
Tota
l num
ber o
f wom
en th
at h
ad a
live
birt
h in
th
e 2
year
s pr
eced
ing
the
surv
ey
44
Con
tent
of a
nten
atal
car
e N
umbe
r of w
omen
with
a li
ve b
irth
in th
e 2
year
s pr
eced
ing
the
surv
ey th
at re
ceiv
ed a
nten
atal
car
e d
urin
g th
e la
st p
regn
ancy
To
tal n
umbe
r of w
omen
with
a li
ve b
irth
in th
e 2
year
s pr
eced
ing
the
surv
ey
45
Tim
ely
initi
atio
n of
br
east
feed
ing
Num
ber o
f wom
en w
ith a
live
birt
h in
the
2 ye
ars
prec
edin
g th
e su
rvey
that
put
the
new
born
infa
nt to
the
brea
st
with
in 1
hou
r of b
irth
Tota
l num
ber o
f wom
en w
ith a
live
birt
h in
the
2 ye
ars
prec
edin
g th
e su
rvey
46
Supp
ort f
or le
arni
ng
Num
ber o
f chi
ldre
n ag
ed 0
-59
mon
ths
livin
g in
hou
seho
lds
in w
hich
an
adul
t has
eng
aged
in fo
ur o
r mor
e ac
tiviti
es to
pro
mot
e le
arni
ng a
nd s
choo
l rea
dine
ss in
the
past
3 d
ays
Tota
l num
ber o
f chi
ldre
n ag
ed 0
-59
mon
ths
surv
eyed
47
Fath
er’s
sup
port
for l
earn
ing
Num
ber o
f chi
ldre
n ag
ed 0
-59
mon
ths
who
se fa
ther
has
eng
aged
in o
ne o
r mor
e ac
tiviti
es to
pro
mot
e le
arni
ng a
nd s
choo
l rea
dine
ss in
the
past
3 d
ays
Tota
l num
ber o
f chi
ldre
n ag
ed 0
-59
mon
ths
48
Supp
ort f
or le
arni
ng:
child
ren’
s bo
oks
N
umbe
r of h
ouse
hold
s w
ith th
ree
or m
ore
child
ren’
s bo
oks
Tota
l num
ber o
f hou
seho
lds
surv
eyed
49
Supp
ort f
or le
arni
ng: n
on-
child
ren’
s bo
oks
Num
ber o
f hou
seho
lds
with
thre
e or
mor
e no
n-ch
ildre
n’s
book
s To
tal n
umbe
r of h
ouse
hold
s su
rvey
ed
50
Supp
ort f
or le
arni
ng: m
ater
ials
fo
r pla
y N
umbe
r of h
ouse
hold
s w
ith th
ree
or m
ore
mat
eria
ls in
tend
ed fo
r pla
y To
tal n
umbe
r of h
ouse
hold
s su
rvey
ed
51
Non
-adu
lt ca
re
Num
ber o
f chi
ldre
n ag
ed 0
-59
mon
ths
left
alon
e or
in th
e ca
re o
f ano
ther
chi
ld y
oung
er th
an 1
0 ye
ars
of a
ge
in th
e pa
st w
eek
Tota
l num
ber o
f chi
ldre
n ag
ed 0
-59
mon
ths
surv
eyed
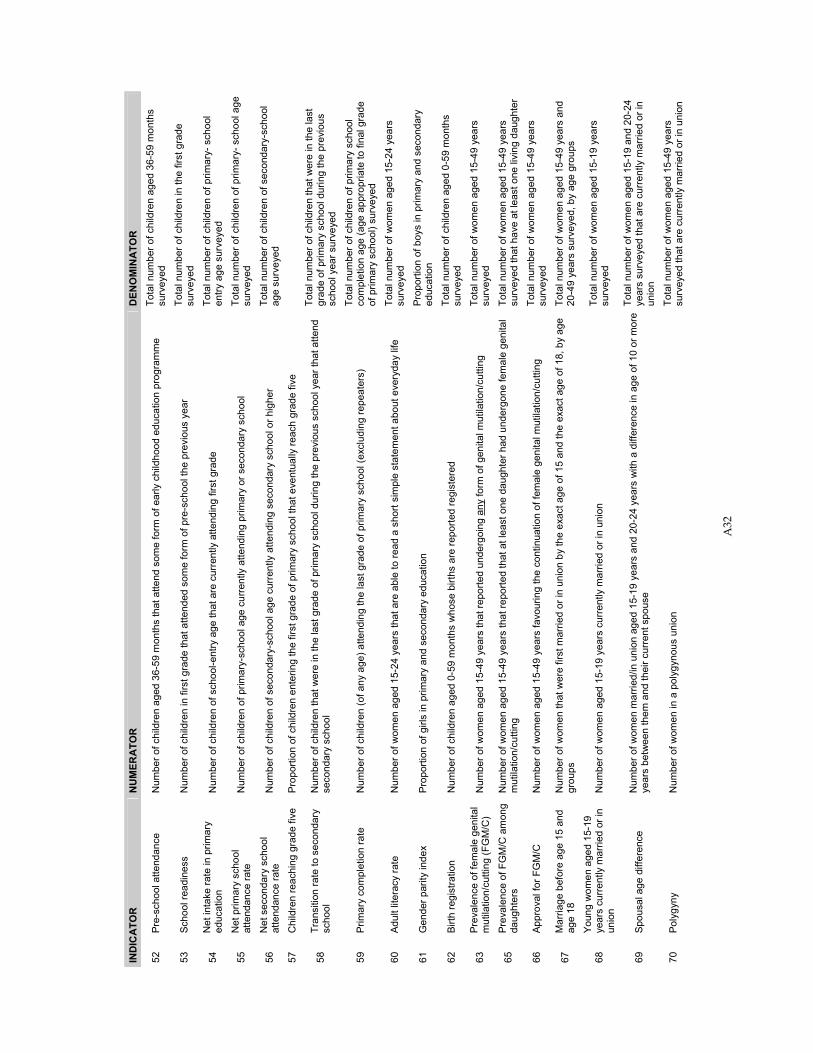
A32
IND
ICA
TOR
N
UM
ERA
TOR
D
ENO
MIN
ATO
R
52
Pre-
scho
ol a
ttend
ance
N
umbe
r of c
hild
ren
aged
36-
59 m
onth
s th
at a
ttend
som
e fo
rm o
f ear
ly c
hild
hood
edu
catio
n pr
ogra
mm
e To
tal n
umbe
r of c
hild
ren
aged
36-
59 m
onth
s su
rvey
ed
53
Scho
ol re
adin
ess
Num
ber o
f chi
ldre
n in
firs
t gra
de th
at a
ttend
ed s
ome
form
of p
re-s
choo
l the
pre
viou
s ye
ar
Tota
l num
ber o
f chi
ldre
n in
the
first
gra
de
surv
eyed
54
Net
inta
ke ra
te in
prim
ary
educ
atio
n N
umbe
r of c
hild
ren
of s
choo
l-ent
ry a
ge th
at a
re c
urre
ntly
atte
ndin
g fir
st g
rade
To
tal n
umbe
r of c
hild
ren
of p
rimar
y- s
choo
l en
try a
ge s
urve
yed
55
Net
prim
ary
scho
ol
atte
ndan
ce ra
te
Num
ber o
f chi
ldre
n of
prim
ary-
scho
ol a
ge c
urre
ntly
atte
ndin
g pr
imar
y or
sec
onda
ry s
choo
l To
tal n
umbe
r of c
hild
ren
of p
rimar
y- s
choo
l age
su
rvey
ed
56
Net
sec
onda
ry s
choo
l at
tend
ance
rate
N
umbe
r of c
hild
ren
of s
econ
dary
-sch
ool a
ge c
urre
ntly
atte
ndin
g se
cond
ary
scho
ol o
r hig
her
Tota
l num
ber o
f chi
ldre
n of
sec
onda
ry-s
choo
l ag
e su
rvey
ed
57
Chi
ldre
n re
achi
ng g
rade
five
Pr
opor
tion
of c
hild
ren
ente
ring
the
first
gra
de o
f prim
ary
scho
ol th
at e
vent
ually
reac
h gr
ade
five
58
Tran
sitio
n ra
te to
sec
onda
ry
scho
ol
Num
ber o
f chi
ldre
n th
at w
ere
in th
e la
st g
rade
of p
rimar
y sc
hool
dur
ing
the
prev
ious
sch
ool y
ear t
hat a
ttend
se
cond
ary
scho
ol
Tota
l num
ber o
f chi
ldre
n th
at w
ere
in th
e la
st
grad
e of
prim
ary
scho
ol d
urin
g th
e pr
evio
us
scho
ol y
ear s
urve
yed
59
Prim
ary
com
plet
ion
rate
N
umbe
r of c
hild
ren
(of a
ny a
ge) a
ttend
ing
the
last
gra
de o
f prim
ary
scho
ol (e
xclu
ding
repe
ater
s)
Tota
l num
ber o
f chi
ldre
n of
prim
ary
scho
ol
com
plet
ion
age
(age
app
ropr
iate
to fi
nal g
rade
of
prim
ary
scho
ol) s
urve
yed
60
Adul
t lite
racy
rate
N
umbe
r of w
omen
age
d 15
-24
year
s th
at a
re a
ble
to re
ad a
sho
rt si
mpl
e st
atem
ent a
bout
eve
ryda
y lif
e To
tal n
umbe
r of w
omen
age
d 15
-24
year
s su
rvey
ed
61
Gen
der p
arity
inde
x Pr
opor
tion
of g
irls
in p
rimar
y an
d se
cond
ary
educ
atio
n Pr
opor
tion
of b
oys
in p
rimar
y an
d se
cond
ary
educ
atio
n
62
Birth
regi
stra
tion
Num
ber o
f chi
ldre
n ag
ed 0
-59
mon
ths
who
se b
irths
are
repo
rted
regi
ster
ed
Tota
l num
ber o
f chi
ldre
n ag
ed 0
-59
mon
ths
surv
eyed
63
Prev
alen
ce o
f fem
ale
geni
tal
mut
ilatio
n/cu
tting
(FG
M/C
) N
umbe
r of w
omen
age
d 15
-49
year
s th
at re
porte
d un
derg
oing
any
form
of g
enita
l mut
ilatio
n/cu
tting
To
tal n
umbe
r of w
omen
age
d 15
-49
year
s su
rvey
ed
65
Prev
alen
ce o
f FG
M/C
am
ong
daug
hter
s N
umbe
r of w
omen
age
d 15
-49
year
s th
at re
porte
d th
at a
t lea
st o
ne d
augh
ter h
ad u
nder
gone
fem
ale
geni
tal
mut
ilatio
n/cu
tting
To
tal n
umbe
r of w
omen
age
d 15
-49
year
s su
rvey
ed th
at h
ave
at le
ast o
ne li
ving
dau
ghte
r
66
Appr
oval
for F
GM
/C
Num
ber o
f wom
en a
ged
15-4
9 ye
ars
favo
urin
g th
e co
ntin
uatio
n of
fem
ale
geni
tal m
utila
tion/
cutti
ng
Tota
l num
ber o
f wom
en a
ged
15-4
9 ye
ars
surv
eyed
67
Mar
riage
bef
ore
age
15 a
nd
age
18
Num
ber o
f wom
en th
at w
ere
first
mar
ried
or in
uni
on b
y th
e ex
act a
ge o
f 15
and
the
exac
t age
of 1
8, b
y ag
e gr
oups
To
tal n
umbe
r of w
omen
age
d 15
-49
year
s an
d 20
-49
year
s su
rvey
ed, b
y ag
e gr
oups
68
Youn
g w
omen
age
d 15
-19
year
s cu
rren
tly m
arrie
d or
in
unio
n N
umbe
r of w
omen
age
d 15
-19
year
s cu
rren
tly m
arrie
d or
in u
nion
To
tal n
umbe
r of w
omen
age
d 15
-19
year
s su
rvey
ed
69
Spou
sal a
ge d
iffer
ence
N
umbe
r of w
omen
mar
ried/
in u
nion
age
d 15
-19
year
s an
d 20
-24
year
s w
ith a
diff
eren
ce in
age
of 1
0 or
mor
e ye
ars
betw
een
them
and
thei
r cur
rent
spo
use
Tota
l num
ber o
f wom
en a
ged
15-1
9 an
d 20
-24
year
s su
rvey
ed th
at a
re c
urre
ntly
mar
ried
or in
un
ion
70
Poly
gyny
N
umbe
r of w
omen
in a
pol
ygyn
ous
unio
n To
tal n
umbe
r of w
omen
age
d 15
-49
year
s su
rvey
ed th
at a
re c
urre
ntly
mar
ried
or in
uni
on
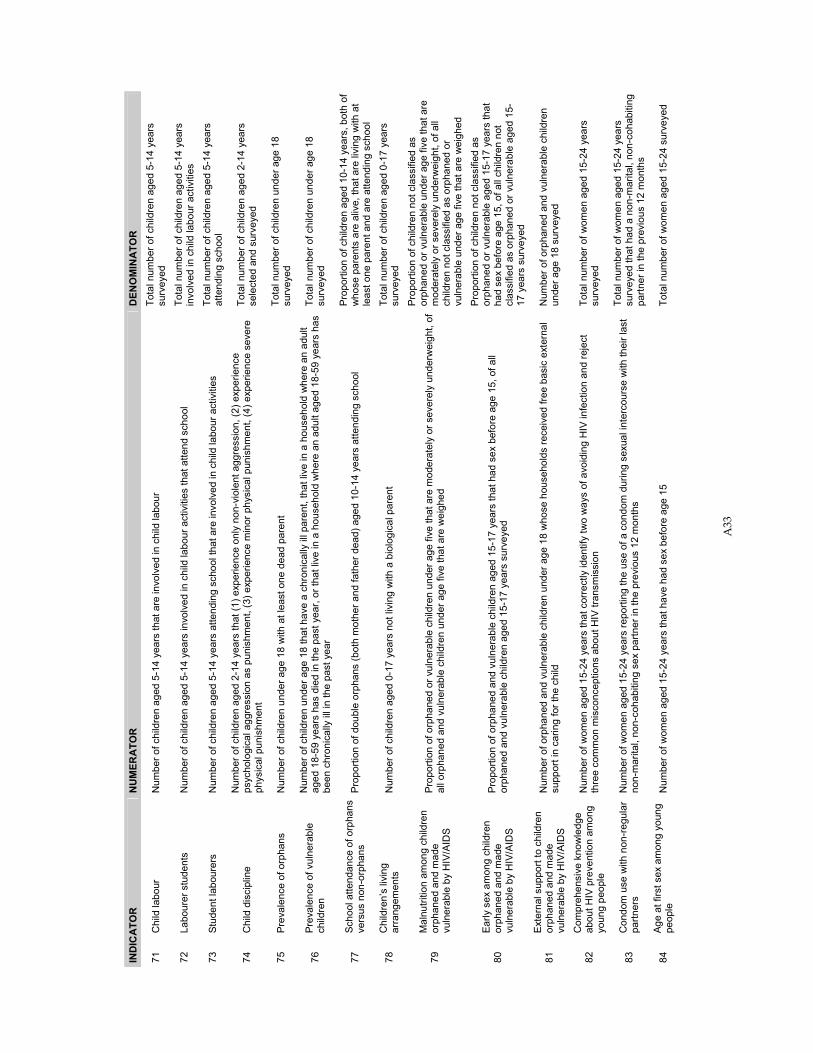
A33
IND
ICA
TOR
N
UM
ERA
TOR
D
ENO
MIN
ATO
R
71
Chi
ld la
bour
N
umbe
r of c
hild
ren
aged
5-1
4 ye
ars
that
are
invo
lved
in c
hild
labo
ur
Tota
l num
ber o
f chi
ldre
n ag
ed 5
-14
year
s su
rvey
ed
72
Labo
urer
stu
dent
s N
umbe
r of c
hild
ren
aged
5-1
4 ye
ars
invo
lved
in c
hild
labo
ur a
ctiv
ities
that
atte
nd s
choo
l To
tal n
umbe
r of c
hild
ren
aged
5-1
4 ye
ars
invo
lved
in c
hild
labo
ur a
ctiv
ities
73
Stud
ent l
abou
rers
N
umbe
r of c
hild
ren
aged
5-1
4 ye
ars
atte
ndin
g sc
hool
that
are
invo
lved
in c
hild
labo
ur a
ctiv
ities
To
tal n
umbe
r of c
hild
ren
aged
5-1
4 ye
ars
atte
ndin
g sc
hool
74
Chi
ld d
isci
plin
e N
umbe
r of c
hild
ren
aged
2-1
4 ye
ars
that
(1) e
xper
ienc
e on
ly n
on-v
iole
nt a
ggre
ssio
n, (2
) exp
erie
nce
psyc
holo
gica
l agg
ress
ion
as p
unis
hmen
t, (3
) exp
erie
nce
min
or p
hysi
cal p
unis
hmen
t, (4
) exp
erie
nce
seve
re
phys
ical
pun
ishm
ent
Tota
l num
ber o
f chi
ldre
n ag
ed 2
-14
year
s se
lect
ed a
nd s
urve
yed
75
Prev
alen
ce o
f orp
hans
N
umbe
r of c
hild
ren
unde
r age
18
with
at l
east
one
dea
d pa
rent
To
tal n
umbe
r of c
hild
ren
unde
r age
18
su
rvey
ed
76
Prev
alen
ce o
f vul
nera
ble
child
ren
Num
ber o
f chi
ldre
n un
der a
ge 1
8 th
at h
ave
a ch
roni
cally
ill p
aren
t, th
at li
ve in
a h
ouse
hold
whe
re a
n ad
ult
aged
18-
59 y
ears
has
die
d in
the
past
yea
r, or
that
live
in a
hou
seho
ld w
here
an
adul
t age
d 18
-59
year
s ha
s be
en c
hron
ical
ly il
l in
the
past
yea
r
Tota
l num
ber o
f chi
ldre
n un
der a
ge 1
8 su
rvey
ed
77
Scho
ol a
ttend
ance
of o
rpha
ns
vers
us n
on-o
rpha
ns
Prop
ortio
n of
dou
ble
orph
ans
(bot
h m
othe
r and
fath
er d
ead)
age
d 10
-14
year
s at
tend
ing
scho
ol
Prop
ortio
n of
chi
ldre
n ag
ed 1
0-14
yea
rs, b
oth
of
who
se p
aren
ts a
re a
live,
that
are
livi
ng w
ith a
t le
ast o
ne p
aren
t and
are
atte
ndin
g sc
hool
78
Chi
ldre
n’s
livin
g ar
rang
emen
ts
Num
ber o
f chi
ldre
n ag
ed 0
-17
year
s no
t liv
ing
with
a b
iolo
gica
l par
ent
Tota
l num
ber o
f chi
ldre
n ag
ed 0
-17
year
s su
rvey
ed
79
Mal
nutri
tion
amon
g ch
ildre
n or
phan
ed a
nd m
ade
vuln
erab
le b
y H
IV/A
IDS
Prop
ortio
n of
orp
hane
d or
vul
nera
ble
child
ren
unde
r age
five
that
are
mod
erat
ely
or s
ever
ely
unde
rwei
ght,
of
all o
rpha
ned
and
vuln
erab
le c
hild
ren
unde
r age
five
that
are
wei
ghed
Prop
ortio
n of
chi
ldre
n no
t cla
ssifi
ed a
s or
phan
ed o
r vul
nera
ble
unde
r age
five
that
are
m
oder
atel
y or
sev
erel
y un
derw
eigh
t, of
all
child
ren
not c
lass
ified
as
orph
aned
or
vuln
erab
le u
nder
age
five
that
are
wei
ghed
80
Early
sex
am
ong
child
ren
orph
aned
and
mad
e vu
lner
able
by
HIV
/AID
S
Prop
ortio
n of
orp
hane
d an
d vu
lner
able
chi
ldre
n ag
ed 1
5-17
yea
rs th
at h
ad s
ex b
efor
e ag
e 15
, of a
ll or
phan
ed a
nd v
ulne
rabl
e ch
ildre
n ag
ed 1
5-17
yea
rs s
urve
yed
Prop
ortio
n of
chi
ldre
n no
t cla
ssifi
ed a
s or
phan
ed o
r vul
nera
ble
aged
15-
17 y
ears
that
ha
d se
x be
fore
age
15,
of a
ll ch
ildre
n no
t cl
assi
fied
as o
rpha
ned
or v
ulne
rabl
e ag
ed 1
5-17
yea
rs s
urve
yed
81
Exte
rnal
sup
port
to c
hild
ren
orph
aned
and
mad
e vu
lner
able
by
HIV
/AID
S
Num
ber o
f orp
hane
d an
d vu
lner
able
chi
ldre
n un
der a
ge 1
8 w
hose
hou
seho
lds
rece
ived
free
bas
ic e
xter
nal
supp
ort i
n ca
ring
for t
he c
hild
N
umbe
r of o
rpha
ned
and
vuln
erab
le c
hild
ren
unde
r age
18
surv
eyed
82
Com
preh
ensi
ve k
now
ledg
e ab
out H
IV p
reve
ntio
n am
ong
youn
g pe
ople
Num
ber o
f wom
en a
ged
15-2
4 ye
ars
that
cor
rect
ly id
entif
y tw
o w
ays
of a
void
ing
HIV
infe
ctio
n an
d re
ject
th
ree
com
mon
mis
conc
eptio
ns a
bout
HIV
tran
smis
sion
To
tal n
umbe
r of w
omen
age
d 15
-24
year
s su
rvey
ed
83
Con
dom
use
with
non
-reg
ular
pa
rtner
s N
umbe
r of w
omen
age
d 15
-24
year
s re
porti
ng th
e us
e of
a c
ondo
m d
urin
g se
xual
inte
rcou
rse
with
thei
r las
t no
n-m
arita
l, no
n-co
habi
ting
sex
partn
er in
the
prev
ious
12
mon
ths
Tota
l num
ber o
f wom
en a
ged
15-2
4 ye
ars
surv
eyed
that
had
a n
on-m
arita
l, no
n-co
habi
ting
partn
er in
the
prev
ious
12
mon
ths
84
Age
at fi
rst s
ex a
mon
g yo
ung
peop
le
Num
ber o
f wom
en a
ged
15-2
4 ye
ars
that
hav
e ha
d se
x be
fore
age
15
Tota
l num
ber o
f wom
en a
ged
15-2
4 su
rvey
ed
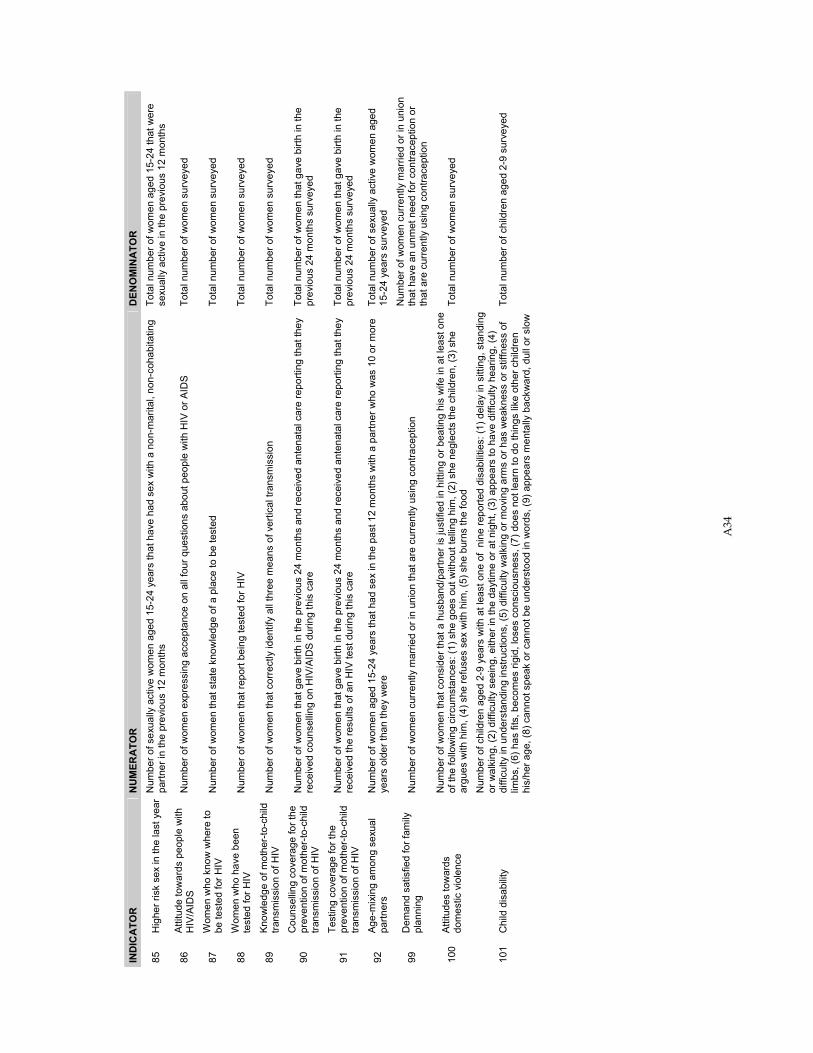
A34
IND
ICA
TOR
N
UM
ERA
TOR
D
ENO
MIN
ATO
R
85
Hig
her r
isk
sex
in th
e la
st y
ear
Num
ber o
f sex
ually
act
ive
wom
en a
ged
15-2
4 ye
ars
that
hav
e ha
d se
x w
ith a
non
-mar
ital,
non-
coha
bita
ting
partn
er in
the
prev
ious
12
mon
ths
Tota
l num
ber o
f wom
en a
ged
15-2
4 th
at w
ere
sexu
ally
act
ive
in th
e pr
evio
us 1
2 m
onth
s
86
Attit
ude
tow
ards
peo
ple
with
H
IV/A
IDS
Num
ber o
f wom
en e
xpre
ssin
g ac
cept
ance
on
all f
our q
uest
ions
abo
ut p
eopl
e w
ith H
IV o
r AID
S To
tal n
umbe
r of w
omen
sur
veye
d
87
Wom
en w
ho k
now
whe
re to
be
test
ed fo
r HIV
N
umbe
r of w
omen
that
sta
te k
now
ledg
e of
a p
lace
to b
e te
sted
To
tal n
umbe
r of w
omen
sur
veye
d
88
Wom
en w
ho h
ave
been
te
sted
for H
IV
Num
ber o
f wom
en th
at re
port
bein
g te
sted
for H
IV
Tota
l num
ber o
f wom
en s
urve
yed
89
Know
ledg
e of
mot
her-
to-c
hild
tra
nsm
issi
on o
f HIV
N
umbe
r of w
omen
that
cor
rect
ly id
entif
y al
l thr
ee m
eans
of v
ertic
al tr
ansm
issi
on
Tota
l num
ber o
f wom
en s
urve
yed
90
Cou
nsel
ling
cove
rage
for t
he
prev
entio
n of
mot
her-
to-c
hild
tra
nsm
issi
on o
f HIV
Num
ber o
f wom
en th
at g
ave
birth
in th
e pr
evio
us 2
4 m
onth
s an
d re
ceiv
ed a
nten
atal
car
e re
porti
ng th
at th
ey
rece
ived
cou
nsel
ling
on H
IV/A
IDS
dur
ing
this
car
e To
tal n
umbe
r of w
omen
that
gav
e bi
rth in
the
prev
ious
24
mon
ths
surv
eyed
91
Test
ing
cove
rage
for t
he
prev
entio
n of
mot
her-
to-c
hild
tra
nsm
issi
on o
f HIV
Num
ber o
f wom
en th
at g
ave
birth
in th
e pr
evio
us 2
4 m
onth
s an
d re
ceiv
ed a
nten
atal
car
e re
porti
ng th
at th
ey
rece
ived
the
resu
lts o
f an
HIV
test
dur
ing
this
car
e To
tal n
umbe
r of w
omen
that
gav
e bi
rth in
the
prev
ious
24
mon
ths
surv
eyed
92
Age-
mix
ing
amon
g se
xual
pa
rtner
s N
umbe
r of w
omen
age
d 15
-24
year
s th
at h
ad s
ex in
the
past
12
mon
ths
with
a p
artn
er w
ho w
as 1
0 or
mor
e ye
ars
olde
r tha
n th
ey w
ere
Tota
l num
ber o
f sex
ually
act
ive
wom
en a
ged
15-2
4 ye
ars
surv
eyed
99
Dem
and
satis
fied
for f
amily
pl
anni
ng
Num
ber o
f wom
en c
urre
ntly
mar
ried
or in
uni
on th
at a
re c
urre
ntly
usi
ng c
ontra
cept
ion
Num
ber o
f wom
en c
urre
ntly
mar
ried
or in
uni
on
that
hav
e an
unm
et n
eed
for c
ontra
cept
ion
or
that
are
cur
rent
ly u
sing
con
trace
ptio
n
100
Attit
udes
tow
ards
do
mes
tic v
iole
nce
Num
ber o
f wom
en th
at c
onsi
der t
hat a
hus
band
/par
tner
is ju
stifi
ed in
hitti
ng o
r bea
ting
his
wife
in a
t lea
st o
ne
of th
e fo
llow
ing
circ
umst
ance
s: (1
) she
goe
s ou
t with
out t
ellin
g hi
m, (
2) s
he n
egle
cts
the
child
ren,
(3) s
he
argu
es w
ith h
im, (
4) s
he re
fuse
s se
x w
ith h
im, (
5) s
he b
urns
the
food
To
tal n
umbe
r of w
omen
sur
veye
d
101
Chi
ld d
isab
ility
Num
ber o
f chi
ldre
n ag
ed 2
-9 y
ears
with
at l
east
one
of
nine
repo
rted
disa
bilit
ies:
(1) d
elay
in s
ittin
g, s
tand
ing
or w
alki
ng, (
2) d
iffic
ulty
see
ing,
eith
er in
the
dayt
ime
or a
t nig
ht, (
3) a
ppea
rs to
hav
e di
fficu
lty h
earin
g, (4
) di
fficu
lty in
und
erst
andi
ng in
stru
ctio
ns, (
5) d
iffic
ulty
wal
king
or m
ovin
g ar
ms
or h
as w
eakn
ess
or s
tiffn
ess
of
limbs
, (6)
has
fits
, bec
omes
rigi
d, lo
ses
cons
ciou
snes
s, (7
) doe
s no
t lea
rn to
do
thin
gs li
ke o
ther
chi
ldre
n hi
s/he
r age
, (8)
can
not s
peak
or c
anno
t be
unde
rsto
od in
wor
ds, (
9) a
ppea
rs m
enta
lly b
ackw
ard,
dul
l or s
low
Tota
l num
ber o
f chi
ldre
n ag
ed 2
-9 s
urve
yed
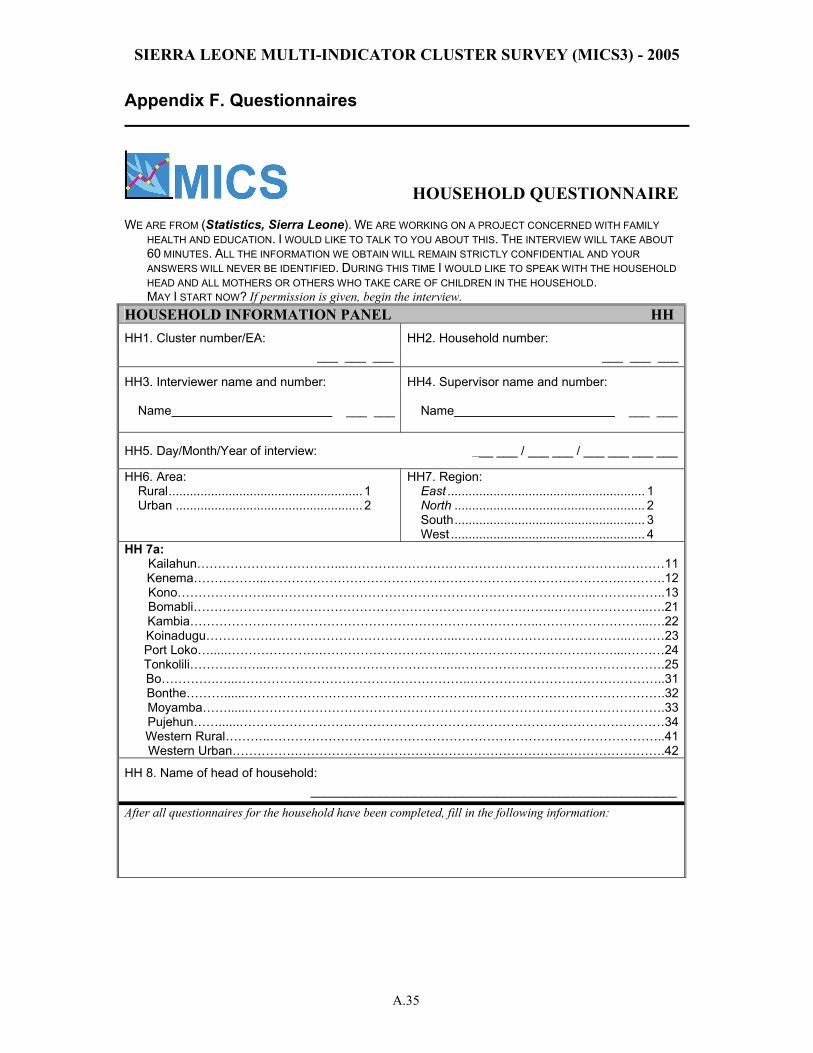
SIERRA LEONE MULTI-INDICATOR CLUSTER SURVEY (MICS3) - 2005
A.35
Appendix F. Questionnaires
HOUSEHOLD QUESTIONNAIRE WE ARE FROM (Statistics, Sierra Leone). WE ARE WORKING ON A PROJECT CONCERNED WITH FAMILY
HEALTH AND EDUCATION. I WOULD LIKE TO TALK TO YOU ABOUT THIS. THE INTERVIEW WILL TAKE ABOUT 60 MINUTES. ALL THE INFORMATION WE OBTAIN WILL REMAIN STRICTLY CONFIDENTIAL AND YOUR ANSWERS WILL NEVER BE IDENTIFIED. DURING THIS TIME I WOULD LIKE TO SPEAK WITH THE HOUSEHOLD HEAD AND ALL MOTHERS OR OTHERS WHO TAKE CARE OF CHILDREN IN THE HOUSEHOLD.
MAY I START NOW? If permission is given, begin the interview. HOUSEHOLD INFORMATION PANEL HH HH1. Cluster number/EA: HH2. Household number:
___ ___ ___ ___ ___ ___
HH3. Interviewer name and number: HH4. Supervisor name and number: Name ___ ___
Name ___ ___
HH5. Day/Month/Year of interview: ___ ___ / ___ ___ / ___ ___ ___ ___
HH6. Area: Rural....................................................... 1 Urban ..................................................... 2
HH7. Region: East ........................................................ 1 North ...................................................... 2 South...................................................... 3 West ....................................................... 4
HH 7a: Kailahun……………………………...…………………………………………………………..………11Kenema……………...…………………………………………………………………………..……….12Kono…………………..…………………………………………………………………..……….……..13Bomabli……………….…………………………………………………………..…………………..….21Kambia……………….………………………………………………………..……………………...….22Koinadugu…………….……………………………………...…………………………………..………23Port Loko….....………………….…………………………..…………………………………....………24Tonkolili……….……...………………………………………..………………………………………….25Bo………….…...………………………………………………..………………………………………..31Bonthe………......……………………………………………….……………………………………….32Moyamba……......……………………………………………………………………………………….33Pujehun……......…………………………………………………………………………………………34Western Rural………..…………………………………………………………………………………..41Western Urban…………….…………………………………………………………………………….42
HH 8. Name of head of household: _____________________________________________________
After all questionnaires for the household have been completed, fill in the following information:
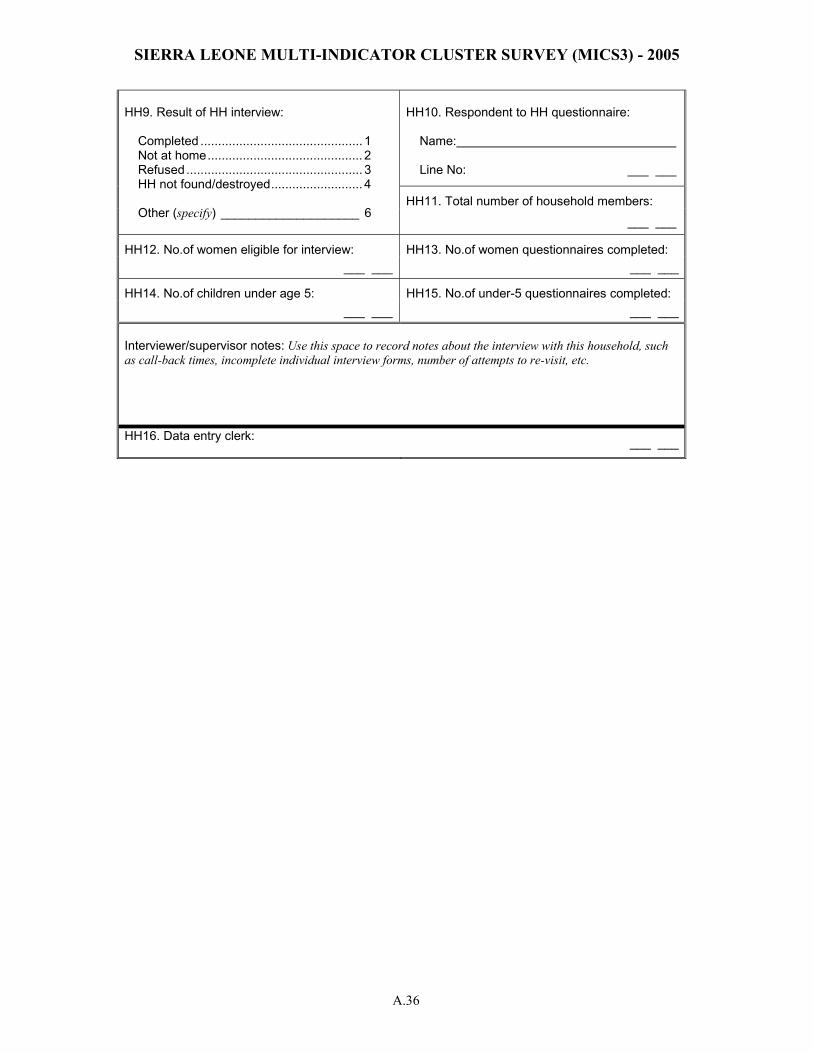
SIERRA LEONE MULTI-INDICATOR CLUSTER SURVEY (MICS3) - 2005
A.36
HH10. Respondent to HH questionnaire: Name: Line No: ___ ___
HH11. Total number of household members:
HH9. Result of HH interview:
Completed .............................................. 1
Not at home............................................ 2 Refused.................................................. 3 HH not found/destroyed.......................... 4
Other (specify) ____________________ 6
___ ___
HH12. No.of women eligible for interview: HH13. No.of women questionnaires completed: ___ ___ ___ ___
HH14. No.of children under age 5: HH15. No.of under-5 questionnaires completed: ___ ___ ___ ___
Interviewer/supervisor notes: Use this space to record notes about the interview with this household, such as call-back times, incomplete individual interview forms, number of attempts to re-visit, etc. HH16. Data entry clerk: ___ ___
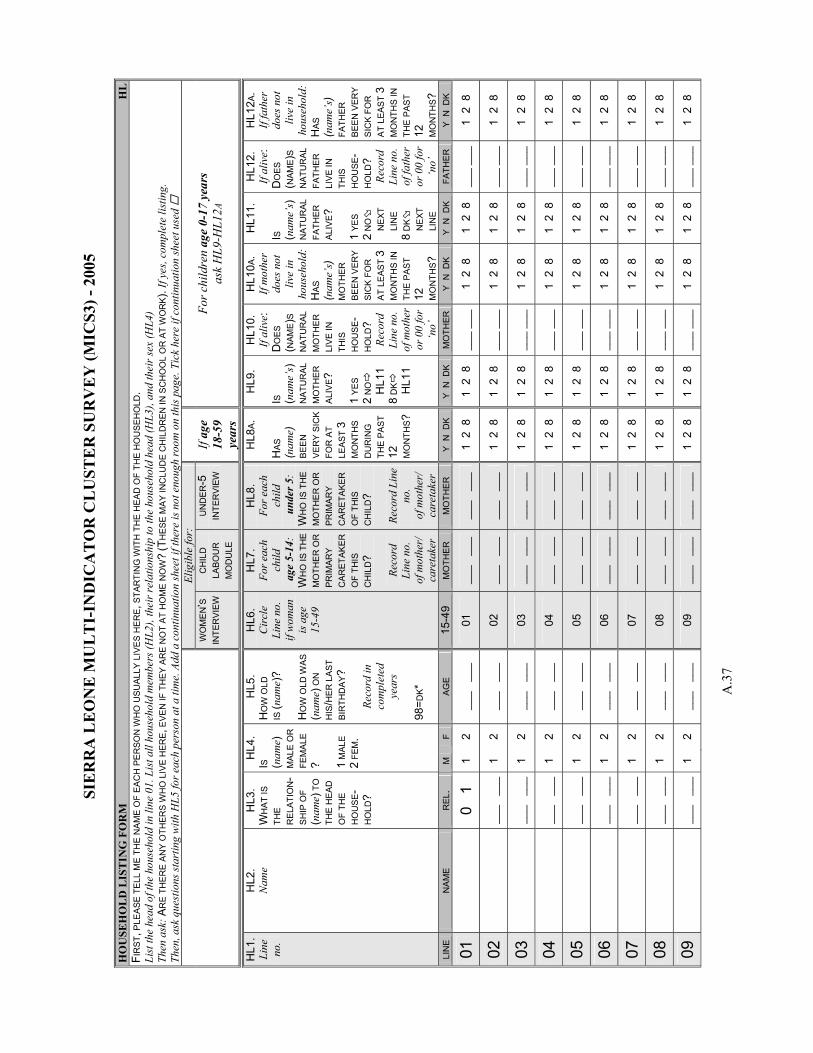
SIE
RR
A L
EO
NE
MU
LT
I-IN
DIC
AT
OR
CL
UST
ER
SU
RV
EY
(MIC
S3) -
200
5
A.3
7
HO
USE
HO
LD
LIS
TIN
G F
OR
M
HL
FIR
ST, P
LEA
SE T
ELL
ME
THE
NA
ME
OF
EAC
H P
ER
SON
WH
O U
SUA
LLY
LIV
ES
HE
RE,
STA
RTI
NG
WIT
H T
HE
HE
AD O
F TH
E H
OU
SEH
OLD
. Li
st th
e he
ad o
f the
hou
seho
ld in
line
01.
Lis
t all
hous
ehol
d m
embe
rs (H
L2),
thei
r rel
atio
nshi
p to
the
hous
ehol
d he
ad (H
L3),
and
thei
r sex
(HL4
) Th
en a
sk: A
RE
TH
ER
E A
NY
OTH
ERS
WH
O L
IVE
HER
E, E
VEN
IF T
HEY
AR
E N
OT
AT H
OM
E N
OW
? (T
HES
E M
AY IN
CLU
DE
CH
ILD
REN
IN S
CH
OO
L O
R A
T W
OR
K).
If ye
s, co
mpl
ete
listin
g.
Then
, ask
que
stio
ns st
artin
g w
ith H
L5 fo
r eac
h pe
rson
at a
tim
e. A
dd a
con
tinua
tion
shee
t if t
here
is n
ot e
noug
h ro
om o
n th
is p
age.
Tic
k he
re if
con
tinua
tion
shee
t use
d
El
igib
le fo
r:
W
OM
EN
’S
INTE
RVI
EWC
HIL
D
LABO
UR
M
OD
ULE
UN
DE
R-5
IN
TER
VIEW
If
age
18-5
9 ye
ars
For c
hild
ren
age
0-17
yea
rs
ask
HL9
-HL1
2 A
HL1
. Li
ne
no.
HL2
. N
ame
HL3
. W
HAT
IS
THE
RE
LATI
ON
-S
HIP
OF
(nam
e) T
O
THE
HEA
D
OF
THE
HO
USE
-H
OLD
?
HL4
. IS
(n
ame)
M
ALE
OR
FE
MA
LE? 1
MA
LE
2 FE
M.
HL5
. H
OW
OLD
IS
(nam
e)?
HO
W O
LD W
AS
(nam
e) O
N
HIS
/HER
LA
ST
BIR
THD
AY?
Re
cord
in
com
plet
ed
year
s 98
=DK*
HL6
. C
ircl
e Li
ne n
o.
if w
oman
is
age
15
-49
HL7
. Fo
r eac
h ch
ild
age
5-1
4:
WH
O IS
TH
E M
OTH
ER O
RP
RIM
ARY
C
AR
ETAK
ER
OF
THIS
C
HIL
D?
Re
cord
Li
ne n
o.
of m
othe
r/
care
take
r
HL8
. Fo
r eac
h ch
ild
und
er 5
: W
HO
IS T
HE
MO
THE
R O
R
PRIM
AR
Y C
ARET
AKE
R
OF
THIS
C
HIL
D?
Reco
rd L
ine
no.
of m
othe
r/
care
take
r
HL8
A.
HAS
(n
ame)
B
EEN
V
ERY
SIC
K
FOR
AT
LEAS
T 3
MO
NTH
S D
UR
ING
TH
E P
AST
12
MO
NTH
S ?
HL9
. I S
(n
ame’
s)
NAT
UR
AL
MO
THER
A
LIVE
? 1
YES
2 N
O
H
L11
8 D
K
H
L11
HL1
0.
If al
ive:
D
OES
(N
AME)S
N
ATU
RAL
M
OTH
ER
LI
VE IN
TH
IS
HO
US
E-H
OLD
? Re
cord
Li
ne n
o.
of m
othe
r or
00
for
‘no’
HL1
0A.
If m
othe
r do
es n
ot
live
in
hous
ehol
d:H
AS
(nam
e’s)
M
OTH
ER
BEEN
VER
Y SI
CK
FO
R
AT L
EAS
T 3
MO
NTH
S IN
TH
E PA
ST
12
MO
NTH
S ?
HL1
1.
I S
(nam
e’s)
N
ATU
RAL
FA
THE
R
ALI
VE?
1 YE
S
2 N
O
N
EXT
LI
NE
8 D
K
N
EXT
LI
NE
HL1
2.
If al
ive:
D
OES
(N
AME)
S N
ATU
RAL
FA
THER
LI
VE IN
TH
IS
HO
USE
-H
OLD
? Re
cord
Li
ne n
o.
of fa
ther
or
00
for
‘no’
HL1
2A.
If fa
ther
do
es n
ot
live
in
hous
ehol
d:H
AS
(nam
e’s)
FA
THE
R
BEE
N V
ERY
SIC
K FO
R
AT L
EAST
3
MO
NTH
S IN
TH
E PA
ST
12
MO
NTH
S ?
LIN
E
NA
ME
REL
. M
F
AGE
15-4
9 M
OTH
ER
M
OTH
ER
Y N
DK
Y N
DK
MO
THER
Y
N D
K
Y N
DK
FATH
ER
Y
N D
K
01
0
1
1 2
___
___
01
__
_ _
__
___
___
1
2 8
1
2 8
__
_ __
_1
2 8
1
2 8
__
_ __
_1
2 8
02
__
_ _
__
1 2
___
___
02
__
_ _
__
___
___
1
2 8
1
2 8
__
_ __
_1
2 8
1
2 8
__
_ __
_1
2 8
03
__
_ _
__
1 2
___
___
03
__
_ _
__
___
___
1
2 8
1
2 8
__
_ __
_1
2 8
1
2 8
__
_ __
_1
2 8
04
__
_ _
__
1 2
___
___
04
__
_ _
__
___
___
1
2 8
1
2 8
__
_ __
_1
2 8
1
2 8
__
_ __
_1
2 8
05
__
_ _
__
1 2
___
___
05
__
_ _
__
___
___
1
2 8
1
2 8
__
_ __
_1
2 8
1
2 8
__
_ __
_1
2 8
06
__
_ _
__
1 2
___
___
06
__
_ _
__
___
___
1
2 8
1
2 8
__
_ __
_1
2 8
1
2 8
__
_ __
_1
2 8
07
__
_ _
__
1 2
___
___
07
__
_ _
__
___
___
1
2 8
1
2 8
__
_ __
_1
2 8
1
2 8
__
_ __
_1
2 8
08
__
_ _
__
1 2
___
___
08
__
_ _
__
___
___
1
2 8
1
2 8
__
_ __
_1
2 8
1
2 8
__
_ __
_1
2 8
09
__
_ _
__
1 2
___
___
09
__
_ _
__
___
___
1
2 8
1
2 8
__
_ __
_1
2 8
1
2 8
__
_ __
_1
2 8
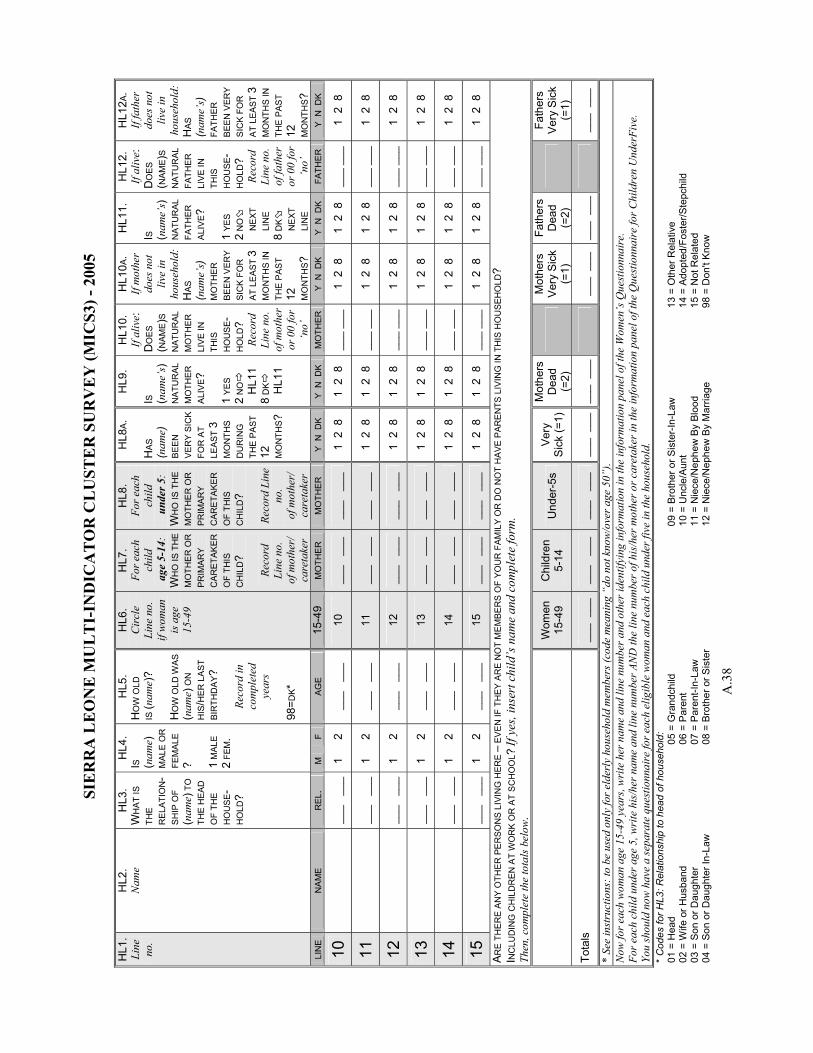
SIE
RR
A L
EO
NE
MU
LT
I-IN
DIC
AT
OR
CL
UST
ER
SU
RV
EY
(MIC
S3) -
200
5
A.3
8
HL1
. Li
ne
no.
HL2
. N
ame
HL3
. W
HAT
IS
THE
RE
LATI
ON
-S
HIP
OF
(nam
e) T
O
THE
HEA
D
OF
THE
HO
USE
-H
OLD
?
HL4
. I S
(n
ame)
M
ALE
OR
FE
MA
LE? 1
MA
LE
2 FE
M.
HL5
. H
OW
OLD
IS
(nam
e)?
HO
W O
LD W
AS
(nam
e) O
N
HIS
/HER
LA
ST
BIR
THD
AY?
Re
cord
in
com
plet
ed
year
s 98
= DK*
HL6
. C
ircl
e Li
ne n
o.
if w
oman
is
age
15
-49
HL7
. Fo
r eac
h ch
ild
age
5-1
4:
WH
O IS
TH
E M
OTH
ER O
RP
RIM
ARY
C
AR
ETAK
ER
OF
THIS
C
HIL
D?
Re
cord
Li
ne n
o.
of m
othe
r/
care
take
r
HL8
. Fo
r eac
h ch
ild
und
er 5
: W
HO
IS T
HE
MO
THE
R O
R
PRIM
AR
Y C
ARET
AKE
R
OF
THIS
C
HIL
D?
Reco
rd L
ine
no.
of m
othe
r/
care
take
r
HL8
A.
HAS
(n
ame)
B
EEN
V
ERY
SIC
K
FOR
AT
LEAS
T 3
MO
NTH
S D
UR
ING
TH
E P
AST
12
MO
NTH
S ?
HL9
. I S
(n
ame’
s)
NAT
UR
AL
MO
THER
A
LIVE
? 1
YES
2 N
O
H
L11
8 D
K
H
L11
HL1
0.
If al
ive:
D
OES
(N
AME)S
N
ATU
RAL
M
OTH
ER
LI
VE IN
TH
IS
HO
US
E-H
OLD
? Re
cord
Li
ne n
o.
of m
othe
r or
00
for
‘no’
HL1
0A.
If m
othe
r do
es n
ot
live
in
hous
ehol
d:H
AS
(nam
e’s)
M
OTH
ER
BEEN
VER
Y SI
CK
FO
R
AT L
EAS
T 3
MO
NTH
S IN
TH
E PA
ST
12
MO
NTH
S ?
HL1
1.
I S
(nam
e’s)
N
ATU
RAL
FA
THE
R
ALI
VE?
1 YE
S
2 N
O
N
EXT
LI
NE
8 D
K
N
EXT
LI
NE
HL1
2.
If al
ive:
D
OES
(N
AME)
S N
ATU
RAL
FA
THER
LI
VE IN
TH
IS
HO
USE
-H
OLD
? Re
cord
Li
ne n
o.
of fa
ther
or
00
for
‘no’
HL1
2A.
If fa
ther
do
es n
ot
live
in
hous
ehol
d:H
AS
(nam
e’s)
FA
THE
R
BEE
N V
ERY
SIC
K FO
R
AT L
EAST
3
MO
NTH
S IN
TH
E PA
ST
12
MO
NTH
S ?
LIN
E
NA
ME
REL
. M
F
AGE
15-4
9 M
OTH
ER
M
OTH
ER
Y N
DK
Y N
DK
MO
THER
Y
N D
K
Y N
DK
FATH
ER
Y
N D
K
10
__
_ _
__
1 2
___
___
10
__
_ _
__
___
___
1
2 8
1
2 8
__
_ __
_1
2 8
1
2 8
__
_ __
_1
2 8
11
__
_ _
__
1 2
___
___
11
__
_ _
__
___
___
1
2 8
1
2 8
__
_ __
_1
2 8
1
2 8
__
_ __
_1
2 8
12
__
_ _
__
1 2
___
___
12
__
_ _
__
___
___
1
2 8
1
2 8
__
_ __
_1
2 8
1
2 8
__
_ __
_1
2 8
13
__
_ _
__
1 2
___
___
13
__
_ _
__
___
___
1
2 8
1
2 8
__
_ __
_1
2 8
1
2 8
__
_ __
_1
2 8
14
__
_ _
__
1 2
___
___
14
__
_ _
__
___
___
1
2 8
1
2 8
__
_ __
_1
2 8
1
2 8
__
_ __
_1
2 8
15
__
_ _
__
1 2
___
___
15
__
_ _
__
___
___
1
2 8
1
2 8
__
_ __
_1
2 8
1
2 8
__
_ __
_1
2 8
AR
E T
HE
RE
AN
Y O
THER
PE
RSO
NS
LIVI
NG
HER
E –
EV
EN IF
TH
EY A
RE
NO
T M
EM
BER
S O
F YO
UR
FAM
ILY
OR
DO
NO
T H
AVE
PAR
EN
TS L
IVIN
G IN
TH
IS H
OU
SEH
OLD
? I N
CLU
DIN
G C
HIL
DR
EN A
T W
OR
K O
R A
T S
CH
OO
L? If
yes
, ins
ert c
hild
’s n
ame
and
com
plet
e fo
rm.
Then
, com
plet
e th
e to
tals
bel
ow.
W
omen
15
-49
Chi
ldre
n 5-
14
Und
er-5
s Ve
ry
Sic
k (=
1)
Mot
hers
D
ead
(=2)
Mot
hers
V
ery
Sic
k (=
1)
Fath
ers
Dea
d (=
2)
Fa
ther
s V
ery
Sic
k (=
1)
Tota
ls
___
___
__
_ _
__
___
___
__
_ _
__
___
___
__
_ _
__
___
___
__
_ _
__
* Se
e in
stru
ctio
ns: t
o be
use
d on
ly fo
r eld
erly
hou
seho
ld m
embe
rs (c
ode
mea
ning
“do
not
kno
w/o
ver a
ge 5
0”).
Now
for e
ach
wom
an a
ge 1
5-49
yea
rs, w
rite
her
nam
e an
d lin
e nu
mbe
r and
oth
er id
entif
ying
info
rmat
ion
in th
e in
form
atio
n pa
nel o
f the
Wom
en’s
Que
stio
nnai
re.
For e
ach
child
und
er a
ge 5
, wri
te h
is/h
er n
ame
and
line
num
ber A
ND
the
line
num
ber o
f his
/her
mot
her o
r car
etak
er in
the
info
rmat
ion
pane
l of t
he Q
uest
ionn
aire
for C
hild
ren
Und
erFi
ve.
You
shou
ld n
ow h
ave
a se
para
te q
uest
ionn
aire
for e
ach
elig
ible
wom
an a
nd e
ach
child
und
er fi
ve in
the
hous
ehol
d.
* C
odes
for H
L3: R
elat
ions
hip
to h
ead
of h
ouse
hold
:01
= H
ead
02 =
Wife
or H
usba
nd
03 =
Son
or D
augh
ter
04 =
Son
or D
augh
ter I
n-La
w
05 =
Gra
ndch
ild
06 =
Par
ent
07 =
Par
ent-I
n-La
w
08 =
Bro
ther
or S
iste
r
09 =
Bro
ther
or S
iste
r-In
-Law
10
= U
ncle
/Aun
t 11
= N
iece
/Nep
hew
By
Bloo
d 12
= N
iece
/Nep
hew
By
Mar
riage
13 =
Oth
er R
elat
ive
14
= A
dopt
ed/F
oste
r/Ste
pchi
ld
15 =
Not
Rel
ated
98
= D
on't
Know
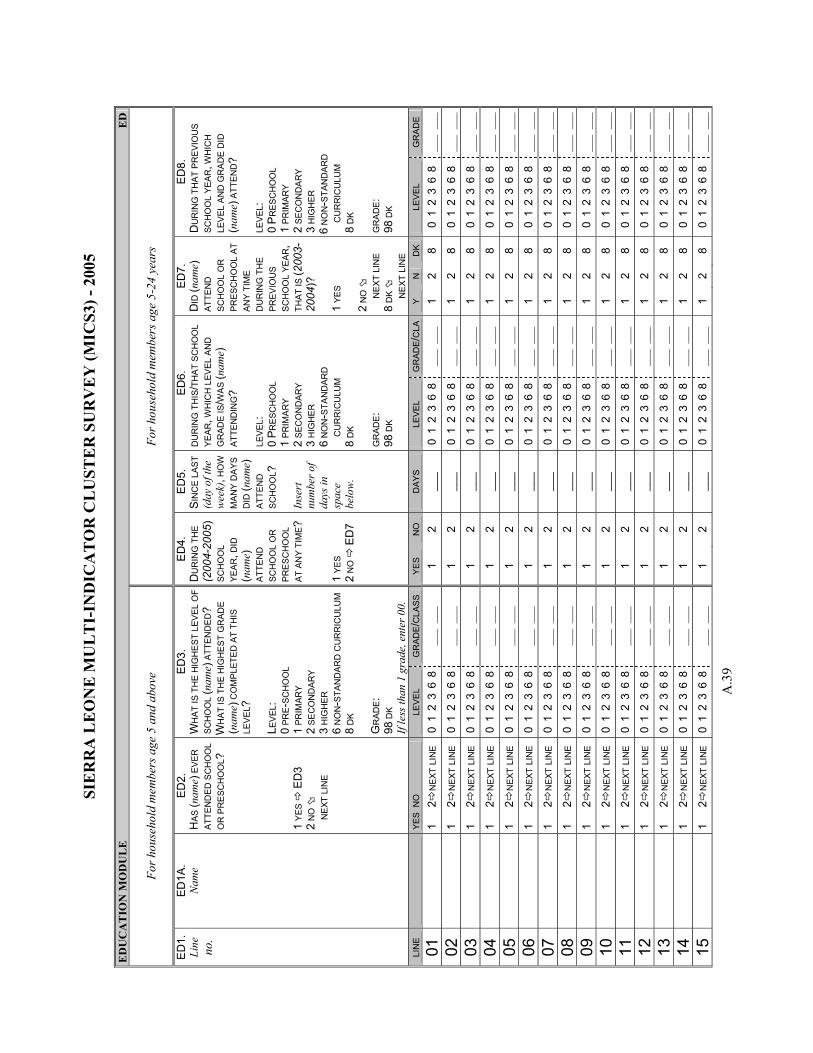
SIE
RR
A L
EO
NE
MU
LT
I-IN
DIC
AT
OR
CL
UST
ER
SU
RV
EY
(MIC
S3) -
200
5
A.3
9
ED
UC
AT
ION
MO
DU
LE
E
D
For h
ouse
hold
mem
bers
age
5 a
nd a
bove
For h
ouse
hold
mem
bers
age
5-2
4 ye
ars
ED
1.
Line
no
.
ED1A
. N
ame
ED2.
H
AS (n
ame)
EVE
R
ATTE
ND
ED S
CH
OO
L O
R P
RE
SCH
OO
L ?
1 Y
ES
ED
3 2
NO
N
EXT
LIN
E
ED
3.
WH
AT
IS T
HE
HIG
HE
ST L
EVEL
OF
SCH
OO
L (n
ame)
ATT
EN
DED
? W
HA
T IS
TH
E H
IGH
EST
GR
AD
E (n
ame)
CO
MP
LETE
D A
T TH
IS
LEV
EL?
L EV
EL:
0 PR
E-S
CH
OO
L 1
PRIM
ARY
2 SE
CO
ND
AR
Y 3
HIG
HER
6
NO
N-S
TAN
DAR
D C
UR
RIC
ULU
M
8 D
K G
RAD
E:
98 D
K If
less
than
1 g
rade
, ent
er 0
0.
ED
4.
DU
RIN
G T
HE
(200
4-20
05)
SCH
OO
L YE
AR, D
ID
(nam
e)
ATTE
ND
SC
HO
OL
OR
PR
ESC
HO
OL
AT A
NY
TIM
E?
1 YE
S 2
NO
E
D7
ED
5.
SIN
CE
LAS
T (d
ay o
f the
w
eek)
, HO
W
MA
NY
DA
YS
DID
(nam
e)
ATTE
ND
S
CH
OO
L ?
Inse
rt
num
ber o
f da
ys in
sp
ace
belo
w.
ED6.
D
UR
ING
TH
IS/T
HAT
SC
HO
OL
YEA
R, W
HIC
H L
EVEL
AN
D
GR
ADE
IS/W
AS
(nam
e)
ATTE
ND
ING
? LE
VEL:
0
PR
ESC
HO
OL
1 PR
IMA
RY
2 SE
CO
ND
ARY
3 H
IGH
ER
6
NO
N-S
TAN
DAR
D
CU
RR
ICU
LUM
8
DK
GR
ADE:
98 D
K
ED7.
D
ID (n
ame)
AT
TEN
D
SCH
OO
L O
R
PRE
SCH
OO
L AT
AN
Y T
IME
DU
RIN
G T
HE
PRE
VIO
US
SCH
OO
L YE
AR,
THAT
IS (2
003-
2004
)?
1 YE
S 2
NO
N
EXT
LIN
E
8 D
K
N
EXT
LIN
E
ED
8.
DU
RIN
G T
HAT
PR
EVIO
US
SCH
OO
L YE
AR
, WH
ICH
LE
VEL
AN
D G
RA
DE
DID
(n
ame)
ATT
END
? LE
VEL
: 0
PR
ESC
HO
OL
1 PR
IMAR
Y 2
SEC
ON
DA
RY
3 H
IGH
ER
6 N
ON
-STA
ND
ARD
C
UR
RIC
ULU
M
8 D
K G
RA
DE:
98
DK
LI
NE
Y
ES N
O
LEVE
L G
RAD
E/C
LASS
Y
ES
NO
D
AYS
LEVE
L G
RAD
E/C
LAY
N
DK
LEVE
L G
RA
DE
01
1
2N
EXT
LIN
E
0 1
2 3
6 8
___
___
1
2 __
_ 0
1 2
3 6
8__
_ _
__
1 2
8 0
1 2
3 6
8
___
___
02
1
2N
EXT
LIN
E
0 1
2 3
6 8
___
___
1
2 __
_ 0
1 2
3 6
8__
_ _
__
1 2
8 0
1 2
3 6
8
___
___
03
1
2N
EXT
LIN
E
0 1
2 3
6 8
___
___
1
2 __
_ 0
1 2
3 6
8__
_ _
__
1 2
8 0
1 2
3 6
8
___
___
04
1
2N
EXT
LIN
E
0 1
2 3
6 8
___
___
1
2 __
_ 0
1 2
3 6
8__
_ _
__
1 2
8 0
1 2
3 6
8
___
___
05
1
2N
EXT
LIN
E
0 1
2 3
6 8
___
___
1
2 __
_ 0
1 2
3 6
8__
_ _
__
1 2
8 0
1 2
3 6
8
___
___
06
1
2N
EXT
LIN
E
0 1
2 3
6 8
___
___
1
2 __
_ 0
1 2
3 6
8__
_ _
__
1 2
8 0
1 2
3 6
8
___
___
07
1
2N
EXT
LIN
E
0 1
2 3
6 8
___
___
1
2 __
_ 0
1 2
3 6
8__
_ _
__
1 2
8 0
1 2
3 6
8
___
___
08
1
2N
EXT
LIN
E
0 1
2 3
6 8
___
___
1
2 __
_ 0
1 2
3 6
8__
_ _
__
1 2
8 0
1 2
3 6
8
___
___
09
1
2N
EXT
LIN
E
0 1
2 3
6 8
___
___
1
2 __
_ 0
1 2
3 6
8__
_ _
__
1 2
8 0
1 2
3 6
8
___
___
10
1
2N
EXT
LIN
E
0 1
2 3
6 8
___
___
1
2 __
_ 0
1 2
3 6
8__
_ _
__
1 2
8 0
1 2
3 6
8
___
___
11
1
2N
EXT
LIN
E
0 1
2 3
6 8
___
___
1
2 __
_ 0
1 2
3 6
8__
_ _
__
1 2
8 0
1 2
3 6
8
___
___
12
1
2N
EXT
LIN
E
0 1
2 3
6 8
___
___
1
2 __
_ 0
1 2
3 6
8__
_ _
__
1 2
8 0
1 2
3 6
8
___
___
13
1
2N
EXT
LIN
E
0 1
2 3
6 8
___
___
1
2 __
_ 0
1 2
3 6
8__
_ _
__
1 2
8 0
1 2
3 6
8
___
___
14
1
2N
EXT
LIN
E
0 1
2 3
6 8
___
___
1
2 __
_ 0
1 2
3 6
8__
_ _
__
1 2
8 0
1 2
3 6
8
___
___
15
1
2N
EXT
LIN
E
0 1
2 3
6 8
___
___
1
2 __
_ 0
1 2
3 6
8__
_ _
__
1 2
8 0
1 2
3 6
8
___
___
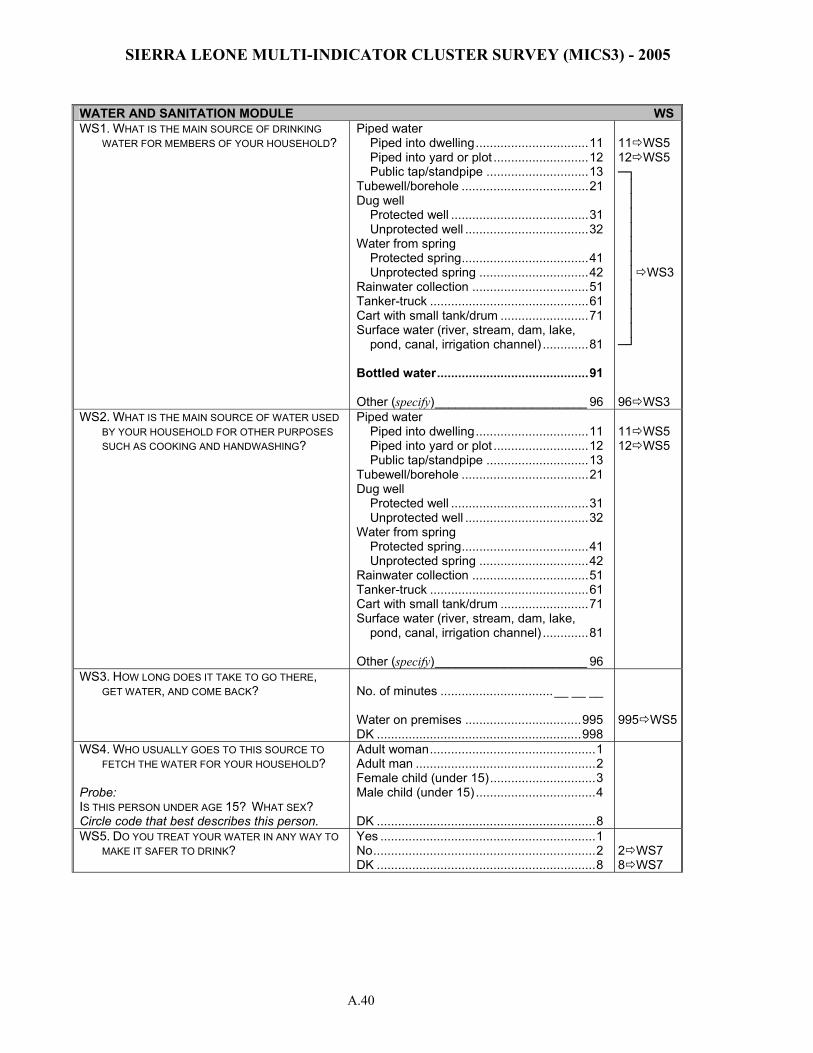
SIERRA LEONE MULTI-INDICATOR CLUSTER SURVEY (MICS3) - 2005
A.40
WATER AND SANITATION MODULE WS WS1. WHAT IS THE MAIN SOURCE OF DRINKING
WATER FOR MEMBERS OF YOUR HOUSEHOLD? Piped water Piped into dwelling................................11 Piped into yard or plot ...........................12 Public tap/standpipe .............................13 Tubewell/borehole ....................................21 Dug well Protected well .......................................31 Unprotected well ...................................32 Water from spring Protected spring....................................41 Unprotected spring ...............................42 Rainwater collection .................................51 Tanker-truck .............................................61 Cart with small tank/drum .........................71 Surface water (river, stream, dam, lake, pond, canal, irrigation channel) .............81 Bottled water...........................................91 Other (specify)______________________ 96
11 WS5 12 WS5 ─┐ │ │ │ │ │ │ │ WS3 │ │ │ │
─┘ 96 WS3
WS2. WHAT IS THE MAIN SOURCE OF WATER USED BY YOUR HOUSEHOLD FOR OTHER PURPOSES SUCH AS COOKING AND HANDWASHING?
Piped water Piped into dwelling................................11 Piped into yard or plot ...........................12 Public tap/standpipe .............................13 Tubewell/borehole ....................................21 Dug well Protected well .......................................31 Unprotected well ...................................32 Water from spring Protected spring....................................41 Unprotected spring ...............................42 Rainwater collection .................................51 Tanker-truck .............................................61 Cart with small tank/drum .........................71 Surface water (river, stream, dam, lake, pond, canal, irrigation channel) .............81 Other (specify)______________________ 96
11 WS5 12 WS5
WS3. HOW LONG DOES IT TAKE TO GO THERE, GET WATER, AND COME BACK?
No. of minutes ................................__ __ __ Water on premises .................................995 DK ..........................................................998
995 WS5
WS4. WHO USUALLY GOES TO THIS SOURCE TO FETCH THE WATER FOR YOUR HOUSEHOLD?
Probe: IS THIS PERSON UNDER AGE 15? WHAT SEX? Circle code that best describes this person.
Adult woman...............................................1 Adult man ...................................................2 Female child (under 15)..............................3 Male child (under 15) ..................................4 DK ..............................................................8
WS5. DO YOU TREAT YOUR WATER IN ANY WAY TO MAKE IT SAFER TO DRINK?
Yes .............................................................1 No...............................................................2 DK ..............................................................8
2 WS7 8 WS7
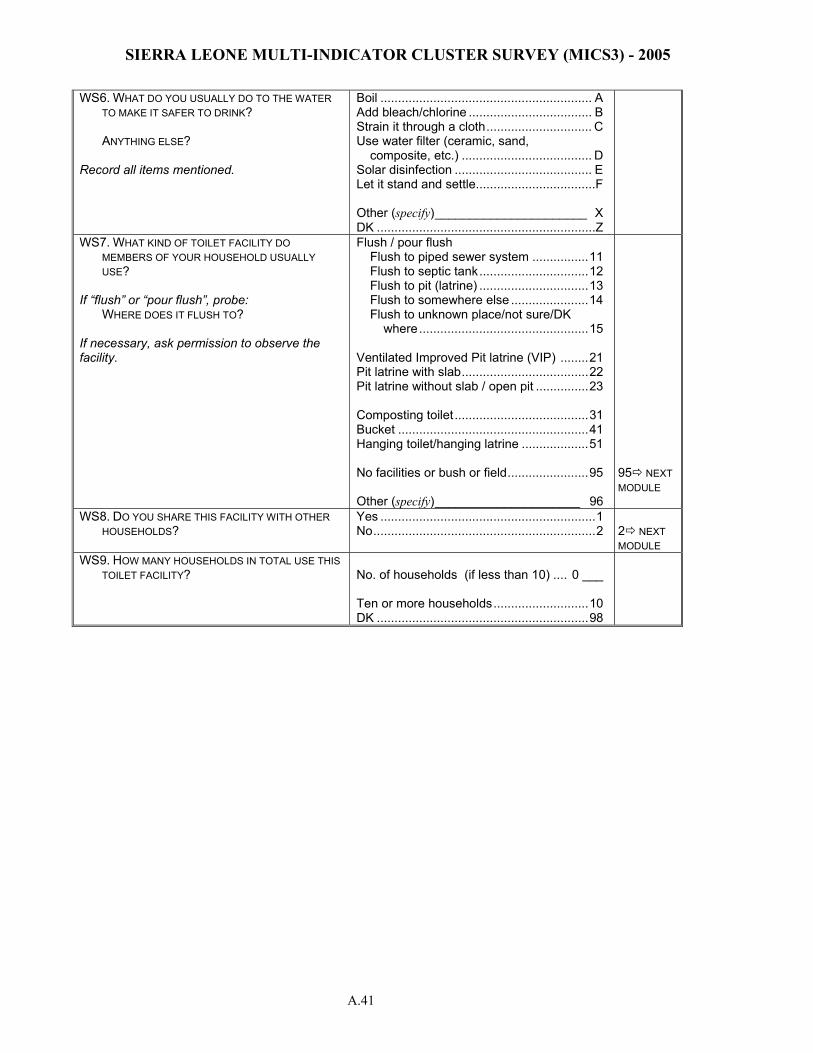
SIERRA LEONE MULTI-INDICATOR CLUSTER SURVEY (MICS3) - 2005
A.41
WS6. WHAT DO YOU USUALLY DO TO THE WATER TO MAKE IT SAFER TO DRINK?
ANYTHING ELSE? Record all items mentioned.
Boil ............................................................ A Add bleach/chlorine ................................... B Strain it through a cloth.............................. C Use water filter (ceramic, sand,
composite, etc.) ..................................... D Solar disinfection ....................................... E Let it stand and settle..................................F Other (specify)______________________ X DK ..............................................................Z
WS7. WHAT KIND OF TOILET FACILITY DO MEMBERS OF YOUR HOUSEHOLD USUALLY USE?
If “flush” or “pour flush”, probe: WHERE DOES IT FLUSH TO? If necessary, ask permission to observe the facility.
Flush / pour flush Flush to piped sewer system ................11 Flush to septic tank...............................12 Flush to pit (latrine) ...............................13 Flush to somewhere else ......................14 Flush to unknown place/not sure/DK
where................................................15 Ventilated Improved Pit latrine (VIP) ........21 Pit latrine with slab....................................22 Pit latrine without slab / open pit ...............23 Composting toilet ......................................31 Bucket ......................................................41 Hanging toilet/hanging latrine ...................51 No facilities or bush or field.......................95 Other (specify)_____________________ 96
95 NEXT MODULE
WS8. DO YOU SHARE THIS FACILITY WITH OTHER HOUSEHOLDS?
Yes .............................................................1 No...............................................................2
2 NEXT MODULE
WS9. HOW MANY HOUSEHOLDS IN TOTAL USE THIS TOILET FACILITY?
No. of households (if less than 10) .... 0 ___ Ten or more households...........................10 DK ............................................................98
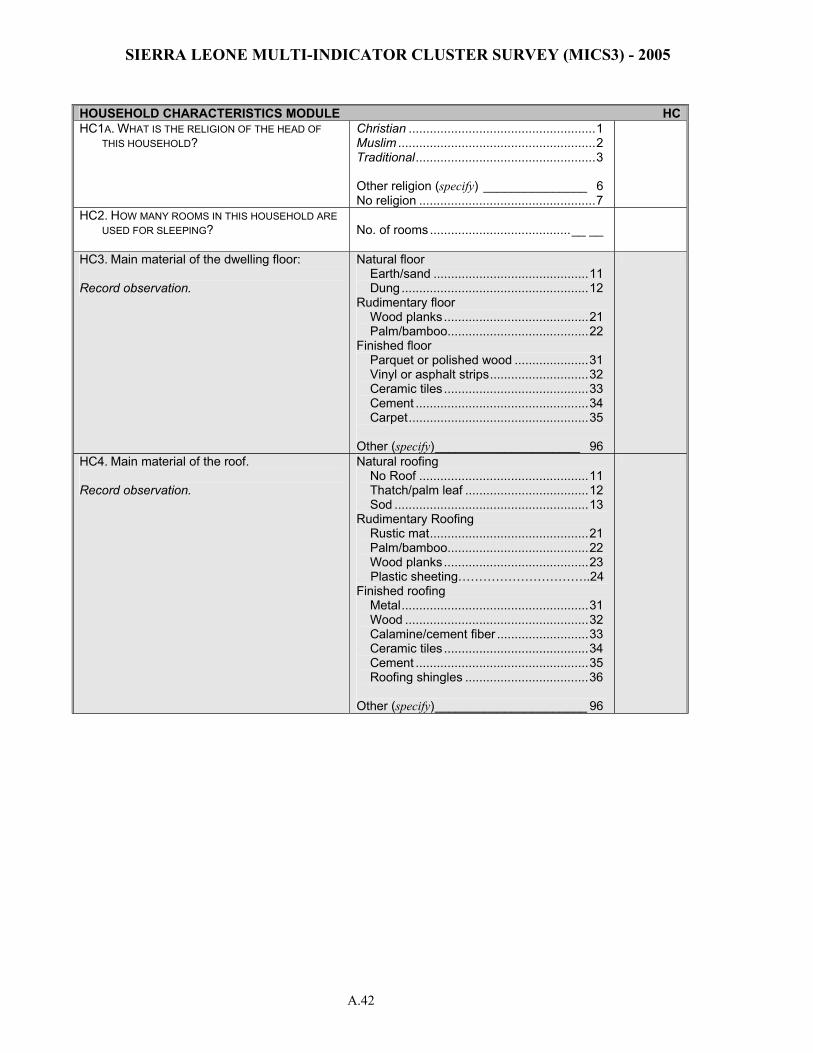
SIERRA LEONE MULTI-INDICATOR CLUSTER SURVEY (MICS3) - 2005
A.42
HOUSEHOLD CHARACTERISTICS MODULE HCHC1A. WHAT IS THE RELIGION OF THE HEAD OF
THIS HOUSEHOLD? Christian .....................................................1 Muslim ........................................................2 Traditional...................................................3 Other religion (specify) _______________ 6 No religion ..................................................7
HC2. HOW MANY ROOMS IN THIS HOUSEHOLD ARE USED FOR SLEEPING?
No. of rooms........................................__ __
HC3. Main material of the dwelling floor: Record observation.
Natural floor Earth/sand ............................................11 Dung .....................................................12 Rudimentary floor Wood planks.........................................21 Palm/bamboo........................................22 Finished floor Parquet or polished wood .....................31 Vinyl or asphalt strips............................32 Ceramic tiles .........................................33 Cement .................................................34 Carpet...................................................35 Other (specify)_____________________ 96
HC4. Main material of the roof. Record observation.
Natural roofing No Roof ................................................11 Thatch/palm leaf ...................................12 Sod .......................................................13 Rudimentary Roofing Rustic mat.............................................21 Palm/bamboo........................................22 Wood planks.........................................23 Plastic sheeting…………………………..24 Finished roofing Metal.....................................................31 Wood ....................................................32 Calamine/cement fiber ..........................33 Ceramic tiles .........................................34 Cement .................................................35 Roofing shingles ...................................36 Other (specify)______________________ 96
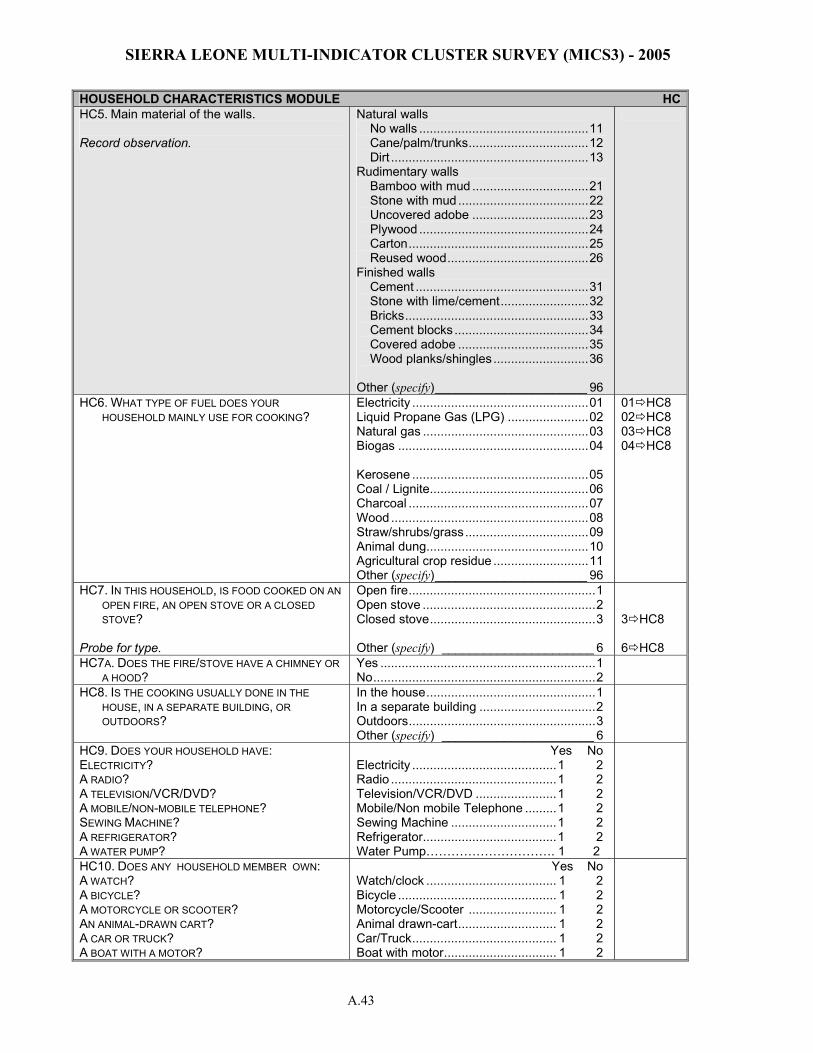
SIERRA LEONE MULTI-INDICATOR CLUSTER SURVEY (MICS3) - 2005
A.43
HOUSEHOLD CHARACTERISTICS MODULE HCHC5. Main material of the walls. Record observation.
Natural walls No walls ................................................11 Cane/palm/trunks..................................12 Dirt ........................................................13 Rudimentary walls Bamboo with mud .................................21 Stone with mud .....................................22 Uncovered adobe .................................23 Plywood ................................................24 Carton...................................................25 Reused wood........................................26 Finished walls Cement .................................................31 Stone with lime/cement.........................32 Bricks....................................................33 Cement blocks ......................................34 Covered adobe .....................................35 Wood planks/shingles ...........................36 Other (specify)______________________ 96
HC6. WHAT TYPE OF FUEL DOES YOUR HOUSEHOLD MAINLY USE FOR COOKING?
Electricity ..................................................01 Liquid Propane Gas (LPG) .......................02 Natural gas ...............................................03 Biogas ......................................................04 Kerosene ..................................................05 Coal / Lignite.............................................06 Charcoal ...................................................07 Wood ........................................................08 Straw/shrubs/grass...................................09 Animal dung..............................................10 Agricultural crop residue ...........................11 Other (specify)______________________ 96
01 HC8 02 HC8 03 HC8 04 HC8
HC7. IN THIS HOUSEHOLD, IS FOOD COOKED ON AN OPEN FIRE, AN OPEN STOVE OR A CLOSED STOVE?
Probe for type.
Open fire.....................................................1 Open stove .................................................2 Closed stove...............................................3 Other (specify) ______________________ 6
3 HC8 6 HC8
HC7A. DOES THE FIRE/STOVE HAVE A CHIMNEY OR A HOOD?
Yes .............................................................1 No...............................................................2
HC8. IS THE COOKING USUALLY DONE IN THE HOUSE, IN A SEPARATE BUILDING, OR OUTDOORS?
In the house................................................1 In a separate building .................................2 Outdoors.....................................................3 Other (specify) ______________________ 6
HC9. DOES YOUR HOUSEHOLD HAVE: ELECTRICITY? A RADIO? A TELEVISION/VCR/DVD? A MOBILE/NON-MOBILE TELEPHONE? SEWING MACHINE? A REFRIGERATOR? A WATER PUMP?
Yes No Electricity .........................................1 2 Radio ...............................................1 2 Television/VCR/DVD .......................1 2 Mobile/Non mobile Telephone .........1 2 Sewing Machine ..............................1 2 Refrigerator......................................1 2 Water Pump…………………………. 1 2
HC10. DOES ANY HOUSEHOLD MEMBER OWN: A WATCH? A BICYCLE? A MOTORCYCLE OR SCOOTER? AN ANIMAL-DRAWN CART? A CAR OR TRUCK? A BOAT WITH A MOTOR?
Yes No Watch/clock ..................................... 1 2 Bicycle ............................................. 1 2 Motorcycle/Scooter ......................... 1 2 Animal drawn-cart............................ 1 2 Car/Truck......................................... 1 2 Boat with motor................................ 1 2
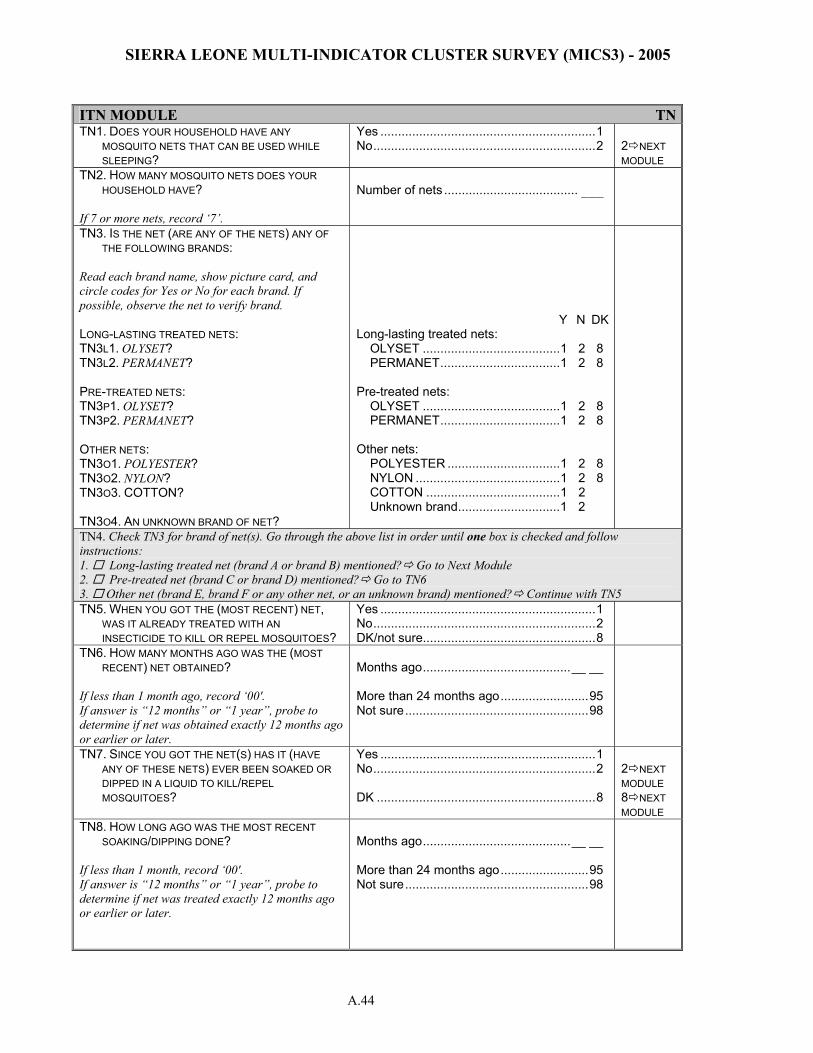
SIERRA LEONE MULTI-INDICATOR CLUSTER SURVEY (MICS3) - 2005
A.44
ITN MODULE TNTN1. DOES YOUR HOUSEHOLD HAVE ANY
MOSQUITO NETS THAT CAN BE USED WHILE SLEEPING?
Yes .............................................................1 No...............................................................2
2 NEXT MODULE
TN2. HOW MANY MOSQUITO NETS DOES YOUR HOUSEHOLD HAVE?
If 7 or more nets, record ‘7’.
Number of nets ...................................... ___
TN3. IS THE NET (ARE ANY OF THE NETS) ANY OF THE FOLLOWING BRANDS:
Read each brand name, show picture card, and circle codes for Yes or No for each brand. If possible, observe the net to verify brand. LONG-LASTING TREATED NETS: TN3L1. OLYSET? TN3L2. PERMANET? PRE-TREATED NETS: TN3P1. OLYSET? TN3P2. PERMANET? OTHER NETS: TN3O1. POLYESTER? TN3O2. NYLON? TN3O3. COTTON? TN3O4. AN UNKNOWN BRAND OF NET?
Y N DK Long-lasting treated nets: OLYSET .......................................1 2 8 PERMANET..................................1 2 8 Pre-treated nets: OLYSET .......................................1 2 8 PERMANET..................................1 2 8 Other nets: POLYESTER ................................1 2 8 NYLON .........................................1 2 8 COTTON ......................................1 2 Unknown brand.............................1 2
TN4. Check TN3 for brand of net(s). Go through the above list in order until one box is checked and follow instructions: 1. Long-lasting treated net (brand A or brand B) mentioned? Go to Next Module 2. Pre-treated net (brand C or brand D) mentioned? Go to TN6 3. Other net (brand E, brand F or any other net, or an unknown brand) mentioned? Continue with TN5 TN5. WHEN YOU GOT THE (MOST RECENT) NET,
WAS IT ALREADY TREATED WITH AN INSECTICIDE TO KILL OR REPEL MOSQUITOES?
Yes .............................................................1 No...............................................................2 DK/not sure.................................................8
TN6. HOW MANY MONTHS AGO WAS THE (MOST RECENT) NET OBTAINED?
If less than 1 month ago, record ‘00'. If answer is “12 months” or “1 year”, probe to determine if net was obtained exactly 12 months ago or earlier or later.
Months ago..........................................__ __ More than 24 months ago.........................95 Not sure....................................................98
TN7. SINCE YOU GOT THE NET(S) HAS IT (HAVE ANY OF THESE NETS) EVER BEEN SOAKED OR DIPPED IN A LIQUID TO KILL/REPEL MOSQUITOES?
Yes .............................................................1 No...............................................................2 DK ..............................................................8
2 NEXT MODULE 8 NEXT MODULE
TN8. HOW LONG AGO WAS THE MOST RECENT SOAKING/DIPPING DONE?
If less than 1 month, record ‘00'. If answer is “12 months” or “1 year”, probe to determine if net was treated exactly 12 months ago or earlier or later.
Months ago..........................................__ __ More than 24 months ago.........................95 Not sure....................................................98
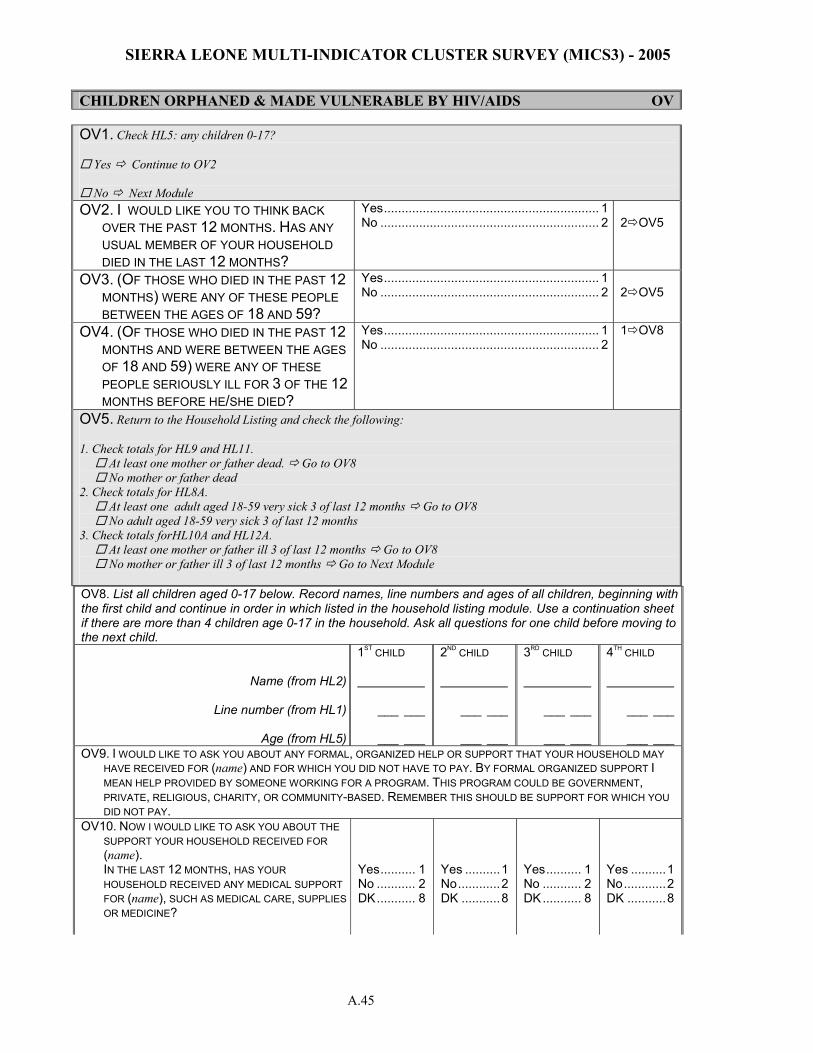
SIERRA LEONE MULTI-INDICATOR CLUSTER SURVEY (MICS3) - 2005
A.45
CHILDREN ORPHANED & MADE VULNERABLE BY HIV/AIDS OV
OV8. List all children aged 0-17 below. Record names, line numbers and ages of all children, beginning with the first child and continue in order in which listed in the household listing module. Use a continuation sheet if there are more than 4 children age 0-17 in the household. Ask all questions for one child before moving to the next child.
Name (from HL2)
Line number (from HL1)
Age (from HL5)
1ST CHILD ___ ___ ___ ___
2ND CHILD ___ ___ ___ ___
3RD CHILD ___ ___ ___ ___
4TH CHILD ___ ___ ___ ___
OV9. I WOULD LIKE TO ASK YOU ABOUT ANY FORMAL, ORGANIZED HELP OR SUPPORT THAT YOUR HOUSEHOLD MAY HAVE RECEIVED FOR (name) AND FOR WHICH YOU DID NOT HAVE TO PAY. BY FORMAL ORGANIZED SUPPORT I MEAN HELP PROVIDED BY SOMEONE WORKING FOR A PROGRAM. THIS PROGRAM COULD BE GOVERNMENT, PRIVATE, RELIGIOUS, CHARITY, OR COMMUNITY-BASED. REMEMBER THIS SHOULD BE SUPPORT FOR WHICH YOU DID NOT PAY.
OV10. NOW I WOULD LIKE TO ASK YOU ABOUT THE SUPPORT YOUR HOUSEHOLD RECEIVED FOR (name).
IN THE LAST 12 MONTHS, HAS YOUR HOUSEHOLD RECEIVED ANY MEDICAL SUPPORT FOR (name), SUCH AS MEDICAL CARE, SUPPLIES OR MEDICINE?
Yes.......... 1 No ........... 2 DK........... 8
Yes ..........1 No............2 DK ...........8
Yes.......... 1 No ........... 2 DK........... 8
Yes ..........1 No............2 DK ...........8
OV1. Check HL5: any children 0-17?
Yes Continue to OV2
No Next Module OV2. I WOULD LIKE YOU TO THINK BACK
OVER THE PAST 12 MONTHS. HAS ANY USUAL MEMBER OF YOUR HOUSEHOLD DIED IN THE LAST 12 MONTHS?
Yes............................................................. 1 No .............................................................. 2
2 OV5
OV3. (OF THOSE WHO DIED IN THE PAST 12 MONTHS) WERE ANY OF THESE PEOPLE BETWEEN THE AGES OF 18 AND 59?
Yes............................................................. 1 No .............................................................. 2
2 OV5
OV4. (OF THOSE WHO DIED IN THE PAST 12 MONTHS AND WERE BETWEEN THE AGES OF 18 AND 59) WERE ANY OF THESE PEOPLE SERIOUSLY ILL FOR 3 OF THE 12 MONTHS BEFORE HE/SHE DIED?
Yes............................................................. 1 No .............................................................. 2
1 OV8
OV5. Return to the Household Listing and check the following: 1. Check totals for HL9 and HL11. At least one mother or father dead. Go to OV8 No mother or father dead 2. Check totals for HL8A. At least one adult aged 18-59 very sick 3 of last 12 months Go to OV8 No adult aged 18-59 very sick 3 of last 12 months 3. Check totals forHL10A and HL12A. At least one mother or father ill 3 of last 12 months Go to OV8 No mother or father ill 3 of last 12 months Go to Next Module
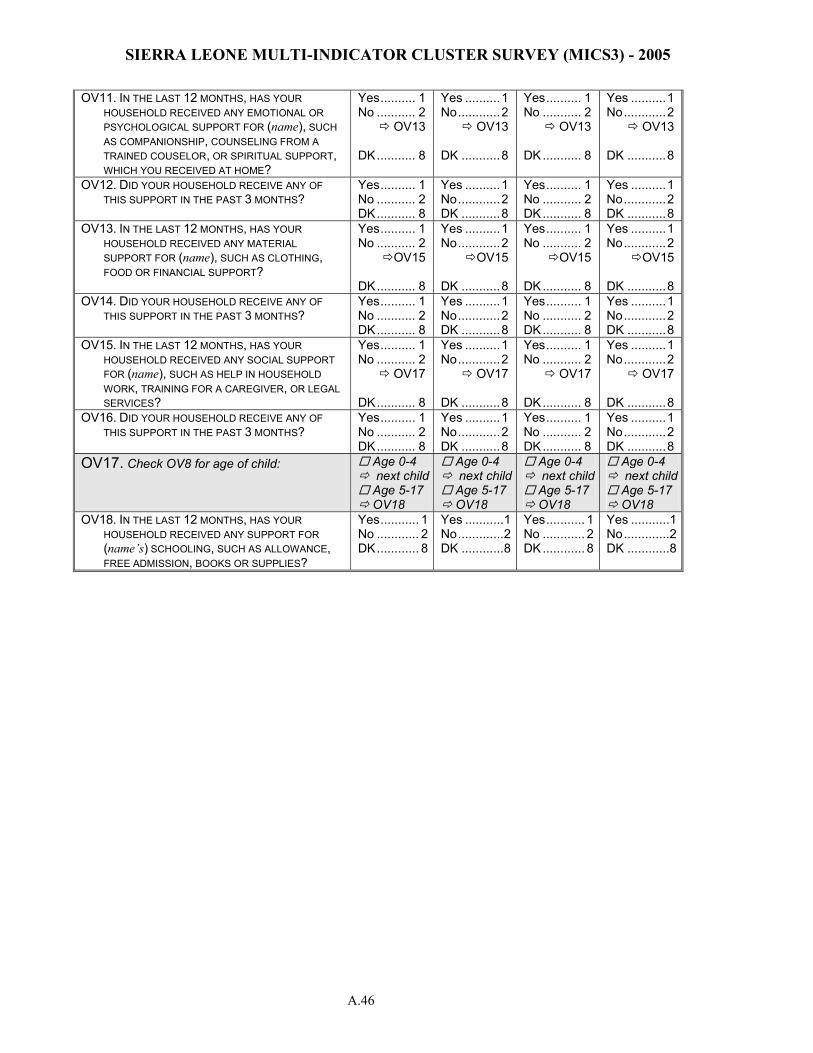
SIERRA LEONE MULTI-INDICATOR CLUSTER SURVEY (MICS3) - 2005
A.46
OV11. IN THE LAST 12 MONTHS, HAS YOUR HOUSEHOLD RECEIVED ANY EMOTIONAL OR PSYCHOLOGICAL SUPPORT FOR (name), SUCH AS COMPANIONSHIP, COUNSELING FROM A TRAINED COUSELOR, OR SPIRITUAL SUPPORT, WHICH YOU RECEIVED AT HOME?
Yes.......... 1 No ........... 2 OV13 DK........... 8
Yes ..........1 No............2 OV13 DK ...........8
Yes.......... 1 No ........... 2 OV13 DK........... 8
Yes ..........1 No............2 OV13 DK ...........8
OV12. DID YOUR HOUSEHOLD RECEIVE ANY OF THIS SUPPORT IN THE PAST 3 MONTHS?
Yes.......... 1 No ........... 2 DK........... 8
Yes ..........1 No............2 DK ...........8
Yes.......... 1 No ........... 2 DK........... 8
Yes ..........1 No............2 DK ...........8
OV13. IN THE LAST 12 MONTHS, HAS YOUR HOUSEHOLD RECEIVED ANY MATERIAL SUPPORT FOR (name), SUCH AS CLOTHING, FOOD OR FINANCIAL SUPPORT?
Yes.......... 1 No ........... 2 OV15 DK........... 8
Yes ..........1 No............2 OV15 DK ...........8
Yes.......... 1 No ........... 2 OV15 DK........... 8
Yes ..........1 No............2 OV15 DK ...........8
OV14. DID YOUR HOUSEHOLD RECEIVE ANY OF THIS SUPPORT IN THE PAST 3 MONTHS?
Yes.......... 1 No ........... 2 DK........... 8
Yes ..........1 No............2 DK ...........8
Yes.......... 1 No ........... 2 DK........... 8
Yes ..........1 No............2 DK ...........8
OV15. IN THE LAST 12 MONTHS, HAS YOUR HOUSEHOLD RECEIVED ANY SOCIAL SUPPORT FOR (name), SUCH AS HELP IN HOUSEHOLD WORK, TRAINING FOR A CAREGIVER, OR LEGAL SERVICES?
Yes.......... 1 No ........... 2 OV17 DK........... 8
Yes ..........1 No............2 OV17 DK ...........8
Yes.......... 1 No ........... 2 OV17 DK........... 8
Yes ..........1 No............2 OV17 DK ...........8
OV16. DID YOUR HOUSEHOLD RECEIVE ANY OF THIS SUPPORT IN THE PAST 3 MONTHS?
Yes.......... 1 No ........... 2 DK........... 8
Yes ..........1 No............2 DK ...........8
Yes.......... 1 No ........... 2 DK........... 8
Yes ..........1 No............2 DK ...........8
OV17. Check OV8 for age of child: Age 0-4 next child Age 5-17 OV18
Age 0-4 next child Age 5-17 OV18
Age 0-4 next child Age 5-17 OV18
Age 0-4 next child Age 5-17 OV18
OV18. IN THE LAST 12 MONTHS, HAS YOUR HOUSEHOLD RECEIVED ANY SUPPORT FOR (name’s) SCHOOLING, SUCH AS ALLOWANCE, FREE ADMISSION, BOOKS OR SUPPLIES?
Yes........... 1No ............ 2DK............ 8
Yes ...........1No.............2DK ............8
Yes........... 1 No ............ 2 DK............ 8
Yes ...........1No.............2DK ............8
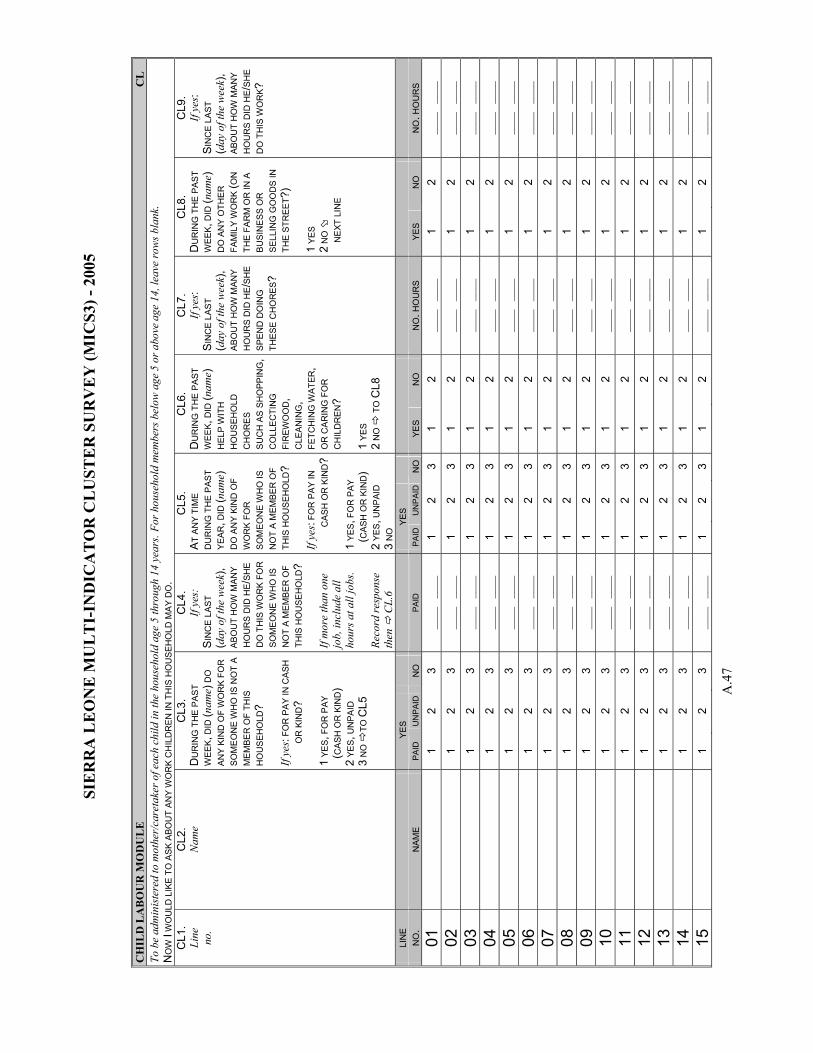
SIE
RR
A L
EO
NE
MU
LT
I-IN
DIC
AT
OR
CL
UST
ER
SU
RV
EY
(MIC
S3) -
200
5
A.4
7
CH
ILD
LA
BO
UR
MO
DU
LE
C
L
To b
e ad
min
iste
red
to m
othe
r/ca
reta
ker o
f eac
h ch
ild in
the
hous
ehol
d ag
e 5
thro
ugh
14 y
ears
. For
hou
seho
ld m
embe
rs b
elow
age
5 o
r abo
ve a
ge 1
4, le
ave
row
s bla
nk.
NO
W I
WO
ULD
LIK
E T
O A
SK A
BOU
T AN
Y W
OR
K C
HIL
DR
EN IN
TH
IS H
OU
SEH
OLD
MA
Y D
O.
CL1
. Li
ne
no.
CL2
. N
ame
CL3
. D
UR
ING
TH
E PA
ST
WEE
K, D
ID (n
ame)
DO
AN
Y K
IND
OF
WO
RK
FOR
SO
ME
ON
E W
HO
IS N
OT
A M
EM
BER
OF
THIS
H
OU
SEH
OLD
? If
yes:
FOR
PA
Y IN
CA
SH
OR
KIN
D?
1 YE
S, F
OR
PAY
(CA
SH O
R K
IND
) 2
YES,
UN
PAID
3
NO
TO
CL5
CL4
. If
yes:
S
INC
E L
AST
(day
of t
he w
eek)
, AB
OU
T H
OW
MAN
Y
HO
UR
S D
ID H
E /SH
E
DO
TH
IS W
OR
K FO
R
SOM
EON
E W
HO
IS
NO
T A
MEM
BER
OF
THIS
HO
USE
HO
LD?
If m
ore
than
one
jo
b, in
clud
e al
l ho
urs a
t all
jobs
. Re
cord
resp
onse
th
en
CL.
6
CL5
. A
T A
NY
TIM
E D
UR
ING
TH
E P
AST
YEA
R, D
ID (n
ame)
D
O A
NY
KIN
D O
F W
OR
K FO
R
SO
MEO
NE
WH
O IS
N
OT
A M
EMB
ER O
F TH
IS H
OU
SEH
OLD
? If
yes:
FOR
PAY
IN
CAS
H O
R K
IND
? 1
YES, F
OR
PAY
(CAS
H O
R K
IND
) 2
YES, U
NP
AID
3
NO
CL6
. D
UR
ING
TH
E PA
ST
WEE
K, D
ID (n
ame)
H
ELP
WIT
H
HO
US
EHO
LD
CH
OR
ES
SU
CH
AS
SH
OPP
ING
,C
OLL
EC
TIN
G
FIR
EWO
OD
, C
LEAN
ING
, FE
TCH
ING
WAT
ER,
OR
CA
RIN
G F
OR
C
HIL
DR
EN?
1 YE
S
2 N
O
TO
CL8
CL7
. If
yes:
SIN
CE
LAST
(d
ay o
f the
wee
k),
ABO
UT
HO
W M
ANY
HO
UR
S D
ID H
E/S
HE
SPEN
D D
OIN
G
THES
E C
HO
RES
?
CL8
. D
UR
ING
TH
E PA
ST
WEE
K, D
ID (n
ame)
D
O A
NY
OTH
ER
FA
MIL
Y W
OR
K (O
N
THE
FAR
M O
R IN
A
BU
SIN
ESS
OR
S
ELLI
NG
GO
OD
S IN
TH
E ST
REE
T ?)
1 Y
ES
2 N
O
NE
XT L
INE
CL9
. If
yes:
SIN
CE
LAST
(d
ay o
f the
wee
k),
ABO
UT
HO
W M
AN
Y H
OU
RS
DID
HE /
SHE
D
O T
HIS
WO
RK ?
LIN
E
YE
S
Y
ES
N
O.
NAM
E
PAID
U
NP
AID
NO
PA
ID
PAI
D
UN
PA
IDN
O
YES
NO
N
O. H
OU
RS
YES
NO
N
O. H
OU
RS
01
1
2 3
____
__
__
1 2
3 1
2 __
__
____
1
2 __
__
____
02
1
2 3
____
__
__
1 2
3 1
2 __
__
____
1
2 __
__
____
03
1
2 3
____
__
__
1 2
3 1
2 __
__
____
1
2 __
__
____
04
1
2 3
____
__
__
1 2
3 1
2 __
__
____
1
2 __
__
____
05
1
2 3
____
__
__
1 2
3 1
2 __
__
____
1
2 __
__
____
06
1
2 3
____
__
__
1 2
3 1
2 __
__
____
1
2 __
__
____
07
1
2 3
____
__
__
1 2
3 1
2 __
__
____
1
2 __
__
____
08
1
2 3
____
__
__
1 2
3 1
2 __
__
____
1
2 __
__
____
09
1
2 3
____
__
__
1 2
3 1
2 __
__
____
1
2 __
__
____
10
1
2 3
____
__
__
1 2
3 1
2 __
__
____
1
2 __
__
____
11
1
2 3
____
__
__
1 2
3 1
2 __
__
____
1
2 __
__
____
12
1
2 3
____
__
__
1 2
3 1
2 __
__
____
1
2 __
__
____
13
1
2 3
____
__
__
1 2
3 1
2 __
__
____
1
2 __
__
____
14
1
2 3
____
__
__
1 2
3 1
2 __
__
____
1
2 __
__
____
15
1
2 3
____
__
__
1 2
3 1
2 __
__
____
1
2 __
__
____
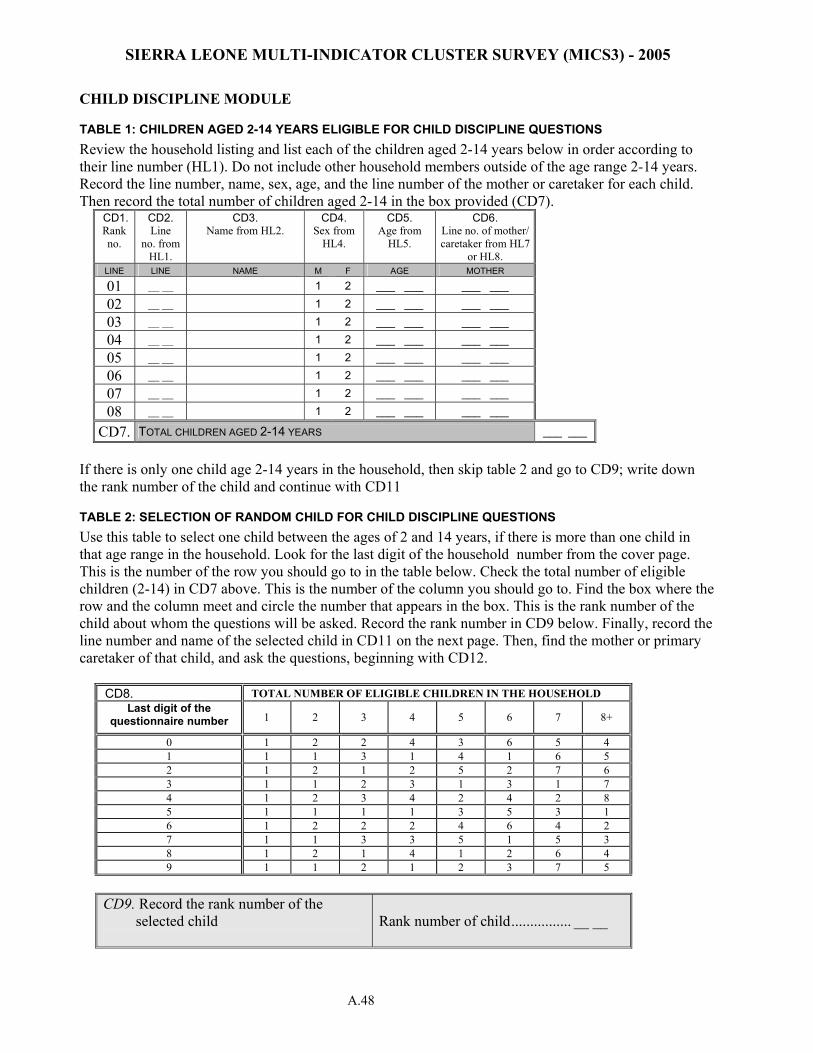
SIERRA LEONE MULTI-INDICATOR CLUSTER SURVEY (MICS3) - 2005
A.48
CHILD DISCIPLINE MODULE
TABLE 1: CHILDREN AGED 2-14 YEARS ELIGIBLE FOR CHILD DISCIPLINE QUESTIONS Review the household listing and list each of the children aged 2-14 years below in order according to their line number (HL1). Do not include other household members outside of the age range 2-14 years. Record the line number, name, sex, age, and the line number of the mother or caretaker for each child. Then record the total number of children aged 2-14 in the box provided (CD7).
CD1. Rank no.
CD2. Line
no. from HL1.
CD3. Name from HL2.
CD4. Sex from
HL4.
CD5. Age from
HL5.
CD6. Line no. of mother/ caretaker from HL7
or HL8. LINE LINE NAME M F AGE MOTHER 01 __ __ 1 2 ___ ___ ___ ___
02 __ __ 1 2 ___ ___ ___ ___
03 __ __ 1 2 ___ ___ ___ ___
04 __ __ 1 2 ___ ___ ___ ___
05 __ __ 1 2 ___ ___ ___ ___
06 __ __ 1 2 ___ ___ ___ ___
07 __ __ 1 2 ___ ___ ___ ___
08 __ __ 1 2 ___ ___ ___ ___
CD7. TOTAL CHILDREN AGED 2-14 YEARS ___ ___
If there is only one child age 2-14 years in the household, then skip table 2 and go to CD9; write down the rank number of the child and continue with CD11
TABLE 2: SELECTION OF RANDOM CHILD FOR CHILD DISCIPLINE QUESTIONS Use this table to select one child between the ages of 2 and 14 years, if there is more than one child in that age range in the household. Look for the last digit of the household number from the cover page. This is the number of the row you should go to in the table below. Check the total number of eligible children (2-14) in CD7 above. This is the number of the column you should go to. Find the box where the row and the column meet and circle the number that appears in the box. This is the rank number of the child about whom the questions will be asked. Record the rank number in CD9 below. Finally, record the line number and name of the selected child in CD11 on the next page. Then, find the mother or primary caretaker of that child, and ask the questions, beginning with CD12.
CD8. TOTAL NUMBER OF ELIGIBLE CHILDREN IN THE HOUSEHOLD Last digit of the
questionnaire number 1 2 3 4 5 6 7 8+
0 1 2 2 4 3 6 5 4 1 1 1 3 1 4 1 6 5 2 1 2 1 2 5 2 7 6 3 1 1 2 3 1 3 1 7 4 1 2 3 4 2 4 2 8 5 1 1 1 1 3 5 3 1 6 1 2 2 2 4 6 4 2 7 1 1 3 3 5 1 5 3 8 1 2 1 4 1 2 6 4 9 1 1 2 1 2 3 7 5
CD9. Record the rank number of the
selected child
Rank number of child................ __ __
SIERRA LEONE MULTI-INDICATOR CLUSTER SURVEY (MICS3) - 2005
A.49
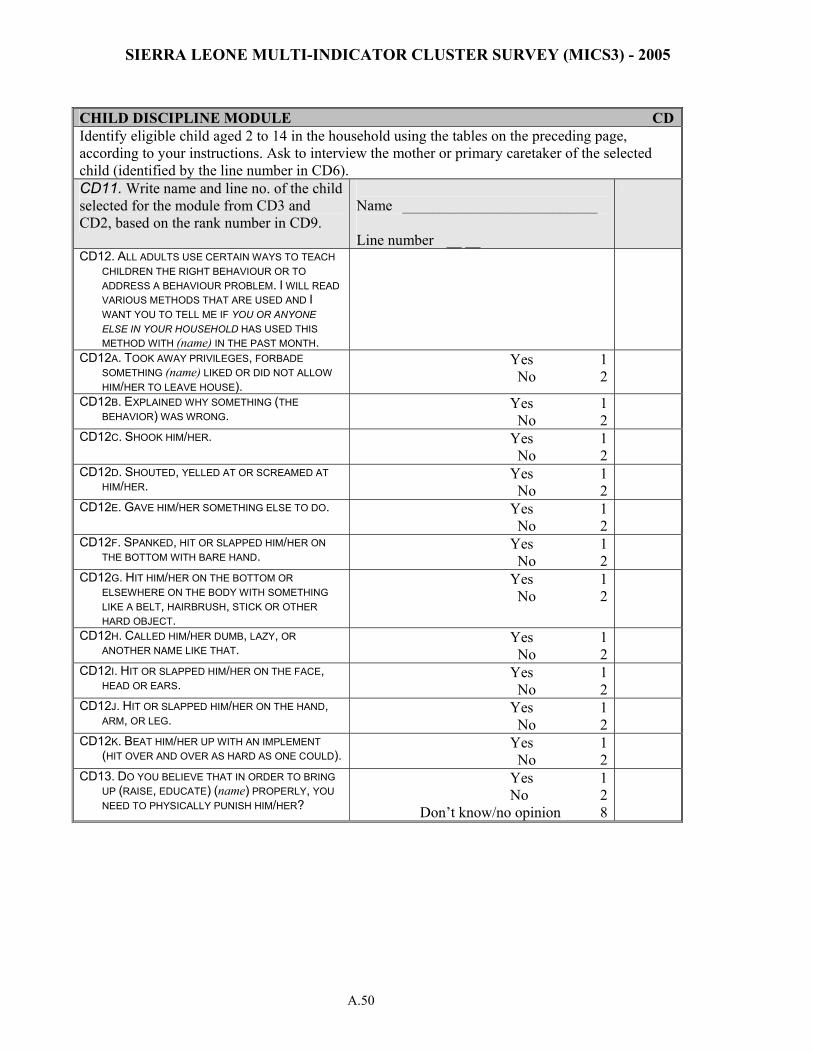
SIERRA LEONE MULTI-INDICATOR CLUSTER SURVEY (MICS3) - 2005
A.50
CHILD DISCIPLINE MODULE CDIdentify eligible child aged 2 to 14 in the household using the tables on the preceding page, according to your instructions. Ask to interview the mother or primary caretaker of the selected child (identified by the line number in CD6). CD11. Write name and line no. of the child selected for the module from CD3 and CD2, based on the rank number in CD9.
Name __________________________ Line number __ __
CD12. ALL ADULTS USE CERTAIN WAYS TO TEACH CHILDREN THE RIGHT BEHAVIOUR OR TO ADDRESS A BEHAVIOUR PROBLEM. I WILL READ VARIOUS METHODS THAT ARE USED AND I WANT YOU TO TELL ME IF YOU OR ANYONE ELSE IN YOUR HOUSEHOLD HAS USED THIS METHOD WITH (name) IN THE PAST MONTH.
CD12A. TOOK AWAY PRIVILEGES, FORBADE SOMETHING (name) LIKED OR DID NOT ALLOW HIM/HER TO LEAVE HOUSE).
Yes 1 No 2
CD12B. EXPLAINED WHY SOMETHING (THE BEHAVIOR) WAS WRONG.
Yes 1 No 2
CD12C. SHOOK HIM/HER. Yes 1 No 2
CD12D. SHOUTED, YELLED AT OR SCREAMED AT HIM/HER.
Yes 1 No 2
CD12E. GAVE HIM/HER SOMETHING ELSE TO DO. Yes 1 No 2
CD12F. SPANKED, HIT OR SLAPPED HIM/HER ON THE BOTTOM WITH BARE HAND.
Yes 1 No 2
CD12G. HIT HIM/HER ON THE BOTTOM OR ELSEWHERE ON THE BODY WITH SOMETHING LIKE A BELT, HAIRBRUSH, STICK OR OTHER HARD OBJECT.
Yes 1 No 2
CD12H. CALLED HIM/HER DUMB, LAZY, OR ANOTHER NAME LIKE THAT.
Yes 1 No 2
CD12I. HIT OR SLAPPED HIM/HER ON THE FACE, HEAD OR EARS.
Yes 1 No 2
CD12J. HIT OR SLAPPED HIM/HER ON THE HAND, ARM, OR LEG.
Yes 1 No 2
CD12K. BEAT HIM/HER UP WITH AN IMPLEMENT (HIT OVER AND OVER AS HARD AS ONE COULD).
Yes 1 No 2
CD13. DO YOU BELIEVE THAT IN ORDER TO BRING UP (RAISE, EDUCATE) (name) PROPERLY, YOU NEED TO PHYSICALLY PUNISH HIM/HER?
Yes 1 No 2
Don’t know/no opinion 8
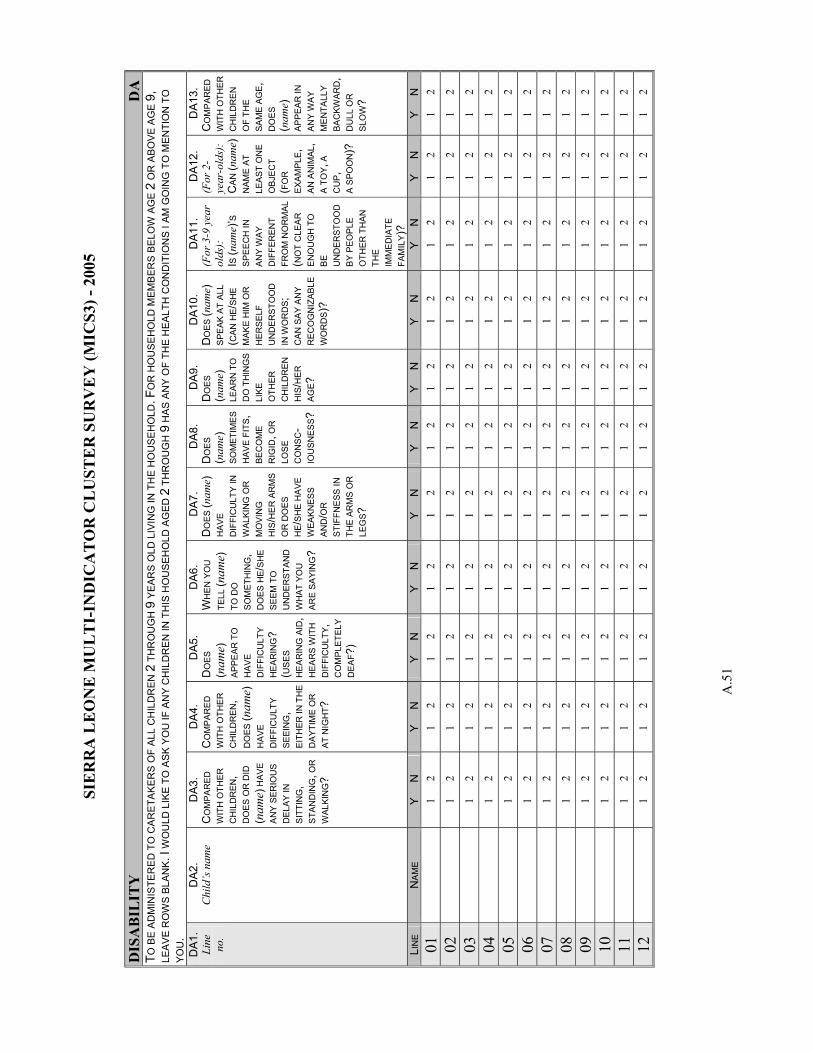
SIE
RR
A L
EO
NE
MU
LT
I-IN
DIC
AT
OR
CL
UST
ER
SU
RV
EY
(MIC
S3) -
200
5
A.5
1
DIS
AB
ILIT
Y
DA
TO
BE
AD
MIN
ISTE
RED
TO
CA
RET
AK
ERS
OF
ALL
CH
ILD
REN
2 T
HR
OU
GH
9 Y
EAR
S O
LD L
IVIN
G IN
TH
E H
OU
SEH
OLD
. FO
R H
OU
SEH
OLD
MEM
BER
S B
ELO
W A
GE
2 O
R A
BO
VE A
GE
9,
LEA
VE
RO
WS
BLAN
K. I
WO
ULD
LIK
E TO
ASK
YO
U IF
AN
Y C
HIL
DR
EN IN
TH
IS H
OU
SEH
OLD
AG
ED 2
TH
RO
UG
H 9
HA
S AN
Y O
F TH
E H
EALT
H C
ON
DIT
ION
S I A
M G
OIN
G T
O M
ENTI
ON
TO
YO
U.
DA
1.
Line
no
.
DA
2.
Chi
ld’s
nam
e
DA
3.
CO
MPA
RED
W
ITH
OTH
ER
C
HIL
DR
EN,
DO
ES O
R D
ID
(nam
e) H
AVE
AN
Y S
ERIO
US
DE
LAY
IN
SIT
TIN
G,
STA
ND
ING
, OR
W
ALKI
NG
?
DA
4.
CO
MP
ARE
D
WIT
H O
THER
C
HIL
DR
EN
, D
OES
(nam
e)
HAV
E D
IFFI
CU
LTY
SEEI
NG
, EI
THER
IN T
HE
DAY
TIM
E O
R
AT N
IGH
T ?
DA
5.
DO
ES
(nam
e)
APP
EAR
TO
H
AVE
D
IFFI
CU
LTY
HE
ARIN
G?
(US
ES
HE
ARIN
G A
ID,
HE
ARS
WIT
H
DIF
FIC
ULT
Y ,
CO
MP
LETE
LY
DE
AF?)
DA6
. W
HEN
YO
U
TELL
(nam
e)
TO D
O
SOM
ETH
ING
, D
OES
HE /
SHE
SEEM
TO
U
ND
ER
STAN
D
WH
AT Y
OU
AR
E SA
YIN
G?
DA
7.
DO
ES (n
ame)
H
AVE
D
IFFI
CU
LTY
IN
WAL
KIN
G O
R
MO
VIN
G
HIS
/HE
R A
RM
S O
R D
OES
H
E/S
HE
HA
VE
WEA
KNES
S A
ND
/OR
ST
IFFN
ESS
IN
THE
AR
MS
OR
LE
GS ?
DA8
. D
OES
(n
ame)
SO
MET
IME
S H
AVE
FITS
, BE
CO
ME
R
IGID
, OR
LO
SE
CO
NS
C-
IOU
SN
ESS?
DA
9.
DO
ES
(nam
e)
LEA
RN
TO
D
O T
HIN
GS
LI
KE
OTH
ER
C
HIL
DR
EN
H
IS/H
ER
AGE ?
DA
10.
DO
ES (n
ame)
SP
EAK
AT
ALL
(CAN
HE/
SHE
M
AKE
HIM
OR
H
ERSE
LF
UN
DER
STO
OD
IN
WO
RD
S ;
CAN
SA
Y A
NY
REC
OG
NIZ
ABLE
W
OR
DS )
?
DA
11.
(For
3-9
yea
r ol
ds):
I S
(nam
e)’S
S
PEEC
H IN
A
NY
WAY
D
IFFE
RE
NT
FRO
M N
OR
MAL
(N
OT
CLE
AR
E
NO
UG
H T
O
BE
UN
DE
RST
OO
D
BY
PEO
PLE
OTH
ER T
HAN
TH
E
IMM
EDIA
TE
FAM
ILY )
?
DA
12.
(For
2-
year
-old
s):
CA
N (n
ame)
N
AME
AT
LEA
ST O
NE
OB
JEC
T (F
OR
EX
AMP
LE,
AN A
NIM
AL,
A TO
Y , A
C
UP ,
A
SPO
ON
)?
DA
13.
CO
MP
ARE
D
WIT
H O
THER
C
HIL
DR
EN
O
F TH
E SA
ME
AG
E,
DO
ES
(nam
e)
APPE
AR
IN
ANY
WA
Y M
EN
TALL
Y BA
CKW
ARD
, D
ULL
OR
SL
OW
?
LIN
E N
AM
E Y
N
Y
N
Y
N
Y
N
Y
N
Y
N
Y
N
Y
N
Y
N
Y
N
Y
N
01
1 2
1 2
1 2
1 2
1 2
1 2
1 2
1 2
1 2
1 2
1 2
02
1
2 1
2 1
2 1
2 1
2 1
2 1
2 1
2 1
2 1
2 1
2
03
1
2 1
2 1
2 1
2 1
2 1
2 1
2 1
2 1
2 1
2 1
2
04
1
2 1
2 1
2 1
2 1
2 1
2 1
2 1
2 1
2 1
2 1
2
05
1
2 1
2 1
2 1
2 1
2 1
2 1
2 1
2 1
2 1
2 1
2
06
1
2 1
2 1
2 1
2 1
2 1
2 1
2 1
2 1
2 1
2 1
2
07
1
2 1
2 1
2 1
2 1
2 1
2 1
2 1
2 1
2 1
2 1
2
08
1
2 1
2 1
2 1
2 1
2 1
2 1
2 1
2 1
2 1
2 1
2
09
1
2 1
2 1
2 1
2 1
2 1
2 1
2 1
2 1
2 1
2 1
2
10
1
2 1
2 1
2 1
2 1
2 1
2 1
2 1
2 1
2 1
2 1
2
11
1
2 1
2 1
2 1
2 1
2 1
2 1
2 1
2 1
2 1
2 1
2
12
1
2 1
2 1
2 1
2 1
2 1
2 1
2 1
2 1
2 1
2 1
2
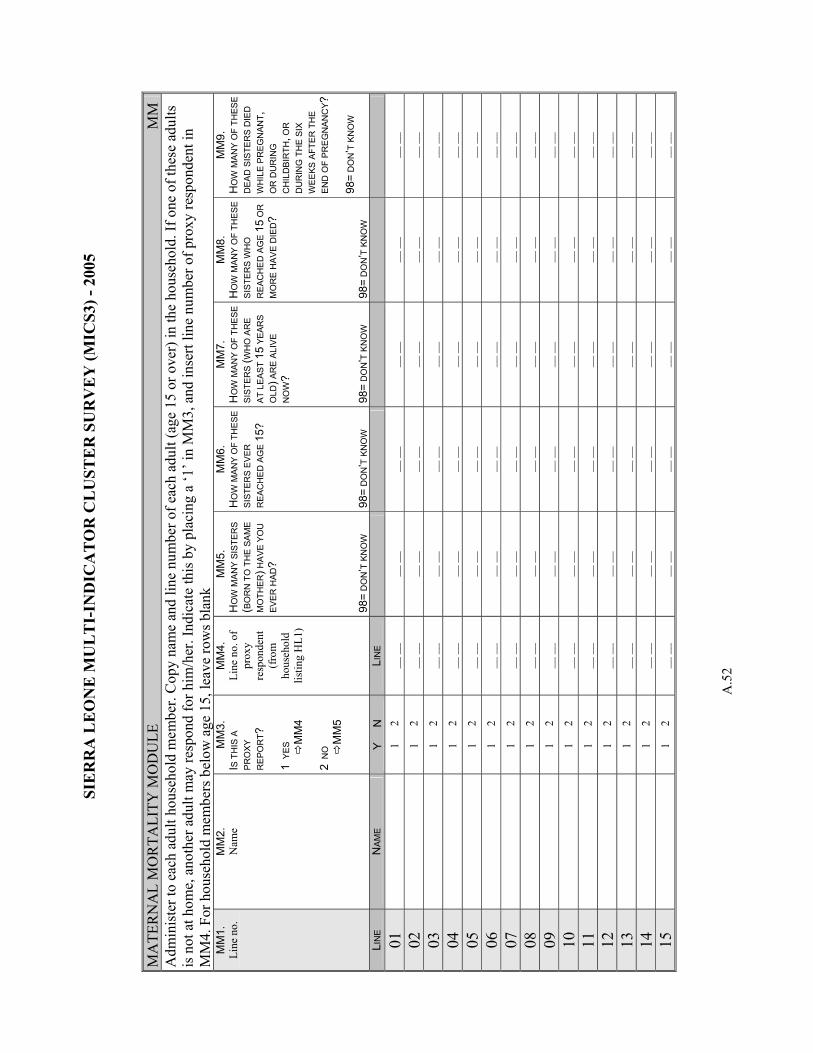
SIE
RR
A L
EO
NE
MU
LT
I-IN
DIC
AT
OR
CL
UST
ER
SU
RV
EY
(MIC
S3) -
200
5
A.5
2
MA
TER
NA
L M
OR
TALI
TY M
OD
ULE
M
M
Adm
inis
ter t
o ea
ch a
dult
hous
ehol
d m
embe
r. C
opy
nam
e an
d lin
e nu
mbe
r of e
ach
adul
t (ag
e 15
or o
ver)
in th
e ho
useh
old.
If o
ne o
f the
se a
dults
is
not
at h
ome,
ano
ther
adu
lt m
ay re
spon
d fo
r him
/her
. Ind
icat
e th
is b
y pl
acin
g a
‘1’ i
n M
M3,
and
inse
rt lin
e nu
mbe
r of p
roxy
resp
onde
nt in
M
M4.
For
hou
seho
ld m
embe
rs b
elow
age
15,
leav
e ro
ws b
lank
M
M1.
Li
ne n
o.
MM
2.
Nam
e
MM
3.
I S T
HIS
A
PR
OXY
R
EPO
RT ?
1
YES
MM
4 2
NO
MM
5
MM
4.
Line
no.
of
prox
y re
spon
dent
(f
rom
ho
useh
old
listin
g H
L1)
MM
5.
HO
W M
ANY
SIST
ERS
(BO
RN
TO
TH
E S
AM
E M
OTH
ER) H
AVE
YO
U
EVER
HA
D?
98=
DO
N’T
KN
OW
MM
6.
HO
W M
AN
Y O
F TH
ESE
S
ISTE
RS
EVER
R
EAC
HE
D A
GE
15?
98=
DO
N’T
KN
OW
MM
7.
HO
W M
ANY
OF
THE
SE
SIST
ERS
(WH
O A
RE
AT
LE
AST
15 Y
EAR
S O
LD) A
RE
ALI
VE
NO
W?
98=
DO
N’T
KN
OW
MM
8.
HO
W M
AN
Y O
F TH
ESE
S
ISTE
RS
WH
O
RE
ACH
ED
AG
E 15
OR
M
OR
E H
AVE
DIE
D?
98=
DO
N’T
KN
OW
MM
9.
HO
W M
ANY
OF
THES
E D
EAD
SIS
TER
S D
IED
W
HIL
E PR
EGN
ANT ,
O
R D
UR
ING
C
HIL
DB
IRTH
, OR
D
UR
ING
TH
E SI
X W
EEKS
AFT
ER T
HE
EN
D O
F PR
EG
NAN
CY ?
98=
DO
N’T
KN
OW
LIN
E
NAM
E
Y
N
LIN
E
01
1 2
__ _
_ __
__
__ _
_ __
__
__ _
_ __
__
02
1
2 __
__
__ _
_ __
__
__ _
_ __
__
__ _
_
03
1
2 __
__
__ _
_ __
__
__ _
_ __
__
__ _
_
04
1
2 __
__
__ _
_ __
__
__ _
_ __
__
__ _
_
05
1
2 __
__
__ _
_ __
__
__ _
_ __
__
__ _
_
06
1
2 __
__
__ _
_ __
__
__ _
_ __
__
__ _
_
07
1
2 __
__
__ _
_ __
__
__ _
_ __
__
__ _
_
08
1
2 __
__
__ _
_ __
__
__ _
_ __
__
__ _
_
09
1
2 __
__
__ _
_ __
__
__ _
_ __
__
__ _
_
10
1
2 __
__
__ _
_ __
__
__ _
_ __
__
__ _
_
11
1
2 __
__
__ _
_ __
__
__ _
_ __
__
__ _
_
12
1
2 __
__
__ _
_ __
__
__ _
_ __
__
__ _
_
13
1
2 __
__
__ _
_ __
__
__ _
_ __
__
__ _
_
14
1
2 __
__
__ _
_ __
__
__ _
_ __
__
__ _
_
15
1
2 __
__
__ _
_ __
__
__ _
_ __
__
__ _
_
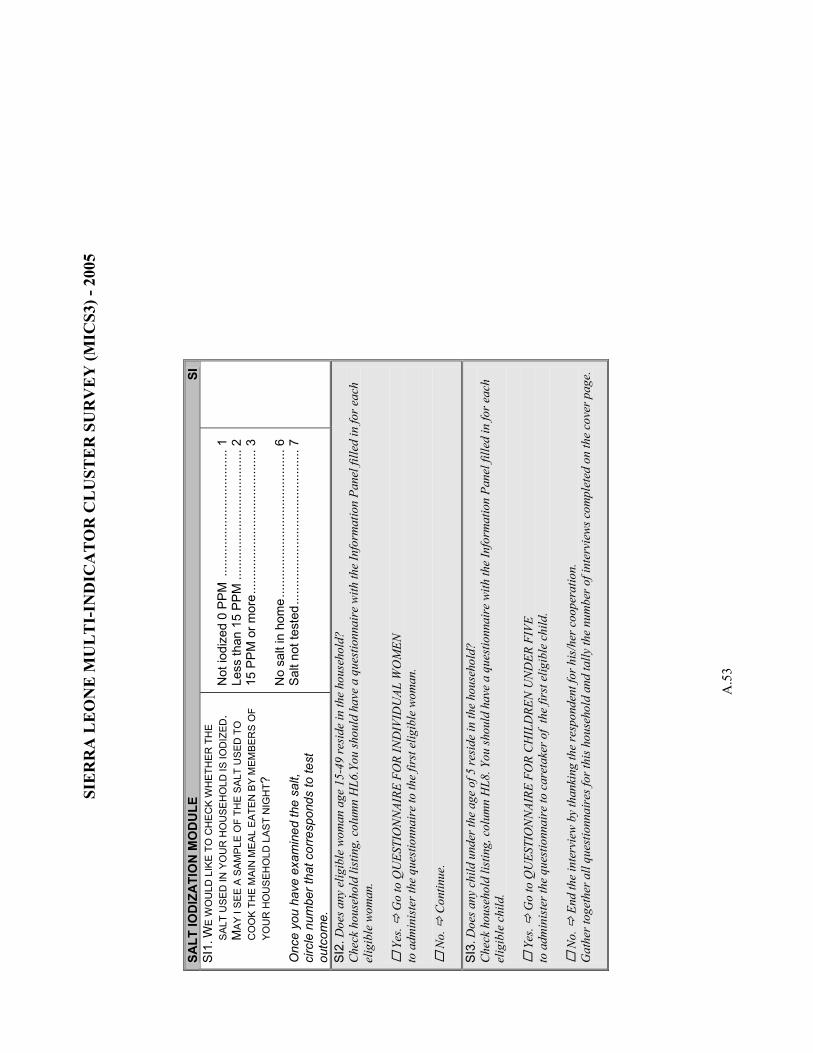
SIE
RR
A L
EO
NE
MU
LT
I-IN
DIC
AT
OR
CL
UST
ER
SU
RV
EY
(MIC
S3) -
200
5
A.5
3
SALT
IOD
IZA
TIO
N M
OD
ULE
SI
SI
1. W
E W
OU
LD L
IKE
TO C
HE
CK
WH
ETH
ER T
HE
SAL
T U
SED
IN Y
OU
R H
OU
SEH
OLD
IS IO
DIZ
ED.
MA
Y I S
EE A
SAM
PLE
OF
THE
SAL
T U
SED
TO
C
OO
K TH
E M
AIN
ME
AL E
ATE
N B
Y M
EMBE
RS
OF
YOU
R H
OU
SEH
OLD
LAS
T N
IGH
T ?
Onc
e yo
u ha
ve e
xam
ined
the
salt,
ci
rcle
num
ber t
hat c
orre
spon
ds to
test
ou
tcom
e.
Not
iodi
zed
0 P
PM
....
......
......
......
......
......
..1
Less
than
15
PP
M...
......
......
......
......
......
....2
15
PP
M o
r mor
e....
......
......
......
......
......
......
.3
No
salt
in h
ome.
......
......
......
......
......
......
.....
6 S
alt n
ot te
sted
......
......
......
......
......
......
......
..7
SI2.
Doe
s any
elig
ible
wom
an a
ge 1
5-49
resi
de in
the
hous
ehol
d?
Che
ck h
ouse
hold
list
ing,
col
umn
HL6
.You
shou
ld h
ave
a qu
estio
nnai
re w
ith th
e In
form
atio
n Pa
nel f
illed
in fo
r eac
h el
igib
le w
oman
.
Yes
. G
o to
QU
ESTI
ON
NAI
RE F
OR
IND
IVID
UAL
WO
MEN
to
adm
inis
ter t
he q
uest
ionn
aire
to th
e fir
st e
ligib
le w
oman
.
No.
C
ontin
ue.
SI3.
Doe
s any
chi
ld u
nder
the
age
of 5
resi
de in
the
hous
ehol
d?
Che
ck h
ouse
hold
list
ing,
col
umn
HL8
. You
shou
ld h
ave
a qu
estio
nnai
re w
ith th
e In
form
atio
n Pa
nel f
illed
in fo
r eac
h el
igib
le c
hild
.
Yes
. G
o to
QU
ESTI
ON
NAI
RE F
OR
CH
ILD
REN
UN
DER
FIV
E to
adm
inis
ter t
he q
uest
ionn
aire
to c
aret
aker
of
the
first
elig
ible
chi
ld.
N
o.
End
the
inte
rvie
w b
y th
anki
ng th
e re
spon
dent
for h
is/h
er c
oope
ratio
n.
Gat
her t
oget
her a
ll qu
estio
nnai
res f
or th
is h
ouse
hold
and
tally
the
num
ber o
f int
ervi
ews c
ompl
eted
on
the
cove
r pag
e.
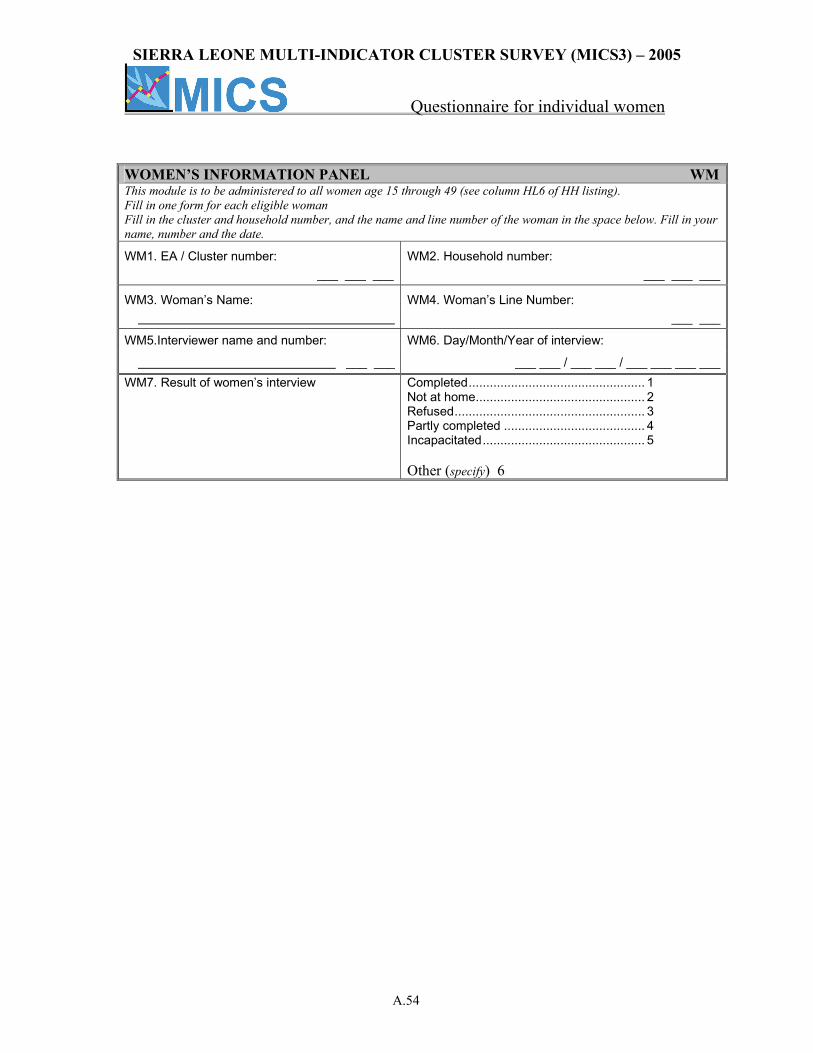
SIERRA LEONE MULTI-INDICATOR CLUSTER SURVEY (MICS3) – 2005
Questionnaire for individual women
A.54
WOMEN’S INFORMATION PANEL WMThis module is to be administered to all women age 15 through 49 (see column HL6 of HH listing). Fill in one form for each eligible woman Fill in the cluster and household number, and the name and line number of the woman in the space below. Fill in your name, number and the date.
WM1. EA / Cluster number: WM2. Household number: ___ ___ ___ ___ ___ ___
WM3. Woman’s Name: WM4. Woman’s Line Number: ___ ___
WM5.Interviewer name and number: WM6. Day/Month/Year of interview:
___ ___ ___ ___ / ___ ___ / ___ ___ ___ ___ WM7. Result of women’s interview Completed.................................................. 1
Not at home................................................ 2 Refused...................................................... 3 Partly completed ........................................ 4 Incapacitated.............................................. 5 Other (specify) 6
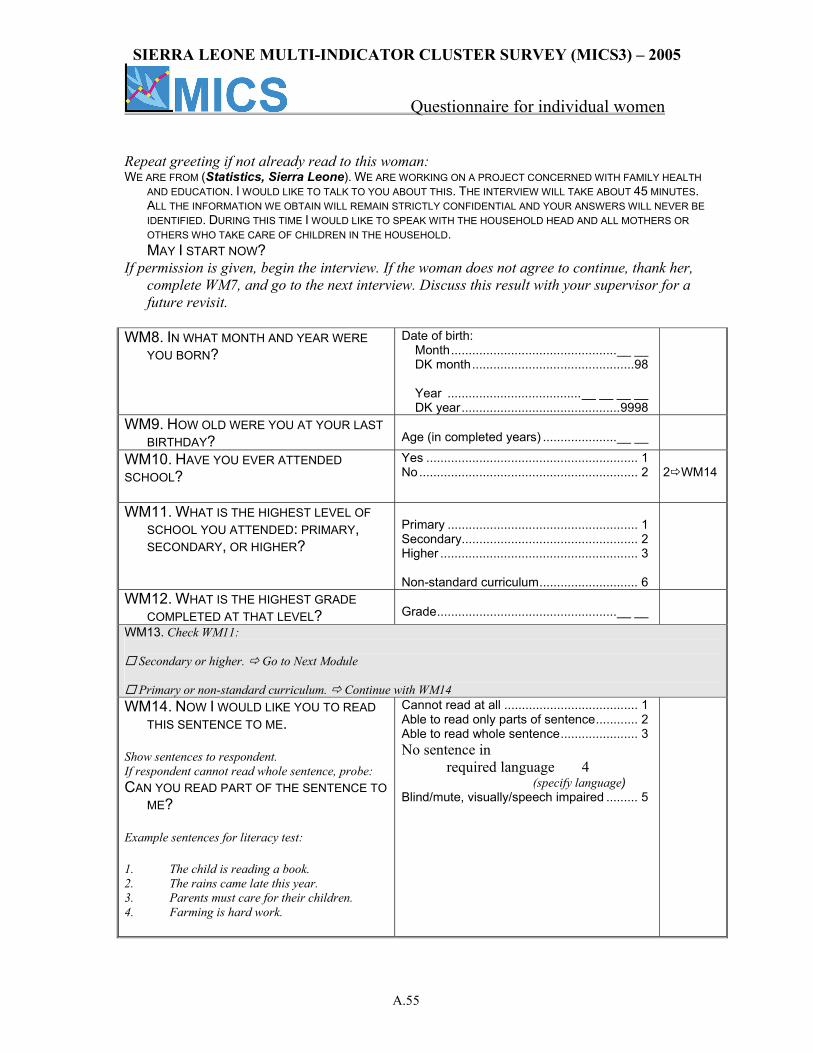
SIERRA LEONE MULTI-INDICATOR CLUSTER SURVEY (MICS3) – 2005
Questionnaire for individual women
A.55
Repeat greeting if not already read to this woman: WE ARE FROM (Statistics, Sierra Leone). WE ARE WORKING ON A PROJECT CONCERNED WITH FAMILY HEALTH
AND EDUCATION. I WOULD LIKE TO TALK TO YOU ABOUT THIS. THE INTERVIEW WILL TAKE ABOUT 45 MINUTES. ALL THE INFORMATION WE OBTAIN WILL REMAIN STRICTLY CONFIDENTIAL AND YOUR ANSWERS WILL NEVER BE IDENTIFIED. DURING THIS TIME I WOULD LIKE TO SPEAK WITH THE HOUSEHOLD HEAD AND ALL MOTHERS OR OTHERS WHO TAKE CARE OF CHILDREN IN THE HOUSEHOLD.
MAY I START NOW? If permission is given, begin the interview. If the woman does not agree to continue, thank her,
complete WM7, and go to the next interview. Discuss this result with your supervisor for a future revisit.
WM8. IN WHAT MONTH AND YEAR WERE
YOU BORN? Date of birth:
Month...............................................__ __ DK month..............................................98 Year ......................................__ __ __ __ DK year.............................................9998
WM9. HOW OLD WERE YOU AT YOUR LAST BIRTHDAY?
Age (in completed years) .....................__ __
WM10. HAVE YOU EVER ATTENDED SCHOOL?
Yes ............................................................ 1 No.............................................................. 2
2 WM14
WM11. WHAT IS THE HIGHEST LEVEL OF SCHOOL YOU ATTENDED: PRIMARY, SECONDARY, OR HIGHER?
Primary ...................................................... 1 Secondary.................................................. 2 Higher ........................................................ 3 Non-standard curriculum............................ 6
WM12. WHAT IS THE HIGHEST GRADE COMPLETED AT THAT LEVEL?
Grade...................................................__ __
WM13. Check WM11:
Secondary or higher. Go to Next Module
Primary or non-standard curriculum. Continue with WM14 WM14. NOW I WOULD LIKE YOU TO READ
THIS SENTENCE TO ME. Show sentences to respondent. If respondent cannot read whole sentence, probe: CAN YOU READ PART OF THE SENTENCE TO
ME? Example sentences for literacy test: 1. The child is reading a book. 2. The rains came late this year. 3. Parents must care for their children. 4. Farming is hard work.
Cannot read at all ...................................... 1 Able to read only parts of sentence............ 2 Able to read whole sentence...................... 3 No sentence in required language 4 (specify language) Blind/mute, visually/speech impaired ......... 5
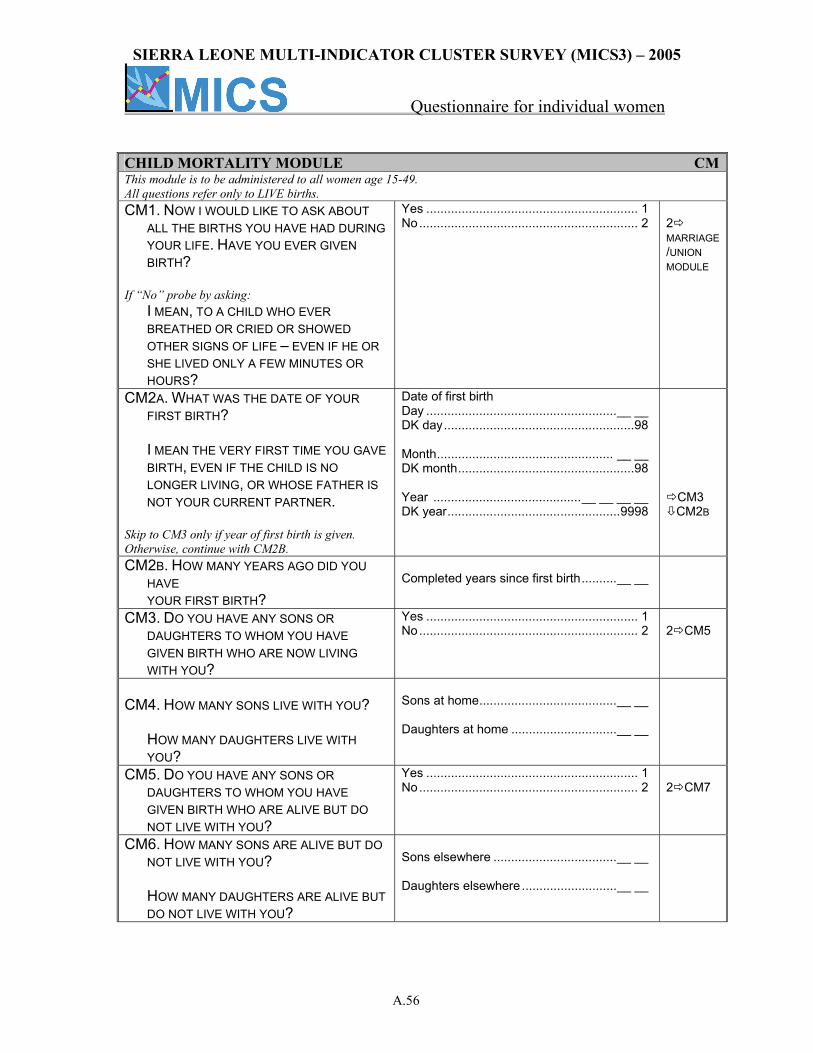
SIERRA LEONE MULTI-INDICATOR CLUSTER SURVEY (MICS3) – 2005
Questionnaire for individual women
A.56
CHILD MORTALITY MODULE CMThis module is to be administered to all women age 15-49. All questions refer only to LIVE births. CM1. NOW I WOULD LIKE TO ASK ABOUT
ALL THE BIRTHS YOU HAVE HAD DURING YOUR LIFE. HAVE YOU EVER GIVEN BIRTH?
If “No” probe by asking: I MEAN, TO A CHILD WHO EVER
BREATHED OR CRIED OR SHOWED OTHER SIGNS OF LIFE – EVEN IF HE OR SHE LIVED ONLY A FEW MINUTES OR HOURS?
Yes ............................................................ 1 No.............................................................. 2
2 MARRIAGE/UNION MODULE
CM2A. WHAT WAS THE DATE OF YOUR FIRST BIRTH?
I MEAN THE VERY FIRST TIME YOU GAVE
BIRTH, EVEN IF THE CHILD IS NO LONGER LIVING, OR WHOSE FATHER IS NOT YOUR CURRENT PARTNER.
Skip to CM3 only if year of first birth is given. Otherwise, continue with CM2B.
Date of first birth Day ......................................................__ __ DK day......................................................98 Month.................................................. __ __ DK month..................................................98 Year ..........................................__ __ __ __ DK year.................................................9998
CM3 CM2B
CM2B. HOW MANY YEARS AGO DID YOU HAVE YOUR FIRST BIRTH?
Completed years since first birth..........__ __
CM3. DO YOU HAVE ANY SONS OR DAUGHTERS TO WHOM YOU HAVE GIVEN BIRTH WHO ARE NOW LIVING WITH YOU?
Yes ............................................................ 1 No.............................................................. 2
2 CM5
CM4. HOW MANY SONS LIVE WITH YOU?
HOW MANY DAUGHTERS LIVE WITH YOU?
Sons at home.......................................__ __ Daughters at home ..............................__ __
CM5. DO YOU HAVE ANY SONS OR DAUGHTERS TO WHOM YOU HAVE GIVEN BIRTH WHO ARE ALIVE BUT DO NOT LIVE WITH YOU?
Yes ............................................................ 1 No.............................................................. 2
2 CM7
CM6. HOW MANY SONS ARE ALIVE BUT DO NOT LIVE WITH YOU?
HOW MANY DAUGHTERS ARE ALIVE BUT DO NOT LIVE WITH YOU?
Sons elsewhere ...................................__ __ Daughters elsewhere ...........................__ __
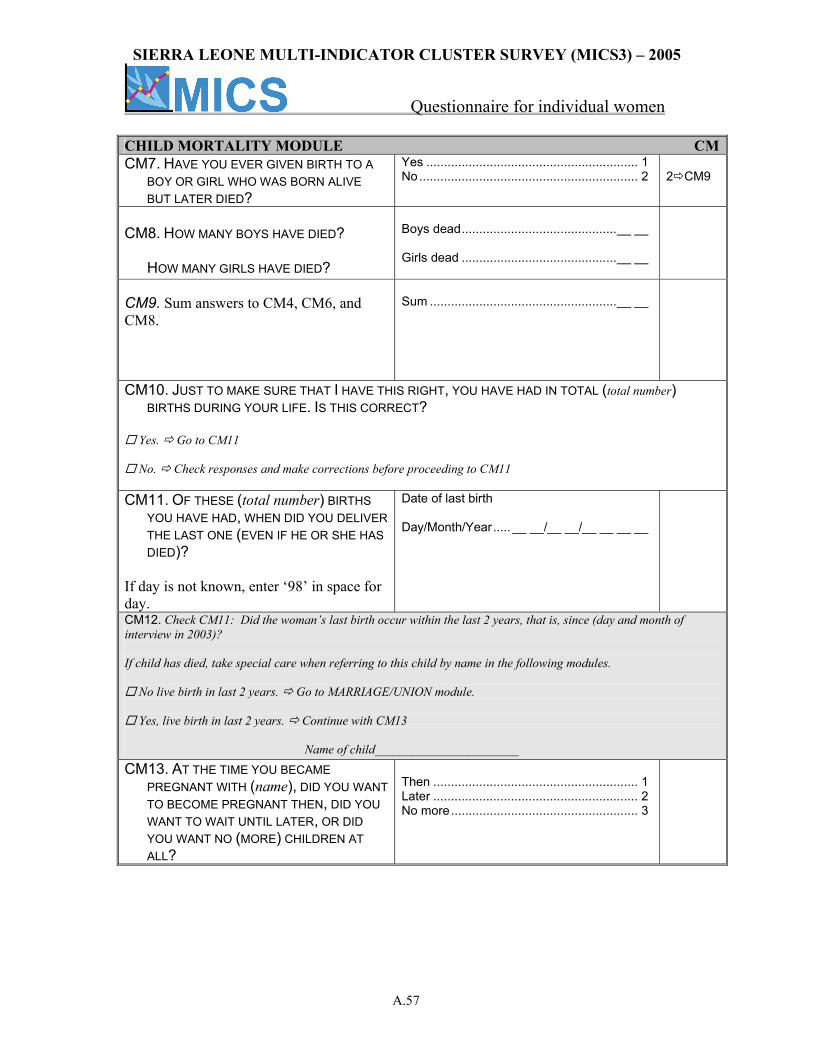
SIERRA LEONE MULTI-INDICATOR CLUSTER SURVEY (MICS3) – 2005
Questionnaire for individual women
A.57
CHILD MORTALITY MODULE CMCM7. HAVE YOU EVER GIVEN BIRTH TO A
BOY OR GIRL WHO WAS BORN ALIVE BUT LATER DIED?
Yes ............................................................ 1 No.............................................................. 2
2 CM9
CM8. HOW MANY BOYS HAVE DIED?
HOW MANY GIRLS HAVE DIED?
Boys dead............................................__ __ Girls dead ............................................__ __
CM9. Sum answers to CM4, CM6, and CM8.
Sum .....................................................__ __
CM10. JUST TO MAKE SURE THAT I HAVE THIS RIGHT, YOU HAVE HAD IN TOTAL (total number) BIRTHS DURING YOUR LIFE. IS THIS CORRECT?
Yes. Go to CM11
No. Check responses and make corrections before proceeding to CM11
CM11. OF THESE (total number) BIRTHS
YOU HAVE HAD, WHEN DID YOU DELIVER THE LAST ONE (EVEN IF HE OR SHE HAS DIED)?
If day is not known, enter ‘98’ in space for day.
Date of last birth Day/Month/Year..... __ __/__ __/__ __ __ __
CM12. Check CM11: Did the woman’s last birth occur within the last 2 years, that is, since (day and month of interview in 2003)? If child has died, take special care when referring to this child by name in the following modules.
No live birth in last 2 years. Go to MARRIAGE/UNION module.
Yes, live birth in last 2 years. Continue with CM13 Name of child_______________________ CM13. AT THE TIME YOU BECAME
PREGNANT WITH (name), DID YOU WANT TO BECOME PREGNANT THEN, DID YOU WANT TO WAIT UNTIL LATER, OR DID YOU WANT NO (MORE) CHILDREN AT ALL?
Then .......................................................... 1 Later .......................................................... 2 No more..................................................... 3
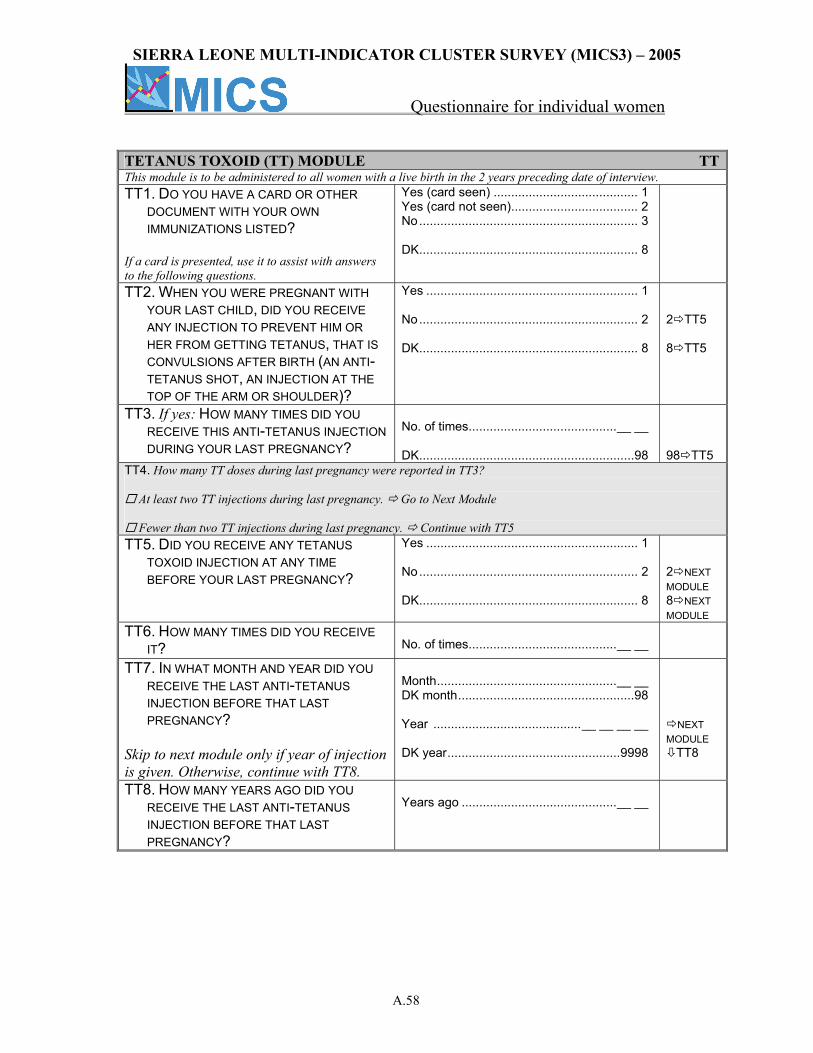
SIERRA LEONE MULTI-INDICATOR CLUSTER SURVEY (MICS3) – 2005
Questionnaire for individual women
A.58
TETANUS TOXOID (TT) MODULE TTThis module is to be administered to all women with a live birth in the 2 years preceding date of interview. TT1. DO YOU HAVE A CARD OR OTHER
DOCUMENT WITH YOUR OWN IMMUNIZATIONS LISTED?
If a card is presented, use it to assist with answers to the following questions.
Yes (card seen) ......................................... 1 Yes (card not seen).................................... 2 No.............................................................. 3 DK.............................................................. 8
TT2. WHEN YOU WERE PREGNANT WITH YOUR LAST CHILD, DID YOU RECEIVE ANY INJECTION TO PREVENT HIM OR HER FROM GETTING TETANUS, THAT IS CONVULSIONS AFTER BIRTH (AN ANTI-TETANUS SHOT, AN INJECTION AT THE TOP OF THE ARM OR SHOULDER)?
Yes ............................................................ 1 No.............................................................. 2 DK.............................................................. 8
2 TT5 8 TT5
TT3. If yes: HOW MANY TIMES DID YOU RECEIVE THIS ANTI-TETANUS INJECTION DURING YOUR LAST PREGNANCY?
No. of times..........................................__ __ DK.............................................................98
98 TT5
TT4. How many TT doses during last pregnancy were reported in TT3?
At least two TT injections during last pregnancy. Go to Next Module
Fewer than two TT injections during last pregnancy. Continue with TT5 TT5. DID YOU RECEIVE ANY TETANUS
TOXOID INJECTION AT ANY TIME BEFORE YOUR LAST PREGNANCY?
Yes ............................................................ 1 No.............................................................. 2 DK.............................................................. 8
2 NEXT MODULE 8 NEXT MODULE
TT6. HOW MANY TIMES DID YOU RECEIVE IT?
No. of times..........................................__ __
TT7. IN WHAT MONTH AND YEAR DID YOU RECEIVE THE LAST ANTI-TETANUS INJECTION BEFORE THAT LAST PREGNANCY?
Skip to next module only if year of injection is given. Otherwise, continue with TT8.
Month...................................................__ __ DK month..................................................98 Year ..........................................__ __ __ __ DK year.................................................9998
NEXT MODULE
TT8
TT8. HOW MANY YEARS AGO DID YOU RECEIVE THE LAST ANTI-TETANUS INJECTION BEFORE THAT LAST PREGNANCY?
Years ago ............................................__ __
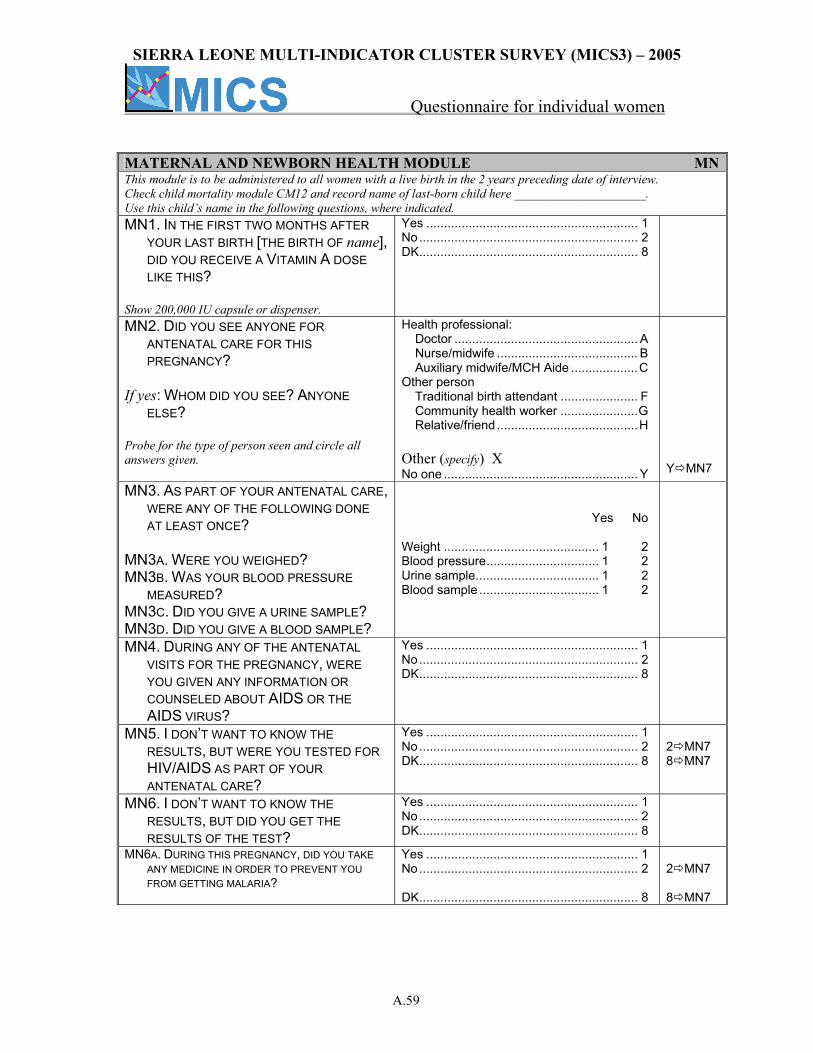
SIERRA LEONE MULTI-INDICATOR CLUSTER SURVEY (MICS3) – 2005
Questionnaire for individual women
A.59
MATERNAL AND NEWBORN HEALTH MODULE MNThis module is to be administered to all women with a live birth in the 2 years preceding date of interview. Check child mortality module CM12 and record name of last-born child here _____________________. Use this child’s name in the following questions, where indicated. MN1. IN THE FIRST TWO MONTHS AFTER
YOUR LAST BIRTH [THE BIRTH OF name], DID YOU RECEIVE A VITAMIN A DOSE LIKE THIS?
Show 200,000 IU capsule or dispenser.
Yes ............................................................ 1 No.............................................................. 2 DK.............................................................. 8
MN2. DID YOU SEE ANYONE FOR ANTENATAL CARE FOR THIS PREGNANCY?
If yes: WHOM DID YOU SEE? ANYONE
ELSE? Probe for the type of person seen and circle all answers given.
Health professional: Doctor .................................................... A Nurse/midwife ........................................ B Auxiliary midwife/MCH Aide ...................C
Other person Traditional birth attendant ...................... F Community health worker ......................G Relative/friend ........................................H Other (specify) X No one ....................................................... Y
Y MN7
MN3. AS PART OF YOUR ANTENATAL CARE, WERE ANY OF THE FOLLOWING DONE AT LEAST ONCE?
MN3A. WERE YOU WEIGHED? MN3B. WAS YOUR BLOOD PRESSURE
MEASURED? MN3C. DID YOU GIVE A URINE SAMPLE? MN3D. DID YOU GIVE A BLOOD SAMPLE?
Yes No Weight ............................................ 1 2 Blood pressure................................ 1 2 Urine sample................................... 1 2 Blood sample .................................. 1 2
MN4. DURING ANY OF THE ANTENATAL VISITS FOR THE PREGNANCY, WERE YOU GIVEN ANY INFORMATION OR COUNSELED ABOUT AIDS OR THE AIDS VIRUS?
Yes ............................................................ 1 No.............................................................. 2 DK.............................................................. 8
MN5. I DON’T WANT TO KNOW THE RESULTS, BUT WERE YOU TESTED FOR HIV/AIDS AS PART OF YOUR ANTENATAL CARE?
Yes ............................................................ 1 No.............................................................. 2 DK.............................................................. 8
2 MN7 8 MN7
MN6. I DON’T WANT TO KNOW THE RESULTS, BUT DID YOU GET THE RESULTS OF THE TEST?
Yes ............................................................ 1 No.............................................................. 2 DK.............................................................. 8
MN6A. DURING THIS PREGNANCY, DID YOU TAKE ANY MEDICINE IN ORDER TO PREVENT YOU FROM GETTING MALARIA?
Yes ............................................................ 1 No.............................................................. 2 DK.............................................................. 8
2 MN7 8 MN7
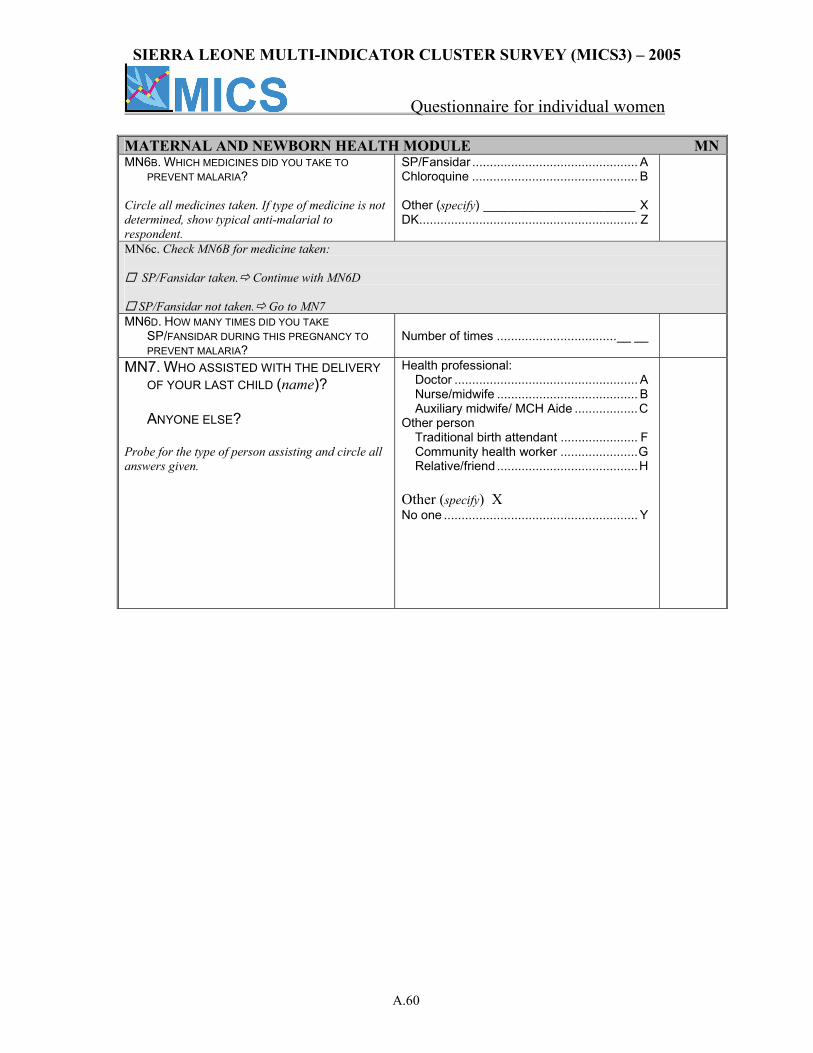
SIERRA LEONE MULTI-INDICATOR CLUSTER SURVEY (MICS3) – 2005
Questionnaire for individual women
A.60
MATERNAL AND NEWBORN HEALTH MODULE MNMN6B. WHICH MEDICINES DID YOU TAKE TO
PREVENT MALARIA? Circle all medicines taken. If type of medicine is not determined, show typical anti-malarial to respondent.
SP/Fansidar ............................................... A Chloroquine ............................................... B Other (specify) ______________________ X DK.............................................................. Z
MN6c. Check MN6B for medicine taken:
SP/Fansidar taken. Continue with MN6D
SP/Fansidar not taken. Go to MN7 MN6D. HOW MANY TIMES DID YOU TAKE
SP/FANSIDAR DURING THIS PREGNANCY TO PREVENT MALARIA?
Number of times ..................................__ __
MN7. WHO ASSISTED WITH THE DELIVERY OF YOUR LAST CHILD (name)? ANYONE ELSE?
Probe for the type of person assisting and circle all answers given.
Health professional: Doctor .................................................... A Nurse/midwife ........................................ B Auxiliary midwife/ MCH Aide ..................C
Other person Traditional birth attendant ...................... F Community health worker ......................G Relative/friend ........................................H Other (specify) X No one ....................................................... Y
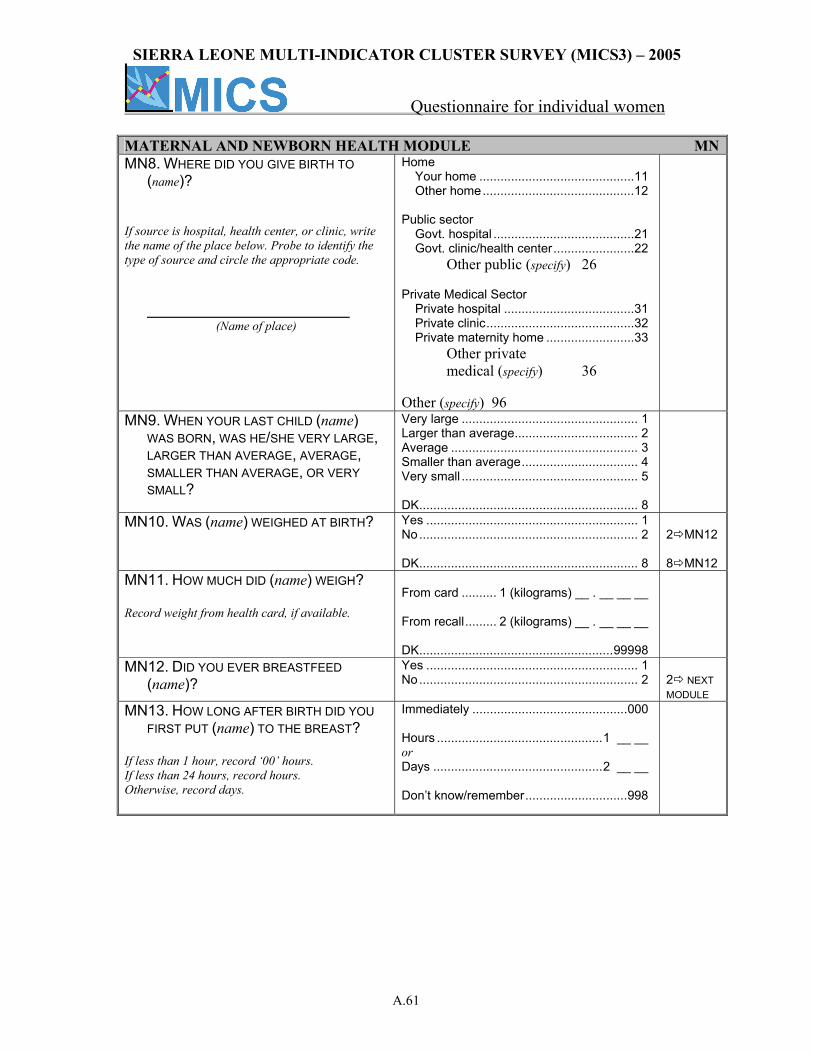
SIERRA LEONE MULTI-INDICATOR CLUSTER SURVEY (MICS3) – 2005
Questionnaire for individual women
A.61
MATERNAL AND NEWBORN HEALTH MODULE MNMN8. WHERE DID YOU GIVE BIRTH TO
(name)? If source is hospital, health center, or clinic, write the name of the place below. Probe to identify the type of source and circle the appropriate code.
(Name of place)
Home Your home ............................................11 Other home...........................................12 Public sector Govt. hospital ........................................21 Govt. clinic/health center.......................22 Other public (specify) 26 Private Medical Sector Private hospital .....................................31 Private clinic..........................................32 Private maternity home .........................33 Other private medical (specify) 36 Other (specify) 96
MN9. WHEN YOUR LAST CHILD (name) WAS BORN, WAS HE/SHE VERY LARGE, LARGER THAN AVERAGE, AVERAGE, SMALLER THAN AVERAGE, OR VERY SMALL?
Very large .................................................. 1 Larger than average................................... 2 Average ..................................................... 3 Smaller than average................................. 4 Very small .................................................. 5 DK.............................................................. 8
MN10. WAS (name) WEIGHED AT BIRTH? Yes ............................................................ 1 No.............................................................. 2 DK.............................................................. 8
2 MN12 8 MN12
MN11. HOW MUCH DID (name) WEIGH? Record weight from health card, if available.
From card .......... 1 (kilograms) __ . __ __ __ From recall......... 2 (kilograms) __ . __ __ __ DK.......................................................99998
MN12. DID YOU EVER BREASTFEED (name)?
Yes ............................................................ 1 No.............................................................. 2
2 NEXT MODULE
MN13. HOW LONG AFTER BIRTH DID YOU FIRST PUT (name) TO THE BREAST?
If less than 1 hour, record ‘00’ hours. If less than 24 hours, record hours. Otherwise, record days.
Immediately ............................................000 Hours ...............................................1 __ __ or Days ................................................2 __ __ Don’t know/remember.............................998
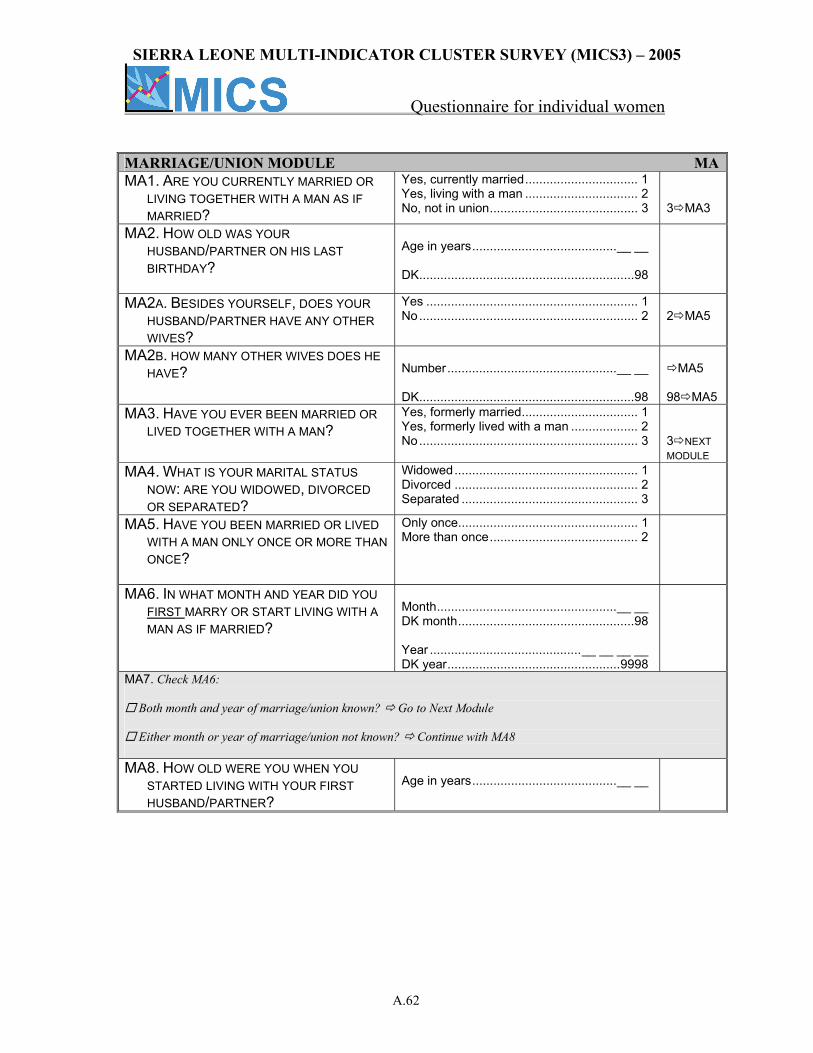
SIERRA LEONE MULTI-INDICATOR CLUSTER SURVEY (MICS3) – 2005
Questionnaire for individual women
A.62
MARRIAGE/UNION MODULE MAMA1. ARE YOU CURRENTLY MARRIED OR
LIVING TOGETHER WITH A MAN AS IF MARRIED?
Yes, currently married................................ 1 Yes, living with a man ................................ 2 No, not in union.......................................... 3
3 MA3
MA2. HOW OLD WAS YOUR HUSBAND/PARTNER ON HIS LAST BIRTHDAY?
Age in years.........................................__ __ DK.............................................................98
MA2A. BESIDES YOURSELF, DOES YOUR HUSBAND/PARTNER HAVE ANY OTHER WIVES?
Yes ............................................................ 1 No.............................................................. 2
2 MA5
MA2B. HOW MANY OTHER WIVES DOES HE HAVE?
Number................................................__ __ DK.............................................................98
MA5
98 MA5
MA3. HAVE YOU EVER BEEN MARRIED OR LIVED TOGETHER WITH A MAN?
Yes, formerly married................................. 1 Yes, formerly lived with a man ................... 2 No.............................................................. 3
3 NEXT MODULE
MA4. WHAT IS YOUR MARITAL STATUS NOW: ARE YOU WIDOWED, DIVORCED OR SEPARATED?
Widowed.................................................... 1 Divorced .................................................... 2 Separated .................................................. 3
MA5. HAVE YOU BEEN MARRIED OR LIVED WITH A MAN ONLY ONCE OR MORE THAN ONCE?
Only once................................................... 1 More than once.......................................... 2
MA6. IN WHAT MONTH AND YEAR DID YOU FIRST MARRY OR START LIVING WITH A MAN AS IF MARRIED?
Month...................................................__ __ DK month..................................................98 Year ...........................................__ __ __ __ DK year.................................................9998
MA7. Check MA6:
Both month and year of marriage/union known? Go to Next Module
Either month or year of marriage/union not known? Continue with MA8 MA8. HOW OLD WERE YOU WHEN YOU
STARTED LIVING WITH YOUR FIRST HUSBAND/PARTNER?
Age in years.........................................__ __
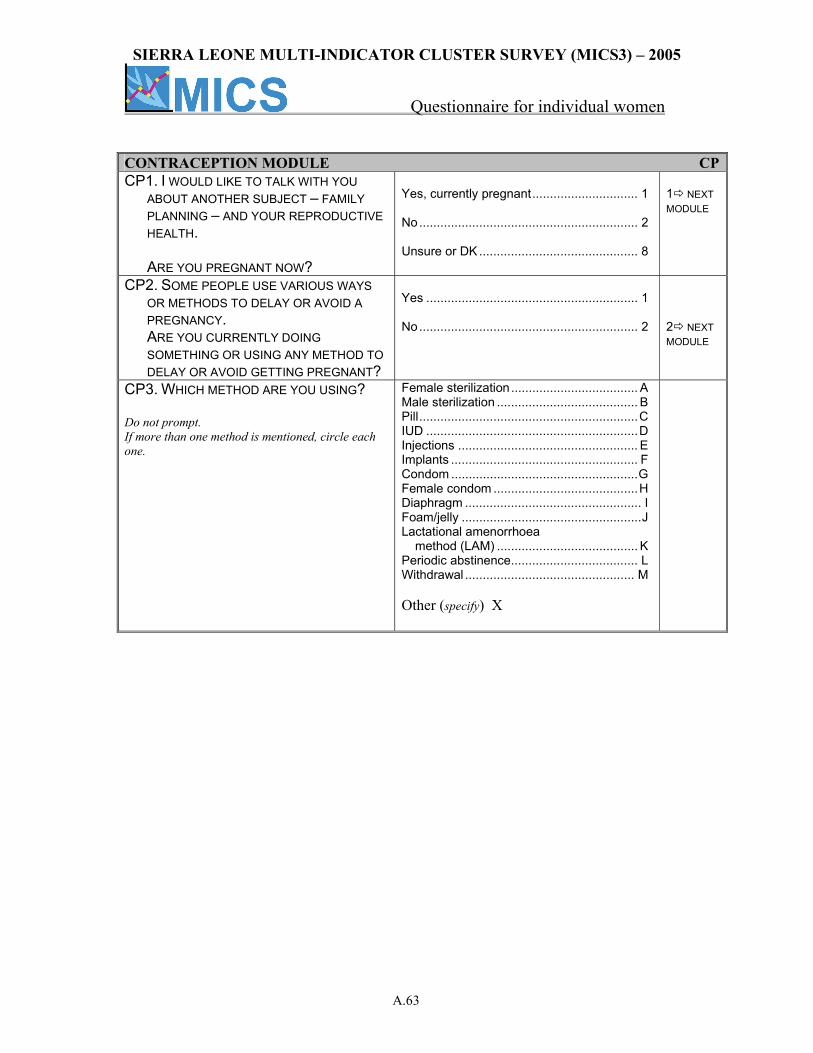
SIERRA LEONE MULTI-INDICATOR CLUSTER SURVEY (MICS3) – 2005
Questionnaire for individual women
A.63
CONTRACEPTION MODULE CPCP1. I WOULD LIKE TO TALK WITH YOU
ABOUT ANOTHER SUBJECT – FAMILY PLANNING – AND YOUR REPRODUCTIVE HEALTH. ARE YOU PREGNANT NOW?
Yes, currently pregnant.............................. 1 No.............................................................. 2 Unsure or DK ............................................. 8
1 NEXT MODULE
CP2. SOME PEOPLE USE VARIOUS WAYS OR METHODS TO DELAY OR AVOID A PREGNANCY. ARE YOU CURRENTLY DOING SOMETHING OR USING ANY METHOD TO DELAY OR AVOID GETTING PREGNANT?
Yes ............................................................ 1 No.............................................................. 2
2 NEXT MODULE
CP3. WHICH METHOD ARE YOU USING? Do not prompt. If more than one method is mentioned, circle each one.
Female sterilization .................................... A Male sterilization ........................................ B Pill..............................................................C IUD ............................................................D Injections ................................................... E Implants ..................................................... F Condom .....................................................G Female condom .........................................H Diaphragm .................................................. I Foam/jelly ...................................................J Lactational amenorrhoea method (LAM) ........................................ K Periodic abstinence.................................... L Withdrawal ................................................ M Other (specify) X
SIERRA LEONE MULTI-INDICATOR CLUSTER SURVEY (MICS3) – 2005
Questionnaire for individual women
A.64
FEMALE SECRET SOCIETY MODULE FGFG1. HAVE YOU EVER HEARD OF BONDO
SOCIETY? Yes ............................................................ 1 No.............................................................. 2
2 NEXT MODULE
FG3. ARE YOU A MEMBER? Yes ............................................................ 1 No.............................................................. 2
2 FG8
FG7. WHO INITIATED YOU? Traditional persons Traditional ‘circumciser’.........................11 Traditional birth attendant .....................12 Other traditional (specify) 16 Health professional Doctor ...................................................21 Nurse/midwife ......................................22 Other health professional (specify) 26 DK.............................................................98
FG8. The following questions apply only to women who have at least one living daughter. Check CM4 and CM6, Child Mortality Module: Woman has living daughter?
Yes. Continue with FG9
No. Go to FG16 FG9. ARE ANY OF YOUR DAUGHTERS
MEMBERS OF THE BONDO SOCIETY? IF YES, HOW MANY?
Number of daughters : ........................__ __ No daughters initiated ...............................00
00 FG16
FG10. WHICH OF YOUR DAUGHTERS WAS INITIATED MOST RECENTLY?
Record the daughter’s name.
Name of daughter: ___________________
FG14. HOW OLD WAS (NAME) WHEN THIS
OCCURRED? IF THE RESPONDENT DOES NOT KNOW THE AGE,
PROBE TO GET AN ESTIMATE.
Daughter’s age at initiation ..................__ __ DK.............................................................98
FG15. WHO DID THE INITIATION?
Traditional persons Traditional ‘initiator’ ...............................11 Traditional birth attendant .....................12 Other Traditional (specify)......................16 Health professional Doctor ...................................................21 Nurse/midwife ......................................22 Other health professional (specify) ....... 26 DK.............................................................98
FG16. DO YOU THINK THE BONDO SOCIETY SHOULD BE CONTINUED OR DISCONTINUED?
Continued .................................................. 1 Discontinued .............................................. 2 Depends .................................................... 3 DK.............................................................. 8
SIERRA LEONE MULTI-INDICATOR CLUSTER SURVEY (MICS3) – 2005
Questionnaire for individual women
A.65
ATTITUDES TOWARD DOMESTIC VIOLENCE DV1. SOMETIMES A HUSBAND IS ANNOYED OR
ANGERED BY THINGS THAT HIS WIFE DOES. IN YOUR OPINION, IS A HUSBAND JUSTIFIED IN HITTING OR BEATING HIS WIFE IN THE FOLLOWING SITUATIONS:
DV1A. IF SHE GOES OUT WITH OUT TELLING HIM? DV1B. IF SHE NEGLECTS THE CHILDREN? DV1C. IF SHE ARGUES WITH HIM? DV1D. IF SHE REFUSES SEX WITH HIM? DV1E. IF SHE BURNS THE FOOD? DV1F. IF SHE REFUSES TO COOK DV1G. IF SHE GOES OUT WITH A BOY FRIEND DV1H. IF SHE REFUSES TO CLEAN THE HOUSE
Yes No DK Goes out without telling ....... 1 2 8 Neglects children.................. 1 2 8 Argues .................................. 1 2 8 Refuses sex........................... 1 2 8 Burns food............................ 1 2 8 Refuses to cook………………….1 2 8 Goes out with Boyfriend…………1 2 8 Refuses to clean the house……..1 2 8
SEXUAL BEHAVIOUR MODULE SBCHECK FOR THE PRESENCE OF OTHERS. BEFORE CONTINUING, ENSURE PRIVACY. SB0. Check WM9: Age of respondent is between 15 and 24?
Age 25-49. Go to Next Module
Age 15-24. Continue with SB1 SB1. NOW I NEED TO ASK YOU SOME QUESTIONS
ABOUT SEXUAL ACTIVITY IN ORDER TO GAIN A BETTER UNDERSTANDING OF SOME FAMILY LIFE ISSUES.
THE INFORMATION YOU SUPPLY WILL REMAIN
STRICTLY CONFIDENTIAL.
Never had intercourse...............................00 Age in years.........................................__ __ First time when started living with (first)
husband/partner....................................95
00 NEXT MODULE
SIERRA LEONE MULTI-INDICATOR CLUSTER SURVEY (MICS3) – 2005
Questionnaire for individual women
A.66
SEXUAL BEHAVIOUR MODULE SB HOW OLD WERE YOU WHEN YOU FIRST HAD
SEXUAL INTERCOURSE (IF EVER)? SB2. WHEN WAS THE LAST TIME YOU HAD SEXUAL
INTERCOURSE? Record ‘years ago’ only if last intercourse was one or more years ago. If 12 months or more the answer must be recorded in years.
Days ago .........................................1 __ __ Weeks ago.......................................2 __ __ Months ago......................................3 __ __ Years ago ........................................4 __ __
4 NEXT MODULE
SB3. THE LAST TIME YOU HAD SEXUAL INTERCOURSE WAS A CONDOM USED?
Yes ............................................................ 1 No.............................................................. 2
SB4. WHAT IS YOUR RELATIONSHIP TO THE MAN WITH WHOM YOU LAST HAD SEXUAL INTERCOURSE?
If man is ‘boyfriend’ or ‘fiancée’, ask: WAS YOUR BOYFRIEND/FIANCÉE LIVING WITH YOU
WHEN YOU LAST HAD SEX? If ‘yes’, circle 1 .If ‘no’, circle 2.
Spouse / cohabiting partner ....................... 1 Man is boyfriend / fiancée .......................... 2 Other friend................................................ 3 Casual acquaintance ................................. 4 Other (specify) ______________________ 6
1 SB6
SB5. HOW OLD IS THIS PERSON? If response is DK, probe: ABOUT HOW OLD IS THIS PERSON?
Age of sexual partner...........................__ __ DK.............................................................98
SB6. HAVE YOU HAD SEX WITH ANY OTHER MAN IN THE LAST 12 MONTHS?
Yes ............................................................ 1 No.............................................................. 2
2 NEXT MODULE
SB7. THE LAST TIME YOU HAD SEXUAL INTERCOURSE WITH THIS OTHER MAN, WAS A CONDOM USED?
Yes ............................................................ 1 No.............................................................. 2
SB8. WHAT IS YOUR RELATIONSHIP TO THIS MAN? If man is ‘boyfriend’ or ‘fiancée’, ask: WAS YOUR BOYFRIEND/FIANCÉE LIVING WITH YOU
WHEN YOU LAST HAD SEX? If ‘yes’, circle 1. If ‘no’, circle 2.
Spouse / cohabiting partner ....................... 1 Man is boyfriend / fiancée .......................... 2 Other friend................................................ 3 Casual acquaintance ................................. 4 Other (specify) ______________________ 6
1 SB10
SB9. HOW OLD IS THIS PERSON? If response is DK, probe: ABOUT HOW OLD IS THIS PERSON?
Age of sexual partner...........................__ __ DK.............................................................98
SB10. OTHER THAN THESE TWO MEN, HAVE YOU HAD SEX WITH ANY OTHER MAN IN THE LAST 12 MONTHS?
Yes ............................................................ 1 No.............................................................. 2
2 NEXT MODULE
SB11. IN TOTAL, WITH HOW MANY DIFFERENT MEN HAVE YOU HAD SEX IN THE LAST 12 MONTHS?
No. of partners .....................................__ __
SIERRA LEONE MULTI-INDICATOR CLUSTER SURVEY (MICS3) – 2005
Questionnaire for individual women
A.67
HIV/AIDS MODULE HAHA1. NOW I WOULD LIKE TO TALK WITH
YOU ABOUT SOMETHING ELSE.
HAVE YOU EVER HEARD OF THE VIRUS HIV OR AN ILLNESS CALLED AIDS?
Yes ............................................................ 1 No.............................................................. 2
2 NEXT MODULE
HA2. CAN PEOPLE PROTECT THEMSELVES FROM GETTING INFECTED WITH THE AIDS VIRUS BY HAVING ONE SEX PARTNER WHO IS NOT INFECTED AND ALSO HAS NO OTHER PARTNERS?
Yes ............................................................ 1 No.............................................................. 2 DK.............................................................. 8
HA3. CAN PEOPLE GET INFECTED WITH THE AIDS VIRUS BECAUSE OF WITCHCRAFT OR OTHER SUPERNATURAL MEANS?
Yes ............................................................ 1 No.............................................................. 2 DK.............................................................. 8
HA4. CAN PEOPLE REDUCE THEIR CHANCE OF GETTING THE AIDS VIRUS BY USING A CONDOM EVERY TIME THEY HAVE SEX?
Yes ............................................................ 1 No.............................................................. 2 DK.............................................................. 8
HA5. CAN PEOPLE GET THE AIDS VIRUS FROM MOSQUITO BITES?
Yes ............................................................ 1 No.............................................................. 2 DK.............................................................. 8
HA6. CAN PEOPLE REDUCE THEIR CHANCE OF GETTING INFECTED WITH THE AIDS VIRUS BY NOT HAVING SEX AT ALL?
Yes ............................................................ 1 No.............................................................. 2 DK.............................................................. 8
HA7. CAN PEOPLE GET THE AIDS VIRUS BY SHARING FOOD WITH A PERSON WHO HAS AIDS?
Yes ............................................................ 1 No.............................................................. 2 DK.............................................................. 8
HA7A. CAN PEOPLE GET THE AIDS VIRUS BY GETTING INJECTIONS WITH A NEEDLE THAT WAS ALREADY USED BY SOMEONE ELSE?
Yes ............................................................ 1 No.............................................................. 2 DK.............................................................. 8
HA8. IS IT POSSIBLE FOR A HEALTHY-LOOKING PERSON TO HAVE THE AIDS VIRUS?
Yes ............................................................ 1 No.............................................................. 2 DK.............................................................. 8
HA9. CAN THE AIDS VIRUS BE TRANSMITTED FROM A MOTHER TO A BABY?
HA9A. DURING PREGNANCY? HA9B. DURING DELIVERY? HA9C. BY BREASTFEEDING?
Yes No DK During pregnancy .....................1 2 8 During delivery..........................1 2 8 By breastfeeding.......................1 2 8
HA10. IF A FEMALE TEACHER HAS THE AIDS VIRUS BUT IS NOT SICK, SHOULD SHE BE ALLOWED TO CONTINUE TEACHING IN SCHOOL?
Yes ............................................................ 1 No.............................................................. 2 DK/not sure/depends ................................. 8
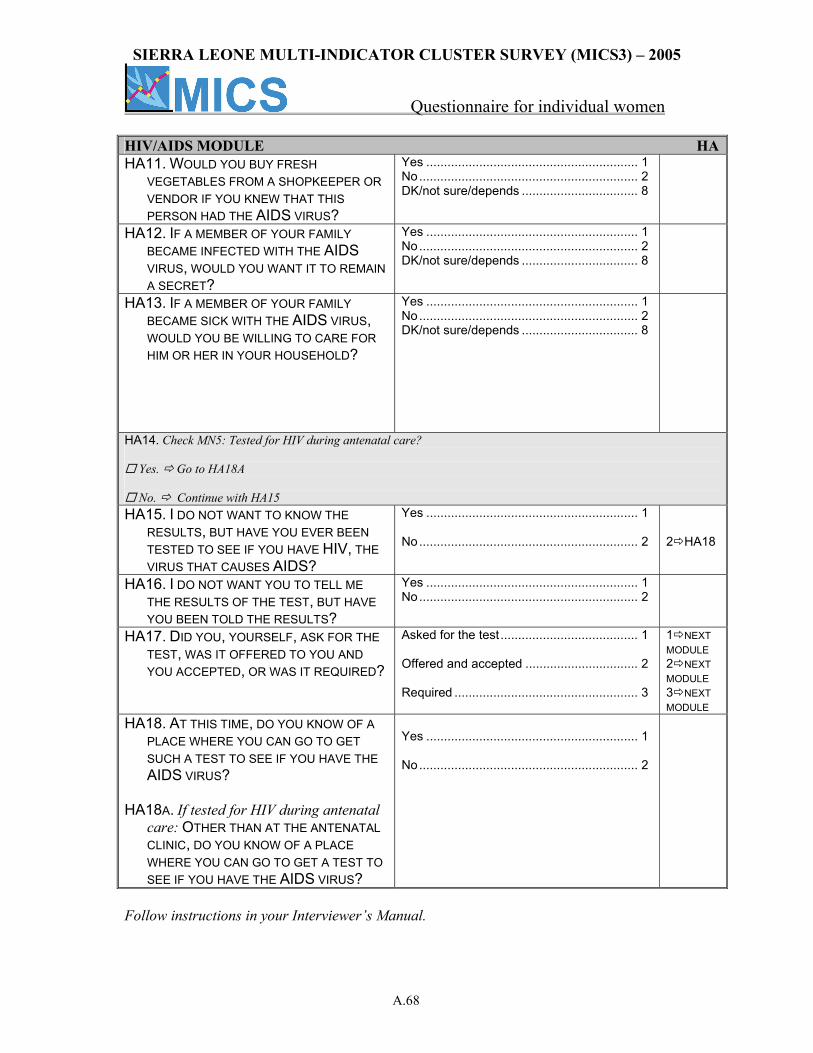
SIERRA LEONE MULTI-INDICATOR CLUSTER SURVEY (MICS3) – 2005
Questionnaire for individual women
A.68
HIV/AIDS MODULE HAHA11. WOULD YOU BUY FRESH
VEGETABLES FROM A SHOPKEEPER OR VENDOR IF YOU KNEW THAT THIS PERSON HAD THE AIDS VIRUS?
Yes ............................................................ 1 No.............................................................. 2 DK/not sure/depends ................................. 8
HA12. IF A MEMBER OF YOUR FAMILY BECAME INFECTED WITH THE AIDS VIRUS, WOULD YOU WANT IT TO REMAIN A SECRET?
Yes ............................................................ 1 No.............................................................. 2 DK/not sure/depends ................................. 8
HA13. IF A MEMBER OF YOUR FAMILY BECAME SICK WITH THE AIDS VIRUS, WOULD YOU BE WILLING TO CARE FOR HIM OR HER IN YOUR HOUSEHOLD?
Yes ............................................................ 1 No.............................................................. 2 DK/not sure/depends ................................. 8
HA14. Check MN5: Tested for HIV during antenatal care?
Yes. Go to HA18A
No. Continue with HA15 HA15. I DO NOT WANT TO KNOW THE
RESULTS, BUT HAVE YOU EVER BEEN TESTED TO SEE IF YOU HAVE HIV, THE VIRUS THAT CAUSES AIDS?
Yes ............................................................ 1 No.............................................................. 2
2 HA18
HA16. I DO NOT WANT YOU TO TELL ME THE RESULTS OF THE TEST, BUT HAVE YOU BEEN TOLD THE RESULTS?
Yes ............................................................ 1 No.............................................................. 2
HA17. DID YOU, YOURSELF, ASK FOR THE TEST, WAS IT OFFERED TO YOU AND YOU ACCEPTED, OR WAS IT REQUIRED?
Asked for the test....................................... 1 Offered and accepted ................................ 2 Required .................................................... 3
1 NEXT MODULE 2 NEXT MODULE 3 NEXT MODULE
HA18. AT THIS TIME, DO YOU KNOW OF A PLACE WHERE YOU CAN GO TO GET SUCH A TEST TO SEE IF YOU HAVE THE AIDS VIRUS?
HA18A. If tested for HIV during antenatal
care: OTHER THAN AT THE ANTENATAL CLINIC, DO YOU KNOW OF A PLACE WHERE YOU CAN GO TO GET A TEST TO SEE IF YOU HAVE THE AIDS VIRUS?
Yes ............................................................ 1 No.............................................................. 2
Follow instructions in your Interviewer’s Manual.
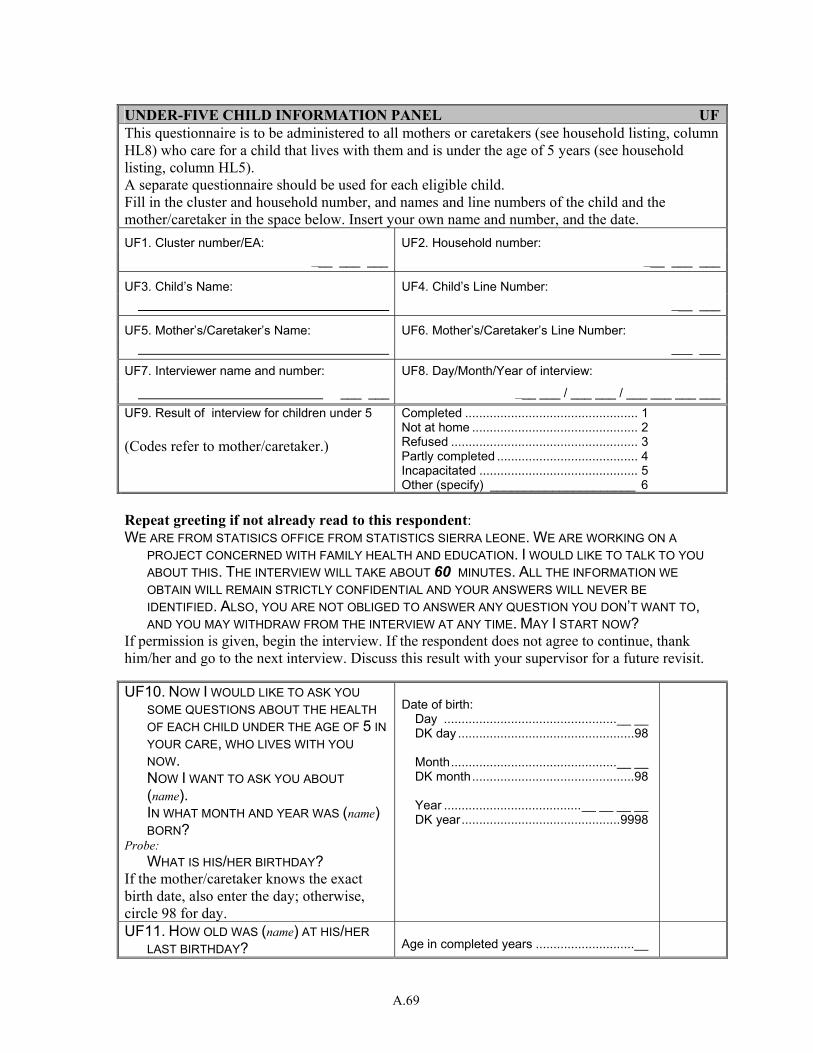
A.69
UNDER-FIVE CHILD INFORMATION PANEL UFThis questionnaire is to be administered to all mothers or caretakers (see household listing, column HL8) who care for a child that lives with them and is under the age of 5 years (see household listing, column HL5). A separate questionnaire should be used for each eligible child. Fill in the cluster and household number, and names and line numbers of the child and the mother/caretaker in the space below. Insert your own name and number, and the date. UF1. Cluster number/EA: UF2. Household number:
___ ___ ___ ___ ___ ___
UF3. Child’s Name: UF4. Child’s Line Number: ___ ___
UF5. Mother’s/Caretaker’s Name: UF6. Mother’s/Caretaker’s Line Number: ___ ___
UF7. Interviewer name and number: UF8. Day/Month/Year of interview:
___ ___ ___ ___ / ___ ___ / ___ ___ ___ ___ UF9. Result of interview for children under 5 (Codes refer to mother/caretaker.)
Completed ................................................. 1 Not at home ............................................... 2 Refused ..................................................... 3 Partly completed ........................................ 4 Incapacitated ............................................. 5 Other (specify) _____________________ 6
Repeat greeting if not already read to this respondent: WE ARE FROM STATISICS OFFICE FROM STATISTICS SIERRA LEONE. WE ARE WORKING ON A
PROJECT CONCERNED WITH FAMILY HEALTH AND EDUCATION. I WOULD LIKE TO TALK TO YOU ABOUT THIS. THE INTERVIEW WILL TAKE ABOUT 60 MINUTES. ALL THE INFORMATION WE OBTAIN WILL REMAIN STRICTLY CONFIDENTIAL AND YOUR ANSWERS WILL NEVER BE IDENTIFIED. ALSO, YOU ARE NOT OBLIGED TO ANSWER ANY QUESTION YOU DON’T WANT TO, AND YOU MAY WITHDRAW FROM THE INTERVIEW AT ANY TIME. MAY I START NOW?
If permission is given, begin the interview. If the respondent does not agree to continue, thank him/her and go to the next interview. Discuss this result with your supervisor for a future revisit. UF10. NOW I WOULD LIKE TO ASK YOU
SOME QUESTIONS ABOUT THE HEALTH OF EACH CHILD UNDER THE AGE OF 5 IN YOUR CARE, WHO LIVES WITH YOU NOW. NOW I WANT TO ASK YOU ABOUT (name). IN WHAT MONTH AND YEAR WAS (name) BORN?
Probe: WHAT IS HIS/HER BIRTHDAY? If the mother/caretaker knows the exact birth date, also enter the day; otherwise, circle 98 for day.
Date of birth: Day .................................................__ __ DK day ..................................................98 Month...............................................__ __ DK month..............................................98 Year .......................................__ __ __ __ DK year.............................................9998
UF11. HOW OLD WAS (name) AT HIS/HER LAST BIRTHDAY?
Age in completed years ............................__
A.70
Record age in completed years.
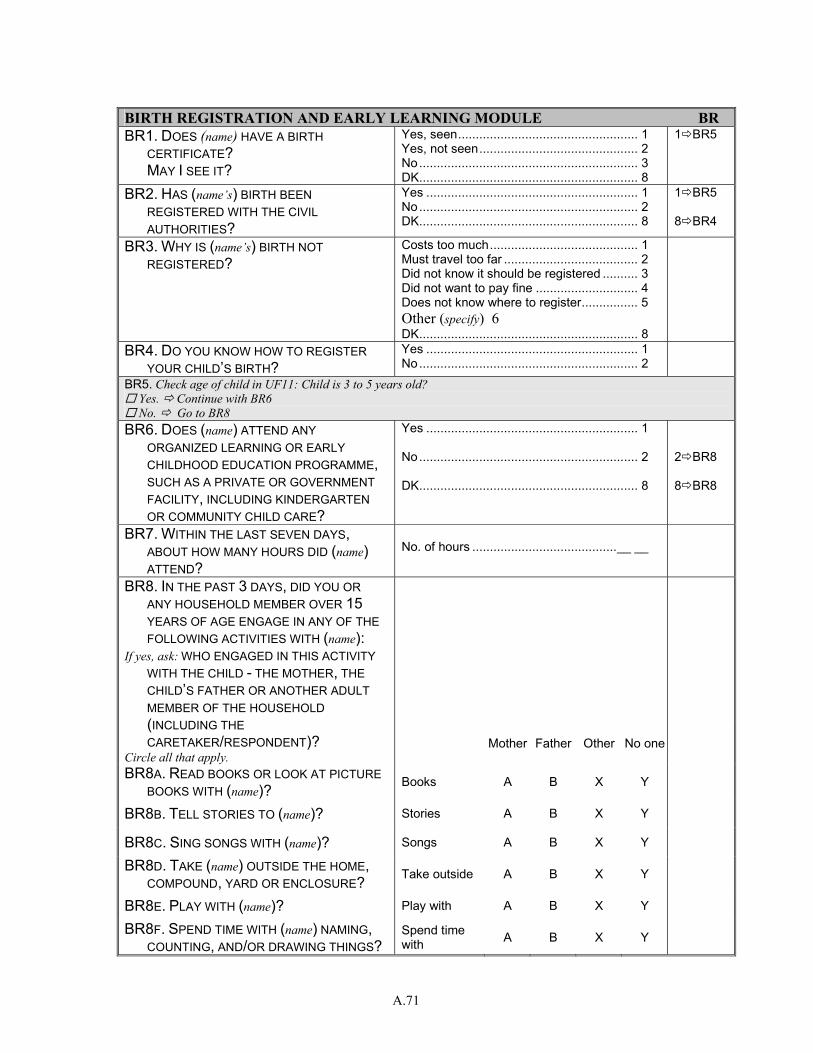
A.71
BIRTH REGISTRATION AND EARLY LEARNING MODULE BR BR1. DOES (name) HAVE A BIRTH
CERTIFICATE? MAY I SEE IT?
Yes, seen................................................... 1 Yes, not seen............................................. 2 No.............................................................. 3 DK.............................................................. 8
1 BR5
BR2. HAS (name’s) BIRTH BEEN REGISTERED WITH THE CIVIL AUTHORITIES?
Yes ............................................................ 1 No.............................................................. 2 DK.............................................................. 8
1 BR5 8 BR4
BR3. WHY IS (name’s) BIRTH NOT REGISTERED?
Costs too much.......................................... 1 Must travel too far ...................................... 2 Did not know it should be registered .......... 3 Did not want to pay fine ............................. 4 Does not know where to register................ 5 Other (specify) 6 DK.............................................................. 8
BR4. DO YOU KNOW HOW TO REGISTER YOUR CHILD’S BIRTH?
Yes ............................................................ 1 No.............................................................. 2
BR5. Check age of child in UF11: Child is 3 to 5 years old? Yes. Continue with BR6 No. Go to BR8
BR6. DOES (name) ATTEND ANY ORGANIZED LEARNING OR EARLY CHILDHOOD EDUCATION PROGRAMME, SUCH AS A PRIVATE OR GOVERNMENT FACILITY, INCLUDING KINDERGARTEN OR COMMUNITY CHILD CARE?
Yes ............................................................ 1 No.............................................................. 2 DK.............................................................. 8
2 BR8 8 BR8
BR7. WITHIN THE LAST SEVEN DAYS, ABOUT HOW MANY HOURS DID (name) ATTEND?
No. of hours .........................................__ __
BR8. IN THE PAST 3 DAYS, DID YOU OR ANY HOUSEHOLD MEMBER OVER 15 YEARS OF AGE ENGAGE IN ANY OF THE FOLLOWING ACTIVITIES WITH (name):
If yes, ask: WHO ENGAGED IN THIS ACTIVITY WITH THE CHILD - THE MOTHER, THE CHILD’S FATHER OR ANOTHER ADULT MEMBER OF THE HOUSEHOLD (INCLUDING THE CARETAKER/RESPONDENT)?
Circle all that apply. Mother Father Other No one
BR8A. READ BOOKS OR LOOK AT PICTURE BOOKS WITH (name)? Books A B X Y
BR8B. TELL STORIES TO (name)? Stories A B X Y
BR8C. SING SONGS WITH (name)? Songs A B X Y
BR8D. TAKE (name) OUTSIDE THE HOME, COMPOUND, YARD OR ENCLOSURE? Take outside A B X Y
BR8E. PLAY WITH (name)? Play with A B X Y
BR8F. SPEND TIME WITH (name) NAMING, COUNTING, AND/OR DRAWING THINGS?
Spend time with A B X Y
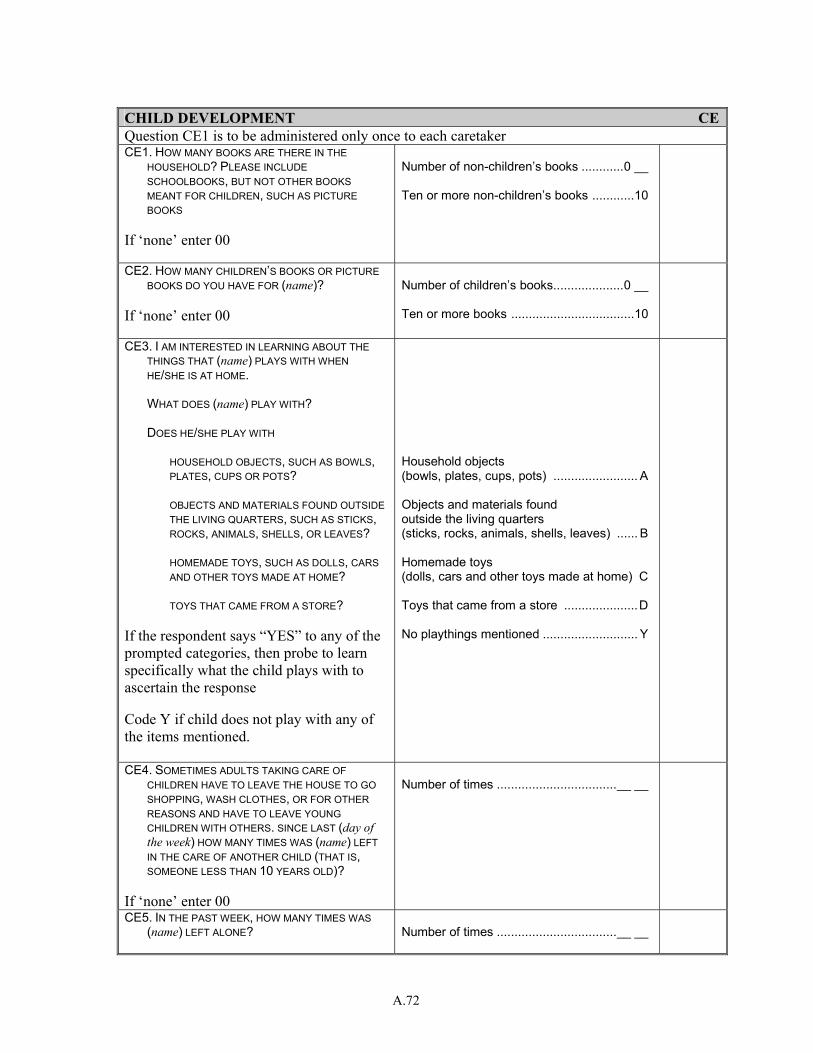
A.72
CHILD DEVELOPMENT CEQuestion CE1 is to be administered only once to each caretaker CE1. HOW MANY BOOKS ARE THERE IN THE
HOUSEHOLD? PLEASE INCLUDE SCHOOLBOOKS, BUT NOT OTHER BOOKS MEANT FOR CHILDREN, SUCH AS PICTURE BOOKS
If ‘none’ enter 00
Number of non-children’s books ............0 __ Ten or more non-children’s books ............10
CE2. HOW MANY CHILDREN’S BOOKS OR PICTURE BOOKS DO YOU HAVE FOR (name)?
If ‘none’ enter 00
Number of children’s books....................0 __ Ten or more books ...................................10
CE3. I AM INTERESTED IN LEARNING ABOUT THE THINGS THAT (name) PLAYS WITH WHEN HE/SHE IS AT HOME.
WHAT DOES (name) PLAY WITH? DOES HE/SHE PLAY WITH
HOUSEHOLD OBJECTS, SUCH AS BOWLS, PLATES, CUPS OR POTS?
OBJECTS AND MATERIALS FOUND OUTSIDE
THE LIVING QUARTERS, SUCH AS STICKS, ROCKS, ANIMALS, SHELLS, OR LEAVES?
HOMEMADE TOYS, SUCH AS DOLLS, CARS
AND OTHER TOYS MADE AT HOME? TOYS THAT CAME FROM A STORE? If the respondent says “YES” to any of the prompted categories, then probe to learn specifically what the child plays with to ascertain the response Code Y if child does not play with any of the items mentioned.
Household objects (bowls, plates, cups, pots) ........................ A Objects and materials found outside the living quarters (sticks, rocks, animals, shells, leaves) ...... B Homemade toys (dolls, cars and other toys made at home) C Toys that came from a store .....................D No playthings mentioned ........................... Y
CE4. SOMETIMES ADULTS TAKING CARE OF CHILDREN HAVE TO LEAVE THE HOUSE TO GO SHOPPING, WASH CLOTHES, OR FOR OTHER REASONS AND HAVE TO LEAVE YOUNG CHILDREN WITH OTHERS. SINCE LAST (day of the week) HOW MANY TIMES WAS (name) LEFT IN THE CARE OF ANOTHER CHILD (THAT IS, SOMEONE LESS THAN 10 YEARS OLD)?
If ‘none’ enter 00
Number of times ..................................__ __
CE5. IN THE PAST WEEK, HOW MANY TIMES WAS (name) LEFT ALONE?
Number of times ..................................__ __
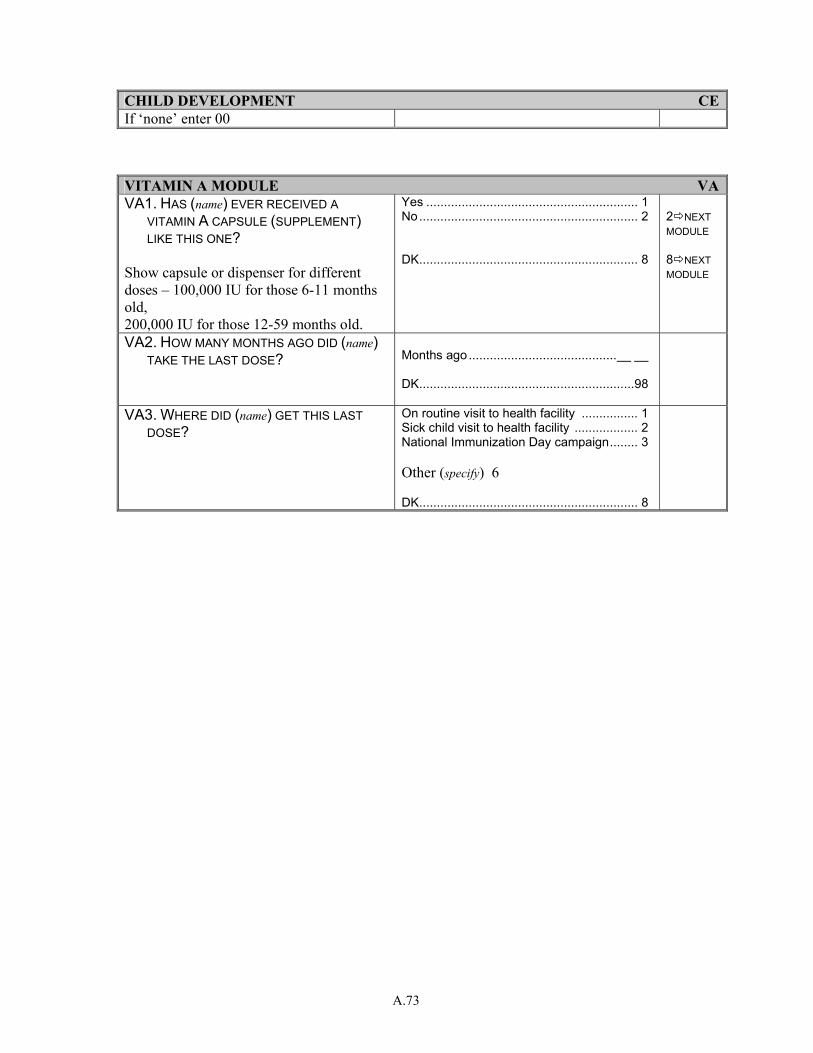
A.73
CHILD DEVELOPMENT CEIf ‘none’ enter 00 VITAMIN A MODULE VAVA1. HAS (name) EVER RECEIVED A
VITAMIN A CAPSULE (SUPPLEMENT) LIKE THIS ONE?
Show capsule or dispenser for different doses – 100,000 IU for those 6-11 months old, 200,000 IU for those 12-59 months old.
Yes ............................................................ 1 No.............................................................. 2 DK.............................................................. 8
2 NEXT MODULE 8 NEXT MODULE
VA2. HOW MANY MONTHS AGO DID (name) TAKE THE LAST DOSE?
Months ago..........................................__ __ DK.............................................................98
VA3. WHERE DID (name) GET THIS LAST DOSE?
On routine visit to health facility ................ 1 Sick child visit to health facility .................. 2 National Immunization Day campaign........ 3 Other (specify) 6 DK.............................................................. 8
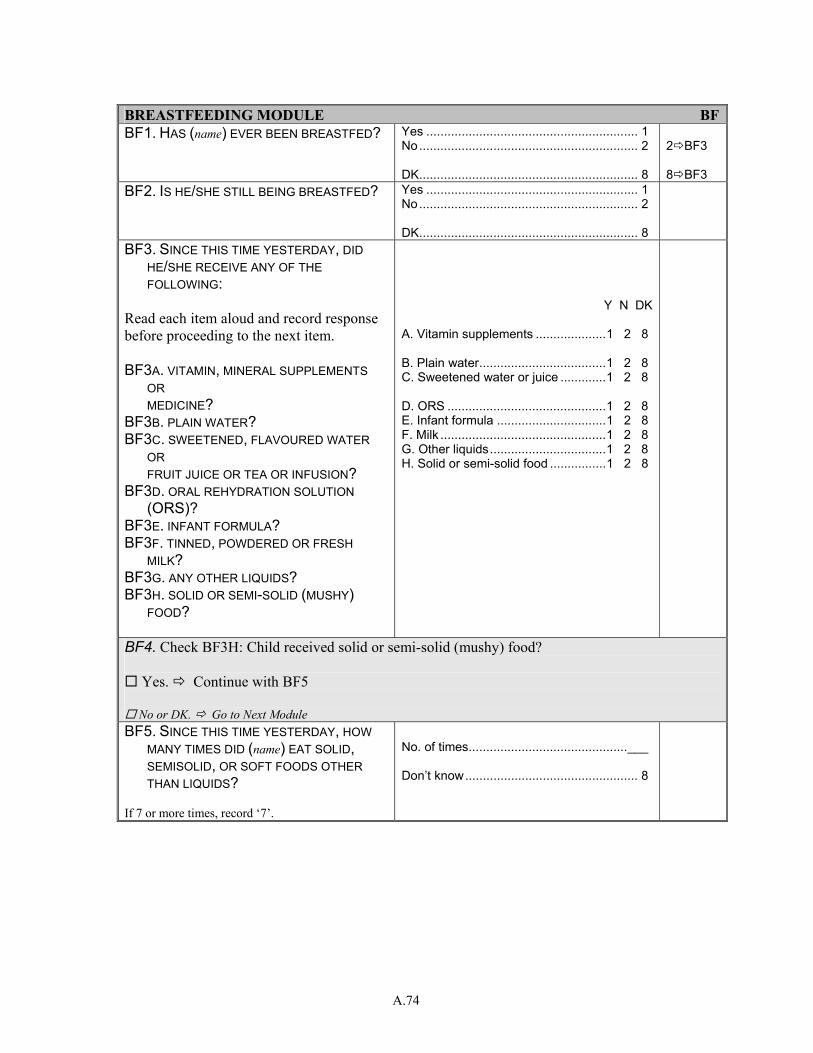
A.74
BREASTFEEDING MODULE BFBF1. HAS (name) EVER BEEN BREASTFED?
Yes ............................................................ 1 No.............................................................. 2 DK.............................................................. 8
2 BF3 8 BF3
BF2. IS HE/SHE STILL BEING BREASTFED? Yes ............................................................ 1 No.............................................................. 2 DK.............................................................. 8
BF3. SINCE THIS TIME YESTERDAY, DID HE/SHE RECEIVE ANY OF THE FOLLOWING:
Read each item aloud and record response before proceeding to the next item. BF3A. VITAMIN, MINERAL SUPPLEMENTS
OR MEDICINE?
BF3B. PLAIN WATER? BF3C. SWEETENED, FLAVOURED WATER
OR FRUIT JUICE OR TEA OR INFUSION?
BF3D. ORAL REHYDRATION SOLUTION (ORS)?
BF3E. INFANT FORMULA? BF3F. TINNED, POWDERED OR FRESH
MILK? BF3G. ANY OTHER LIQUIDS? BF3H. SOLID OR SEMI-SOLID (MUSHY)
FOOD?
Y N DK A. Vitamin supplements ....................1 2 8 B. Plain water....................................1 2 8 C. Sweetened water or juice .............1 2 8 D. ORS .............................................1 2 8 E. Infant formula ...............................1 2 8 F. Milk ...............................................1 2 8 G. Other liquids.................................1 2 8 H. Solid or semi-solid food ................1 2 8
BF4. Check BF3H: Child received solid or semi-solid (mushy) food?
Yes. Continue with BF5
No or DK. Go to Next Module
BF5. SINCE THIS TIME YESTERDAY, HOW MANY TIMES DID (name) EAT SOLID, SEMISOLID, OR SOFT FOODS OTHER THAN LIQUIDS?
If 7 or more times, record ‘7’.
No. of times.............................................___ Don’t know................................................. 8
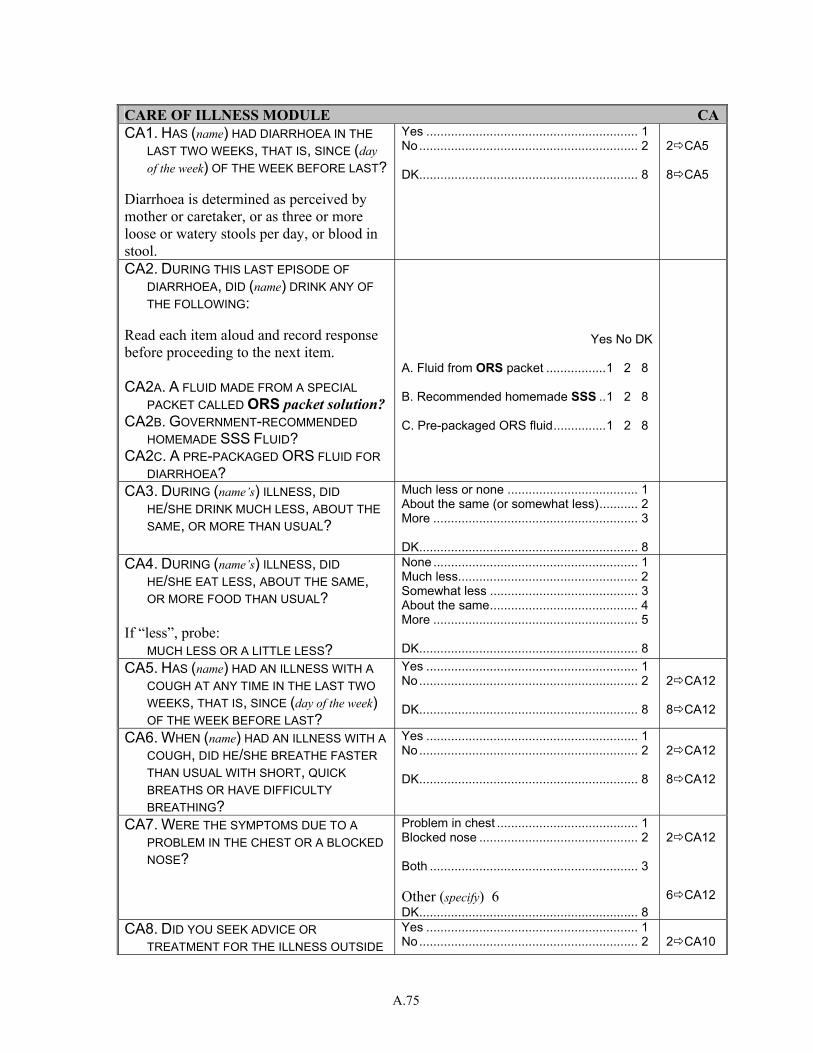
A.75
CARE OF ILLNESS MODULE CACA1. HAS (name) HAD DIARRHOEA IN THE
LAST TWO WEEKS, THAT IS, SINCE (day of the week) OF THE WEEK BEFORE LAST?
Diarrhoea is determined as perceived by mother or caretaker, or as three or more loose or watery stools per day, or blood in stool.
Yes ............................................................ 1 No.............................................................. 2 DK.............................................................. 8
2 CA5 8 CA5
CA2. DURING THIS LAST EPISODE OF DIARRHOEA, DID (name) DRINK ANY OF THE FOLLOWING:
Read each item aloud and record response before proceeding to the next item. CA2A. A FLUID MADE FROM A SPECIAL
PACKET CALLED ORS packet solution? CA2B. GOVERNMENT-RECOMMENDED
HOMEMADE SSS FLUID? CA2C. A PRE-PACKAGED ORS FLUID FOR
DIARRHOEA?
Yes No DK
A. Fluid from ORS packet .................1 2 8 B. Recommended homemade SSS ..1 2 8 C. Pre-packaged ORS fluid...............1 2 8
CA3. DURING (name’s) ILLNESS, DID HE/SHE DRINK MUCH LESS, ABOUT THE SAME, OR MORE THAN USUAL?
Much less or none ..................................... 1 About the same (or somewhat less)........... 2 More .......................................................... 3 DK.............................................................. 8
CA4. DURING (name’s) ILLNESS, DID HE/SHE EAT LESS, ABOUT THE SAME, OR MORE FOOD THAN USUAL?
If “less”, probe: MUCH LESS OR A LITTLE LESS?
None .......................................................... 1 Much less................................................... 2 Somewhat less .......................................... 3 About the same.......................................... 4 More .......................................................... 5 DK.............................................................. 8
CA5. HAS (name) HAD AN ILLNESS WITH A COUGH AT ANY TIME IN THE LAST TWO WEEKS, THAT IS, SINCE (day of the week) OF THE WEEK BEFORE LAST?
Yes ............................................................ 1 No.............................................................. 2 DK.............................................................. 8
2 CA12 8 CA12
CA6. WHEN (name) HAD AN ILLNESS WITH A COUGH, DID HE/SHE BREATHE FASTER THAN USUAL WITH SHORT, QUICK BREATHS OR HAVE DIFFICULTY BREATHING?
Yes ............................................................ 1 No.............................................................. 2 DK.............................................................. 8
2 CA12 8 CA12
CA7. WERE THE SYMPTOMS DUE TO A PROBLEM IN THE CHEST OR A BLOCKED NOSE?
Problem in chest ........................................ 1 Blocked nose ............................................. 2 Both ........................................................... 3 Other (specify) 6 DK.............................................................. 8
2 CA12 6 CA12
CA8. DID YOU SEEK ADVICE OR TREATMENT FOR THE ILLNESS OUTSIDE
Yes ............................................................ 1 No.............................................................. 2
2 CA10
A.76
CARE OF ILLNESS MODULE CATHE HOME?
DK.............................................................. 8 8 CA10
CA9. FROM WHERE DID YOU SEEK CARE? ANYWHERE ELSE?
Circle all providers mentioned, but do NOT prompt with any suggestions. If source is hospital, health center, or clinic, write the name of the place below. Probe to identify the type of source and circle the appropriate code.
(Name of place)
Public sources Govt. hospital ......................................... A Govt. health centre/post ......................... B Govt. MCH post .....................................C Village health worker..............................D Govt. Mobile/outreach clinic .................. E Other public (specify) H Private sources Private hospital/clinic............................... I Private physician.....................................J Pharmacy .............................................. K Mobile clinic .......................................... L Other private medical (specify) O Other source Relative or friend.................................... P Shop .....................................................Q Traditional practitioner ...........................R Other (specify) X
CA10. WAS (name) GIVEN MEDICINE TO TREAT THIS ILLNESS?
Yes ............................................................ 1 No.............................................................. 2 DK.............................................................. 8
2 CA12 8 CA12
CA11. WHAT MEDICINE WAS (name) GIVEN?
Circle all medicines given.
Antibiotic (like procaine, amoxicillin, tetracycline, ampicyline, etc) ................. A
Paracetamol/Panadol/Acetaminophen....... P Aspirin........................................................Q Ibupropfen..................................................R Other (specify) X DK.............................................................. Z
CA12. Check UF11: Child aged under 3?
Yes. Continue with CA13
No. Go to CA14
CA13. THE LAST TIME (name) PASSED STOOLS, WHAT WAS DONE TO DISPOSE OF THE STOOLS?
Child used toilet/latrine..............................01 Put/rinsed into toilet or latrine....................02 Put/rinsed into drain or ditch .....................03 Thrown into garbage (solid waste) ............04 Buried .......................................................05 Left in the open .........................................06 Other (specify) 96 DK.............................................................98
A.77
CARE OF ILLNESS MODULE CAAsk the following question (CA14) only once for each caretaker. CA14. SOMETIMES CHILDREN HAVE
SEVERE ILLNESSES AND SHOULD BE TAKEN IMMEDIATELY TO A HEALTH FACILITY.
WHAT TYPES OF SYMPTOMS WOULD CAUSE YOU TO TAKE YOUR CHILD TO A HEALTH FACILITY RIGHT AWAY?
Keep asking for more signs or symptoms until the caretaker cannot recall any additional symptoms. Circle all symptoms mentioned, But do NOT prompt with any suggestions.
Child not able to drink or breastfeed .......... A Child becomes sicker................................. B Child develops a fever ...............................C Child has fast breathing .............................D Child has difficult breathing........................ E Child has blood in stool.............................. F Child is drinking poorly...............................G Other (specify) X Other (specify) Y Other (specify) Z
A.78
MALARIA MODULE FOR UNDER-FIVES MLML1. IN THE LAST TWO WEEKS, THAT IS,
SINCE (day of the week) OF THE WEEK BEFORE LAST, HAS (name) BEEN ILL WITH A FEVER?
Yes ............................................................ 1 No.............................................................. 2 DK.............................................................. 8
2 ML10 8 ML10
ML2. WAS (name) SEEN AT A HEALTH FACILITY DURING THIS ILLNESS?
Yes ............................................................ 1 No.............................................................. 2 DK.............................................................. 8
2 ML6 8 ML6
ML3. DID (name) TAKE A MEDICINE FOR FEVER OR MALARIA THAT WAS PROVIDED OR PRESCRIBED AT THE HEALTH FACILITY?
Yes ............................................................ 1 No.............................................................. 2 DK.............................................................. 8
2 ML5 8 ML5
ML4. WHAT MEDICINE DID (name) TAKE THAT WAS PROVIDED OR PRESCRIBED AT THE HEALTH FACILITY?
Circle all medicines mentioned.
Anti-malarials: SP/Fansidar ........................................... A Chloroquine............................................ B Amodiaquine ..........................................C Quinine ..................................................D Artemisinin-based combinations ............ E Other anti-malarial (specify) H Other medications: Paracetamol/Panadol/Acetaminophen ... P Aspirin....................................................Q Ibuprofen................................................R Other (specify) X DK.............................................................. Z
ML5. WAS (name) GIVEN MEDICINE FOR THE FEVER OR MALARIA BEFORE BEING TAKEN TO THE HEALTH FACILITY?
Yes ............................................................ 1 No.............................................................. 2 DK.............................................................. 8
1 ML7 2 ML8 8 ML8
ML6. WAS (name) GIVEN MEDICINE FOR FEVER OR MALARIA DURING THIS ILLNESS?
Yes ............................................................ 1 No.............................................................. 2 DK.............................................................. 8
2 ML8 8 ML8
A.79
MALARIA MODULE FOR UNDER-FIVES ML ML7. WHAT MEDICINE WAS (name) GIVEN? Circle all medicines given. Ask to see the medication if type is not known. If type of medication is still not determined, show typical anti-malarials to respondent.
Anti-malarials: SP/Fansidar ........................................... A Chloroquine............................................ B Amodiaquine ..........................................C Quinine ..................................................D Artemisinin-based combinations ............ E Other anti-malarial (specify) H Other medications: Paracetamol/Panadol/Acetaminophen ... P Aspirin....................................................Q Ibuprofen................................................R Other (specify) X DK.............................................................. Z
ML8. Check ML4 and ML7: Anti-malarial mentioned (codes A - H)?
Yes. Continue with ML9
No. Go to ML10 ML9. HOW LONG AFTER THE FEVER
STARTED DID (name) FIRST TAKE (name of anti-malarial from ML4 or ML7)?
If multiple anti-malarials mentioned in ML4 or ML7, name all anti-malarial medicines mentioned. Record the code for the day on which the first anti-malarial was given.
Same day ................................................. 0 Next day ................................................... 1 2 days after the fever ................................. 2 3 days after the fever ................................. 3 4 or more days after the fever .................... 4 DK.............................................................. 8
ML10. DID (name) SLEEP UNDER A MOSQUITO NET LAST NIGHT?
Yes ............................................................ 1 No.............................................................. 2 DK.............................................................. 8
2 NEXT MODULE 8 NEXT MODULE
ML11. HOW LONG AGO DID YOUR HOUSEHOLD OBTAIN THE MOSQUITO NET?
If less than 1 month, record ‘00’. If answer is “12 months” or “1 year”, probe to determine if net was treated exactly 12 months ago or earlier or later.
Months ago..........................................__ __ More than 24 months ago .........................95 Not sure ....................................................98
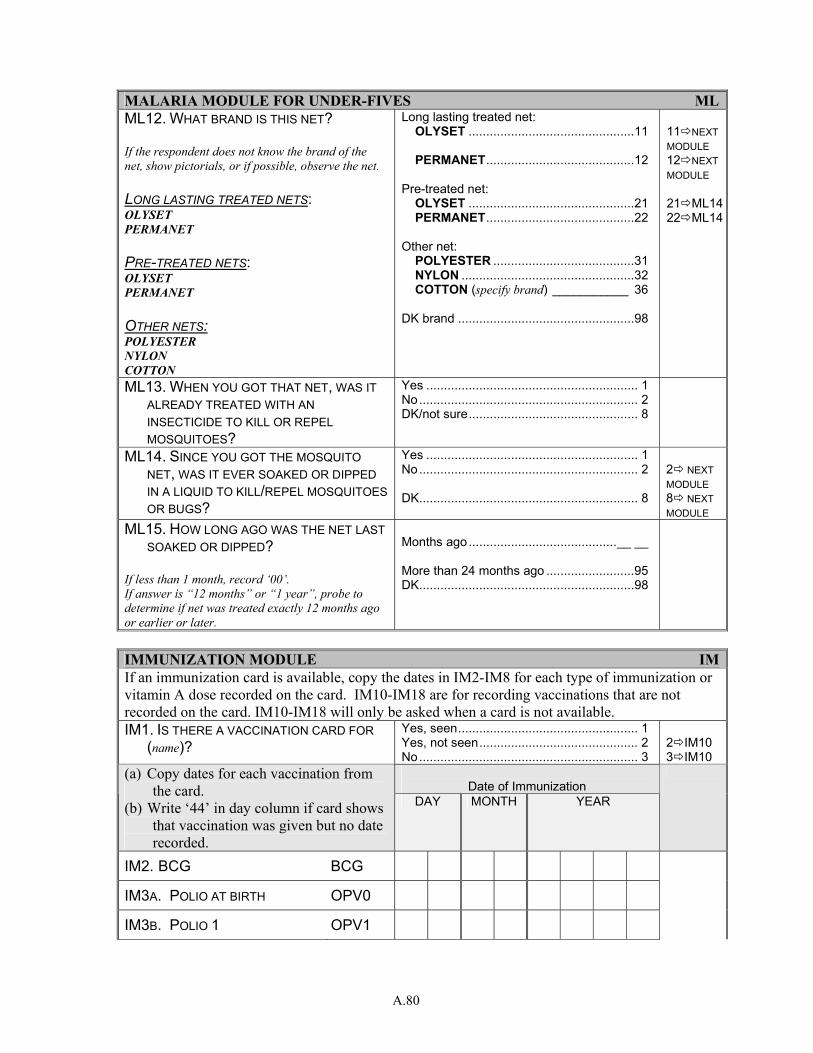
A.80
MALARIA MODULE FOR UNDER-FIVES MLML12. WHAT BRAND IS THIS NET? If the respondent does not know the brand of the net, show pictorials, or if possible, observe the net. LONG LASTING TREATED NETS: OLYSET PERMANET PRE-TREATED NETS: OLYSET PERMANET OTHER NETS: POLYESTER NYLON COTTON
Long lasting treated net: OLYSET ...............................................11 PERMANET..........................................12 Pre-treated net: OLYSET ...............................................21 PERMANET..........................................22 Other net: POLYESTER ........................................31 NYLON .................................................32 COTTON (specify brand) ___________ 36 DK brand ..................................................98
11 NEXT MODULE 12 NEXT MODULE 21 ML1422 ML14
ML13. WHEN YOU GOT THAT NET, WAS IT ALREADY TREATED WITH AN INSECTICIDE TO KILL OR REPEL MOSQUITOES?
Yes ............................................................ 1 No.............................................................. 2 DK/not sure................................................ 8
ML14. SINCE YOU GOT THE MOSQUITO NET, WAS IT EVER SOAKED OR DIPPED IN A LIQUID TO KILL/REPEL MOSQUITOES OR BUGS?
Yes ............................................................ 1 No.............................................................. 2 DK.............................................................. 8
2 NEXT MODULE 8 NEXT MODULE
ML15. HOW LONG AGO WAS THE NET LAST SOAKED OR DIPPED?
If less than 1 month, record ‘00’. If answer is “12 months” or “1 year”, probe to determine if net was treated exactly 12 months ago or earlier or later.
Months ago..........................................__ __ More than 24 months ago .........................95 DK.............................................................98
IMMUNIZATION MODULE IMIf an immunization card is available, copy the dates in IM2-IM8 for each type of immunization or vitamin A dose recorded on the card. IM10-IM18 are for recording vaccinations that are not recorded on the card. IM10-IM18 will only be asked when a card is not available. IM1. IS THERE A VACCINATION CARD FOR
(name)? Yes, seen................................................... 1 Yes, not seen............................................. 2 No.............................................................. 3
2 IM10 3 IM10
Date of Immunization
(a) Copy dates for each vaccination from the card.
(b) Write ‘44’ in day column if card shows that vaccination was given but no date recorded.
DAY MONTH YEAR
IM2. BCG BCG
IM3A. POLIO AT BIRTH OPV0
IM3B. POLIO 1 OPV1
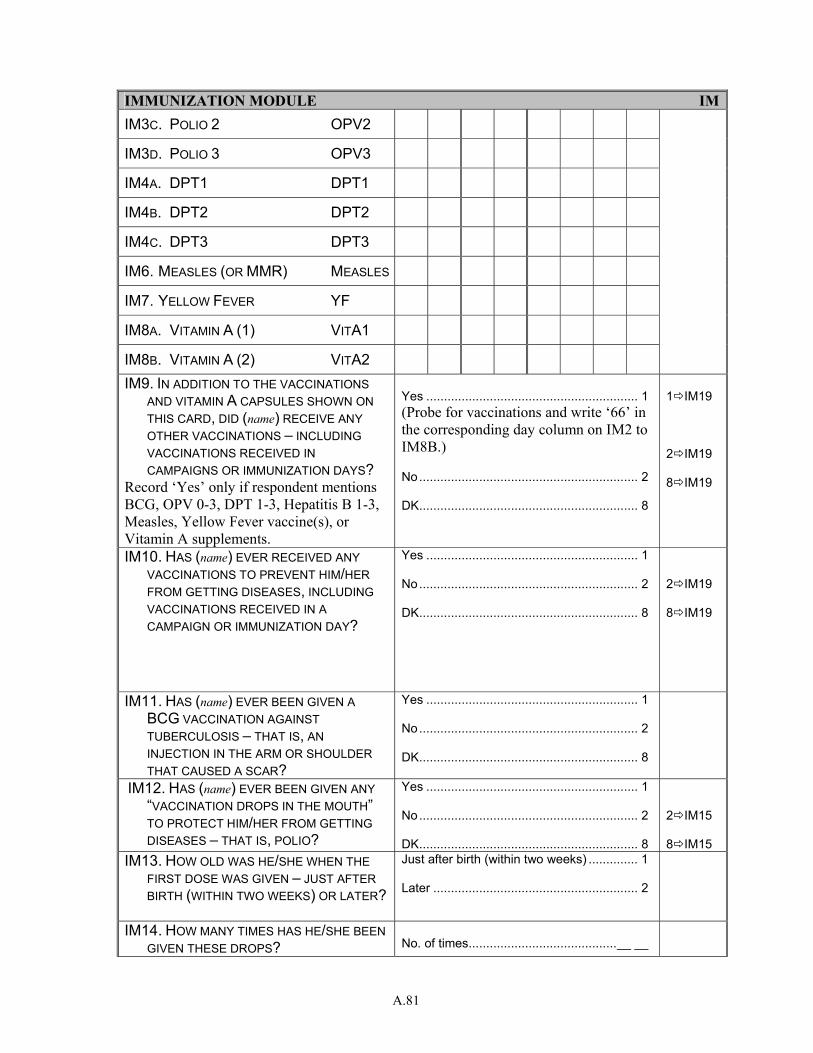
A.81
IMMUNIZATION MODULE IMIM3C. POLIO 2 OPV2
IM3D. POLIO 3 OPV3
IM4A. DPT1 DPT1
IM4B. DPT2 DPT2
IM4C. DPT3 DPT3
IM6. MEASLES (OR MMR) MEASLES
IM7. YELLOW FEVER YF
IM8A. VITAMIN A (1) VITA1
IM8B. VITAMIN A (2) VITA2
IM9. IN ADDITION TO THE VACCINATIONS AND VITAMIN A CAPSULES SHOWN ON THIS CARD, DID (name) RECEIVE ANY OTHER VACCINATIONS – INCLUDING VACCINATIONS RECEIVED IN CAMPAIGNS OR IMMUNIZATION DAYS?
Record ‘Yes’ only if respondent mentions BCG, OPV 0-3, DPT 1-3, Hepatitis B 1-3, Measles, Yellow Fever vaccine(s), or Vitamin A supplements.
Yes ............................................................ 1 (Probe for vaccinations and write ‘66’ in the corresponding day column on IM2 to IM8B.) No.............................................................. 2 DK.............................................................. 8
1 IM19 2 IM19 8 IM19
IM10. HAS (name) EVER RECEIVED ANY VACCINATIONS TO PREVENT HIM/HER FROM GETTING DISEASES, INCLUDING VACCINATIONS RECEIVED IN A CAMPAIGN OR IMMUNIZATION DAY?
Yes ............................................................ 1 No.............................................................. 2 DK.............................................................. 8
2 IM19 8 IM19
IM11. HAS (name) EVER BEEN GIVEN A BCG VACCINATION AGAINST TUBERCULOSIS – THAT IS, AN INJECTION IN THE ARM OR SHOULDER THAT CAUSED A SCAR?
Yes ............................................................ 1 No.............................................................. 2 DK.............................................................. 8
IM12. HAS (name) EVER BEEN GIVEN ANY “VACCINATION DROPS IN THE MOUTH” TO PROTECT HIM/HER FROM GETTING DISEASES – THAT IS, POLIO?
Yes ............................................................ 1 No.............................................................. 2 DK.............................................................. 8
2 IM15 8 IM15
IM13. HOW OLD WAS HE/SHE WHEN THE FIRST DOSE WAS GIVEN – JUST AFTER BIRTH (WITHIN TWO WEEKS) OR LATER?
Just after birth (within two weeks) .............. 1 Later .......................................................... 2
IM14. HOW MANY TIMES HAS HE/SHE BEEN GIVEN THESE DROPS?
No. of times..........................................__ __
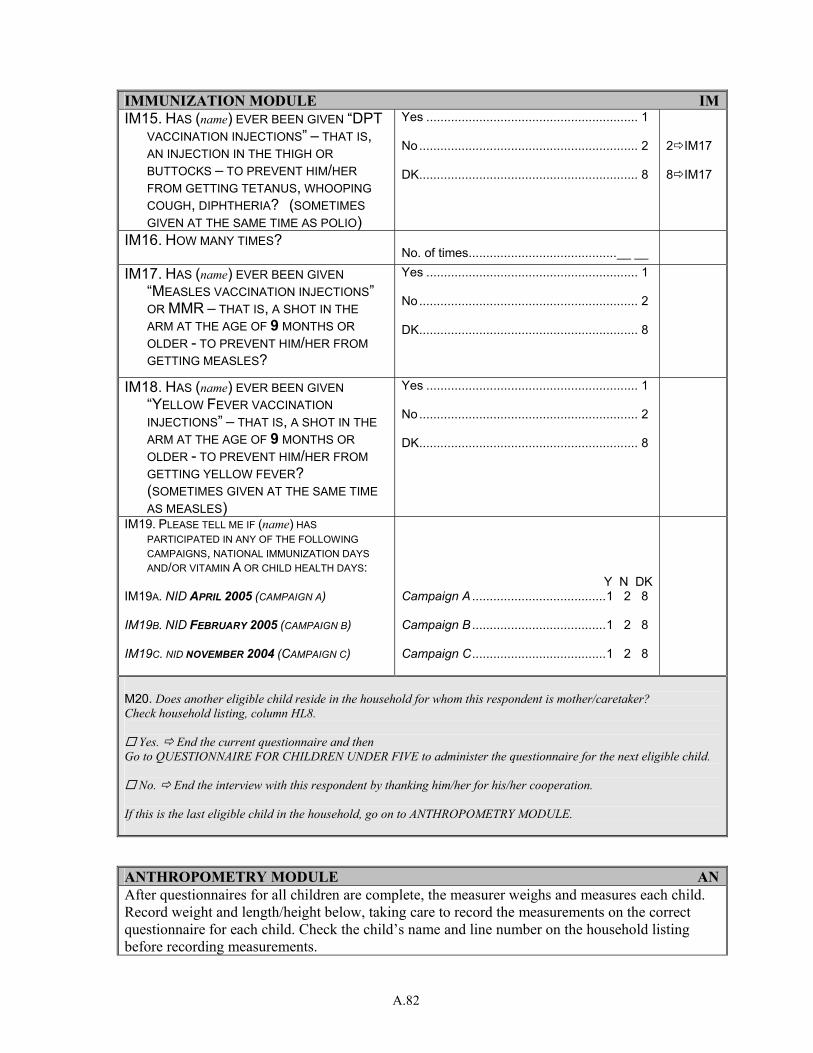
A.82
IMMUNIZATION MODULE IMIM15. HAS (name) EVER BEEN GIVEN “DPT
VACCINATION INJECTIONS” – THAT IS, AN INJECTION IN THE THIGH OR BUTTOCKS – TO PREVENT HIM/HER FROM GETTING TETANUS, WHOOPING COUGH, DIPHTHERIA? (SOMETIMES GIVEN AT THE SAME TIME AS POLIO)
Yes ............................................................ 1 No.............................................................. 2 DK.............................................................. 8
2 IM17 8 IM17
IM16. HOW MANY TIMES? No. of times..........................................__ __
IM17. HAS (name) EVER BEEN GIVEN “MEASLES VACCINATION INJECTIONS” OR MMR – THAT IS, A SHOT IN THE ARM AT THE AGE OF 9 MONTHS OR OLDER - TO PREVENT HIM/HER FROM GETTING MEASLES?
Yes ............................................................ 1 No.............................................................. 2 DK.............................................................. 8
IM18. HAS (name) EVER BEEN GIVEN “YELLOW FEVER VACCINATION INJECTIONS” – THAT IS, A SHOT IN THE ARM AT THE AGE OF 9 MONTHS OR OLDER - TO PREVENT HIM/HER FROM GETTING YELLOW FEVER?
(SOMETIMES GIVEN AT THE SAME TIME AS MEASLES)
Yes ............................................................ 1 No.............................................................. 2 DK.............................................................. 8
IM19. PLEASE TELL ME IF (name) HAS PARTICIPATED IN ANY OF THE FOLLOWING CAMPAIGNS, NATIONAL IMMUNIZATION DAYS AND/OR VITAMIN A OR CHILD HEALTH DAYS:
IM19A. NID APRIL 2005 (CAMPAIGN A)
IM19B. NID FEBRUARY 2005 (CAMPAIGN B)
IM19C. NID NOVEMBER 2004 (CAMPAIGN C)
Y N DK Campaign A ......................................1 2 8
Campaign B ......................................1 2 8
Campaign C......................................1 2 8
M20. Does another eligible child reside in the household for whom this respondent is mother/caretaker? Check household listing, column HL8.
Yes. End the current questionnaire and then Go to QUESTIONNAIRE FOR CHILDREN UNDER FIVE to administer the questionnaire for the next eligible child.
No. End the interview with this respondent by thanking him/her for his/her cooperation. If this is the last eligible child in the household, go on to ANTHROPOMETRY MODULE. ANTHROPOMETRY MODULE ANAfter questionnaires for all children are complete, the measurer weighs and measures each child. Record weight and length/height below, taking care to record the measurements on the correct questionnaire for each child. Check the child’s name and line number on the household listing before recording measurements.
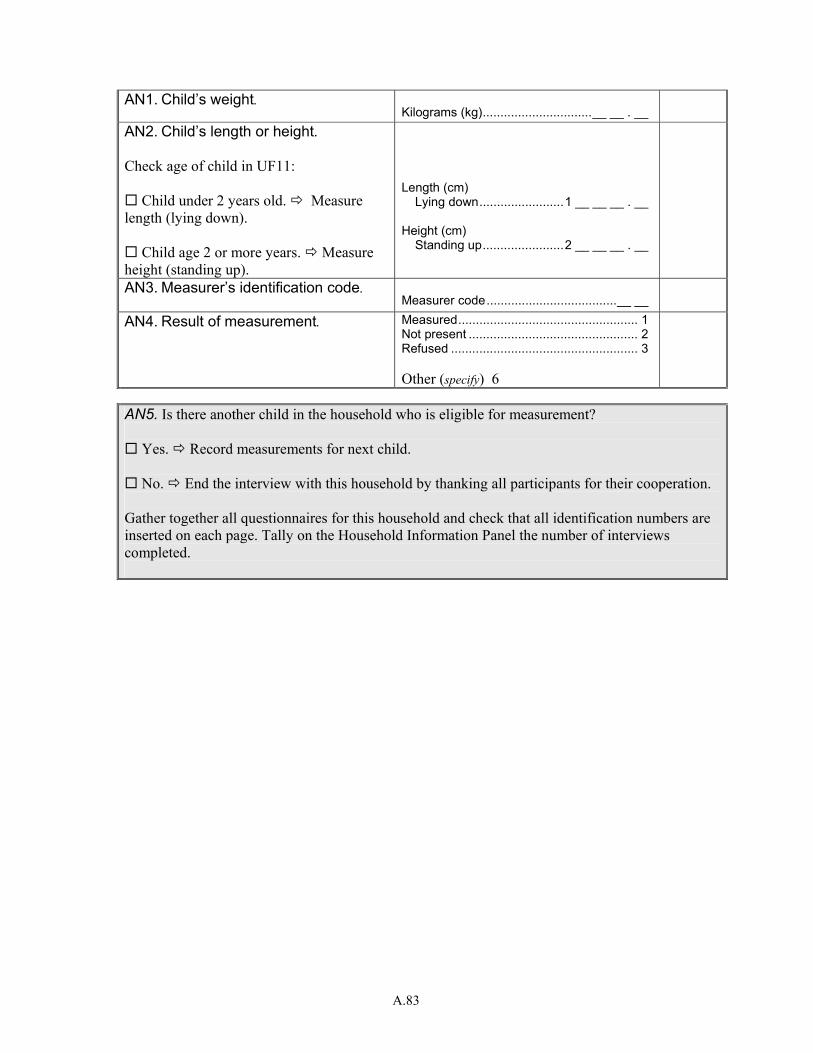
A.83
AN1. Child’s weight. Kilograms (kg)...............................__ __ . __
AN2. Child’s length or height. Check age of child in UF11:
Child under 2 years old. Measure length (lying down).
Child age 2 or more years. Measure height (standing up).
Length (cm)
Lying down........................1 __ __ __ . __ Height (cm)
Standing up.......................2 __ __ __ . __
AN3. Measurer’s identification code. Measurer code.....................................__ __
AN4. Result of measurement. Measured................................................... 1 Not present ................................................ 2 Refused ..................................................... 3 Other (specify) 6
AN5. Is there another child in the household who is eligible for measurement?
Yes. Record measurements for next child.
No. End the interview with this household by thanking all participants for their cooperation. Gather together all questionnaires for this household and check that all identification numbers are inserted on each page. Tally on the Household Information Panel the number of interviews completed.
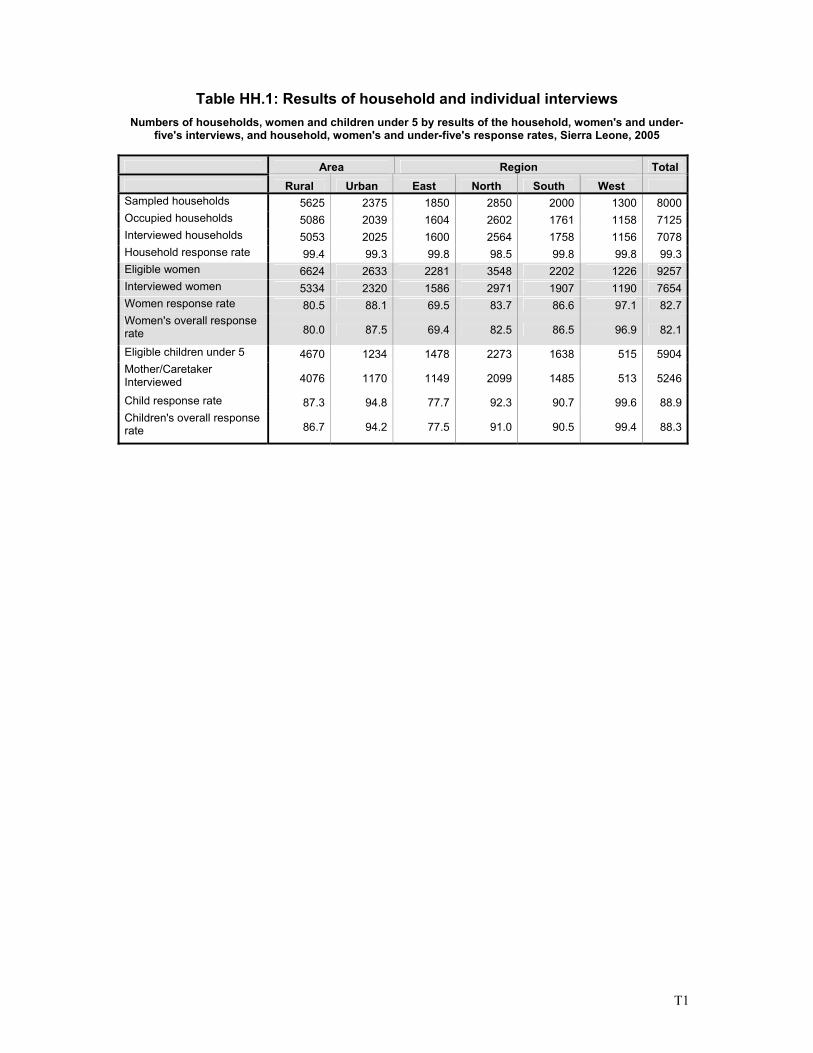
T1
Table HH.1: Results of household and individual interviews Numbers of households, women and children under 5 by results of the household, women's and under-
five's interviews, and household, women's and under-five's response rates, Sierra Leone, 2005
Area Region Total Rural Urban East North South West Sampled households 5625 2375 1850 2850 2000 1300 8000Occupied households 5086 2039 1604 2602 1761 1158 7125Interviewed households 5053 2025 1600 2564 1758 1156 7078Household response rate 99.4 99.3 99.8 98.5 99.8 99.8 99.3Eligible women 6624 2633 2281 3548 2202 1226 9257Interviewed women 5334 2320 1586 2971 1907 1190 7654Women response rate 80.5 88.1 69.5 83.7 86.6 97.1 82.7Women's overall response rate 80.0 87.5 69.4 82.5 86.5 96.9 82.1
Eligible children under 5 4670 1234 1478 2273 1638 515 5904Mother/Caretaker Interviewed 4076 1170 1149 2099 1485 513 5246
Child response rate 87.3 94.8 77.7 92.3 90.7 99.6 88.9Children's overall response rate 86.7 94.2 77.5 91.0 90.5 99.4 88.3
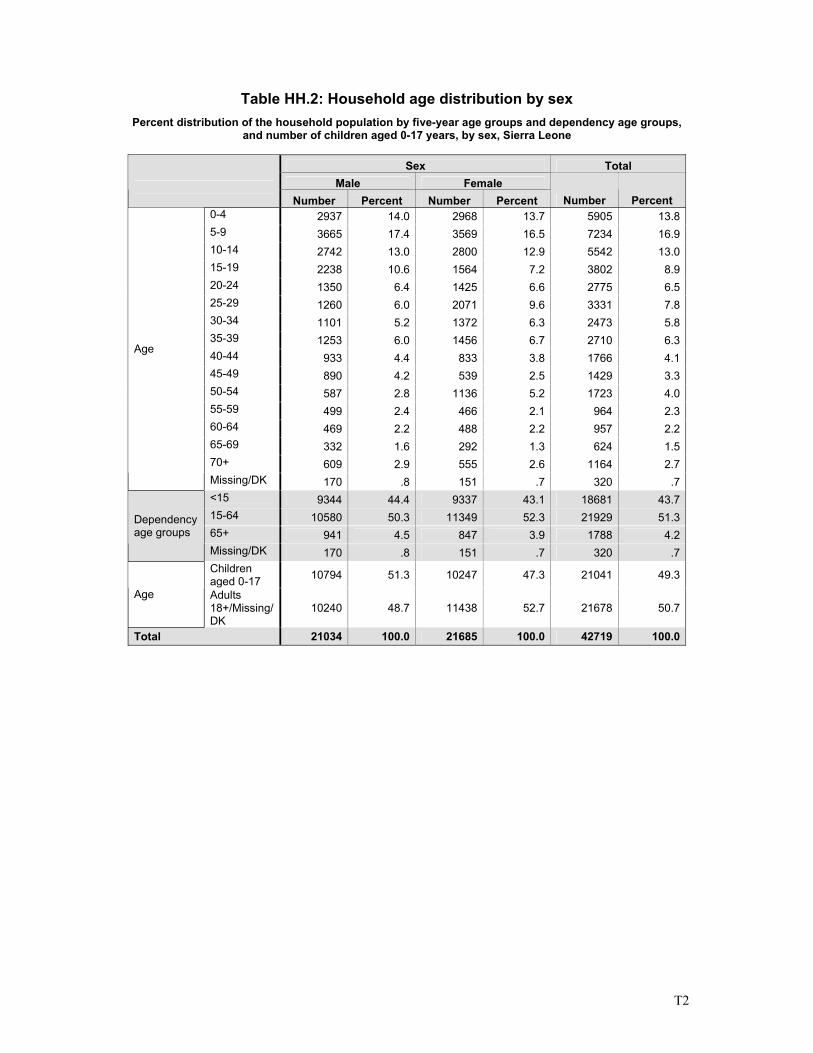
T2
Table HH.2: Household age distribution by sex Percent distribution of the household population by five-year age groups and dependency age groups,
and number of children aged 0-17 years, by sex, Sierra Leone
Sex Total Male Female
Number Percent Number Percent Number Percent 0-4 2937 14.0 2968 13.7 5905 13.85-9 3665 17.4 3569 16.5 7234 16.910-14 2742 13.0 2800 12.9 5542 13.015-19 2238 10.6 1564 7.2 3802 8.920-24 1350 6.4 1425 6.6 2775 6.525-29 1260 6.0 2071 9.6 3331 7.830-34 1101 5.2 1372 6.3 2473 5.835-39 1253 6.0 1456 6.7 2710 6.340-44 933 4.4 833 3.8 1766 4.145-49 890 4.2 539 2.5 1429 3.350-54 587 2.8 1136 5.2 1723 4.055-59 499 2.4 466 2.1 964 2.360-64 469 2.2 488 2.2 957 2.265-69 332 1.6 292 1.3 624 1.570+ 609 2.9 555 2.6 1164 2.7
Age
Missing/DK 170 .8 151 .7 320 .7<15 9344 44.4 9337 43.1 18681 43.715-64 10580 50.3 11349 52.3 21929 51.365+ 941 4.5 847 3.9 1788 4.2
Dependency age groups
Missing/DK 170 .8 151 .7 320 .7Children aged 0-17 10794 51.3 10247 47.3 21041 49.3
Age Adults 18+/Missing/DK
10240 48.7 11438 52.7 21678 50.7
Total 21034 100.0 21685 100.0 42719 100.0
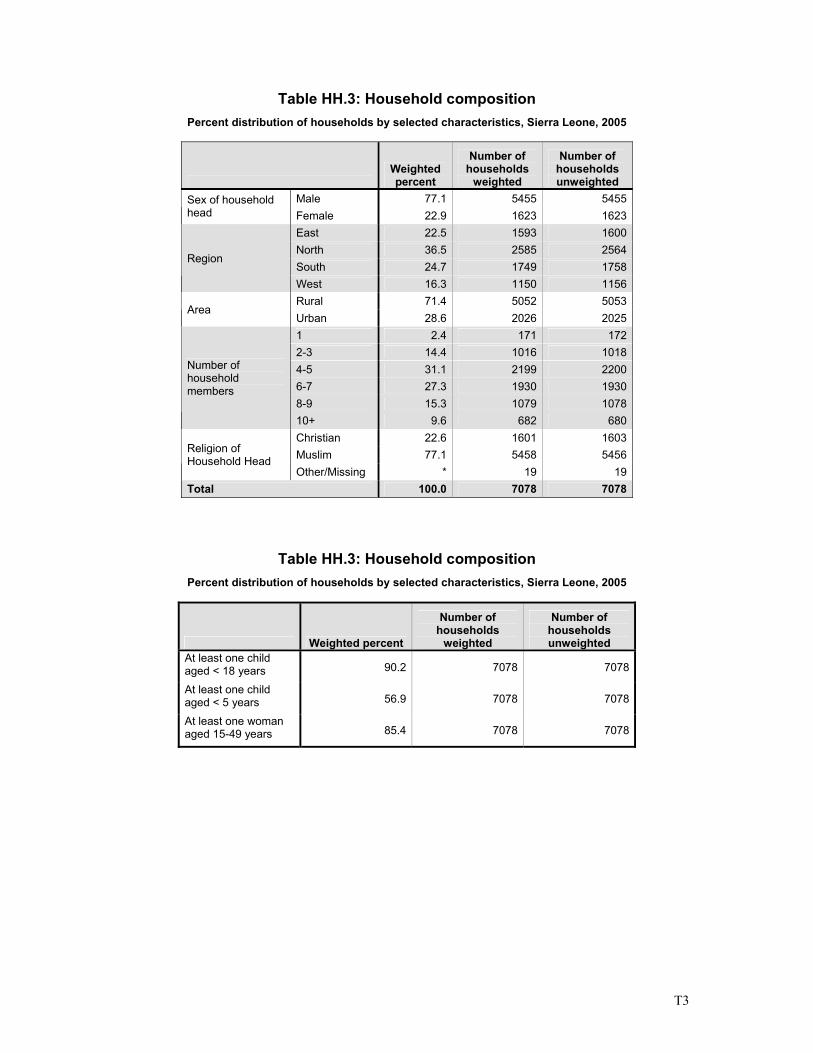
T3
Table HH.3: Household composition Percent distribution of households by selected characteristics, Sierra Leone, 2005
Weighted percent
Number of households
weighted
Number of households unweighted
Male 77.1 5455 5455 Sex of household head Female 22.9 1623 1623
East 22.5 1593 1600 North 36.5 2585 2564 South 24.7 1749 1758
Region
West 16.3 1150 1156 Rural 71.4 5052 5053
Area Urban 28.6 2026 2025 1 2.4 171 172 2-3 14.4 1016 1018 4-5 31.1 2199 2200 6-7 27.3 1930 1930 8-9 15.3 1079 1078
Number of household members
10+ 9.6 682 680 Christian 22.6 1601 1603 Muslim 77.1 5458 5456 Religion of
Household Head Other/Missing * 19 19
Total 100.0 7078 7078
Table HH.3: Household composition Percent distribution of households by selected characteristics, Sierra Leone, 2005
Weighted percent
Number of households
weighted
Number of households unweighted
At least one child aged < 18 years 90.2 7078 7078
At least one child aged < 5 years 56.9 7078 7078
At least one woman aged 15-49 years 85.4 7078 7078
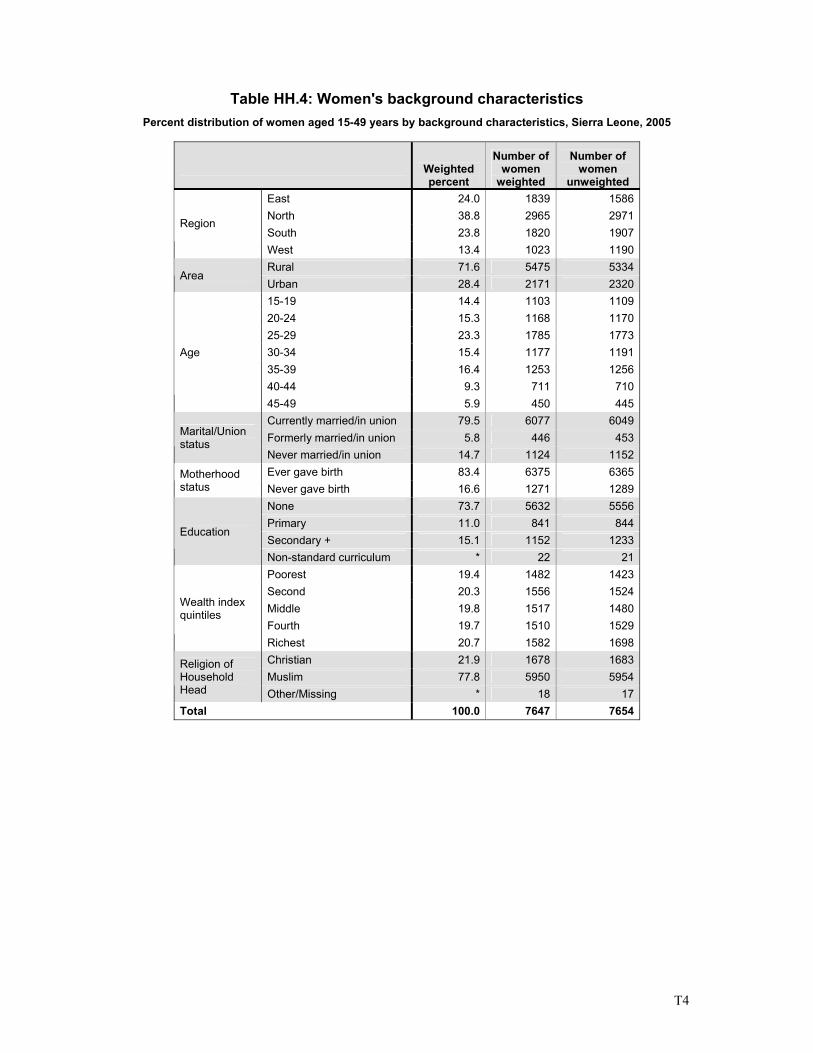
T4
Table HH.4: Women's background characteristics Percent distribution of women aged 15-49 years by background characteristics, Sierra Leone, 2005
Weighted percent
Number of women
weighted
Number of women
unweighted East 24.0 1839 1586 North 38.8 2965 2971 South 23.8 1820 1907
Region
West 13.4 1023 1190 Rural 71.6 5475 5334
Area Urban 28.4 2171 2320 15-19 14.4 1103 1109 20-24 15.3 1168 1170 25-29 23.3 1785 1773 30-34 15.4 1177 1191 35-39 16.4 1253 1256 40-44 9.3 711 710
Age
45-49 5.9 450 445 Currently married/in union 79.5 6077 6049 Formerly married/in union 5.8 446 453 Marital/Union
status Never married/in union 14.7 1124 1152 Ever gave birth 83.4 6375 6365 Motherhood
status Never gave birth 16.6 1271 1289 None 73.7 5632 5556 Primary 11.0 841 844 Secondary + 15.1 1152 1233
Education
Non-standard curriculum * 22 21 Poorest 19.4 1482 1423 Second 20.3 1556 1524 Middle 19.8 1517 1480 Fourth 19.7 1510 1529
Wealth index quintiles
Richest 20.7 1582 1698 Christian 21.9 1678 1683 Muslim 77.8 5950 5954
Religion of Household Head Other/Missing * 18 17 Total 100.0 7647 7654
T5
Table HH.5: Children's background characteristics
Percent distribution of children under five years of age by background characteristics, Sierra Leone, 2005
Weighted percent
Number of under-5 children weighted
Number of under-5 children
unweighted Male 49.7 2605 2609
Sex Female 50.3 2639 2637 East 24.8 1300 1149 North 38.9 2040 2099 South 27.5 1444 1485
Region
West 8.8 460 513 Rural 79.0 4144 4076
Area Urban 21.0 1101 1170 < 6 months 9.6 503 500 6-11 months 9.8 513 517 12-23 months 20.6 1074 1073 24-35 months 20.5 1069 1071 36-47 months 22.6 1181 1177
Age
48-59 months 16.9 884 889 None 80.6 4226 4199 Primary 10.3 541 543 Mother's
education Secondary 9.0 473 500 Poorest 21.1 1109 1083 Second 23.5 1231 1212 Middle 22.0 1156 1140 Fourth 19.4 1020 1036
Wealth index quintiles
Richest 13.9 729 775 Christian 19.0 995 992 Muslim 80.8 4240 4245
Religion of Household Head Other/Missing * 9 9 Total 100.0 5245 5246
** Cases of Non-Standard Curriculum = 2 and Missing/DK = 2 for mother’s education deleted from the table
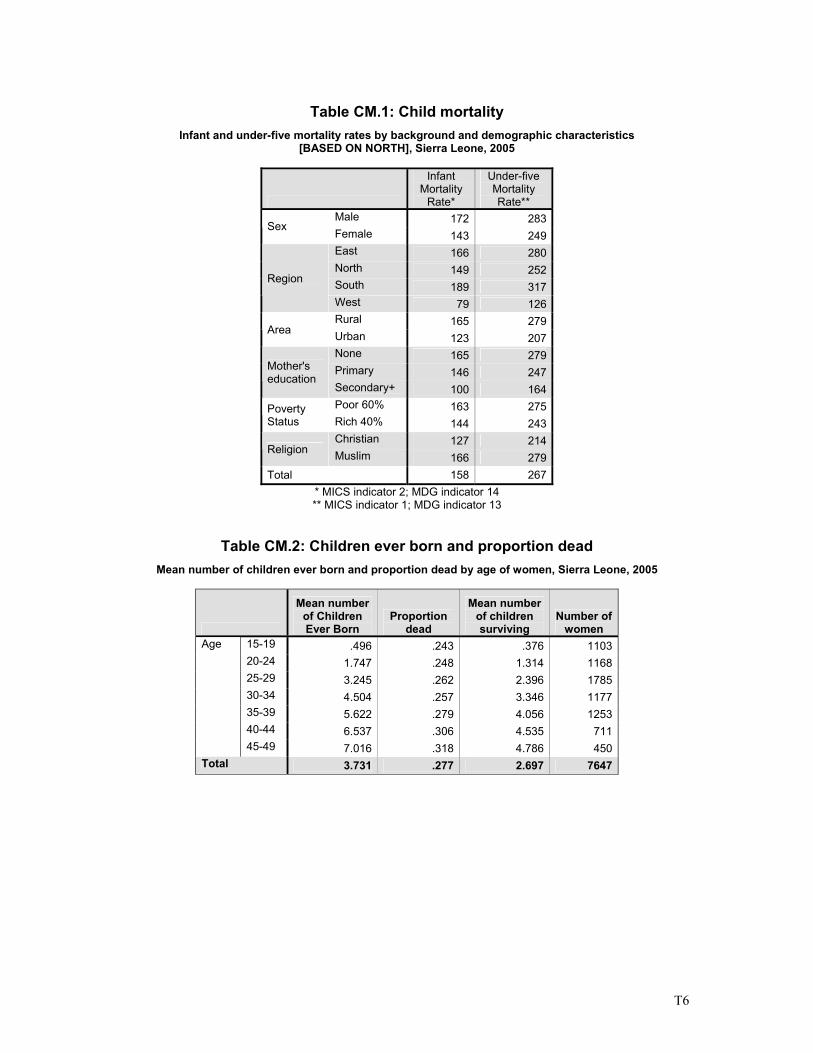
T6
Table CM.1: Child mortality
Infant and under-five mortality rates by background and demographic characteristics [BASED ON NORTH], Sierra Leone, 2005
Infant Mortality
Rate*
Under-five Mortality Rate**
Male 172 283Sex
Female 143 249East 166 280North 149 252South 189 317
Region
West 79 126Rural 165 279
Area Urban 123 207None 165 279Primary 146 247Mother's
education Secondary+ 100 164Poor 60% 163 275Poverty
Status Rich 40% 144 243Christian 127 214
Religion Muslim 166 279Total 158 267
* MICS indicator 2; MDG indicator 14 ** MICS indicator 1; MDG indicator 13
Table CM.2: Children ever born and proportion dead Mean number of children ever born and proportion dead by age of women, Sierra Leone, 2005
Mean number of Children Ever Born
Proportion dead
Mean number of children surviving
Number of women
15-19 .496 .243 .376 1103 20-24 1.747 .248 1.314 1168 25-29 3.245 .262 2.396 1785 30-34 4.504 .257 3.346 1177 35-39 5.622 .279 4.056 1253 40-44 6.537 .306 4.535 711
Age
45-49 7.016 .318 4.786 450 Total 3.731 .277 2.697 7647
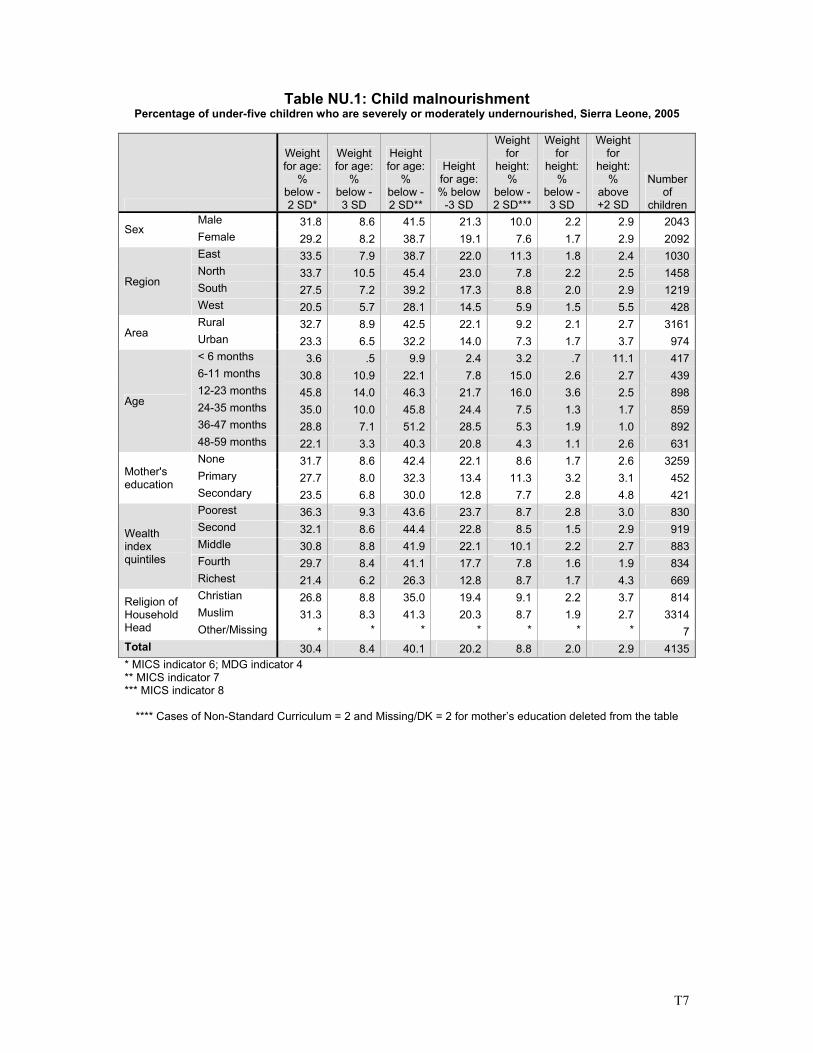
T7
Table NU.1: Child malnourishment Percentage of under-five children who are severely or moderately undernourished, Sierra Leone, 2005
Weight for age:
% below -2 SD*
Weight for age:
% below -3 SD
Height for age:
% below -2 SD**
Height for age: % below
-3 SD
Weight for
height: %
below -2 SD***
Weight for
height: %
below -3 SD
Weight for
height: %
above +2 SD
Number of
children Male 31.8 8.6 41.5 21.3 10.0 2.2 2.9 2043
Sex Female 29.2 8.2 38.7 19.1 7.6 1.7 2.9 2092East 33.5 7.9 38.7 22.0 11.3 1.8 2.4 1030North 33.7 10.5 45.4 23.0 7.8 2.2 2.5 1458South 27.5 7.2 39.2 17.3 8.8 2.0 2.9 1219
Region
West 20.5 5.7 28.1 14.5 5.9 1.5 5.5 428Rural 32.7 8.9 42.5 22.1 9.2 2.1 2.7 3161
Area Urban 23.3 6.5 32.2 14.0 7.3 1.7 3.7 974< 6 months 3.6 .5 9.9 2.4 3.2 .7 11.1 4176-11 months 30.8 10.9 22.1 7.8 15.0 2.6 2.7 43912-23 months 45.8 14.0 46.3 21.7 16.0 3.6 2.5 89824-35 months 35.0 10.0 45.8 24.4 7.5 1.3 1.7 85936-47 months 28.8 7.1 51.2 28.5 5.3 1.9 1.0 892
Age
48-59 months 22.1 3.3 40.3 20.8 4.3 1.1 2.6 631None 31.7 8.6 42.4 22.1 8.6 1.7 2.6 3259Primary 27.7 8.0 32.3 13.4 11.3 3.2 3.1 452Mother's
education Secondary 23.5 6.8 30.0 12.8 7.7 2.8 4.8 421Poorest 36.3 9.3 43.6 23.7 8.7 2.8 3.0 830Second 32.1 8.6 44.4 22.8 8.5 1.5 2.9 919Middle 30.8 8.8 41.9 22.1 10.1 2.2 2.7 883Fourth 29.7 8.4 41.1 17.7 7.8 1.6 1.9 834
Wealth index quintiles
Richest 21.4 6.2 26.3 12.8 8.7 1.7 4.3 669Christian 26.8 8.8 35.0 19.4 9.1 2.2 3.7 814Muslim 31.3 8.3 41.3 20.3 8.7 1.9 2.7 3314
Religion of Household Head Other/Missing * * * * * * * 7Total 30.4 8.4 40.1 20.2 8.8 2.0 2.9 4135* MICS indicator 6; MDG indicator 4 ** MICS indicator 7 *** MICS indicator 8
**** Cases of Non-Standard Curriculum = 2 and Missing/DK = 2 for mother’s education deleted from the table
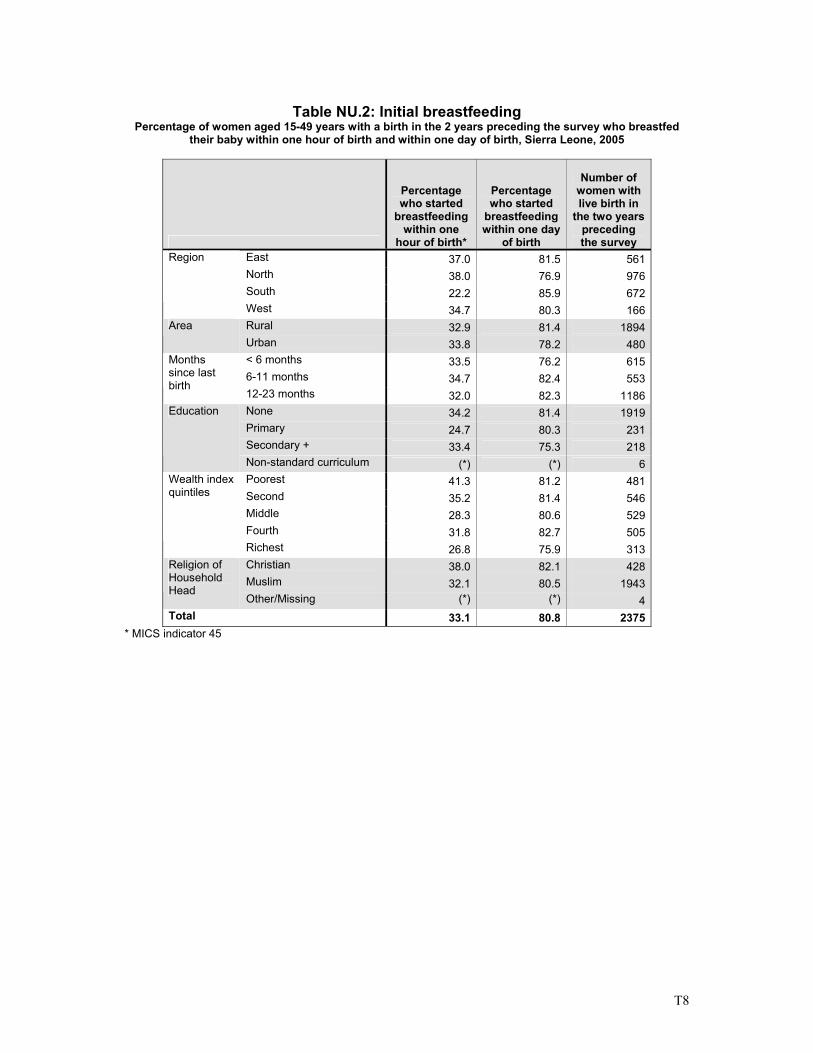
T8
Table NU.2: Initial breastfeeding
Percentage of women aged 15-49 years with a birth in the 2 years preceding the survey who breastfed their baby within one hour of birth and within one day of birth, Sierra Leone, 2005
Percentage who started
breastfeeding within one
hour of birth*
Percentage who started
breastfeeding within one day
of birth
Number of women with live birth in
the two years preceding the survey
East 37.0 81.5 561 North 38.0 76.9 976 South 22.2 85.9 672
Region
West 34.7 80.3 166 Rural 32.9 81.4 1894 Area Urban 33.8 78.2 480 < 6 months 33.5 76.2 615 6-11 months 34.7 82.4 553
Months since last birth
12-23 months 32.0 82.3 1186 None 34.2 81.4 1919 Primary 24.7 80.3 231 Secondary + 33.4 75.3 218
Education
Non-standard curriculum (*) (*) 6 Poorest 41.3 81.2 481 Second 35.2 81.4 546 Middle 28.3 80.6 529 Fourth 31.8 82.7 505
Wealth index quintiles
Richest 26.8 75.9 313 Christian 38.0 82.1 428 Muslim 32.1 80.5 1943
Religion of Household Head
Other/Missing (*) (*) 4 Total 33.1 80.8 2375
* MICS indicator 45
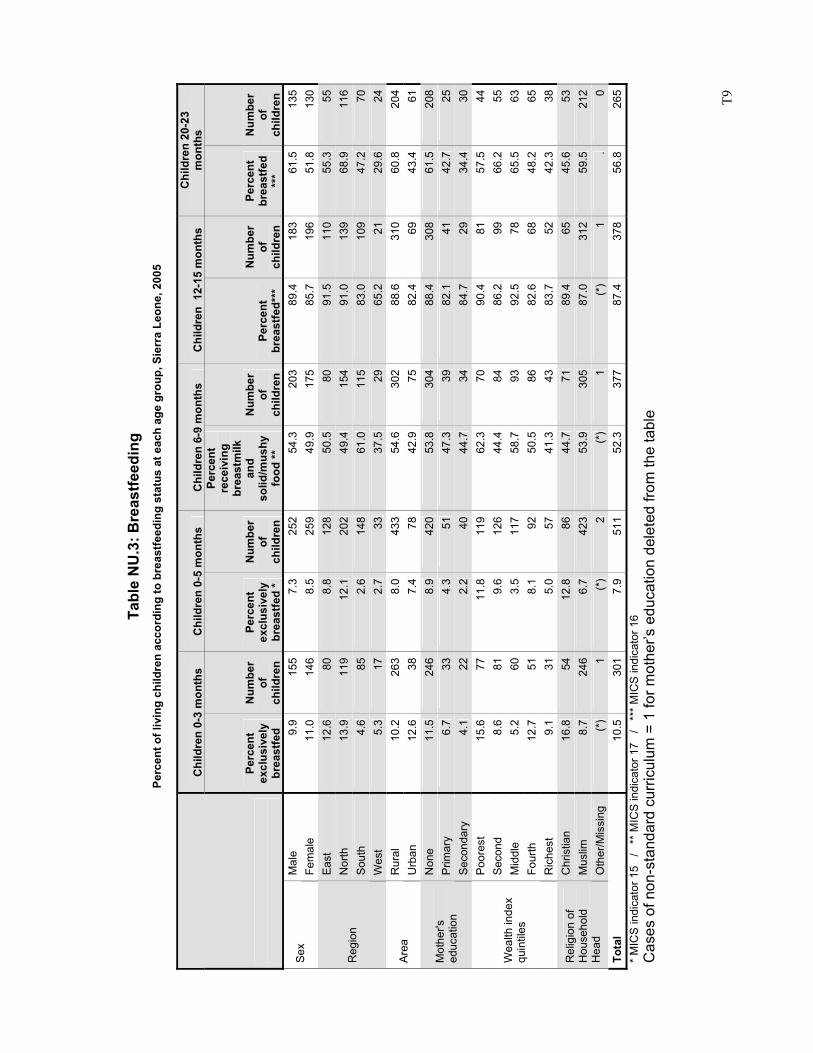
T9
Tabl
e N
U.3
: Bre
astfe
edin
g Pe
rcen
t of l
ivin
g ch
ildre
n ac
cord
ing
to b
reas
tfeed
ing
stat
us a
t eac
h ag
e gr
oup,
Sie
rra
Leon
e, 2
005
Chi
ldre
n 0-
3 m
onth
s C
hild
ren
0-5
mon
ths
Chi
ldre
n 6-
9 m
onth
s C
hild
ren
12-
15 m
onth
s C
hild
ren
20-2
3 m
onth
s
Perc
ent
excl
usiv
ely
brea
stfe
d
Num
ber
of
child
ren
Perc
ent
excl
usiv
ely
brea
stfe
d *
Num
ber
of
child
ren
Perc
ent
rece
ivin
g br
east
milk
an
d so
lid/m
ushy
fo
od **
Num
ber
of
child
ren
Perc
ent
brea
stfe
d***
Num
ber
of
child
ren
Perc
ent
brea
stfe
d **
*
Num
ber
of
child
ren
Mal
e 9.
915
57.
325
254
.3
203
89.4
183
61.5
135
Sex
Fem
ale
11.0
146
8.5
259
49.9
17
585
.719
651
.813
0E
ast
12.6
808.
812
850
.5
8091
.511
055
.355
Nor
th
13.9
119
12.1
202
49.4
15
491
.013
968
.911
6So
uth
4.6
852.
614
861
.0
115
83.0
109
47.2
70R
egio
n
Wes
t 5.
317
2.7
3337
.5
2965
.221
29.6
24R
ural
10
.226
38.
043
354
.6
302
88.6
310
60.8
204
Area
U
rban
12
.638
7.4
7842
.9
7582
.469
43.4
61N
one
11.5
246
8.9
420
53.8
30
488
.430
861
.520
8P
rimar
y 6.
733
4.3
5147
.3
3982
.141
42.7
25M
othe
r's
educ
atio
n Se
cond
ary
4.1
222.
240
44.7
34
84.7
2934
.430
Poor
est
15.6
7711
.811
962
.3
7090
.481
57.5
44S
econ
d 8.
681
9.6
126
44.4
84
86.2
9966
.255
Mid
dle
5.2
603.
511
758
.7
9392
.578
65.5
63Fo
urth
12
.751
8.1
9250
.5
8682
.668
48.2
65
Wea
lth in
dex
quin
tiles
Ric
hest
9.
131
5.0
5741
.3
4383
.752
42.3
38C
hris
tian
16.8
5412
.886
44.7
71
89.4
6545
.653
Mus
lim
8.7
246
6.7
423
53.9
30
587
.031
259
.521
2R
elig
ion
of
Hou
seho
ld
Hea
d O
ther
/Mis
sing
(*
)1
(*)
2(*
) 1
(*)
1.
0To
tal
10.5
301
7.9
511
52.3
37
787
.437
856
.826
5*
MIC
S in
dica
tor 1
5 /
**
MIC
S in
dica
tor 1
7 /
**
* M
ICS
indi
cato
r 16
Cas
es o
f non
-sta
ndar
d cu
rric
ulum
= 1
for m
othe
r’s e
duca
tion
dele
ted
from
the
tabl
e
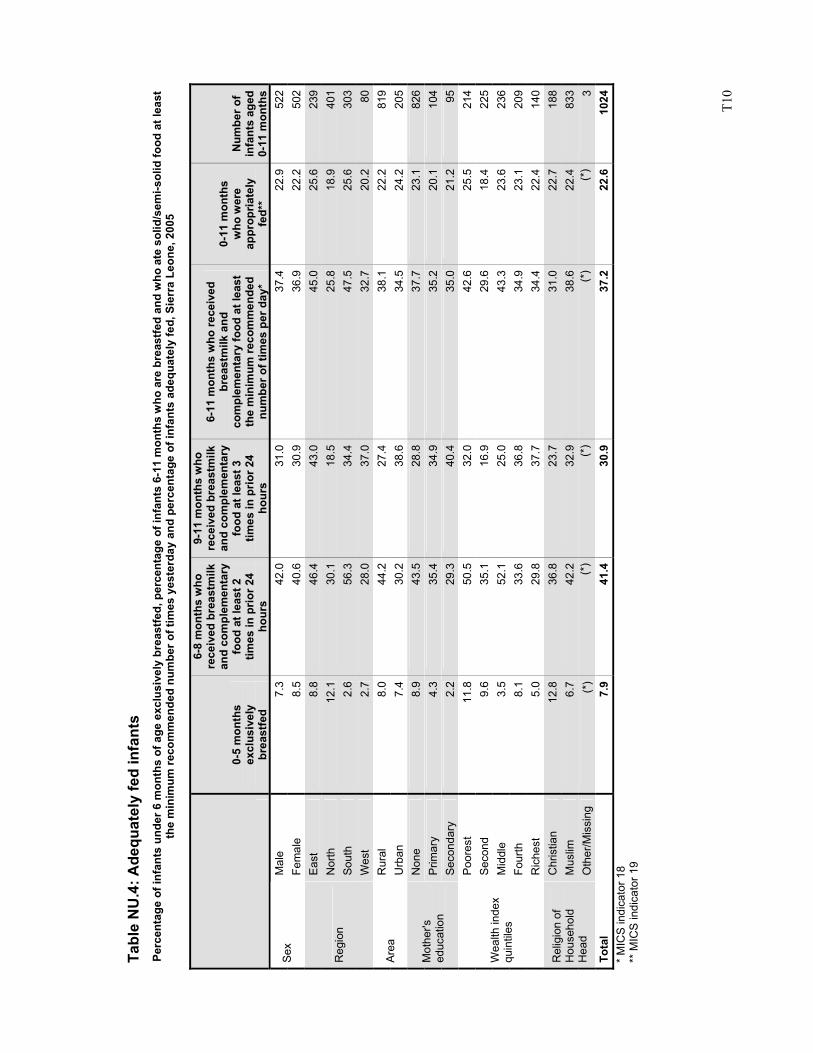
T1
0
Tabl
e N
U.4
: Ade
quat
ely
fed
infa
nts
Perc
enta
ge o
f inf
ants
und
er 6
mon
ths
of a
ge e
xclu
sive
ly b
reas
tfed,
per
cent
age
of in
fant
s 6-
11 m
onth
s w
ho a
re b
reas
tfed
and
who
ate
sol
id/s
emi-s
olid
food
at l
east
th
e m
inim
um re
com
men
ded
num
ber o
f tim
es y
este
rday
and
per
cent
age
of in
fant
s ad
equa
tely
fed,
Sie
rra
Leon
e, 2
005
0-5
mon
ths
excl
usiv
ely
br
east
fed
6-8
mon
ths
who
re
ceiv
ed b
reas
tmilk
an
d co
mpl
emen
tary
fo
od a
t lea
st 2
tim
es in
prio
r 24
hour
s
9-11
mon
ths
who
re
ceiv
ed b
reas
tmilk
an
d co
mpl
emen
tary
fo
od a
t lea
st 3
tim
es in
prio
r 24
hour
s
6-11
mon
ths
who
rece
ived
br
east
milk
and
co
mpl
emen
tary
food
at l
east
th
e m
inim
um re
com
men
ded
num
ber o
f tim
es p
er d
ay*
0-11
mon
ths
who
wer
e ap
prop
riate
ly
fed*
*
Num
ber o
f in
fant
s ag
ed
0-11
mon
ths
Mal
e 7.
342
.031
.037
.422
.952
2Se
x Fe
mal
e 8.
540
.630
.936
.922
.250
2E
ast
8.8
46.4
43.0
45.0
25.6
239
Nor
th
12.1
30.1
18.5
25.8
18.9
401
Sout
h 2.
656
.334
.447
.525
.630
3R
egio
n
Wes
t 2.
728
.037
.032
.720
.280
Rur
al
8.0
44.2
27.4
38.1
22.2
819
Area
U
rban
7.
430
.238
.634
.524
.220
5N
one
8.9
43.5
28.8
37.7
23.1
826
Prim
ary
4.3
35.4
34.9
35.2
20.1
104
Mot
her's
ed
ucat
ion
Seco
ndar
y 2.
229
.340
.435
.021
.295
Poor
est
11.8
50.5
32.0
42.6
25.5
214
Sec
ond
9.6
35.1
16.9
29.6
18.4
225
Mid
dle
3.5
52.1
25.0
43.3
23.6
236
Four
th
8.1
33.6
36.8
34.9
23.1
209
Wea
lth in
dex
quin
tiles
Ric
hest
5.
029
.837
.734
.422
.414
0C
hris
tian
12.8
36.8
23.7
31.0
22.7
188
Mus
lim
6.7
42.2
32.9
38.6
22.4
833
Rel
igio
n of
H
ouse
hold
H
ead
Oth
er/M
issi
ng
(*)
(*)
(*)
(*)
(*)
3To
tal
7.9
41.4
30.9
37.2
22.6
1024
* M
ICS
indi
cato
r 18
** M
ICS
indi
cato
r 19
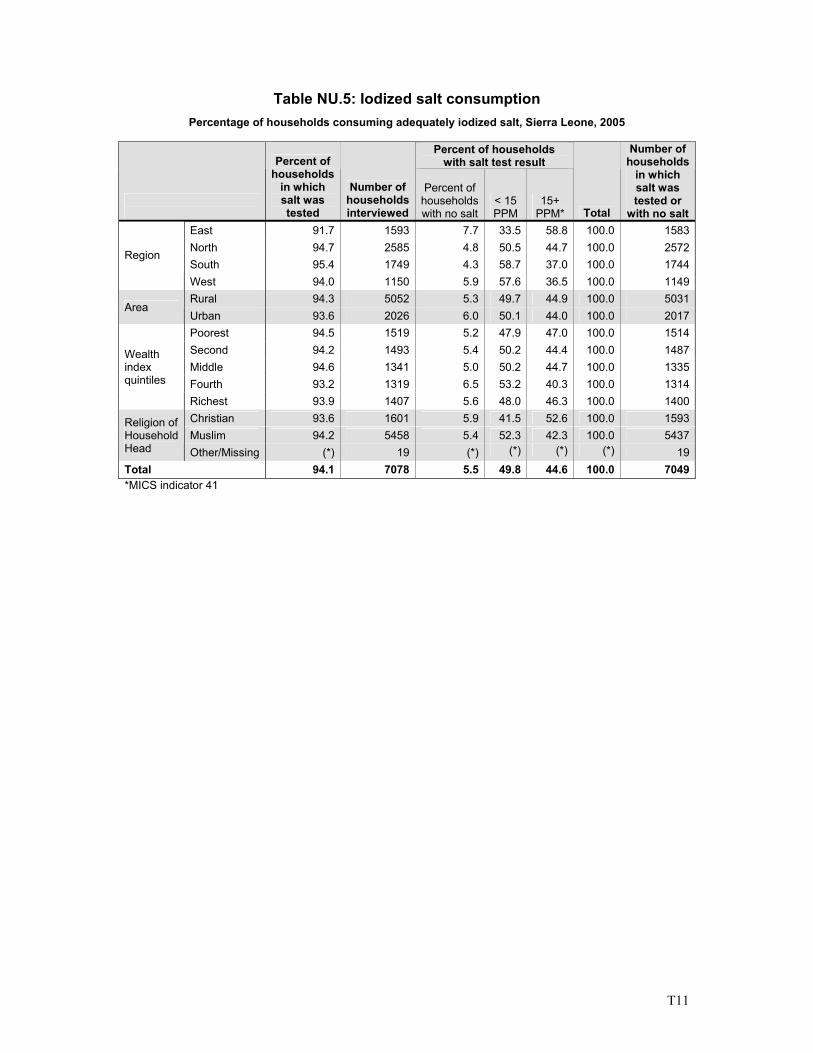
T11
Table NU.5: Iodized salt consumption Percentage of households consuming adequately iodized salt, Sierra Leone, 2005
Percent of households
with salt test result
Percent of households
in which salt was tested
Number of households interviewed
Percent of households with no salt
< 15 PPM
15+ PPM* Total
Number of households
in which salt was tested or
with no saltEast 91.7 1593 7.7 33.5 58.8 100.0 1583North 94.7 2585 4.8 50.5 44.7 100.0 2572South 95.4 1749 4.3 58.7 37.0 100.0 1744
Region
West 94.0 1150 5.9 57.6 36.5 100.0 1149Rural 94.3 5052 5.3 49.7 44.9 100.0 5031
Area Urban 93.6 2026 6.0 50.1 44.0 100.0 2017Poorest 94.5 1519 5.2 47.9 47.0 100.0 1514Second 94.2 1493 5.4 50.2 44.4 100.0 1487Middle 94.6 1341 5.0 50.2 44.7 100.0 1335Fourth 93.2 1319 6.5 53.2 40.3 100.0 1314
Wealth index quintiles
Richest 93.9 1407 5.6 48.0 46.3 100.0 1400Christian 93.6 1601 5.9 41.5 52.6 100.0 1593Muslim 94.2 5458 5.4 52.3 42.3 100.0 5437
Religion of Household Head Other/Missing (*) 19 (*) (*) (*) (*) 19Total 94.1 7078 5.5 49.8 44.6 100.0 7049*MICS indicator 41
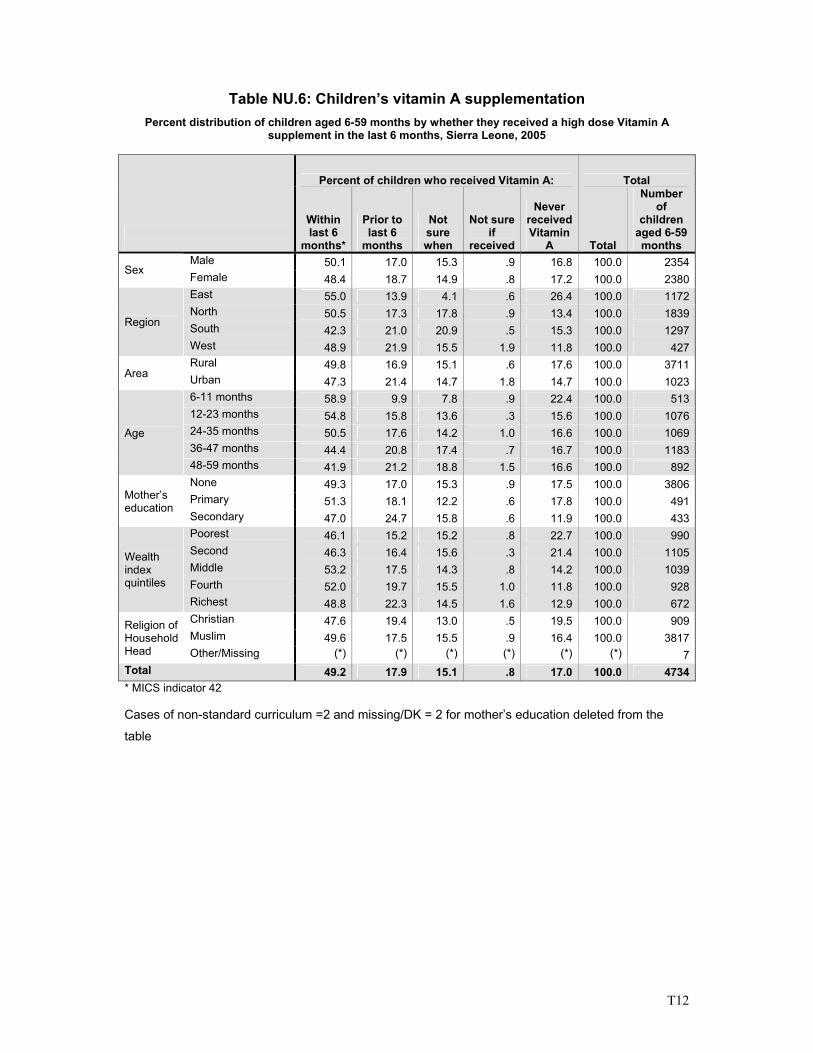
T12
Table NU.6: Children’s vitamin A supplementation Percent distribution of children aged 6-59 months by whether they received a high dose Vitamin A
supplement in the last 6 months, Sierra Leone, 2005
Percent of children who received Vitamin A: Total
Within last 6
months*
Prior to last 6
months
Not sure when
Not sure if
received
Never received Vitamin
A Total
Number of
children aged 6-59 months
Male 50.1 17.0 15.3 .9 16.8 100.0 2354Sex Female 48.4 18.7 14.9 .8 17.2 100.0 2380
East 55.0 13.9 4.1 .6 26.4 100.0 1172North 50.5 17.3 17.8 .9 13.4 100.0 1839South 42.3 21.0 20.9 .5 15.3 100.0 1297
Region
West 48.9 21.9 15.5 1.9 11.8 100.0 427Rural 49.8 16.9 15.1 .6 17.6 100.0 3711
Area Urban 47.3 21.4 14.7 1.8 14.7 100.0 10236-11 months 58.9 9.9 7.8 .9 22.4 100.0 51312-23 months 54.8 15.8 13.6 .3 15.6 100.0 107624-35 months 50.5 17.6 14.2 1.0 16.6 100.0 106936-47 months 44.4 20.8 17.4 .7 16.7 100.0 1183
Age
48-59 months 41.9 21.2 18.8 1.5 16.6 100.0 892None 49.3 17.0 15.3 .9 17.5 100.0 3806Primary 51.3 18.1 12.2 .6 17.8 100.0 491Mother’s
education Secondary 47.0 24.7 15.8 .6 11.9 100.0 433Poorest 46.1 15.2 15.2 .8 22.7 100.0 990Second 46.3 16.4 15.6 .3 21.4 100.0 1105Middle 53.2 17.5 14.3 .8 14.2 100.0 1039Fourth 52.0 19.7 15.5 1.0 11.8 100.0 928
Wealth index quintiles
Richest 48.8 22.3 14.5 1.6 12.9 100.0 672Christian 47.6 19.4 13.0 .5 19.5 100.0 909Muslim 49.6 17.5 15.5 .9 16.4 100.0 3817
Religion of Household Head Other/Missing (*) (*) (*) (*) (*) (*) 7Total 49.2 17.9 15.1 .8 17.0 100.0 4734* MICS indicator 42 Cases of non-standard curriculum =2 and missing/DK = 2 for mother’s education deleted from the
table
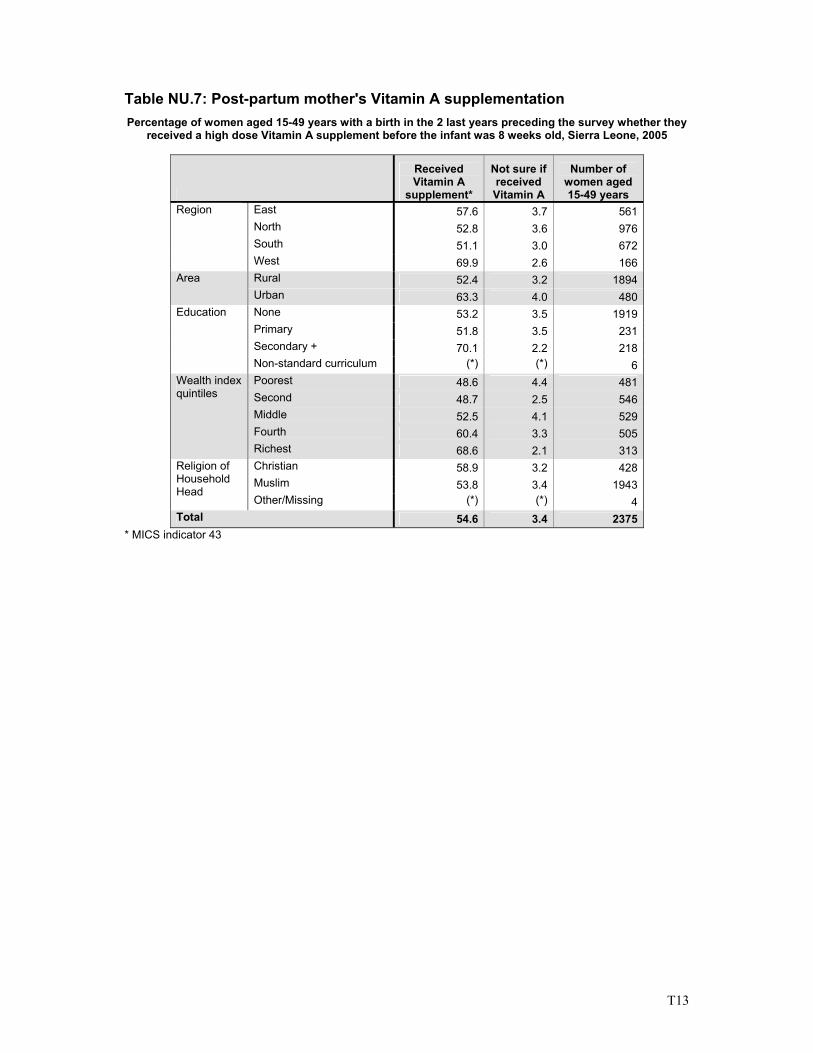
T13
Table NU.7: Post-partum mother's Vitamin A supplementation Percentage of women aged 15-49 years with a birth in the 2 last years preceding the survey whether they
received a high dose Vitamin A supplement before the infant was 8 weeks old, Sierra Leone, 2005
Received Vitamin A
supplement*
Not sure if received Vitamin A
Number of women aged 15-49 years
East 57.6 3.7 561 North 52.8 3.6 976 South 51.1 3.0 672
Region
West 69.9 2.6 166 Rural 52.4 3.2 1894 Area Urban 63.3 4.0 480 None 53.2 3.5 1919 Primary 51.8 3.5 231 Secondary + 70.1 2.2 218
Education
Non-standard curriculum (*) (*) 6 Poorest 48.6 4.4 481 Second 48.7 2.5 546 Middle 52.5 4.1 529 Fourth 60.4 3.3 505
Wealth index quintiles
Richest 68.6 2.1 313 Christian 58.9 3.2 428 Muslim 53.8 3.4 1943
Religion of Household Head
Other/Missing (*) (*) 4 Total 54.6 3.4 2375
* MICS indicator 43
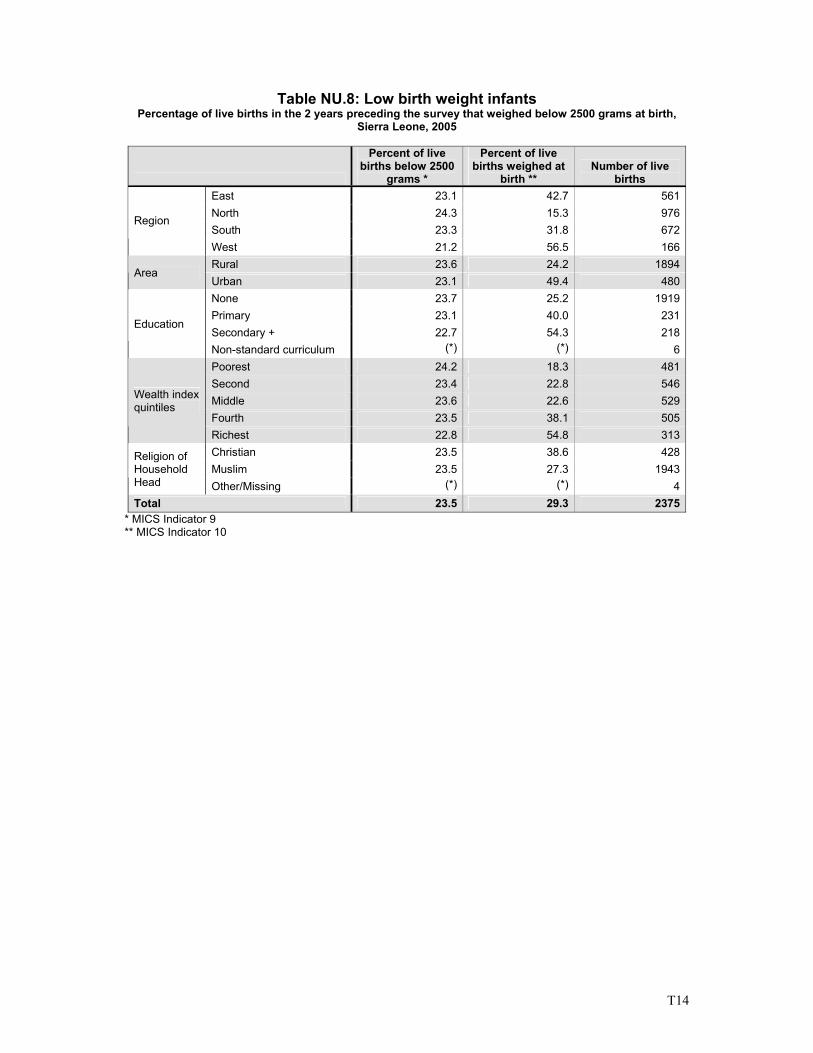
T14
Table NU.8: Low birth weight infants Percentage of live births in the 2 years preceding the survey that weighed below 2500 grams at birth,
Sierra Leone, 2005
Percent of live births below 2500
grams *
Percent of live births weighed at
birth ** Number of live
births East 23.1 42.7 561North 24.3 15.3 976South 23.3 31.8 672
Region
West 21.2 56.5 166Rural 23.6 24.2 1894
Area Urban 23.1 49.4 480None 23.7 25.2 1919Primary 23.1 40.0 231Secondary + 22.7 54.3 218
Education
Non-standard curriculum (*) (*) 6Poorest 24.2 18.3 481Second 23.4 22.8 546Middle 23.6 22.6 529Fourth 23.5 38.1 505
Wealth index quintiles
Richest 22.8 54.8 313Christian 23.5 38.6 428Muslim 23.5 27.3 1943
Religion of Household Head Other/Missing (*) (*) 4Total 23.5 29.3 2375
* MICS Indicator 9 ** MICS Indicator 10
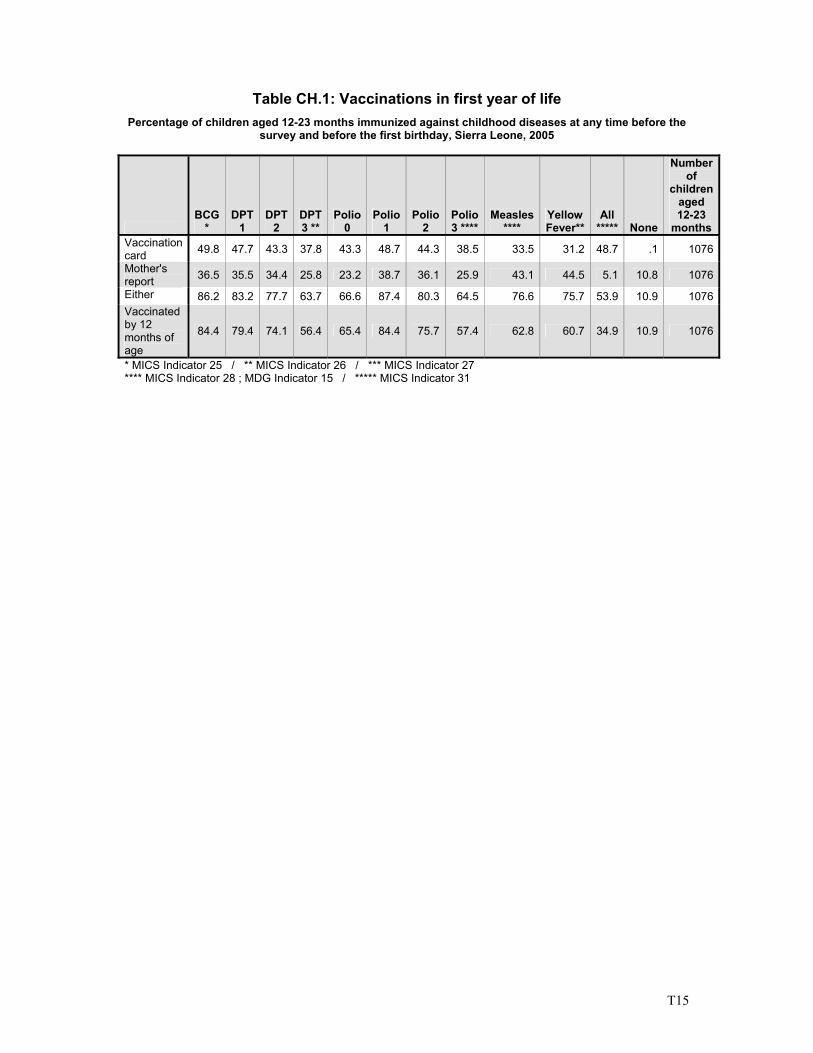
T15
Table CH.1: Vaccinations in first year of life Percentage of children aged 12-23 months immunized against childhood diseases at any time before the
survey and before the first birthday, Sierra Leone, 2005
BCG
* DPT
1 DPT
2 DPT 3 **
Polio 0
Polio 1
Polio 2
Polio 3 ****
Measles ****
Yellow Fever**
All ***** None
Number of
children aged 12-23
months Vaccination card 49.8 47.7 43.3 37.8 43.3 48.7 44.3 38.5 33.5 31.2 48.7 .1 1076
Mother's report 36.5 35.5 34.4 25.8 23.2 38.7 36.1 25.9 43.1 44.5 5.1 10.8 1076
Either 86.2 83.2 77.7 63.7 66.6 87.4 80.3 64.5 76.6 75.7 53.9 10.9 1076Vaccinated by 12 months of age
84.4 79.4 74.1 56.4 65.4 84.4 75.7 57.4 62.8 60.7 34.9 10.9 1076
* MICS Indicator 25 / ** MICS Indicator 26 / *** MICS Indicator 27 **** MICS Indicator 28 ; MDG Indicator 15 / ***** MICS Indicator 31
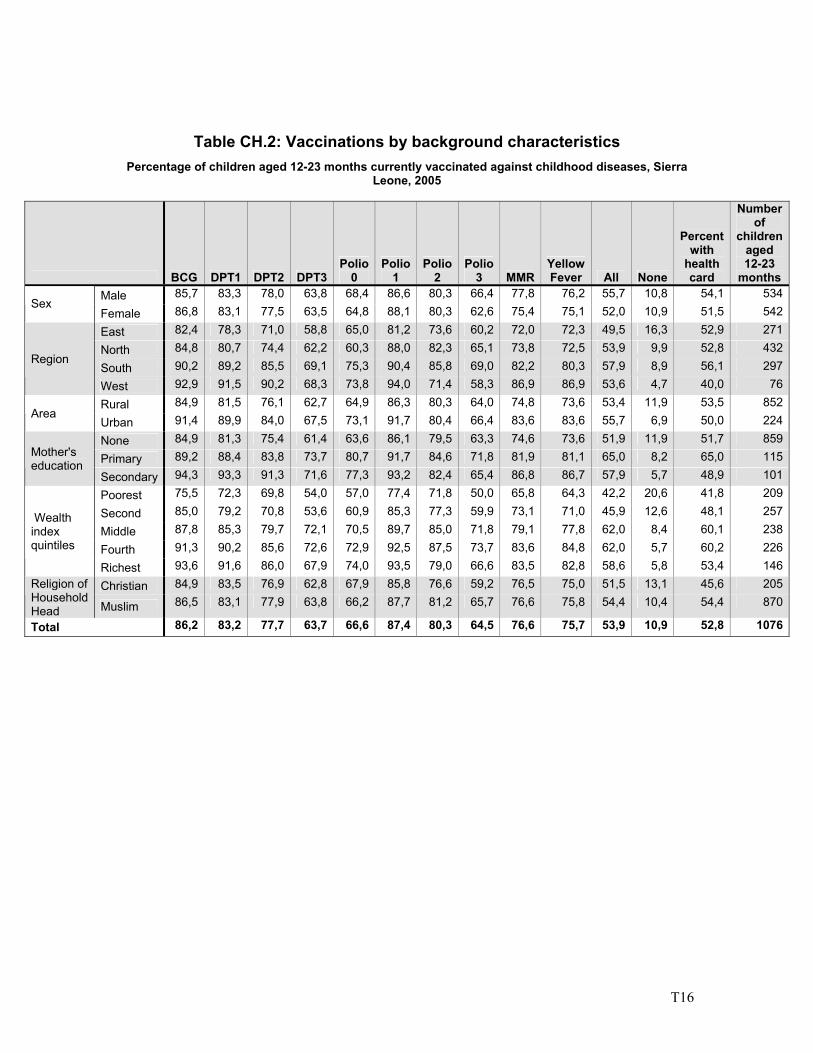
T16
Table CH.2: Vaccinations by background characteristics Percentage of children aged 12-23 months currently vaccinated against childhood diseases, Sierra
Leone, 2005
BCG DPT1 DPT2 DPT3Polio
0 Polio
1 Polio
2 Polio
3 MMRYellow Fever All None
Percent with
health card
Number of
children aged 12-23
months Male 85,7 83,3 78,0 63,8 68,4 86,6 80,3 66,4 77,8 76,2 55,7 10,8 54,1 534
Sex Female 86,8 83,1 77,5 63,5 64,8 88,1 80,3 62,6 75,4 75,1 52,0 10,9 51,5 542
East 82,4 78,3 71,0 58,8 65,0 81,2 73,6 60,2 72,0 72,3 49,5 16,3 52,9 271
North 84,8 80,7 74,4 62,2 60,3 88,0 82,3 65,1 73,8 72,5 53,9 9,9 52,8 432
South 90,2 89,2 85,5 69,1 75,3 90,4 85,8 69,0 82,2 80,3 57,9 8,9 56,1 297Region
West 92,9 91,5 90,2 68,3 73,8 94,0 71,4 58,3 86,9 86,9 53,6 4,7 40,0 76
Rural 84,9 81,5 76,1 62,7 64,9 86,3 80,3 64,0 74,8 73,6 53,4 11,9 53,5 852Area
Urban 91,4 89,9 84,0 67,5 73,1 91,7 80,4 66,4 83,6 83,6 55,7 6,9 50,0 224
None 84,9 81,3 75,4 61,4 63,6 86,1 79,5 63,3 74,6 73,6 51,9 11,9 51,7 859
Primary 89,2 88,4 83,8 73,7 80,7 91,7 84,6 71,8 81,9 81,1 65,0 8,2 65,0 115Mother's education
Secondary 94,3 93,3 91,3 71,6 77,3 93,2 82,4 65,4 86,8 86,7 57,9 5,7 48,9 101
Poorest 75,5 72,3 69,8 54,0 57,0 77,4 71,8 50,0 65,8 64,3 42,2 20,6 41,8 209
Second 85,0 79,2 70,8 53,6 60,9 85,3 77,3 59,9 73,1 71,0 45,9 12,6 48,1 257
Middle 87,8 85,3 79,7 72,1 70,5 89,7 85,0 71,8 79,1 77,8 62,0 8,4 60,1 238
Fourth 91,3 90,2 85,6 72,6 72,9 92,5 87,5 73,7 83,6 84,8 62,0 5,7 60,2 226
Wealth index quintiles
Richest 93,6 91,6 86,0 67,9 74,0 93,5 79,0 66,6 83,5 82,8 58,6 5,8 53,4 146
Christian 84,9 83,5 76,9 62,8 67,9 85,8 76,6 59,2 76,5 75,0 51,5 13,1 45,6 205Religion of Household Head Muslim 86,5 83,1 77,9 63,8 66,2 87,7 81,2 65,7 76,6 75,8 54,4 10,4 54,4 870
Total 86,2 83,2 77,7 63,7 66,6 87,4 80,3 64,5 76,6 75,7 53,9 10,9 52,8 1076
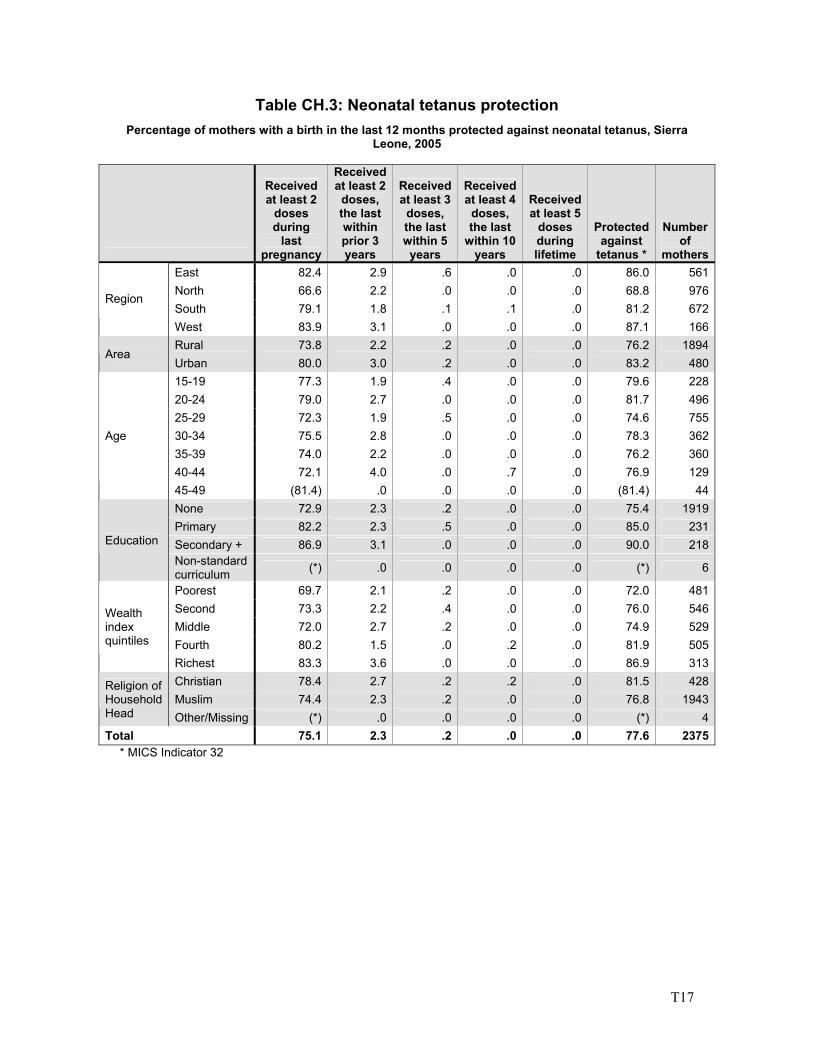
T17
Table CH.3: Neonatal tetanus protection Percentage of mothers with a birth in the last 12 months protected against neonatal tetanus, Sierra
Leone, 2005
Received at least 2
doses during
last pregnancy
Received at least 2
doses, the last within prior 3 years
Received at least 3
doses, the last within 5
years
Received at least 4
doses, the last
within 10 years
Received at least 5
doses during lifetime
Protected against
tetanus *
Number of
mothersEast 82.4 2.9 .6 .0 .0 86.0 561North 66.6 2.2 .0 .0 .0 68.8 976South 79.1 1.8 .1 .1 .0 81.2 672
Region
West 83.9 3.1 .0 .0 .0 87.1 166Rural 73.8 2.2 .2 .0 .0 76.2 1894
Area Urban 80.0 3.0 .2 .0 .0 83.2 48015-19 77.3 1.9 .4 .0 .0 79.6 22820-24 79.0 2.7 .0 .0 .0 81.7 49625-29 72.3 1.9 .5 .0 .0 74.6 75530-34 75.5 2.8 .0 .0 .0 78.3 36235-39 74.0 2.2 .0 .0 .0 76.2 36040-44 72.1 4.0 .0 .7 .0 76.9 129
Age
45-49 (81.4) .0 .0 .0 .0 (81.4) 44None 72.9 2.3 .2 .0 .0 75.4 1919Primary 82.2 2.3 .5 .0 .0 85.0 231Secondary + 86.9 3.1 .0 .0 .0 90.0 218Education
Non-standard curriculum (*) .0 .0 .0 .0 (*) 6
Poorest 69.7 2.1 .2 .0 .0 72.0 481Second 73.3 2.2 .4 .0 .0 76.0 546Middle 72.0 2.7 .2 .0 .0 74.9 529Fourth 80.2 1.5 .0 .2 .0 81.9 505
Wealth index quintiles
Richest 83.3 3.6 .0 .0 .0 86.9 313Christian 78.4 2.7 .2 .2 .0 81.5 428Muslim 74.4 2.3 .2 .0 .0 76.8 1943
Religion of Household Head Other/Missing (*) .0 .0 .0 .0 (*) 4Total 75.1 2.3 .2 .0 .0 77.6 2375
* MICS Indicator 32
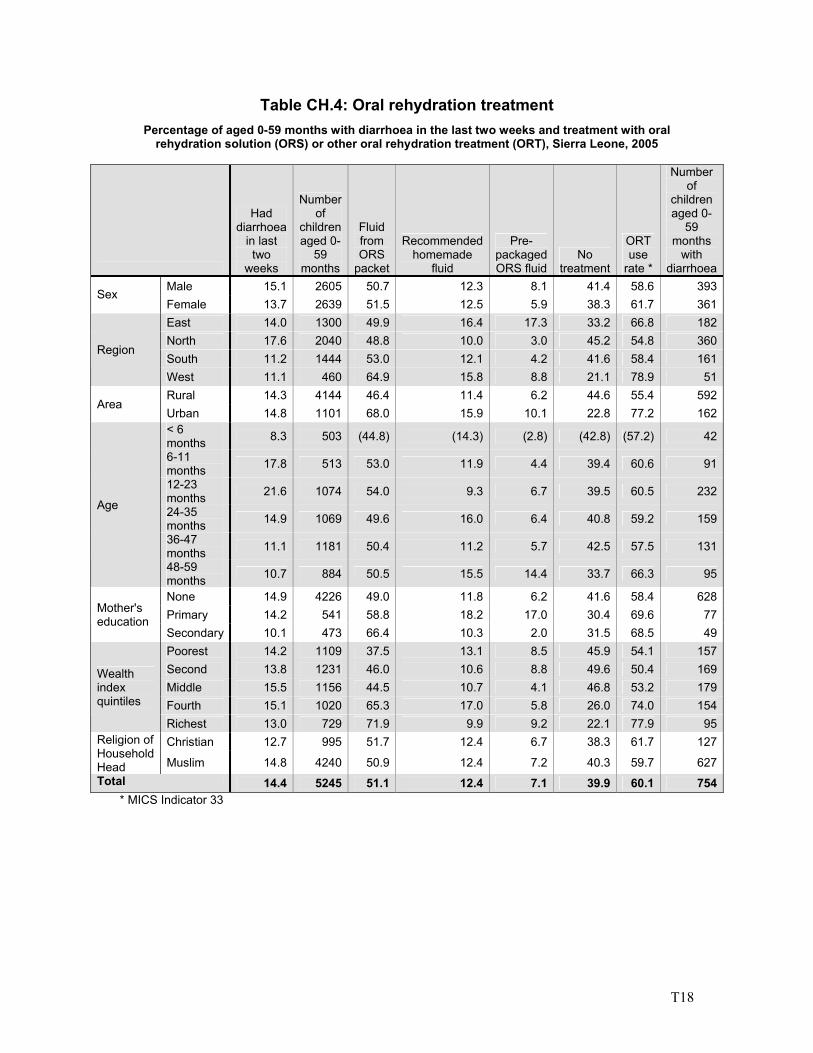
T18
Table CH.4: Oral rehydration treatment Percentage of aged 0-59 months with diarrhoea in the last two weeks and treatment with oral
rehydration solution (ORS) or other oral rehydration treatment (ORT), Sierra Leone, 2005
Had diarrhoea
in last two
weeks
Number of
children aged 0-
59 months
Fluid from ORS
packet
Recommended homemade
fluid
Pre-packaged ORS fluid
No treatment
ORT use
rate *
Number of
children aged 0-
59 months
with diarrhoea
Male 15.1 2605 50.7 12.3 8.1 41.4 58.6 393Sex
Female 13.7 2639 51.5 12.5 5.9 38.3 61.7 361East 14.0 1300 49.9 16.4 17.3 33.2 66.8 182North 17.6 2040 48.8 10.0 3.0 45.2 54.8 360South 11.2 1444 53.0 12.1 4.2 41.6 58.4 161
Region
West 11.1 460 64.9 15.8 8.8 21.1 78.9 51Rural 14.3 4144 46.4 11.4 6.2 44.6 55.4 592
Area Urban 14.8 1101 68.0 15.9 10.1 22.8 77.2 162< 6 months 8.3 503 (44.8) (14.3) (2.8) (42.8) (57.2) 42
6-11 months 17.8 513 53.0 11.9 4.4 39.4 60.6 91
12-23 months 21.6 1074 54.0 9.3 6.7 39.5 60.5 232
24-35 months 14.9 1069 49.6 16.0 6.4 40.8 59.2 159
36-47 months 11.1 1181 50.4 11.2 5.7 42.5 57.5 131
Age
48-59 months 10.7 884 50.5 15.5 14.4 33.7 66.3 95
None 14.9 4226 49.0 11.8 6.2 41.6 58.4 628Primary 14.2 541 58.8 18.2 17.0 30.4 69.6 77Mother's
education Secondary 10.1 473 66.4 10.3 2.0 31.5 68.5 49Poorest 14.2 1109 37.5 13.1 8.5 45.9 54.1 157Second 13.8 1231 46.0 10.6 8.8 49.6 50.4 169Middle 15.5 1156 44.5 10.7 4.1 46.8 53.2 179Fourth 15.1 1020 65.3 17.0 5.8 26.0 74.0 154
Wealth index quintiles
Richest 13.0 729 71.9 9.9 9.2 22.1 77.9 95Christian 12.7 995 51.7 12.4 6.7 38.3 61.7 127Religion of
Household Head Muslim 14.8 4240 50.9 12.4 7.2 40.3 59.7 627Total 14.4 5245 51.1 12.4 7.1 39.9 60.1 754
* MICS Indicator 33
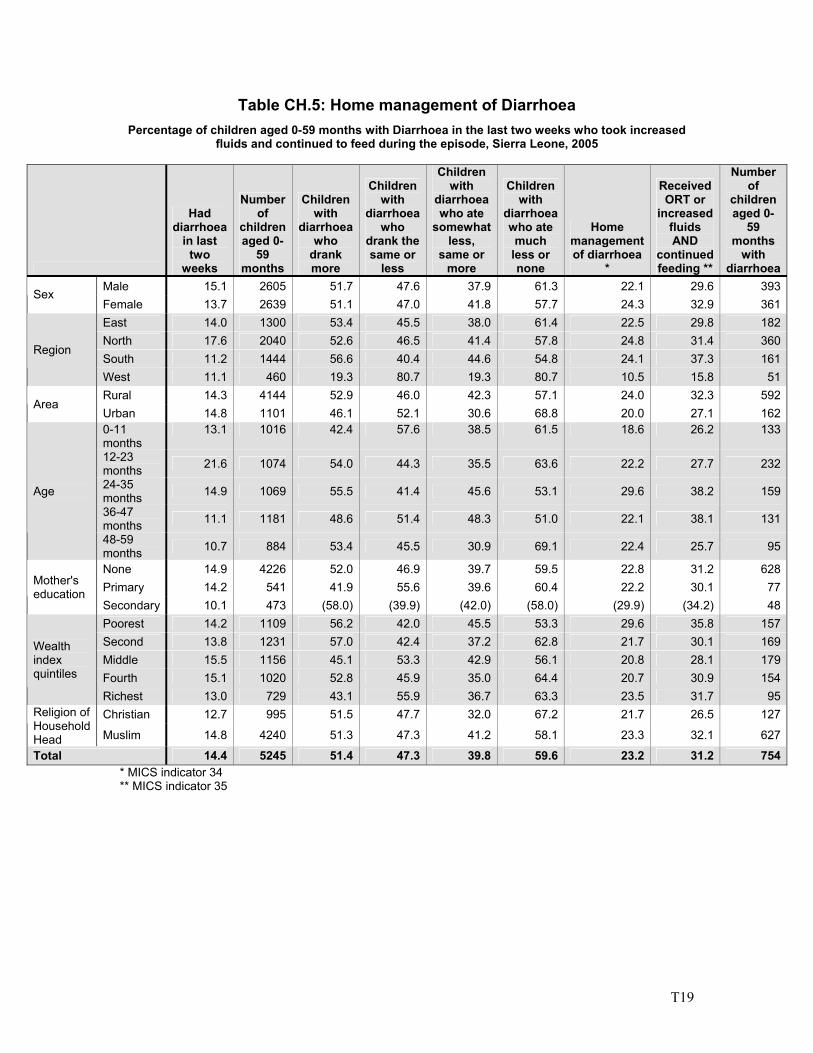
T19
Table CH.5: Home management of Diarrhoea Percentage of children aged 0-59 months with Diarrhoea in the last two weeks who took increased
fluids and continued to feed during the episode, Sierra Leone, 2005
Had diarrhoea
in last two
weeks
Number of
children aged 0-
59 months
Children with
diarrhoea who
drank more
Children with
diarrhoea who
drank the same or
less
Children with
diarrhoea who ate
somewhat less,
same or more
Children with
diarrhoea who ate much
less or none
Home management of diarrhoea
*
Received ORT or
increased fluids AND
continued feeding **
Number of
children aged 0-
59 months
with diarrhoea
Male 15.1 2605 51.7 47.6 37.9 61.3 22.1 29.6 393Sex
Female 13.7 2639 51.1 47.0 41.8 57.7 24.3 32.9 361East 14.0 1300 53.4 45.5 38.0 61.4 22.5 29.8 182North 17.6 2040 52.6 46.5 41.4 57.8 24.8 31.4 360South 11.2 1444 56.6 40.4 44.6 54.8 24.1 37.3 161
Region
West 11.1 460 19.3 80.7 19.3 80.7 10.5 15.8 51Rural 14.3 4144 52.9 46.0 42.3 57.1 24.0 32.3 592
Area Urban 14.8 1101 46.1 52.1 30.6 68.8 20.0 27.1 1620-11 months
13.1 1016 42.4 57.6 38.5 61.5 18.6 26.2 133
12-23 months 21.6 1074 54.0 44.3 35.5 63.6 22.2 27.7 232
24-35 months 14.9 1069 55.5 41.4 45.6 53.1 29.6 38.2 159
36-47 months 11.1 1181 48.6 51.4 48.3 51.0 22.1 38.1 131
Age
48-59 months 10.7 884 53.4 45.5 30.9 69.1 22.4 25.7 95
None 14.9 4226 52.0 46.9 39.7 59.5 22.8 31.2 628Primary 14.2 541 41.9 55.6 39.6 60.4 22.2 30.1 77Mother's
education Secondary 10.1 473 (58.0) (39.9) (42.0) (58.0) (29.9) (34.2) 48Poorest 14.2 1109 56.2 42.0 45.5 53.3 29.6 35.8 157Second 13.8 1231 57.0 42.4 37.2 62.8 21.7 30.1 169Middle 15.5 1156 45.1 53.3 42.9 56.1 20.8 28.1 179Fourth 15.1 1020 52.8 45.9 35.0 64.4 20.7 30.9 154
Wealth index quintiles
Richest 13.0 729 43.1 55.9 36.7 63.3 23.5 31.7 95Christian 12.7 995 51.5 47.7 32.0 67.2 21.7 26.5 127Religion of
Household Head Muslim 14.8 4240 51.3 47.3 41.2 58.1 23.3 32.1 627
Total 14.4 5245 51.4 47.3 39.8 59.6 23.2 31.2 754* MICS indicator 34 ** MICS indicator 35
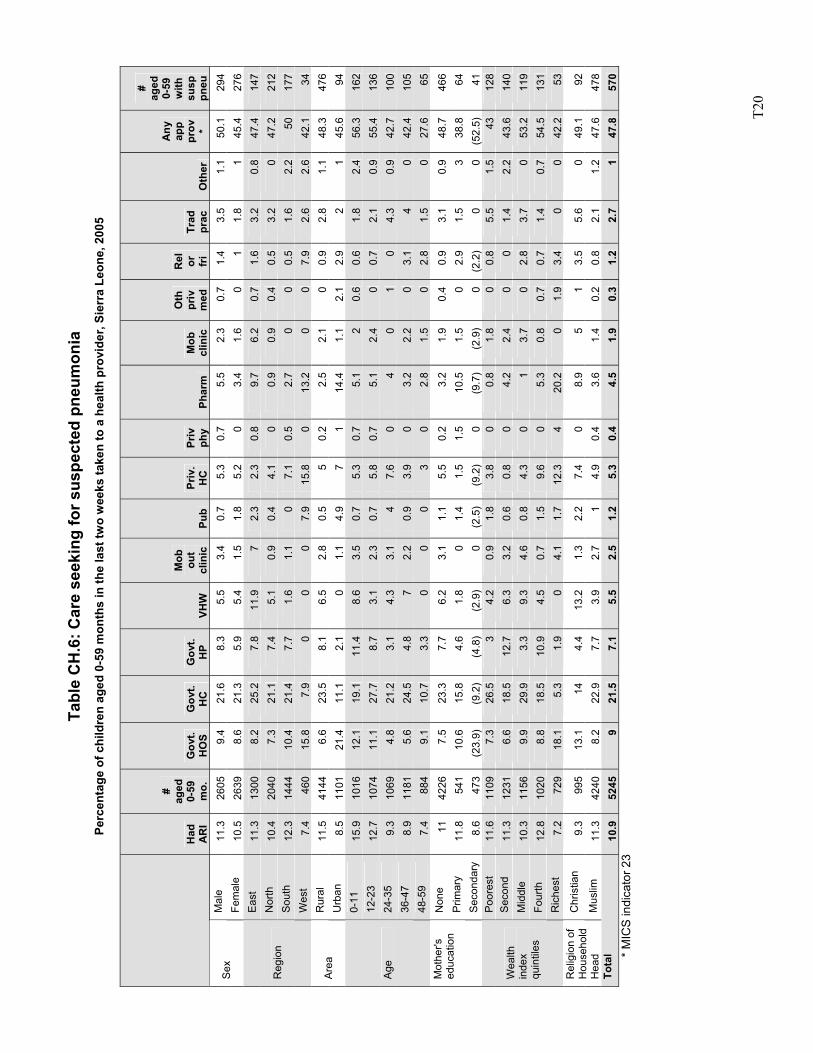
T2
0
Tabl
e C
H.6
: Car
e se
ekin
g fo
r sus
pect
ed p
neum
onia
Pe
rcen
tage
of c
hild
ren
aged
0-5
9 m
onth
s in
the
last
two
wee
ks ta
ken
to a
hea
lth p
rovi
der,
Sier
ra L
eone
, 200
5
H
ad
AR
I
#
ag
ed
0-
59
m
o.
Gov
t.
HO
S G
ovt.
HC
G
ovt.
HP
VHW
Mob
ou
t cl
inic
Pu
b Pr
iv.
HC
Pr
iv
phy
Phar
m
Mob
cl
inic
Oth
pr
iv
med
Rel
or
fr
i Tr
ad
prac
O
ther
Any
app
pr
ov
*
#
ag
ed
0-
59
w
ith
su
sp
pneu
M
ale
11.3
26
05
9.4
21.6
8.
3 5.
5 3.
4 0.
7 5.
3 0.
7 5.
5 2.
3 0.
7 1.
4 3.
5 1.
1 50
.1
294
Sex
Fe
mal
e 10
.5
2639
8.
6 21
.3
5.9
5.4
1.5
1.8
5.2
0 3.
4 1.
6 0
1 1.
8 1
45.4
27
6 E
ast
11.3
13
00
8.2
25.2
7.
8 11
.9
7 2.
3 2.
3 0.
8 9.
7 6.
2 0.
7 1.
6 3.
2 0.
8 47
.4
147
Nor
th
10.4
20
40
7.3
21.1
7.
4 5.
1 0.
9 0.
4 4.
1 0
0.9
0.9
0.4
0.5
3.2
0 47
.2
212
Sou
th
12.3
14
44
10.4
21
.4
7.7
1.6
1.1
0 7.
1 0.
5 2.
7 0
0 0.
5 1.
6 2.
2 50
17
7 R
egio
n
Wes
t 7.
4 46
0 15
.8
7.9
0 0
0 7.
9 15
.8
0 13
.2
0 0
7.9
2.6
2.6
42.1
34
R
ural
11
.5
4144
6.
6 23
.5
8.1
6.5
2.8
0.5
5 0.
2 2.
5 2.
1 0
0.9
2.8
1.1
48.3
47
6 A
rea
Urb
an
8.5
1101
21
.4
11.1
2.
1 0
1.1
4.9
7 1
14.4
1.
1 2.
1 2.
9 2
1 45
.6
94
0-11
15
.9
1016
12
.1
19.1
11
.4
8.6
3.5
0.7
5.3
0.7
5.1
2 0.
6 0.
6 1.
8 2.
4 56
.3
162
12-2
3 12
.7
1074
11
.1
27.7
8.
7 3.
1 2.
3 0.
7 5.
8 0.
7 5.
1 2.
4 0
0.7
2.1
0.9
55.4
13
6 24
-35
9.3
1069
4.
8 21
.2
3.1
4.3
3.1
4 7.
6 0
4 0
1 0
4.3
0.9
42.7
10
0 36
-47
8.
9 11
81
5.6
24.5
4.
8 7
2.2
0.9
3.9
0 3.
2 2.
2 0
3.1
4 0
42.4
10
5
Age
48-5
9
7.4
884
9.1
10.7
3.
3 0
0 0
3 0
2.8
1.5
0 2.
8 1.
5 0
27.6
65
N
one
11
4226
7.
5 23
.3
7.7
6.2
3.1
1.1
5.5
0.2
3.2
1.9
0.4
0.9
3.1
0.9
48.7
46
6 P
rimar
y 11
.8
541
10.6
15
.8
4.6
1.8
0 1.
4 1.
5 1.
5 10
.5
1.5
0 2.
9 1.
5 3
38.8
64
Mot
her's
ed
ucat
ion
S
econ
dary
8.
6 47
3 (2
3.9)
(9
.2)
(4.8
) (2
.9)
0 (2
.5)
(9.2
) 0
(9.7
) (2
.9)
0 (2
.2)
0 0
(52.
5)
41
Poo
rest
11
.6
1109
7.
3 26
.5
3 4.
2 0.
9 1.
8 3.
8 0
0.8
1.8
0 0.
8 5.
5 1.
5 43
12
8 S
econ
d 11
.3
1231
6.
6 18
.5
12.7
6.
3 3.
2 0.
6 0.
8 0
4.2
2.4
0 0
1.4
2.2
43.6
14
0 M
iddl
e 10
.3
1156
9.
9 29
.9
3.3
9.3
4.6
0.8
4.3
0 1
3.7
0 2.
8 3.
7 0
53.2
11
9 Fo
urth
12
.8
1020
8.
8 18
.5
10.9
4.
5 0.
7 1.
5 9.
6 0
5.3
0.8
0.7
0.7
1.4
0.7
54.5
13
1
Wea
lth
inde
x qu
intil
es
Ric
hest
7.
2 72
9 18
.1
5.3
1.9
0 4.
1 1.
7 12
.3
4 20
.2
0 1.
9 3.
4 0
0 42
.2
53
Chr
istia
n 9.
3 99
5 13
.1
14
4.4
13.2
1.
3 2.
2 7.
4 0
8.9
5 1
3.5
5.6
0 49
.1
92
Rel
igio
n of
H
ouse
hold
H
ead
Mus
lim
11.3
42
40
8.2
22.9
7.
7 3.
9 2.
7 1
4.9
0.4
3.6
1.4
0.2
0.8
2.1
1.2
47.6
47
8 To
tal
10.9
52
45
9 21
.5
7.1
5.5
2.5
1.2
5.3
0.4
4.5
1.9
0.3
1.2
2.7
1 47
.8
570
* M
ICS
indi
cato
r 23
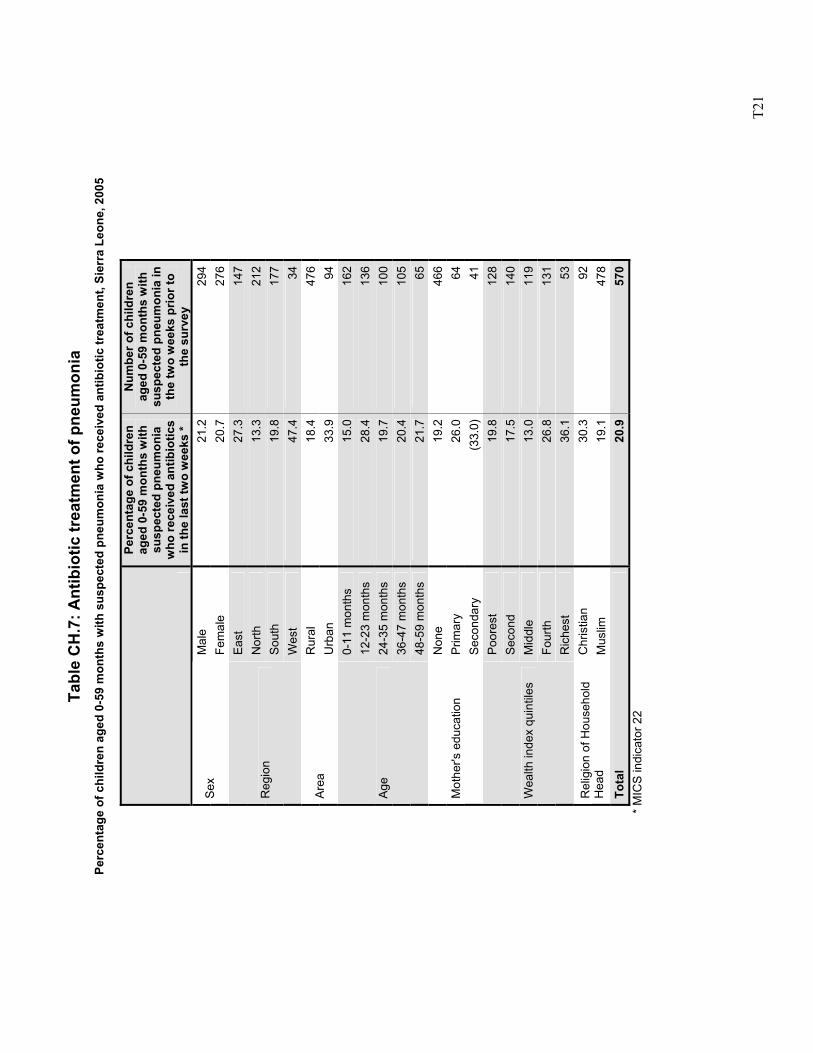
T2
1
Tabl
e C
H.7
: Ant
ibio
tic tr
eatm
ent o
f pne
umon
ia
Perc
enta
ge o
f chi
ldre
n ag
ed 0
-59
mon
ths
with
sus
pect
ed p
neum
onia
who
rece
ived
ant
ibio
tic tr
eatm
ent,
Sier
ra L
eone
, 200
5
Perc
enta
ge o
f chi
ldre
n ag
ed 0
-59
mon
ths
with
su
spec
ted
pneu
mon
ia
who
rece
ived
ant
ibio
tics
in th
e la
st tw
o w
eeks
*
Num
ber o
f chi
ldre
n ag
ed 0
-59
mon
ths
with
su
spec
ted
pneu
mon
ia in
th
e tw
o w
eeks
prio
r to
the
surv
ey
Mal
e 21
.2
294
Sex
Fem
ale
20.7
27
6Ea
st
27.3
14
7N
orth
13
.3
212
Sout
h 19
.8
177
Reg
ion
Wes
t 47
.4
34R
ural
18
.4
476
Area
U
rban
33
.9
940-
11 m
onth
s 15
.0
162
12-2
3 m
onth
s 28
.4
136
24-3
5 m
onth
s 19
.7
100
36-4
7 m
onth
s 20
.4
105
Age
48-5
9 m
onth
s 21
.7
65N
one
19.2
46
6P
rimar
y 26
.0
64M
othe
r's e
duca
tion
Seco
ndar
y (3
3.0)
41
Poor
est
19.8
12
8S
econ
d 17
.5
140
Mid
dle
13.0
11
9Fo
urth
26
.8
131
Wea
lth in
dex
quin
tiles
Ric
hest
36
.1
53C
hris
tian
30.3
92
Rel
igio
n of
Hou
seho
ld
Hea
d M
uslim
19
.1
478
Tota
l 20
.9
570
*
MIC
S in
dica
tor 2
2
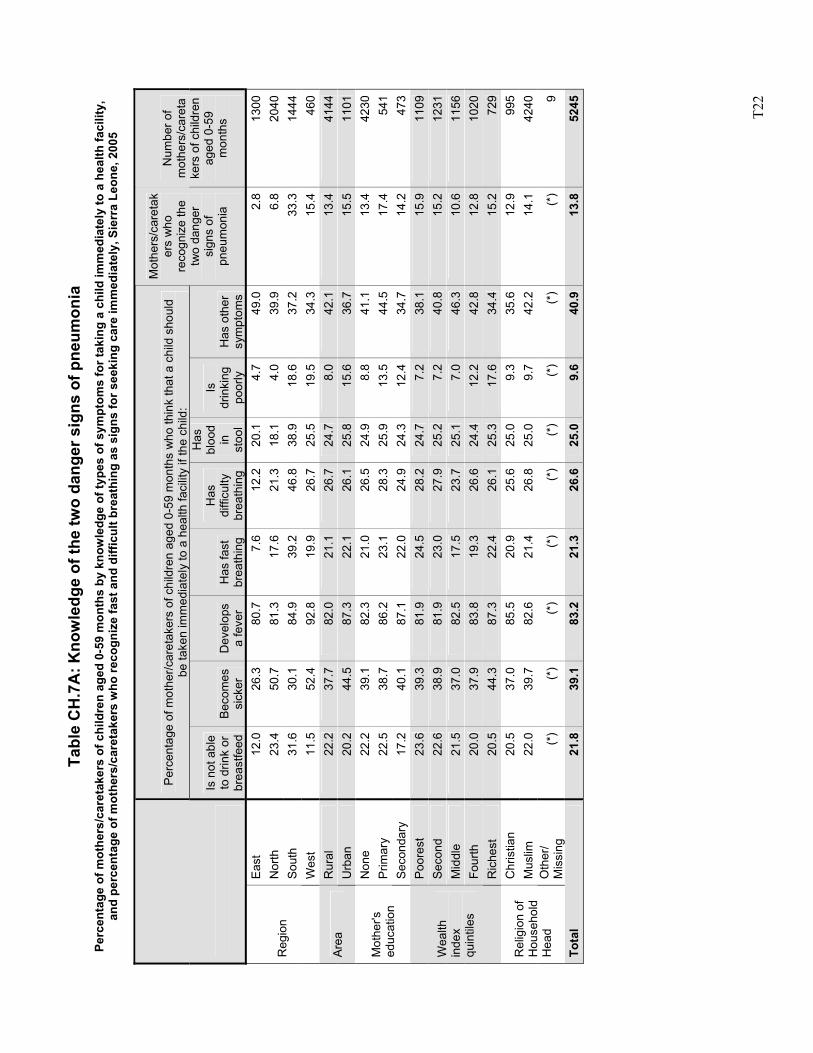
T2
2
Tabl
e C
H.7
A: K
now
ledg
e of
the
two
dang
er s
igns
of p
neum
onia
Pe
rcen
tage
of m
othe
rs/c
aret
aker
s of
chi
ldre
n ag
ed 0
-59
mon
ths
by k
now
ledg
e of
type
s of
sym
ptom
s fo
r tak
ing
a ch
ild im
med
iate
ly to
a h
ealth
faci
lity,
an
d pe
rcen
tage
of m
othe
rs/c
aret
aker
s w
ho re
cogn
ize
fast
and
diff
icul
t bre
athi
ng a
s si
gns
for s
eeki
ng c
are
imm
edia
tely
, Sie
rra
Leon
e, 2
005
Perc
enta
ge o
f mot
her/c
aret
aker
s of
chi
ldre
n ag
ed 0
-59
mon
ths
who
thin
k th
at a
chi
ld s
houl
d be
take
n im
med
iate
ly to
a h
ealth
faci
lity
if th
e ch
ild:
Is n
ot a
ble
to d
rink
or
brea
stfe
ed
Bec
omes
si
cker
D
evel
ops
a fe
ver
Has
fast
br
eath
ing
Has
di
fficu
lty
brea
thin
g
Has
bl
ood
in
stoo
l
Is
drin
king
po
orly
H
as o
ther
sy
mpt
oms
Mot
hers
/car
etak
ers
who
re
cogn
ize
the
two
dang
er
sign
s of
pn
eum
onia
Num
ber o
f m
othe
rs/c
aret
ake
rs o
f chi
ldre
n ag
ed 0
-59
mon
ths
Ea
st
12.0
26
.380
.77.
612
.220
.1
4.7
49.0
2.8
1300
Nor
th
23.4
50
.781
.317
.621
.318
.1
4.0
39.9
6.8
2040
Sout
h 31
.6
30.1
84.9
39.2
46.8
38.9
18
.637
.233
.314
44R
egio
n
Wes
t 11
.5
52.4
92.8
19.9
26.7
25.5
19
.534
.315
.446
0R
ural
22
.2
37.7
82.0
21.1
26.7
24.7
8.
042
.113
.441
44Ar
ea
Urb
an
20.2
44
.587
.322
.126
.125
.8
15.6
36.7
15.5
1101
Non
e 22
.2
39.1
82.3
21.0
26.5
24.9
8.
841
.113
.442
30P
rimar
y 22
.5
38.7
86.2
23.1
28.3
25.9
13
.544
.517
.454
1M
othe
r's
educ
atio
n Se
cond
ary
17.2
40
.187
.122
.024
.924
.3
12.4
34.7
14.2
473
Poor
est
23.6
39
.381
.924
.528
.224
.7
7.2
38.1
15.9
1109
Sec
ond
22.6
38
.981
.923
.027
.925
.2
7.2
40.8
15.2
1231
Mid
dle
21.5
37
.082
.517
.523
.725
.1
7.0
46.3
10.6
1156
Four
th
20.0
37
.983
.819
.326
.624
.4
12.2
42.8
12.8
1020
Wea
lth
inde
x qu
intil
es
Ric
hest
20
.5
44.3
87.3
22.4
26.1
25.3
17
.634
.415
.272
9C
hris
tian
20.5
37
.085
.520
.925
.625
.0
9.3
35.6
12.9
995
Mus
lim
22.0
39
.782
.621
.426
.825
.0
9.7
42.2
14.1
4240
Rel
igio
n of
H
ouse
hold
H
ead
Oth
er/
Mis
sing
(*
) (*
)(*
)(*
)(*
)(*
) (*
)(*
)(*
)9
Tota
l 21
.8
39.1
83.2
21.3
26.6
25.0
9.
640
.913
.852
45
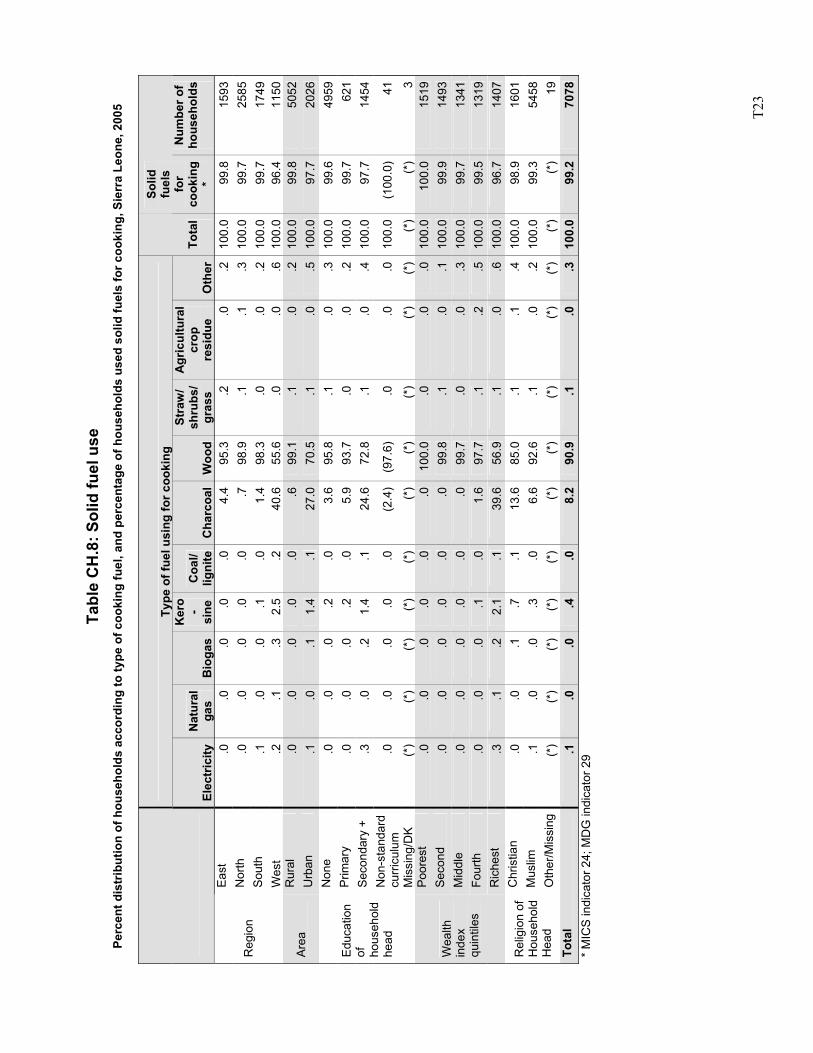
T2
3
Ta
ble
CH
.8: S
olid
fuel
use
Pe
rcen
t dis
trib
utio
n of
hou
seho
lds
acco
rdin
g to
type
of c
ooki
ng fu
el, a
nd p
erce
ntag
e of
hou
seho
lds
used
sol
id fu
els
for c
ooki
ng, S
ierr
a Le
one,
200
5
Type
of f
uel u
sing
for c
ooki
ng
El
ectr
icity
N
atur
al
gas
Bio
gas
Ker
o-
sine
C
oal/
ligni
teC
harc
oal
Woo
d
Stra
w/
shru
bs/
gras
s
Agr
icul
tura
l cr
op
resi
due
Oth
erTo
tal
Solid
fu
els
for
cook
ing
*
Num
ber o
f ho
useh
olds
Ea
st
.0
.0.0
.0.0
4.4
95.3
.2
.0.2
100.
099
.815
93N
orth
.0
.0
.0.0
.0.7
98.9
.1
.1.3
100.
099
.725
85So
uth
.1
.0.0
.1.0
1.4
98.3
.0
.0.2
100.
099
.717
49R
egio
n
Wes
t .2
.1
.32.
5.2
40.6
55.6
.0
.0.6
100.
096
.411
50R
ural
.0
.0
.0.0
.0.6
99.1
.1
.0.2
100.
099
.850
52A
rea
U
rban
.1
.0
.11.
4.1
27.0
70.5
.1
.0.5
100.
097
.720
26N
one
.0
.0.0
.2.0
3.6
95.8
.1
.0.3
100.
099
.649
59P
rimar
y .0
.0
.0.2
.05.
993
.7
.0.0
.210
0.0
99.7
621
Seco
ndar
y +
.3
.0.2
1.4
.124
.672
.8
.1.0
.410
0.0
97.7
1454
Non
-sta
ndar
d cu
rric
ulum
.0
.0
.0.0
.0(2
.4)
(97.
6)
.0.0
.010
0.0
(100
.0)
41
Edu
catio
n of
ho
useh
old
head
Mis
sing
/DK
(*)
(*)
(*)
(*)
(*)
(*)
(*)
(*)
(*)
(*)
(*)
(*)
3Po
ores
t .0
.0
.0.0
.0.0
100.
0 .0
.0.0
100.
010
0.0
1519
Sec
ond
.0
.0.0
.0.0
.099
.8
.1.0
.110
0.0
99.9
1493
Mid
dle
.0
.0.0
.0.0
.099
.7
.0.0
.310
0.0
99.7
1341
Four
th
.0
.0.0
.1.0
1.6
97.7
.1
.2.5
100.
099
.513
19
Wea
lth
inde
x qu
intil
es
Ric
hest
.3
.1
.22.
1.1
39.6
56.9
.1
.0.6
100.
096
.714
07C
hris
tian
.0
.0.1
.7.1
13.6
85.0
.1
.1.4
100.
098
.916
01M
uslim
.1
.0
.0.3
.06.
692
.6
.1.0
.210
0.0
99.3
5458
Rel
igio
n of
H
ouse
hold
H
ead
O
ther
/Mis
sing
(*
) (*
)(*
)(*
)(*
)(*
)(*
) (*
)(*
)(*
)(*
)(*
)19
Tota
l .1
.0
.0.4
.08.
290
.9
.1.0
.310
0.0
99.2
7078
* M
ICS
indi
cato
r 24;
MD
G in
dica
tor 2
9
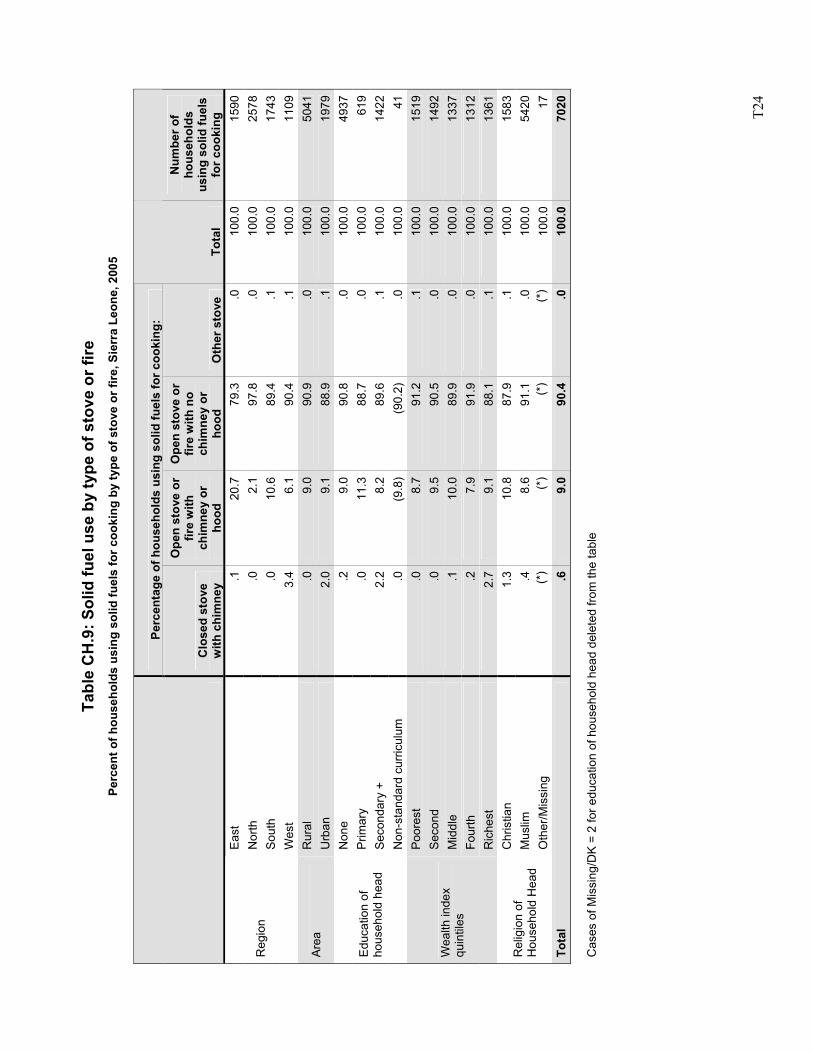
T2
4
Ta
ble
CH
.9: S
olid
fuel
use
by
type
of s
tove
or f
ire
Perc
ent o
f hou
seho
lds
usin
g so
lid fu
els
for c
ooki
ng b
y ty
pe o
f sto
ve o
r fire
, Sie
rra
Leon
e, 2
005
Perc
enta
ge o
f hou
seho
lds
usin
g so
lid fu
els
for c
ooki
ng:
C
lose
d st
ove
with
chi
mne
y
Ope
n st
ove
or
fire
with
ch
imne
y or
ho
od
Ope
n st
ove
or
fire
with
no
chim
ney
or
hood
O
ther
sto
ve
Tota
l
Num
ber o
f ho
useh
olds
us
ing
solid
fuel
s fo
r coo
king
Ea
st
.120
.779
.3.0
100.
015
90N
orth
.0
2.1
97.8
.010
0.0
2578
Sout
h .0
10.6
89.4
.110
0.0
1743
Reg
ion
Wes
t 3.
46.
190
.4.1
100.
011
09R
ural
.0
9.0
90.9
.010
0.0
5041
Area
U
rban
2.
09.
188
.9.1
100.
019
79N
one
.29.
090
.8.0
100.
049
37P
rimar
y .0
11.3
88.7
.010
0.0
619
Seco
ndar
y +
2.2
8.2
89.6
.110
0.0
1422
Edu
catio
n of
ho
useh
old
head
Non
-sta
ndar
d cu
rricu
lum
.0
(9.8
)(9
0.2)
.010
0.0
41Po
ores
t .0
8.7
91.2
.110
0.0
1519
Sec
ond
.09.
590
.5.0
100.
014
92M
iddl
e .1
10.0
89.9
.010
0.0
1337
Four
th
.27.
991
.9.0
100.
013
12
Wea
lth in
dex
quin
tiles
Ric
hest
2.
79.
188
.1.1
100.
013
61C
hris
tian
1.3
10.8
87.9
.110
0.0
1583
Mus
lim
.48.
691
.1.0
100.
054
20R
elig
ion
of
Hou
seho
ld H
ead
Oth
er/M
issi
ng
(*)
(*)
(*)
(*)
100.
017
Tota
l .6
9.0
90.4
.010
0.0
7020
Cas
es o
f Mis
sing
/DK
= 2
for e
duca
tion
of h
ouse
hold
hea
d de
lete
d fro
m th
e ta
ble
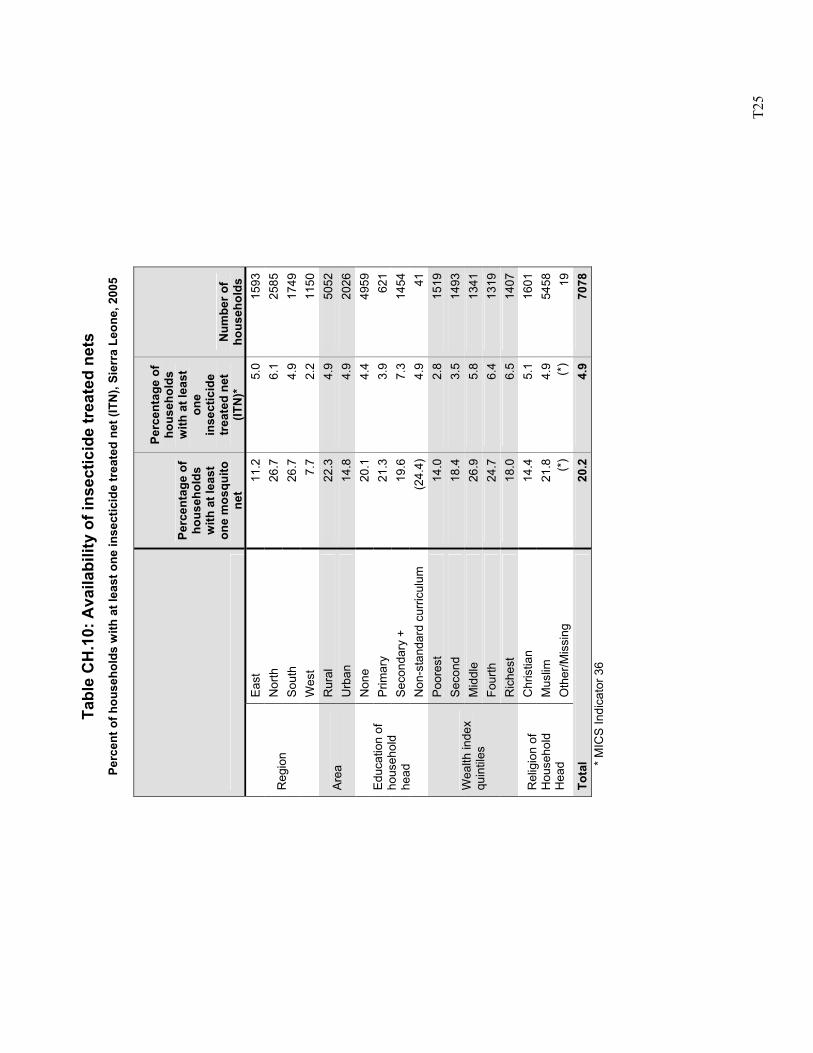
T2
5
Ta
ble
CH
.10:
Ava
ilabi
lity
of in
sect
icid
e tr
eate
d ne
ts
Perc
ent o
f hou
seho
lds
with
at l
east
one
inse
ctic
ide
trea
ted
net (
ITN
), Si
erra
Leo
ne, 2
005
Perc
enta
ge o
f ho
useh
olds
w
ith a
t lea
st
one
mos
quito
ne
t
Perc
enta
ge o
f ho
useh
olds
w
ith a
t lea
st
one
inse
ctic
ide
trea
ted
net
(ITN
)*
Num
ber o
f ho
useh
olds
Ea
st
11.2
5.0
1593
Nor
th
26.7
6.1
2585
Sout
h 26
.74.
917
49R
egio
n
Wes
t 7.
72.
211
50R
ural
22
.34.
950
52Ar
ea
Urb
an
14.8
4.9
2026
Non
e 20
.14.
449
59P
rimar
y 21
.33.
962
1Se
cond
ary
+ 19
.67.
314
54
Edu
catio
n of
ho
useh
old
head
N
on-s
tand
ard
curri
culu
m
(24.
4)4.
941
Poor
est
14.0
2.8
1519
Sec
ond
18.4
3.5
1493
Mid
dle
26.9
5.8
1341
Four
th
24.7
6.4
1319
Wea
lth in
dex
quin
tiles
Ric
hest
18
.06.
514
07C
hris
tian
14.4
5.1
1601
Mus
lim
21.8
4.9
5458
Rel
igio
n of
H
ouse
hold
H
ead
Oth
er/M
issi
ng
(*)
(*)
19To
tal
20.2
4.9
7078
* M
ICS
Indi
cato
r 36
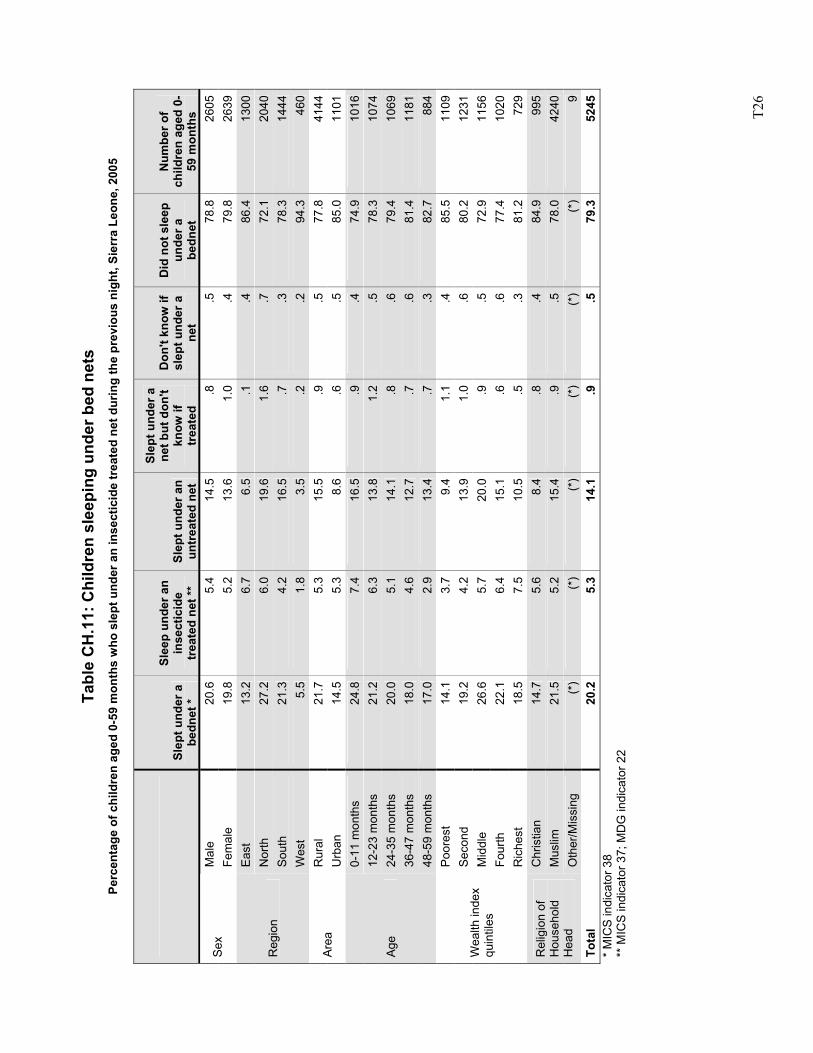
T2
6
Ta
ble
CH
.11:
Chi
ldre
n sl
eepi
ng u
nder
bed
net
s Pe
rcen
tage
of c
hild
ren
aged
0-5
9 m
onth
s w
ho s
lept
und
er a
n in
sect
icid
e tr
eate
d ne
t dur
ing
the
prev
ious
nig
ht, S
ierr
a Le
one,
200
5
Slep
t und
er a
be
dnet
*
Slee
p un
der a
n in
sect
icid
e tr
eate
d ne
t **
Slep
t und
er a
n un
trea
ted
net
Slep
t und
er a
ne
t but
don
't kn
ow if
tr
eate
d
Don
't kn
ow if
sl
ept u
nder
a
net
Did
not
sle
ep
unde
r a
bedn
et
Num
ber o
f ch
ildre
n ag
ed 0
-59
mon
ths
Mal
e 20
.65.
414
.5.8
.578
.826
05Se
x Fe
mal
e 19
.85.
213
.61.
0.4
79.8
2639
East
13
.26.
76.
5.1
.486
.413
00N
orth
27
.26.
019
.61.
6.7
72.1
2040
Sout
h 21
.34.
216
.5.7
.378
.314
44R
egio
n
Wes
t 5.
51.
83.
5.2
.294
.346
0R
ural
21
.75.
315
.5.9
.577
.841
44Ar
ea
Urb
an
14.5
5.3
8.6
.6.5
85.0
1101
0-11
mon
ths
24.8
7.4
16.5
.9.4
74.9
1016
12-2
3 m
onth
s 21
.26.
313
.81.
2.5
78.3
1074
24-3
5 m
onth
s 20
.05.
114
.1.8
.679
.410
6936
-47
mon
ths
18.0
4.6
12.7
.7.6
81.4
1181
Age
48-5
9 m
onth
s 17
.02.
913
.4.7
.382
.788
4Po
ores
t 14
.13.
79.
41.
1.4
85.5
1109
Sec
ond
19.2
4.2
13.9
1.0
.680
.212
31M
iddl
e 26
.65.
720
.0.9
.572
.911
56Fo
urth
22
.16.
415
.1.6
.677
.410
20
Wea
lth in
dex
quin
tiles
Ric
hest
18
.57.
510
.5.5
.381
.272
9C
hris
tian
14.7
5.6
8.4
.8.4
84.9
995
Mus
lim
21.5
5.2
15.4
.9.5
78.0
4240
Rel
igio
n of
H
ouse
hold
H
ead
Oth
er/M
issi
ng
(*)
(*)
(*)
(*)
(*)
(*)
9To
tal
20.2
5.3
14.1
.9.5
79.3
5245
* M
ICS
indi
cato
r 38
** M
ICS
indi
cato
r 37;
MD
G in
dica
tor 2
2
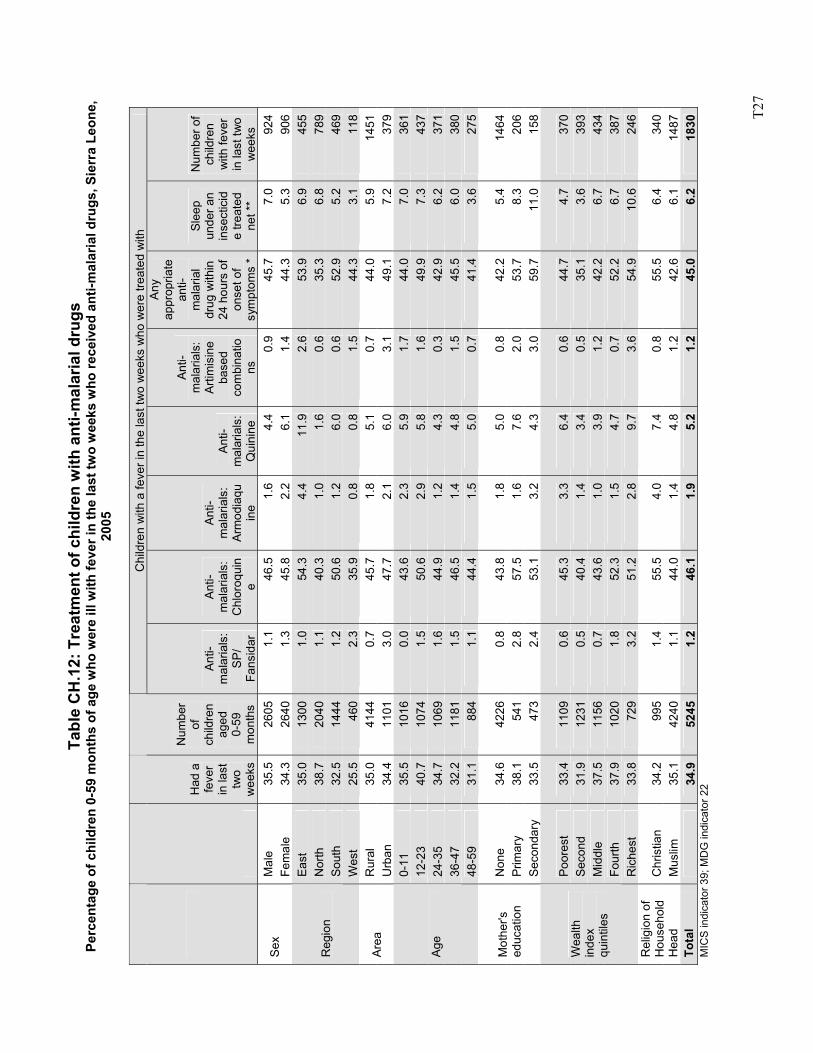
T2
7
Tabl
e C
H.1
2: T
reat
men
t of c
hild
ren
with
ant
i-mal
aria
l dru
gs
Perc
enta
ge o
f chi
ldre
n 0-
59 m
onth
s of
age
who
wer
e ill
with
feve
r in
the
last
two
wee
ks w
ho re
ceiv
ed a
nti-m
alar
ial d
rugs
, Sie
rra
Leon
e,
2005
Chi
ldre
n w
ith a
feve
r in
the
last
two
wee
ks w
ho w
ere
treat
ed w
ith
Had
a
feve
r in
last
tw
o w
eeks
Num
ber
of
child
ren
aged
0-
59
mon
ths
Anti-
mal
aria
ls:
SP/
Fans
idar
Anti-
mal
aria
ls:
Chl
oroq
uin
e
Anti-
mal
aria
ls:
Arm
odia
quin
e
Anti-
mal
aria
ls:
Qui
nine
Anti-
mal
aria
ls:
Arti
mis
ine
base
d co
mbi
natio
ns
Any
ap
prop
riate
an
ti-m
alar
ial
drug
with
in
24 h
ours
of
onse
t of
sym
ptom
s *
Slee
p un
der a
n in
sect
icid
e tre
ated
ne
t **
Num
ber o
f ch
ildre
n w
ith fe
ver
in la
st tw
o w
eeks
M
ale
35.5
26
05
1.1
46.5
1.
6 4.
4 0.
9 45
.7
7.0
924
Sex
Fem
ale
34.3
26
40
1.3
45.8
2.
2 6.
1 1.
4 44
.3
5.3
906
East
35
.0
1300
1.
0 54
.3
4.4
11.9
2.
6 53
.9
6.9
455
Nor
th
38.7
20
40
1.1
40.3
1.
0 1.
6 0.
6 35
.3
6.8
789
Sout
h 32
.5
1444
1.
2 50
.6
1.2
6.0
0.6
52.9
5.
2 46
9 R
egio
n
Wes
t 25
.5
460
2.3
35.9
0.
8 0.
8 1.
5 44
.3
3.1
118
Rur
al
35.0
41
44
0.7
45.7
1.
8 5.
1 0.
7 44
.0
5.9
1451
Ar
ea
Urb
an
34.4
11
01
3.0
47.7
2.
1 6.
0 3.
1 49
.1
7.2
379
0-11
35
.5
1016
0.
0 43
.6
2.3
5.9
1.7
44.0
7.
0 36
1 12
-23
40.7
10
74
1.5
50.6
2.
9 5.
8 1.
6 49
.9
7.3
437
24-3
5 34
.7
1069
1.
6 44
.9
1.2
4.3
0.3
42.9
6.
2 37
1 36
-47
32.2
11
81
1.5
46.5
1.
4 4.
8 1.
5 45
.5
6.0
380
Age
48-5
9 31
.1
884
1.1
44.4
1.
5 5.
0 0.
7 41
.4
3.6
275
Non
e 34
.6
4226
0.
8 43
.8
1.8
5.0
0.8
42.2
5.
4 14
64
Prim
ary
38.1
54
1 2.
8 57
.5
1.6
7.6
2.0
53.7
8.
3 20
6 M
othe
r's
educ
atio
n Se
cond
ary
33.5
47
3 2.
4 53
.1
3.2
4.3
3.0
59.7
11
.0
158
Poor
est
33.4
11
09
0.6
45.3
3.
3 6.
4 0.
6 44
.7
4.7
370
Sec
ond
31.9
12
31
0.5
40.4
1.
4 3.
4 0.
5 35
.1
3.6
393
Mid
dle
37.5
11
56
0.7
43.6
1.
0 3.
9 1.
2 42
.2
6.7
434
Four
th
37.9
10
20
1.8
52.3
1.
5 4.
7 0.
7 52
.2
6.7
387
Wea
lth
inde
x qu
intil
es
Ric
hest
33
.8
729
3.2
51.2
2.
8 9.
7 3.
6 54
.9
10.6
24
6
Chr
istia
n 34
.2
995
1.4
55.5
4.
0 7.
4 0.
8 55
.5
6.4
340
Rel
igio
n of
H
ouse
hold
H
ead
Mus
lim
35.1
42
40
1.1
44.0
1.
4 4.
8 1.
2 42
.6
6.1
1487
To
tal
34
.9
5245
1.
2 46
.1
1.9
5.2
1.2
45.0
6.
2 18
30
MIC
S in
dica
tor 3
9; M
DG
indi
cato
r 22
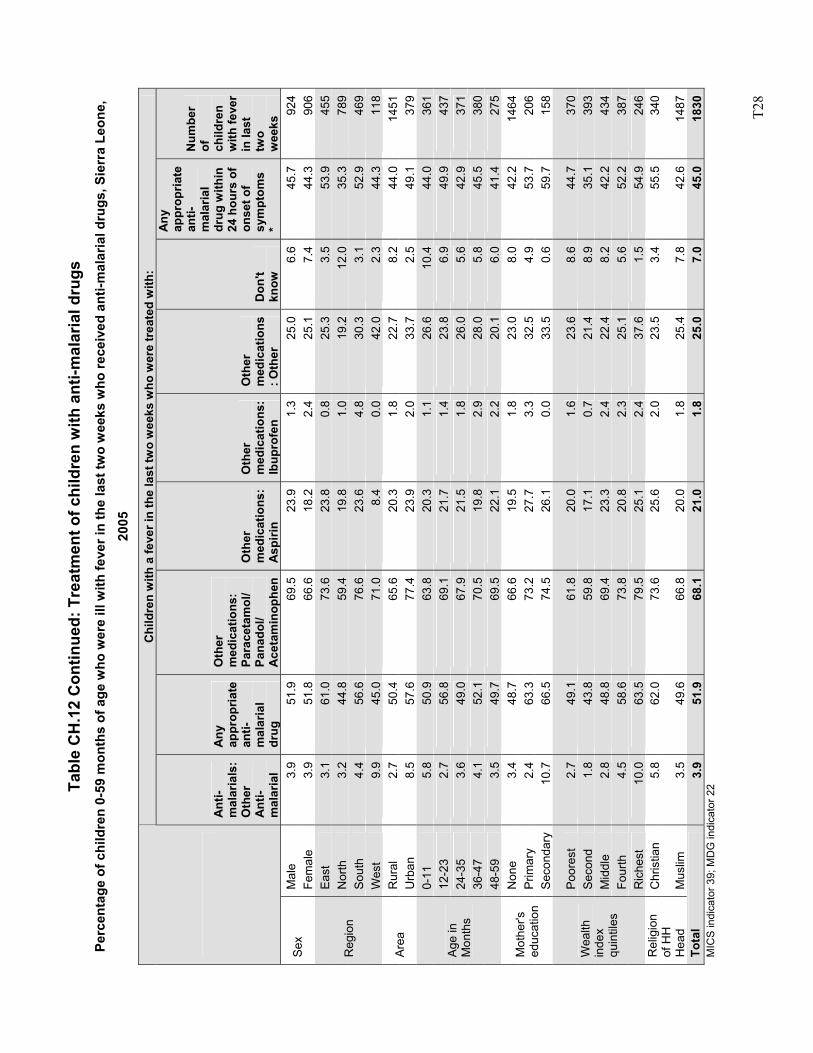
T2
8
Tabl
e C
H.1
2 C
ontin
ued:
Tre
atm
ent o
f chi
ldre
n w
ith a
nti-m
alar
ial d
rugs
Pe
rcen
tage
of c
hild
ren
0-59
mon
ths
of a
ge w
ho w
ere
ill w
ith fe
ver i
n th
e la
st tw
o w
eeks
who
rece
ived
ant
i-mal
aria
l dru
gs, S
ierr
a Le
one,
20
05
Chi
ldre
n w
ith a
feve
r in
the
last
two
wee
ks w
ho w
ere
trea
ted
with
:
A
nti-
mal
aria
ls:
Oth
er
Ant
i-m
alar
ial
Any
ap
prop
riate
an
ti-m
alar
ial
drug
Oth
er
med
icat
ions
: Pa
race
tam
ol/
Pana
dol/
Ace
tam
inop
hen
Oth
er
med
icat
ions
: A
spiri
n
Oth
er
med
icat
ions
: Ib
upro
fen
Oth
er
med
icat
ions
: O
ther
D
on't
know
Any
ap
prop
riate
an
ti-m
alar
ial
drug
with
in
24 h
ours
of
onse
t of
sym
ptom
s *
Num
ber
of
child
ren
with
feve
r in
last
tw
o w
eeks
M
ale
3.9
51.9
69
.5
23.9
1.
3 25
.0
6.6
45.7
92
4 Se
x Fe
mal
e 3.
9 51
.8
66.6
18
.2
2.4
25.1
7.
4 44
.3
906
East
3.
1 61
.0
73.6
23
.8
0.8
25.3
3.
5 53
.9
455
Nor
th
3.2
44.8
59
.4
19.8
1.
0 19
.2
12.0
35
.3
789
Sout
h 4.
4 56
.6
76.6
23
.6
4.8
30.3
3.
1 52
.9
469
Reg
ion
Wes
t 9.
9 45
.0
71.0
8.
4 0.
0 42
.0
2.3
44.3
11
8 R
ural
2.
7 50
.4
65.6
20
.3
1.8
22.7
8.
2 44
.0
1451
Ar
ea
Urb
an
8.5
57.6
77
.4
23.9
2.
0 33
.7
2.5
49.1
37
9 0-
11
5.8
50.9
63
.8
20.3
1.
1 26
.6
10.4
44
.0
361
12-2
3 2.
7 56
.8
69.1
21
.7
1.4
23.8
6.
9 49
.9
437
24-3
5 3.
6 49
.0
67.9
21
.5
1.8
26.0
5.
6 42
.9
371
36-4
7 4.
1 52
.1
70.5
19
.8
2.9
28.0
5.
8 45
.5
380
Age
in
Mon
ths
48-5
9 3.
5 49
.7
69.5
22
.1
2.2
20.1
6.
0 41
.4
275
Non
e 3.
4 48
.7
66.6
19
.5
1.8
23.0
8.
0 42
.2
1464
Pr
imar
y 2.
4 63
.3
73.2
27
.7
3.3
32.5
4.
9 53
.7
206
Mot
her's
ed
ucat
ion
Seco
ndar
y 10
.7
66.5
74
.5
26.1
0.
0 33
.5
0.6
59.7
15
8
Poor
est
2.7
49.1
61
.8
20.0
1.
6 23
.6
8.6
44.7
37
0 S
econ
d 1.
8 43
.8
59.8
17
.1
0.7
21.4
8.
9 35
.1
393
Mid
dle
2.8
48.8
69
.4
23.3
2.
4 22
.4
8.2
42.2
43
4 Fo
urth
4.
5 58
.6
73.8
20
.8
2.3
25.1
5.
6 52
.2
387
Wea
lth
inde
x qu
intil
es
Ric
hest
10
.0
63.5
79
.5
25.1
2.
4 37
.6
1.5
54.9
24
6 C
hris
tian
5.8
62.0
73
.6
25.6
2.
0 23
.5
3.4
55.5
34
0 R
elig
ion
of H
H
Hea
d M
uslim
3.
5 49
.6
66.8
20
.0
1.8
25.4
7.
8 42
.6
1487
To
tal
3.9
51.9
68
.1
21.0
1.
8 25
.0
7.0
45.0
18
30
MIC
S in
dica
tor 3
9; M
DG
indi
cato
r 22
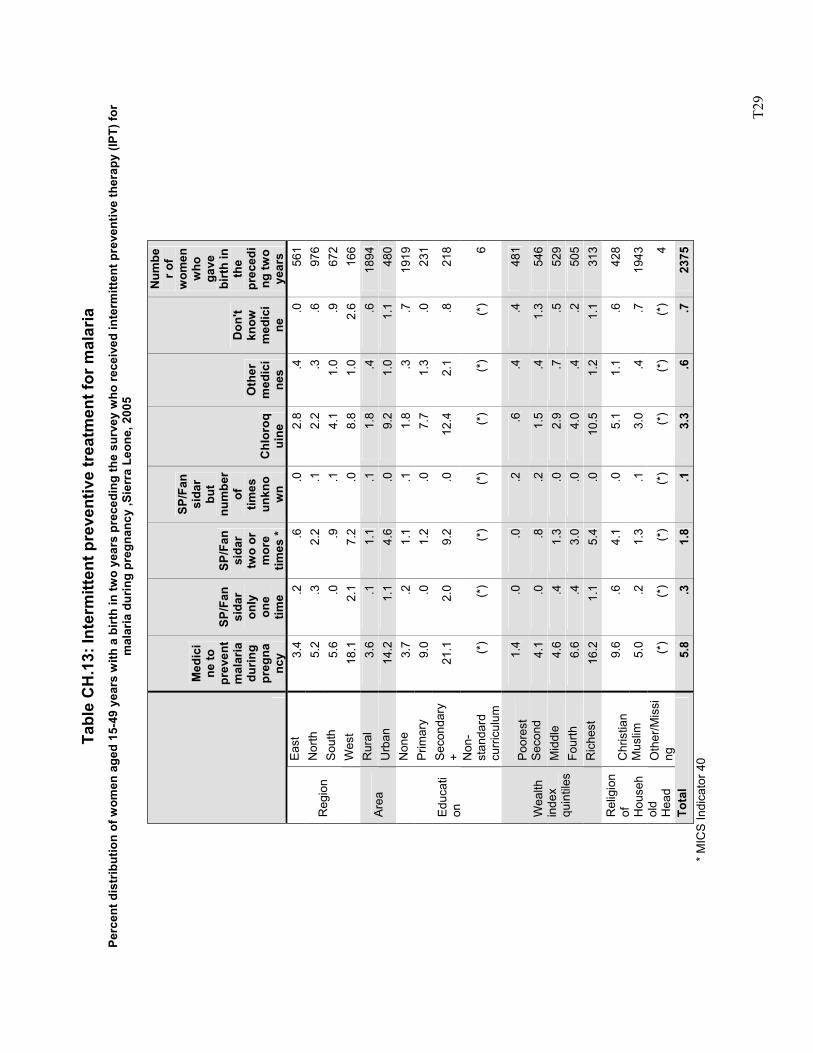
T2
9
Ta
ble
CH
.13:
Inte
rmitt
ent p
reve
ntiv
e tr
eatm
ent f
or m
alar
ia
Perc
ent d
istr
ibut
ion
of w
omen
age
d 15
-49
year
s w
ith a
birt
h in
two
year
s pr
eced
ing
the
surv
ey w
ho re
ceiv
ed in
term
itten
t pre
vent
ive
ther
apy
(IPT)
for
mal
aria
dur
ing
preg
nanc
y ,S
ierr
a Le
one,
200
5
Med
ici
ne to
pr
even
t m
alar
ia
durin
g pr
egna
ncy
SP/F
ansi
dar
only
on
e tim
e
SP/F
ansi
dar
two
or
mor
e tim
es *
SP/F
ansi
dar
but
num
ber
of
times
un
kno
wn
Chl
oroq
uine
Oth
er
med
ici
nes
Don
't kn
ow
med
ici
ne
Num
ber o
f w
omen
w
ho
gave
bi
rth
in
the
prec
edi
ng tw
o ye
ars
East
3.
4.2
.6.0
2.8
.4.0
561
Nor
th
5.2
.32.
2.1
2.2
.3.6
976
Sout
h 5.
6.0
.9.1
4.1
1.0
.967
2R
egio
n
Wes
t 18
.12.
17.
2.0
8.8
1.0
2.6
166
Rur
al
3.6
.11.
1.1
1.8
.4.6
1894
Are
a
Urb
an
14.2
1.1
4.6
.09.
2 1.
01.
148
0N
one
3.7
.21.
1.1
1.8
.3.7
1919
Prim
ary
9.0
.01.
2.0
7.7
1.3
.023
1Se
cond
ary
+ 21
.12.
09.
2.0
12.4
2.
1.8
218
Educ
ati
on
Non
-st
anda
rd
curr
icul
um
(*)
(*)
(*)
(*)
(*)
(*)
(*)
6
Poor
est
1.4
.0.0
.2.6
.4
.448
1
Sec
ond
4.1
.0.8
.21.
5 .4
1.3
546
Mid
dle
4.6
.41.
3.0
2.9
.7.5
529
Four
th
6.6
.43.
0.0
4.0
.4.2
505
Wea
lth
inde
x qu
intil
es
Ric
hest
16
.21.
15.
4.0
10.5
1.
21.
131
3 C
hris
tian
9.6
.64.
1.0
5.1
1.1
.642
8
Mus
lim
5.0
.21.
3.1
3.0
.4.7
1943
Rel
igio
n of
H
ouse
hol
d H
ead
O
ther
/Mis
sing
(*
)(*
)(*
)(*
)(*
) (*
)(*
)4
Tota
l 5.
8.3
1.8
.13.
3 .6
.723
75
*
MIC
S In
dica
tor 4
0
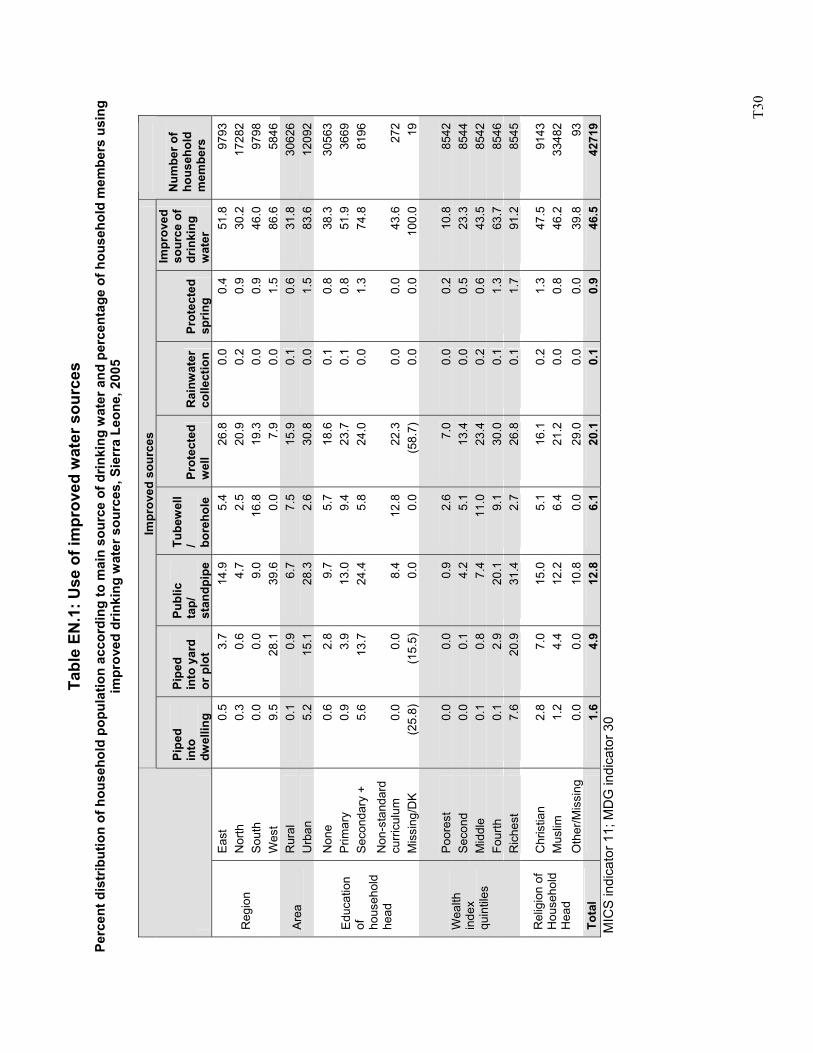
T3
0
Tabl
e EN
.1: U
se o
f im
prov
ed w
ater
sou
rces
Pe
rcen
t dis
trib
utio
n of
hou
seho
ld p
opul
atio
n ac
cord
ing
to m
ain
sour
ce o
f drin
king
wat
er a
nd p
erce
ntag
e of
hou
seho
ld m
embe
rs u
sing
im
prov
ed d
rinki
ng w
ater
sou
rces
, Sie
rra
Leon
e, 2
005
Im
prov
ed s
ourc
es
Pipe
d in
to
dwel
ling
Pipe
d in
to y
ard
or p
lot
Publ
ic
tap/
st
andp
ipe
Tube
wel
l/ bo
reho
le
Prot
ecte
d w
ell
Rai
nwat
er
colle
ctio
n Pr
otec
ted
sprin
g
Impr
oved
so
urce
of
drin
king
w
ater
Num
ber o
f ho
useh
old
mem
bers
East
0.
5 3.
7 14
.9
5.4
26.8
0.
0 0.
4 51
.8
9793
N
orth
0.
3 0.
6 4.
7 2.
5 20
.9
0.2
0.9
30.2
17
282
Sout
h 0.
0 0.
0 9.
0 16
.8
19.3
0.
0 0.
9 46
.0
9798
R
egio
n
Wes
t 9.
5 28
.1
39.6
0.
0 7.
9 0.
0 1.
5 86
.6
5846
R
ural
0.
1 0.
9 6.
7 7.
5 15
.9
0.1
0.6
31.8
30
626
Area
U
rban
5.
2 15
.1
28.3
2.
6 30
.8
0.0
1.5
83.6
12
092
Non
e 0.
6 2.
8 9.
7 5.
7 18
.6
0.1
0.8
38.3
30
563
Prim
ary
0.9
3.9
13.0
9.
4 23
.7
0.1
0.8
51.9
36
69
Seco
ndar
y +
5.6
13.7
24
.4
5.8
24.0
0.
0 1.
3 74
.8
8196
Non
-sta
ndar
d cu
rricu
lum
0.
0 0.
0 8.
4 12
.8
22.3
0.
0 0.
0 43
.6
272
Edu
catio
n of
ho
useh
old
head
Mis
sing
/DK
(25.
8)
(15.
5)
0.0
0.0
(58.
7)
0.0
0.0
100.
0 19
Poor
est
0.0
0.0
0.9
2.6
7.0
0.0
0.2
10.8
85
42
Sec
ond
0.0
0.1
4.2
5.1
13.4
0.
0 0.
5 23
.3
8544
M
iddl
e 0.
1 0.
8 7.
4 11
.0
23.4
0.
2 0.
6 43
.5
8542
Fo
urth
0.
1 2.
9 20
.1
9.1
30.0
0.
1 1.
3 63
.7
8546
Wea
lth
inde
x qu
intil
es
Ric
hest
7.
6 20
.9
31.4
2.
7 26
.8
0.1
1.7
91.2
85
45
Chr
istia
n 2.
8 7.
0 15
.0
5.1
16.1
0.
2 1.
3 47
.5
9143
M
uslim
1.
2 4.
4 12
.2
6.4
21.2
0.
0 0.
8 46
.2
3348
2 R
elig
ion
of
Hou
seho
ld
Hea
d O
ther
/Mis
sing
0.
0 0.
0 10
.8
0.0
29.0
0.
0 0.
0 39
.8
93
Tota
l
1.6
4.9
12.8
6.
1 20
.1
0.1
0.9
46.5
42
719
MIC
S in
dica
tor 1
1; M
DG
indi
cato
r 30
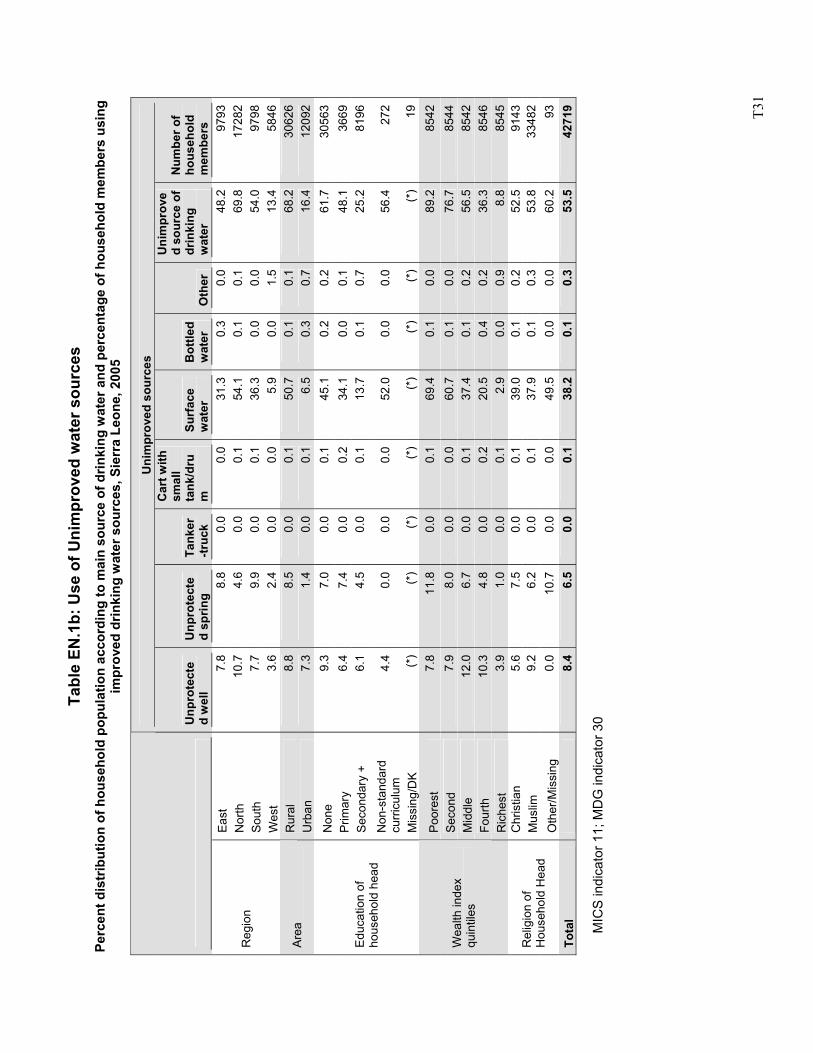
T3
1
Tabl
e EN
.1b:
Use
of U
nim
prov
ed w
ater
sou
rces
Pe
rcen
t dis
trib
utio
n of
hou
seho
ld p
opul
atio
n ac
cord
ing
to m
ain
sour
ce o
f drin
king
wat
er a
nd p
erce
ntag
e of
hou
seho
ld m
embe
rs u
sing
im
prov
ed d
rinki
ng w
ater
sou
rces
, Sie
rra
Leon
e, 2
005
MIC
S in
dica
tor 1
1; M
DG
indi
cato
r 30
Uni
mpr
oved
sou
rces
U
npro
tect
ed
wel
l U
npro
tect
ed
sprin
g Ta
nker
-truc
k
Car
t with
sm
all
tank
/dru
m
Surf
ace
wat
er
Bot
tled
wat
er
Oth
er
Uni
mpr
ove
d so
urce
of
drin
king
w
ater
Num
ber o
f ho
useh
old
mem
bers
Ea
st
7.8
8.8
0.0
0.0
31.3
0.
3 0.
0 48
.2
9793
N
orth
10
.7
4.6
0.0
0.1
54.1
0.
1 0.
1 69
.8
1728
2 So
uth
7.7
9.9
0.0
0.1
36.3
0.
0 0.
0 54
.0
9798
R
egio
n
Wes
t 3.
6 2.
4 0.
0 0.
0 5.
9 0.
0 1.
5 13
.4
5846
R
ural
8.
8 8.
5 0.
0 0.
1 50
.7
0.1
0.1
68.2
30
626
Area
U
rban
7.
3 1.
4 0.
0 0.
1 6.
5 0.
3 0.
7 16
.4
1209
2
Non
e 9.
3 7.
0 0.
0 0.
1 45
.1
0.2
0.2
61.7
30
563
Prim
ary
6.4
7.4
0.0
0.2
34.1
0.
0 0.
1 48
.1
3669
Se
cond
ary
+ 6.
1 4.
5 0.
0 0.
1 13
.7
0.1
0.7
25.2
81
96
Non
-sta
ndar
d cu
rric
ulum
4.
4 0.
0 0.
0 0.
0 52
.0
0.0
0.0
56.4
27
2
Edu
catio
n of
ho
useh
old
head
Mis
sing
/DK
(*)
(*)
(*)
(*)
(*)
(*)
(*)
(*)
19
Poor
est
7.8
11.8
0.
0 0.
1 69
.4
0.1
0.0
89.2
85
42
Sec
ond
7.9
8.0
0.0
0.0
60.7
0.
1 0.
0 76
.7
8544
M
iddl
e 12
.0
6.7
0.0
0.1
37.4
0.
1 0.
2 56
.5
8542
Fo
urth
10
.3
4.8
0.0
0.2
20.5
0.
4 0.
2 36
.3
8546
Wea
lth in
dex
quin
tiles
Ric
hest
3.
9 1.
0 0.
0 0.
1 2.
9 0.
0 0.
9 8.
8 85
45
Chr
istia
n 5.
6 7.
5 0.
0 0.
1 39
.0
0.1
0.2
52.5
91
43
Mus
lim
9.2
6.2
0.0
0.1
37.9
0.
1 0.
3 53
.8
3348
2 R
elig
ion
of
Hou
seho
ld H
ead
Oth
er/M
issi
ng
0.0
10.7
0.
0 0.
0 49
.5
0.0
0.0
60.2
93
To
tal
8.
4 6.
5 0.
0 0.
1 38
.2
0.1
0.3
53.5
42
719
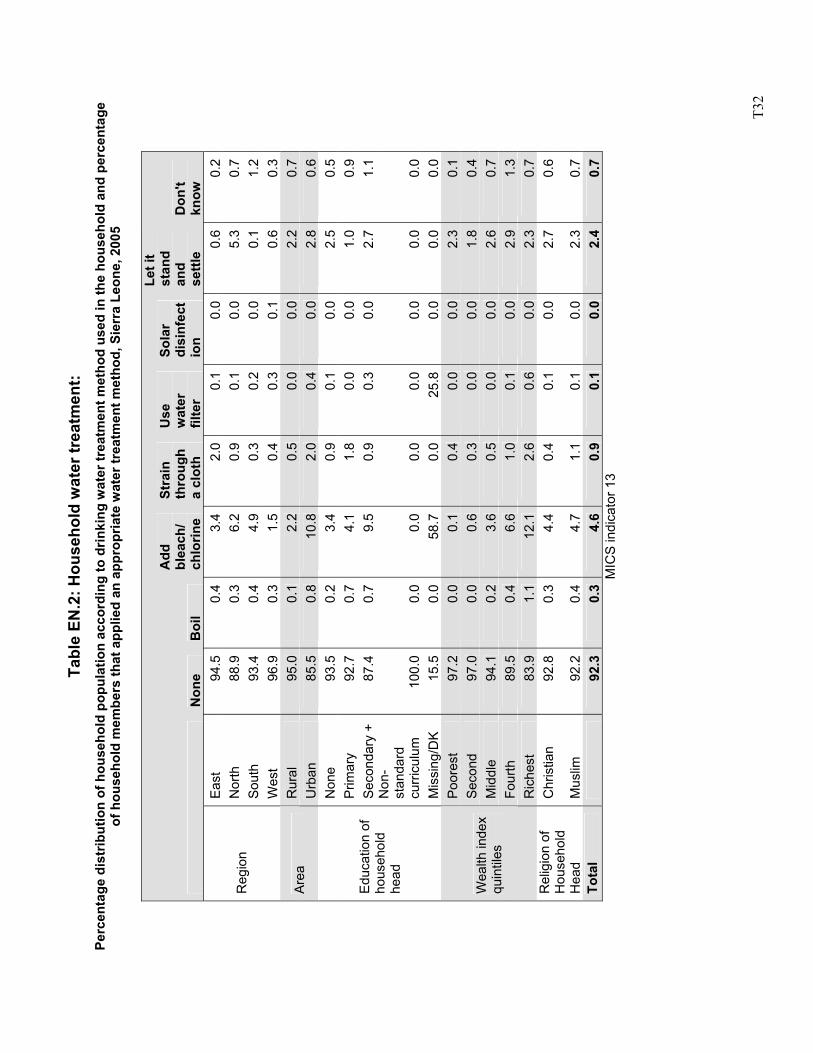
T3
2
Tabl
e EN
.2: H
ouse
hold
wat
er tr
eatm
ent:
Perc
enta
ge d
istr
ibut
ion
of h
ouse
hold
pop
ulat
ion
acco
rdin
g to
drin
king
wat
er tr
eatm
ent m
etho
d us
ed in
the
hous
ehol
d an
d pe
rcen
tage
of
hou
seho
ld m
embe
rs th
at a
pplie
d an
app
ropr
iate
wat
er tr
eatm
ent m
etho
d, S
ierr
a Le
one,
200
5
N
one
Boi
l
Add
bl
each
/ ch
lorin
e
Stra
in
thro
ugh
a cl
oth
Use
w
ater
fil
ter
Sola
r di
sinf
ect
ion
Let i
t st
and
and
settl
e D
on't
know
E
ast
94.5
0.4
3.4
2.0
0.1
0.0
0.6
0.2
Nor
th
88.9
0.3
6.2
0.9
0.1
0.0
5.3
0.7
Sou
th
93.4
0.4
4.9
0.3
0.2
0.0
0.1
1.2
Reg
ion
Wes
t 96
.90.
31.
50.
4 0.
30.
10.
60.
3R
ural
95
.00.
12.
20.
5 0.
00.
02.
20.
7A
rea
Urb
an
85.5
0.8
10.8
2.0
0.4
0.0
2.8
0.6
Non
e 93
.50.
23.
40.
9 0.
10.
02.
50.
5P
rimar
y 92
.70.
74.
11.
8 0.
00.
01.
00.
9S
econ
dary
+
87.4
0.7
9.5
0.9
0.3
0.0
2.7
1.1
Non
-st
anda
rd
curr
icul
um
100.
00.
00.
00.
0 0.
00.
00.
00.
0
Edu
catio
n of
ho
useh
old
head
Mis
sing
/DK
15
.50.
058
.70.
0 25
.80.
00.
00.
0P
oore
st
97.2
0.0
0.1
0.4
0.0
0.0
2.3
0.1
Seco
nd
97.0
0.0
0.6
0.3
0.0
0.0
1.8
0.4
Mid
dle
94.1
0.2
3.6
0.5
0.0
0.0
2.6
0.7
Four
th
89.5
0.4
6.6
1.0
0.1
0.0
2.9
1.3
Wea
lth in
dex
quin
tiles
Ric
hest
83
.91.
112
.12.
6 0.
60.
02.
30.
7C
hris
tian
92.8
0.3
4.4
0.4
0.1
0.0
2.7
0.6
Rel
igio
n of
H
ouse
hold
H
ead
Mus
lim
92.2
0.4
4.7
1.1
0.1
0.0
2.3
0.7
Tota
l
92.3
0.3
4.6
0.9
0.1
0.0
2.4
0.7
MIC
S in
dica
tor 1
3
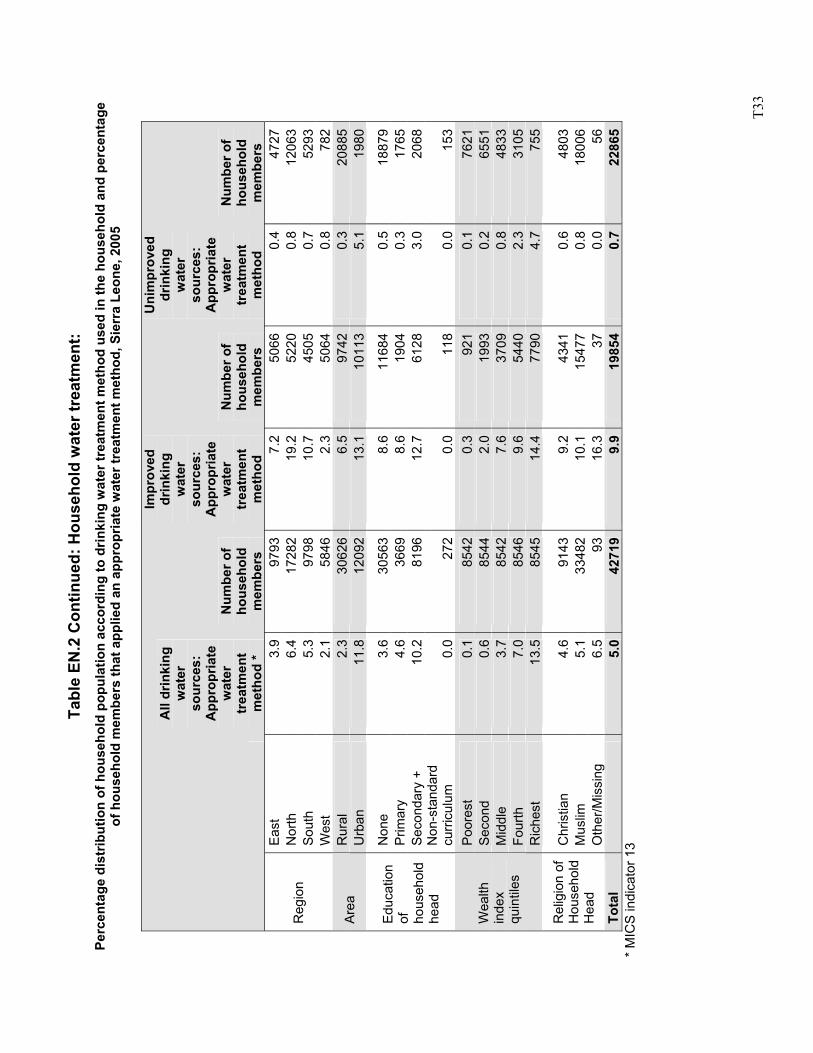
T3
3
Tabl
e EN
.2 C
ontin
ued:
Hou
seho
ld w
ater
trea
tmen
t: Pe
rcen
tage
dis
trib
utio
n of
hou
seho
ld p
opul
atio
n ac
cord
ing
to d
rinki
ng w
ater
trea
tmen
t met
hod
used
in th
e ho
useh
old
and
perc
enta
ge
of h
ouse
hold
mem
bers
that
app
lied
an a
ppro
pria
te w
ater
trea
tmen
t met
hod,
Sie
rra
Leon
e, 2
005
All
drin
king
w
ater
so
urce
s:
App
ropr
iate
w
ater
tr
eatm
ent
met
hod
*
Num
ber o
f ho
useh
old
mem
bers
Impr
oved
dr
inki
ng
wat
er
sour
ces:
A
ppro
pria
te
wat
er
trea
tmen
t m
etho
d
Num
ber o
f ho
useh
old
mem
bers
Uni
mpr
oved
dr
inki
ng
wat
er
sour
ces:
A
ppro
pria
te
wat
er
trea
tmen
t m
etho
d
Num
ber o
f ho
useh
old
mem
bers
E
ast
3.9
9793
7.2
5066
0.4
4727
Nor
th
6.4
1728
219
.2
5220
0.8
1206
3S
outh
5.
397
9810
.7
4505
0.7
5293
Reg
ion
Wes
t 2.
158
462.
3 50
640.
878
2R
ural
2.
330
626
6.5
9742
0.3
2088
5A
rea
Urb
an
11.8
1209
213
.1
1011
35.
119
80
Non
e 3.
630
563
8.6
1168
40.
518
879
Prim
ary
4.6
3669
8.6
1904
0.3
1765
Sec
onda
ry +
10
.281
9612
.7
6128
3.0
2068
Edu
catio
n of
ho
useh
old
head
N
on-s
tand
ard
curr
icul
um
0.0
272
0.0
118
0.0
153
Poo
rest
0.
185
420.
3 92
10.
176
21Se
cond
0.
685
442.
0 19
930.
265
51M
iddl
e 3.
785
427.
6 37
090.
848
33Fo
urth
7.
085
469.
6 54
402.
331
05
Wea
lth
inde
x qu
intil
es
Ric
hest
13
.585
4514
.4
7790
4.7
755
Chr
istia
n 4.
691
439.
2 43
410.
648
03M
uslim
5.
133
482
10.1
15
477
0.8
1800
6R
elig
ion
of
Hou
seho
ld
Hea
d O
ther
/Mis
sing
6.
593
16.3
37
0.0
56To
tal
5.
042
719
9.9
1985
40.
722
865
* MIC
S in
dica
tor 1
3
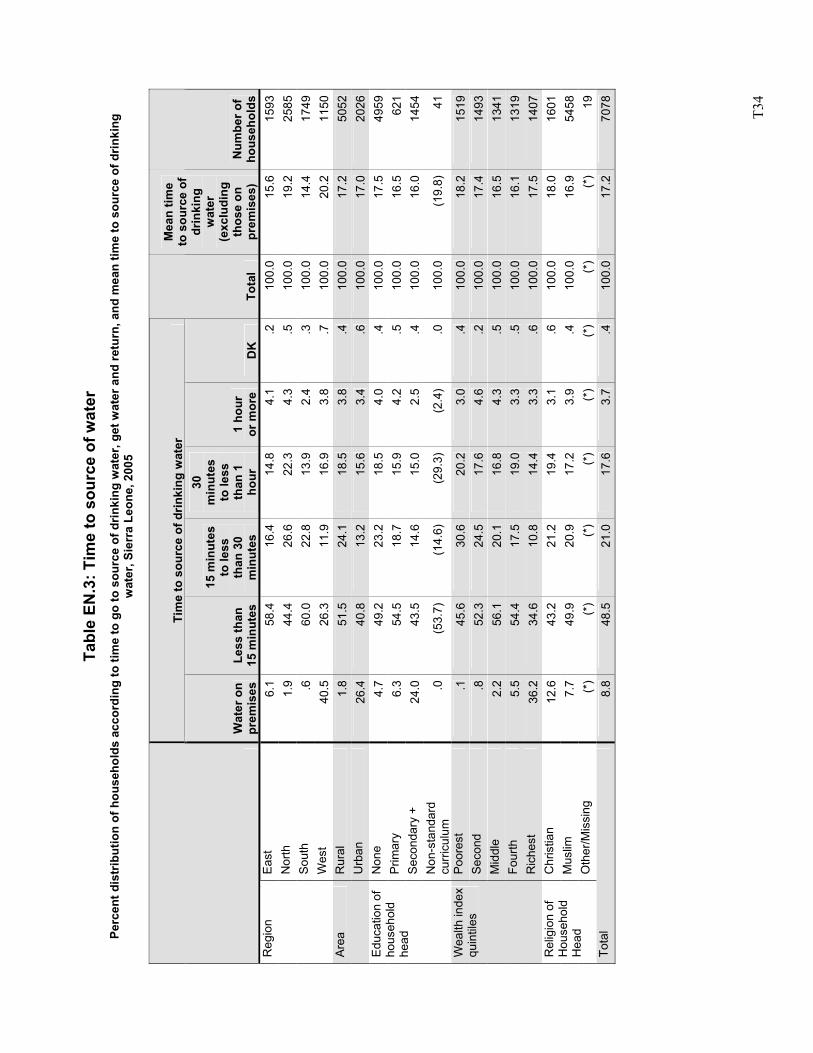
T3
4
Ta
ble
EN.3
: Tim
e to
sou
rce
of w
ater
Pe
rcen
t dis
trib
utio
n of
hou
seho
lds
acco
rdin
g to
tim
e to
go
to s
ourc
e of
drin
king
wat
er, g
et w
ater
and
retu
rn, a
nd m
ean
time
to s
ourc
e of
drin
king
w
ater
, Sie
rra
Leon
e, 2
005
Tim
e to
sou
rce
of d
rinki
ng w
ater
W
ater
on
prem
ises
Le
ss th
an
15 m
inut
es
15 m
inut
es
to le
ss
than
30
min
utes
30
min
utes
to
less
th
an 1
ho
ur
1 ho
ur
or m
ore
DK
To
tal
Mea
n tim
e to
sou
rce
of
drin
king
w
ater
(e
xclu
ding
th
ose
on
prem
ises
) N
umbe
r of
hous
ehol
dsEa
st
6.1
58.4
16.4
14.8
4.1
.210
0.0
15.6
1593
Nor
th
1.9
44.4
26.6
22.3
4.3
.510
0.0
19.2
2585
Sout
h .6
60.0
22.8
13.9
2.4
.310
0.0
14.4
1749
Reg
ion
Wes
t 40
.526
.311
.916
.93.
8.7
100.
020
.211
50R
ural
1.
851
.524
.118
.53.
8.4
100.
017
.250
52Ar
ea
Urb
an
26.4
40.8
13.2
15.6
3.4
.610
0.0
17.0
2026
Non
e 4.
749
.223
.218
.54.
0.4
100.
017
.549
59P
rimar
y 6.
354
.518
.715
.94.
2.5
100.
016
.562
1Se
cond
ary
+ 24
.043
.514
.615
.02.
5.4
100.
016
.014
54
Edu
catio
n of
ho
useh
old
head
Non
-sta
ndar
d cu
rric
ulum
.0
(53.
7)(1
4.6)
(29.
3)(2
.4)
.010
0.0
(19.
8)41
Poor
est
.145
.630
.620
.23.
0.4
100.
018
.215
19S
econ
d .8
52.3
24.5
17.6
4.6
.210
0.0
17.4
1493
Mid
dle
2.2
56.1
20.1
16.8
4.3
.510
0.0
16.5
1341
Four
th
5.5
54.4
17.5
19.0
3.3
.510
0.0
16.1
1319
Wea
lth in
dex
quin
tiles
Ric
hest
36
.234
.610
.814
.43.
3.6
100.
017
.514
07C
hris
tian
12.6
43.2
21.2
19.4
3.1
.610
0.0
18.0
1601
Mus
lim
7.7
49.9
20.9
17.2
3.9
.410
0.0
16.9
5458
Rel
igio
n of
H
ouse
hold
H
ead
Oth
er/M
issi
ng
(*)
(*)
(*)
(*)
(*)
(*)
(*)
(*)
19To
tal
8.8
48.5
21.0
17.6
3.7
.410
0.0
17.2
7078
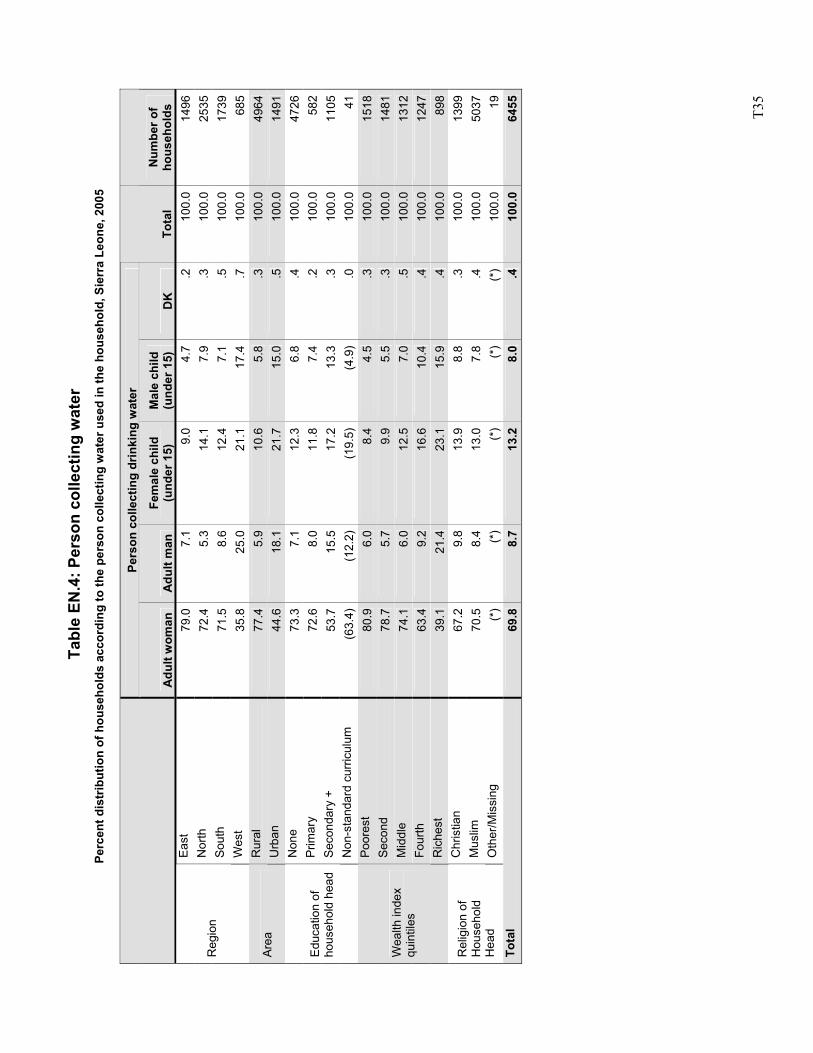
T3
5
Tab
le E
N.4
: Per
son
colle
ctin
g w
ater
Pe
rcen
t dis
trib
utio
n of
hou
seho
lds
acco
rdin
g to
the
pers
on c
olle
ctin
g w
ater
use
d in
the
hous
ehol
d, S
ierr
a Le
one,
200
5
Pers
on c
olle
ctin
g dr
inki
ng w
ater
A
dult
wom
an
Adu
lt m
an
Fem
ale
child
(u
nder
15)
M
ale
child
(u
nder
15)
D
K
Tota
l N
umbe
r of
hous
ehol
ds
East
79
.07.
19.
0 4.
7.2
100.
014
96N
orth
72
.45.
314
.1
7.9
.310
0.0
2535
Sout
h 71
.58.
612
.4
7.1
.510
0.0
1739
Reg
ion
Wes
t 35
.825
.021
.1
17.4
.710
0.0
685
Rur
al
77.4
5.9
10.6
5.
8.3
100.
049
64Ar
ea
Urb
an
44.6
18.1
21.7
15
.0.5
100.
014
91N
one
73.3
7.1
12.3
6.
8.4
100.
047
26P
rimar
y 72
.68.
011
.8
7.4
.210
0.0
582
Seco
ndar
y +
53.7
15.5
17.2
13
.3.3
100.
011
05E
duca
tion
of
hous
ehol
d he
ad
Non
-sta
ndar
d cu
rricu
lum
(6
3.4)
(12.
2)(1
9.5)
(4
.9)
.010
0.0
41Po
ores
t 80
.96.
08.
4 4.
5.3
100.
015
18S
econ
d 78
.75.
79.
9 5.
5.3
100.
014
81M
iddl
e 74
.16.
012
.5
7.0
.510
0.0
1312
Four
th
63.4
9.2
16.6
10
.4.4
100.
012
47
Wea
lth in
dex
quin
tiles
Ric
hest
39
.121
.423
.1
15.9
.410
0.0
898
Chr
istia
n 67
.29.
813
.9
8.8
.310
0.0
1399
Mus
lim
70.5
8.4
13.0
7.
8.4
100.
050
37R
elig
ion
of
Hou
seho
ld
Hea
d O
ther
/Mis
sing
(*
)(*
)(*
) (*
)(*
)10
0.0
19To
tal
69.8
8.7
13.2
8.
0.4
100.
064
55
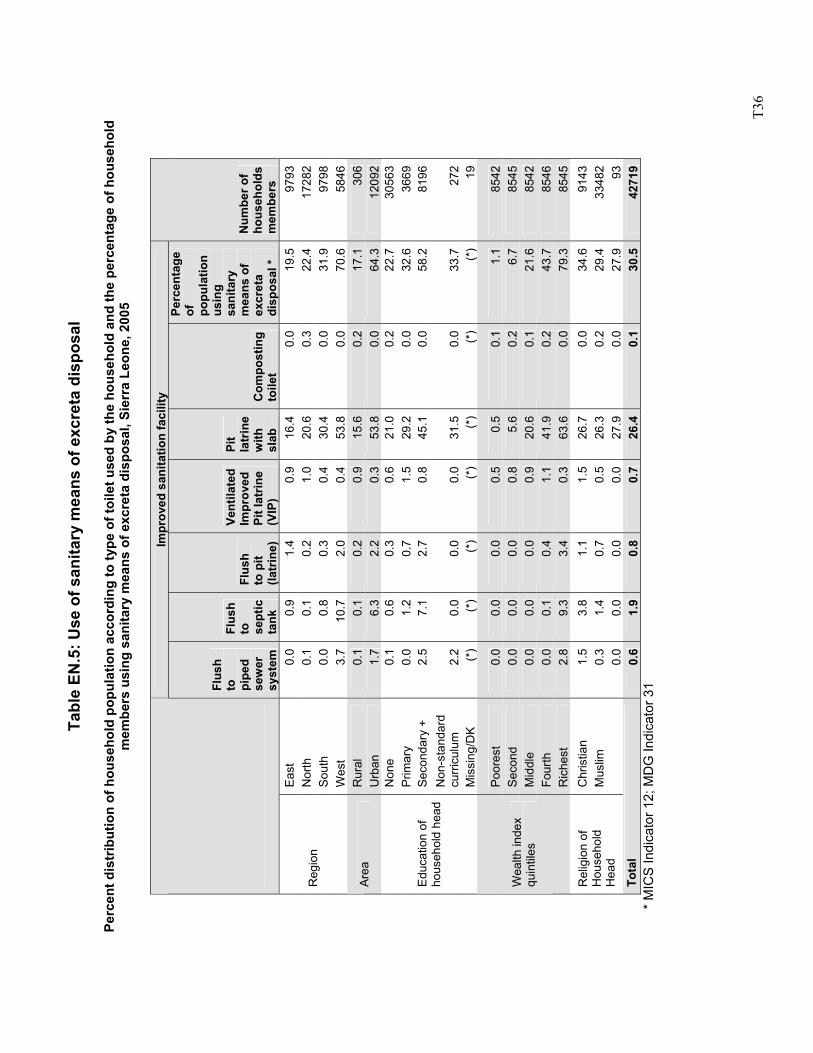
T3
6
Tabl
e EN
.5: U
se o
f san
itary
mea
ns o
f exc
reta
dis
posa
l
Perc
ent d
istr
ibut
ion
of h
ouse
hold
pop
ulat
ion
acco
rdin
g to
type
of t
oile
t use
d by
the
hous
ehol
d an
d th
e pe
rcen
tage
of h
ouse
hold
m
embe
rs u
sing
san
itary
mea
ns o
f exc
reta
dis
posa
l, Si
erra
Leo
ne, 2
005
Im
prov
ed s
anita
tion
faci
lity
Flus
h to
pi
ped
sew
er
syst
em
Flus
h to
se
ptic
ta
nk
Flus
h to
pit
(latr
ine)
Vent
ilate
d Im
prov
ed
Pit l
atrin
e (V
IP)
Pit
latr
ine
with
sl
ab
Com
post
ing
toile
t
Perc
enta
ge
of
popu
latio
n us
ing
sani
tary
m
eans
of
excr
eta
disp
osal
*
Num
ber o
f ho
useh
olds
m
embe
rs
East
0.
0 0.
9 1.
4 0.
9 16
.4
0.0
19.5
97
93
Nor
th
0.1
0.1
0.2
1.0
20.6
0.
3 22
.4
1728
2 So
uth
0.0
0.8
0.3
0.4
30.4
0.
0 31
.9
9798
R
egio
n
Wes
t 3.
7 10
.7
2.0
0.4
53.8
0.
0 70
.6
5846
R
ural
0.
1 0.
1 0.
2 0.
9 15
.6
0.2
17.1
30
6 Ar
ea
Urb
an
1.7
6.3
2.2
0.3
53.8
0.
0 64
.3
1209
2 N
one
0.1
0.6
0.3
0.6
21.0
0.
2 22
.7
3056
3 Pr
imar
y 0.
0 1.
2 0.
7 1.
5 29
.2
0.0
32.6
36
69
Seco
ndar
y +
2.5
7.1
2.7
0.8
45.1
0.
0 58
.2
8196
N
on-s
tand
ard
curri
culu
m
2.2
0.0
0.0
0.0
31.5
0.
0 33
.7
272
Edu
catio
n of
ho
useh
old
head
Mis
sing
/DK
(*
) (*
) (*
) (*
) (*
) (*
) (*
) 19
Poor
est
0.0
0.0
0.0
0.5
0.5
0.1
1.1
8542
S
econ
d 0.
0 0.
0 0.
0 0.
8 5.
6 0.
2 6.
7 85
45
Mid
dle
0.0
0.0
0.0
0.9
20.6
0.
1 21
.6
8542
Fo
urth
0.
0 0.
1 0.
4 1.
1 41
.9
0.2
43.7
85
46
Wea
lth in
dex
quin
tiles
Ric
hest
2.
8 9.
3 3.
4 0.
3 63
.6
0.0
79.3
85
45
Chr
istia
n 1.
5 3.
8 1.
1 1.
5 26
.7
0.0
34.6
91
43
Mus
lim
0.3
1.4
0.7
0.5
26.3
0.
2 29
.4
3348
2 R
elig
ion
of
Hou
seho
ld
Hea
d
0.0
0.0
0.0
0.0
27.9
0.
0 27
.9
93
Tota
l 0.
6 1.
9 0.
8 0.
7 26
.4
0.1
30.5
42
719
* M
ICS
Indi
cato
r 12;
MD
G In
dica
tor 3
1
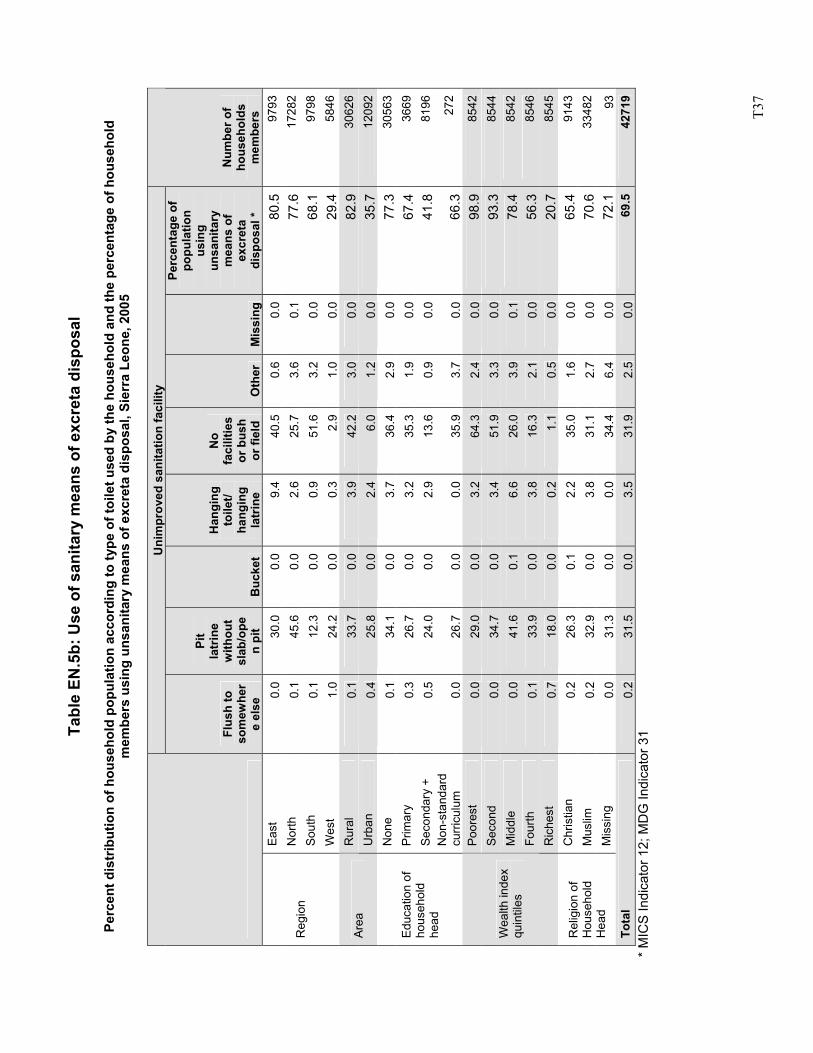
T3
7
Tabl
e EN
.5b:
Use
of s
anita
ry m
eans
of e
xcre
ta d
ispo
sal
Pe
rcen
t dis
trib
utio
n of
hou
seho
ld p
opul
atio
n ac
cord
ing
to ty
pe o
f toi
let u
sed
by th
e ho
useh
old
and
the
perc
enta
ge o
f hou
seho
ld
mem
bers
usi
ng u
nsan
itary
mea
ns o
f exc
reta
dis
posa
l, Si
erra
Leo
ne, 2
005
U
nim
prov
ed s
anita
tion
faci
lity
Flus
h to
so
mew
her
e el
se
Pit
latr
ine
with
out
slab
/ope
n pi
t B
ucke
t
Han
ging
to
ilet/
hang
ing
latr
ine
No
faci
litie
s or
bus
h or
fiel
d O
ther
M
issi
ng
Perc
enta
ge o
f po
pula
tion
usin
g un
sani
tary
m
eans
of
excr
eta
disp
osal
*
Num
ber o
f ho
useh
olds
m
embe
rs
East
0.
0 30
.0
0.0
9.4
40.5
0.
6 0.
0 80
.5
9793
N
orth
0.
1 45
.6
0.0
2.6
25.7
3.
6 0.
1 77
.6
1728
2 So
uth
0.1
12.3
0.
0 0.
9 51
.6
3.2
0.0
68.1
97
98
Reg
ion
Wes
t 1.
0 24
.2
0.0
0.3
2.9
1.0
0.0
29.4
58
46
Rur
al
0.1
33.7
0.
0 3.
9 42
.2
3.0
0.0
82.9
30
626
Area
U
rban
0.
4 25
.8
0.0
2.4
6.0
1.2
0.0
35.7
12
092
Non
e 0.
1 34
.1
0.0
3.7
36.4
2.
9 0.
0 77
.3
3056
3 P
rimar
y 0.
3 26
.7
0.0
3.2
35.3
1.
9 0.
0 67
.4
3669
Se
cond
ary
+ 0.
5 24
.0
0.0
2.9
13.6
0.
9 0.
0 41
.8
8196
E
duca
tion
of
hous
ehol
d he
ad
Non
-sta
ndar
d cu
rricu
lum
0.
0 26
.7
0.0
0.0
35.9
3.
7 0.
0 66
.3
272
Poor
est
0.0
29.0
0.
0 3.
2 64
.3
2.4
0.0
98.9
85
42
Sec
ond
0.0
34.7
0.
0 3.
4 51
.9
3.3
0.0
93.3
85
44
Mid
dle
0.0
41.6
0.
1 6.
6 26
.0
3.9
0.1
78.4
85
42
Four
th
0.1
33.9
0.
0 3.
8 16
.3
2.1
0.0
56.3
85
46
Wea
lth in
dex
quin
tiles
Ric
hest
0.
7 18
.0
0.0
0.2
1.1
0.5
0.0
20.7
85
45
Chr
istia
n 0.
2 26
.3
0.1
2.2
35.0
1.
6 0.
0 65
.4
9143
M
uslim
0.
2 32
.9
0.0
3.8
31.1
2.
7 0.
0 70
.6
3348
2 R
elig
ion
of
Hou
seho
ld
Hea
d M
issi
ng
0.0
31.3
0.
0 0.
0 34
.4
6.4
0.0
72.1
93
To
tal
0.2
31.5
0.
0 3.
5 31
.9
2.5
0.0
69.5
42
719
* MIC
S In
dica
tor 1
2; M
DG
Indi
cato
r 31
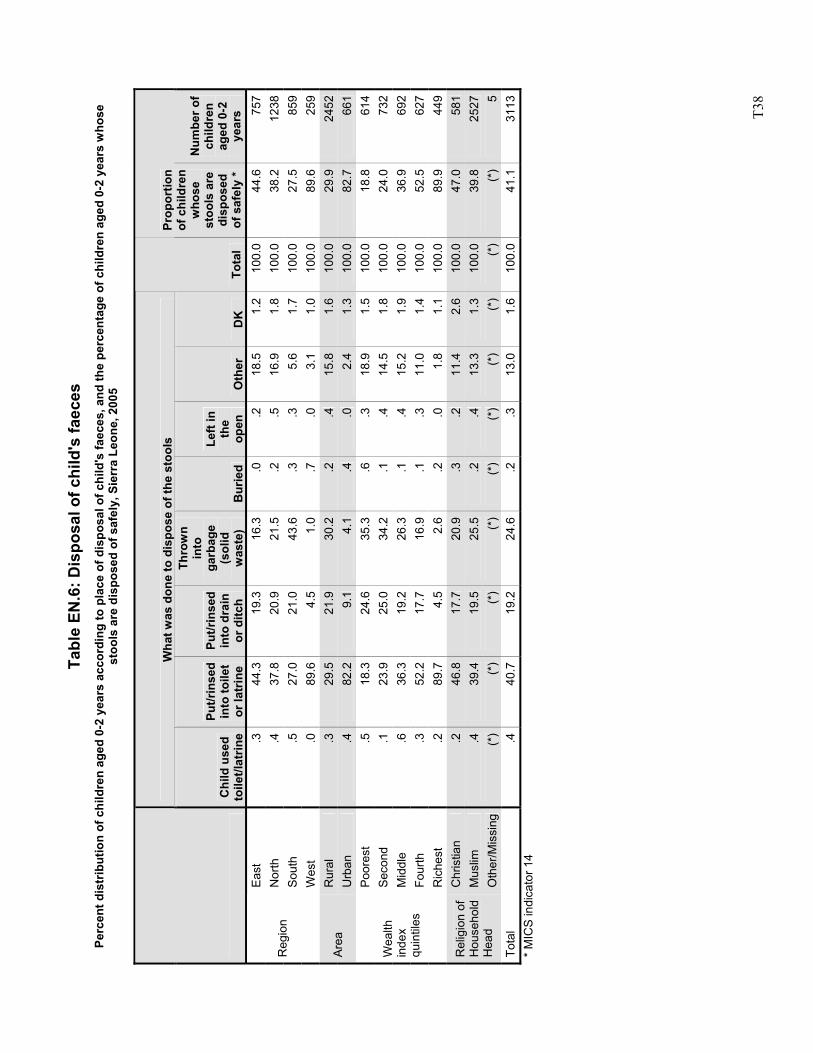
T3
8
Tabl
e EN
.6: D
ispo
sal o
f chi
ld's
faec
es
Perc
ent d
istr
ibut
ion
of c
hild
ren
aged
0-2
yea
rs a
ccor
ding
to p
lace
of d
ispo
sal o
f chi
ld's
faec
es, a
nd th
e pe
rcen
tage
of c
hild
ren
aged
0-2
yea
rs w
hose
st
ools
are
dis
pose
d of
saf
ely,
Sie
rra
Leon
e, 2
005
Wha
t was
don
e to
dis
pose
of t
he s
tool
s
C
hild
use
d to
ilet/l
atrin
e
Put/r
inse
d in
to to
ilet
or la
trin
e
Put/r
inse
d in
to d
rain
or
ditc
h
Thro
wn
into
ga
rbag
e (s
olid
w
aste
) B
urie
d
Left
in
the
open
O
ther
D
K
Tota
l
Prop
ortio
n of
chi
ldre
n w
hose
st
ools
are
di
spos
ed
of s
afel
y *
Num
ber o
f ch
ildre
n ag
ed 0
-2
year
s Ea
st
.3
44.3
19.3
16.3
.0.2
18
.51.
210
0.0
44.6
757
Nor
th
.4
37.8
20.9
21.5
.2.5
16
.91.
810
0.0
38.2
1238
Sout
h .5
27
.021
.043
.6.3
.3
5.6
1.7
100.
027
.585
9R
egio
n
Wes
t .0
89
.64.
51.
0.7
.0
3.1
1.0
100.
089
.625
9R
ural
.3
29
.521
.930
.2.2
.4
15.8
1.6
100.
029
.924
52Ar
ea
Urb
an
.4
82.2
9.1
4.1
.4.0
2.
41.
310
0.0
82.7
661
Poor
est
.5
18.3
24.6
35.3
.6.3
18
.91.
510
0.0
18.8
614
Sec
ond
.1
23.9
25.0
34.2
.1.4
14
.51.
810
0.0
24.0
732
Mid
dle
.6
36.3
19.2
26.3
.1.4
15
.21.
910
0.0
36.9
692
Four
th
.3
52.2
17.7
16.9
.1.3
11
.01.
410
0.0
52.5
627
Wea
lth
inde
x qu
intil
es
Ric
hest
.2
89
.74.
52.
6.2
.0
1.8
1.1
100.
089
.944
9C
hris
tian
.2
46.8
17.7
20.9
.3.2
11
.42.
610
0.0
47.0
581
Mus
lim
.4
39.4
19.5
25.5
.2.4
13
.31.
310
0.0
39.8
2527
Rel
igio
n of
H
ouse
hold
H
ead
Oth
er/M
issi
ng
(*)
(*)
(*)
(*)
(*)
(*)
(*)
(*)
(*)
(*)
5To
tal
.4
40.7
19.2
24.6
.2.3
13
.01.
610
0.0
41.1
3113
* M
ICS
indi
cato
r 14
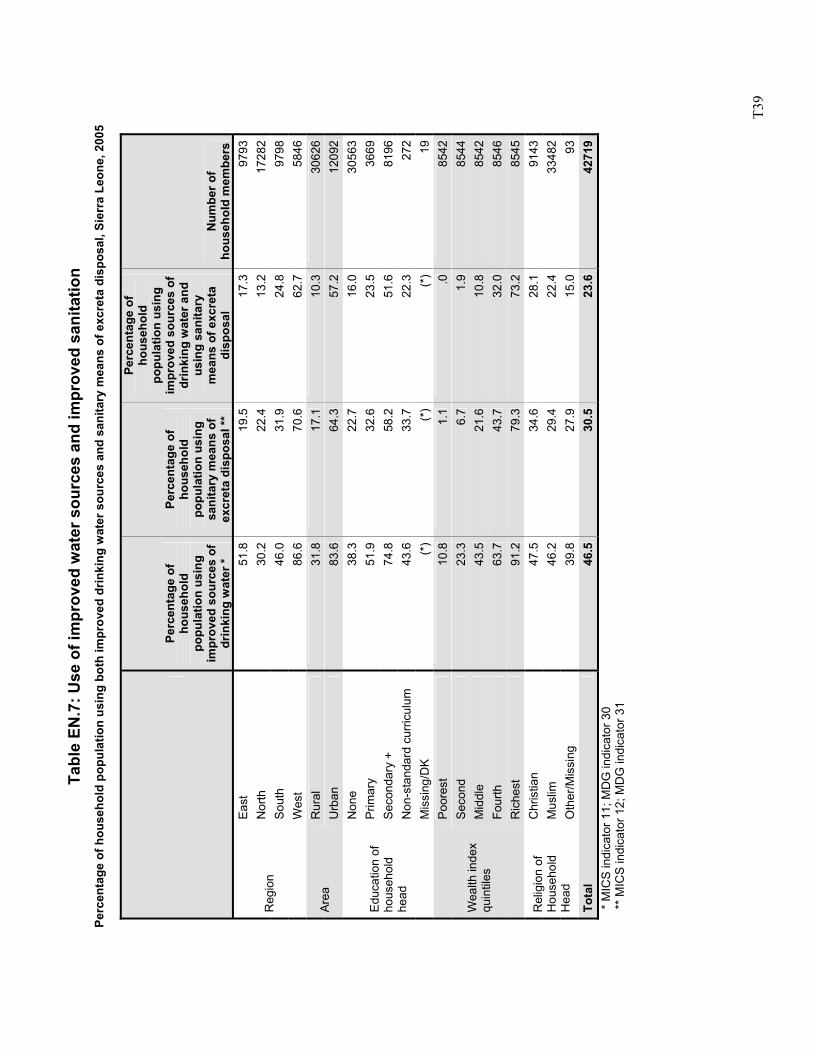
T3
9
Tabl
e EN
.7: U
se o
f im
prov
ed w
ater
sou
rces
and
impr
oved
san
itatio
n Pe
rcen
tage
of h
ouse
hold
pop
ulat
ion
usin
g bo
th im
prov
ed d
rinki
ng w
ater
sou
rces
and
san
itary
mea
ns o
f exc
reta
dis
posa
l, Si
erra
Leo
ne, 2
005
Pe
rcen
tage
of
hous
ehol
d po
pula
tion
usin
g im
prov
ed s
ourc
es o
f dr
inki
ng w
ater
*
Perc
enta
ge o
f ho
useh
old
popu
latio
n us
ing
sani
tary
mea
ns o
f ex
cret
a di
spos
al **
Perc
enta
ge o
f ho
useh
old
popu
latio
n us
ing
impr
oved
sou
rces
of
drin
king
wat
er a
nd
usin
g sa
nita
ry
mea
ns o
f exc
reta
di
spos
al
Num
ber o
f ho
useh
old
mem
bers
Ea
st
51.8
19.5
17
.397
93N
orth
30
.222
.4
13.2
1728
2So
uth
46.0
31.9
24
.897
98R
egio
n
Wes
t 86
.670
.6
62.7
5846
Rur
al
31.8
17.1
10
.330
626
Area
U
rban
83
.664
.3
57.2
1209
2N
one
38.3
22.7
16
.030
563
Prim
ary
51.9
32.6
23
.536
69Se
cond
ary
+ 74
.858
.2
51.6
8196
Non
-sta
ndar
d cu
rricu
lum
43
.633
.7
22.3
272
Edu
catio
n of
ho
useh
old
head
Mis
sing
/DK
(*)
(*)
(*)
19Po
ores
t 10
.81.
1 .0
8542
Sec
ond
23.3
6.7
1.9
8544
Mid
dle
43.5
21.6
10
.885
42Fo
urth
63
.743
.7
32.0
8546
Wea
lth in
dex
quin
tiles
Ric
hest
91
.279
.3
73.2
8545
Chr
istia
n 47
.534
.6
28.1
9143
Mus
lim
46.2
29.4
22
.433
482
Rel
igio
n of
H
ouse
hold
H
ead
Oth
er/M
issi
ng
39.8
27.9
15
.093
Tota
l 46
.530
.5
23.6
4271
9
* M
ICS
indi
cato
r 11;
MD
G in
dica
tor 3
0
** M
ICS
indi
cato
r 12;
MD
G in
dica
tor 3
1
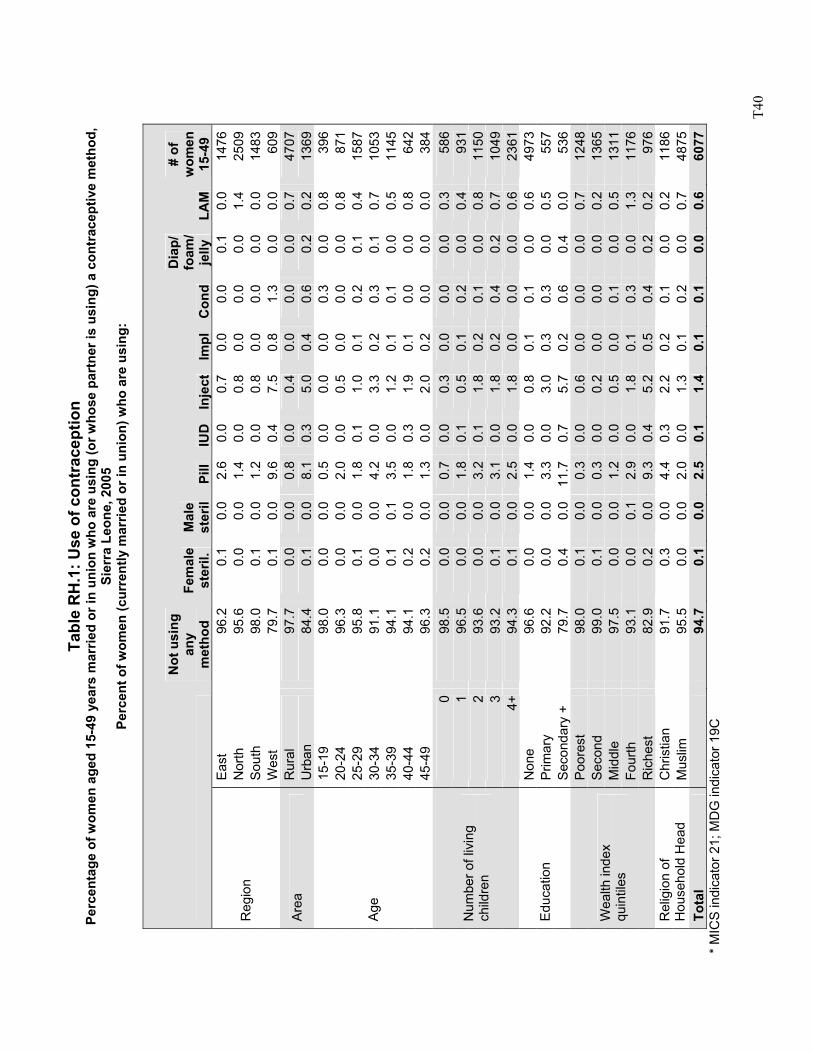
T4
0
Tabl
e R
H.1
: Use
of c
ontr
acep
tion
Perc
enta
ge o
f wom
en a
ged
15-4
9 ye
ars
mar
ried
or in
uni
on w
ho a
re u
sing
(or w
hose
par
tner
is u
sing
) a c
ontr
acep
tive
met
hod,
Si
erra
Leo
ne, 2
005
Perc
ent o
f wom
en (c
urre
ntly
mar
ried
or in
uni
on) w
ho a
re u
sing
:
Not
usi
ng
any
met
hod
Fem
ale
ster
il.
Mal
e st
eril
Pill
IUD
In
ject
Impl
Con
d
Dia
p/
foam
/ je
lly
LAM
# of
w
omen
15
-49
Eas
t 96
.20.
10.
02.
60.
0 0.
70.
00.
00.
10.
014
76N
orth
95
.60.
00.
01.
40.
0 0.
80.
00.
00.
01.
425
09S
outh
98
.00.
10.
01.
20.
0 0.
80.
00.
00.
00.
014
83R
egio
n
Wes
t 79
.70.
10.
09.
60.
4 7.
50.
81.
30.
00.
060
9R
ural
97
.70.
00.
00.
80.
0 0.
40.
00.
00.
00.
747
07A
rea
Urb
an
84.4
0.1
0.0
8.1
0.3
5.0
0.4
0.6
0.2
0.2
1369
15-1
9 98
.00.
00.
00.
50.
0 0.
00.
00.
30.
00.
839
620
-24
96.3
0.0
0.0
2.0
0.0
0.5
0.0
0.0
0.0
0.8
871
25-2
9 95
.80.
10.
01.
80.
1 1.
00.
10.
20.
10.
415
8730
-34
91.1
0.0
0.0
4.2
0.0
3.3
0.2
0.3
0.1
0.7
1053
35-3
9 94
.10.
10.
13.
50.
0 1.
20.
10.
10.
00.
511
4540
-44
94.1
0.2
0.0
1.8
0.3
1.9
0.1
0.0
0.0
0.8
642
Age
45-4
9 96
.30.
20.
01.
30.
0 2.
00.
20.
00.
00.
038
40
98.5
0.0
0.0
0.7
0.0
0.3
0.0
0.0
0.0
0.3
586
196
.50.
00.
01.
80.
1 0.
50.
10.
20.
00.
493
12
93.6
0.0
0.0
3.2
0.1
1.8
0.2
0.1
0.0
0.8
1150
393
.20.
10.
03.
10.
0 1.
80.
20.
40.
20.
710
49
Num
ber o
f liv
ing
child
ren
4+94
.30.
10.
02.
50.
0 1.
80.
00.
00.
00.
623
61N
one
96.6
0.0
0.0
1.4
0.0
0.8
0.1
0.1
0.0
0.6
4973
Prim
ary
92.2
0.0
0.0
3.3
0.0
3.0
0.3
0.3
0.0
0.5
557
Edu
catio
n S
econ
dary
+
79.7
0.4
0.0
11.7
0.7
5.7
0.2
0.6
0.4
0.0
536
Poo
rest
98
.00.
10.
00.
30.
0 0.
60.
00.
00.
00.
712
48Se
cond
99
.00.
10.
00.
30.
0 0.
20.
00.
00.
00.
213
65M
iddl
e 97
.50.
00.
01.
20.
0 0.
50.
00.
10.
00.
513
11Fo
urth
93
.10.
00.
12.
90.
0 1.
80.
10.
30.
01.
311
76
Wea
lth in
dex
quin
tiles
Ric
hest
82
.90.
20.
09.
30.
4 5.
20.
50.
40.
20.
297
6C
hris
tian
91.7
0.3
0.0
4.4
0.3
2.2
0.2
0.1
0.0
0.2
1186
Rel
igio
n of
H
ouse
hold
Hea
d M
uslim
95
.50.
00.
02.
00.
0 1.
30.
10.
20.
00.
748
75To
tal
94
.70.
10.
02.
50.
1 1.
40.
10.
10.
00.
660
77 *
MIC
S in
dica
tor 2
1; M
DG
indi
cato
r 19C
T4
1
Tabl
e R
H.1
: Use
of c
ontr
acep
tion
Perc
enta
ge o
f wom
en a
ged
15-4
9 ye
ars
mar
ried
or in
uni
on w
ho a
re u
sing
(or w
hose
par
tner
is u
sing
)a c
ontr
acep
tive
met
hod,
Si
erra
Leo
ne, 2
005:
Pe
rcen
t of w
omen
(cur
rent
ly m
arrie
d or
in u
nion
) who
are
usi
ng:
MIC
S in
dica
tor 2
1; M
DG
indi
cato
r 19C
Pe
riod
abst
ain
With
- dr
aw
Oth
er
Any
m
oder
n A
ny
trad
A
ny
met
hod
Num
ber o
f w
omen
cur
rent
ly
mar
ried
or in
un
ion
Eas
t 0.
10.
10.
23.
5 0.
33.
814
76N
orth
0.
00.
00.
52.
4 2.
04.
425
09S
outh
0.
00.
00.
02.
0 0.
02.
014
83R
egio
n
Wes
t 0.
10.
00.
419
.8
0.6
20.3
609
Rur
al
0.0
0.0
0.2
1.3
1.0
2.3
4707
Are
a U
rban
0.
10.
00.
614
.7
0.9
15.6
1369
15-1
9 0.
00.
00.
50.
7 1.
22.
039
620
-24
0.0
0.1
0.2
2.5
1.2
3.7
871
25-2
9 0.
10.
00.
33.
3 0.
94.
215
8730
-34
0.0
0.0
0.2
8.1
0.8
8.9
1053
35-3
9 0.
10.
00.
25.
1 0.
85.
911
4540
-44
0.0
0.0
0.9
4.2
1.7
5.9
642
Age
45-4
9 0.
00.
00.
03.
7 0.
03.
738
40
0.0
0.0
0.2
1.0
0.5
1.5
586
10.
10.
10.
12.
7 0.
83.
593
12
0.0
0.0
0.2
5.4
0.9
6.4
1150
30.
10.
00.
35.
8 1.
06.
810
49
Num
ber o
f liv
ing
child
ren
4+0.
00.
00.
54.
6 1.
15.
723
61N
one
0.0
0.0
0.3
2.4
1.0
3.4
4973
Prim
ary
0.0
0.0
0.3
6.9
0.9
7.8
557
Edu
catio
n S
econ
dary
+
0.4
0.0
0.4
19.6
0.
720
.353
6P
oore
st
0.1
0.1
0.1
1.0
1.0
2.0
1248
Seco
nd
0.0
0.0
0.2
0.6
0.4
1.0
1365
Mid
dle
0.0
0.0
0.3
1.7
0.8
2.5
1311
Four
th
0.0
0.0
0.5
5.2
1.8
6.9
1176
Wea
lth in
dex
quin
tiles
Ric
hest
0.
20.
00.
516
.2
0.9
17.1
976
Chr
istia
n 0.
20.
10.
37.
5 0.
88.
311
86R
elig
ion
of
Hou
seho
ld
Hea
d M
uslim
0.
00.
00.
33.
6 1.
04.
548
91To
tal
0.0
0.0
0.3
4.3
1.0
5.3
6077
T4
2
Tabl
e R
H.2
: Ant
enat
al c
are
prov
ider
Pe
rcen
t dis
trib
utio
n of
wom
en a
ged
15-4
9 w
ho g
ave
birt
h in
the
two
year
s pr
eced
ing
the
surv
ey b
y ty
pe o
f per
sonn
el p
rovi
ding
ant
enat
al c
are,
Sie
rra
Leon
e, 2
005
Pers
on p
rovi
ding
ant
enat
al c
are
M
edic
al
doct
or
Nur
se/
mid
wife
A
uxili
ary
mid
wife
Trad
ition
al
birt
h at
tend
ant
Com
mun
ity
heal
th
wor
ker
Rel
ativ
e/
Frie
nd
Oth
er
/mis
sing
No
ante
nata
l ca
re
rece
ived
Any
sk
illed
pe
rson
nel
*
Num
ber o
f w
omen
w
ho g
ave
birt
h in
th
e pr
eced
ing
two
year
s Ea
st
3.7
80.9
1.4
6.4
2.6
.21.
13.
785
.956
1N
orth
2.
5 60
.810
.08.
14.
73.
81.
28.
873
.497
6So
uth
4.8
66.6
14.1
4.0
2.1
.32.
26.
085
.567
2R
egio
n
Wes
t 17
.6
71.0
4.1
2.1
1.6
.0.0
3.6
92.8
166
Rur
al
2.0
68.2
9.0
7.1
3.5
2.1
1.1
6.9
79.3
1894
Area
U
rban
14
.1
66.9
7.5
2.3
2.1
.22.
44.
588
.548
015
-19
6.6
70.0
9.2
4.6
1.8
1.3
1.3
5.2
85.8
228
20-2
4 4.
8 69
.56.
56.
33.
91.
21.
06.
780
.849
625
-29
3.4
66.7
9.9
7.2
2.5
1.9
1.2
7.2
80.0
755
30-3
4 6.
0 67
.68.
16.
24.
41.
42.
73.
581
.836
235
-39
4.1
67.3
9.6
4.8
3.4
2.5
.97.
580
.936
040
-44
3.6
68.2
6.9
6.8
3.1
2.3
1.6
7.6
78.6
129
Age
45-4
9 (2
.4)
(67.
4)(1
3.6)
(2.7
)(4
.5)
.0(2
.3)
(7.1
)(8
3.4)
44N
one
2.8
67.4
8.8
6.8
3.7
1.9
1.4
7.2
79.0
1919
Prim
ary
7.3
72.1
7.7
5.1
1.3
.91.
83.
987
.123
1Se
cond
ary
+ 16
.2
68.6
9.2
1.4
1.4
.0.9
2.2
94.0
218
Edu
catio
n of
m
othe
r/car
e pr
ovid
er
Non
-sta
ndar
d cu
rric
ulum
(*
) (*
)(*
)(*
)(*
)(*
)(*
)(*
)(*
)6
Poor
est
.9
61.5
9.0
11.4
3.6
2.1
1.2
10.4
71.4
481
Sec
ond
2.2
69.7
8.6
4.9
4.4
1.9
1.2
7.1
80.5
546
Mid
dle
2.1
69.4
8.4
6.2
3.8
2.1
1.3
6.7
79.9
529
Four
th
5.0
70.5
10.0
5.7
2.2
1.4
1.6
3.6
85.5
505
Wea
lth
inde
x qu
intil
es
Ric
hest
17
.1
68.1
7.0
1.0
1.2
.61.
73.
392
.231
3C
hris
tian
6.5
69.0
7.7
5.3
2.4
1.7
.76.
683
.243
2R
elig
ion
of
Hou
seho
ld
Hea
d M
uslim
4.
0 67
.79.
06.
33.
41.
71.
56.
480
.719
43To
tal
4.5
67.9
8.7
6.1
3.2
1.7
1.4
6.4
81.1
2375
* M
ICS
indi
cato
r 20
T4
3
Tabl
e R
H.3
: Ant
enat
al c
are
cont
ent
Perc
enta
ge o
f pre
gnan
t wom
en re
ceiv
ing
ante
nnal
car
e am
ong
wom
en a
ged
15-4
9 ye
ars
who
gav
e bi
rth
in tw
o ye
ars
prec
edin
g th
e su
rvey
and
pe
rcen
tage
of p
regn
ant w
omen
rece
ivin
g sp
ecifi
c ca
re a
s pa
rt o
f the
ant
enat
al c
are
rece
ived
, Sie
rra
Leon
e
Perc
ent o
f pre
gnan
t wom
en w
ho h
ad:
Perc
ent o
f pr
egna
nt
wom
en
rece
ivin
g A
NC
on
e or
mor
e tim
es d
urin
g pr
egna
ncy*
B
lood
sam
ple
take
n
Blo
od
pres
sure
m
easu
red
Urin
e sp
ecim
en
take
n W
eigh
t m
easu
red
Num
ber o
f w
omen
who
ga
ve b
irth
in
two
year
s pr
eced
ing
surv
ey
East
96
.313
.576
.8
23.3
84.0
561
Nor
th
91.2
27.0
61.7
26
.263
.697
6So
uth
94.0
25.2
65.1
23
.673
.967
2R
egio
n
Wes
t 96
.470
.484
.5
70.9
84.0
166
Rur
al
93.1
19.5
64.8
20
.871
.018
94Ar
ea
Urb
an
95.5
53.5
79.6
56
.279
.948
015
-19
94.8
25.6
66.1
30
.171
.522
820
-24
93.3
28.1
71.7
30
.373
.649
625
-29
92.8
24.4
64.8
25
.972
.975
530
-34
96.5
30.9
70.7
30
.574
.136
235
-39
92.5
26.1
68.0
25
.572
.136
040
-44
92.4
21.8
62.4
26
.564
.912
9
Age
45-4
9 (9
2.9)
(21.
6)(7
4.4)
(2
7.4)
(85.
7)44
Non
e 92
.821
.964
.5
23.9
69.8
1919
Prim
ary
96.1
33.2
78.0
32
.282
.023
1Se
cond
ary
+ 97
.857
.486
.4
59.0
89.0
218
Educ
atio
n
Non
-sta
ndar
d cu
rricu
lum
(*
)(*
)(*
) (*
)(*
)6
Poor
est
89.6
12.7
54.0
15
.265
.548
1S
econ
d 92
.918
.261
.3
18.7
67.9
546
Mid
dle
93.3
22.7
69.9
25
.374
.652
9Fo
urth
96
.432
.775
.5
32.5
75.1
505
Wea
lth in
dex
quin
tiles
Ric
hest
96
.757
.384
.4
60.6
85.8
313
Chr
istia
n 93
.432
.470
.7
33.5
76.9
428
Rel
igio
n of
H
ouse
hold
H
ead
Mus
lim
93.6
25.0
67.1
26
.771
.919
47
Tota
l 93
.626
.367
.8
27.9
72.8
2375
*
MIC
S in
dica
tor 4
4
T4
4
Tabl
e R
H.4
: Ass
ista
nce
durin
g de
liver
y Pe
rcen
t dis
trib
utio
n of
wom
en a
ged
15-4
9 w
ith a
birt
h in
two
year
s pr
eced
ing
the
surv
ey b
y ty
pe o
f per
sonn
el a
ssis
ting
at d
eliv
ery,
Sie
rra
Leon
e, 2
005
Pers
on a
ssis
ting
at d
eliv
ery
M
edic
al
doct
or
Nur
se/
mid
wife
A
uxili
ary
mid
wife
Trad
ition
al
birt
h at
tend
ant
Com
mun
ity
heal
th
wor
ker
Rel
ativ
e/
frie
nd
Oth
er/
mis
sing
N
o at
tend
ant
Any
sk
illed
pe
rson
nel
*
Del
iver
ed
in h
ealth
fa
cilit
y **
Num
ber
of w
omen
w
ho g
ave
birt
h in
pr
eced
ing
two
year
s Ea
st
1.8
61.6
3.
2 25
.5
1.4
3.7
0.8
1.9
66.6
26
.4
561
Nor
th
2.4
20.4
2.
2 43
.3
1.9
25.1
1.
5 3.
3 25
13
.7
976
Sout
h 1.
6 34
.4
4.3
45.7
1.
7 8.
1 2.
4 1.
9 40
.2
15.3
67
2 R
egio
n
Wes
t 6.
2 71
.5
5.2
9.3
0.5
5.2
0 2.
1 82
.9
34.2
16
6 R
ural
1.
6 30
.4
2.8
44.3
1.
7 15
.2
1.5
2.5
34.8
15
.5
1894
Ar
ea
Urb
an
5 66
.4
4.9
9.9
1.5
8.5
1.5
2.2
76.4
30
.9
480
15-1
9 2.
8 43
.5
2.8
33.7
1.
4 10
.7
3.1
2.1
49
19.2
22
8 20
-24
1.7
39.8
3.
1 38
.1
1.9
12.1
1.
2 2.
1 44
.6
20.4
49
6 25
-29
2.5
36.1
3.
4 38
.4
1.5
14.3
1.
2 2.
6 42
19
.3
755
30-3
4 2.
4 37
.3
2.5
35.7
3.
1 14
3
1.9
42.2
18
.6
362
35-3
9 2.
2 35
4.
5 38
.6
0.8
15
0 3.
7 41
.8
16.3
36
0 40
-44
3.1
37.7
2.
4 37
0
16
0.7
3.1
43.2
14
.3
129
Age
45-4
9 0
(35.
5)
0 (3
4.7)
(2
.3)
(22.
6)
(5)
0 (3
5.5)
(1
4.2)
44
N
one
1.4
33.4
3.
2 40
.7
1.7
15.2
1.
6 2.
8 38
16
.1
1919
P
rimar
y 3.
9 49
.1
2.6
30.3
0.
4 10
.3
1.8
1.6
55.5
25
.8
231
Educ
atio
n Se
cond
ary
+ 8.
4 63
.2
4.1
16.2
2
4.3
1 0.
9 75
.7
33.6
21
8 Po
ores
t 1.
4 24
1.
8 46
.5
1.7
19.6
2.
4 2.
7 27
.2
10.3
48
1 S
econ
d 1.
3 30
.7
2 45
2
15.7
1.
4 1.
9 34
12
.6
546
Mid
dle
1.5
33.3
2.
7 41
.8
1.5
14.3
1.
3 3.
5 37
.5
20.3
52
9 Fo
urth
2.
1 43
.6
4.2
33.4
1.
8 11
.1
1.4
2.5
49.9
22
.6
505
Wea
lth
inde
x qu
intil
es
Ric
hest
7.
1 68
.8
6.7
8.9
0.7
5.5
1 1.
4 82
.6
32.4
31
3 C
hris
tian
3.6
43.5
3.
5 34
.4
2.4
8.7
0.7
3.3
50.5
23
.9
432
Rel
igio
n of
H
ouse
hold
H
ead
Mus
lim
2 36
.5
3.1
37.9
1.
5 14
.9
1.7
2.3
41.7
17
.5
1943
To
tal
2.3
37.7
3.
2 37
.4
1.6
13.8
1.
5 2.
5 43
.2
18.6
23
75
* M
ICS
indi
cato
r 4; M
DG
indi
cato
r 17
** M
ICS
indi
cato
r 5
T4
5
Tabl
e R
H.5
: Mat
erna
l mor
talit
y ra
tio
Life
time
risk
of m
ater
nal d
eath
and
pro
port
ion
of d
ead
sist
ers
dyin
g of
mat
erna
l cau
ses,
Sie
rra
Leon
e, 2
005
Num
ber
of a
dult
hous
ehol
d re
spon
dent
s
Sist
ers
who
re
ache
d ag
e 15
Sist
ers
who
re
ache
d ag
e 15
(a
djus
ted)
Sist
ers
who
re
ache
d ag
e 15
an
d w
ho
died
M
ater
nal
deat
hs
Adj
ustm
ent f
acto
r
Sist
er
units
of
risk
expo
sure
Life
time
risk
of
mat
erna
l de
ath
Perc
ent
of d
ead
sist
ers
dyin
g of
m
ater
nal
caus
es
Tota
l fe
rtili
ty
rate
10-
14 y
ears
ag
o
Mat
erna
l m
orta
lity
ratio
* 15
-19
3745
48
1811
655
366
54.1
07
1247
.043
14.7
..
20-2
4 27
29
4764
1152
635
965
.206
23
74.0
2718
.1.
.25
-29
3265
68
8316
652
623
99.3
43
5712
.017
15.9
..
30-3
4 24
35
5598
5598
709
116
.503
28
16.0
4116
.3.
.35
-39
2660
64
7664
7691
513
6.6
64
4300
.032
14.8
..
40-4
4 17
44
4424
4424
731
99.8
02
3548
.028
13.6
..
45-4
9 13
91
3417
3417
676
94.9
00
3075
.031
13.9
..
50-5
4 16
83
4122
4122
899
103
.958
39
49.0
2611
.5.
.55
-59
933
2255
2255
623
75.9
86
2224
.034
12.1
..
Res
pond
ent
age
60+
2953
70
9270
9227
4322
51.
000
7092
.032
8.2
..
Tota
l 23
539
4984
873
215
8644
1066
. 36
335
.029
12.3
6.50
457
* M
ICS
Indi
cato
r 3; M
DG
Indi
cato
r 16
T4
6
Tabl
e C
D.1
: Fam
ily s
uppo
rt fo
r lea
rnin
g %
chi
ldre
n ag
ed 0
-59
mon
ths
for w
hom
hou
seho
ld m
embe
rs a
re e
ngag
ed in
act
iviti
es th
at p
rom
ote
lear
ning
and
sch
ool r
eadi
ness
, Sie
rra
Leon
e, 2
005
* M
ICS
indi
cato
r 46
** M
ICS
indi
cato
r 47
Perc
enta
ge o
f chi
ldre
n ag
ed 0
-59
mon
ths
For w
hom
ho
useh
old
mem
bers
en
gage
d in
four
or
mor
e ac
tiviti
es th
at
prom
ote
lear
ning
and
sc
hool
re
adin
ess
*
Mea
n nu
mbe
r of
activ
ities
ho
useh
old
mem
bers
en
gage
in
with
the
child
For w
hom
the
fath
er
enga
ged
in
one
or m
ore
activ
ities
that
pr
omot
e le
arni
ng a
nd
scho
ol
read
ines
s **
Mea
n nu
mbe
r of
act
iviti
es
the
fath
er
enga
ge in
with
th
e ch
ild
Livi
ng in
a
hous
ehol
d w
ithou
t the
ir na
tura
l fat
her
Num
ber o
f ch
ildre
n ag
ed 0
-59
mon
ths
Mal
e 63
.53.
866
.4
1.8
23.6
2605
Sex
Fem
ale
65.9
3.9
62.8
1.
826
.226
39Ea
st
69.9
4.0
75.5
2.
420
.213
00N
orth
63
.83.
865
.4
1.7
23.9
2040
Sout
h 56
.03.
754
.6
1.4
26.7
1444
Reg
ion
Wes
t 81
.54.
361
.8
2.0
37.0
460
Rur
al
62.7
3.8
66.4
1.
821
.341
44Ar
ea
Urb
an
72.4
4.1
57.8
1.
738
.511
010-
23 m
onth
s 50
.73.
462
.2
1.6
23.0
2090
Age
24-5
9 m
onth
s 73
.94.
166
.2
2.0
26.2
3154
Non
e 63
.63.
865
.4
1.8
22.7
4226
Prim
ary
66.0
3.9
65.1
1.
927
.054
1M
othe
r’s e
duca
tion
Seco
ndar
y 72
.84.
256
.6
1.7
42.3
473
Non
e 63
.33.
873
.1
2.0
.027
57P
rimar
y 59
.83.
875
.0
2.2
.045
5Se
cond
ary
+ 74
.14.
178
.2
2.5
.069
9Fa
ther
’s e
duca
tion
Fath
er n
ot in
hou
seho
ld
65.1
3.9
35.4
1.
010
0.0
1306
Poor
est
64.1
3.8
68.2
1.
921
.711
09S
econ
d 64
.63.
866
.1
1.8
20.8
1231
Mid
dle
62.4
3.8
65.0
1.
823
.111
56Fo
urth
62
.83.
862
.4
1.7
27.6
1020
Wea
lth in
dex
quin
tiles
Ric
hest
72
.24.
159
.1
1.8
35.8
729
Chr
istia
n 72
.94.
170
.9
2.2
27.9
996
Rel
igio
n of
H
ouse
hold
Hea
d M
uslim
62
.83.
863
.2
1.7
24.2
4249
Tota
l 64
.73.
864
.6
1.8
24.9
5245
T4
7
Ta
ble
CD
.2: L
earn
ing
mat
eria
ls
Perc
enta
ge o
f chi
ldre
n ag
ed 0
-59
mon
ths
livin
g in
hou
seho
lds
cont
aini
ng le
arni
ng m
ater
ials
, Sie
rra
Leon
e, 2
005
Chi
ld p
lays
with
:
3 or
mor
e no
n-ch
ildre
n’s
book
s *
Med
ian
num
ber
of n
on-
child
ren’
s bo
oks
3 or
mor
e ch
ildre
n’s
book
s **
Med
ian
num
ber
of
child
ren’
s bo
oks
Hou
seho
ld
obje
cts
Obj
ects
an
d m
ater
ials
fo
und
outs
ide
the
hom
e H
omem
ade
toys
Toys
th
at
cam
e fr
om
a st
ore
No
play
thin
gs
men
tione
d
3 or
mor
e ty
pes
of
play
thin
gs
***
Num
ber
of
child
ren
aged
0-
59
mon
ths
Mal
e 28
.3
0.0
10.6
0.0
77.8
72.1
51
.535
.612
.252
.926
05Se
x Fe
mal
e 29
.1
0.0
11.1
0.0
77.4
70.2
48
.938
.812
.950
.926
39Ea
st
16.9
0.
06.
90.
083
.274
.8
59.7
37.2
11.4
63.7
1300
Nor
th
26.9
0.
012
.70.
076
.567
.0
43.1
29.8
14.8
39.9
2040
Sout
h 30
.4
0.0
5.4
0.0
79.1
80.2
57
.037
.711
.460
.614
44R
egio
n
Wes
t 64
.3
7.0
30.6
0.0
61.6
51.1
33
.968
.49.
244
.346
0R
ural
21
.6
0.0
6.6
0.0
79.4
73.5
51
.630
.213
.351
.441
44Ar
ea
Urb
an
55.3
4.
026
.80.
070
.762
.3
45.1
63.7
9.7
53.6
1101
0-23
mon
ths
27.3
0.
010
.10.
061
.552
.1
37.4
30.1
28.4
36.9
2100
Age
24-5
9 m
onth
s 29
.6
0.0
11.3
0.0
88.3
83.9
58
.841
.92.
061
.931
44N
one
24.0
0.
08.
50.
079
.072
.2
50.6
32.5
12.9
50.8
4226
Prim
ary
35.9
0.
014
.10.
075
.671
.2
52.6
49.0
12.0
57.3
541
Mot
her’s
ed
ucat
ion
Seco
ndar
y 62
.2
6.0
27.9
0.0
66.6
61.8
44
.466
.010
.454
.847
3Po
ores
t 17
.1
0.0
3.5
0.0
82.7
78.7
52
.925
.112
.154
.111
09S
econ
d 18
.6
0.0
4.9
0.0
78.7
74.2
51
.628
.213
.851
.612
31M
iddl
e 23
.1
0.0
8.9
0.0
79.3
72.3
51
.931
.912
.752
.311
56Fo
urth
35
.2
0.0
13.9
0.0
77.5
66.7
49
.743
.712
.949
.110
20
Wea
lth
inde
x qu
intil
es
Ric
hest
63
.0
6.0
30.9
0.0
65.2
58.8
42
.170
.210
.352
.172
9C
hris
tian
37.6
0.
015
.80.
077
.776
.6
52.2
43.0
10.7
57.9
995
Mus
lim
26.6
0.
09.
70.
077
.569
.9
49.8
35.9
13.0
50.4
4240
Rel
igio
n of
H
ouse
hold
H
ead
Oth
er/M
issi
ng
(*)
(*)
(*)
(*)
(*)
(*)
(*)
(*)
(*)
(*)
9To
tal
28.7
0.
010
.80.
077
.671
.2
50.2
37.2
12.5
51.9
5245
* M
ICS
indi
cato
r 49
** M
ICS
indi
cato
r 48
***
MIC
S in
dica
tor 5
0 C
ases
of N
on-s
tand
ard
curri
culu
m =
2 a
nd m
issi
ng/D
K =
2 fo
r mot
her’s
edu
catio
n de
lete
d fro
m th
e ta
ble
T4
8
Tabl
e C
D.3
: Chi
ldre
n le
ft al
one
or w
ith o
ther
chi
ldre
n Pe
rcen
tage
of c
hild
ren
age
0-59
mon
ths
left
in th
e ca
re o
f oth
er c
hild
ren
unde
r the
age
of 1
0 ye
ars
or le
ft al
one
in th
e pa
st w
eek,
Sie
rra
Leon
e, 2
005
Left
in th
e ca
re c
hild
ren
unde
r the
age
of
10
year
s in
pa
st w
eek
Left
alon
e in
th
e pa
st w
eek
Left
with
in
adeq
uate
ca
re in
pas
t w
eek
*
Num
ber o
f ch
ildre
n ag
ed
0-59
mon
ths
Mal
e 19
.35.
1 20
.226
05Se
x Fe
mal
e 20
.25.
8 21
.326
39Ea
st
15.8
6.4
17.2
1300
Nor
th
25.0
5.5
25.8
2040
Sout
h 18
.25.
4 19
.314
44R
egio
n
Wes
t 12
.12.
9 12
.746
0R
ural
20
.85.
3 21
.641
44Ar
ea
Urb
an
15.5
6.1
17.5
1101
0-23
14
.03.
5 15
.021
00Ag
e 24
-59
23.5
6.8
24.6
3144
Non
e 20
.15.
4 21
.042
26P
rimar
y 22
.16.
5 23
.554
1M
othe
r's
educ
atio
n Se
cond
ary
14.0
4.5
15.5
473
Poor
est
18.3
4.4
18.6
1109
Sec
ond
22.3
5.6
22.6
1231
Mid
dle
20.7
6.0
22.2
1156
Four
th
20.9
6.0
22.0
1020
Wea
lth in
dex
quin
tiles
Ric
hest
14
.35.
2 16
.672
9C
hris
tian
15.5
4.1
16.8
995
Mus
lim
20.8
5.8
21.7
4240
Rel
igio
n of
H
ouse
hold
H
ead
Mis
sing
(*
)(*
) (*
)9
Tota
l 19
.75.
5 20
.752
45
*
MIC
S in
dica
tor 5
1
Cas
es o
f Non
-sta
ndar
d cu
rricu
lum
= 2
and
mis
sing
/DK
= 2
for m
othe
r’s e
duca
tion
dele
ted
from
the
tabl
e
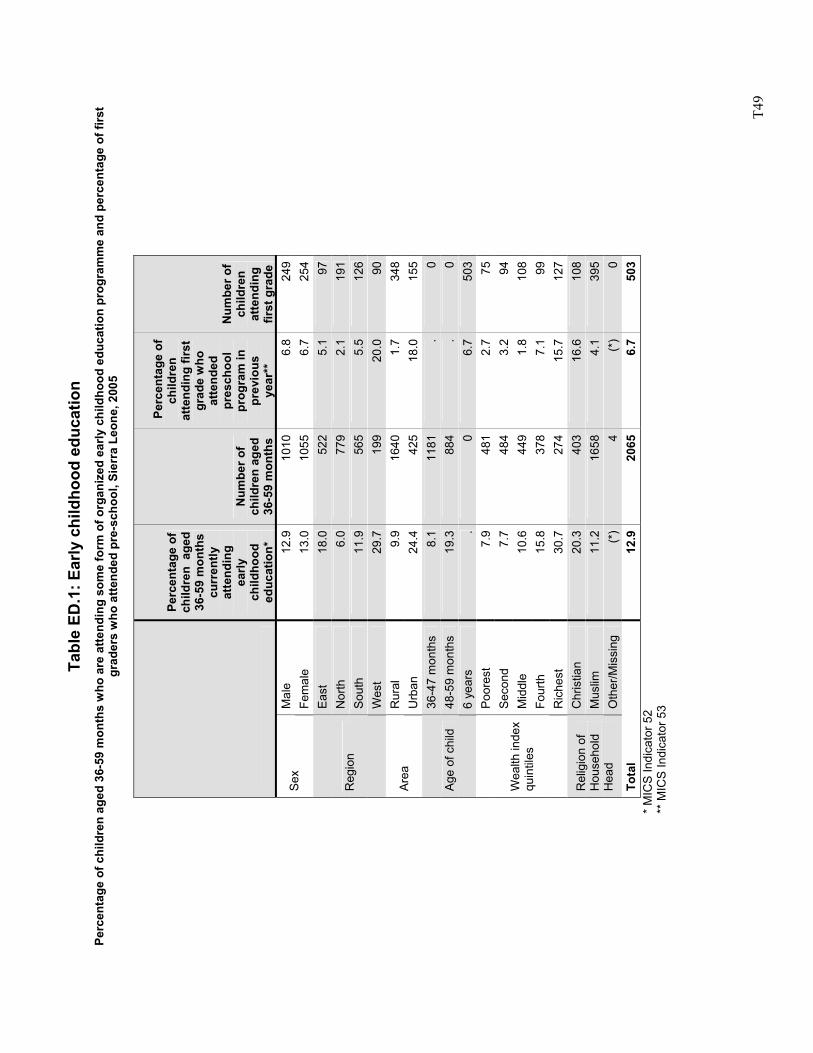
T4
9
Tabl
e ED
.1: E
arly
chi
ldho
od e
duca
tion
Perc
enta
ge o
f chi
ldre
n ag
ed 3
6-59
mon
ths
who
are
atte
ndin
g so
me
form
of o
rgan
ized
ear
ly c
hild
hood
edu
catio
n pr
ogra
mm
e an
d pe
rcen
tage
of f
irst
grad
ers
who
atte
nded
pre
-sch
ool,
Sier
ra L
eone
, 200
5
Perc
enta
ge o
f ch
ildre
n a
ged
36-5
9 m
onth
s cu
rren
tly
atte
ndin
g ea
rly
child
hood
ed
ucat
ion*
Num
ber o
f ch
ildre
n ag
ed
36-5
9 m
onth
s
Per
cent
age
of
child
ren
atte
ndin
g fir
st
grad
e w
ho
atte
nded
pr
esch
ool
prog
ram
in
prev
ious
ye
ar**
Num
ber o
f ch
ildre
n at
tend
ing
first
gra
de
Mal
e 12
.910
10
6.8
249
Sex
Fem
ale
13.0
1055
6.
725
4Ea
st
18.0
522
5.1
97N
orth
6.
077
9 2.
119
1So
uth
11.9
565
5.5
126
Reg
ion
Wes
t 29
.719
9 20
.090
Rur
al
9.9
1640
1.
734
8Ar
ea
Urb
an
24.4
425
18.0
155
36-4
7 m
onth
s 8.
111
81
.0
48-5
9 m
onth
s 19
.388
4 .
0A
ge o
f chi
ld
6 ye
ars
.0
6.7
503
Poor
est
7.9
481
2.7
75S
econ
d 7.
748
4 3.
294
Mid
dle
10.6
449
1.8
108
Four
th
15.8
378
7.1
99
Wea
lth in
dex
quin
tiles
Ric
hest
30
.727
4 15
.712
7C
hris
tian
20.3
403
16.6
108
Mus
lim
11.2
1658
4.
139
5R
elig
ion
of
Hou
seho
ld
Hea
d O
ther
/Mis
sing
(*
)4
(*)
0To
tal
12.9
2065
6.
750
3
* M
ICS
Indi
cato
r 52
**
MIC
S In
dica
tor 5
3
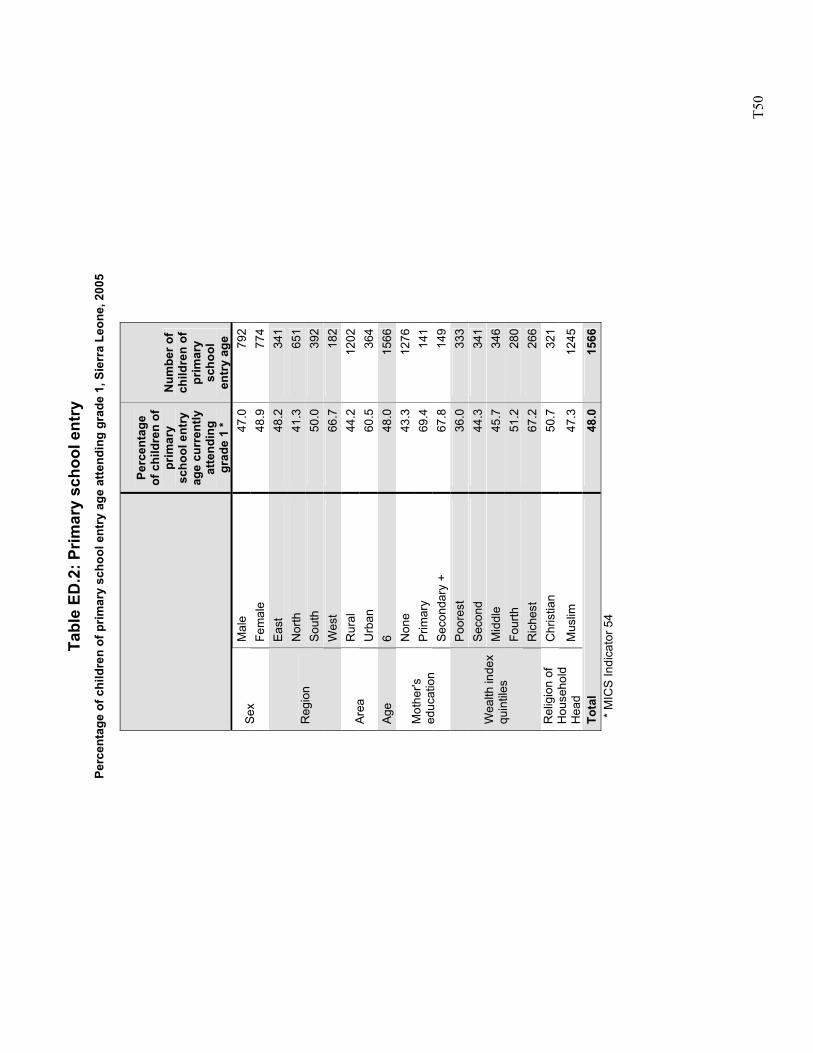
T5
0
Tabl
e ED
.2: P
rimar
y sc
hool
ent
ry
Perc
enta
ge o
f chi
ldre
n of
prim
ary
scho
ol e
ntry
age
atte
ndin
g gr
ade
1, S
ierr
a Le
one,
200
5
Perc
enta
ge
of c
hild
ren
of
prim
ary
scho
ol e
ntry
ag
e cu
rren
tly
atte
ndin
g gr
ade
1 *
Num
ber o
f ch
ildre
n of
pr
imar
y sc
hool
en
try
age
Mal
e 47
.0
792
Sex
Fem
ale
48.9
77
4Ea
st
48.2
34
1N
orth
41
.3
651
Sout
h 50
.0
392
Reg
ion
Wes
t 66
.7
182
Rur
al
44.2
12
02Ar
ea
Urb
an
60.5
36
4Ag
e 6
48.0
15
66N
one
43.3
12
76P
rimar
y 69
.4
141
Mot
her's
ed
ucat
ion
Seco
ndar
y +
67.8
14
9Po
ores
t 36
.0
333
Sec
ond
44.3
34
1M
iddl
e 45
.7
346
Four
th
51.2
28
0
Wea
lth in
dex
quin
tiles
Ric
hest
67
.2
266
Chr
istia
n 50
.7
321
Rel
igio
n of
H
ouse
hold
H
ead
Mus
lim
47.3
12
45
Tota
l 48
.0
1566
*
MIC
S In
dica
tor 5
4
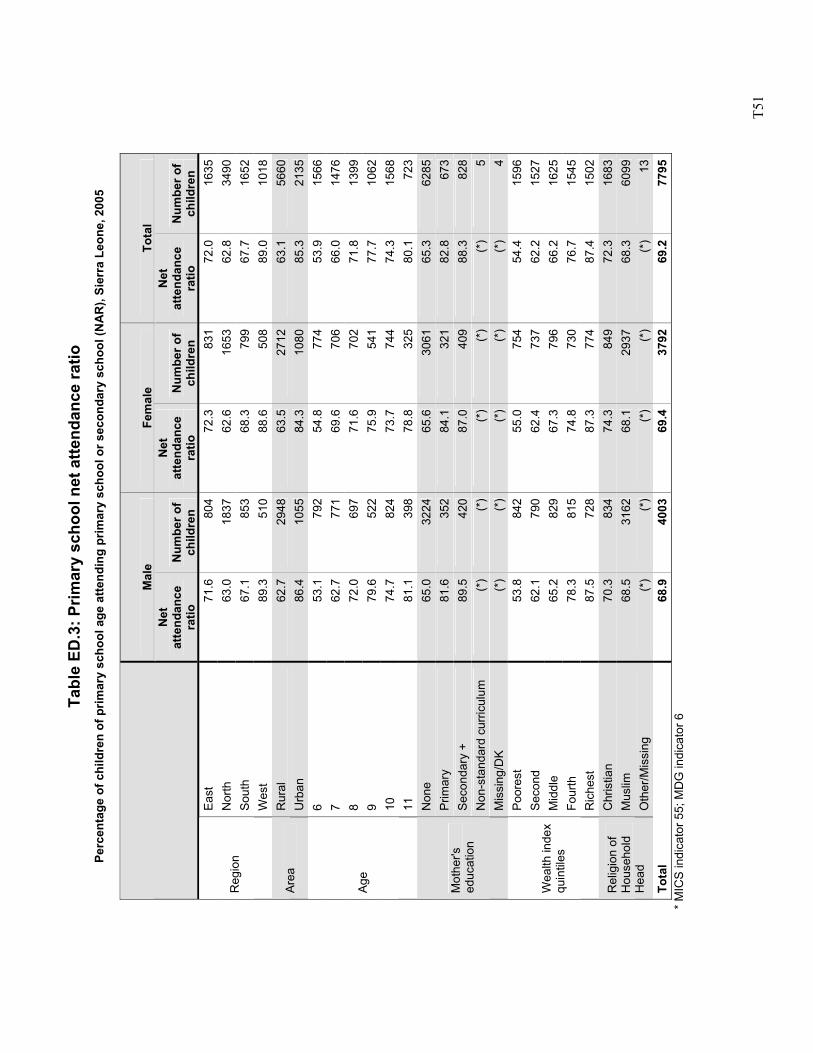
T5
1
Tabl
e ED
.3: P
rimar
y sc
hool
net
atte
ndan
ce ra
tio
Perc
enta
ge o
f chi
ldre
n of
prim
ary
scho
ol a
ge a
ttend
ing
prim
ary
scho
ol o
r sec
onda
ry s
choo
l (N
AR
), Si
erra
Leo
ne, 2
005
Mal
e Fe
mal
e To
tal
Net
at
tend
ance
ra
tio
Num
ber o
f ch
ildre
n
Net
at
tend
ance
ra
tio
Num
ber o
f ch
ildre
n
Net
at
tend
ance
ra
tio
Num
ber o
f ch
ildre
n Ea
st
71.6
804
72.3
83
172
.016
35N
orth
63
.018
3762
.6
1653
62.8
3490
Sout
h 67
.185
368
.3
799
67.7
1652
Reg
ion
Wes
t 89
.351
088
.6
508
89.0
1018
Rur
al
62.7
2948
63.5
27
1263
.156
60Ar
ea
Urb
an
86.4
1055
84.3
10
8085
.321
356
53.1
792
54.8
77
453
.915
667
62.7
771
69.6
70
666
.014
768
72.0
697
71.6
70
271
.813
999
79.6
522
75.9
54
177
.710
6210
74
.782
473
.7
744
74.3
1568
Age
11
81.1
398
78.8
32
580
.172
3N
one
65.0
3224
65.6
30
6165
.362
85P
rimar
y 81
.635
284
.1
321
82.8
673
Seco
ndar
y +
89.5
420
87.0
40
988
.382
8N
on-s
tand
ard
curri
culu
m
(*)
(*)
(*)
(*)
(*)
5
Mot
her's
ed
ucat
ion
Mis
sing
/DK
(*)
(*)
(*)
(*)
(*)
4Po
ores
t 53
.884
255
.0
754
54.4
1596
Sec
ond
62.1
790
62.4
73
762
.215
27M
iddl
e 65
.282
967
.3
796
66.2
1625
Four
th
78.3
815
74.8
73
076
.715
45
Wea
lth in
dex
quin
tiles
Ric
hest
87
.572
887
.3
774
87.4
1502
Chr
istia
n 70
.383
474
.3
849
72.3
1683
Mus
lim
68.5
3162
68.1
29
3768
.360
99R
elig
ion
of
Hou
seho
ld
Hea
d O
ther
/Mis
sing
(*
)(*
)(*
) (*
)(*
)13
Tota
l 68
.940
0369
.4
3792
69.2
7795
*
MIC
S in
dica
tor 5
5; M
DG
indi
cato
r 6

T5
2
Tabl
e ED
.4: S
econ
dary
sch
ool n
et a
ttend
ance
ratio
Pe
rcen
tage
of c
hild
ren
of s
econ
dary
sch
ool a
ge a
ttend
ing
seco
ndar
y or
hig
her s
choo
l (N
AR
), Si
erra
Leo
ne, 2
005
Mal
e Fe
mal
e To
tal
Net
at
tend
ance
ra
tio
Num
ber o
f ch
ildre
n
Net
at
tend
ance
ra
tio
Num
ber o
f ch
ildre
n
Net
at
tend
ance
ra
tio
Num
ber o
f ch
ildre
n Ea
st
17.2
613
11.0
53
214
.311
45N
orth
12
.812
498.
2 11
4410
.623
93So
uth
14.6
609
9.2
485
12.2
1094
Reg
ion
Wes
t 56
.949
951
.2
480
54.1
978
Rur
al
9.0
1927
5.1
1652
7.2
3578
Area
U
rban
44
.410
4436
.3
988
40.5
2032
12
10.5
628
9.7
585
10.1
1212
13
14.3
448
14.7
46
314
.591
114
27
.544
421
.4
683
23.8
1126
15
20.1
746
13.0
44
717
.511
9316
29
.635
926
.2
252
28.2
611
Age
17
37.2
346
22.9
21
031
.855
6N
one
14.9
1844
11.9
16
8613
.535
30P
rimar
y 19
.820
217
.2
186
18.5
388
Seco
ndar
y +
50.4
301
42.4
33
046
.263
1N
on-s
tand
ard
curri
culu
m
(*)
(*)
(*)
(*)
(*)
3M
othe
r not
in h
ouse
hold
27
.561
816
.0
437
22.8
1055
Mot
her's
ed
ucat
ion
Mis
sing
/DK
(*)
(*)
(*)
(*)
(*)
3Po
ores
t 6.
352
32.
4 46
14.
598
5S
econ
d 7.
550
93.
5 42
45.
793
4M
iddl
e 9.
951
75.
1 45
17.
796
8Fo
urth
23
.867
316
.7
583
20.5
1256
Wea
lth in
dex
quin
tiles
Ric
hest
47
.474
841
.2
720
44.4
1467
Chr
istia
n 29
.065
919
.2
619
24.2
1278
Mus
lim
19.3
2305
16.1
20
1817
.843
23R
elig
ion
of
Hou
seho
ld
Hea
d O
ther
/Mis
sing
(*
)(*
)(*
) (*
)(*
)9
Tota
l 21
.429
7016
.8
2640
19.3
5610
* M
ICS
indi
cato
r 56
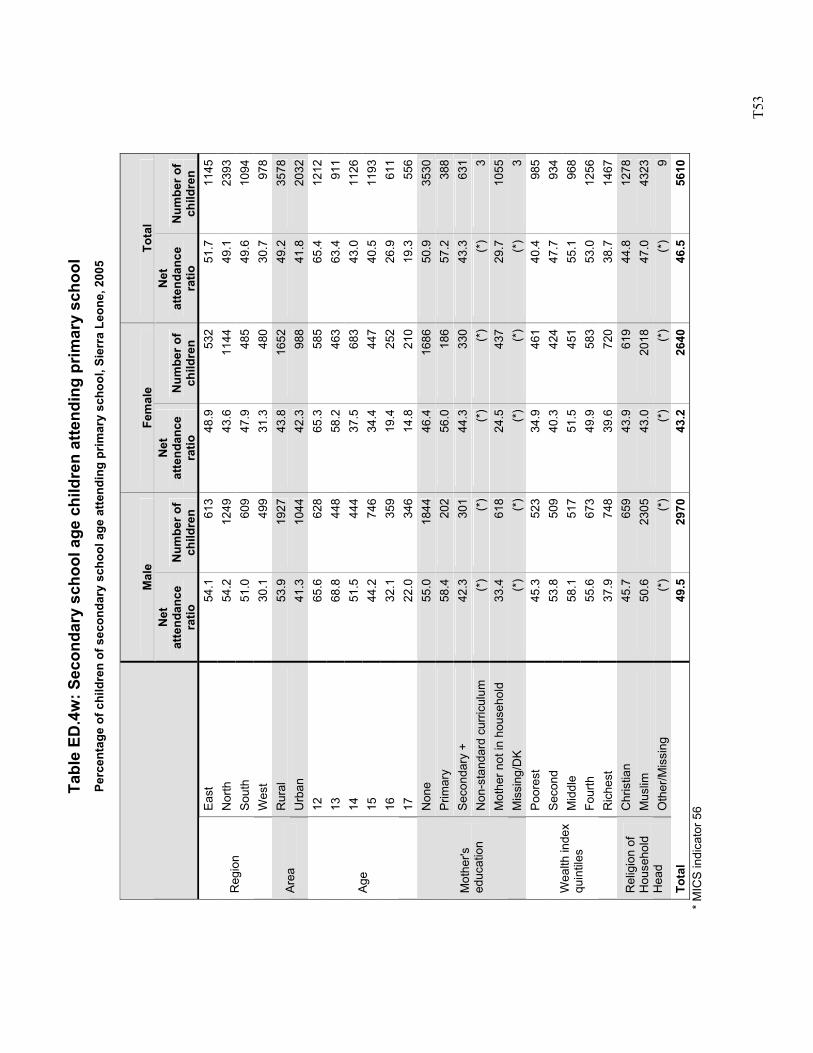
T5
3
Tabl
e ED
.4w
: Sec
onda
ry s
choo
l age
chi
ldre
n at
tend
ing
prim
ary
scho
ol
Perc
enta
ge o
f chi
ldre
n of
sec
onda
ry s
choo
l age
atte
ndin
g pr
imar
y sc
hool
, Sie
rra
Leon
e, 2
005
Mal
e Fe
mal
e To
tal
Net
at
tend
ance
ra
tio
Num
ber o
f ch
ildre
n
Net
at
tend
ance
ra
tio
Num
ber o
f ch
ildre
n
Net
at
tend
ance
ra
tio
Num
ber o
f ch
ildre
n Ea
st
54.1
613
48.9
53
251
.711
45N
orth
54
.212
4943
.6
1144
49.1
2393
Sout
h 51
.060
947
.9
485
49.6
1094
Reg
ion
Wes
t 30
.149
931
.3
480
30.7
978
Rur
al
53.9
1927
43.8
16
5249
.235
78Ar
ea
Urb
an
41.3
1044
42.3
98
841
.820
3212
65
.662
865
.3
585
65.4
1212
13
68.8
448
58.2
46
363
.491
114
51
.544
437
.5
683
43.0
1126
15
44.2
746
34.4
44
740
.511
9316
32
.135
919
.4
252
26.9
611
Age
17
22.0
346
14.8
21
019
.355
6N
one
55.0
1844
46.4
16
8650
.935
30P
rimar
y 58
.420
256
.0
186
57.2
388
Seco
ndar
y +
42.3
301
44.3
33
043
.363
1N
on-s
tand
ard
curri
culu
m
(*)
(*)
(*)
(*)
(*)
3M
othe
r not
in h
ouse
hold
33
.461
824
.5
437
29.7
1055
Mot
her's
ed
ucat
ion
Mis
sing
/DK
(*)
(*)
(*)
(*)
(*)
3Po
ores
t 45
.352
334
.9
461
40.4
985
Sec
ond
53.8
509
40.3
42
447
.793
4M
iddl
e 58
.151
751
.5
451
55.1
968
Four
th
55.6
673
49.9
58
353
.012
56
Wea
lth in
dex
quin
tiles
Ric
hest
37
.974
839
.6
720
38.7
1467
Chr
istia
n 45
.765
943
.9
619
44.8
1278
Mus
lim
50.6
2305
43.0
20
1847
.043
23R
elig
ion
of
Hou
seho
ld
Hea
d O
ther
/Mis
sing
(*
)(*
)(*
) (*
)(*
)9
Tota
l 49
.529
7043
.2
2640
46.5
5610
*
MIC
S in
dica
tor 5
6
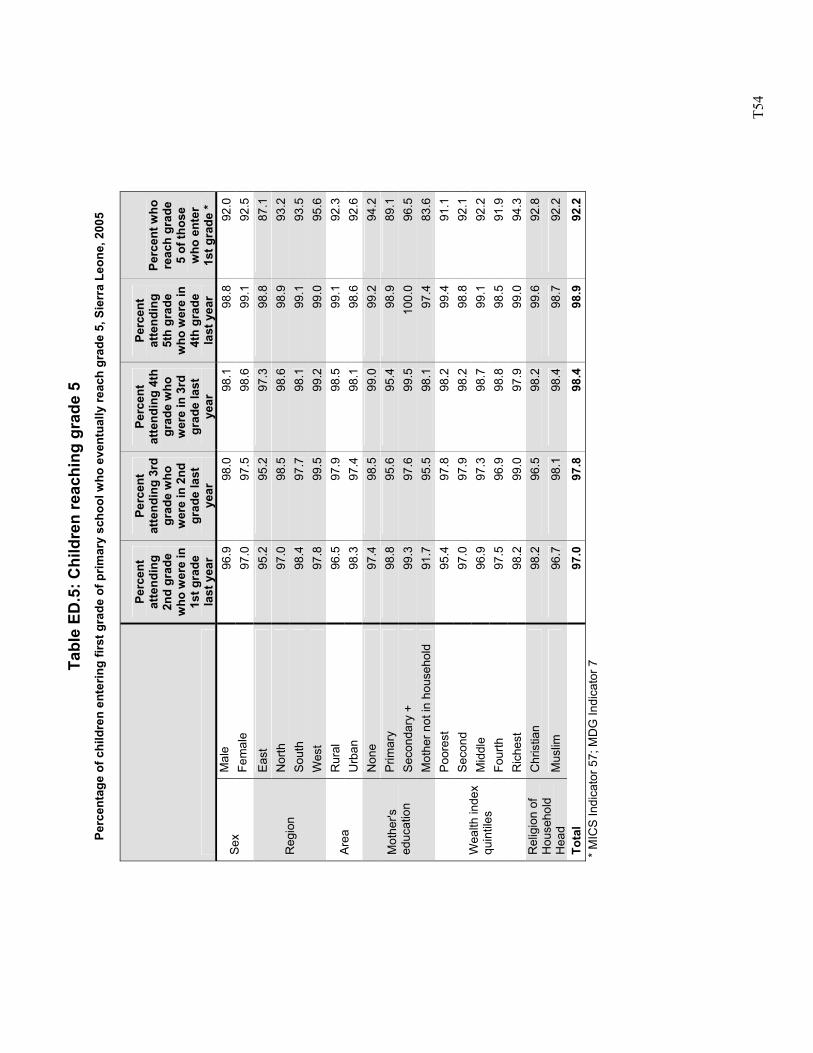
T5
4
Tabl
e ED
.5: C
hild
ren
reac
hing
gra
de 5
Pe
rcen
tage
of c
hild
ren
ente
ring
first
gra
de o
f prim
ary
scho
ol w
ho e
vent
ually
reac
h gr
ade
5, S
ierr
a Le
one,
200
5
Perc
ent
atte
ndin
g 2n
d gr
ade
who
wer
e in
1s
t gra
de
last
yea
r
Perc
ent
atte
ndin
g 3r
d gr
ade
who
w
ere
in 2
nd
grad
e la
st
year
Perc
ent
atte
ndin
g 4t
h gr
ade
who
w
ere
in 3
rd
grad
e la
st
year
Perc
ent
atte
ndin
g 5t
h gr
ade
who
wer
e in
4t
h gr
ade
last
yea
r
Perc
ent w
ho
reac
h gr
ade
5 of
thos
e w
ho e
nter
1s
t gra
de *
Mal
e 96
.998
.098
.198
.892
.0Se
x Fe
mal
e 97
.097
.598
.699
.192
.5Ea
st
95.2
95.2
97.3
98.8
87.1
Nor
th
97.0
98.5
98.6
98.9
93.2
Sout
h 98
.497
.798
.199
.193
.5R
egio
n
Wes
t 97
.899
.599
.299
.095
.6R
ural
96
.597
.998
.599
.192
.3Ar
ea
Urb
an
98.3
97.4
98.1
98.6
92.6
Non
e 97
.498
.599
.099
.294
.2P
rimar
y 98
.895
.695
.498
.989
.1Se
cond
ary
+ 99
.397
.699
.510
0.0
96.5
Mot
her's
ed
ucat
ion
Mot
her n
ot in
hou
seho
ld
91.7
95.5
98.1
97.4
83.6
Poor
est
95.4
97.8
98.2
99.4
91.1
Sec
ond
97.0
97.9
98.2
98.8
92.1
Mid
dle
96.9
97.3
98.7
99.1
92.2
Four
th
97.5
96.9
98.8
98.5
91.9
Wea
lth in
dex
quin
tiles
Ric
hest
98
.299
.097
.999
.094
.3C
hris
tian
98.2
96.5
98.2
99.6
92.8
Rel
igio
n of
H
ouse
hold
H
ead
Mus
lim
96.7
98.1
98.4
98.7
92.2
Tota
l 97
.097
.898
.498
.992
.2
*
MIC
S In
dica
tor 5
7; M
DG
Indi
cato
r 7
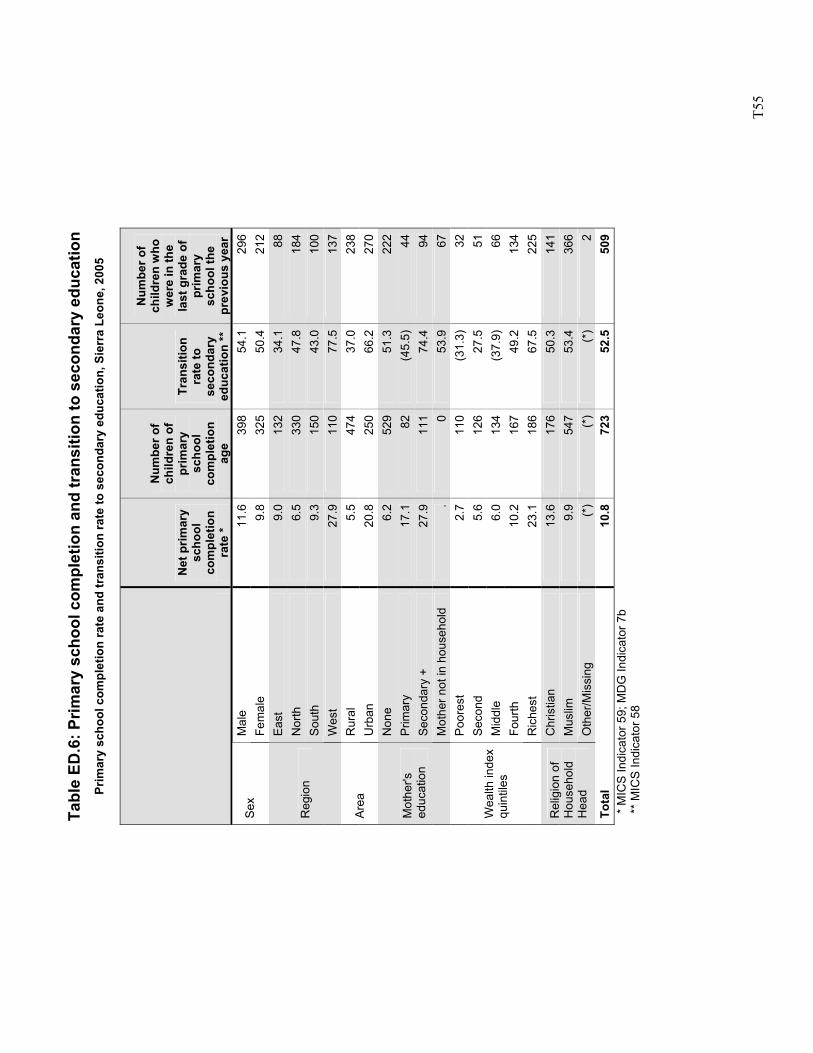
T5
5
Tabl
e ED
.6: P
rimar
y sc
hool
com
plet
ion
and
tran
sitio
n to
sec
onda
ry e
duca
tion
Prim
ary
scho
ol c
ompl
etio
n ra
te a
nd tr
ansi
tion
rate
to s
econ
dary
edu
catio
n, S
ierr
a Le
one,
200
5
Net
prim
ary
scho
ol
com
plet
ion
rate
*
Num
ber o
f ch
ildre
n of
pr
imar
y sc
hool
co
mpl
etio
n ag
e
Tran
sitio
n ra
te to
se
cond
ary
educ
atio
n **
Num
ber o
f ch
ildre
n w
ho
wer
e in
the
last
gra
de o
f pr
imar
y sc
hool
the
prev
ious
yea
r M
ale
11.6
398
54.1
296
Sex
Fem
ale
9.8
325
50.4
212
East
9.
013
2 34
.188
Nor
th
6.5
330
47.8
184
Sout
h 9.
315
0 43
.010
0R
egio
n
Wes
t 27
.911
0 77
.513
7R
ural
5.
547
4 37
.023
8Ar
ea
Urb
an
20.8
250
66.2
270
Non
e 6.
252
9 51
.322
2P
rimar
y 17
.182
(4
5.5)
44Se
cond
ary
+ 27
.911
1 74
.494
Mot
her's
ed
ucat
ion
Mot
her n
ot in
hou
seho
ld
.0
53.9
67Po
ores
t 2.
711
0 (3
1.3)
32S
econ
d 5.
612
6 27
.551
Mid
dle
6.0
134
(37.
9)66
Four
th
10.2
167
49.2
134
Wea
lth in
dex
quin
tiles
Ric
hest
23
.118
6 67
.522
5C
hris
tian
13.6
176
50.3
141
Mus
lim
9.9
547
53.4
366
Rel
igio
n of
H
ouse
hold
H
ead
Oth
er/M
issi
ng
(*)
(*)
(*)
2To
tal
10.8
723
52.5
509
*
MIC
S In
dica
tor 5
9; M
DG
Indi
cato
r 7b
**
MIC
S In
dica
tor 5
8
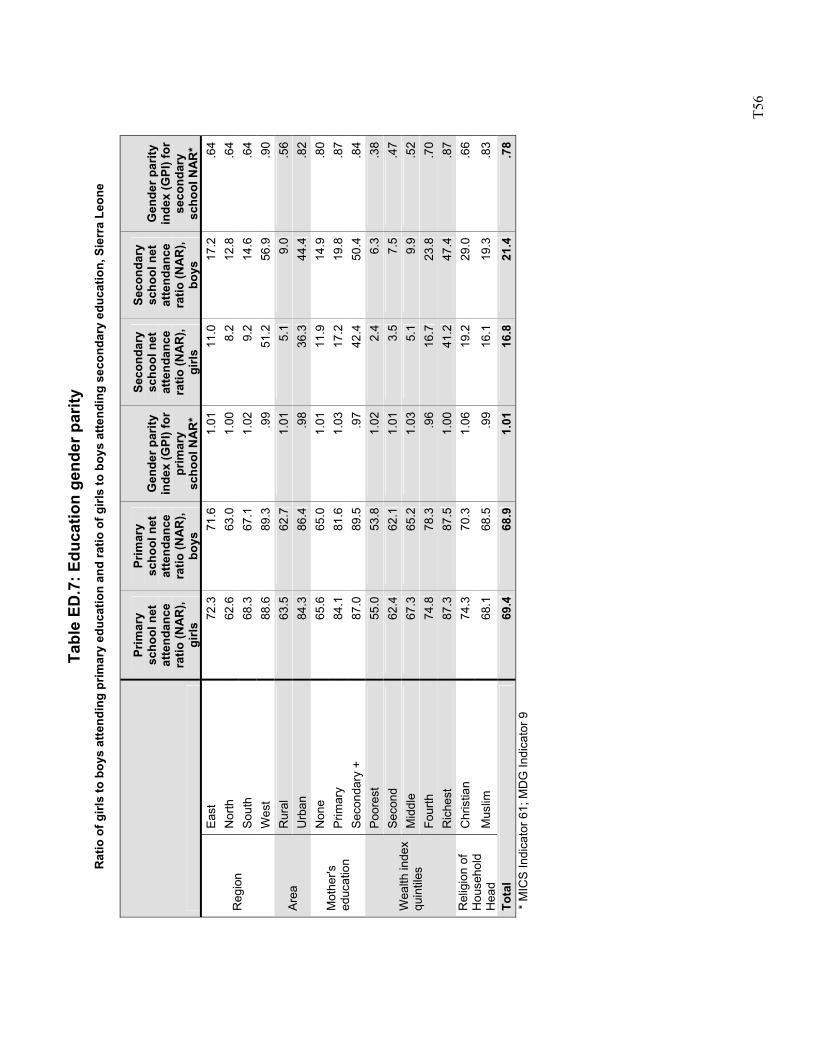
T5
6
Tabl
e ED
.7: E
duca
tion
gend
er p
arity
R
atio
of g
irls
to b
oys
atte
ndin
g pr
imar
y ed
ucat
ion
and
ratio
of g
irls
to b
oys
atte
ndin
g se
cond
ary
educ
atio
n, S
ierr
a Le
one
Prim
ary
scho
ol n
et
atte
ndan
ce
ratio
(NA
R),
girls
Prim
ary
scho
ol n
et
atte
ndan
ce
ratio
(NA
R),
boys
Gen
der p
arity
in
dex
(GPI
) for
pr
imar
y sc
hool
NA
R*
Seco
ndar
y sc
hool
net
at
tend
ance
ra
tio (N
AR
), gi
rls
Seco
ndar
y sc
hool
net
at
tend
ance
ra
tio (N
AR
), bo
ys
Gen
der p
arity
in
dex
(GPI
) for
se
cond
ary
scho
ol N
AR
* Ea
st
72.3
71.6
1.01
11
.017
.2.6
4N
orth
62
.663
.01.
00
8.2
12.8
.64
Sout
h 68
.367
.11.
02
9.2
14.6
.64
Reg
ion
Wes
t 88
.689
.3.9
9 51
.256
.9.9
0R
ural
63
.562
.71.
01
5.1
9.0
.56
Area
U
rban
84
.386
.4.9
8 36
.344
.4.8
2N
one
65.6
65.0
1.01
11
.914
.9.8
0P
rimar
y 84
.181
.61.
03
17.2
19.8
.87
Mot
her's
ed
ucat
ion
Seco
ndar
y +
87.0
89.5
.97
42.4
50.4
.84
Poor
est
55.0
53.8
1.02
2.
46.
3.3
8S
econ
d 62
.462
.11.
01
3.5
7.5
.47
Mid
dle
67.3
65.2
1.03
5.
19.
9.5
2Fo
urth
74
.878
.3.9
6 16
.723
.8.7
0
Wea
lth in
dex
quin
tiles
Ric
hest
87
.387
.51.
00
41.2
47.4
.87
Chr
istia
n 74
.370
.31.
06
19.2
29.0
.66
Rel
igio
n of
H
ouse
hold
H
ead
Mus
lim
68.1
68.5
.99
16.1
19.3
.83
Tota
l 69
.468
.91.
01
16.8
21.4
.78
*
MIC
S In
dica
tor 6
1; M
DG
Indi
cato
r 9
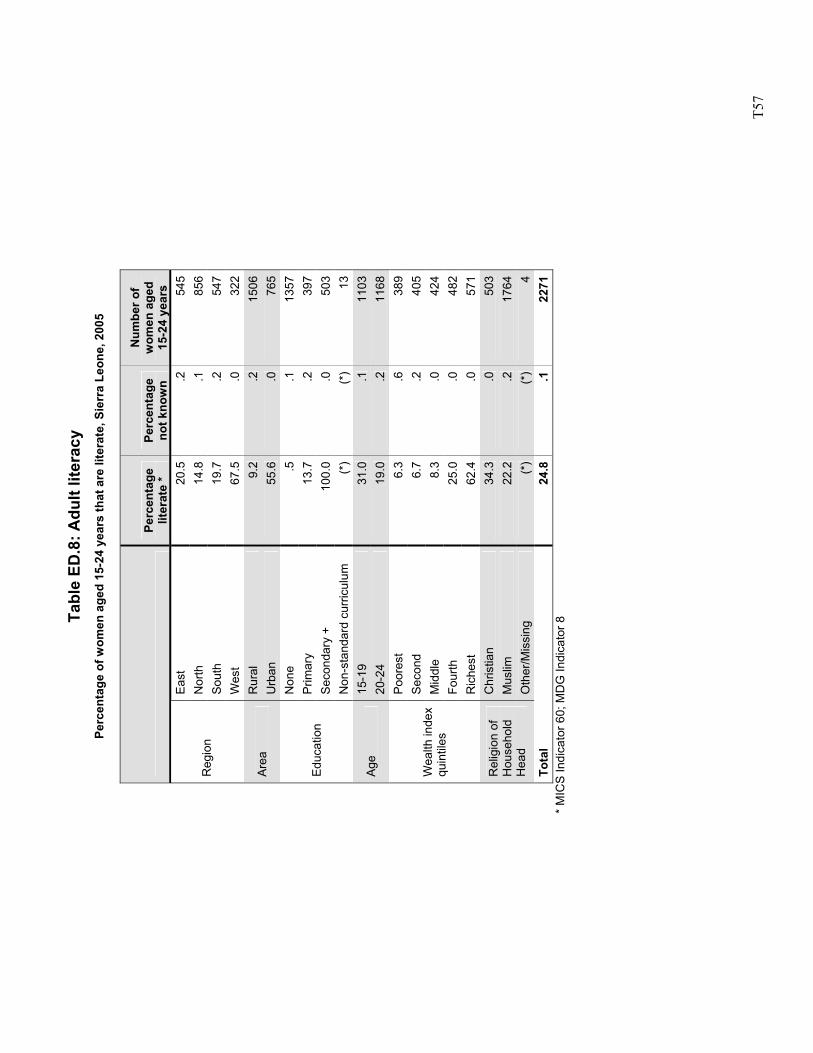
T5
7
Tabl
e ED
.8: A
dult
liter
acy
Perc
enta
ge o
f wom
en a
ged
15-2
4 ye
ars
that
are
lite
rate
, Sie
rra
Leon
e, 2
005
Pe
rcen
tage
lit
erat
e *
Perc
enta
ge
not k
now
n
Num
ber o
f w
omen
age
d 15
-24
year
s Ea
st
20.5
.254
5N
orth
14
.8.1
856
Sout
h 19
.7.2
547
Reg
ion
Wes
t 67
.5.0
322
Rur
al
9.2
.215
06Ar
ea
Urb
an
55.6
.076
5N
one
.5.1
1357
Prim
ary
13.7
.239
7Se
cond
ary
+ 10
0.0
.050
3Ed
ucat
ion
Non
-sta
ndar
d cu
rricu
lum
(*
)(*
)13
15-1
9 31
.0.1
1103
Age
20-2
4 19
.0.2
1168
Poor
est
6.3
.638
9S
econ
d 6.
7.2
405
Mid
dle
8.3
.042
4Fo
urth
25
.0.0
482
Wea
lth in
dex
quin
tiles
Ric
hest
62
.4.0
571
Chr
istia
n 34
.3.0
503
Mus
lim
22.2
.217
64R
elig
ion
of
Hou
seho
ld
Hea
d O
ther
/Mis
sing
(*
)(*
)4
Tota
l 24
.8.1
2271
*
MIC
S In
dica
tor 6
0; M
DG
Indi
cato
r 8
T5
8
Tabl
e C
P.1:
Birt
h re
gist
ratio
n Pe
rcen
t dis
trib
utio
n of
chi
ldre
n ag
ed 0
-59
mon
ths
by w
heth
er b
irth
is re
gist
ered
and
reas
ons
for n
on-r
egis
trat
ion,
Sie
rra
Leon
e, 2
005
Birt
h is
not
regi
ster
ed b
ecau
se:
Birt
h is
re
gist
ered
*
Don
't kn
ow if
bi
rth
is
regi
ster
ed
Num
ber
of
child
ren
aged
0-
59
mon
ths
Cos
ts
too
muc
h
Mus
t tr
avel
to
o fa
r
Did
n't
know
ch
ild
shou
ld b
e re
gist
ered
Late
, di
dn't
wan
t to
pa
y fin
e
Doe
sn't
know
w
here
to
re
gist
er
Oth
er
Don
't kn
ow
Mis
sing
Num
ber o
f ch
ildre
n ag
ed 0
-59
mon
ths
with
out
birt
h re
gist
ratio
n
Mal
e 47
.61.
326
0521
.413
.532
.6
3.1
20.1
7.8
1.6
.113
31Se
x Fe
mal
e 48
.01.
626
3920
.016
.032
.8
3.3
19.7
6.6
1.5
.013
29Ea
st
44.6
1.3
1300
28.6
15.2
20.2
4.
417
.711
.91.
9.0
704
Nor
th
28.6
1.6
2040
15.1
14.9
40.7
1.
123
.23.
31.
6.0
1424
Sout
h 71
.81.
414
4423
.116
.134
.9
7.0
13.1
5.3
.3.3
387
Reg
ion
Wes
t 67
.31.
446
030
.46.
88.
7 8.
116
.226
.73.
1.0
144
Rur
al
44.2
1.4
4144
19.4
15.5
34.2
3.
020
.56.
01.
4.0
2253
Area
U
rban
61
.51.
511
0127
.710
.324
.8
4.3
16.7
13.9
2.3
.040
70-
11 m
onth
s 44
.41.
010
1619
.014
.432
.0
3.1
18.6
10.4
2.5
.055
512
-23
mon
ths
49.8
.510
7420
.913
.735
.6
3.1
19.1
5.8
1.8
.053
424
-35
mon
ths
49.9
1.7
1069
20.0
14.3
33.7
2.
621
.27.
11.
2.0
518
36-4
7 m
onth
s 48
.42.
211
8124
.913
.431
.3
3.8
19.5
6.2
.7.2
583
Age
48-5
9 m
onth
s 46
.31.
888
418
.218
.830
.1
3.4
21.6
6.4
1.5
.045
9N
one
44.9
1.5
4226
20.0
15.0
33.6
3.
120
.76.
01.
5.0
2266
Prim
ary
53.0
1.5
541
27.7
12.4
33.0
2.
415
.19.
0.4
.024
6M
othe
r's
educ
atio
n Se
cond
ary
68.4
.647
319
.614
.017
.7
5.8
15.8
22.7
4.4
.014
7Po
ores
t 45
.61.
311
0918
.916
.035
.1
3.3
18.4
6.7
1.7
.058
8S
econ
d 45
.31.
912
3123
.116
.831
.3
2.2
19.3
5.9
1.4
.065
0M
iddl
e 44
.31.
311
5616
.513
.638
.2
3.1
22.6
5.7
.3.2
629
Four
th
46.4
1.5
1020
21.4
15.5
32.3
3.
520
.64.
81.
9.0
531
Wea
lth
inde
x qu
intil
es
Ric
hest
63
.11.
072
927
.48.
018
.5
5.3
17.1
20.0
3.7
.026
2C
hris
tian
59.6
.899
530
.022
.813
.8
5.3
16.2
10.8
1.0
.039
4R
elig
ion
of
Hou
seho
ld
Hea
d M
uslim
45
.11.
642
4019
.113
.335
.9
2.9
20.5
6.6
1.6
.022
66
Tota
l 47
.81.
452
4520
.714
.732
.7
3.2
19.9
7.2
1.5
.026
60*
MIC
S In
dica
tor 6
2
T5
9
Tabl
e C
P.2:
Chi
ld la
bour
Pe
rcen
tage
of c
hild
ren
aged
5-1
4 ye
ars
who
are
invo
lved
in c
hild
labo
ur a
ctiv
ities
by
type
of w
ork,
Sie
rra
Leon
e, 2
005
W
orki
ng o
utsi
de h
ouse
hold
Pa
id w
ork
Unp
aid
wor
k
Hou
seho
ld
chor
es fo
r 28+
ho
urs/
wee
k
Wor
king
for
fam
ily
busi
ness
To
tal c
hild
la
bour
*
Num
ber o
f ch
ildre
n ag
ed 5
-14
yea
rs
Mal
e 2.
416
.11.
641
.048
.864
07Se
x Fe
mal
e 2.
414
.92.
040
.347
.763
69Ea
st
1.6
14.7
.836
.142
.326
44N
orth
4.
39.
22.
553
.356
.856
91So
uth
.726
.71.
139
.349
.626
46R
egio
n
Wes
t .3
20.3
1.9
9.1
27.7
1795
Rur
al
2.8
15.7
2.0
51.4
56.7
9054
Area
U
rban
1.
415
.11.
214
.427
.737
225-
11 y
ears
2.
720
.01.
347
.656
.495
26Ag
e 12
-14
year
s 1.
52.
33.
220
.224
.432
50Ye
s 2.
016
.31.
436
.745
.386
58Sc
hool
par
ticip
atio
n N
o 3.
213
.82.
848
.954
.541
18N
one
2.7
14.6
2.0
45.6
51.8
1012
6P
rimar
y 2.
022
.21.
035
.146
.311
47Se
cond
ary
+ .5
16.1
1.3
11.0
25.0
1486
Non
-sta
ndar
d cu
rricu
lum
(*
)(*
)(*
)(*
)(*
)9
Mot
her's
edu
catio
n
Mis
sing
/DK
(*)
(*)
(*)
(*)
(*)
8Po
ores
t 3.
712
.13.
055
.358
.925
33S
econ
d 2.
515
.21.
451
.756
.924
50M
iddl
e 2.
417
.92.
250
.756
.925
55Fo
urth
2.
515
.9.8
35.1
43.8
2616
Wea
lth in
dex
quin
tiles
Ric
hest
1.
016
.41.
611
.825
.926
22C
hris
tian
4.5
13.2
2.3
36.3
43.5
2761
Mus
lim
1.8
16.1
1.7
41.8
49.6
9991
Rel
igio
n of
Hou
seho
ld
Hea
d O
ther
/Mis
sing
(*
)(*
)(*
)(*
)(*
)23
Tota
l 2.
415
.51.
840
.648
.312
776
* M
ICS
Indi
cato
r 71

T6
0
Tabl
e C
P.3:
Lab
oure
r stu
dent
s an
d st
uden
t lab
oure
rs
Perc
enta
ge o
f chi
ldre
n ag
ed 5
-14
year
s w
ho a
re L
abou
rer s
tude
nts
and
stud
ent l
abou
rers
, Sie
rra
Leon
e, 2
005
Perc
enta
ge o
f ch
ildre
n in
ch
ild la
bour
*
Perc
enta
ge o
f ch
ildre
n at
tend
ing
scho
ol **
*
Num
ber o
f ch
ildre
n ag
ed 5
-14
Perc
enta
ge o
f ch
ild
labo
urer
s w
ho a
re a
lso
atte
ndin
g sc
hool
**
Num
ber o
f ch
ild
labo
urer
s ag
ed 5
-14
Perc
enta
ge o
f st
uden
ts w
ho
are
also
in
volv
ed in
ch
ild la
bour
**
**
Num
ber o
f st
uden
ts
aged
5-1
4 M
ale
48.8
68.7
6407
63.8
3126
45.3
4400
Sex
Fem
ale
47.7
66.9
6369
63.4
3039
45.2
4258
East
42
.368
.626
4467
.111
2041
.418
14N
orth
56
.860
.856
9158
.432
3454
.534
62So
uth
49.6
66.4
2646
64.4
1314
48.2
1756
Reg
ion
Wes
t 27
.790
.617
9587
.649
826
.816
26R
ural
56
.760
.290
5459
.351
3455
.854
51Ar
ea
Urb
an
27.7
86.2
3722
84.9
1031
27.3
3207
5-11
yea
rs
56.4
65.8
9526
64.2
5372
55.0
6269
Age
12-1
4 ye
ars
24.4
73.5
3250
59.7
793
19.8
2389
Non
e 51
.863
.410
126
60.5
5250
49.5
6417
Prim
ary
46.3
78.3
1147
78.5
531
46.4
898
Seco
ndar
y +
25.0
89.9
1486
87.4
372
24.3
1336
Non
-sta
ndar
d cu
rricu
lum
(*
)(*
)(*
)(*
)(*
)(*
)3
Mot
her's
ed
ucat
ion
Mis
sing
/DK
(*)
(*)
(*)
(*)
(*)
(*)
4Po
ores
t 58
.950
.725
3350
.014
9258
.012
85S
econ
d 56
.958
.224
5057
.613
9456
.314
26M
iddl
e 56
.964
.425
5563
.914
5456
.516
44Fo
urth
43
.875
.326
1674
.111
4543
.019
71
Wea
lth in
dex
quin
tiles
Ric
hest
25
.988
.926
2287
.567
925
.523
31C
hris
tian
43.5
72.5
2761
66.7
1201
40.0
2003
Mus
lim
49.6
66.5
9991
62.8
4952
46.8
6643
Rel
igio
n of
H
ouse
hold
H
ead
Oth
er/M
issi
ng
(*)
(*)
(*)
(*)
(*)
(*)
12To
tal
48.3
67.8
1277
663
.661
6545
.386
58**
MIC
S In
dica
tor 7
2 **
** M
ICS
Indi
cato
r 73
T6
1
Tabl
e C
P.4:
Chi
ld d
isci
plin
e Pe
rcen
tage
of c
hild
ren
aged
2-1
4 ye
ars
acco
rdin
g to
met
hod
of d
isci
plin
ing
the
child
, Sie
rra
Leon
e, 2
005
Perc
enta
ge o
f chi
ldre
n 2-
14 y
ears
of a
ge w
ho e
xper
ienc
e:
Onl
y no
n-vi
olen
t di
scip
line
Psyc
holo
gica
l pu
nish
men
t
Min
or
phys
ical
pu
nish
men
t
Seve
re
phys
ical
pu
nish
men
t
Any
ps
ycho
logi
cal
or p
hysi
cal
puni
shm
ent *
No
disc
iplin
e or
pu
nish
men
t
Mot
her/c
aret
aker
be
lieve
s th
at th
e ch
ild n
eeds
to
be p
hysi
cally
pu
nish
ed
Num
ber o
f ch
ildre
n ag
ed 2
-14
year
s**
Mal
e 6.
382
.975
.922
.591
.72.
056
.529
67Se
x Fe
mal
e 5.
881
.875
.122
.691
.72.
555
.430
51Ea
st
6.7
85.9
63.6
12.3
91.1
2.2
61.9
1379
Nor
th
5.0
82.7
80.4
30.2
92.3
2.6
56.4
2342
Sout
h 5.
882
.375
.519
.392
.81.
560
.214
00R
egio
n
Wes
t 8.
075
.980
.923
.389
.22.
838
.889
7R
ural
5.
783
.474
.622
.592
.12.
259
.043
43Ar
ea
Urb
an
6.9
79.6
77.8
22.7
90.7
2.5
47.9
1676
2-4
year
s 7.
377
.170
.019
.787
.65.
155
.514
545-
9 ye
ars
5.5
83.8
76.9
22.8
93.1
1.5
56.6
2566
Age
10-1
4 ye
ars
5.8
84.3
77.6
24.2
92.9
1.3
55.4
1998
Non
e 5.
982
.975
.222
.891
.82.
357
.347
40P
rimar
y 5.
681
.777
.423
.292
.42.
057
.655
2M
othe
r's
educ
atio
n Se
cond
ary
+ 7.
379
.275
.920
.490
.42.
245
.772
0Po
ores
t 7.
181
.471
.920
.690
.22.
854
.212
70S
econ
d 5.
184
.576
.924
.492
.72.
260
.712
56M
iddl
e 5.
484
.273
.121
.892
.42.
260
.511
86Fo
urth
5.
682
.378
.223
.592
.81.
658
.711
64
Wea
lth
inde
x qu
intil
es
Ric
hest
7.
079
.177
.622
.490
.52.
545
.011
43C
hris
tian
6.2
82.6
75.6
20.3
91.9
2.0
52.6
1329
Mus
lim
6.0
82.3
75.4
23.1
91.6
2.4
56.9
4674
Rel
igio
n of
H
ouse
hold
H
ead
Oth
er/M
issi
ng
(*)
(*)
(*)
(*)
(*)
(*)
(*)
15To
tal
6.0
82.3
75.5
22.5
91.7
2.3
55.9
6018
* M
ICS
Indi
cato
r 74
** T
able
is b
ased
on
child
ren
aged
2-1
4 ye
ars
rand
omly
sel
ecte
d du
ring
field
wor
k (o
ne c
hild
sel
ecte
d pe
r hou
seho
ld, i
f any
chi
ldre
n in
the
age
rang
e) fo
r who
m th
e qu
estio
ns o
n ch
ild d
isci
plin
e w
ere
adm
inis
tere
d
T6
2
Tabl
e C
P.5:
Ear
ly m
arria
ge a
nd p
olyg
yny
%f w
omen
age
d 15
-49
in m
arria
ge o
r uni
on b
efor
e th
eir 1
5th
birt
hday
, per
cent
age
of w
omen
age
d 20
-49
in m
arria
ge o
r uni
on b
efor
e th
eir 1
8th
birt
hday
, %
wom
en a
ged
15-1
9 cu
rren
tly m
arrie
d or
in u
nion
, and
the
perc
enta
ge o
f mar
ried
or in
uni
on w
omen
in a
pol
ygyn
ous
mar
riage
or u
nion
, Si
erra
Leo
ne,
2005
Perc
enta
ge
mar
ried
befo
re a
ge 1
5 *
Num
ber
of w
omen
ag
ed 1
5-49
yea
rs
Perc
enta
ge
mar
ried
befo
re a
ge 1
8 *
Num
ber
of w
omen
ag
ed 2
0-49
yea
rs
Perc
enta
ge o
f w
omen
15-
19
year
s m
arrie
d/in
un
ion
**
Num
ber
of
wom
en
aged
15-
19 y
ears
Perc
enta
ge o
f w
omen
age
d 15
-49
yea
rs in
po
lygy
nous
m
arria
ge/u
nion
**
*
Num
ber o
f w
omen
ag
ed 1
5-49
cu
rren
tly
mar
ried/
in
unio
n Ea
st
27.3
1839
62.5
1581
33.5
258
38.2
1476
Nor
th
34.1
2965
69.4
2543
42.2
422
53.1
2509
Sout
h 22
.218
2063
.315
4541
.127
541
.714
83R
egio
n
Wes
t 15
.710
2337
.487
512
.214
811
.960
9R
ural
30
.554
7567
.647
6646
.770
947
.147
07Ar
ea
Urb
an
18.6
2171
47.0
1777
16.3
394
26.9
1369
15-1
9 15
.411
03na
na35
.911
0335
.939
620
-24
27.7
1168
55.6
1168
nana
34.6
871
25-2
9 32
.317
8564
.217
85na
na42
.115
8730
-34
31.7
1177
65.2
1177
nana
43.4
1053
35-3
9 27
.412
5364
.412
53na
na43
.611
4540
-44
26.9
711
62.7
711
nana
50.5
642
Age
45-4
9 22
.145
053
.945
0na
na50
.838
4N
one
31.0
5632
67.0
5077
60.1
554
45.8
4973
Prim
ary
22.0
841
57.8
596
20.9
244
34.5
557
Educ
atio
n Se
cond
ary
+ 12
.411
5235
.685
63.
429
720
.853
6Po
ores
t 31
.014
8265
.913
0644
.117
642
.912
48S
econ
d 31
.815
5670
.513
7650
.718
045
.913
65M
iddl
e 31
.615
1767
.913
2645
.819
047
.813
11Fo
urth
25
.615
1061
.712
6239
.224
845
.711
76
Wea
lth in
dex
quin
tiles
Ric
hest
16
.315
8243
.112
7313
.830
926
.697
6C
hris
tian
27.2
1678
56.3
1440
20.0
238
29.5
1186
Mus
lim
27.2
5950
63.7
5087
40.1
863
45.7
4875
Rel
igio
n of
H
ouse
hold
H
ead
Oth
er/M
issi
ng
(*)
(*)
(*)
(*)
(*)
(*)
(*)
16To
tal
27.2
7647
62.0
6543
35.9
1103
42.6
6077
* M
ICS
Indi
cato
r 67
** M
ICS
Indi
cato
r 68,
***
MIC
S In
dica
tor 7
0 na
: no
t app
licab
le
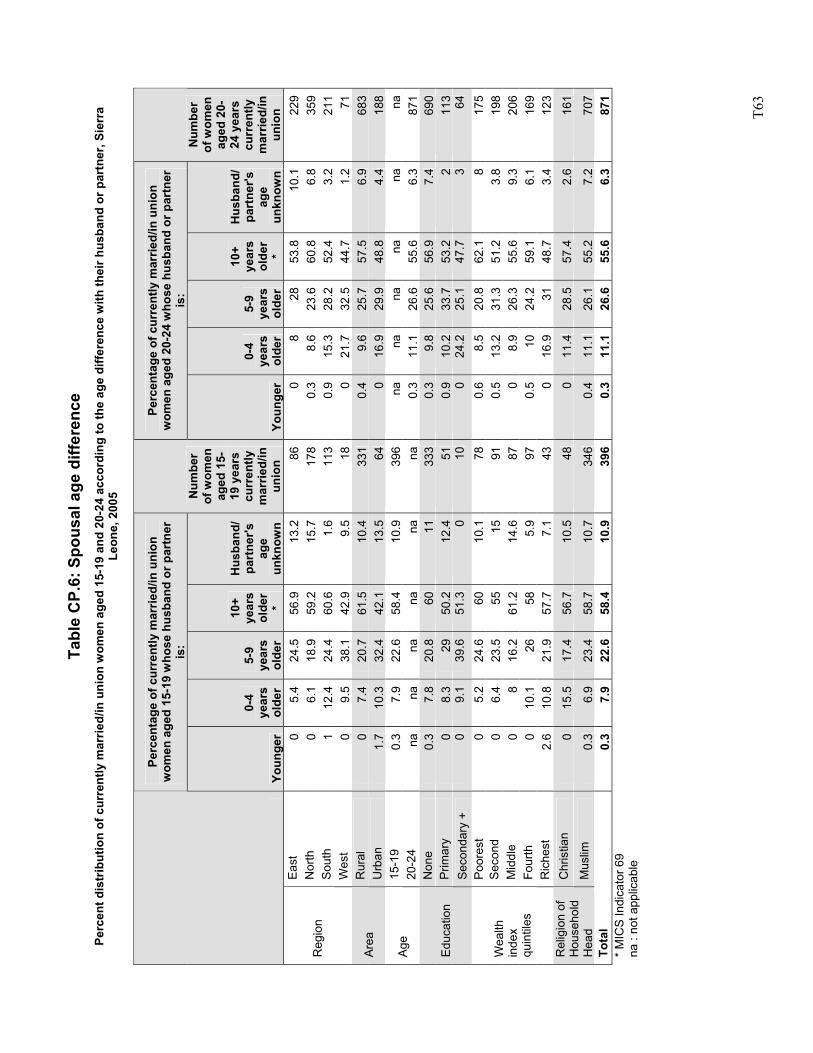
T6
3
Tabl
e C
P.6:
Spo
usal
age
diff
eren
ce
Perc
ent d
istr
ibut
ion
of c
urre
ntly
mar
ried/
in u
nion
wom
en a
ged
15-1
9 an
d 20
-24
acco
rdin
g to
the
age
diffe
renc
e w
ith th
eir h
usba
nd o
r par
tner
, Sie
rra
Leon
e, 2
005
Perc
enta
ge o
f cur
rent
ly m
arrie
d/in
uni
on
wom
en a
ged
15-1
9 w
hose
hus
band
or p
artn
er
is:
Perc
enta
ge o
f cur
rent
ly m
arrie
d/in
uni
on
wom
en a
ged
20-2
4 w
hose
hus
band
or p
artn
er
is:
Yo
unge
r
0-4
year
s ol
der
5-9
year
s ol
der
10+
year
s ol
der
*
Hus
band
/ pa
rtne
r's
age
unkn
own
Num
ber
of w
omen
ag
ed 1
5-19
yea
rs
curr
ently
m
arrie
d/in
un
ion
Yo
unge
r
0-4
year
s ol
der
5-9
year
s ol
der
10+
year
s ol
der
*
Hus
band
/ pa
rtne
r's
age
unkn
own
Num
ber
of w
omen
ag
ed 2
0-24
yea
rs
curr
ently
m
arrie
d/in
un
ion
Ea
st
0 5.
4 24
.5
56.9
13
.2
86
0 8
28
53.8
10
.1
229
Nor
th
0 6.
1 18
.9
59.2
15
.7
178
0.3
8.6
23.6
60
.8
6.8
359
Sout
h 1
12.4
24
.4
60.6
1.
6 11
3 0.
9 15
.3
28.2
52
.4
3.2
211
Reg
ion
Wes
t 0
9.5
38.1
42
.9
9.5
18
0 21
.7
32.5
44
.7
1.2
71
Rur
al
0 7.
4 20
.7
61.5
10
.4
331
0.4
9.6
25.7
57
.5
6.9
683
Area
U
rban
1.
7 10
.3
32.4
42
.1
13.5
64
0
16.9
29
.9
48.8
4.
4 18
8 15
-19
0.3
7.9
22.6
58
.4
10.9
39
6 na
na
na
na
na
na
Ag
e 20
-24
na
na
na
na
na
na
0.3
11.1
26
.6
55.6
6.
3 87
1 N
one
0.3
7.8
20.8
60
11
33
3 0.
3 9.
8 25
.6
56.9
7.
4 69
0 P
rimar
y 0
8.3
29
50.2
12
.4
51
0.9
10.2
33
.7
53.2
2
113
Educ
atio
n Se
cond
ary
+ 0
9.1
39.6
51
.3
0 10
0
24.2
25
.1
47.7
3
64
Poor
est
0 5.
2 24
.6
60
10.1
78
0.
6 8.
5 20
.8
62.1
8
175
Sec
ond
0 6.
4 23
.5
55
15
91
0.5
13.2
31
.3
51.2
3.
8 19
8 M
iddl
e 0
8 16
.2
61.2
14
.6
87
0 8.
9 26
.3
55.6
9.
3 20
6 Fo
urth
0
10.1
26
58
5.
9 97
0.
5 10
24
.2
59.1
6.
1 16
9
Wea
lth
inde
x qu
intil
es
Ric
hest
2.
6 10
.8
21.9
57
.7
7.1
43
0 16
.9
31
48.7
3.
4 12
3 C
hris
tian
0 15
.5
17.4
56
.7
10.5
48
0
11.4
28
.5
57.4
2.
6 16
1 R
elig
ion
of
Hou
seho
ld
Hea
d M
uslim
0.
3 6.
9 23
.4
58.7
10
.7
346
0.4
11.1
26
.1
55.2
7.
2 70
7 To
tal
0.3
7.9
22.6
58
.4
10.9
39
6 0.
3 11
.1
26.6
55
.6
6.3
871
* M
ICS
Indi
cato
r 69
na :
not a
pplic
able
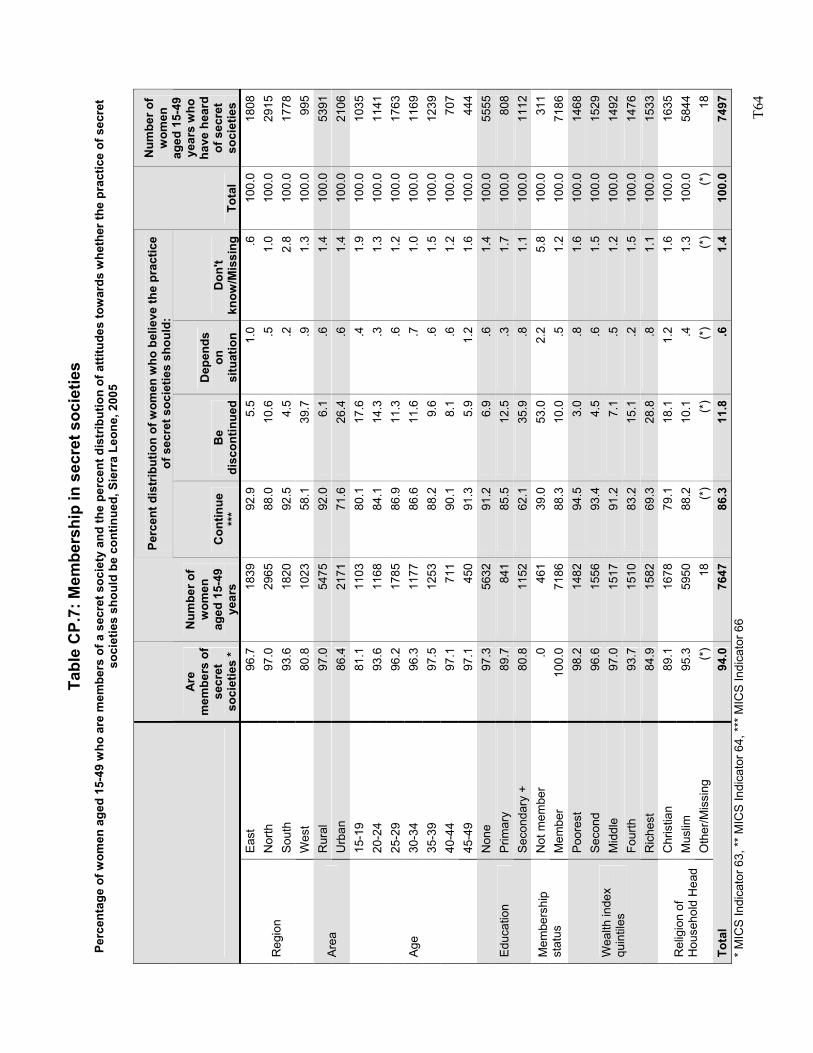
T6
4
Tabl
e C
P.7:
Mem
bers
hip
in s
ecre
t soc
ietie
s Pe
rcen
tage
of w
omen
age
d 15
-49
who
are
mem
bers
of a
sec
ret s
ocie
ty a
nd th
e pe
rcen
t dis
trib
utio
n of
atti
tude
s to
war
ds w
heth
er th
e pr
actic
e of
sec
ret
soci
etie
s sh
ould
be
cont
inue
d, S
ierr
a Le
one,
200
5
Perc
ent d
istr
ibut
ion
of w
omen
who
bel
ieve
the
prac
tice
of s
ecre
t soc
ietie
s sh
ould
:
Are
m
embe
rs o
f se
cret
so
ciet
ies
*
Num
ber o
f w
omen
ag
ed 1
5-49
ye
ars
Con
tinue
**
* B
e di
scon
tinue
d
Dep
ends
on
si
tuat
ion
Don
't kn
ow/M
issi
ngTo
tal
Num
ber o
f w
omen
ag
ed 1
5-49
ye
ars
who
ha
ve h
eard
of
sec
ret
soci
etie
s Ea
st
96.7
1839
92.9
5.5
1.0
.610
0.0
1808
Nor
th
97.0
2965
88.0
10.6
.5
1.0
100.
029
15So
uth
93.6
1820
92.5
4.5
.22.
810
0.0
1778
Reg
ion
Wes
t 80
.810
2358
.139
.7
.91.
310
0.0
995
Rur
al
97.0
5475
92.0
6.1
.61.
410
0.0
5391
Area
U
rban
86
.421
7171
.626
.4
.61.
410
0.0
2106
15-1
9 81
.111
0380
.117
.6
.41.
910
0.0
1035
20-2
4 93
.611
6884
.114
.3
.31.
310
0.0
1141
25-2
9 96
.217
8586
.911
.3
.61.
210
0.0
1763
30-3
4 96
.311
7786
.611
.6
.71.
010
0.0
1169
35-3
9 97
.512
5388
.29.
6 .6
1.5
100.
012
3940
-44
97.1
711
90.1
8.1
.61.
210
0.0
707
Age
45-4
9 97
.145
091
.35.
9 1.
21.
610
0.0
444
Non
e 97
.356
3291
.26.
9 .6
1.4
100.
055
55P
rimar
y 89
.784
185
.512
.5
.31.
710
0.0
808
Educ
atio
n Se
cond
ary
+ 80
.811
5262
.135
.9
.81.
110
0.0
1112
Not
mem
ber
.046
139
.053
.0
2.2
5.8
100.
031
1M
embe
rshi
p st
atus
M
embe
r 10
0.0
7186
88.3
10.0
.5
1.2
100.
071
86Po
ores
t 98
.214
8294
.53.
0 .8
1.6
100.
014
68S
econ
d 96
.615
5693
.44.
5 .6
1.5
100.
015
29M
iddl
e 97
.015
1791
.27.
1 .5
1.2
100.
014
92Fo
urth
93
.715
1083
.215
.1
.21.
510
0.0
1476
Wea
lth in
dex
quin
tiles
Ric
hest
84
.915
8269
.328
.8
.81.
110
0.0
1533
Chr
istia
n 89
.116
7879
.118
.1
1.2
1.6
100.
016
35M
uslim
95
.359
5088
.210
.1
.41.
310
0.0
5844
Rel
igio
n of
H
ouse
hold
Hea
d O
ther
/Mis
sing
(*
)18
(*)
(*)
(*)
(*)
(*)
18To
tal
94.0
7647
86.3
11.8
.6
1.4
100.
074
97*
MIC
S In
dica
tor 6
3, *
* M
ICS
Indi
cato
r 64,
***
MIC
S In
dica
tor 6
6
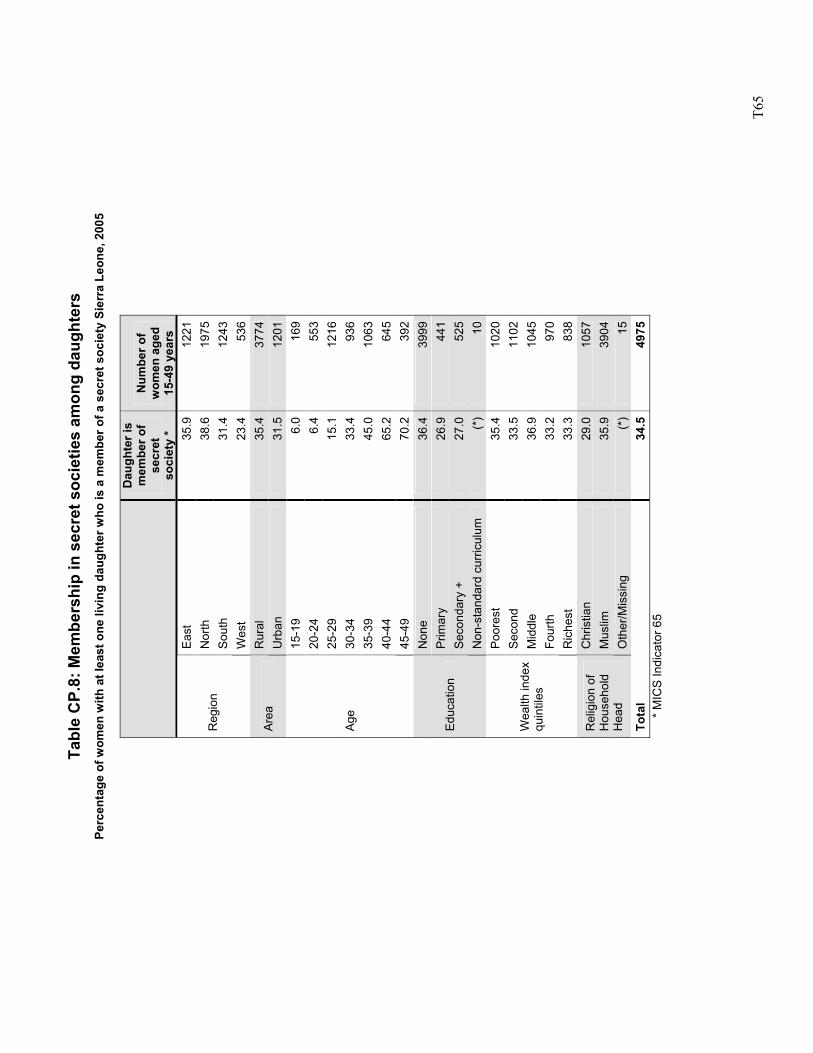
T6
5
Tabl
e C
P.8:
Mem
bers
hip
in s
ecre
t soc
ietie
s am
ong
daug
hter
s Pe
rcen
tage
of w
omen
with
at l
east
one
livi
ng d
augh
ter w
ho is
a m
embe
r of a
sec
ret s
ocie
ty S
ierr
a Le
one,
200
5
Dau
ghte
r is
mem
ber o
f se
cret
so
ciet
y *
Num
ber o
f w
omen
age
d 15
-49
year
s Ea
st
35.9
12
21N
orth
38
.6
1975
Sout
h 31
.4
1243
Reg
ion
Wes
t 23
.4
536
Rur
al
35.4
37
74Ar
ea
Urb
an
31.5
12
0115
-19
6.0
169
20-2
4 6.
4 55
325
-29
15.1
12
1630
-34
33.4
93
635
-39
45.0
10
6340
-44
65.2
64
5
Age
45-4
9 70
.2
392
Non
e 36
.4
3999
Prim
ary
26.9
44
1Se
cond
ary
+ 27
.0
525
Educ
atio
n
Non
-sta
ndar
d cu
rricu
lum
(*
) 10
Poor
est
35.4
10
20S
econ
d 33
.5
1102
Mid
dle
36.9
10
45Fo
urth
33
.2
970
Wea
lth in
dex
quin
tiles
Ric
hest
33
.3
838
Chr
istia
n 29
.0
1057
Mus
lim
35.9
39
04R
elig
ion
of
Hou
seho
ld
Hea
d O
ther
/Mis
sing
(*
) 15
Tota
l 34
.5
4975
*
MIC
S In
dica
tor 6
5
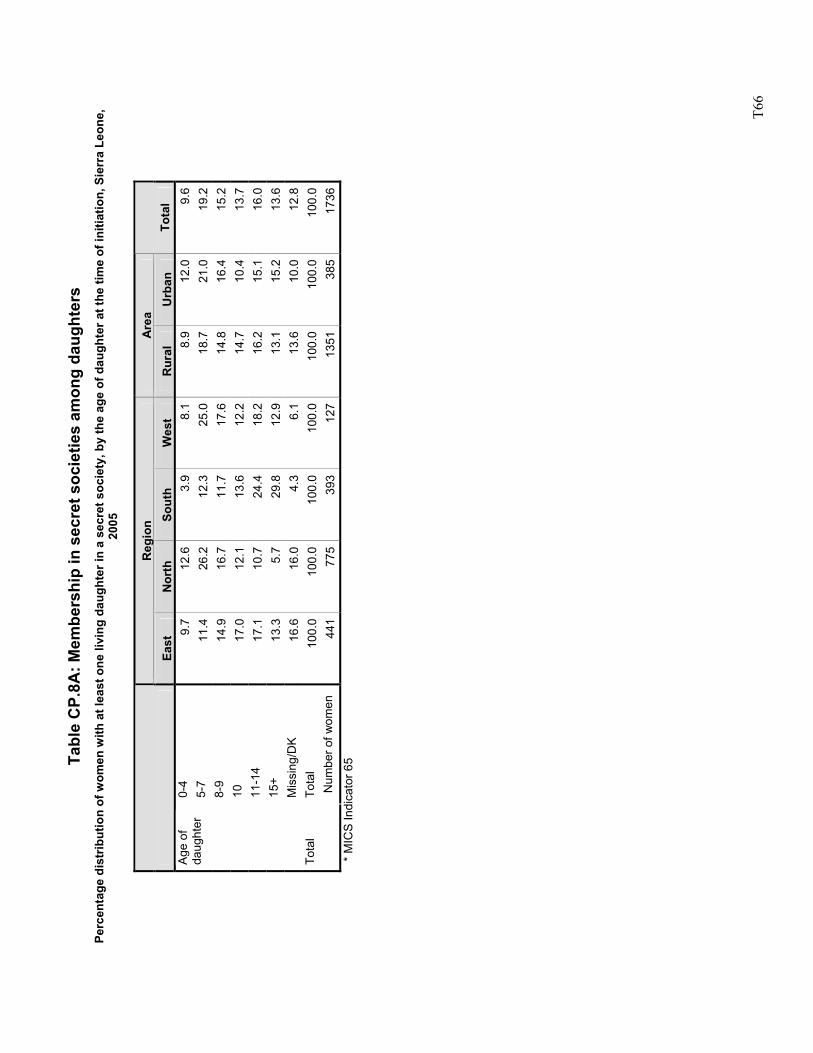
T6
6
Tabl
e C
P.8A
: Mem
bers
hip
in s
ecre
t soc
ietie
s am
ong
daug
hter
s Pe
rcen
tage
dis
trib
utio
n of
wom
en w
ith a
t lea
st o
ne li
ving
dau
ghte
r in
a se
cret
soc
iety
, by
the
age
of d
augh
ter a
t the
tim
e of
initi
atio
n, S
ierr
a Le
one,
20
05
R
egio
n A
rea
Ea
st
Nor
th
Sout
h W
est
Rur
al
Urb
an
Tota
l 0-
4 9.
712
.63.
98.
1 8.
912
.09.
65-
7 11
.426
.212
.325
.0
18.7
21.0
19.2
8-9
14.9
16.7
11.7
17.6
14
.816
.415
.210
17
.012
.113
.612
.2
14.7
10.4
13.7
11-1
4 17
.110
.724
.418
.2
16.2
15.1
16.0
15+
13.3
5.7
29.8
12.9
13
.115
.213
.6
Age
of
daug
hter
Mis
sing
/DK
16.6
16.0
4.3
6.1
13.6
10.0
12.8
Tota
l 10
0.0
100.
010
0.0
100.
0 10
0.0
100.
010
0.0
Tota
l N
umbe
r of w
omen
44
177
539
312
7 13
5138
517
36*
MIC
S In
dica
tor 6
5
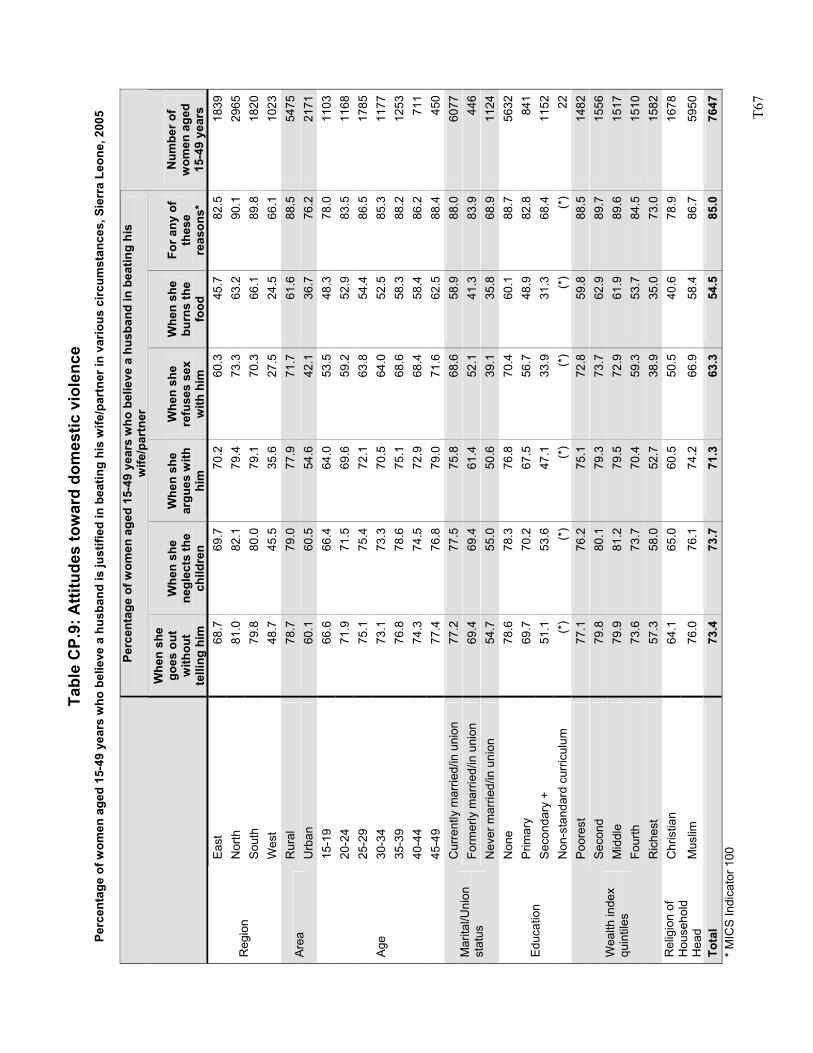
T6
7
Tabl
e C
P.9:
Atti
tude
s to
war
d do
mes
tic v
iole
nce
Perc
enta
ge o
f wom
en a
ged
15-4
9 ye
ars
who
bel
ieve
a h
usba
nd is
just
ified
in b
eatin
g hi
s w
ife/p
artn
er in
var
ious
circ
umst
ance
s, S
ierr
a Le
one,
200
5
Perc
enta
ge o
f wom
en a
ged
15-4
9 ye
ars
who
bel
ieve
a h
usba
nd in
bea
ting
his
wife
/par
tner
Whe
n sh
e go
es o
ut
with
out
telli
ng h
im
Whe
n sh
e ne
glec
ts th
e ch
ildre
n
Whe
n sh
e ar
gues
with
hi
m
Whe
n sh
e re
fuse
s se
x w
ith h
im
Whe
n sh
e bu
rns
the
food
For a
ny o
f th
ese
reas
ons*
Num
ber o
f w
omen
age
d 15
-49
year
s Ea
st
68.7
69.7
70.2
60.3
45.7
82.5
1839
Nor
th
81.0
82.1
79.4
73.3
63.2
90.1
2965
Sout
h 79
.880
.079
.170
.366
.189
.818
20R
egio
n
Wes
t 48
.745
.535
.627
.524
.566
.110
23R
ural
78
.779
.077
.971
.761
.688
.554
75Ar
ea
Urb
an
60.1
60.5
54.6
42.1
36.7
76.2
2171
15-1
9 66
.666
.464
.053
.548
.378
.011
0320
-24
71.9
71.5
69.6
59.2
52.9
83.5
1168
25-2
9 75
.175
.472
.163
.854
.486
.517
8530
-34
73.1
73.3
70.5
64.0
52.5
85.3
1177
35-3
9 76
.878
.675
.168
.658
.388
.212
5340
-44
74.3
74.5
72.9
68.4
58.4
86.2
711
Age
45-4
9 77
.476
.879
.071
.662
.588
.445
0C
urre
ntly
mar
ried/
in u
nion
77
.277
.575
.868
.658
.988
.060
77Fo
rmer
ly m
arrie
d/in
uni
on
69.4
69.4
61.4
52.1
41.3
83.9
446
Mar
ital/U
nion
st
atus
N
ever
mar
ried/
in u
nion
54
.755
.050
.639
.135
.868
.911
24N
one
78.6
78.3
76.8
70.4
60.1
88.7
5632
Prim
ary
69.7
70.2
67.5
56.7
48.9
82.8
841
Seco
ndar
y +
51.1
53.6
47.1
33.9
31.3
68.4
1152
Educ
atio
n
Non
-sta
ndar
d cu
rricu
lum
(*
)(*
)(*
)(*
)(*
)(*
)22
Poor
est
77.1
76.2
75.1
72.8
59.8
88.5
1482
Sec
ond
79.8
80.1
79.3
73.7
62.9
89.7
1556
Mid
dle
79.9
81.2
79.5
72.9
61.9
89.6
1517
Four
th
73.6
73.7
70.4
59.3
53.7
84.5
1510
Wea
lth in
dex
quin
tiles
Ric
hest
57
.358
.052
.738
.935
.073
.015
82C
hris
tian
64.1
65.0
60.5
50.5
40.6
78.9
1678
Rel
igio
n of
H
ouse
hold
H
ead
Mus
lim
76.0
76.1
74.2
66.9
58.4
86.7
5950
Tota
l 73
.473
.771
.363
.354
.585
.076
47*
MIC
S In
dica
tor 1
00
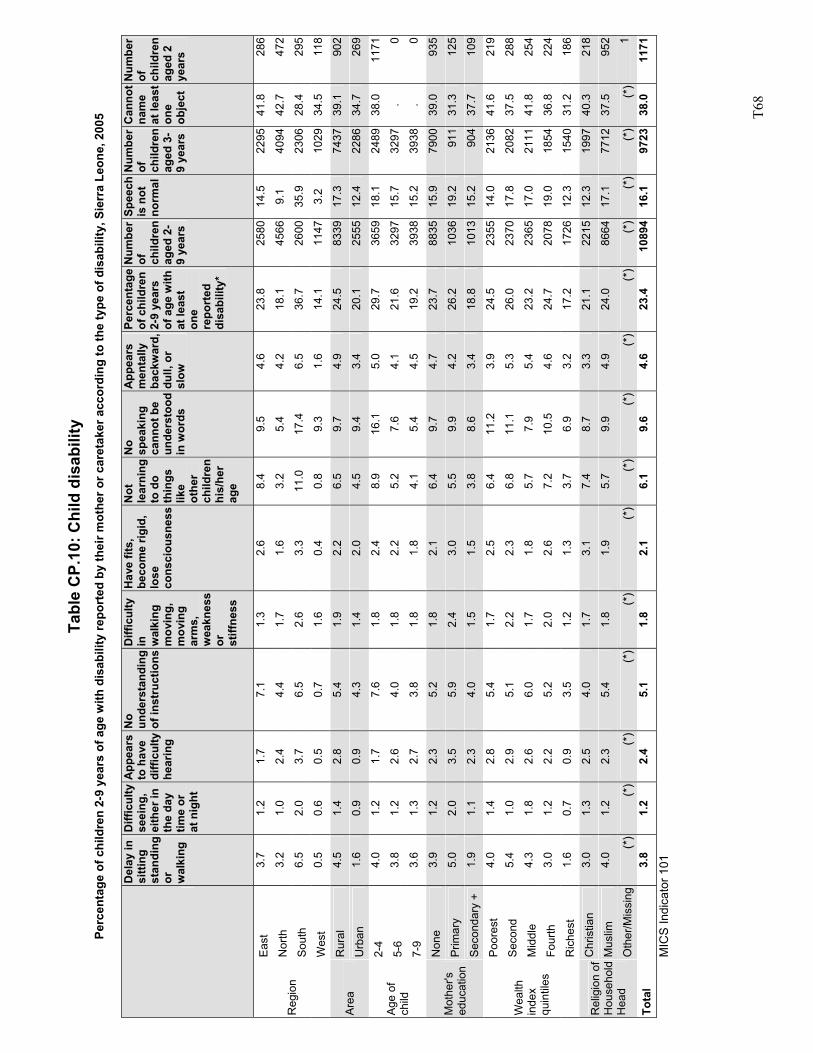
T6
8
Tabl
e C
P.10
: Chi
ld d
isab
ility
Pe
rcen
tage
of c
hild
ren
2-9
year
s of
age
with
dis
abili
ty re
port
ed b
y th
eir m
othe
r or c
aret
aker
acc
ordi
ng to
the
type
of d
isab
ility
, Sie
rra
Leon
e, 2
005
Del
ay in
si
tting
st
andi
ng
or
wal
king
Diff
icul
ty
seei
ng,
eith
er in
th
e da
y tim
e or
at
nig
ht
App
ears
to
hav
e di
fficu
lty
hear
ing
No
unde
rsta
ndin
g of
inst
ruct
ions
Diff
icul
ty
in
wal
king
m
ovin
g,
mov
ing
arm
s,
wea
knes
s or
st
iffne
ss
Hav
e fit
s,
beco
me
rigid
, lo
se
cons
ciou
snes
s
Not
le
arni
ng
to d
o th
ings
lik
e ot
her
child
ren
his/
her
age
No
spea
king
ca
nnot
be
unde
rsto
od
in w
ords
App
ears
m
enta
lly
back
war
d,
dull,
or
slow
Perc
enta
ge
of c
hild
ren
2-9
year
s of
age
with
at
leas
t on
e re
port
ed
disa
bilit
y*
Num
ber
of
child
ren
aged
2-
9 ye
ars
Spee
ch
is n
ot
norm
al
Num
ber
of
child
ren
aged
3-
9 ye
ars
Can
not
nam
e at
leas
t on
e ob
ject
Num
ber
of
child
ren
aged
2
year
s
Eas
t 3.
7 1.
2 1.
7 7.
1 1.
3 2.
6 8.
4 9.
5 4.
6 23
.8
2580
14.5
22
9541
.8
286
Nor
th
3.2
1.0
2.4
4.4
1.7
1.6
3.2
5.4
4.2
18.1
45
669.
1 40
9442
.7
472
Sou
th
6.5
2.0
3.7
6.5
2.6
3.3
11.0
17
.4
6.5
36.7
26
0035
.9
2306
28.4
29
5 R
egio
n
Wes
t 0.
5 0.
6 0.
5 0.
7 1.
6 0.
4 0.
8 9.
3 1.
6 14
.1
1147
3.2
1029
34.5
11
8
Rur
al
4.5
1.4
2.8
5.4
1.9
2.2
6.5
9.7
4.9
24.5
83
3917
.3
7437
39.1
90
2 A
rea
Urb
an
1.6
0.9
0.9
4.3
1.4
2.0
4.5
9.4
3.4
20.1
25
5512
.4
2286
34.7
26
9
2-4
4.0
1.2
1.7
7.6
1.8
2.4
8.9
16.1
5.
0 29
.7
3659
18.1
24
8938
.0
1171
5-6
3.8
1.2
2.6
4.0
1.8
2.2
5.2
7.6
4.1
21.6
32
9715
.7
3297
. 0
Age
of
child
7-
9 3.
6 1.
3 2.
7 3.
8 1.
8 1.
8 4.
1 5.
4 4.
5 19
.2
3938
15.2
39
38.
0
Non
e 3.
9 1.
2 2.
3 5.
2 1.
8 2.
1 6.
4 9.
7 4.
7 23
.7
8835
15.9
79
0039
.0
935
Prim
ary
5.0
2.0
3.5
5.9
2.4
3.0
5.5
9.9
4.2
26.2
10
3619
.2
911
31.3
12
5 M
othe
r's
educ
atio
n S
econ
dary
+
1.9
1.1
2.3
4.0
1.5
1.5
3.8
8.6
3.4
18.8
10
1315
.2
904
37.7
10
9
Poo
rest
4.
0 1.
4 2.
8 5.
4 1.
7 2.
5 6.
4 11
.2
3.9
24.5
23
5514
.0
2136
41.6
21
9
Sec
ond
5.4
1.0
2.9
5.1
2.2
2.3
6.8
11.1
5.
3 26
.0
2370
17.8
20
8237
.5
288
Mid
dle
4.3
1.8
2.6
6.0
1.7
1.8
5.7
7.9
5.4
23.2
23
6517
.0
2111
41.8
25
4
Four
th
3.0
1.2
2.2
5.2
2.0
2.6
7.2
10.5
4.
6 24
.7
2078
19.0
18
5436
.8
224
Wea
lth
inde
x qu
intil
es
Ric
hest
1.
6 0.
7 0.
9 3.
5 1.
2 1.
3 3.
7 6.
9 3.
2 17
.2
1726
12.3
15
4031
.2
186
Chr
istia
n 3.
0 1.
3 2.
5 4.
0 1.
7 3.
1 7.
4 8.
7 3.
3 21
.1
2215
12.3
19
9740
.3
218
Mus
lim
4.0
1.2
2.3
5.4
1.8
1.9
5.7
9.9
4.9
24.0
86
6417
.1
7712
37.5
95
2 R
elig
ion
of
Hou
seho
ld
Hea
d O
ther
/Mis
sing
(*
) (*
) (*
) (*
)(*
)(*
)(*
)(*
)(*
)(*
)(*
)(*
)(*
)(*
)1
Tota
l 3.
8 1.
2 2.
4 5.
1 1.
8 2.
1 6.
1 9.
6 4.
6 23
.4
1089
416
.1
9723
38.0
11
71
MIC
S In
dica
tor 1
01
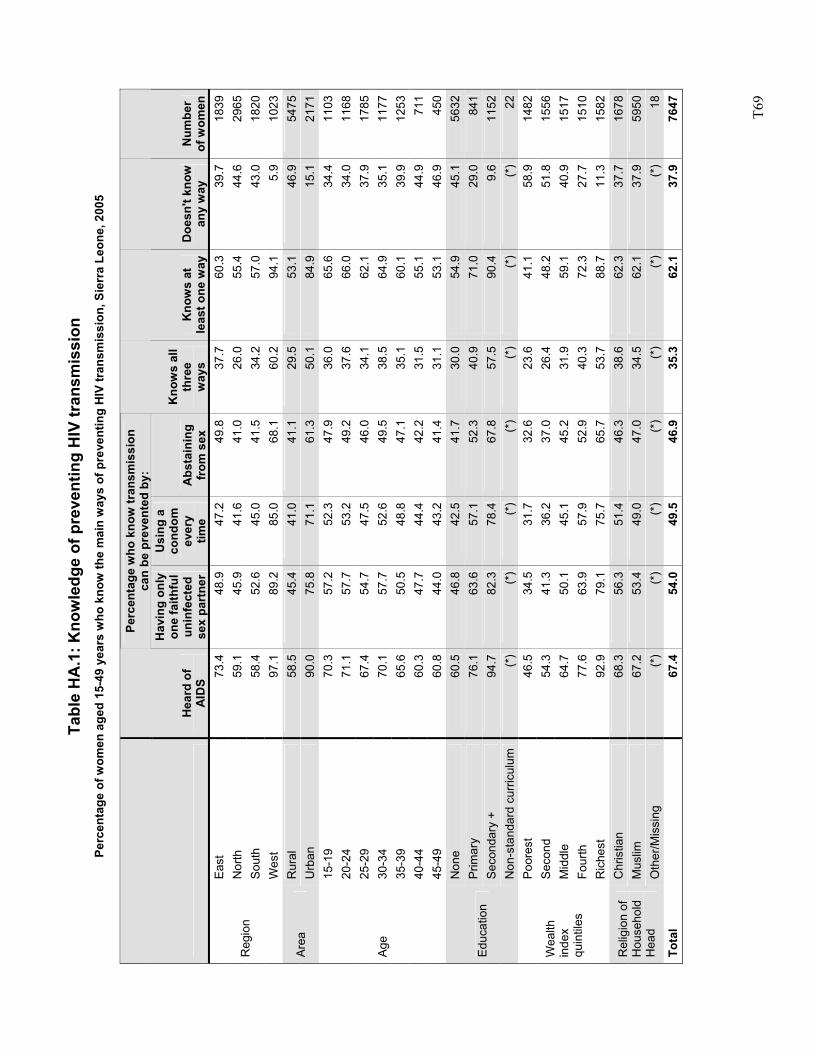
T6
9
Tabl
e H
A.1
: Kno
wle
dge
of p
reve
ntin
g H
IV tr
ansm
issi
on
Perc
enta
ge o
f wom
en a
ged
15-4
9 ye
ars
who
kno
w th
e m
ain
way
s of
pre
vent
ing
HIV
tran
smis
sion
, Sie
rra
Leon
e, 2
005
Pe
rcen
tage
who
kno
w tr
ansm
issi
on
can
be p
reve
nted
by:
H
eard
of
AID
S
Hav
ing
only
on
e fa
ithfu
l un
infe
cted
se
x pa
rtne
r
Usi
ng a
co
ndom
ev
ery
time
Abs
tain
ing
from
sex
Kno
ws
all
thre
e w
ays
Kno
ws
at
leas
t one
way
Doe
sn't
know
an
y w
ay
Num
ber
of w
omen
East
73
.448
.947
.249
.8
37.7
60.3
39.7
1839
Nor
th
59.1
45.9
41.6
41.0
26
.055
.444
.629
65So
uth
58.4
52.6
45.0
41.5
34
.257
.043
.018
20R
egio
n
Wes
t 97
.189
.285
.068
.1
60.2
94.1
5.9
1023
Rur
al
58.5
45.4
41.0
41.1
29
.553
.146
.954
75Ar
ea
Urb
an
90.0
75.8
71.1
61.3
50
.184
.915
.121
7115
-19
70.3
57.2
52.3
47.9
36
.065
.634
.411
0320
-24
71.1
57.7
53.2
49.2
37
.666
.034
.011
6825
-29
67.4
54.7
47.5
46.0
34
.162
.137
.917
8530
-34
70.1
57.7
52.6
49.5
38
.564
.935
.111
7735
-39
65.6
50.5
48.8
47.1
35
.160
.139
.912
5340
-44
60.3
47.7
44.4
42.2
31
.555
.144
.971
1
Age
45-4
9 60
.844
.043
.241
.4
31.1
53.1
46.9
450
Non
e 60
.546
.842
.541
.7
30.0
54.9
45.1
5632
Prim
ary
76.1
63.6
57.1
52.3
40
.971
.029
.084
1Se
cond
ary
+ 94
.782
.378
.467
.8
57.5
90.4
9.6
1152
Educ
atio
n
Non
-sta
ndar
d cu
rricu
lum
(*
)(*
)(*
)(*
) (*
)(*
)(*
)22
Poor
est
46.5
34.5
31.7
32.6
23
.641
.158
.914
82S
econ
d 54
.341
.336
.237
.0
26.4
48.2
51.8
1556
Mid
dle
64.7
50.1
45.1
45.2
31
.959
.140
.915
17Fo
urth
77
.663
.957
.952
.9
40.3
72.3
27.7
1510
Wea
lth
inde
x qu
intil
es
Ric
hest
92
.979
.175
.765
.7
53.7
88.7
11.3
1582
Chr
istia
n 68
.356
.351
.446
.3
38.6
62.3
37.7
1678
Mus
lim
67.2
53.4
49.0
47.0
34
.562
.137
.959
50R
elig
ion
of
Hou
seho
ld
Hea
d O
ther
/Mis
sing
(*
)(*
)(*
)(*
) (*
)(*
)(*
)18
Tota
l 67
.454
.049
.546
.9
35.3
62.1
37.9
7647
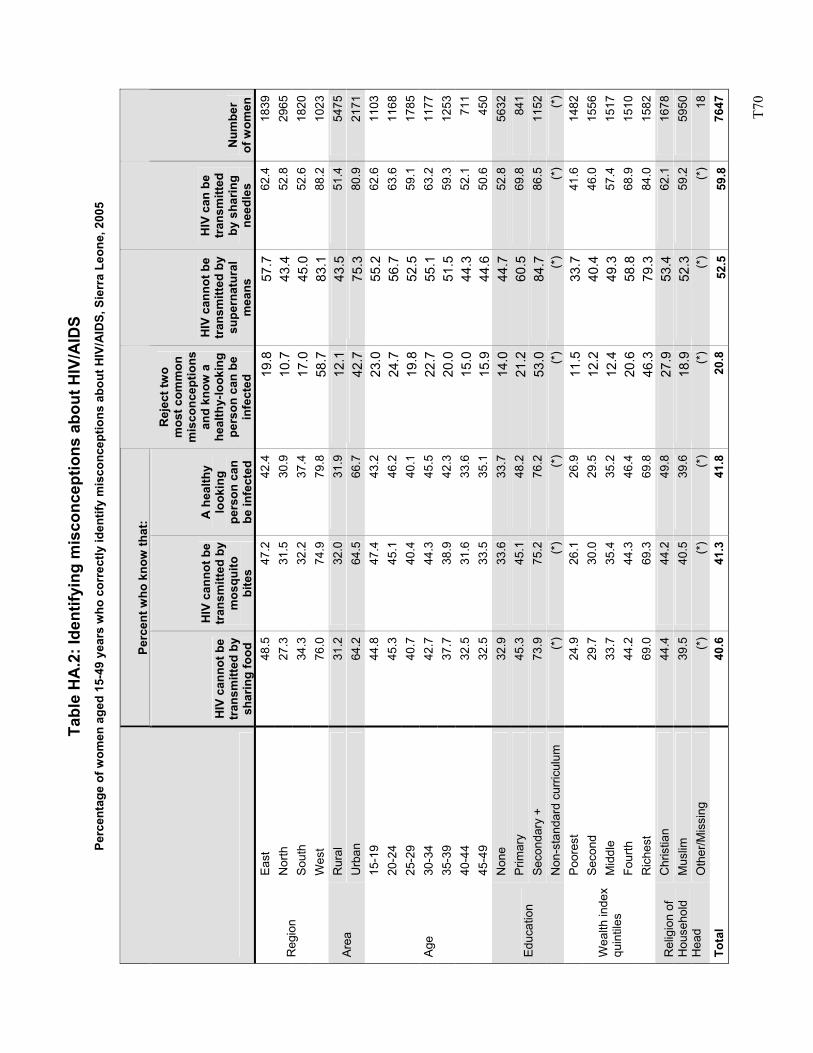
T7
0
Tabl
e H
A.2
: Ide
ntify
ing
mis
conc
eptio
ns a
bout
HIV
/AID
S Pe
rcen
tage
of w
omen
age
d 15
-49
year
s w
ho c
orre
ctly
iden
tify
mis
conc
eptio
ns a
bout
HIV
/AID
S, S
ierr
a Le
one,
200
5
Perc
ent w
ho k
now
that
:
HIV
can
not b
e tr
ansm
itted
by
shar
ing
food
HIV
can
not b
e tr
ansm
itted
by
mos
quito
bi
tes
A h
ealth
y lo
okin
g pe
rson
can
be
infe
cted
Rej
ect t
wo
mos
t com
mon
m
isco
ncep
tions
an
d kn
ow a
he
alth
y-lo
okin
g pe
rson
can
be
infe
cted
HIV
can
not b
e tr
ansm
itted
by
supe
rnat
ural
m
eans
HIV
can
be
tran
smitt
ed
by s
harin
g ne
edle
s N
umbe
r of
wom
en
East
48
.547
.242
.419
.857
.762
.418
39N
orth
27
.331
.530
.910
.743
.452
.829
65So
uth
34.3
32.2
37.4
17.0
45.0
52.6
1820
Reg
ion
Wes
t 76
.074
.979
.858
.783
.188
.210
23R
ural
31
.232
.031
.912
.143
.551
.454
75Ar
ea
Urb
an
64.2
64.5
66.7
42.7
75.3
80.9
2171
15-1
9 44
.847
.443
.223
.055
.262
.611
0320
-24
45.3
45.1
46.2
24.7
56.7
63.6
1168
25-2
9 40
.740
.440
.119
.852
.559
.117
8530
-34
42.7
44.3
45.5
22.7
55.1
63.2
1177
35-3
9 37
.738
.942
.320
.051
.559
.312
5340
-44
32.5
31.6
33.6
15.0
44.3
52.1
711
Age
45-4
9 32
.533
.535
.115
.944
.650
.645
0N
one
32.9
33.6
33.7
14.0
44.7
52.8
5632
Prim
ary
45.3
45.1
48.2
21.2
60.5
69.8
841
Seco
ndar
y +
73.9
75.2
76.2
53.0
84.7
86.5
1152
Educ
atio
n
Non
-sta
ndar
d cu
rricu
lum
(*
)(*
)(*
)(*
)(*
)(*
)(*
)Po
ores
t 24
.926
.126
.911
.533
.741
.614
82S
econ
d 29
.730
.029
.512
.240
.446
.015
56M
iddl
e 33
.735
.435
.212
.449
.357
.415
17Fo
urth
44
.244
.346
.420
.658
.868
.915
10
Wea
lth in
dex
quin
tiles
Ric
hest
69
.069
.369
.846
.379
.384
.015
82C
hris
tian
44.4
44.2
49.8
27.9
53.4
62.1
1678
Mus
lim
39.5
40.5
39.6
18.9
52.3
59.2
5950
Rel
igio
n of
H
ouse
hold
H
ead
Oth
er/M
issi
ng
(*)
(*)
(*)
(*)
(*)
(*)
18To
tal
40.6
41.3
41.8
20.8
52.5
59.8
7647
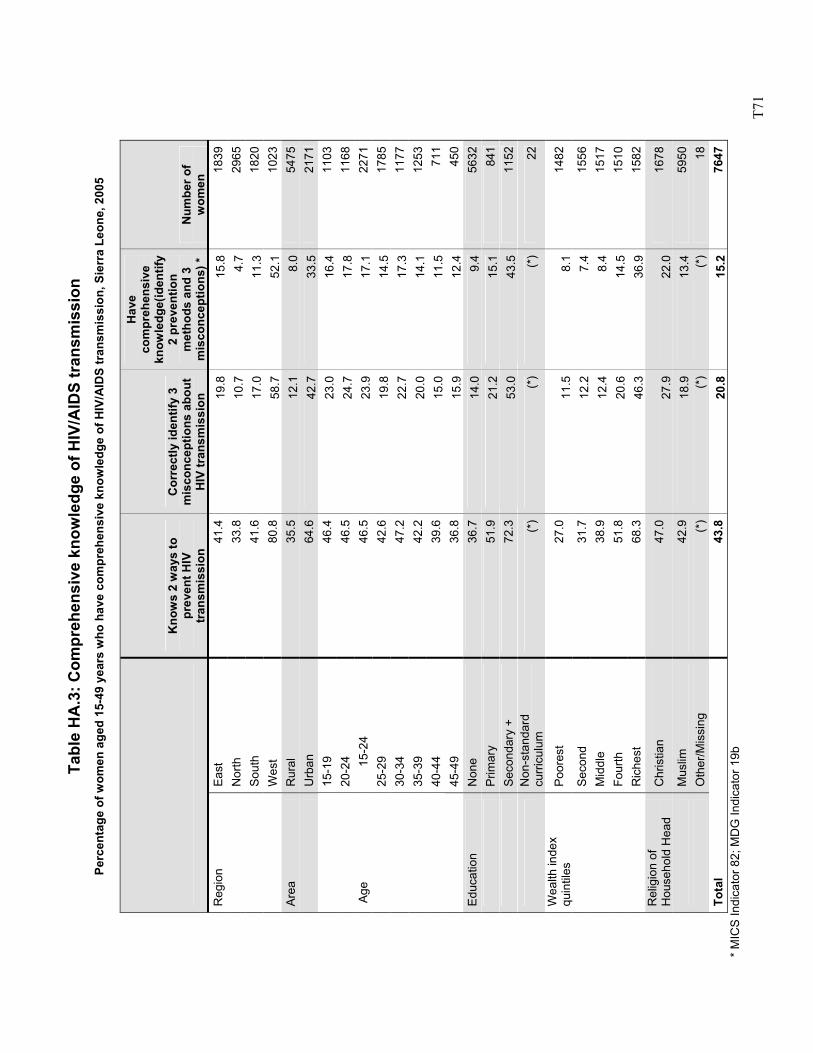
T7
1
Tabl
e H
A.3
: Com
preh
ensi
ve k
now
ledg
e of
HIV
/AID
S tr
ansm
issi
on
Perc
enta
ge o
f wom
en a
ged
15-4
9 ye
ars
who
hav
e co
mpr
ehen
sive
kno
wle
dge
of H
IV/A
IDS
tran
smis
sion
, Sie
rra
Leon
e, 2
005
Kno
ws
2 w
ays
to
prev
ent H
IV
tran
smis
sion
Cor
rect
ly id
entif
y 3
mis
conc
eptio
ns a
bout
H
IV tr
ansm
issi
on
Hav
e co
mpr
ehen
sive
kn
owle
dge(
iden
tify
2 pr
even
tion
met
hods
and
3
mis
conc
eptio
ns) *
N
umbe
r of
wom
en
Reg
ion
East
41
.419
.815
.818
39
Nor
th
33.8
10.7
4.7
2965
So
uth
41.6
17.0
11.3
1820
W
est
80.8
58.7
52.1
1023
Area
R
ural
35
.512
.18.
054
75
Urb
an
64.6
42.7
33.5
2171
15-1
9 46
.423
.016
.411
0320
-24
46.5
24.7
17.8
1168
15-2
4 46
.523
.917
.122
7125
-29
42.6
19.8
14.5
1785
30-3
4 47
.222
.717
.311
7735
-39
42.2
20.0
14.1
1253
40-4
4 39
.615
.011
.571
1
Age
45-4
9 36
.815
.912
.445
0Ed
ucat
ion
Non
e 36
.714
.09.
456
32
Prim
ary
51.9
21.2
15.1
841
Se
cond
ary
+ 72
.353
.043
.511
52
N
on-s
tand
ard
curr
icul
um
(*)
(*)
(*)
22
Wea
lth in
dex
quin
tiles
Po
ores
t 27
.011
.58.
114
82
S
econ
d 31
.712
.27.
415
56
Mid
dle
38.9
12.4
8.4
1517
Fo
urth
51
.820
.614
.515
10
Ric
hest
68
.346
.336
.915
82R
elig
ion
of
Hou
seho
ld H
ead
Chr
istia
n 47
.027
.922
.016
78
M
uslim
42
.918
.913
.459
50
Oth
er/M
issi
ng
(*)
(*)
(*)
18To
tal
43.8
20.8
15.2
7647
* M
ICS
Indi
cato
r 82;
MD
G In
dica
tor 1
9b
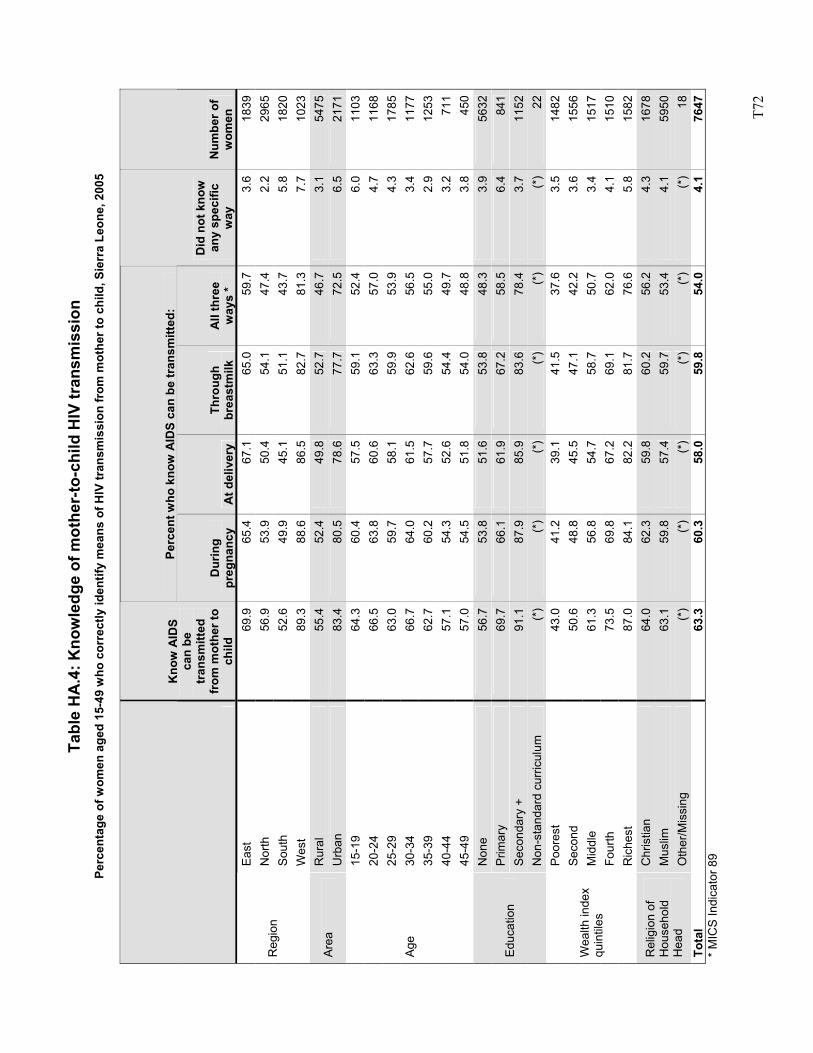
T7
2
Tabl
e H
A.4
: Kno
wle
dge
of m
othe
r-to
-chi
ld H
IV tr
ansm
issi
on
Perc
enta
ge o
f wom
en a
ged
15-4
9 w
ho c
orre
ctly
iden
tify
mea
ns o
f HIV
tran
smis
sion
from
mot
her t
o ch
ild, S
ierr
a Le
one,
200
5
Perc
ent w
ho k
now
AID
S ca
n be
tran
smitt
ed:
Kno
w A
IDS
can
be
tran
smitt
ed
from
mot
her t
o ch
ild
Dur
ing
preg
nanc
y A
t del
iver
y Th
roug
h br
east
milk
A
ll th
ree
way
s *
Did
not
kno
w
any
spec
ific
way
N
umbe
r of
wom
en
East
69
.965
.467
.1
65.0
59.7
3.6
1839
Nor
th
56.9
53.9
50.4
54
.147
.42.
229
65So
uth
52.6
49.9
45.1
51
.143
.75.
818
20R
egio
n
Wes
t 89
.388
.686
.5
82.7
81.3
7.7
1023
Rur
al
55.4
52.4
49.8
52
.746
.73.
154
75Ar
ea
Urb
an
83.4
80.5
78.6
77
.772
.56.
521
7115
-19
64.3
60.4
57.5
59
.152
.46.
011
0320
-24
66.5
63.8
60.6
63
.357
.04.
711
6825
-29
63.0
59.7
58.1
59
.953
.94.
317
8530
-34
66.7
64.0
61.5
62
.656
.53.
411
7735
-39
62.7
60.2
57.7
59
.655
.02.
912
5340
-44
57.1
54.3
52.6
54
.449
.73.
271
1
Age
45-4
9 57
.054
.551
.8
54.0
48.8
3.8
450
Non
e 56
.753
.851
.6
53.8
48.3
3.9
5632
Prim
ary
69.7
66.1
61.9
67
.258
.56.
484
1Se
cond
ary
+ 91
.187
.985
.9
83.6
78.4
3.7
1152
Educ
atio
n
Non
-sta
ndar
d cu
rricu
lum
(*
)(*
)(*
) (*
)(*
)(*
)22
Poor
est
43.0
41.2
39.1
41
.537
.63.
514
82S
econ
d 50
.648
.845
.5
47.1
42.2
3.6
1556
Mid
dle
61.3
56.8
54.7
58
.750
.73.
415
17Fo
urth
73
.569
.867
.2
69.1
62.0
4.1
1510
Wea
lth in
dex
quin
tiles
Ric
hest
87
.084
.182
.2
81.7
76.6
5.8
1582
Chr
istia
n 64
.062
.359
.8
60.2
56.2
4.3
1678
Mus
lim
63.1
59.8
57.4
59
.753
.44.
159
50R
elig
ion
of
Hou
seho
ld
Hea
d O
ther
/Mis
sing
(*
)(*
)(*
) (*
)(*
)(*
)18
Tota
l 63
.360
.358
.0
59.8
54.0
4.1
7647
* M
ICS
Indi
cato
r 89
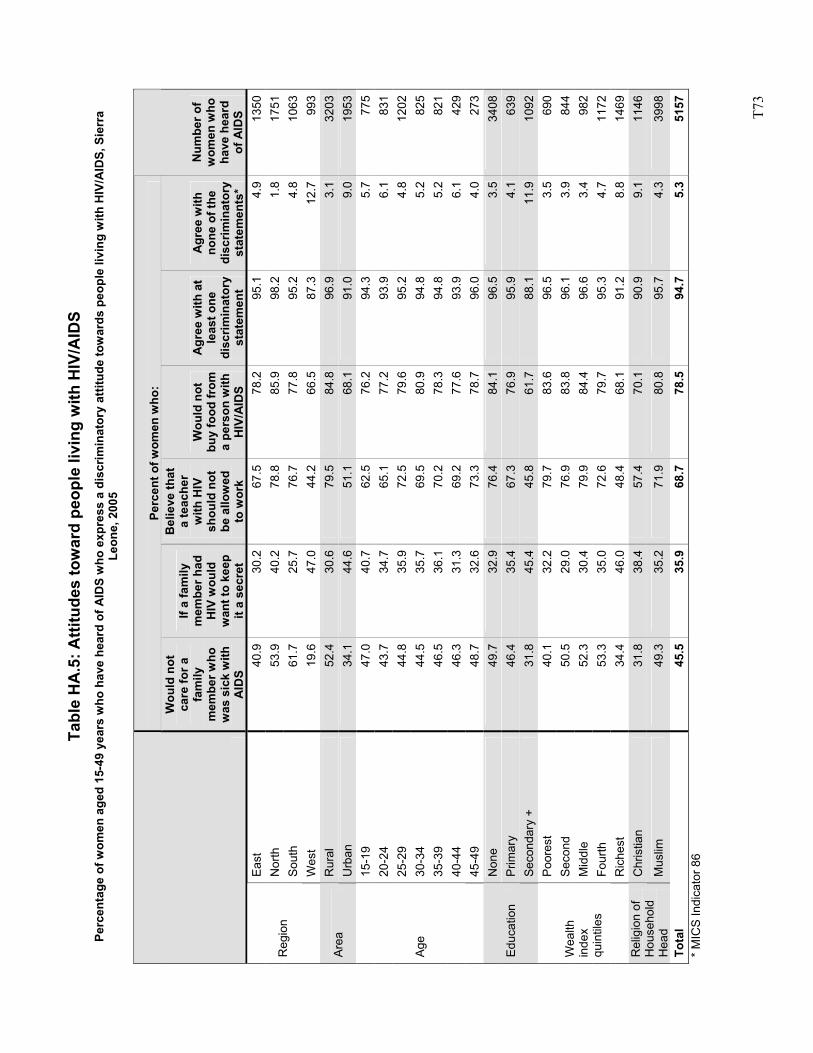
T7
3
Tabl
e H
A.5
: Atti
tude
s to
war
d pe
ople
livi
ng w
ith H
IV/A
IDS
Perc
enta
ge o
f wom
en a
ged
15-4
9 ye
ars
who
hav
e he
ard
of A
IDS
who
exp
ress
a d
iscr
imin
ator
y at
titud
e to
war
ds p
eopl
e liv
ing
with
HIV
/AID
S, S
ierr
a Le
one,
200
5
Perc
ent o
f wom
en w
ho:
Wou
ld n
ot
care
for a
fa
mily
m
embe
r who
w
as s
ick
with
A
IDS
If a
fam
ily
mem
ber h
ad
HIV
wou
ld
wan
t to
keep
it
a se
cret
Bel
ieve
that
a
teac
her
with
HIV
sh
ould
not
be
allo
wed
to
wor
k
Wou
ld n
ot
buy
food
from
a
pers
on w
ith
HIV
/AID
S
Agr
ee w
ith a
t le
ast o
ne
disc
rimin
ator
y st
atem
ent
Agr
ee w
ith
none
of t
he
disc
rimin
ator
y st
atem
ents
*
Num
ber o
f w
omen
who
ha
ve h
eard
of
AID
S Ea
st
40.9
30.2
67.5
78.2
95.1
4.9
1350
Nor
th
53.9
40.2
78.8
85.9
98.2
1.8
1751
Sout
h 61
.725
.776
.777
.895
.24.
810
63R
egio
n
Wes
t 19
.647
.044
.266
.587
.312
.799
3R
ural
52
.430
.679
.584
.896
.93.
132
03Ar
ea
Urb
an
34.1
44.6
51.1
68.1
91.0
9.0
1953
15-1
9 47
.040
.762
.576
.294
.35.
777
520
-24
43.7
34.7
65.1
77.2
93.9
6.1
831
25-2
9 44
.835
.972
.579
.695
.24.
812
0230
-34
44.5
35.7
69.5
80.9
94.8
5.2
825
35-3
9 46
.536
.170
.278
.394
.85.
282
140
-44
46.3
31.3
69.2
77.6
93.9
6.1
429
Age
45-4
9 48
.732
.673
.378
.796
.04.
027
3N
one
49.7
32.9
76.4
84.1
96.5
3.5
3408
Prim
ary
46.4
35.4
67.3
76.9
95.9
4.1
639
Educ
atio
n Se
cond
ary
+ 31
.845
.445
.861
.788
.111
.910
92Po
ores
t 40
.132
.279
.783
.696
.53.
569
0S
econ
d 50
.529
.076
.983
.896
.13.
984
4M
iddl
e 52
.330
.479
.984
.496
.63.
498
2Fo
urth
53
.335
.072
.679
.795
.34.
711
72
Wea
lth
inde
x qu
intil
es
Ric
hest
34
.446
.048
.468
.191
.28.
814
69C
hris
tian
31.8
38.4
57.4
70.1
90.9
9.1
1146
Rel
igio
n of
H
ouse
hold
H
ead
Mus
lim
49.3
35.2
71.9
80.8
95.7
4.3
3998
Tota
l 45
.535
.968
.778
.594
.75.
351
57*
MIC
S In
dica
tor 8
6
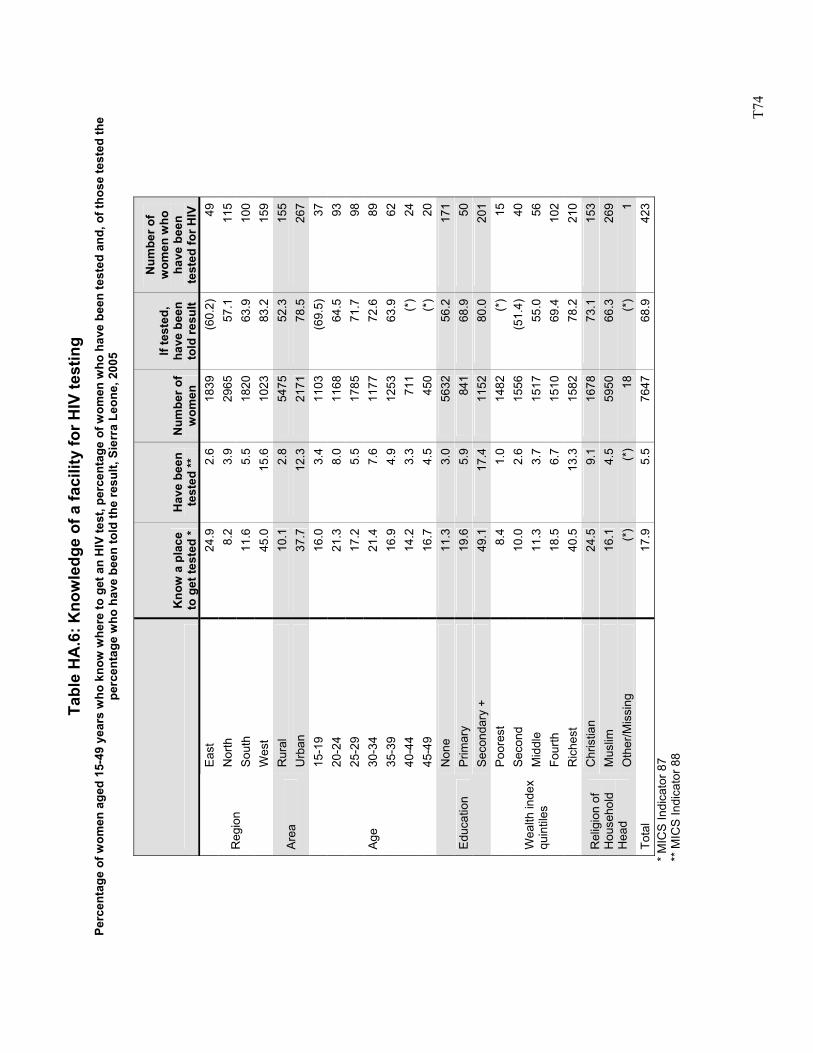
T7
4
Tabl
e H
A.6
: Kno
wle
dge
of a
faci
lity
for H
IV te
stin
g Pe
rcen
tage
of w
omen
age
d 15
-49
year
s w
ho k
now
whe
re to
get
an
HIV
test
, per
cent
age
of w
omen
who
hav
e be
en te
sted
and
, of t
hose
test
ed th
e pe
rcen
tage
who
hav
e be
en to
ld th
e re
sult,
Sie
rra
Leon
e, 2
005
K
now
a p
lace
to
get
test
ed *
Hav
e be
en
test
ed **
N
umbe
r of
wom
en
If te
sted
, ha
ve b
een
told
resu
lt
Num
ber o
f w
omen
who
ha
ve b
een
test
ed fo
r HIV
Ea
st
24.9
2.6
1839
(60.
2)49
Nor
th
8.2
3.9
2965
57.1
115
Sout
h 11
.65.
518
2063
.910
0R
egio
n
Wes
t 45
.015
.610
2383
.215
9R
ural
10
.12.
854
7552
.315
5Ar
ea
Urb
an
37.7
12.3
2171
78.5
267
15-1
9 16
.03.
411
03(6
9.5)
3720
-24
21.3
8.0
1168
64.5
9325
-29
17.2
5.5
1785
71.7
9830
-34
21.4
7.6
1177
72.6
8935
-39
16.9
4.9
1253
63.9
6240
-44
14.2
3.3
711
(*)
24
Age
45-4
9 16
.74.
545
0(*
)20
Non
e 11
.33.
056
3256
.217
1P
rimar
y 19
.65.
984
168
.950
Educ
atio
n Se
cond
ary
+ 49
.117
.411
5280
.020
1Po
ores
t 8.
41.
014
82(*
)15
Sec
ond
10.0
2.6
1556
(51.
4)40
Mid
dle
11.3
3.7
1517
55.0
56Fo
urth
18
.56.
715
1069
.410
2
Wea
lth in
dex
quin
tiles
Ric
hest
40
.513
.315
8278
.221
0C
hris
tian
24.5
9.1
1678
73.1
153
Mus
lim
16.1
4.5
5950
66.3
269
Rel
igio
n of
H
ouse
hold
H
ead
Oth
er/M
issi
ng
(*)
(*)
18(*
)1
Tota
l 17
.95.
576
4768
.942
3
*
MIC
S In
dica
tor 8
7
**
MIC
S In
dica
tor 8
8
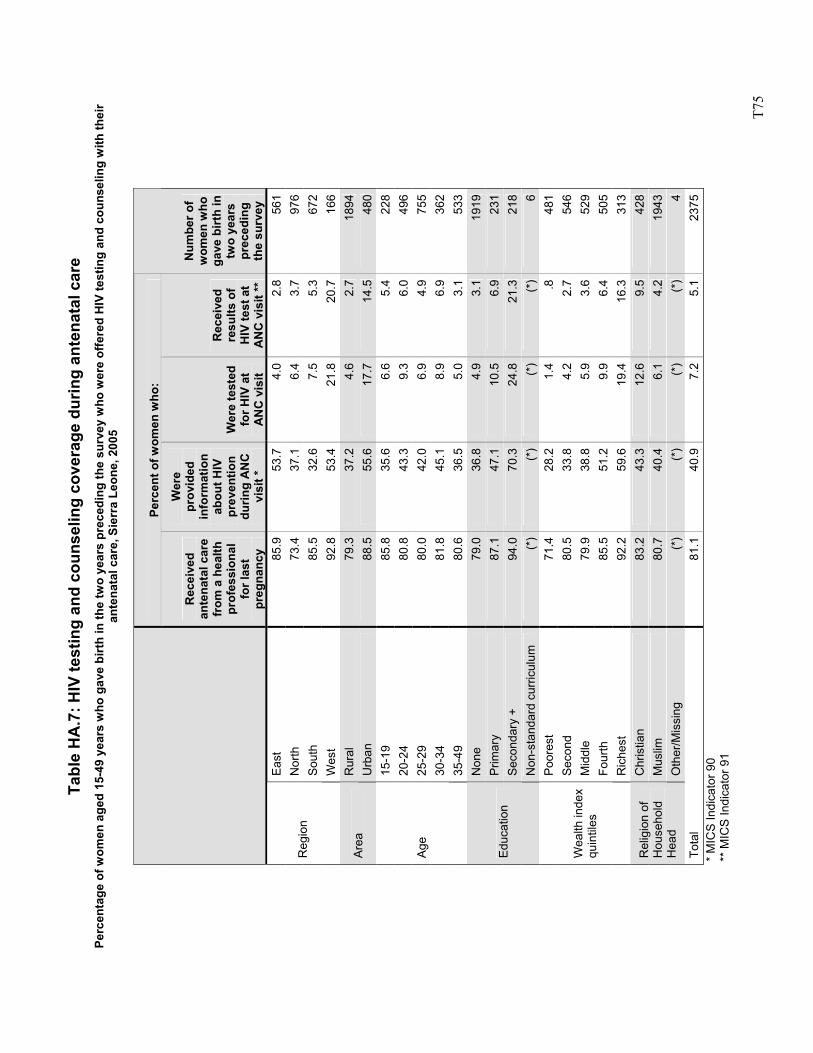
T7
5
Tabl
e H
A.7
: HIV
test
ing
and
coun
selin
g co
vera
ge d
urin
g an
tena
tal c
are
Perc
enta
ge o
f wom
en a
ged
15-4
9 ye
ars
who
gav
e bi
rth
in th
e tw
o ye
ars
prec
edin
g th
e su
rvey
who
wer
e of
fere
d H
IV te
stin
g an
d co
unse
ling
with
thei
r an
tena
tal c
are,
Sie
rra
Leon
e, 2
005
Perc
ent o
f wom
en w
ho:
Rec
eive
d an
tena
tal c
are
from
a h
ealth
pr
ofes
sion
al
for l
ast
preg
nanc
y
Wer
e pr
ovid
ed
info
rmat
ion
abou
t HIV
pr
even
tion
durin
g A
NC
vi
sit *
Wer
e te
sted
fo
r HIV
at
AN
C v
isit
Rec
eive
d re
sults
of
HIV
test
at
AN
C v
isit
**
Num
ber o
f w
omen
who
ga
ve b
irth
in
two
year
s pr
eced
ing
the
surv
ey
East
85
.953
.74.
02.
856
1N
orth
73
.437
.16.
43.
797
6So
uth
85.5
32.6
7.5
5.3
672
Reg
ion
Wes
t 92
.853
.421
.820
.716
6R
ural
79
.337
.24.
62.
718
94Ar
ea
Urb
an
88.5
55.6
17.7
14.5
480
15-1
9 85
.835
.66.
65.
422
820
-24
80.8
43.3
9.3
6.0
496
25-2
9 80
.042
.06.
94.
975
530
-34
81.8
45.1
8.9
6.9
362
Age
35-4
9 80
.636
.55.
03.
153
3N
one
79.0
36.8
4.9
3.1
1919
Prim
ary
87.1
47.1
10.5
6.9
231
Seco
ndar
y +
94.0
70.3
24.8
21.3
218
Educ
atio
n
Non
-sta
ndar
d cu
rricu
lum
(*
)(*
)(*
)(*
)6
Poor
est
71.4
28.2
1.4
.848
1S
econ
d 80
.533
.84.
22.
754
6M
iddl
e 79
.938
.85.
93.
652
9Fo
urth
85
.551
.29.
96.
450
5
Wea
lth in
dex
quin
tiles
Ric
hest
92
.259
.619
.416
.331
3C
hris
tian
83.2
43.3
12.6
9.5
428
Mus
lim
80.7
40.4
6.1
4.2
1943
Rel
igio
n of
H
ouse
hold
H
ead
Oth
er/M
issi
ng
(*)
(*)
(*)
(*)
4To
tal
81.1
40.9
7.2
5.1
2375
* M
ICS
Indi
cato
r 90
** M
ICS
Indi
cato
r 91
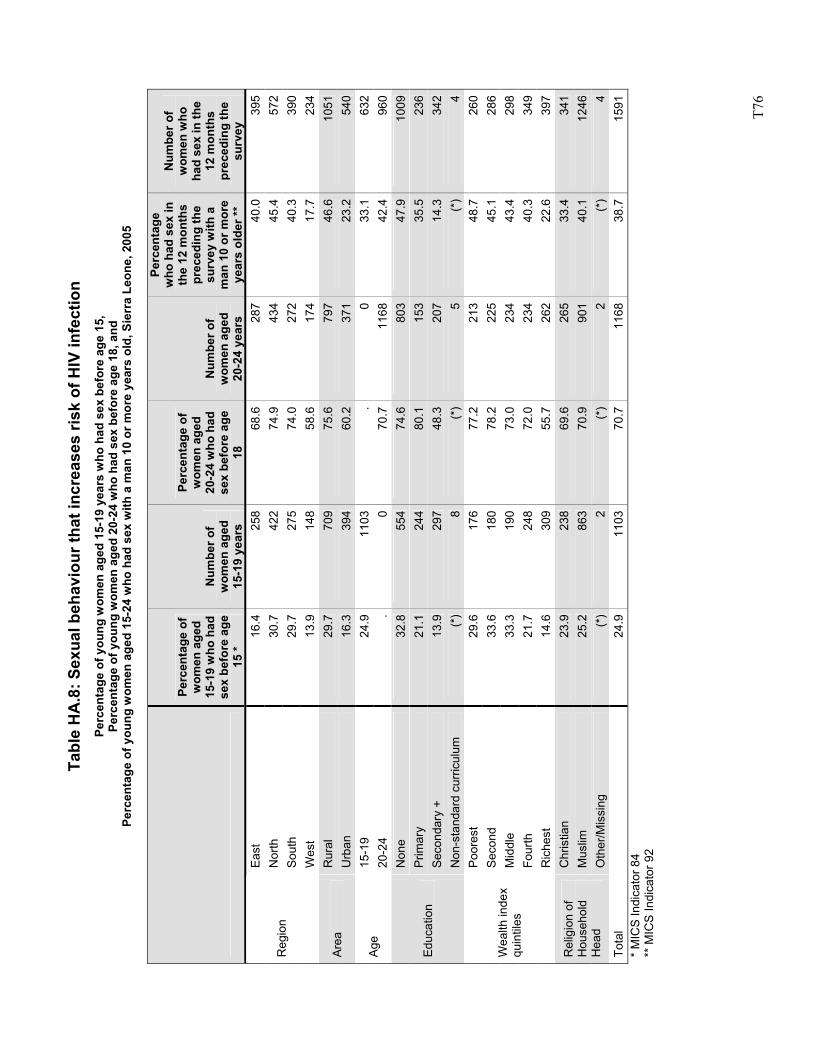
T7
6
Tabl
e H
A.8
: Sex
ual b
ehav
iour
that
incr
ease
s ris
k of
HIV
infe
ctio
n Pe
rcen
tage
of y
oung
wom
en a
ged
15-1
9 ye
ars
who
had
sex
bef
ore
age
15,
Perc
enta
ge o
f you
ng w
omen
age
d 20
-24
who
had
sex
bef
ore
age
18, a
nd
Perc
enta
ge o
f you
ng w
omen
age
d 15
-24
who
had
sex
with
a m
an 1
0 or
mor
e ye
ars
old,
Sie
rra
Leon
e, 2
005
Perc
enta
ge o
f w
omen
age
d 15
-19
who
had
se
x be
fore
age
15
*
Num
ber o
f w
omen
age
d 15
-19
year
s
Perc
enta
ge o
f w
omen
age
d 20
-24
who
had
se
x be
fore
age
18
Num
ber o
f w
omen
age
d 20
-24
year
s
Perc
enta
ge
who
had
sex
in
the
12 m
onth
s pr
eced
ing
the
surv
ey w
ith a
m
an 1
0 or
mor
e ye
ars
olde
r **
Num
ber o
f w
omen
who
ha
d se
x in
the
12 m
onth
s pr
eced
ing
the
surv
ey
East
16
.425
868
.6
287
40.0
395
Nor
th
30.7
422
74.9
43
445
.457
2So
uth
29.7
275
74.0
27
240
.339
0R
egio
n
Wes
t 13
.914
858
.6
174
17.7
234
Rur
al
29.7
709
75.6
79
746
.610
51Ar
ea
Urb
an
16.3
394
60.2
37
123
.254
015
-19
24.9
1103
. 0
33.1
632
Age
20-2
4 .
070
.7
1168
42.4
960
Non
e 32
.855
474
.6
803
47.9
1009
Prim
ary
21.1
244
80.1
15
335
.523
6Se
cond
ary
+ 13
.929
748
.3
207
14.3
342
Educ
atio
n
Non
-sta
ndar
d cu
rricu
lum
(*
)8
(*)
5(*
)4
Poor
est
29.6
176
77.2
21
348
.726
0S
econ
d 33
.618
078
.2
225
45.1
286
Mid
dle
33.3
190
73.0
23
443
.429
8Fo
urth
21
.724
872
.0
234
40.3
349
Wea
lth in
dex
quin
tiles
Ric
hest
14
.630
955
.7
262
22.6
397
Chr
istia
n 23
.923
869
.6
265
33.4
341
Mus
lim
25.2
863
70.9
90
140
.112
46R
elig
ion
of
Hou
seho
ld
Hea
d O
ther
/Mis
sing
(*
)2
(*)
2(*
)4
Tota
l 24
.911
0370
.7
1168
38.7
1591
* M
ICS
Indi
cato
r 84
** M
ICS
Indi
cato
r 92
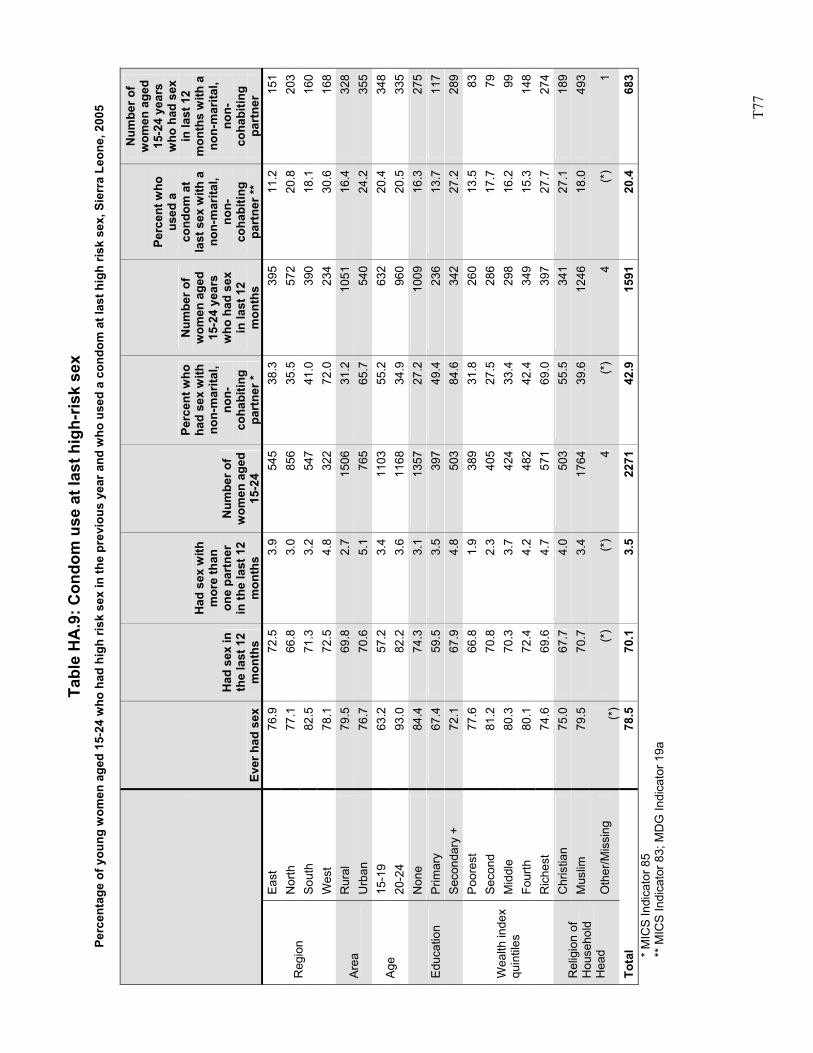
T7
7
Tabl
e H
A.9
: Con
dom
use
at l
ast h
igh-
risk
sex
Perc
enta
ge o
f you
ng w
omen
age
d 15
-24
who
had
hig
h ris
k se
x in
the
prev
ious
yea
r and
who
use
d a
cond
om a
t las
t hig
h ris
k se
x, S
ierr
a Le
one,
200
5
Ever
had
sex
Had
sex
in
the
last
12
mon
ths
Had
sex
with
m
ore
than
on
e pa
rtne
r in
the
last
12
mon
ths
Num
ber o
f w
omen
age
d 15
-24
Perc
ent w
ho
had
sex
with
no
n-m
arita
l, no
n-co
habi
ting
part
ner *
Num
ber o
f w
omen
age
d 15
-24
year
s w
ho h
ad s
ex
in la
st 1
2 m
onth
s
Perc
ent w
ho
used
a
cond
om a
t la
st s
ex w
ith a
no
n-m
arita
l, no
n-co
habi
ting
part
ner *
*
Num
ber o
f w
omen
age
d 15
-24
year
s w
ho h
ad s
ex
in la
st 1
2 m
onth
s w
ith a
no
n-m
arita
l, no
n-co
habi
ting
part
ner
East
76
.972
.53.
954
538
.339
511
.215
1N
orth
77
.166
.83.
085
635
.557
220
.820
3So
uth
82.5
71.3
3.2
547
41.0
390
18.1
160
Reg
ion
Wes
t 78
.172
.54.
832
272
.023
430
.616
8R
ural
79
.569
.82.
715
0631
.210
5116
.432
8Ar
ea
Urb
an
76.7
70.6
5.1
765
65.7
540
24.2
355
15-1
9 63
.257
.23.
411
0355
.263
220
.434
8Ag
e 20
-24
93.0
82.2
3.6
1168
34.9
960
20.5
335
Non
e 84
.474
.33.
113
5727
.210
0916
.327
5P
rimar
y 67
.459
.53.
539
749
.423
613
.711
7Ed
ucat
ion
Seco
ndar
y +
72.1
67.9
4.8
503
84.6
342
27.2
289
Poor
est
77.6
66.8
1.9
389
31.8
260
13.5
83S
econ
d 81
.270
.82.
340
527
.528
617
.779
Mid
dle
80.3
70.3
3.7
424
33.4
298
16.2
99Fo
urth
80
.172
.44.
248
242
.434
915
.314
8
Wea
lth in
dex
quin
tiles
Ric
hest
74
.669
.64.
757
169
.039
727
.727
4C
hris
tian
75.0
67.7
4.0
503
55.5
341
27.1
189
Mus
lim
79.5
70.7
3.4
1764
39.6
1246
18.0
493
Rel
igio
n of
H
ouse
hold
H
ead
Oth
er/M
issi
ng
(*)
(*)
(*)
4(*
)4
(*)
1
Tota
l 78
.570
.13.
522
7142
.915
9120
.468
3*
MIC
S In
dica
tor 8
5 **
MIC
S In
dica
tor 8
3; M
DG
Indi
cato
r 19a
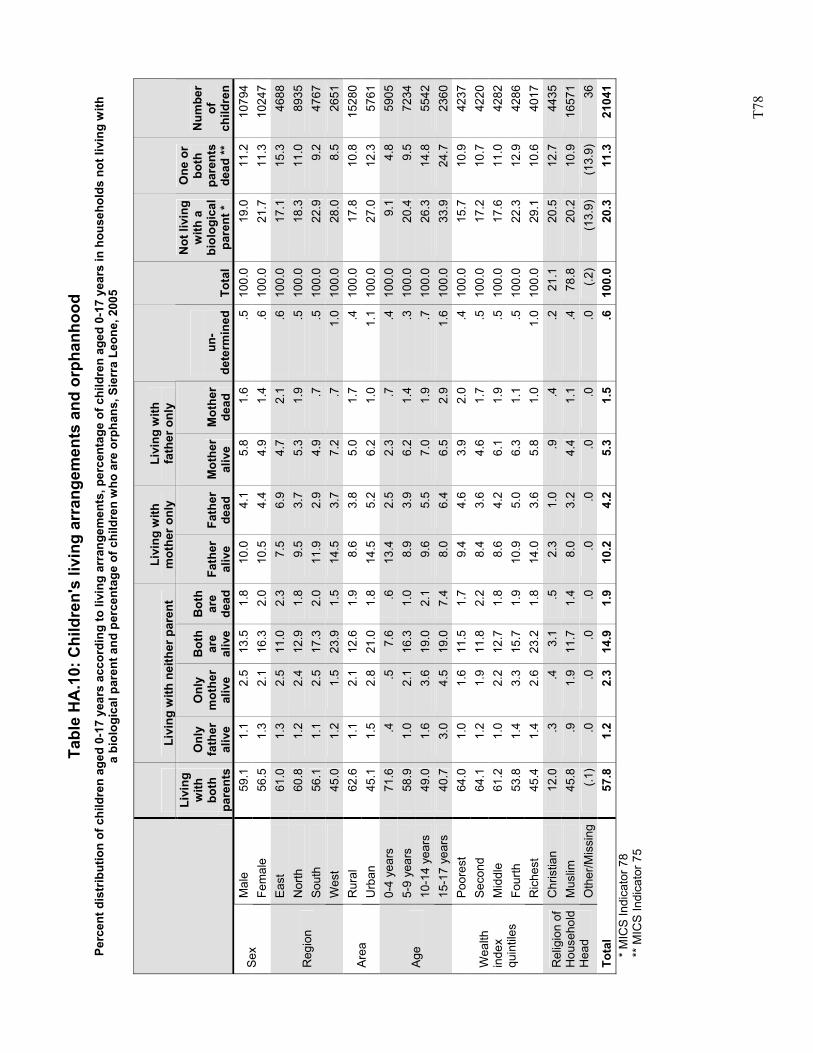
T7
8
Tabl
e H
A.1
0: C
hild
ren'
s liv
ing
arra
ngem
ents
and
orp
hanh
ood
Perc
ent d
istr
ibut
ion
of c
hild
ren
aged
0-1
7 ye
ars
acco
rdin
g to
livi
ng a
rran
gem
ents
, per
cent
age
of c
hild
ren
aged
0-1
7 ye
ars
in h
ouse
hold
s no
t liv
ing
with
a
biol
ogic
al p
aren
t and
per
cent
age
of c
hild
ren
who
are
orp
hans
, Sie
rra
Leon
e, 2
005
Li
ving
with
nei
ther
par
ent
Livi
ng w
ith
mot
her o
nly
Livi
ng w
ith
fath
er o
nly
Livi
ng
with
bo
th
pare
nts
Onl
y fa
ther
al
ive
Onl
y m
othe
r al
ive
Bot
h ar
e al
ive
Bot
h ar
e de
adFa
ther
al
ive
Fath
er
dead
M
othe
r al
ive
Mot
her
dead
un
-de
term
ined
Tota
l
Not
livi
ng
with
a
biol
ogic
al
pare
nt *
One
or
both
pa
rent
s de
ad **
Num
ber
of
child
ren
Mal
e 59
.1
1.1
2.5
13.5
1.8
10.0
4.1
5.8
1.6
.510
0.0
19.0
11.2
1079
4Se
x Fe
mal
e 56
.5
1.3
2.1
16.3
2.0
10.5
4.4
4.9
1.4
.610
0.0
21.7
11.3
1024
7Ea
st
61.0
1.
32.
511
.02.
37.
56.
94.
7 2.
1.6
100.
017
.115
.346
88N
orth
60
.8
1.2
2.4
12.9
1.8
9.5
3.7
5.3
1.9
.510
0.0
18.3
11.0
8935
Sout
h 56
.1
1.1
2.5
17.3
2.0
11.9
2.9
4.9
.7.5
100.
022
.99.
247
67R
egio
n
Wes
t 45
.0
1.2
1.5
23.9
1.5
14.5
3.7
7.2
.71.
010
0.0
28.0
8.5
2651
Rur
al
62.6
1.
12.
112
.61.
98.
63.
85.
0 1.
7.4
100.
017
.810
.815
280
Area
U
rban
45
.1
1.5
2.8
21.0
1.8
14.5
5.2
6.2
1.0
1.1
100.
027
.012
.357
610-
4 ye
ars
71.6
.4
.57.
6.6
13.4
2.5
2.3
.7.4
100.
09.
14.
859
055-
9 ye
ars
58.9
1.
02.
116
.31.
08.
93.
96.
2 1.
4.3
100.
020
.49.
572
3410
-14
year
s 49
.0
1.6
3.6
19.0
2.1
9.6
5.5
7.0
1.9
.710
0.0
26.3
14.8
5542
Age
15-1
7 ye
ars
40.7
3.
04.
519
.07.
48.
06.
46.
5 2.
91.
610
0.0
33.9
24.7
2360
Poor
est
64.0
1.
01.
611
.51.
79.
44.
63.
9 2.
0.4
100.
015
.710
.942
37S
econ
d 64
.1
1.2
1.9
11.8
2.2
8.4
3.6
4.6
1.7
.510
0.0
17.2
10.7
4220
Mid
dle
61.2
1.
02.
212
.71.
88.
64.
26.
1 1.
9.5
100.
017
.611
.042
82Fo
urth
53
.8
1.4
3.3
15.7
1.9
10.9
5.0
6.3
1.1
.510
0.0
22.3
12.9
4286
Wea
lth
inde
x qu
intil
es
Ric
hest
45
.4
1.4
2.6
23.2
1.8
14.0
3.6
5.8
1.0
1.0
100.
029
.110
.640
17C
hris
tian
12.0
.3
.43.
1.5
2.3
1.0
.9
.4.2
21.1
20.5
12.7
4435
Mus
lim
45.8
.9
1.9
11.7
1.4
8.0
3.2
4.4
1.1
.478
.820
.210
.916
571
Rel
igio
n of
H
ouse
hold
H
ead
Oth
er/M
issi
ng
(.1)
.0.0
.0.0
.0.0
.0
.0.0
(.2)
(13.
9)(1
3.9)
36To
tal
57.8
1.
22.
314
.91.
910
.24.
25.
3 1.
5.6
100.
020
.311
.321
041
* M
ICS
Indi
cato
r 78
** M
ICS
Indi
cato
r 75
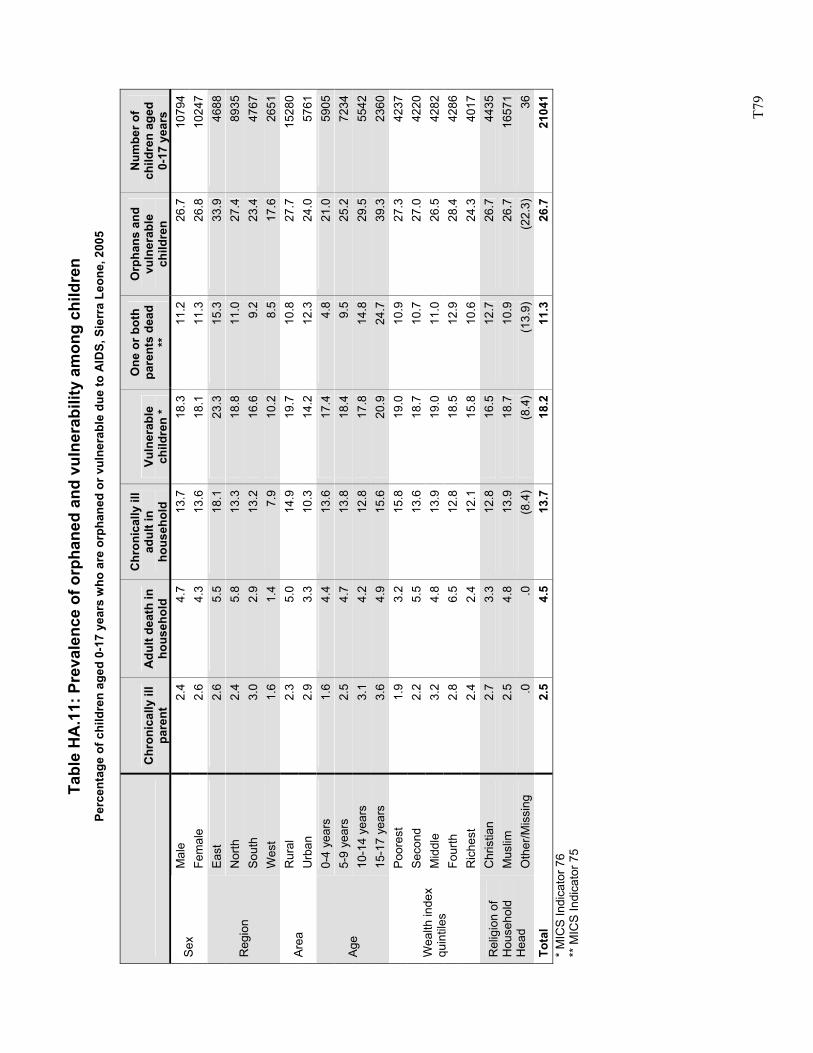
T7
9
Tabl
e H
A.1
1: P
reva
lenc
e of
orp
hane
d an
d vu
lner
abili
ty a
mon
g ch
ildre
n Pe
rcen
tage
of c
hild
ren
aged
0-1
7 ye
ars
who
are
orp
hane
d or
vul
nera
ble
due
to A
IDS,
Sie
rra
Leon
e, 2
005
C
hron
ical
ly il
l pa
rent
A
dult
deat
h in
ho
useh
old
Chr
onic
ally
ill
adul
t in
hous
ehol
d Vu
lner
able
ch
ildre
n *
One
or b
oth
pare
nts
dead
**
Orp
hans
and
vu
lner
able
ch
ildre
n
Num
ber o
f ch
ildre
n ag
ed
0-17
yea
rs
Mal
e 2.
44.
713
.718
.311
.226
.710
794
Sex
Fem
ale
2.6
4.3
13.6
18.1
11.3
26.8
1024
7Ea
st
2.6
5.5
18.1
23.3
15.3
33.9
4688
Nor
th
2.4
5.8
13.3
18.8
11.0
27.4
8935
Sout
h 3.
02.
913
.216
.69.
223
.447
67R
egio
n
Wes
t 1.
61.
47.
910
.28.
517
.626
51R
ural
2.
35.
014
.919
.710
.827
.715
280
Area
U
rban
2.
93.
310
.314
.212
.324
.057
610-
4 ye
ars
1.6
4.4
13.6
17.4
4.8
21.0
5905
5-9
year
s 2.
54.
713
.818
.49.
525
.272
3410
-14
year
s 3.
14.
212
.817
.814
.829
.555
42Ag
e
15-1
7 ye
ars
3.6
4.9
15.6
20.9
24.7
39.3
2360
Poor
est
1.9
3.2
15.8
19.0
10.9
27.3
4237
Sec
ond
2.2
5.5
13.6
18.7
10.7
27.0
4220
Mid
dle
3.2
4.8
13.9
19.0
11.0
26.5
4282
Four
th
2.8
6.5
12.8
18.5
12.9
28.4
4286
Wea
lth in
dex
quin
tiles
Ric
hest
2.
42.
412
.115
.810
.624
.340
17C
hris
tian
2.7
3.3
12.8
16.5
12.7
26.7
4435
Mus
lim
2.5
4.8
13.9
18.7
10.9
26.7
1657
1R
elig
ion
of
Hou
seho
ld
Hea
d O
ther
/Mis
sing
.0
.0(8
.4)
(8.4
)(1
3.9)
(22.
3)36
Tota
l 2.
54.
513
.718
.211
.326
.721
041
* M
ICS
Indi
cato
r 76
** M
ICS
Indi
cato
r 75
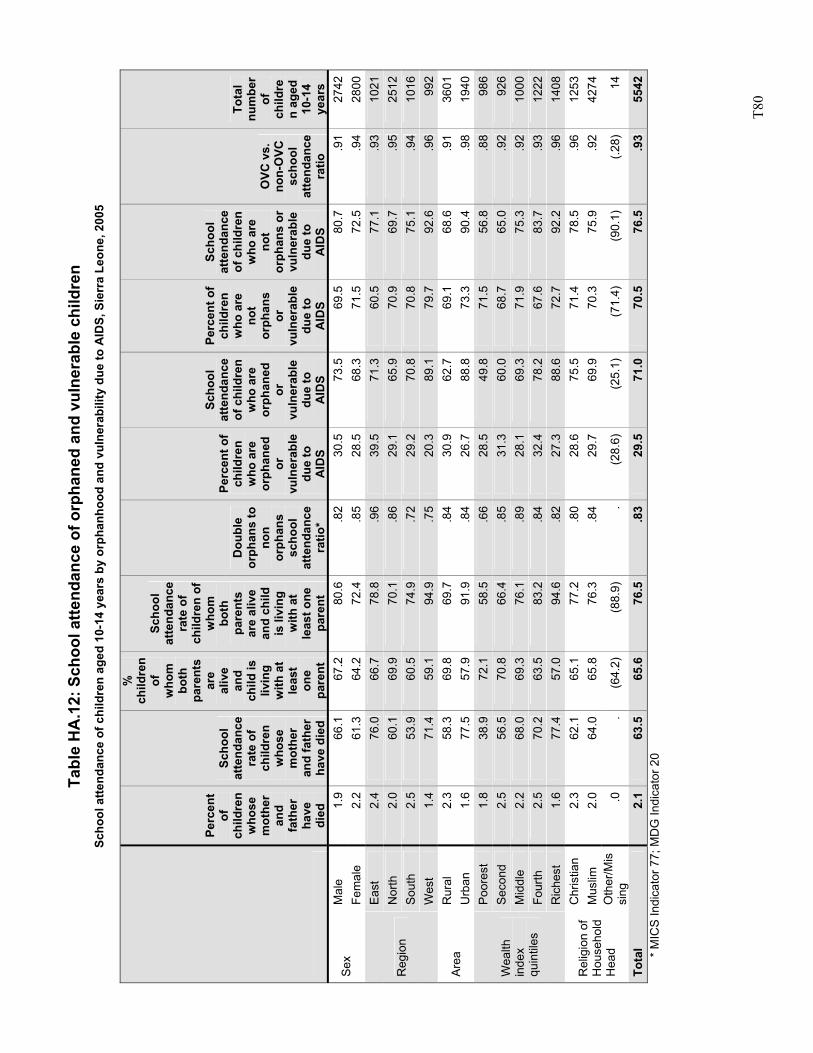
T8
0
Tabl
e H
A.1
2: S
choo
l atte
ndan
ce o
f orp
hane
d an
d vu
lner
able
chi
ldre
n Sc
hool
atte
ndan
ce o
f chi
ldre
n ag
ed 1
0-14
yea
rs b
y or
phan
hood
and
vul
nera
bilit
y du
e to
AID
S, S
ierr
a Le
one,
200
5
Perc
ent
of
child
ren
who
se
mot
her
and
fath
er
have
di
ed
Scho
ol
atte
ndan
ce
rate
of
child
ren
who
se
mot
her
and
fath
er
have
die
d
%
child
ren
of
who
m
both
pa
rent
s ar
e al
ive
and
child
is
livin
g w
ith a
t le
ast
one
pare
nt
Scho
ol
atte
ndan
ce
rate
of
child
ren
of
who
m
both
pa
rent
s ar
e al
ive
and
child
is
livi
ng
with
at
leas
t one
pa
rent
Dou
ble
orph
ans
to
non
orph
ans
scho
ol
atte
ndan
ce
ratio
*
Perc
ent o
f ch
ildre
n w
ho a
re
orph
aned
or
vu
lner
able
du
e to
A
IDS
Scho
ol
atte
ndan
ce
of c
hild
ren
who
are
or
phan
ed
or
vuln
erab
le
due
to
AID
S
Perc
ent o
f ch
ildre
n w
ho a
re
not
orph
ans
or
vuln
erab
le
due
to
AID
S
Scho
ol
atte
ndan
ce
of c
hild
ren
who
are
no
t or
phan
s or
vu
lner
able
du
e to
A
IDS
OVC
vs.
no
n-O
VC
scho
ol
atte
ndan
ce
ratio
Tota
l nu
mbe
r of
ch
ildre
n ag
ed
10-1
4 ye
ars
Mal
e 1.
9 66
.167
.280
.6.8
230
.5
73.5
69.5
80.7
.91
2742
Sex
Fem
ale
2.2
61.3
64.2
72.4
.85
28.5
68
.371
.572
.5.9
428
00Ea
st
2.4
76.0
66.7
78.8
.96
39.5
71
.360
.577
.1.9
310
21N
orth
2.
0 60
.169
.970
.1.8
629
.1
65.9
70.9
69.7
.95
2512
Sout
h 2.
5 53
.960
.574
.9.7
229
.2
70.8
70.8
75.1
.94
1016
Reg
ion
Wes
t 1.
4 71
.459
.194
.9.7
520
.3
89.1
79.7
92.6
.96
992
Rur
al
2.3
58.3
69.8
69.7
.84
30.9
62
.769
.168
.6.9
136
01Ar
ea
Urb
an
1.6
77.5
57.9
91.9
.84
26.7
88
.873
.390
.4.9
819
40Po
ores
t 1.
8 38
.972
.158
.5.6
628
.5
49.8
71.5
56.8
.88
986
Sec
ond
2.5
56.5
70.8
66.4
.85
31.3
60
.068
.765
.0.9
292
6M
iddl
e 2.
2 68
.069
.376
.1.8
928
.1
69.3
71.9
75.3
.92
1000
Four
th
2.5
70.2
63.5
83.2
.84
32.4
78
.267
.683
.7.9
312
22
Wea
lth
inde
x qu
intil
es
Ric
hest
1.
6 77
.457
.094
.6.8
227
.3
88.6
72.7
92.2
.96
1408
Chr
istia
n 2.
3 62
.165
.177
.2.8
028
.6
75.5
71.4
78.5
.96
1253
Mus
lim
2.0
64.0
65.8
76.3
.84
29.7
69
.970
.375
.9.9
242
74R
elig
ion
of
Hou
seho
ld
Hea
d O
ther
/Mis
sing
.0
.
(64.
2)(8
8.9)
.(2
8.6)
(2
5.1)
(71.
4)(9
0.1)
(.28)
14
Tota
l 2.
1 63
.565
.676
.5.8
329
.5
71.0
70.5
76.5
.93
5542
* M
ICS
Indi
cato
r 77;
MD
G In
dica
tor 2
0
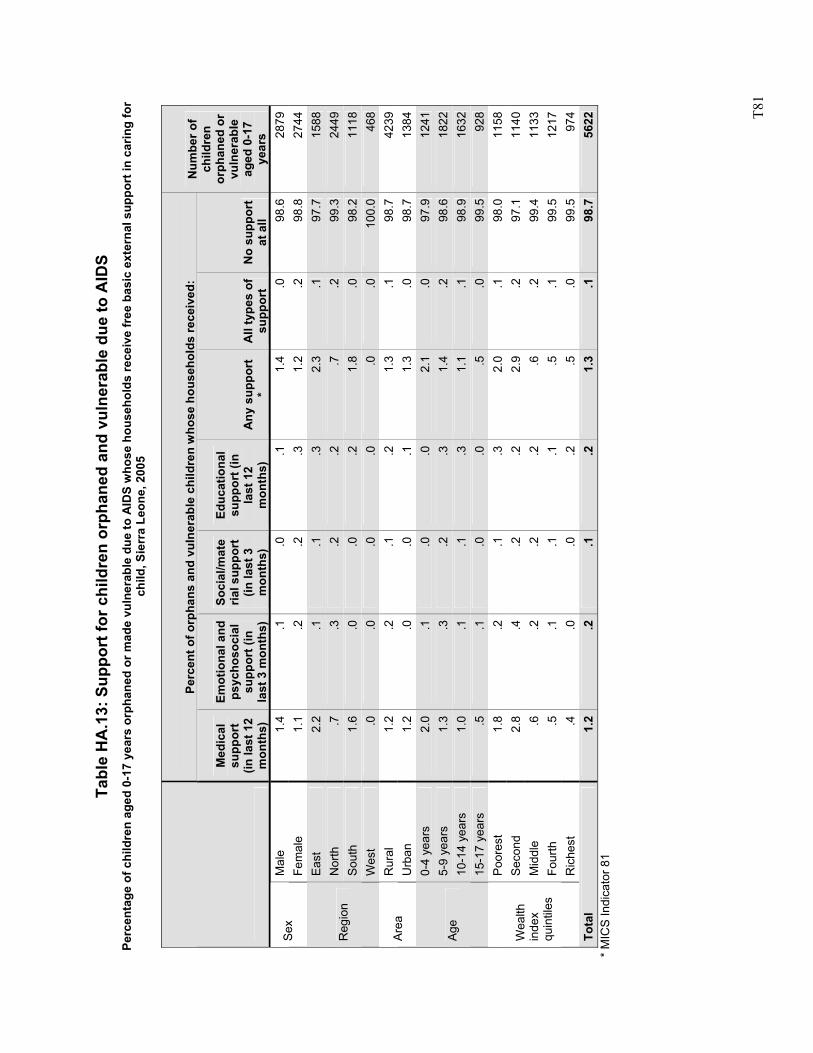
T8
1
Ta
ble
HA
.13:
Sup
port
for c
hild
ren
orph
aned
and
vul
nera
ble
due
to A
IDS
Perc
enta
ge o
f chi
ldre
n ag
ed 0
-17
year
s or
phan
ed o
r mad
e vu
lner
able
due
to A
IDS
who
se h
ouse
hold
s re
ceiv
e fr
ee b
asic
ext
erna
l sup
port
in c
arin
g fo
r ch
ild, S
ierr
a Le
one,
200
5
Perc
ent o
f orp
hans
and
vul
nera
ble
child
ren
who
se h
ouse
hold
s re
ceiv
ed:
Med
ical
su
ppor
t (in
last
12
mon
ths)
Emot
iona
l and
ps
ycho
soci
al
supp
ort (
in
last
3 m
onth
s)
Soci
al/m
ate
rial s
uppo
rt
(in la
st 3
m
onth
s)
Educ
atio
nal
supp
ort (
in
last
12
mon
ths)
A
ny s
uppo
rt
* A
ll ty
pes
of
supp
ort
No
supp
ort
at a
ll
Num
ber o
f ch
ildre
n or
phan
ed o
r vu
lner
able
ag
ed 0
-17
year
s M
ale
1.4
.1.0
.11.
4.0
98.6
2879
Sex
Fem
ale
1.1
.2.2
.31.
2.2
98.8
2744
East
2.
2.1
.1.3
2.3
.197
.715
88N
orth
.7
.3.2
.2.7
.299
.324
49So
uth
1.6
.0.0
.21.
8.0
98.2
1118
Reg
ion
Wes
t .0
.0.0
.0.0
.010
0.0
468
Rur
al
1.2
.2.1
.21.
3.1
98.7
4239
Area
U
rban
1.
2.0
.0.1
1.3
.098
.713
840-
4 ye
ars
2.0
.1.0
.02.
1.0
97.9
1241
5-9
year
s 1.
3.3
.2.3
1.4
.298
.618
2210
-14
year
s 1.
0.1
.1.3
1.1
.198
.916
32Ag
e
15-1
7 ye
ars
.5.1
.0.0
.5.0
99.5
928
Poor
est
1.8
.2.1
.32.
0.1
98.0
1158
Sec
ond
2.8
.4.2
.22.
9.2
97.1
1140
Mid
dle
.6.2
.2.2
.6.2
99.4
1133
Four
th
.5.1
.1.1
.5.1
99.5
1217
Wea
lth
inde
x qu
intil
es
Ric
hest
.4
.0.0
.2.5
.099
.597
4To
tal
1.2
.2.1
.21.
3.1
98.7
5622
* M
ICS
Indi
cato
r 81
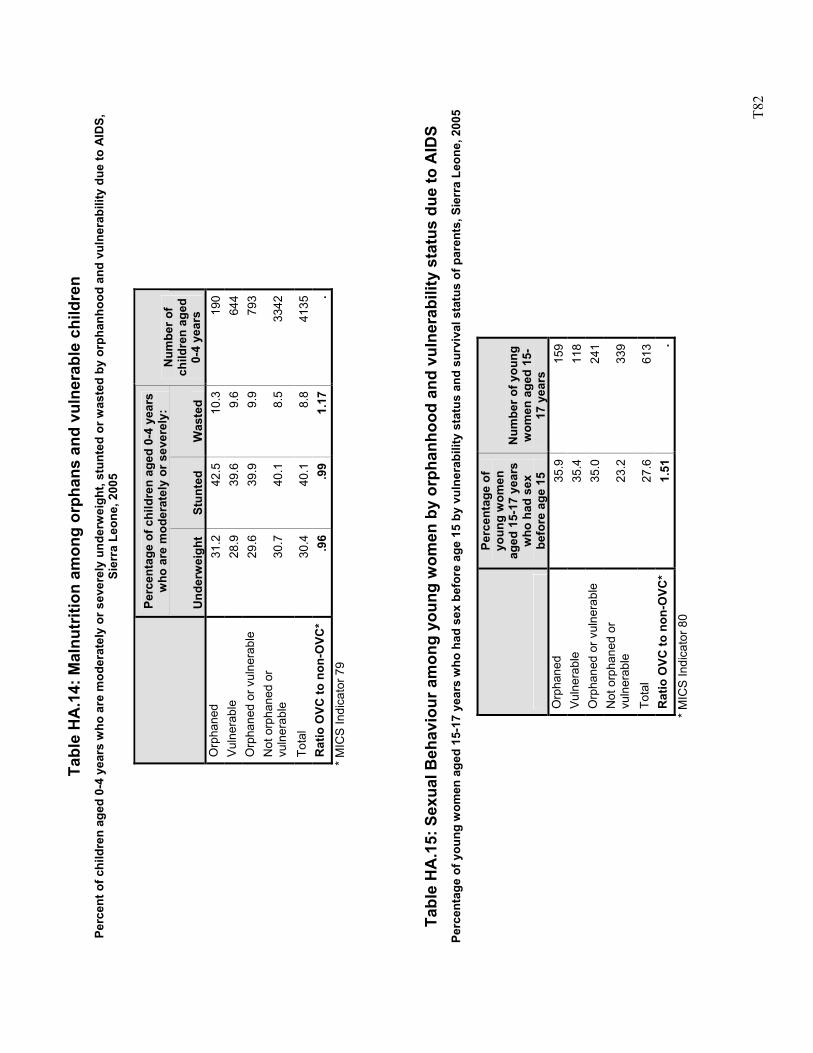
T8
2
Tabl
e H
A.1
4: M
alnu
triti
on a
mon
g or
phan
s an
d vu
lner
able
chi
ldre
n Pe
rcen
t of c
hild
ren
aged
0-4
yea
rs w
ho a
re m
oder
atel
y or
sev
erel
y un
derw
eigh
t, st
unte
d or
was
ted
by o
rpha
nhoo
d an
d vu
lner
abili
ty d
ue to
AID
S,
Sier
ra L
eone
, 200
5
Perc
enta
ge o
f chi
ldre
n ag
ed 0
-4 y
ears
w
ho a
re m
oder
atel
y or
sev
erel
y:
U
nder
wei
ght
Stun
ted
Was
ted
Num
ber o
f ch
ildre
n ag
ed
0-4
year
s O
rpha
ned
31.2
42.5
10.3
190
Vuln
erab
le
28.9
39.6
9.6
644
Orp
hane
d or
vul
nera
ble
29.6
39.9
9.9
793
Not
orp
hane
d or
vu
lner
able
30
.740
.18.
533
42
Tota
l 30
.440
.18.
841
35R
atio
OVC
to n
on-O
VC*
.96
.99
1.17
.
*
MIC
S In
dica
tor 7
9
Ta
ble
HA
.15:
Sex
ual B
ehav
iour
am
ong
youn
g w
omen
by
orph
anho
od a
nd v
ulne
rabi
lity
stat
us d
ue to
AID
S Pe
rcen
tage
of y
oung
wom
en a
ged
15-1
7 ye
ars
who
had
sex
bef
ore
age
15 b
y vu
lner
abili
ty s
tatu
s an
d su
rviv
al s
tatu
s of
par
ents
, Sie
rra
Leon
e, 2
005
Perc
enta
ge o
f yo
ung
wom
en
aged
15-
17 y
ears
w
ho h
ad s
ex
befo
re a
ge 1
5
Num
ber o
f you
ng
wom
en a
ged
15-
17 y
ears
O
rpha
ned
35.9
159
Vuln
erab
le
35.4
118
Orp
hane
d or
vul
nera
ble
35.0
241
Not
orp
hane
d or
vu
lner
able
23
.233
9
Tota
l 27
.661
3R
atio
OVC
to n
on-O
VC*
1.51
.
* M
ICS
Indi
cato
r 80

T83
Sierra Leone Multiple Indicator Cluster Survey
2005
Related Documents