Power Technology Issue 104 SIEMENS Siemens Energy, Inc. PSS ® E Test System for Voltage Collapse Analysis Leonardo T. G. Lima Principal Consultant [email protected] James W. Feltes Senior Manager Consulting [email protected] Introduction Voltage collapse is one of the major limitations in modern transmission systems. Quite often it is the most limiting factor preventing further increases in power transfers over existing transmission lines and interfaces. PSS ® E contains several activities that help the analysis of voltage collapse issues and the investigation of potential mitigation solutions after a voltage collapse condition is identified. The objectives of this paper are: provide a small system susceptible to voltage problems; describe the different voltage collapse conditions observed in this test system; and present the PSS ® E tools for investigating voltage collapse problems. This paper presents a relatively small system for the analysis of voltage collapse issues. It is based on the 1979 IEEE Reliability Test System [1], which was extended to represent multi-area systems in the 1996 version of the IEEE Reliability Test System [2]. However, the test system and associated data presented in this paper is related to the so-called “one area RTS-96” system [2], which is equivalent to the 1979 Reliability Test System [1]. Changes to the IEEE Reliability Test System Several modifications were introduced in the power flow data of the original 1979 IEEE Reliability Test System to make it more suitable for voltage stability/voltage collapse analysis. These changes were introduced to highlight different aspects of the problems related to voltage control and reactive power compensation. The following changes were introduced by Siemens PTI: 1. The synchronous condenser at bus 114 was replaced by a static VAR compensator (SVC) with the same nominal range (–50/+200 MVAr). In practice, the reactive power output of this device becomes voltage dependent and its maximum reactive power output is severely reduced under low voltage conditions. 2. The shunt at bus 106 was replaced by an SVC with a range of (-50/+100 MVAr). This change introduces one additional voltage control equipment that is quite important. This SVC is a key component in the proposed system data and is usually required to avoid voltage collapse during dynamic simulations. 3. The step-up transformers of generators and SVCs are explicitly represented in the case, assuming 5 tap positions and no OLTC. The generators are connected to the low voltage bus, assumed to be

Welcome message from author
This document is posted to help you gain knowledge. Please leave a comment to let me know what you think about it! Share it to your friends and learn new things together.
Transcript
Power Technology Issue 104
SIEMENS Siemens Energy, Inc.
PSS®E Test System for Voltage Collapse Analysis Leonardo T. G. Lima Principal Consultant [email protected]
James W. Feltes
Senior Manager Consulting [email protected]
Introduction
Voltage collapse is one of the major limitations in modern transmission systems. Quite often it is the most limiting factor preventing further increases in power transfers over existing transmission lines and interfaces.
PSS®E contains several activities that help the analysis of voltage collapse issues and the investigation of potential mitigation solutions after a voltage collapse condition is identified.
The objectives of this paper are:
provide a small system susceptible to voltage problems;
describe the different voltage collapse conditions observed in this test system; and
present the PSS®E tools for investigating voltage collapse problems.
This paper presents a relatively small system for the analysis of voltage collapse issues. It is based on the 1979 IEEE Reliability Test System [1], which was extended to represent multi-area systems in the 1996 version of the IEEE Reliability Test System [2]. However, the test system and associated data presented in this paper is related to the so-called “one area RTS-96” system [2], which is equivalent to the 1979 Reliability Test System [1].
Changes to the IEEE Reliability Test System
Several modifications were introduced in the power flow data of the original 1979 IEEE Reliability Test System to make it more suitable for voltage stability/voltage collapse analysis. These changes were introduced to highlight different aspects of the problems related to voltage control and reactive power compensation.
The following changes were introduced by Siemens PTI:
1. The synchronous condenser at bus 114 was replaced by a static VAR compensator (SVC) with the same nominal range (–50/+200 MVAr). In practice, the reactive power output of this device becomes voltage dependent and its maximum reactive power output is severely reduced under low voltage conditions.
2. The shunt at bus 106 was replaced by an SVC with a range of (-50/+100 MVAr). This change introduces one additional voltage control equipment that is quite important. This SVC is a key component in the proposed system data and is usually required to avoid voltage collapse during dynamic simulations.
3. The step-up transformers of generators and SVCs are explicitly represented in the case, assuming 5 tap positions and no OLTC. The generators are connected to the low voltage bus, assumed to be
Power Technology July 2009
Page 2
18 kV for all units. All generators remotely control the voltage at the high voltage side on their GSU in the power flow, while the SVCs control local (terminal) voltage.
4. All other transformers in the case are represented as +/- 10% OLTC transformers with 33 steps (0.625% per step). Tap changers are located on the high voltage side of the transformer. The OLTC controls the voltage at the low voltage side bus.
5. The loads are no longer directly connected to the 138 kV or 230 kV buses. Step-down transformers to 13.8 kV with an OLTC controlling their low voltage side are introduced with an estimated 15% reactance on an MVA base calculated by rounding up to the nearest multiple of 50 MVA 110% of the load apparent power.
6. The branch between buses 107 and 108 was converted to a double circuit to avoid islanding a group of buses under N-1 contingencies.
7. Line reactors were added to compensate the charging of the long underground cable between buses 106 and 110.
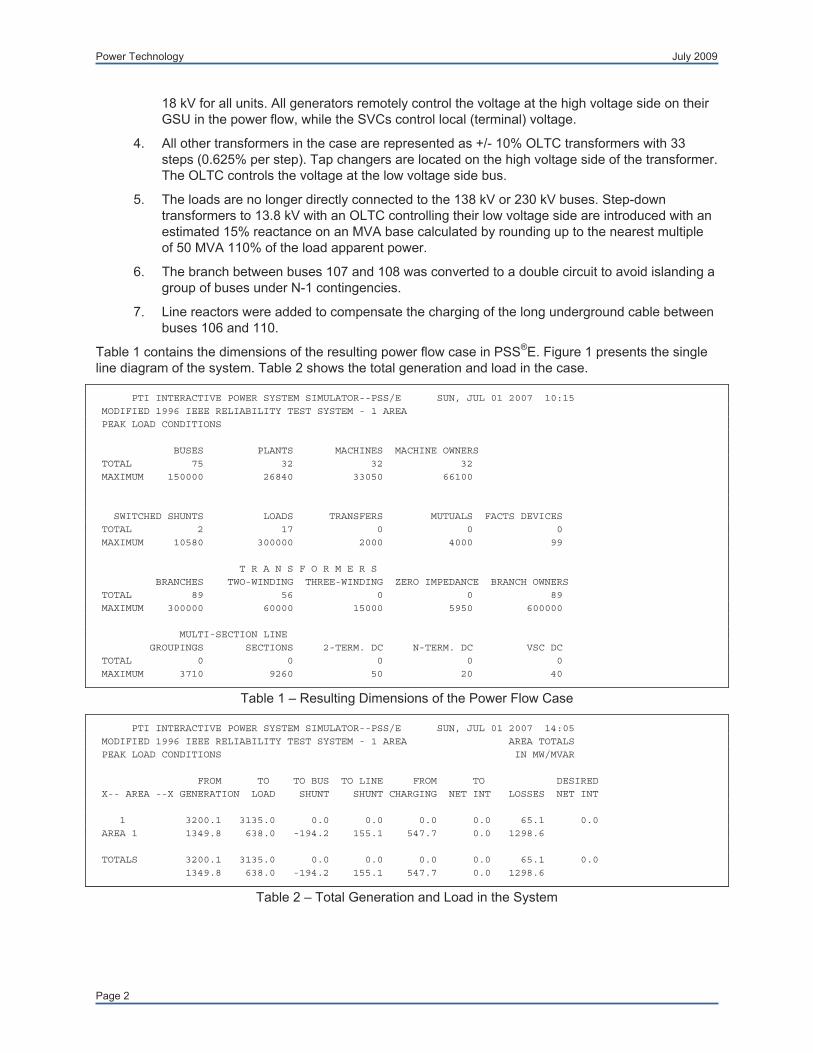
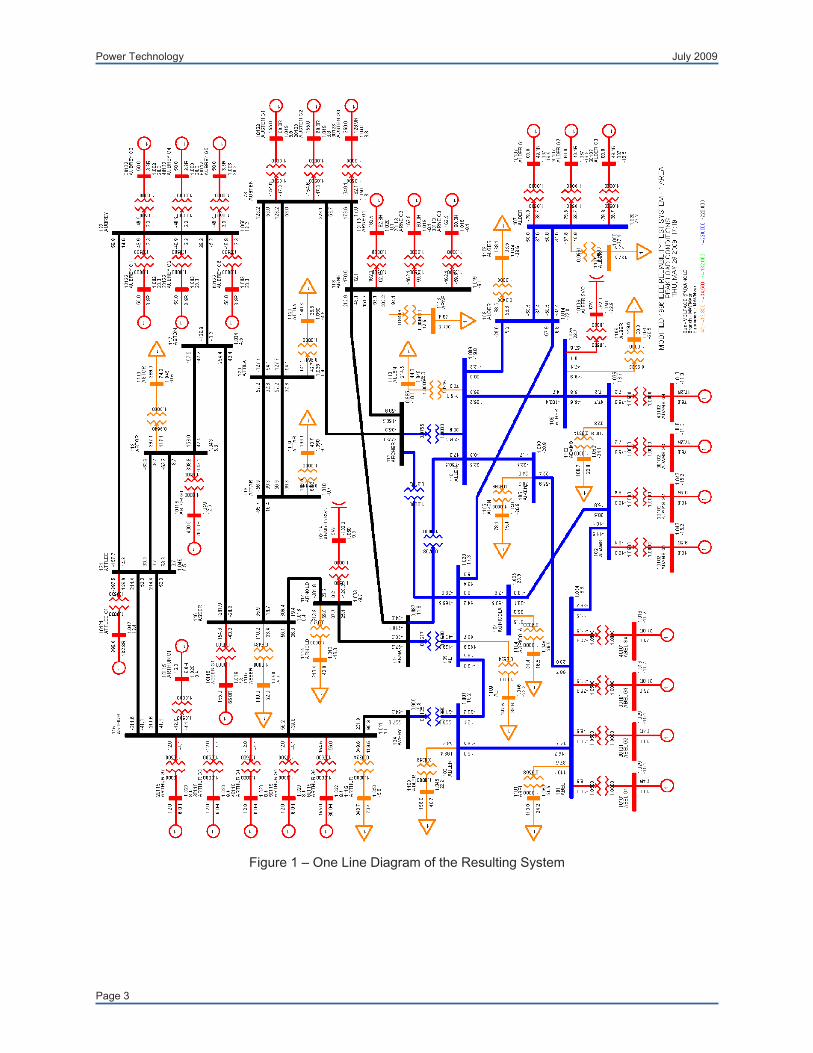
Table 1 contains the dimensions of the resulting power flow case in PSS®E. Figure 1 presents the single line diagram of the system. Table 2 shows the total generation and load in the case.
PTI INTERACTIVE POWER SYSTEM SIMULATOR--PSS/E SUN, JUL 01 2007 10:15
MODIFIED 1996 IEEE RELIABILITY TEST SYSTEM - 1 AREA
PEAK LOAD CONDITIONS
BUSES PLANTS MACHINES MACHINE OWNERS TOTAL 75 32 32 32
MAXIMUM 150000 26840 33050 66100
SWITCHED SHUNTS LOADS TRANSFERS MUTUALS FACTS DEVICES TOTAL 2 17 0 0 0
MAXIMUM 10580 300000 2000 4000 99
T R A N S F O R M E R S
BRANCHES TWO-WINDING THREE-WINDING ZERO IMPEDANCE BRANCH OWNERS TOTAL 89 56 0 0 89
MAXIMUM 300000 60000 15000 5950 600000
MULTI-SECTION LINE
GROUPINGS SECTIONS 2-TERM. DC N-TERM. DC VSC DC TOTAL 0 0 0 0 0
MAXIMUM 3710 9260 50 20 40
Table 1 – Resulting Dimensions of the Power Flow Case
PTI INTERACTIVE POWER SYSTEM SIMULATOR--PSS/E SUN, JUL 01 2007 14:05
MODIFIED 1996 IEEE RELIABILITY TEST SYSTEM - 1 AREA AREA TOTALS PEAK LOAD CONDITIONS IN MW/MVAR
FROM TO TO BUS TO LINE FROM TO DESIRED X-- AREA --X GENERATION LOAD SHUNT SHUNT CHARGING NET INT LOSSES NET INT
1 3200.1 3135.0 0.0 0.0 0.0 0.0 65.1 0.0
AREA 1 1349.8 638.0 -194.2 155.1 547.7 0.0 1298.6
TOTALS 3200.1 3135.0 0.0 0.0 0.0 0.0 65.1 0.0
1349.8 638.0 -194.2 155.1 547.7 0.0 1298.6
Table 2 – Total Generation and Load in the System
Power Technology July 2009
Page 3
Figure 1 – One Line Diagram of the Resulting System
Power Technology July 2009
Page 4
Power Flow Solution
The power flow solution was adjusted using the PSS®E Optimal Power Flow (OPF) to bring all voltages within normal range (1.05 to 0.95 pu). This OPF solution modified tap positions and generator scheduled voltages as compared to the original data of the IEEE Reliability Test System.
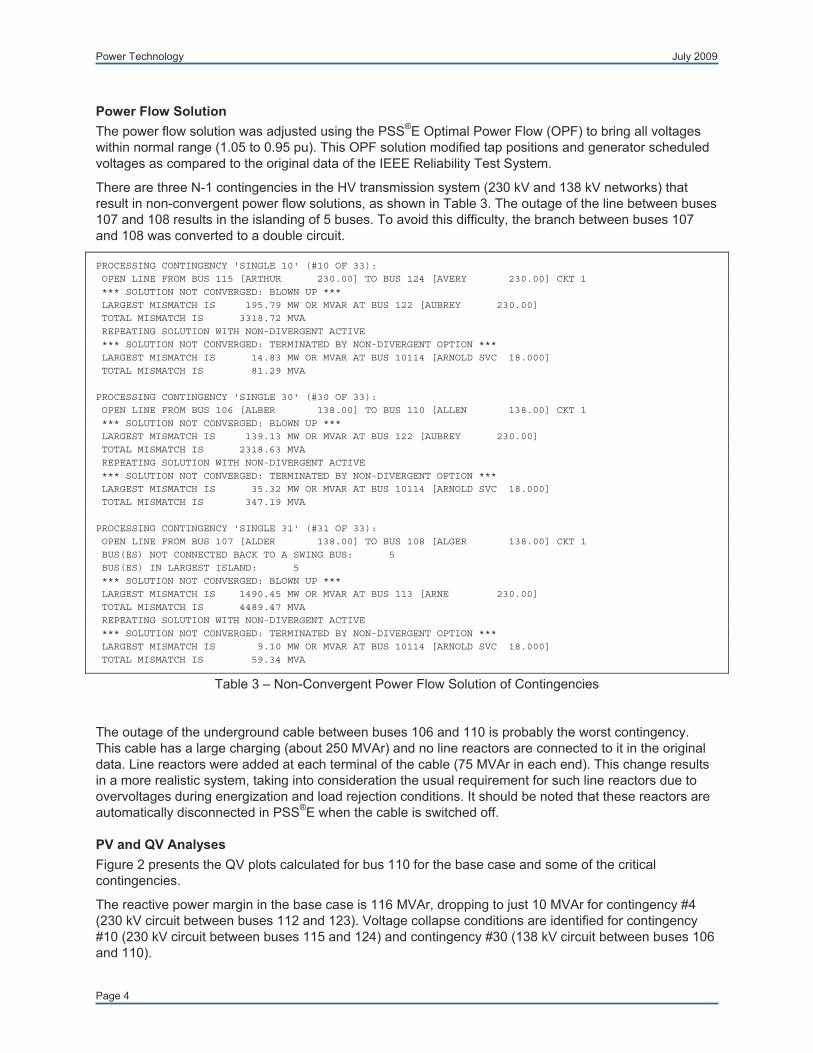
There are three N-1 contingencies in the HV transmission system (230 kV and 138 kV networks) that result in non-convergent power flow solutions, as shown in Table 3. The outage of the line between buses 107 and 108 results in the islanding of 5 buses. To avoid this difficulty, the branch between buses 107 and 108 was converted to a double circuit.
PROCESSING CONTINGENCY 'SINGLE 10' (#10 OF 33): OPEN LINE FROM BUS 115 [ARTHUR 230.00] TO BUS 124 [AVERY 230.00] CKT 1
*** SOLUTION NOT CONVERGED: BLOWN UP ***
LARGEST MISMATCH IS 195.79 MW OR MVAR AT BUS 122 [AUBREY 230.00] TOTAL MISMATCH IS 3318.72 MVA
REPEATING SOLUTION WITH NON-DIVERGENT ACTIVE *** SOLUTION NOT CONVERGED: TERMINATED BY NON-DIVERGENT OPTION ***
LARGEST MISMATCH IS 14.83 MW OR MVAR AT BUS 10114 [ARNOLD SVC 18.000]
TOTAL MISMATCH IS 81.29 MVA
PROCESSING CONTINGENCY 'SINGLE 30' (#30 OF 33): OPEN LINE FROM BUS 106 [ALBER 138.00] TO BUS 110 [ALLEN 138.00] CKT 1
*** SOLUTION NOT CONVERGED: BLOWN UP *** LARGEST MISMATCH IS 139.13 MW OR MVAR AT BUS 122 [AUBREY 230.00]
TOTAL MISMATCH IS 2318.63 MVA
REPEATING SOLUTION WITH NON-DIVERGENT ACTIVE *** SOLUTION NOT CONVERGED: TERMINATED BY NON-DIVERGENT OPTION ***
LARGEST MISMATCH IS 35.32 MW OR MVAR AT BUS 10114 [ARNOLD SVC 18.000] TOTAL MISMATCH IS 347.19 MVA
PROCESSING CONTINGENCY 'SINGLE 31' (#31 OF 33): OPEN LINE FROM BUS 107 [ALDER 138.00] TO BUS 108 [ALGER 138.00] CKT 1
BUS(ES) NOT CONNECTED BACK TO A SWING BUS: 5 BUS(ES) IN LARGEST ISLAND: 5
*** SOLUTION NOT CONVERGED: BLOWN UP *** LARGEST MISMATCH IS 1490.45 MW OR MVAR AT BUS 113 [ARNE 230.00]
TOTAL MISMATCH IS 4489.47 MVA
REPEATING SOLUTION WITH NON-DIVERGENT ACTIVE *** SOLUTION NOT CONVERGED: TERMINATED BY NON-DIVERGENT OPTION ***
LARGEST MISMATCH IS 9.10 MW OR MVAR AT BUS 10114 [ARNOLD SVC 18.000] TOTAL MISMATCH IS 59.34 MVA
Table 3 – Non-Convergent Power Flow Solution of Contingencies
The outage of the underground cable between buses 106 and 110 is probably the worst contingency. This cable has a large charging (about 250 MVAr) and no line reactors are connected to it in the original data. Line reactors were added at each terminal of the cable (75 MVAr in each end). This change results in a more realistic system, taking into consideration the usual requirement for such line reactors due to overvoltages during energization and load rejection conditions. It should be noted that these reactors are automatically disconnected in PSS®E when the cable is switched off.
PV and QV Analyses
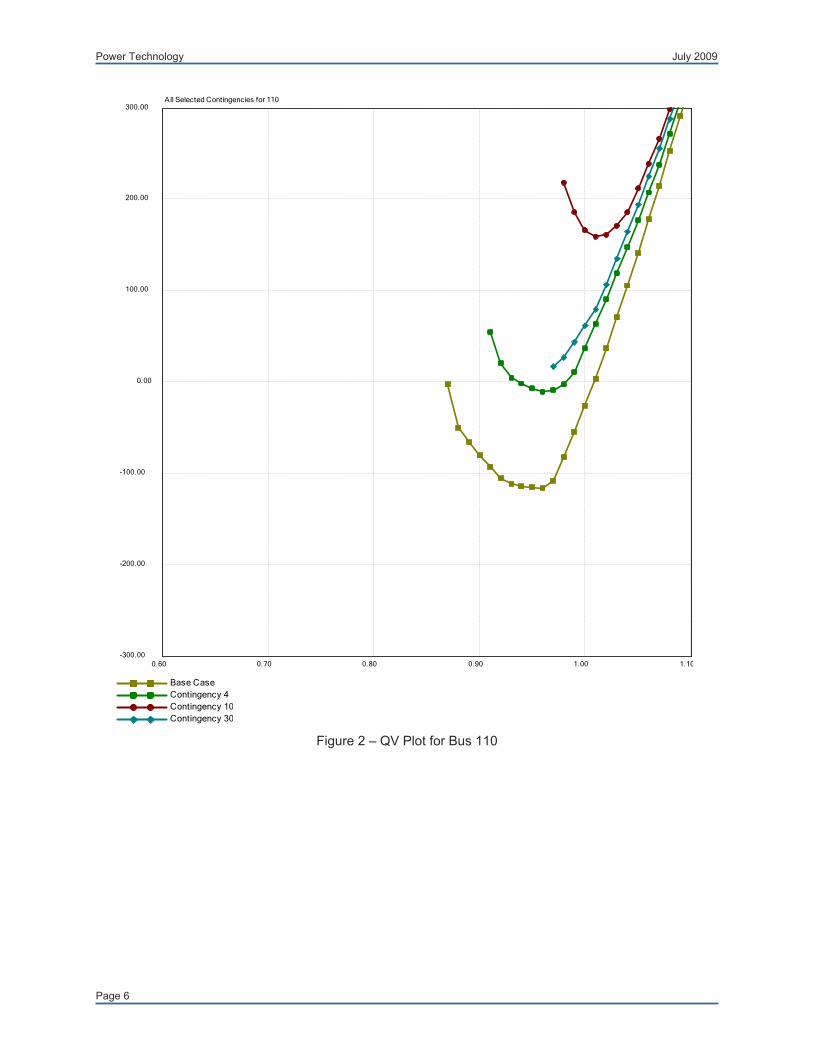
Figure 2 presents the QV plots calculated for bus 110 for the base case and some of the critical contingencies.
The reactive power margin in the base case is 116 MVAr, dropping to just 10 MVAr for contingency #4 (230 kV circuit between buses 112 and 123). Voltage collapse conditions are identified for contingency #10 (230 kV circuit between buses 115 and 124) and contingency #30 (138 kV circuit between buses 106 and 110).
Power Technology July 2009
Page 5
It should be noted that the reactive power deficiency for contingency #10 is greater than 150 MVAr and the minimum of the associated QV curve is associated with bus voltage greater than 1.0 pu. The QV curve associated with contingency #30 is incomplete, since the power flow solution did not converge for voltages below 0.97 pu.
These QV results were obtained using a full Newton power flow solution and the non-divergent power flow solution in PSS®E. The transformer taps are locked during the contingency calculation, but the switched shunts with continuous control (SVCs) are allowed to respond.
The PV analysis considered generation to load transfers from the 230 kV to the 138 kV networks. In other words, the generation connected to buses 113, 114, 115, 116, 118, 121, 122 and 123 is increased, with the additional power being transferred to the loads connected to buses 1101, 1102, 1103, 1104, 1105, 1106, 1107, 1108, 1109 and 1110.
It should be noted that the additional generation available on the 230 kV system (Pmax – Pgen) is about 100 MW. Transfers greater than 100 MW imply a disregard for the data associated with maximum power output of the generation units. Furthermore, since the ratings for the generator step-up transformers match the generator MVA capability, the overload of the generators also imply an overload of the step-up transformers.
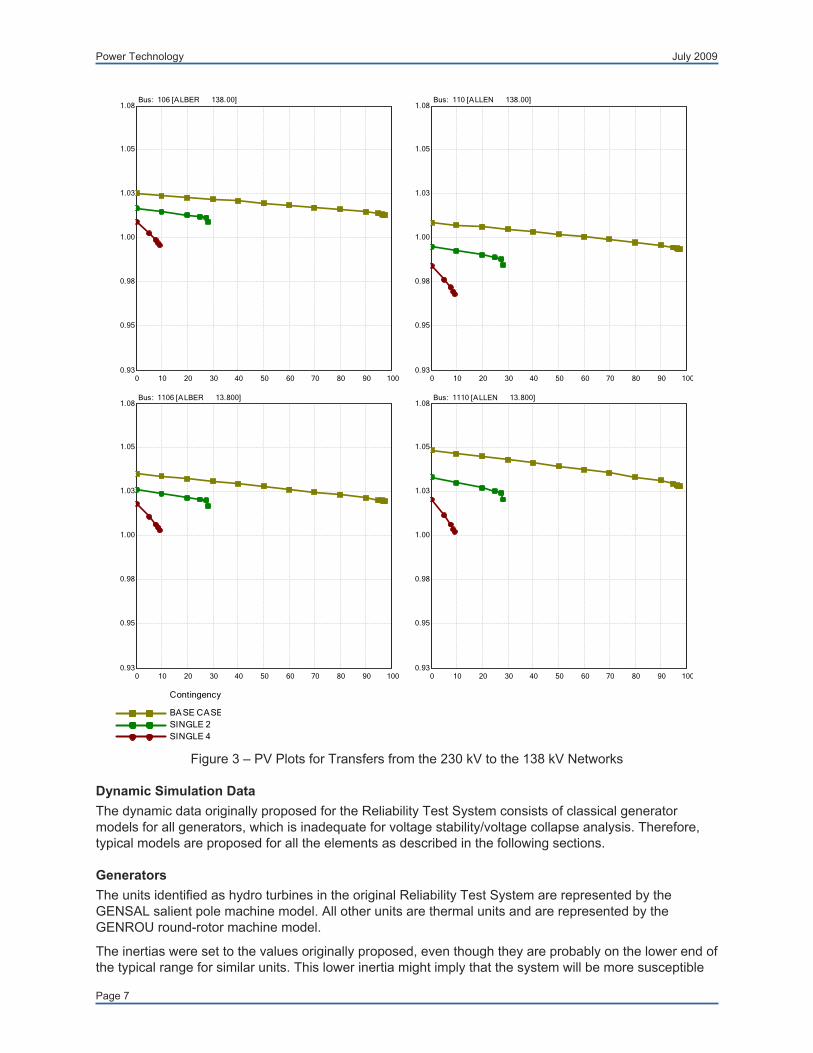
Figure 3 presents some of the calculated PV plots. These plots correspond to the voltages at the 138 kV buses 106 and 110, as well as the voltages at the 13.8 kV load buses 1106 and 1110. The maximum transfer calculated for the base case is slightly under 100 MW. No incremental transfer is possible for contingency #30 (see the QV results), as well as for contingency #6 (outage of the 138 kV circuit between buses 114 and 116) and contingency #10 (outage of the 230 kV circuit between buses 115 and 124). Contingency #4 resulted in a maximum incremental transfer of just 10 MW.
Power Technology July 2009
Page 6
0.70 0.80 0.90 1.000.60 1.10
200.00
100.00
0.00
-100.00
-200.00
300.00
-300.00
All Selected Contingencies for 110
Base CaseContingency 4Contingency 10Contingency 30
Figure 2 – QV Plot for Bus 110
Power Technology July 2009
Page 7
10 20 30 40 50 60 70 80 900 100
1.05
1.03
1.00
0.98
0.95
1.08
0.9310 20 30 40 50 60 70 80 900 100
1.05
1.03
1.00
0.98
0.95
1.08
0.93
10 20 30 40 50 60 70 80 900 100
1.05
1.03
1.00
0.98
0.95
1.08
0.9310 20 30 40 50 60 70 80 900 100
1.05
1.03
1.00
0.98
0.95
1.08
0.93
Bus: 106 [ALBER 138.00] Bus: 110 [ALLEN 138.00]
Bus: 1106 [ALBER 13.800] Bus: 1110 [ALLEN 13.800]
Contingency
BASE CASESINGLE 2SINGLE 4
Figure 3 – PV Plots for Transfers from the 230 kV to the 138 kV Networks
Dynamic Simulation Data
The dynamic data originally proposed for the Reliability Test System consists of classical generator models for all generators, which is inadequate for voltage stability/voltage collapse analysis. Therefore, typical models are proposed for all the elements as described in the following sections.
Generators
The units identified as hydro turbines in the original Reliability Test System are represented by the GENSAL salient pole machine model. All other units are thermal units and are represented by the GENROU round-rotor machine model.
The inertias were set to the values originally proposed, even though they are probably on the lower end of the typical range for similar units. This lower inertia might imply that the system will be more susceptible

Power Technology July 2009
Page 8
to angular instability (loss of synchronism) and poorly damped oscillations than would be expected if more realistic inertias are considered. Additional simulations will be required to quantify this effect and determine how important it is to the overall simulation results.
All other parameters are representative of generation units of comparable MVA ratings.
Excitation Systems
Three different excitation system models were used. The IEEET1 and EXAC1 models correspond to AC rotating exciters, while the SCRX model represents a bus-fed static exciter. The parameters for these excitation systems provide a reasonable, representative response for these equipment.
The limits are set in such way as to limit the ceiling (maximum field voltage) to be around twice the rated (full load) field voltage. The resulting response ratios are above 1.0, with the exception of the generator at bus 30123. The relatively high ceiling in these excitation systems results in a responsive voltage control, consistent with modern excitation systems.
Maximum Excitation Limiters
The over-excitation limiter (OEL) model MAXEX2 was applied for all generators. This model corresponds to an OEL that acts at the voltage reference of the excitation system with an inverse time characteristic. The rated value for the field current was calculated in PSS®E considering the generators at full power output with 0.9 power factor. Changes to the generator model parameters, particularly the saturation characteristics and synchronous reactances, would affect the rated field current and would require adjustments to the corresponding OEL model.
Turbine/Speed Governors
Only a few generators have a turbine/speed governor model. Those machines without such a model are simulated with constant mechanical power. There is a limited amount of reserves in the case, so the simulation of large imbalances between generation and load should be avoided, since there is a significant risk of large frequency excursions and even the inability of the simulation model to control frequency.
The hydro turbines are represented by the model HYGOV, while the IEEEG1 model is used for the steam units. It should be noted that the parameters for the steam turbines consider a tandem-compound unit with a reheater [3].
Static VAR Compensators
The power flow case contains two static VAR compensators (SVC) represented as switched shunts with continuous control. The first one is connected to bus 10114 and is rated –50/+200 MVAr. The other one is rated –50/+100 MVAr and is connected to bus 10106.
The PSS®E model CSSCST is used to represent the dynamic response of these devices. The steady state gain K is set at 150 pu/pu, but is provided in the PSS®E model in Mvar/pu, resulting in the gains 37,500 (250 x 150) and 22,500 (150 x 150) for these dynamic models. The thyristor bridge is represented by a first order lag, with a time constant T5 = 30 ms. The time constant T3 was calculated for each SVC so a reasonable closed-loop response (adequate phase margin) is obtained. The methodology for the calculation of T3 is described in [4, 5].
The limits Vmax and Vmin are entered as zero in the CSSCST dynamic model, so the voltage setpoint provided in the power flow data is used. The voltage override capability provides a discontinuous control for large voltage deviations, forcing the SVC output to its limits when the voltage error is larger than Vov = 0.5 pu.
Tap Changers
The representation of the effect of OLTC transformers is particularly important for the analysis of slow voltage collapse phenomena. This model is usually associated with longer term dynamic simulations, up to several minutes after fault clearing.

Power Technology July 2009
Page 9
All transformers represented with on-load tap changers in the power flow have the PSS®E dynamic model OLTC1 in the dynamic setup. This model does not contain any differential equations (state variables); it considers an initial delay for the first tap change of 30 seconds, with a 1 second delay in the switching action and 5 seconds delay before consecutive tap changes are allowed. It should be recognized that this is quite fast and probably faster than most practical settings, with the effect of the OLTC becoming evident with simulations lasting just one to two minutes after fault clearing.
Load Recovery
Similarly to the OLTC transformers (and associated with it), the recovery of the load demand to the pre-disturbance levels is important for the analysis of slow voltage collapse phenomena. The representation of such phenomena is also associated with longer term dynamic simulations, up to several minutes after fault clearing.
Load recovery to a constant MVA characteristic is represented in PSS®E by the family of models EXTLxx. This model provides separate time constants for the recovery of the real and reactive parts of the load. The EXTLAL model was used to apply this characteristic to all loads in the system. The gains Kp and Kq are set to 5%, resulting in a recovery to constant MVA in a few minutes after the fault clearing. Again, this is probably faster than what is observed in practice. The use of such values simply makes the effect more evident and more pronounced in the overall system response, which is desirable in a test system.
Complex Load Model
A different kind of voltage collapse is associated with the stalling of induction motors due to low voltages during the fault, resulting in inadequate voltage recovery after fault clearing or even voltage collapse. This is sometimes called short-term voltage collapse to differentiate it from the slower (long-term) phenomena associated with OLTC action and load recovery to constant MVA characteristics [6, 7].
This fast voltage collapse problem can be investigated in PSS®E with the use of the complex load model. The CLODAL version of the model applies the same load characteristics to all loads in the system. The following load composition is proposed:
15% of large induction motors (industrial motors);
35% of small induction motors (air conditioning);
2% of transformer excitation current;
15% of discharge lighting;
5% of constant MVA load;
remaining load (28%) represented as 100% constant current for the real part and 100% constant admittance for the reactive part; and
5% reactance (on load MW base) in the step-down transformer.
Dynamic Simulation Results
In order to demonstrate the key features of the proposed test system regarding voltage collapse/voltage stability issues, the following section presents the results of some of the simulations performed.
PSS®E activities ESTR/ERUN and GSTR/GRUN were applied to make sure that the excitation systems and speed governors models resulted in properly tuned responses, compatible with the expected performance of these equipment.
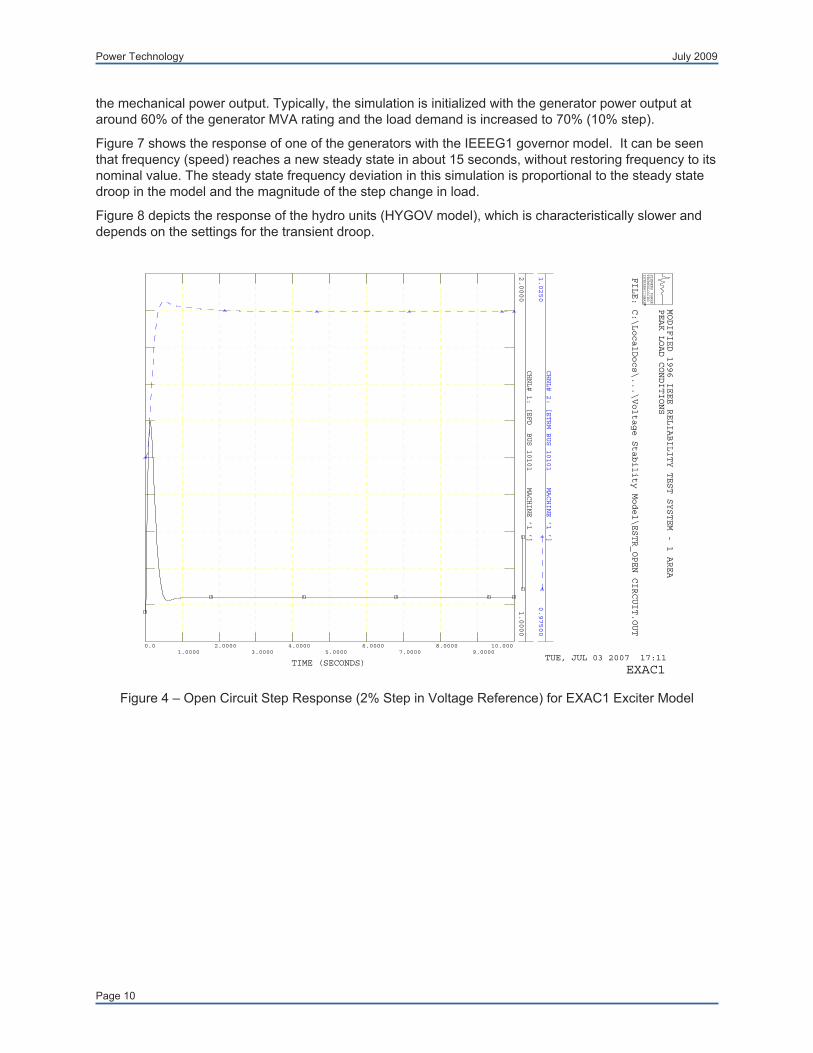
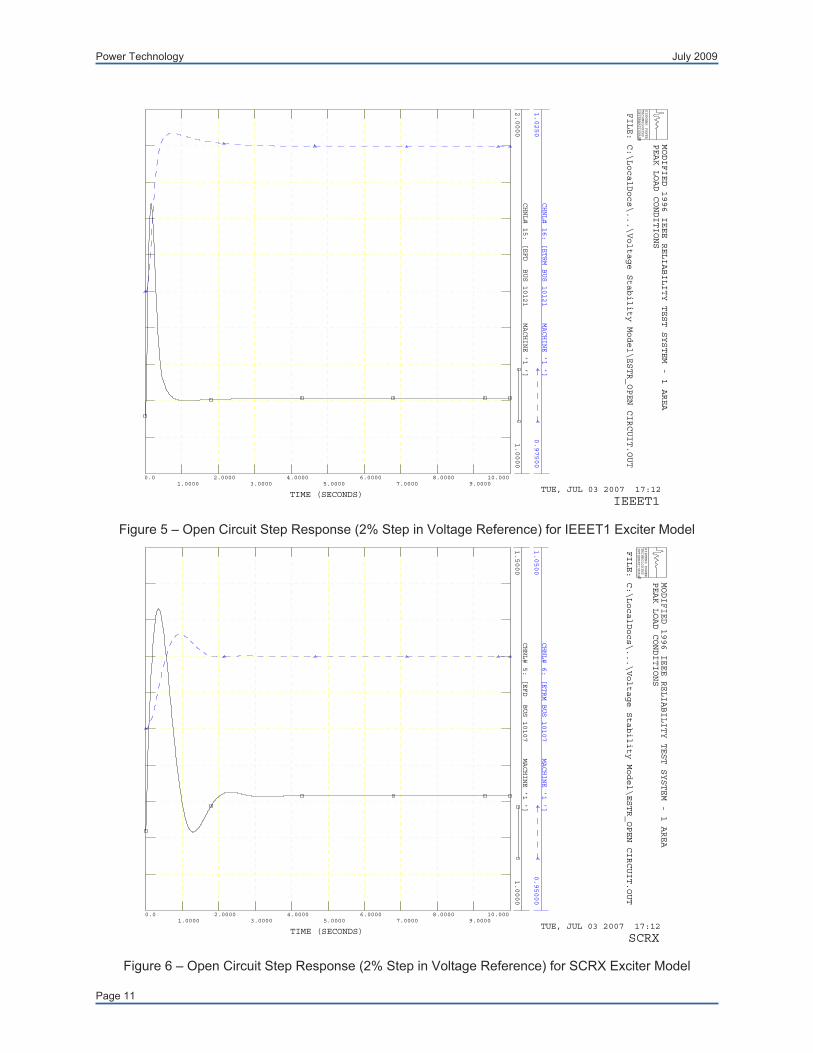
The key test regarding the control tuning of excitation systems is the open circuit step test. Figure 4 presents the response of the EXAC1 model to a 2% step change in voltage reference. It can be seen that the voltage regulator provides a fast response with minimal overshoot. Similarly, Figure 5 and Figure 6 present the responses obtained with the IEEET1 and SCRX models, respectively.
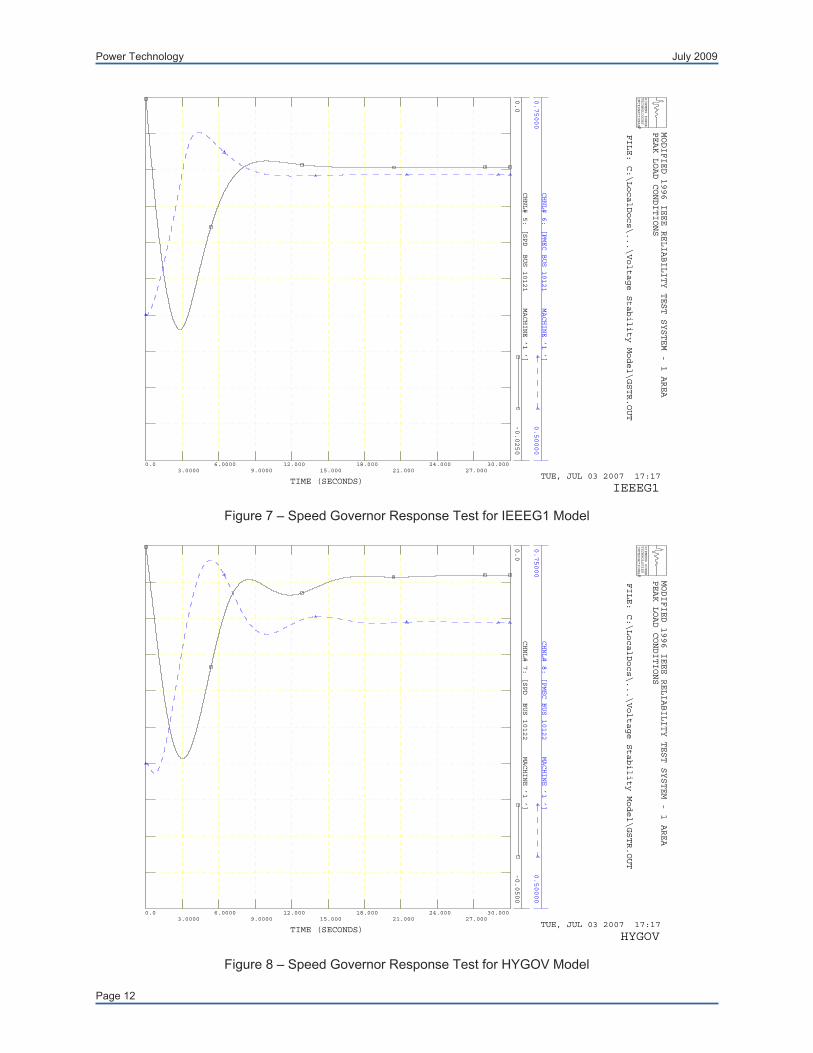
The test for the speed governor response consists of the generator feeding a constant MW load in isolated mode. A sudden change in the load demand is applied and the speed governor reacts to modify
Power Technology July 2009
Page 10
the mechanical power output. Typically, the simulation is initialized with the generator power output at around 60% of the generator MVA rating and the load demand is increased to 70% (10% step).
Figure 7 shows the response of one of the generators with the IEEEG1 governor model. It can be seen that frequency (speed) reaches a new steady state in about 15 seconds, without restoring frequency to its nominal value. The steady state frequency deviation in this simulation is proportional to the steady state droop in the model and the magnitude of the step change in load.
Figure 8 depicts the response of the hydro units (HYGOV model), which is characteristically slower and depends on the settings for the transient droop.
Figure 4 – Open Circuit Step Response (2% Step in Voltage Reference) for EXAC1 Exciter Model
CHNL# 1: [EFD BUS 10101 MACHINE ’1 ’]
2.0000
1.0000
CHNL# 2: [ETRM BUS 10101 MACHINE ’1 ’]
1.0250
0.97500
MODIFIED 1996 IEEE RELIABILITY TEST SYSTEM - 1 AREA
PEAK LOAD CONDITIONS
TUE, JUL 03 2007 17:11TIME (SECONDS)
SIEMENS POWER
TECHNOLOGIES
INTERNATIONAL
R
0.01.0000
2.00003.0000
4.00005.0000
6.00007.0000
8.00009.0000
10.000
FILE: C:\LocalDocs\...\Voltage Stability Model\ESTR_OPEN CIRCUIT.OUT
EXAC1
Power Technology July 2009
Page 11
Figure 5 – Open Circuit Step Response (2% Step in Voltage Reference) for IEEET1 Exciter Model
Figure 6 – Open Circuit Step Response (2% Step in Voltage Reference) for SCRX Exciter Model
CHNL# 15: [EFD BUS 10121 MACHINE ’1 ’]
2.0000
1.0000
CHNL# 16: [ETRM BUS 10121 MACHINE ’1 ’]
1.0250
0.97500
MODIFIED 1996 IEEE RELIABILITY TEST SYSTEM - 1 AREA
PEAK LOAD CONDITIONS
TUE, JUL 03 2007 17:12TIME (SECONDS)
SIEMENS POWER
TECHNOLOGIES
INTERNATIONAL
R
0.01.0000
2.00003.0000
4.00005.0000
6.00007.0000
8.00009.0000
10.000
FILE: C:\LocalDocs\...\Voltage Stability Model\ESTR_OPEN CIRCUIT.OUT
IEEET1
CHNL# 5: [EFD BUS 10107 MACHINE ’1 ’]
1.5000
1.0000
CHNL# 6: [ETRM BUS 10107 MACHINE ’1 ’]
1.0500
0.95000
MODIFIED 1996 IEEE RELIABILITY TEST SYSTEM - 1 AREA
PEAK LOAD CONDITIONS
TUE, JUL 03 2007 17:12TIME (SECONDS)
SIEMENS POWER
TECHNOLOGIES
INTERNATIONAL
R
0.01.0000
2.00003.0000
4.00005.0000
6.00007.0000
8.00009.0000
10.000
FILE: C:\LocalDocs\...\Voltage Stability Model\ESTR_OPEN CIRCUIT.OUT
SCRX
Power Technology July 2009
Page 12
Figure 7 – Speed Governor Response Test for IEEEG1 Model
Figure 8 – Speed Governor Response Test for HYGOV Model
CHNL# 5: [SPD BUS 10121 MACHINE ’1 ’]
0.0
-0.0250
CHNL# 6: [PMEC BUS 10121 MACHINE ’1 ’]
0.75000
0.50000
MODIFIED 1996 IEEE RELIABILITY TEST SYSTEM - 1 AREA
PEAK LOAD CONDITIONS
TUE, JUL 03 2007 17:17TIME (SECONDS)
SIEMENS POWER
TECHNOLOGIES
INTERNATIONAL
R
0.03.0000
6.00009.0000
12.00015.000
18.00021.000
24.00027.000
30.000
FILE: C:\LocalDocs\...\Voltage Stability Model\GSTR.OUT
IEEEG1
CHNL# 7: [SPD BUS 10122 MACHINE ’1 ’]
0.0
-0.0500
CHNL# 8: [PMEC BUS 10122 MACHINE ’1 ’]
0.75000
0.50000
MODIFIED 1996 IEEE RELIABILITY TEST SYSTEM - 1 AREA
PEAK LOAD CONDITIONS
TUE, JUL 03 2007 17:17TIME (SECONDS)
SIEMENS POWER
TECHNOLOGIES
INTERNATIONAL
R
0.03.0000
6.00009.0000
12.00015.000
18.00021.000
24.00027.000
30.000
FILE: C:\LocalDocs\...\Voltage Stability Model\GSTR.OUT
HYGOV
Power Technology July 2009
Page 13
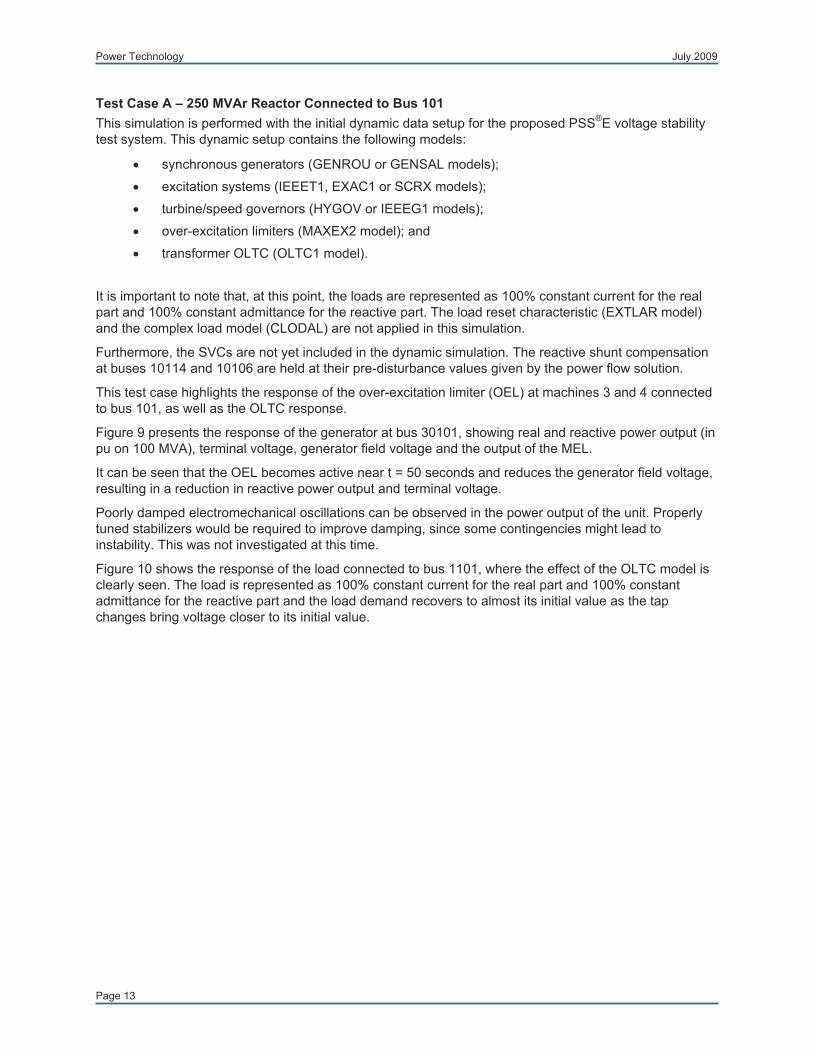
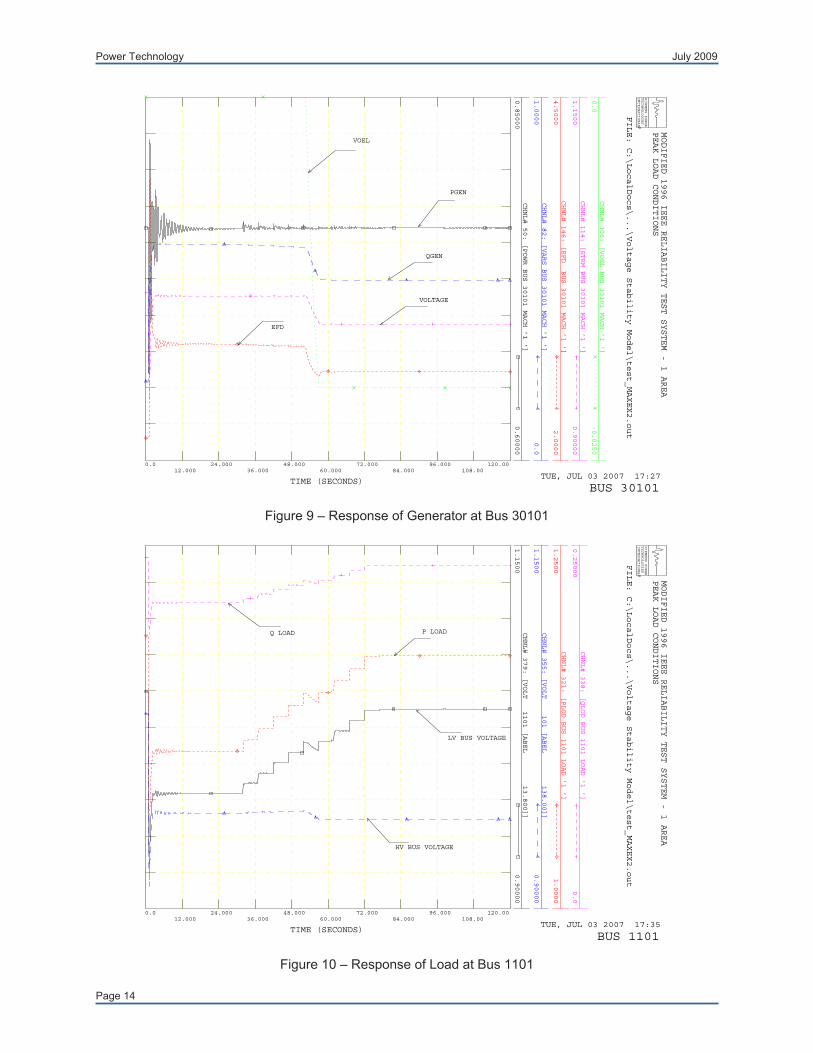
Test Case A – 250 MVAr Reactor Connected to Bus 101
This simulation is performed with the initial dynamic data setup for the proposed PSS®E voltage stability test system. This dynamic setup contains the following models:
synchronous generators (GENROU or GENSAL models);
excitation systems (IEEET1, EXAC1 or SCRX models);
turbine/speed governors (HYGOV or IEEEG1 models);
over-excitation limiters (MAXEX2 model); and
transformer OLTC (OLTC1 model).
It is important to note that, at this point, the loads are represented as 100% constant current for the real part and 100% constant admittance for the reactive part. The load reset characteristic (EXTLAR model) and the complex load model (CLODAL) are not applied in this simulation.
Furthermore, the SVCs are not yet included in the dynamic simulation. The reactive shunt compensation at buses 10114 and 10106 are held at their pre-disturbance values given by the power flow solution.
This test case highlights the response of the over-excitation limiter (OEL) at machines 3 and 4 connected to bus 101, as well as the OLTC response.
Figure 9 presents the response of the generator at bus 30101, showing real and reactive power output (in pu on 100 MVA), terminal voltage, generator field voltage and the output of the MEL.
It can be seen that the OEL becomes active near t = 50 seconds and reduces the generator field voltage, resulting in a reduction in reactive power output and terminal voltage.
Poorly damped electromechanical oscillations can be observed in the power output of the unit. Properly tuned stabilizers would be required to improve damping, since some contingencies might lead to instability. This was not investigated at this time.
Figure 10 shows the response of the load connected to bus 1101, where the effect of the OLTC model is clearly seen. The load is represented as 100% constant current for the real part and 100% constant admittance for the reactive part and the load demand recovers to almost its initial value as the tap changes bring voltage closer to its initial value.
Power Technology July 2009
Page 14
Figure 9 – Response of Generator at Bus 30101
Figure 10 – Response of Load at Bus 1101
CHNL# 50: [POWR BUS 30101 MACH ’1 ’]
0.85000
0.60000
CHNL# 82: [VARS BUS 30101 MACH ’1 ’]
1.0000
0.0
CHNL# 146: [EFD BUS 30101 MACH ’1 ’]
4.5000
2.0000
CHNL# 114: [ETRM BUS 30101 MACH ’1 ’]
1.1500
0.90000
CHNL# 306: [VOEL BUS 30101 MACH ’1 ’]
0.0
-0.0250
MODIFIED 1996 IEEE RELIABILITY TEST SYSTEM - 1 AREA
PEAK LOAD CONDITIONS
TUE, JUL 03 2007 17:27TIME (SECONDS)
SIEMENS POWER
TECHNOLOGIES
INTERNATIONAL
R
0.012.000
24.00036.000
48.00060.000
72.00084.000
96.000108.00
120.00
FILE: C:\LocalDocs\...\Voltage Stability Model\test_MAXEX2.out
VOEL
PGEN
QGEN
VOLTAGE
EFD
BUS 30101
CHNL# 379: [VOLT 1101 [ABEL 13.800]]
1.1500
0.90000
CHNL# 355: [VOLT 101 [ABEL 138.00]]
1.1500
0.90000
CHNL# 321: [PLOD BUS 1101 LOAD ’1 ’]
1.2500
1.0000
CHNL# 338: [QLOD BUS 1101 LOAD ’1 ’]
0.25000
0.0
MODIFIED 1996 IEEE RELIABILITY TEST SYSTEM - 1 AREA
PEAK LOAD CONDITIONS
TUE, JUL 03 2007 17:35TIME (SECONDS)
SIEMENS POWER
TECHNOLOGIES
INTERNATIONAL
R
0.012.000
24.00036.000
48.00060.000
72.00084.000
96.000108.00
120.00
FILE: C:\LocalDocs\...\Voltage Stability Model\test_MAXEX2.out
HV BUS VOLTAGE
LV BUS VOLTAGE
Q LOAD P LOAD
BUS 1101
Power Technology July 2009
Page 15
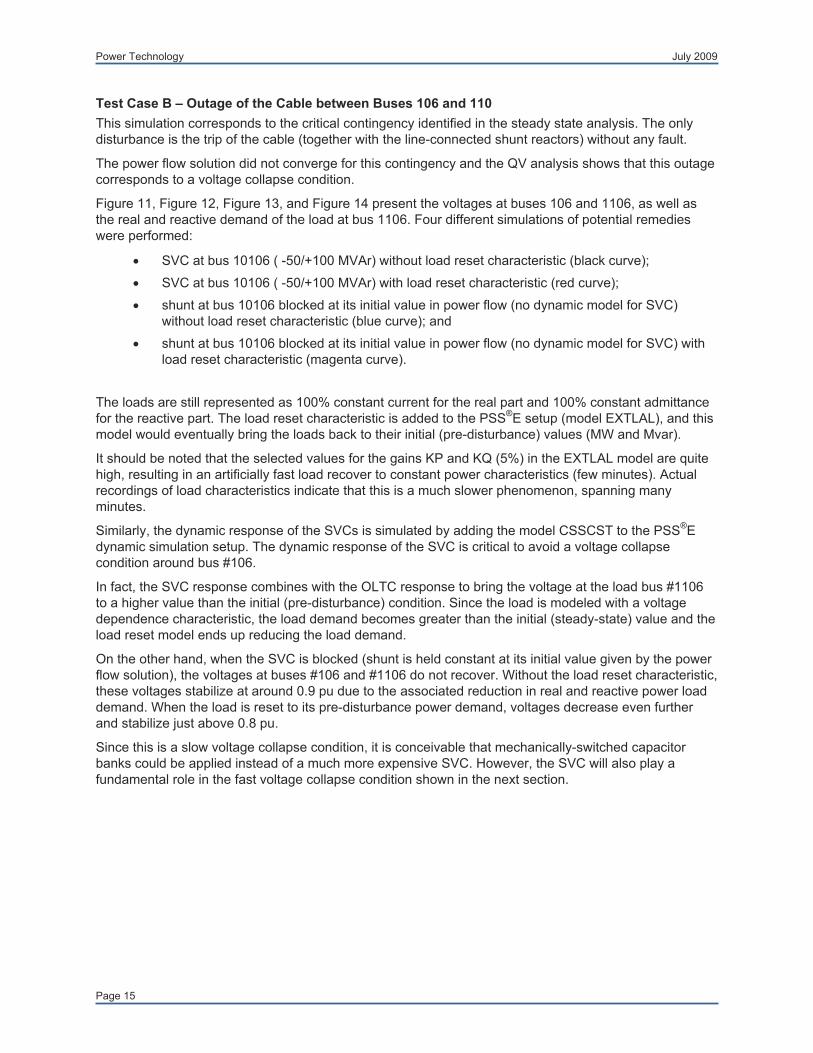
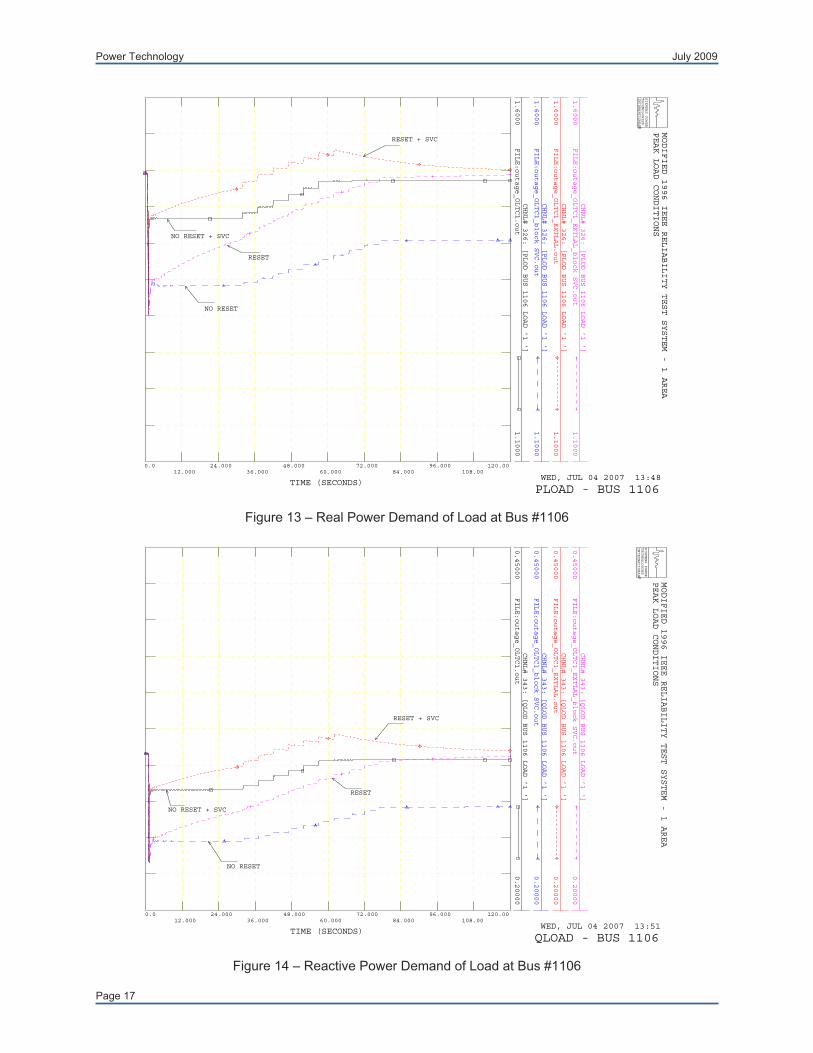
Test Case B – Outage of the Cable between Buses 106 and 110
This simulation corresponds to the critical contingency identified in the steady state analysis. The only disturbance is the trip of the cable (together with the line-connected shunt reactors) without any fault.
The power flow solution did not converge for this contingency and the QV analysis shows that this outage corresponds to a voltage collapse condition.
Figure 11, Figure 12, Figure 13, and Figure 14 present the voltages at buses 106 and 1106, as well as the real and reactive demand of the load at bus 1106. Four different simulations of potential remedies were performed:
SVC at bus 10106 ( -50/+100 MVAr) without load reset characteristic (black curve);
SVC at bus 10106 ( -50/+100 MVAr) with load reset characteristic (red curve);
shunt at bus 10106 blocked at its initial value in power flow (no dynamic model for SVC) without load reset characteristic (blue curve); and
shunt at bus 10106 blocked at its initial value in power flow (no dynamic model for SVC) with load reset characteristic (magenta curve).
The loads are still represented as 100% constant current for the real part and 100% constant admittance for the reactive part. The load reset characteristic is added to the PSS®E setup (model EXTLAL), and this model would eventually bring the loads back to their initial (pre-disturbance) values (MW and Mvar).
It should be noted that the selected values for the gains KP and KQ (5%) in the EXTLAL model are quite high, resulting in an artificially fast load recover to constant power characteristics (few minutes). Actual recordings of load characteristics indicate that this is a much slower phenomenon, spanning many minutes.
Similarly, the dynamic response of the SVCs is simulated by adding the model CSSCST to the PSS®E dynamic simulation setup. The dynamic response of the SVC is critical to avoid a voltage collapse condition around bus #106.
In fact, the SVC response combines with the OLTC response to bring the voltage at the load bus #1106 to a higher value than the initial (pre-disturbance) condition. Since the load is modeled with a voltage dependence characteristic, the load demand becomes greater than the initial (steady-state) value and the load reset model ends up reducing the load demand.
On the other hand, when the SVC is blocked (shunt is held constant at its initial value given by the power flow solution), the voltages at buses #106 and #1106 do not recover. Without the load reset characteristic, these voltages stabilize at around 0.9 pu due to the associated reduction in real and reactive power load demand. When the load is reset to its pre-disturbance power demand, voltages decrease even further and stabilize just above 0.8 pu.
Since this is a slow voltage collapse condition, it is conceivable that mechanically-switched capacitor banks could be applied instead of a much more expensive SVC. However, the SVC will also play a fundamental role in the fast voltage collapse condition shown in the next section.

Power Technology July 2009
Page 16
Figure 11 – Voltage at 138 kV Bus #106
Figure 12 – Voltage at 13.8 kV Load Bus #1106
CHNL# 360: [VOLT 106 [ALBER 138.00]]
FILE: outage_OLTC1.out
1.0500
0.80000
CHNL# 360: [VOLT 106 [ALBER 138.00]]
FILE: outage_OLTC1_block SVC.out
1.0500
0.80000
CHNL# 360: [VOLT 106 [ALBER 138.00]]
FILE: outage_OLTC1_EXTLAL.out
1.0500
0.80000
CHNL# 360: [VOLT 106 [ALBER 138.00]]
FILE: outage_OLTC1_EXTLAL_block SVC.out
1.0500
0.80000
MODIFIED 1996 IEEE RELIABILITY TEST SYSTEM - 1 AREA
PEAK LOAD CONDITIONS
WED, JUL 04 2007 13:43TIME (SECONDS)
SIEMENS POWER
TECHNOLOGIES
INTERNATIONAL
R
0.012.000
24.00036.000
48.00060.000
72.00084.000
96.000108.00
120.00
NO RESET + SVC
RESET + SVC
NO RESET
RESET
VOLTAGE BUS 106
CHNL# 384: [VOLT 1106 [ALBER 13.800]]
FILE: outage_OLTC1.out
1.1500
0.65000
CHNL# 384: [VOLT 1106 [ALBER 13.800]]
FILE: outage_OLTC1_block SVC.out
1.1500
0.65000
CHNL# 384: [VOLT 1106 [ALBER 13.800]]
FILE: outage_OLTC1_EXTLAL.out
1.1500
0.65000
CHNL# 384: [VOLT 1106 [ALBER 13.800]]
FILE: outage_OLTC1_EXTLAL_block SVC.out
1.1500
0.65000
MODIFIED 1996 IEEE RELIABILITY TEST SYSTEM - 1 AREA
PEAK LOAD CONDITIONS
WED, JUL 04 2007 13:45TIME (SECONDS)
SIEMENS POWER
TECHNOLOGIES
INTERNATIONAL
R
0.012.000
24.00036.000
48.00060.000
72.00084.000
96.000108.00
120.00
NO RESET + SVC
RESET + SVC
NO RESET
RESET
VOLTAGE BUS 1106
Power Technology July 2009
Page 17
Figure 13 – Real Power Demand of Load at Bus #1106
Figure 14 – Reactive Power Demand of Load at Bus #1106
CHNL# 326: [PLOD BUS 1106 LOAD ’1 ’]
FILE: outage_OLTC1.out
1.6000
1.1000
CHNL# 326: [PLOD BUS 1106 LOAD ’1 ’]
FILE: outage_OLTC1_block SVC.out
1.6000
1.1000
CHNL# 326: [PLOD BUS 1106 LOAD ’1 ’]
FILE: outage_OLTC1_EXTLAL.out
1.6000
1.1000
CHNL# 326: [PLOD BUS 1106 LOAD ’1 ’]
FILE: outage_OLTC1_EXTLAL_block SVC.out
1.6000
1.1000
MODIFIED 1996 IEEE RELIABILITY TEST SYSTEM - 1 AREA
PEAK LOAD CONDITIONS
WED, JUL 04 2007 13:48TIME (SECONDS)
SIEMENS POWER
TECHNOLOGIES
INTERNATIONAL
R
0.012.000
24.00036.000
48.00060.000
72.00084.000
96.000108.00
120.00
NO RESET + SVC
NO RESET
RESET + SVC
RESET
PLOAD - BUS 1106
CHNL# 343: [QLOD BUS 1106 LOAD ’1 ’]
FILE: outage_OLTC1.out
0.45000
0.20000
CHNL# 343: [QLOD BUS 1106 LOAD ’1 ’]
FILE: outage_OLTC1_block SVC.out
0.45000
0.20000
CHNL# 343: [QLOD BUS 1106 LOAD ’1 ’]
FILE: outage_OLTC1_EXTLAL.out
0.45000
0.20000
CHNL# 343: [QLOD BUS 1106 LOAD ’1 ’]
FILE: outage_OLTC1_EXTLAL_block SVC.out
0.45000
0.20000
MODIFIED 1996 IEEE RELIABILITY TEST SYSTEM - 1 AREA
PEAK LOAD CONDITIONS
WED, JUL 04 2007 13:51TIME (SECONDS)
SIEMENS POWER
TECHNOLOGIES
INTERNATIONAL
R
0.012.000
24.00036.000
48.00060.000
72.00084.000
96.000108.00
120.00
NO RESET + SVC
NO RESET
RESET
RESET + SVC
QLOAD - BUS 1106
Power Technology July 2009
Page 18
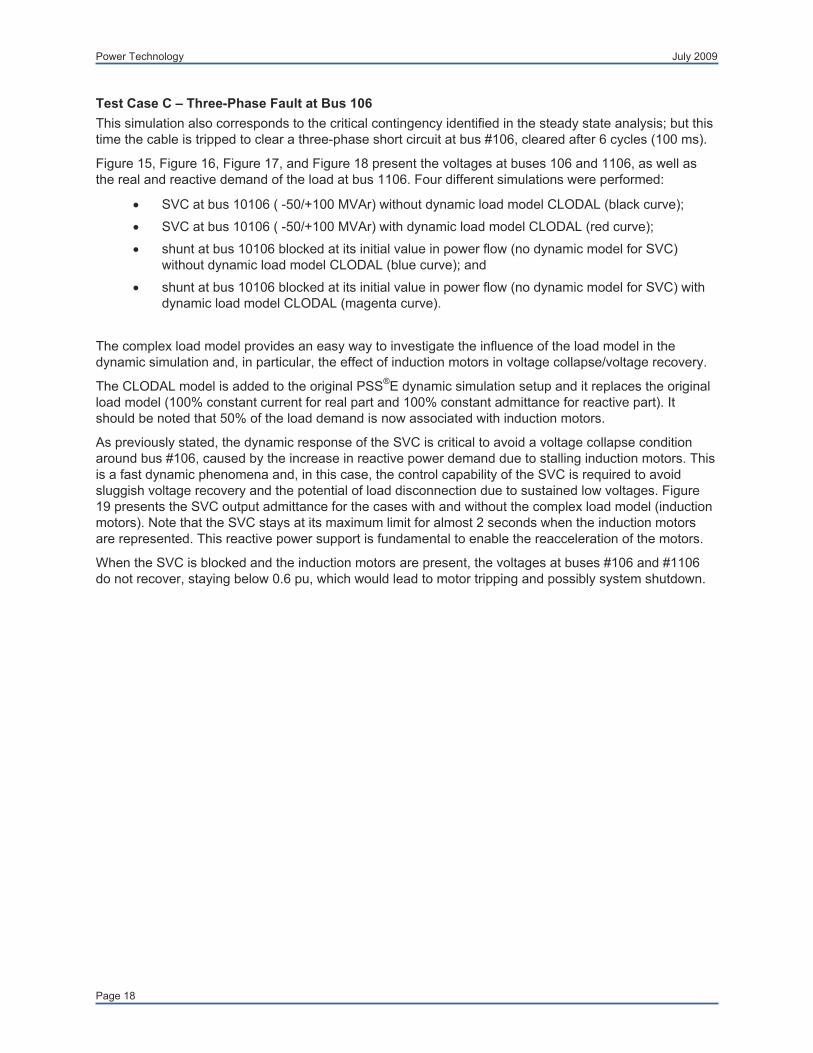
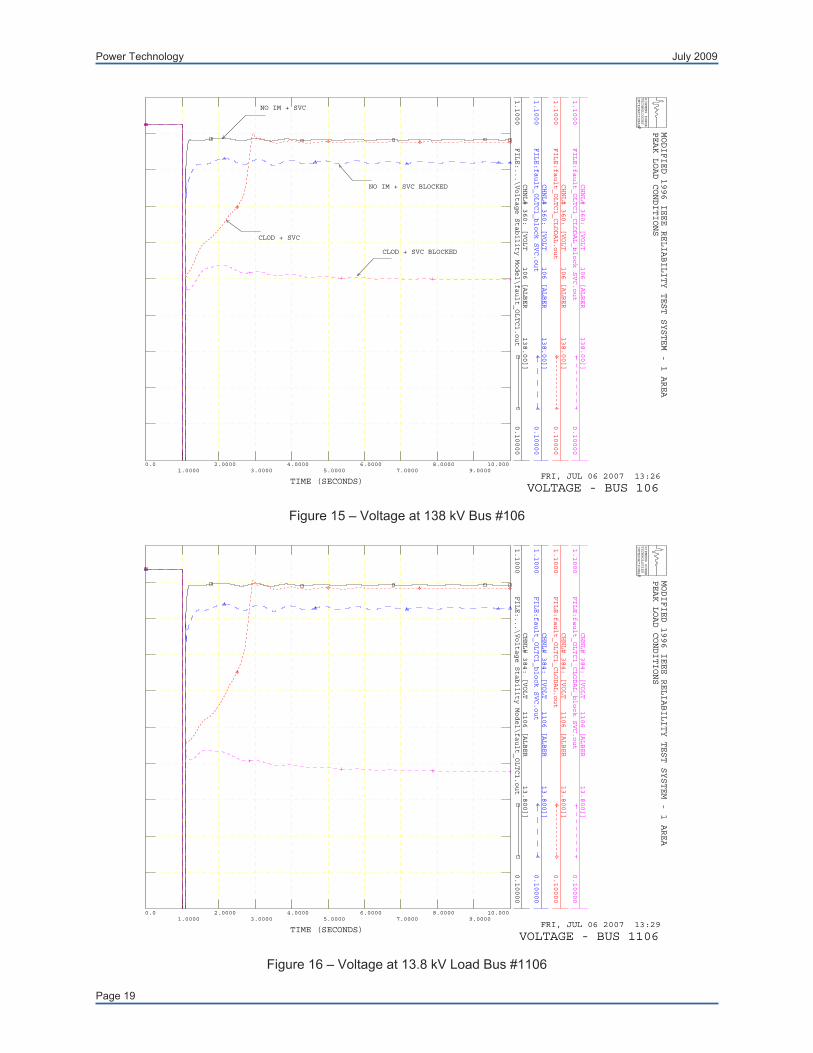
Test Case C – Three-Phase Fault at Bus 106
This simulation also corresponds to the critical contingency identified in the steady state analysis; but this time the cable is tripped to clear a three-phase short circuit at bus #106, cleared after 6 cycles (100 ms).
Figure 15, Figure 16, Figure 17, and Figure 18 present the voltages at buses 106 and 1106, as well as the real and reactive demand of the load at bus 1106. Four different simulations were performed:
SVC at bus 10106 ( -50/+100 MVAr) without dynamic load model CLODAL (black curve);
SVC at bus 10106 ( -50/+100 MVAr) with dynamic load model CLODAL (red curve);
shunt at bus 10106 blocked at its initial value in power flow (no dynamic model for SVC) without dynamic load model CLODAL (blue curve); and
shunt at bus 10106 blocked at its initial value in power flow (no dynamic model for SVC) with dynamic load model CLODAL (magenta curve).
The complex load model provides an easy way to investigate the influence of the load model in the dynamic simulation and, in particular, the effect of induction motors in voltage collapse/voltage recovery.
The CLODAL model is added to the original PSS®E dynamic simulation setup and it replaces the original load model (100% constant current for real part and 100% constant admittance for reactive part). It should be noted that 50% of the load demand is now associated with induction motors.
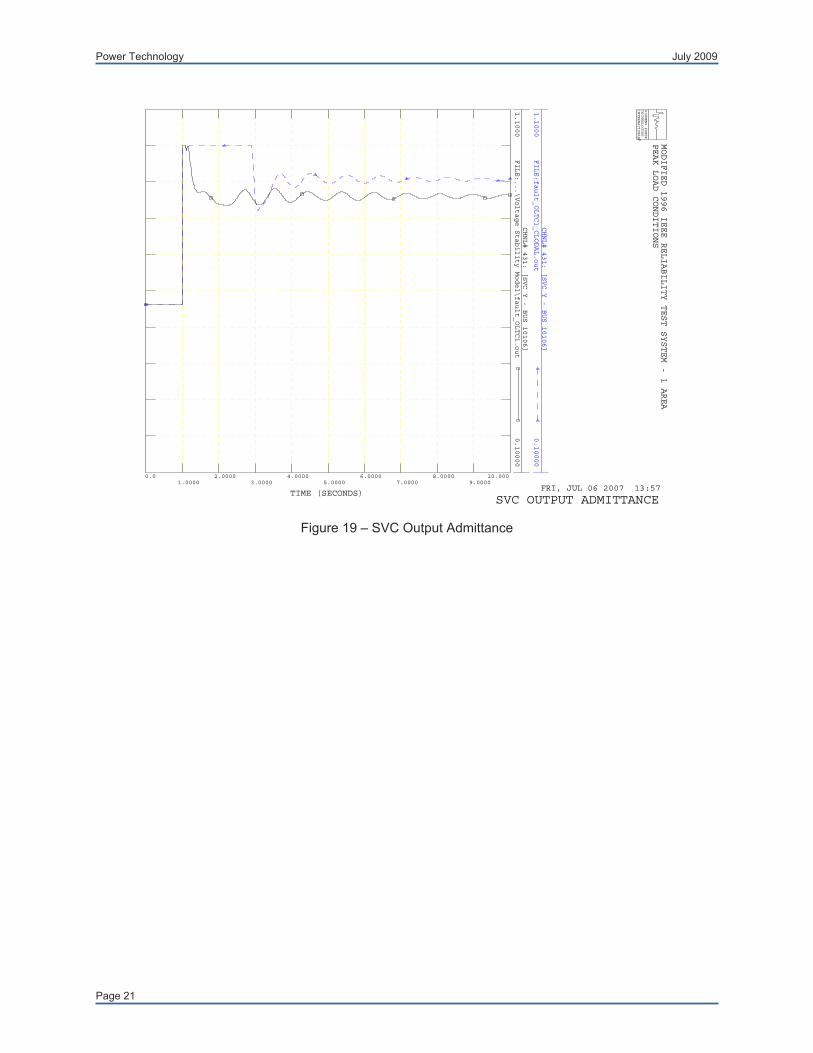
As previously stated, the dynamic response of the SVC is critical to avoid a voltage collapse condition around bus #106, caused by the increase in reactive power demand due to stalling induction motors. This is a fast dynamic phenomena and, in this case, the control capability of the SVC is required to avoid sluggish voltage recovery and the potential of load disconnection due to sustained low voltages. Figure 19 presents the SVC output admittance for the cases with and without the complex load model (induction motors). Note that the SVC stays at its maximum limit for almost 2 seconds when the induction motors are represented. This reactive power support is fundamental to enable the reacceleration of the motors.
When the SVC is blocked and the induction motors are present, the voltages at buses #106 and #1106 do not recover, staying below 0.6 pu, which would lead to motor tripping and possibly system shutdown.
Power Technology July 2009
Page 19
Figure 15 – Voltage at 138 kV Bus #106
Figure 16 – Voltage at 13.8 kV Load Bus #1106
CHNL# 360: [VOLT 106 [ALBER 138.00]]
FILE: ...\Voltage Stability Model\fault_OLTC1.out
1.1000
0.10000
CHNL# 360: [VOLT 106 [ALBER 138.00]]
FILE: fault_OLTC1_block SVC.out
1.1000
0.10000
CHNL# 360: [VOLT 106 [ALBER 138.00]]
FILE: fault_OLTC1_CLODAL.out
1.1000
0.10000
CHNL# 360: [VOLT 106 [ALBER 138.00]]
FILE: fault_OLTC1_CLODAL_block SVC.out
1.1000
0.10000
MODIFIED 1996 IEEE RELIABILITY TEST SYSTEM - 1 AREA
PEAK LOAD CONDITIONS
FRI, JUL 06 2007 13:26TIME (SECONDS)
SIEMENS POWER
TECHNOLOGIES
INTERNATIONAL
R
0.01.0000
2.00003.0000
4.00005.0000
6.00007.0000
8.00009.0000
10.000
NO IM + SVC
NO IM + SVC BLOCKED
CLOD + SVC
CLOD + SVC BLOCKED
VOLTAGE - BUS 106
CHNL# 384: [VOLT 1106 [ALBER 13.800]]
FILE: ...\Voltage Stability Model\fault_OLTC1.out
1.1000
0.10000
CHNL# 384: [VOLT 1106 [ALBER 13.800]]
FILE: fault_OLTC1_block SVC.out
1.1000
0.10000
CHNL# 384: [VOLT 1106 [ALBER 13.800]]
FILE: fault_OLTC1_CLODAL.out
1.1000
0.10000
CHNL# 384: [VOLT 1106 [ALBER 13.800]]
FILE: fault_OLTC1_CLODAL_block SVC.out
1.1000
0.10000
MODIFIED 1996 IEEE RELIABILITY TEST SYSTEM - 1 AREA
PEAK LOAD CONDITIONS
FRI, JUL 06 2007 13:29TIME (SECONDS)
SIEMENS POWER
TECHNOLOGIES
INTERNATIONAL
R
0.01.0000
2.00003.0000
4.00005.0000
6.00007.0000
8.00009.0000
10.000
VOLTAGE - BUS 1106

Power Technology July 2009
Page 20
Figure 17 – Real Power Demand of Load at Bus #1106
Figure 18 – Reactive Power Demand of Load at Bus #1106
CHNL# 326: [PLOD BUS 1106 LOAD ’1 ’]
FILE: ...\Voltage Stability Model\fault_OLTC1.out
2.5000
0.0
CHNL# 326: [PLOD BUS 1106 LOAD ’1 ’]
FILE: fault_OLTC1_block SVC.out
2.5000
0.0
CHNL# 326: [PLOD BUS 1106 LOAD ’1 ’]
FILE: fault_OLTC1_CLODAL.out
2.5000
0.0
CHNL# 326: [PLOD BUS 1106 LOAD ’1 ’]
FILE: fault_OLTC1_CLODAL_block SVC.out
2.5000
0.0
MODIFIED 1996 IEEE RELIABILITY TEST SYSTEM - 1 AREA
PEAK LOAD CONDITIONS
FRI, JUL 06 2007 13:30TIME (SECONDS)
SIEMENS POWER
TECHNOLOGIES
INTERNATIONAL
R
0.01.0000
2.00003.0000
4.00005.0000
6.00007.0000
8.00009.0000
10.000
PLOAD - BUS 1106
CHNL# 343: [QLOD BUS 1106 LOAD ’1 ’]
FILE: ...\Voltage Stability Model\fault_OLTC1.out
1.0000
0.0
CHNL# 343: [QLOD BUS 1106 LOAD ’1 ’]
FILE: fault_OLTC1_block SVC.out
1.0000
0.0
CHNL# 343: [QLOD BUS 1106 LOAD ’1 ’]
FILE: fault_OLTC1_CLODAL.out
1.0000
0.0
CHNL# 343: [QLOD BUS 1106 LOAD ’1 ’]
FILE: fault_OLTC1_CLODAL_block SVC.out
1.0000
0.0
MODIFIED 1996 IEEE RELIABILITY TEST SYSTEM - 1 AREA
PEAK LOAD CONDITIONS
FRI, JUL 06 2007 13:30TIME (SECONDS)
SIEMENS POWER
TECHNOLOGIES
INTERNATIONAL
R
0.01.0000
2.00003.0000
4.00005.0000
6.00007.0000
8.00009.0000
10.000
QLOAD - BUS 1106
Power Technology July 2009
Page 21
Figure 19 – SVC Output Admittance
CHNL# 431: [SVC Y - BUS 10106]
FILE: ...\Voltage Stability Model\fault_OLTC1.out
1.1000
0.10000
CHNL# 431: [SVC Y - BUS 10106]
FILE: fault_OLTC1_CLODAL.out
1.1000
0.10000
MODIFIED 1996 IEEE RELIABILITY TEST SYSTEM - 1 AREA
PEAK LOAD CONDITIONS
FRI, JUL 06 2007 13:57TIME (SECONDS)
SIEMENS POWER
TECHNOLOGIES
INTERNATIONAL
R
0.01.0000
2.00003.0000
4.00005.0000
6.00007.0000
8.00009.0000
10.000
SVC OUTPUT ADMITTANCE
Power Technology July 2009
Page 22
Conclusions
This paper presented a relatively small test system with documented voltage collapse/voltage stability problems.
These problems are identified using steady state tools (power flow, contingency analysis, and PV/QV analysis) and the dynamic simulation capability in PSS®E. In particular, the test system provides an example of the use of dynamic simulation models that are quite specific for the analysis of voltage collapse problems.
This test system will be incorporated in the example systems distributed with PSS®E. Meanwhile, the data is available in PSS®E rev. 31 format by request to the PSS®E support.
References
[1] Reliability Test System Task Force of the Application of Probability Methods Subcommittee – “IEEE Reliability Test System”, IEEE Trans. on PAS, vol. 98, no. 6, Nov./Dec. 1979, pp. 2047-2054.
[2] Reliability Test System Task Force of the Application of Probability Methods Subcommittee – “The IEEE Reliability Test System – 1996”, IEEE Trans. on PWRS, vol. 14, no. 3, Aug. 1999, pp. 1010-1020.
[3] Task Force on Overall Plant Response – “Dynamic Models for Steam and Hydro Turbines in Power System Studies”, IEEE Trans. on PAS, vol. 92, no. 12, Dec. 1973, pp. 1904-1915.
[4] Siemens PTI – “PSS®E Rev. 31 Program Application Guide”, vol. II, section 15.5.
[5] Rodolfo Koessler – “Dynamic Simulation of Static Var Compensators in Distribution Systems”, IEEE Trans. on PWRS, vol 7, no. 3, Aug. 1992, pp. 1285-1291.
[6] IEEE/CIGRÉ Joint Task Force on Stability Terms and Definitions – “Definition and Classification of Power System Stability”, IEEE Trans. on PWRS, vol. 19, no. 2, May 2004, pp. 1387-1401.
[7] Badrul H. Chowdhury and Carson W. Taylor – “Voltage Stability Analysis: V-Q Power Flow Simulation Versus Dynamic Simulation”, IEEE Trans. on PWRS, vol. 15, no. 4, Nov. 2000, pp. 1354-1359.
Related Documents