Copyright © Siemens AG 2009. All rights reserved. Siemens Q2 FY09 The Analyst Conference will take place in London, on April 29, at 4.00 p.m. CEST, and will be webcast on www.siemens.com/investorrelations The Press Conference will take place in Berlin, on April 29, at 9.00 a.m. CEST, and will be webcast on www.siemens.com/press IR FLASHLIGHT

Welcome message from author
This document is posted to help you gain knowledge. Please leave a comment to let me know what you think about it! Share it to your friends and learn new things together.
Transcript

Copyright © Siemens AG 2009. All rights reserved.
Siemens Q2 FY09
The Analyst Conference will take place in London,on April 29, at 4.00 p.m. CEST, and will be webcast on www.siemens.com/investorrelations
The Press Conference will take place in Berlin,on April 29, at 9.00 a.m. CEST, and will be webcast on www.siemens.com/press
IR FLASHLIGHT
Page 2 April 2009 Copyright © Siemens AG 2009. All rights reserved.Flashlight Q2 09
Safe Harbour Statement
This document contains forward-looking statements and information – that is, statements related to future, not past, events. These statements may be identified by words such as “expects,” “looks forward to,” “anticipates,” “intends,” “plans,” “believes,” “seeks,” “estimates,” “will,” “project” or words of similar meaning. Such statements are based on our current expectations and certain assumptions, and are, therefore, subject to certain risks and uncertainties. A variety of factors, many of which are beyond Siemens’ control, affect our operations, performance, business strategy and results and could cause the actual results, performance or achievements of Siemens to be materially different from any future results, performance or achievements that may be expressed or implied by such forward-looking statements. For us, particular uncertainties arise, among others, from changes in general economic and business conditions (including margin developments in major business areas and recessionary trends); the possibility that customers will delay conversion of booked orders into revenue or that our pricing power will be diminished by continued adverse market developments, to a greater extent than we currently expect; the behavior of financial markets, including fluctuations in interest and exchange rates, commodity and equity prices, debt prices (credit spreads) and financial assets generally; continued volatility and further deterioration of the capital markets; the commercial credit environment and, in particular, additional uncertainties arising out of the subprime, financial market and liquidity crises; future financial performance of major industries that we serve, including, without limitation, the Sectors Industry, Energy and Healthcare; the challenges of integrating major acquisitions and implementing joint ventures and other significant portfolio measures; introduction of competing products or technologies by other companies; lack of acceptance of new products or services by customers targeted by Siemens; changes in business strategy; the outcome of pending investigations and legal proceedings, including corruption investigations to which we are currently subject and actions resulting from the findings of these investigations; the potential impact of such investigations and proceedings on our ongoing business including our relationships with governments and other customers; the potential impact of such matters on our financial statements; as well as various other factors. More detailed information about certain of these factors is contained throughout this report and in our other filings with the SEC, which are available on the Siemens website, www.siemens.com, and on the SEC’swebsite, www.sec.gov. Should one or more of these risks or uncertainties materialize, or should underlying assumptions prove incorrect, actual results may vary materially from those described in the relevant forward-looking statement as expected, anticipated, intended, planned, believed, sought, estimated or projected. Siemens does not intend or assume any obligation to update or revise these forward-looking statements in light of developments which differ from those anticipated.
Adjusted or organic growth rates of revenue and new orders; Return on equity, or ROE; Return on capital employed, or ROCE; Cash conversion rate, or CCR; Free cash flow; Earnings before interest, taxes, depreciation and amortization, or EBITDA (adjusted); and Net debt are or may be non-GAAP financial measures. These supplemental financial measures should not be viewed in isolation as alternatives to measures of our financial condition, results of operations or cash flows as presented in accordance with IFRS in our Consolidated Financial Statements. A definition of these supplemental financial measures, a reconciliation to the most directly comparable IFRS financial measures and information regarding the usefulness and limitations of these supplemental financial measures can be found on our Investor Relations website at www.siemens.com/nonGAAP.
Page 3 April 2009 Copyright © Siemens AG 2009. All rights reserved.Flashlight Q2 09
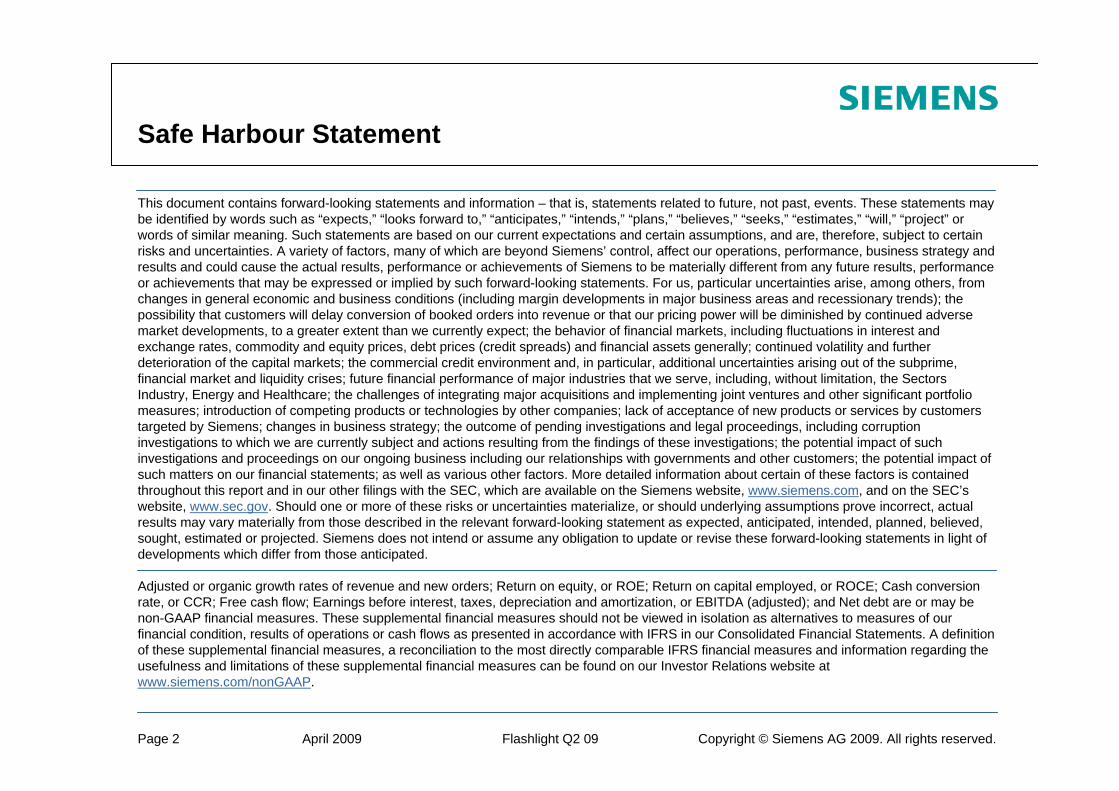
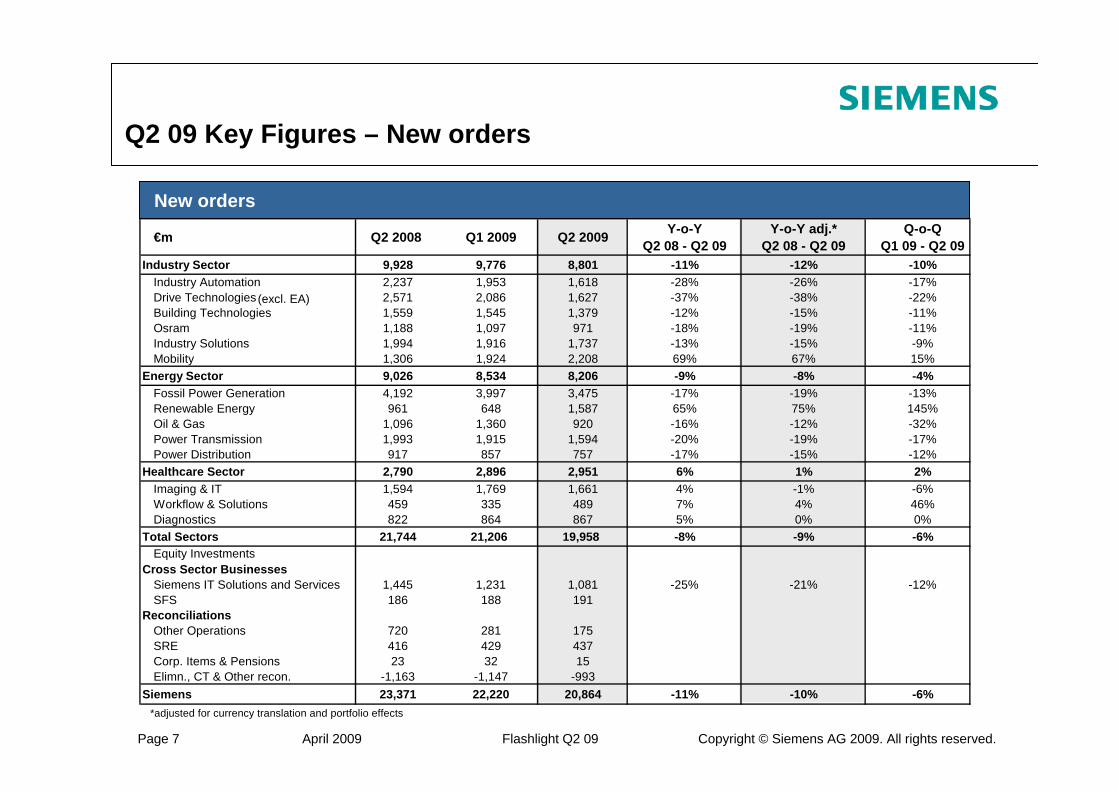
Top line benefiting from diversified portfolio: robust b-t-b at 1.1x driven by impressive Energy b-t-b at 1.3x; no material order cancellations
Orders down 10% y-o-y from a record quarter last year:
Industry (-12%): double digit decline across all divisions except Mobility (+67%) including a large order in China
Energy (-8%): overall order decline partly offset by Renewables (+75%) which won two large orders for offshore turbines; €1.5bn Iraq order booked in Q2
Healthcare (+1%) stable despite challenging US environment
Strong revenue growth (+5%) driven by Energy (+28%) due to excellent execution; Healthcare (+4%), solid growth at Imaging & IT +3%; Industry (-6%) impacted by the global downturn
Total sector profit of €1.8bn leading to a total sector profit margin of 10.2%
Margin pressure at short cycle businesses: IA 7.9% underlying, Osram 0.8% and DT 12.9% underlying; Electronic Assembly (Q2 09 loss €86m) reclassified from DT to Other Operations
Strong underlying incremental margin at Energy of 21% yoy
Healthcare holding up, Imaging stable on Q1 09 level
Clean quarter: EPS cont. ops. at €1.05
Strong free cash flow Total Sectors of €1.9bn at Q2 08 level benefiting from significantly improved working capital management
1) All figures on a comparable basis excluding currency translation and portfolio effects
Financial Highlights of Q2 09
Page 4 April 2009 Copyright © Siemens AG 2009. All rights reserved.Flashlight Q2 09
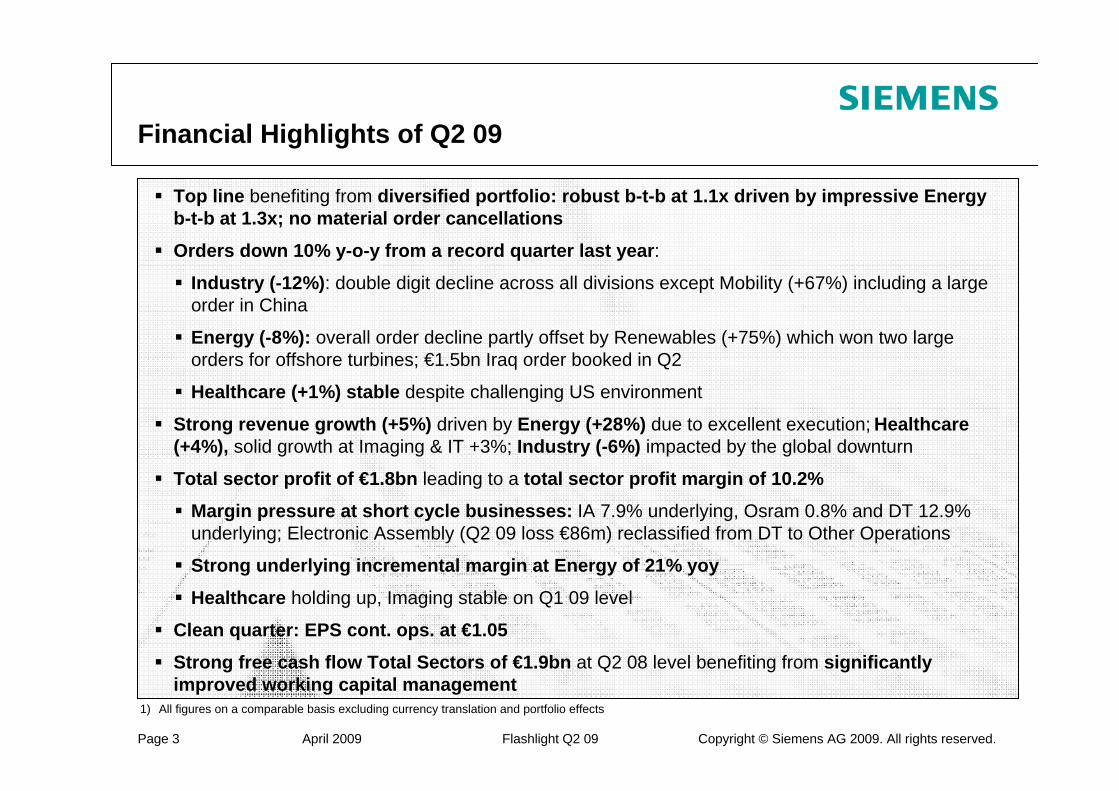
Key Items relating to Q2 09 (I)
IndustryIndustry Automation
– Margin: 5.8%, PPA1) €(36)m associated to UGS acquisition– Underlying margin: 7.9% excl. PPA– Q2 08: PPA €(26)m, OTC €(2)m, underlying margin 18.8%
Drive Technologies– Margin: 12.5%, PPA €(9)m associated to Flender acquisition– Underlying margin: 12.9% excl. PPA and Electronic Assembly (EA)– As of Q2 09 EA was transferred to Other Operations– Q2 09 loss at EA €(86)m incl. charges related to impairments and
severance expenses– Q2 08: PPA €(9)m, underlying margin 16.2% excl. PPA and EA
Building Technologies– Margin: 6.7%
Osram– Margin: 0.8%
IS– Margin: 6.7%– Q2 08: Disposal gain €30m, underlying margin: 5.7%
Mobility – Margin: 6.9%– Q2 08: Charges related to project reviews €(209)m, underlying
margin 6.9%
Energy
1) PPA = purchase price allocation; OTC = one-time costs
Fossil Power Generation– Margin: 13.1%
– Equity stake of Areva NP now accounted for as held for sale. Changes expected to substantially reduce volatility in Fossil's equity investment income
– Q2 08: Charges stemming from project reviews €(559)m,project review resulting in revenue reduction €(200)m, underlying margin 12.0%
Renewable Energy– Margin: 13.1%
Oil & Gas
– Margin: 11.6%
Power Transmission
– Margin: 11.2%
Power Distribution
– Margin: 12.5%
Page 5 April 2009 Copyright © Siemens AG 2009. All rights reserved.Flashlight Q2 09
Key Items relating to Q2 09 (II)
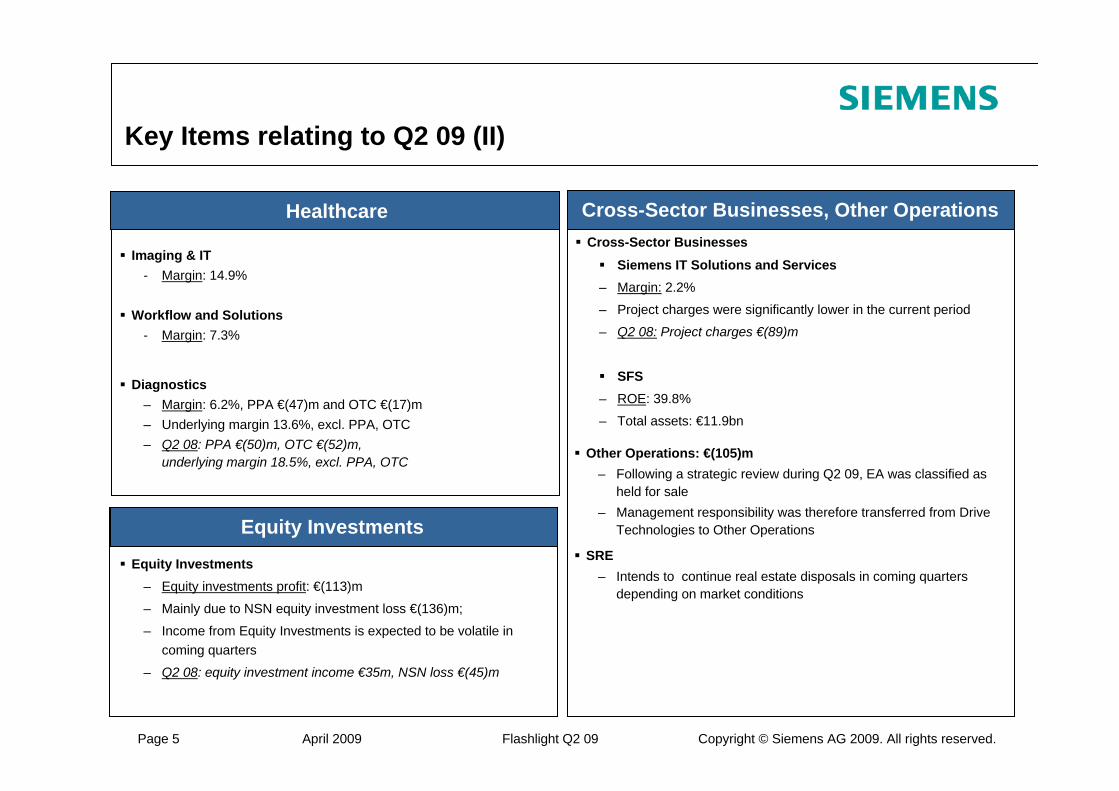
Healthcare Cross-Sector Businesses, Other Operations
Imaging & IT- Margin: 14.9%
Workflow and Solutions- Margin: 7.3%
Diagnostics– Margin: 6.2%, PPA €(47)m and OTC €(17)m – Underlying margin 13.6%, excl. PPA, OTC– Q2 08: PPA €(50)m, OTC €(52)m,
underlying margin 18.5%, excl. PPA, OTC
Equity Investments – Equity investments profit: €(113)m
– Mainly due to NSN equity investment loss €(136)m;
– Income from Equity Investments is expected to be volatile in coming quarters
– Q2 08: equity investment income €35m, NSN loss €(45)m
Cross-Sector Businesses Siemens IT Solutions and Services
– Margin: 2.2%
– Project charges were significantly lower in the current period
– Q2 08: Project charges €(89)m
SFS– ROE: 39.8%
– Total assets: €11.9bn
Equity Investments
Other Operations: €(105)m– Following a strategic review during Q2 09, EA was classified as
held for sale– Management responsibility was therefore transferred from Drive
Technologies to Other Operations
SRE– Intends to continue real estate disposals in coming quarters
depending on market conditions
Page 6 April 2009 Copyright © Siemens AG 2009. All rights reserved.Flashlight Q2 09
Key Items relating to Q2 09 (III)
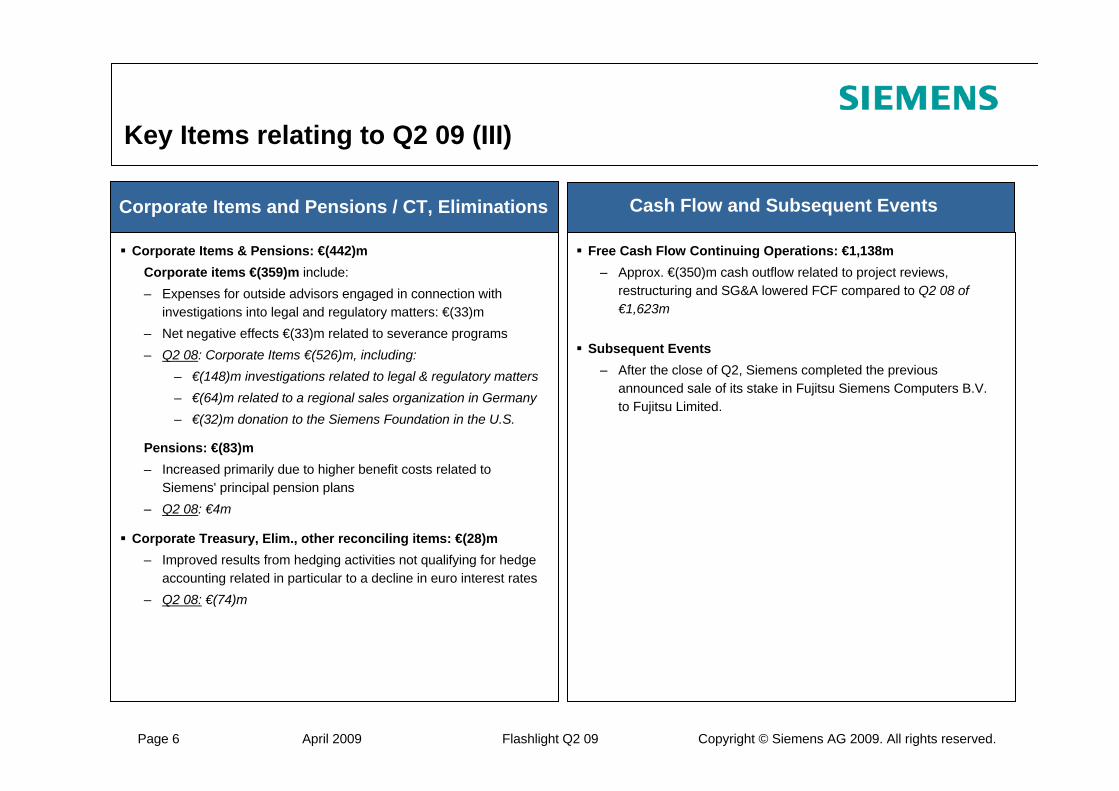
Corporate Items and Pensions / CT, Eliminations Cash Flow and Subsequent Events
Free Cash Flow Continuing Operations: €1,138m– Approx. €(350)m cash outflow related to project reviews,
restructuring and SG&A lowered FCF compared to Q2 08 of €1,623m
Subsequent Events– After the close of Q2, Siemens completed the previous
announced sale of its stake in Fujitsu Siemens Computers B.V. to Fujitsu Limited.
Corporate Items & Pensions: €(442)m Corporate items €(359)m include:– Expenses for outside advisors engaged in connection with
investigations into legal and regulatory matters: €(33)m – Net negative effects €(33)m related to severance programs– Q2 08: Corporate Items €(526)m, including:
– €(148)m investigations related to legal & regulatory matters– €(64)m related to a regional sales organization in Germany– €(32)m donation to the Siemens Foundation in the U.S.
Pensions: €(83)m– Increased primarily due to higher benefit costs related to
Siemens' principal pension plans– Q2 08: €4m
Corporate Treasury, Elim., other reconciling items: €(28)m– Improved results from hedging activities not qualifying for hedge
accounting related in particular to a decline in euro interest rates– Q2 08: €(74)m
Page 7 April 2009 Copyright © Siemens AG 2009. All rights reserved.Flashlight Q2 09
Q2 09 Key Figures – New orders
New orders
*adjusted for currency translation and portfolio effects
(excl. EA)
€m Q2 2008 Q1 2009 Q2 2009 Y-o-Y Q2 08 - Q2 09
Y-o-Y adj.*Q2 08 - Q2 09
Q-o-Q Q1 09 - Q2 09
Industry Sector 9,928 9,776 8,801 -11% -12% -10%Industry Automation 2,237 1,953 1,618 -28% -26% -17%Drive Technologies 2,571 2,086 1,627 -37% -38% -22%Building Technologies 1,559 1,545 1,379 -12% -15% -11%Osram 1,188 1,097 971 -18% -19% -11%Industry Solutions 1,994 1,916 1,737 -13% -15% -9%Mobility 1,306 1,924 2,208 69% 67% 15%
Energy Sector 9,026 8,534 8,206 -9% -8% -4%Fossil Power Generation 4,192 3,997 3,475 -17% -19% -13%Renewable Energy 961 648 1,587 65% 75% 145%Oil & Gas 1,096 1,360 920 -16% -12% -32%Power Transmission 1,993 1,915 1,594 -20% -19% -17%Power Distribution 917 857 757 -17% -15% -12%
Healthcare Sector 2,790 2,896 2,951 6% 1% 2%Imaging & IT 1,594 1,769 1,661 4% -1% -6%Workflow & Solutions 459 335 489 7% 4% 46%Diagnostics 822 864 867 5% 0% 0%
Total Sectors 21,744 21,206 19,958 -8% -9% -6%Equity Investments
Cross Sector BusinessesSiemens IT Solutions and Services 1,445 1,231 1,081 -25% -21% -12%SFS 186 188 191
ReconciliationsOther Operations 720 281 175SRE 416 429 437Corp. Items & Pensions 23 32 15Elimn., CT & Other recon. -1,163 -1,147 -993
Siemens 23,371 22,220 20,864 -11% -10% -6%
Page 8 April 2009 Copyright © Siemens AG 2009. All rights reserved.Flashlight Q2 09
Q2 09 Key Figures – Revenue
Revenue
*adjusted for currency translation and portfolio effects
(excl. EA)
€m Q2 2008 Q1 2009 Q2 2009 Y-o-Y Q2 08 - Q2 09
Y-o-Y adj.*Q2 08 - Q2 09
Q-o-Q Q1 09 - Q2 09
Industry Sector 8,980 9,288 8,645 -4% -6% -7%Industry Automation 2,122 1,977 1,685 -21% -19% -15%Drive Technologies 2,106 2,060 1,954 -7% -10% -5%Building Technologies 1,432 1,531 1,443 1% -3% -6%Osram 1,188 1,097 971 -18% -19% -11%Industry Solutions 1,586 1,796 1,759 11% 7% -2%Mobility 1,351 1,564 1,542 14% 15% -1%
Energy Sector 4,964 6,232 6,364 28% 28% 2%Fossil Power Generation 1,732 2,373 2,377 37% 35% 0%Renewable Energy 417 713 800 92% 88% 12%Oil & Gas 981 1,048 1,040 6% 12% -1%Power Transmission 1,256 1,500 1,503 20% 21% 0%Power Distribution 699 805 846 21% 23% 5%
Healthcare Sector 2,722 2,936 2,984 10% 4% 2%Imaging & IT 1,629 1,769 1,774 9% 3% 0%Workflow & Solutions 376 373 412 10% 7% 10%Diagnostics 816 872 867 6% 0% -1%
Total Sectors 16,666 18,456 17,993 8% 6% -3%Equity Investments
Cross Sector BusinessesSiemens IT Solutions and Services 1,266 1,289 1,136 -10% -4% -12%SFS 186 188 191
ReconciliationsOther Operations 730 327 211SRE 416 429 437Corp. Items & Pensions 17 23 18Elimn., CT & Other recon. -1,187 -1,078 -1,031
Siemens 18,094 19,634 18,955 5% 5% -3%

Page 9 April 2009 Copyright © Siemens AG 2009. All rights reserved.Flashlight Q2 09
Q2 09 Key Figures – Profit and margin
Profit and margin
*RoE
(excl. EA)
€m Q2 2008 Q1 2009 Q2 2009 MarginQ2 2008
MarginQ1 2009
MarginQ2 2009
Target range
Industry Sector 941 934 671 10.5% 10.1% 7.8% 9-13%Industry Automation 371 255 97 17.5% 12.9% 5.8% 12-17%Drive Technologies 332 260 244 15.8% 12.6% 12.5% 11-16%Building Technologies 109 124 97 7.6% 8.1% 6.7% 7-10%Osram 122 92 8 10.3% 8.4% 0.8% 10-12%Industry Solutions 121 119 118 7.6% 6.6% 6.7% 5-7%Mobility -116 85 106 -8.6% 5.4% 6.9% 5-7%
Energy Sector 6 756 818 0.1% 12.1% 12.9% 11-15%Fossil Power Generation -328 289 312 -18.9% 12.2% 13.1% 11-15%Renewable Energy 35 101 105 8.4% 14.2% 13.1% 12-16%Oil & Gas 78 106 121 8.0% 10.1% 11.6% 10-14%Power Transmission 144 152 168 11.5% 10.1% 11.2% 10-14%Power Distribution 77 107 106 11.0% 13.3% 12.5% 11-15%
Healthcare Sector 341 342 355 12.5% 11.6% 11.9% 14-17%Imaging & IT 236 262 265 14.5% 14.8% 14.9% 14-17%Workflow & Solutions 63 -6 30 16.8% -1.6% 7.3% 11-14%Diagnostics 49 83 54 6.0% 9.5% 6.2% 16-19%
Total Sectors 1,288 2,032 1,844 7.7% 11.0% 10.2%Equity Investments 35 85 -113
Cross Sector BusinessesSiemens IT Solutions and Services -35 46 25 -2.8% 3.6% 2.2% 5-7%SFS 101 66 117 46.8% 23.4% 39.8% 20-23%*
ReconciliationsOther Operations -64 -40 -105SRE 60 45 37Corporate Items and Pensions -522 -236 -442Elimn., CT & Other recon. -74 -263 -28
Siemens Pre-Tax Profit 789 1,735 1,335Taxes -224 -475 -380
Income from Cont. Operations 565 1,260 955Income from discontinued operations -153 -30 58
Net Income (All-In) 412 1,230 1,013Minority interest 28 27 51Basic EPS from Cont. Operations 0.59 1.43 1.05Basic EPS from Net income (all-in) 0.42 1.40 1.11

Page 10 April 2009 Copyright © Siemens AG 2009. All rights reserved.Flashlight Q2 09
Adj. ind.Net DebtQ1 FY 09
-5.3
Net DebtAdj.
-14.2
Net DebtQ1 FY09
2.1
Profita-bility
-0.3
NetWorkingcapital
-0.1
-8.9
Other Operating Activities
-0.3
Net Cash from
Investing Activities
-2.1
Key Financing Activities
-14.9
Net DebtQ2 FY09
-6.0
Under-funding
-0.3
Creditguarantee
9.8
SFS Debt
0.9
Hybrid Adj.
-10.6
Adj. ind.Net DebtQ2 FY09
Q2 09 Net Debt Bridge:Industrial net debt increase mostly driven by gap in pension funding
Net Cash from Operating
Activities
Change in NWC e.g.Inventories -0.3Trade and other receivables +1.1Other current assets -0.7Trade payables -0.1
Therein e.g.Dividends paid -1.4Interest paid -0.1FX effects on net debt -0.5
Pension deficit -5.3OPEB -0.6
€bn
Adj. ind. ND/EBITDA1)
0.86x
Adj. ind. ND/EBITDA2)
1.12x
1) EBITDA annualised: Q1 FY09 x 42) EBITDA annualised: H1 FY09 x 2

Page 11 April 2009 Copyright © Siemens AG 2009. All rights reserved.Flashlight Q2 09
Underfunding increased primarily due to a negative €1.1bn return on plan assets in Q2, both in equities and fixed income investmentsThe DBO remains unchanged in Q2 as increase in discount rate could compensate for serviceand interest cost
29%61%9%1%
(2.2)
0.00.60.6
(2.5)
22.76.2%20.2
FY 08
0.00.10.6
0.00.80.8
Additional contributionRegular fundingDBO of Principal Other Post-Employment Benefits1)
(5.3)(1.0)Funded status
23%63%10%4%
33%54%8%5%
Asset allocation of pension assetsEquitiesFixed incomeReal estateCash
(1.2)1.3Actual return on plan assets
23.75.8%18.4
25.05.3%24.0
Defined benefit obligation (DBO) of Principal Pension BenefitsDiscount rateFair Value of plan assets
Q2 FY 09FY 07According to 20F, in €bn
Pension underfunding increased by €1.0bn to -€5.3bn in Q2 FY09
1) Mainly unfunded
Page 12 April 2009 Copyright © Siemens AG 2009. All rights reserved.Flashlight Q2 09
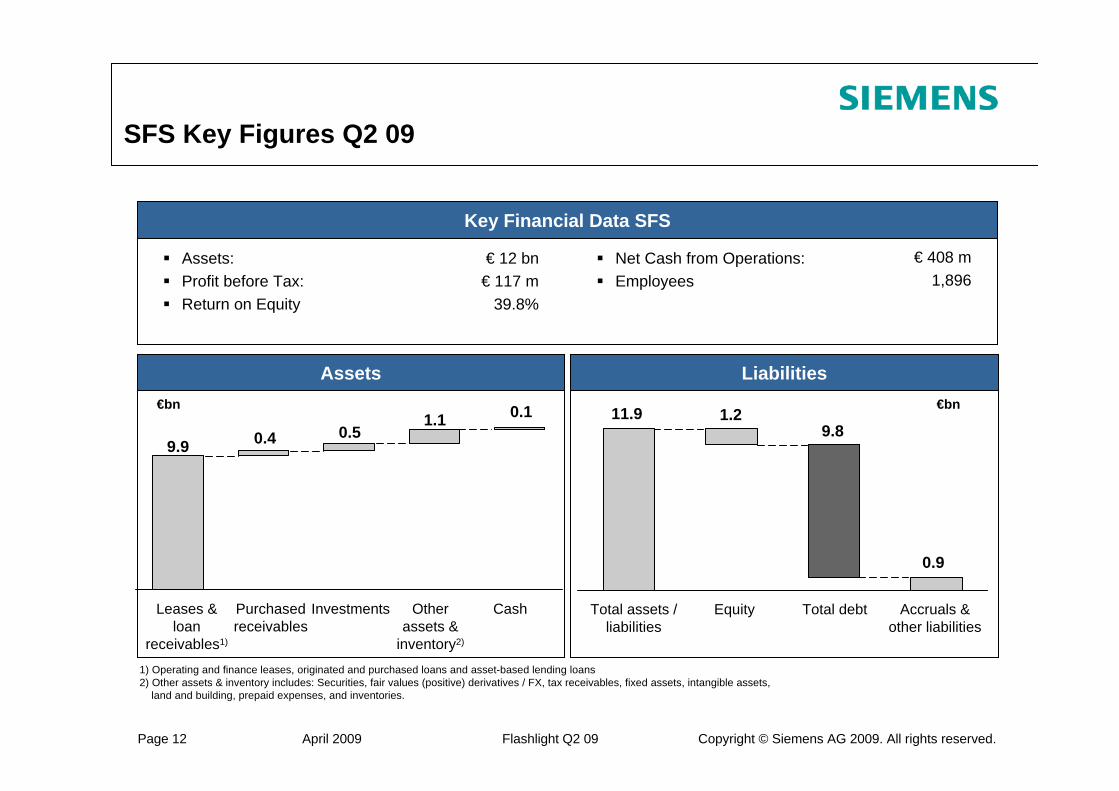
SFS Key Figures Q2 09
Key Financial Data SFS
Assets: Profit before Tax:Return on Equity
€ 12 bn€ 117 m
39.8%
Net Cash from Operations:Employees
€ 408 m1,896
Assets Liabilities
1) Operating and finance leases, originated and purchased loans and asset-based lending loans2) Other assets & inventory includes: Securities, fair values (positive) derivatives / FX, tax receivables, fixed assets, intangible assets,
land and building, prepaid expenses, and inventories.
Equity Total debt
11.99.8
Accruals & other liabilities
Total assets / liabilities
0.1
CashOtherassets &
inventory2)
InvestmentsPurchased receivables
Leases &loan
receivables1)
€bn1.2
0.9
9.9 0.4 0.51.1
€bn
Page 13 April 2009 Copyright © Siemens AG 2009. All rights reserved.Flashlight Q2 09
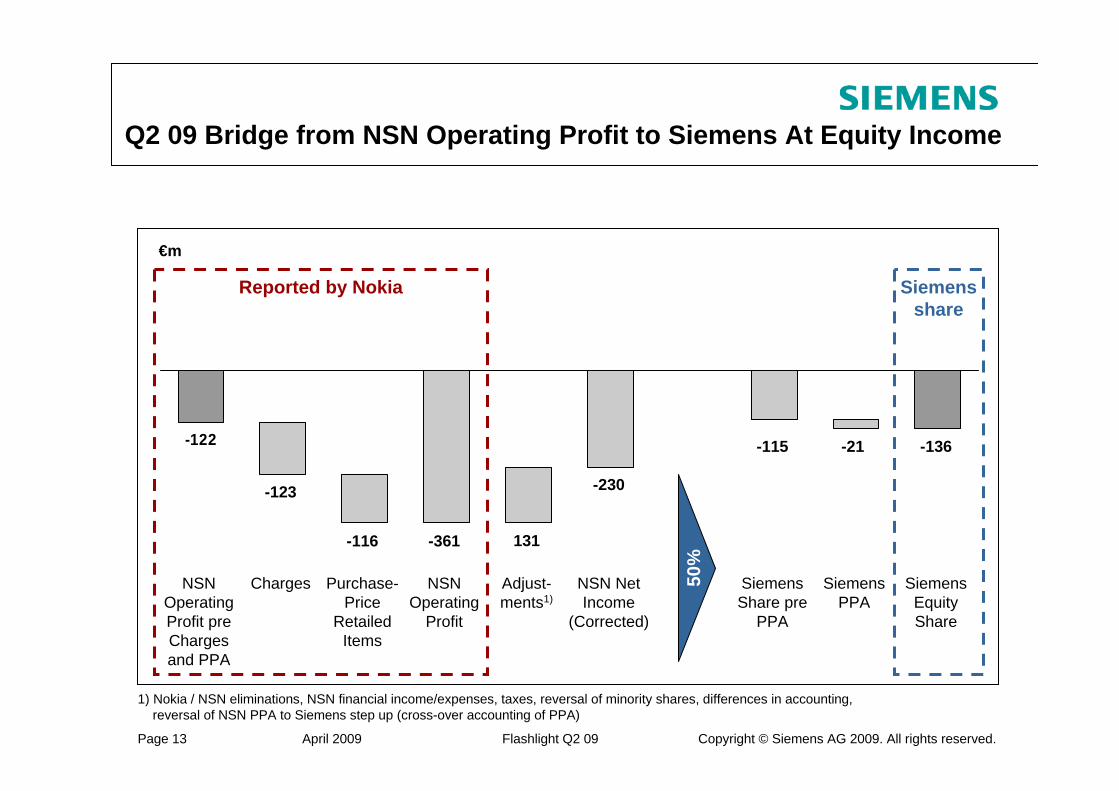
-122
-123
NSN Operating
Profit
Charges Purchase-Price
Retailed Items
-361 131
Adjust-ments1)
NSN Net Income
(Corrected)
-230
-116
NSN Operating Profit pre Charges and PPA
-115
Siemens Share pre
PPA
-21
Siemens PPA
-136
Siemens Equity Share
€m
Q2 09 Bridge from NSN Operating Profit to Siemens At Equity Income
1) Nokia / NSN eliminations, NSN financial income/expenses, taxes, reversal of minority shares, differences in accounting,reversal of NSN PPA to Siemens step up (cross-over accounting of PPA)
50%
Siemens share
Reported by Nokia

Page 14 April 2009 Copyright © Siemens AG 2009. All rights reserved.Flashlight Q2 09
Siemens investor relations contact data
Mariel von Drathen +49-89-636-33780
Munich Office +49-89-636-32474
US Office +1-408-464-2004
Internet: http://www.siemens.com/investorrelations
Email: [email protected]
Fax: +49-89-636-32830
Page 15 April 2009 Copyright © Siemens AG 2009. All rights reserved.Flashlight Q2 09
Reconciliation and Definitions forNon-GAAP Measures (I)
To supplement Siemens' Consolidated Financial Statements presented in accordance with International Financial Reporting Standards, or IFRS, Siemens presents the following financial measures:
Adjusted or organic growth rates of Revenue and new orders;Return on equity, or ROE;Return on capital employed, or ROCE;Cash conversion rate, or CCR, and free cash flow;Earnings before interest, taxes, depreciation and amortization, or EBITDA (adjusted); andNet debt
These supplemental financial measures are or may be "non-GAAP financial measures," as defined in the rules of the U.S. Securities and Exchange Commission. They exclude or include amounts that are included or excluded, as applicable, in the calculation of the most directly comparable financial measures calculated in accordance with IFRS, and their usefulness is therefore subject to limitations, which are described below under "Limitations on Usefulness of Non-GAAP Financial Measures." Accordingly, they should not be viewed in isolation as alter-natives to the most directly comparable financial measures calculated in accordance with IFRS, as identified in the following discussion, and they should be considered in conjunction with Siemens’ Consolidated Financial Statements presented in accordance with IFRS and the Notes to Consolidated Financial Statements. Siemens’ most recent annual Consolidated Financial Statements at any given time (the "Annual Financial Statements") can be found in the most recent Annual Report of Siemens (the "Annual Report"), which can be accessed at www.siemens.com/annual-report. Siemens' most recent interim Consolidated Financial Statements (the "Interim Financial Statements") at any given time can be found at www.siemens.com/investors under the heading "Publications" – "Financial Publications" – "Financial Statements" or in the most recent Quarterly Report of Siemens (the "Quarterly Reports"), which can be accessed at www.siemens.com/quarterly-reports.
In addition, in considering these supplemental financial measures, investors should bear in mind that other companies that report similarly titled financial measures may calculate them differently. Accordingly, investors should exercise appropriate caution in comparing these supplemental financial measures to similarly titled financial measures reported by other companies.
Definitions, most directly comparable IFRS financial measures and usefulness of Siemens’ supplemental financial measuresSiemens’ supplemental financial measures focus on growth, capital efficiency, cash generation, and optimization of Siemens' capital structure and therefore are included within Siemens’ Fit42010 strategic program. The following discussion provides definitions of these supplemental financial measures, the most directly comparable IFRS financial measures and information regarding the usefulness of these supplemental financial measures.

Page 16 April 2009 Copyright © Siemens AG 2009. All rights reserved.Flashlight Q2 09
Reconciliation and Definitions forNon-GAAP Measures (II)
Adjusted or organic growth rates of Revenue and ordersIn its financial reports, Siemens presents, on a worldwide basis and for its Sectors and Cross-Sector Businesses, the percentage change from period to period in Revenue as adjusted for currency translation effects and portfolio effects, i.e., the effects of acquisitions and dispositions. These adjusted percentage changes are called adjusted or organic rates of growth in Revenue. The IFRS financial measure most directly comparable to adjusted or organic growth rates of Revenue is the growth rate of Revenue calculated based on the Revenue figure as presented in the Consolidated Income Statement. Siemens believes that meaningful analysis of trends in Revenue from one period to the next requires an understanding of the quantitative impact of these effects, and accordingly Siemens management considers adjusted or organic rates of growth in Revenue in its management of Siemens’ business. For this reason, Siemens believes that investors’ ability to assess Siemens’ overall performance may be improved by disclosure of this information.Under Siemens’ policy for the recognition of new orders, Siemens generally recognizes a new order when it enters into a contract that it considers “effective and binding” based on its review of a number of different criteria. In general, if a contract is considered effective and binding, Siemens recognizes the total contract value as promptly as practicable. There is no standard system for compiling new order information among companies in our fields of activities. Accordingly, Siemens’ new order totals may not be comparable with new order totals reported by other companies. Contract value is the agreed price or fee of the irrevocable portion of the contract to deliver goods and/or render services. New orders is not required or defined by IFRS. Furthermore, Siemens’ new order totals are not audited; however Siemens does subject its new orders to internal documentation and review requirements.
Return on equity, or ROEIn contrast, and in line with common practice in financial services, the profitability measure for Siemens Financial Services (SFS) is return on equity, or ROE. Siemens defines ROE as annualized Income before income taxes of SFS divided by the average allocated equity for SFS. The allocated equity for SFS is determined and influenced by the size and quality of its portfolio of commercial finance assets (primarily leases) and equity investments. This allocation is designed to cover the risks of the underlying business and is in line with common credit risk management standards in banking. The actual risk portfolio of the SFS portfolio is evaluated and controlled monthly and is reflected in the quarterly (commercial finance) and annual (equity investments) adjustments of allocated equity. Annualized income before income taxes of SFS for any quarter is calculated as Income before income taxes multiplied by four.Return on equity is reported only for the segment SFS. Because Siemens management uses ROE as a supplement to Siemens’ Consolidated Financial Statements in evaluating the business performance of SFS, Siemens believes that investors’ ability to assess Siemens’ overall performance may be improved by disclosure of this information.
Page 17 April 2009 Copyright © Siemens AG 2009. All rights reserved.Flashlight Q2 09
Reconciliation and Definitions forNon-GAAP Measures (III)
Return on Capital Employed, or ROCEReturn on capital employed, or ROCE is Siemens’ measure of capital efficiency. Siemens uses this financial performance ratio in order to assess its income generation from the point of view of its shareholders and creditors, who provide Siemens with equity and debt. ROCE is used as a measure of how capital invested in the Company or the Sectors yields competitive returns. Achievement of predetermined targets relating to ROCE is one of the factors taken into account in determining the amount of performance-based or variable compensation received by Siemens management.
Because Siemens management uses ROCE as a supplement to Siemens’ Consolidated Financial Statements in evaluating Siemens’ business performance, Siemens believes that investors’ ability to assess Siemens’ overall performance may be improved by disclosure of this information.
ROCE on a Siemens group levelSiemens defines ROCE as Net income (before interest) divided by average capital employed, or CE.
Net income (before interest), the numerator in the ROCE calculation, is defined as Net income excluding Other interest income (expense), net and excluding taxes on Other interest income (expense), net. Taxes on Other interest (expense), net are calculated in a simplified form by applying the current tax rate, which can be derived from the Consolidated Statements of Income, to Other interest income (expense), net.
Capital employed, the denominator in the ROCE calculation, is defined as Total equity plus Long-term debt plus Short-term debt and current maturities of long-term debt minus Cash and cash equivalents. Each of the components of capital employed appears on the face of the Consolidated Balance Sheet.
ROCE on a Siemens group level, on a continuing operations basisSiemens also presents ROCE on a continuing operations basis. For this purpose, the numerator is Income from continuing operations and the denominator is capital employed, less Assets classified as held for disposal presented as discontinued operations net of Liabilities associated with assets held for disposal presented as discontinued operations.
ROCE on a Sector levelFor the Sectors, ROCE is defined as Profit divided by average Assets. Profit for each Sector is defined as earnings before financing interest, certain pension costs and income taxes; certain items not considered performance-indicative by management may be excluded. Assets for each Sector are defined as Total assets less intragroup financing receivables and investments, less income tax assets, less non-interest-bearing liabilities/provisions other than tax liabilities.
Page 18 April 2009 Copyright © Siemens AG 2009. All rights reserved.Flashlight Q2 09
Reconciliation and Definitions forNon-GAAP Measures (IV)
Cash conversion rate and free cash flowCash conversion rate, or CCR is a operational performance measure, which shows us how much of our income we are converting to free cash flow. Siemens defines cash conversion rate as free cash flow divided by Net income. Cash conversion rate is reported on a regular basis to Siemens management.Siemens defines free cash flow as Net cash provided by (used in) operating activities less Additions to intangible assets and property, plant and equipment. The IFRS financial measure most directly comparable to free cash flow is Net cash provided by (used in) operating activities.Free cash flow is a cash measure that is not impacted by cash flows related to portfolio activities, and it is therefore less volatile than the total of Net cash provided by (used in) operating activities and Net cash provided by (used in) investing activities. For this reason, free cash flow is reported on a regular basis to Siemens management and used by management to assess and manage cash generation among the various reportable segments of Siemens and for the worldwide Siemens group. Achievement of predetermined targets relating to free cash flow generation is one of the factors taken into account in determining the amount of performance-based or variable compensation received by Siemens management, both at the level of the worldwide Siemens group and at the level of individual reportable segments. For these reasons, Siemens believes that investors' ability to assess Siemens' overall performance may be improved by disclosure of this information.EBITDA (adjusted)Siemens defines EBITDA (adjusted) as EBIT (adjusted) before amortization (which is in turn defined as Amortization and impairments of intangible assets other than goodwill) and Depreciation and impairment of property, plant and equipment and goodwill. Siemens defines EBIT (adjusted) as Income from continuing operations before income taxes less Financial income (expense), net and Income (loss) from investments accounted for using the equity method, net. Each of these components of EBIT (adjusted) appears on the face of the Consolidated Financial Statements presented in accordance with IFRS. Each of the additional components of EBITDA (adjusted) appears in the Consolidated Financial Statements or the MD&A thereto. The IFRS financial measure most directly comparable to EBIT (adjusted) and EBITDA (adjusted) is Income from continuing operations before income taxes. EBITDA (adjusted) is part of a capital structure measure which is calculated as the ratio of adjusted industrial net debt to EBITDA (adjusted). Adjusted industrial net debt is defined as net debt (see below) less (1) SFS debt excluding SFS internally purchased receivables, less (2) 50% of the nominal amount of our hybrid bond; plus (3) the funded status of pension benefits; plus (4) the funded status of other post-employment benefits; and plus (5) credit guarantees. Further information concerning adjusted industrial net debt can be found in the Annual Report under the heading "Management's discussion and analysis – Liquidity and capital resources – Capital structure." Siemens management uses this measure to manage its debt-equity ratio with the goal of ensuring both unrestricted access to debt financing instruments in the capital markets and its ability to meet scheduled debt service obligations.Further EBIT (adjusted) and EBITDA (adjusted) are also broadly used by analysts, rating agencies and investors for performance assessment, and Siemens therefore believes that investors’ ability to assess Siemens' overall performance may be improved by disclosure of this information.
Page 19 April 2009 Copyright © Siemens AG 2009. All rights reserved.Flashlight Q2 09
Reconciliation and Definitions forNon-GAAP Measures (V)
Net debtSiemens defines net debt as total debt less total liquidity. Total debt is defined as Short-term debt plus current maturities of long-term debt plus long-term debt. Total liquidity is defined as Cash and cash equivalents plus current Available-for-sale financial assets. Each of these components appears in the Consolidated Balance Sheet. The IFRS financial measure most directly comparable to net debt is total debt as reported in the Notes to Consolidated Financial Statements.
Siemens management reviews net debt regularly as part of its management of Siemens' overall liquidity, financial flexibility, capital structure and leverage. Furthermore, certain debt rating agencies, creditors and credit analysts monitor Siemens' net debt as part of their assessments of Siemens' business. For these reasons, Siemens believes that investors’ ability to assess Siemens' overall performance may be improved by disclosure of this information.
Limitations Associated with Siemens’ Supplemental Financial MeasuresThe supplemental financial measures reported by Siemens may be subject to limitations as analytical tools. In particular:
With respect to adjusted or organic percentage change in Revenue and new orders: These measures are not adjusted for other effects, such as increases or decreases in prices or quantity/volume.With respect to return on equity, or ROE: This measure is not adjusted for special items, such as the disposition of equity investments (allocated to SFS) or impairments, and therefore it has been volatile over prior year periods. In addition, the use of this measure is inherently limited by the fact that it is a ratio.With respect to return on capital employed, or ROCE: The use of this measure is inherently limited by the fact that it is a ratio.With respect to cash conversion rate and free cash flow: In addition to capital expenditures needed to maintain or grow its business, Siemens requires cash for a wide variety of non-discretionary expenditures, such as interest and principal payments on outstanding debt, dividend payments or other operating expenses. Free cash flow therefore should not be viewed as a measure of cash generated by operations that is available exclusively for discretionary expenditures. In addition, the use of cash conversion rate is inherently limited by the fact that it is a ratio.With respect to EBIT (adjusted) and EBITDA (adjusted): Financial income and taxes are significant cash expenses that may reduce the amount of cash available for distribution to shareholders or reinvestment in the business. EBIT (adjusted) does not reflect these expenses. Items such as depreciation and amortization, while not directly affecting Siemens’ cash position, represent the loss in value of assets over time. The expense associated with, and accordingly the full economic effect of this loss in value are not reflected in EBITDA (adjusted).With respect to net debt: Siemens typically needs a considerable portion of its cash, cash equivalents and available-for-sale financial assets at any given time for purposes other than debt reduction. The deduction of these items from total debt in the calculation of net debt therefore should not be understood to mean that these items are available exclusively for debt reduction at any given time.

Page 20 April 2009 Copyright © Siemens AG 2009. All rights reserved.Flashlight Q2 09
Reconciliation and Definitions forNon-GAAP Measures (VI)
Compensation for Limitations Associated with Siemens' Supplemental Financial MeasureSiemens provides a quantitative reconciliation of each supplemental financial measure to the most directly comparable IFRS financial measure either in this document, in the Notes to Consolidated Financial Statements or in the Annual Reports and Quarterly Reports under the heading “Management’s discussion and analysis,” and Siemens encourages investors to review those reconciliations carefully.
Related Documents