Welcome message from author
This document is posted to help you gain knowledge. Please leave a comment to let me know what you think about it! Share it to your friends and learn new things together.
Transcript


Analyst: Massimo Bonisoli, CFA| [email protected]| +39 02 6204 271
HOLD (n.a.)
Target: €11.60 (n.a.) | Risk: High
July 25, 2019 1 #251
EQUITY RESEARCH
ITALY | Chemical
[1] Italian GAAP*adj. for PPA (excluded in IFRS)
PRICE ORD LAST 365 DAYS
SICIT: AN EXCELLENCE IN THE GREEN ECONOMY
SICIT is a leading company in the fast growth market of biostimulants for
agriculture and retardant for gypsum materials through the recycling of
waste from the tanning industry in the region of Veneto. Its ambitious growth
plan aims to almost double revenues by 2022-23 through the debottleneck of
its existing two plants, the opening of new capacity in Latam, and a new
granular fertilizer plant. Despite the compelling investment case, we initiate
coverage with a Hold recommendation and €11.60 target price as we believe
FY19 will show limited earnings growth due to the unfavourable trading
environment in agrochem and construction markets. The stock already trades
at 25% discount vs agrochem cluster, therefore we see also relatively limited
downside. We would be more positive on the stock once the effects on
earnings from its capex plan start to be visible.
Circular economy from the beginning
SICIT (acronym of Società Industrie Chimiche Italiane) is a chemical company
which treats the waste material from the tanning industry and transforms it
into valuable raw materials (protein hydrolysates) for agricultural and / or
industrial use (biostimulants, plaster retardants and fats).
Strong growth trend for biostimulants and retarders
SICIT enjoys strong demand driven by underlying macro-trends.
- The market for biostimulants (55% revenues) is expected to increase at
low double digit CAGR driven by the farmers’ needs of: 1. Higher yield; 2.
Lower input cost; 3. Sustainable farming; 4 Organic Farming;
- The market for plaster retardant (30% revenues) is expected to expand at
high single-digit CAGR trailing the increasing penetration of gypsum as a
building material;
- Fat (15% of revenues) mainly for biofuel, is a commoditized market. The
plan will allow to improve the value of the product.
Growth largely visible from 2020
We assume a 4% EBITDA growth in FY19. The weak trading environment in agrochem and construction markets will somewhat cap the EBITDA expansion in FY19. Most of the earnings growth will be visible from FY20 when the investment plan starts to have sizeable effects – we assume a 13% CAGR
over 2019-22.
A key player in the organic recycling economy
SICIT is a strong player of the circular economy at the beginning of an exciting investment plan:
- The compelling growth opportunities are driven by the exposure to fast growing products and its organic expansion; we assume top line and EBITDA growth by respectively 12% and 13%;
- The sound profitability (EBITDA margins >40%) is the result of the recycling activity and the superior production process;
- The stock trades at compelling multiples: EV/EBITDA 6.9x FY19, some 25% discount to relevant agrochem peers.
Our vision on the stock would be positive in the absence of clouds
surrounding the SICIT trading environment in FY19 in key end markets of
agrochem and construction industries. We believe FY20 will improve
materially thanks to product launches and a more benign commodity price
environment.
SICIT | Initiation of coverage
STOCK DATA
Price € 9.73
Bloomberg code SICT IM
Market Cap. (€ mn) 193
Free Float 51%
Shares Out. (mn) 19.8
52-week range 9.21 - 12.5
Daily Volumes ('000) 14.0
PERFORMANCE 1M 3M 12M
Absolute -2.2% -18.2% -6.5%
Rel. to FTSE all shares -6.5% -19.3% -16.8%
MAIN METRICS [1]
€ M N 2018 2019E 2020E
Revenues 55.1 57.1 62.7
Adjusted EBITDA 22.7 23.7 26.5
Adj. net income* 13.4 13.8 14.7
Adj. EPS - € cents 67.4 69.5 74.1
DPS ord - € cents 34.0 35.7 37.1
MULTIPLES 2018 2019E 2020E
P/E adj* 14.4 x 14.0 x 13.1 x
P/E EX CASH Adj* 13.3 x 12.0 x 11.6 x
Adj. EV/EBITDA 7.9 x 7.0 x 6.4 x
EV/EBITDA 7.6 x 7.0 x 6.4 x
REMUNERATION 2018 2019E 2020E
Div. Yield ord 3.5% 3.7% 3.8%
FCF yield 3.2% 0.6% 1.1%
INDEBTEDNESS 2018 2019E 2020E
Net Cash (Debt) 14.5 27.6 22.6
Debt/EBITDA n.m. n.m. n.m.
Interests cov n.m. n.m. n.m.

2
SICIT | July 25, 2019
MAIN FIGURES [1] €M 2017 2018 2019E 2020E 2021E 2022E
Revenues 53.9 55.1 57.1 62.7 75.0 86.5
Growth 19% 2% 4% 10% 20% 15%
EBITDA 22.2 23.6 23.7 26.5 32.0 37.4
Growth 26% 6% 0% 12% 21% 17%
Adjusted EBITDA 22.2 22.7 23.7 26.5 32.0 37.4
Growth 26% 2% 4% 12% 21% 17%
Adj. EBIT 17.9 18.0 18.6 19.9 24.0 28.0
Growth 30% 0% 3% 7% 21% 17%
Profit before tax 17.7 18.2 14.5 15.8 19.9 23.9
Growth 28% 3% -20% 9% 26% 20%
Adj. net income* 12.9 13.4 13.8 14.7 17.8 20.7
Growth 32% 3% 3% 7% 21% 17%
Net income 12.9 13.4 9.7 10.6 13.7 16.6
Growth 32% 3% -28% 10% 29% 22%
MARGIN 2017 2018 2019E 2020E 2021E 2022E
Ebitda Margin 41.1% 42.7% 41.4% 42.2% 42.7% 43.2%
Ebitda adj Margin 41.1% 41.1% 41.4% 42.2% 42.7% 43.2%
Ebit adj Margin 33.3% 32.6% 32.6% 31.7% 32.0% 32.4%
Pbt adj Margin 32.9% 33.1% 25.4% 25.2% 26.6% 27.7%
Ni adj margin 24.0% 24.2% 24.1% 23.5% 23.7% 24.0%
Ni rep margin 24.0% 24.2% 16.9% 16.9% 18.2% 19.3%
SHARE DATA [1] 2017 2018 2019E 2020E 2021E 2022E
EPS - € cents 65.2 67.4 48.8 53.5 69.0 84.0
Growth - 3% -28% 10% 29% 22%
Adj. EPS - € cents* 65.2 67.4 69.5 74.1 89.7 104.7
Growth - 3% 3% 7% 21% 17%
DPS ord - € cents 0.0 34.0 35.7 37.1 44.8 52.3
BVPS - € 3.1 3.5 6.8 7.0 7.3 7.7
VARIOUS - € MN 2017 2018 2019E 2020E 2021E 2022E
Capital employed 45.9 55.4 107.4 115.9 125.4 124.5
FCF 9.3 6.2 1.1 2.1 4.2 17.6
Capex 7.4 8.4 17.0 18.0 19.0 10.0
Working capital 11.5 11.6 12.2 13.4 16.1 18.5
INDEBTNESS - € MN 2017 2018 2019E 2020E 2021E 2022E
Net Cash (Debt) 15.4 14.5 27.6 22.6 19.4 28.1
D/E n.m. n.m. n.m. n.m. n.m. n.m.
Debt/EBITDA n.m. n.m. n.m. n.m. n.m. n.m.
Interests cov n.m. n.m. n.m. n.m. n.m. n.m.
MARKET RATIOS 2017 2018 2019E 2020E 2021E 2022E
P/E ord n.a. 14.4 x 19.9 x 18.2 x 14.1 x 11.6 x
P/E adj* n.a. 14.4 x 14.0 x 13.1 x 10.9 x 9.3 x
P/E EX CASH Adj* n.a. 13.3 x 12.0 x 11.6 x 9.8 x 7.9 x
PBV n.a. 2.8 x 1.4 x 1.4 x 1.3 x 1.3 x
EV FIGURES 2017 2018 2019E 2020E 2021E 2022E
EV/EBITDA n.a. 7.6 x 7.0 x 6.4 x 5.4 x 4.4 x
Adj. EV/EBITDA n.a. 7.9 x 7.0 x 6.4 x 5.4 x 4.4 x
Adj. EV/EBIT n.a. 9.9 x 8.9 x 8.6 x 7.2 x 5.9 x
EV/CE n.a. 3.2 x 1.5 x 1.5 x 1.4 x 1.3 x
REMUNERATION 2017 2018 2019E 2020E 2021E 2022E
Div. Yield ord 0.0% 3.5% 3.7% 3.8% 4.6% 5.4%
FCF yield 4.8% 3.2% 0.6% 1.1% 2.2% 9.1%
ROE 21.1% 19.1% 10.2% 10.6% 12.3% 13.6%
ROCE 39.1% 32.5% 13.5% 13.6% 15.9% 19.2%
[1] Italian GAAP
*adj. for PPA (excluded in IFRS)Source: Equita SIM estimates & company data
3
SICIT | July 25, 2019
INDEX
SICIT - INVESTMENT SUMMARY ......................................................................... 4
SICIT BRIEF INTRODUCTION ................................................................................ 6
SWOT ANALYSIS ................................................................................................. 9
STRATEGIC POSITIONING - SUMMARY ............................................................. 10
A HISTORY OF GROWTH ................................................................................... 10
SOURCING OF RAW MATERIALS – TRANSFORMING WASTE INTO VALUABLE
MATERIALS ....................................................................................................... 12
ITALIAN TANNING INDUSTRY .............................................................................. 14
THE ARZIGNANO DISTRICT .................................................................................. 14
BIOSTIMULANTS - GROWTH TREND IS MUCH STRONGER THAN AGROCHEMICALS .... 16
#1 GROWTH DRIVER: YIELD AND COST BENEFITS FOR GROWERS ..................... 18
QUANTIFYING THE VALUE FOR FARMERS FROM BIOSTIMULANTS .................... 19
#2 GROWTH DRIVER: HIGHER ROCE FOR CROP PROTECTION COMPANIES ....... 21
#3 GROWTH DRIVER: THE AGRICULTURAL CHALLENGE OF GROWING MORE
FROM LESS .......................................................................................................... 22
#4 GROWTH DRIVER: SUSTAINABILTY IN AGRICULTURE .................................... 24
#5 GROWTH DRIVER: BIOSTIMULANTS ARE SUITABLE FOR ORGANIC FARMING ....... 24
#6 GROWTH DRIVER: PRECISION FARMING ....................................................... 25
SICIT BIOSTIMULANTS PRODUCTS PORTFOLIO .................................................. 26
CUSTOMERS: THE MAIN PLAYERS IN THE SECTOR ............................................. 26
A FRAGMENTED COMPETITIVE ENVIRONMENT ................................................. 28
RETARDERS ADDITIVES DRIVEN BY THE HIGHER GYPSUM PENETRATION......... 29
RETARDANTS COMPETITIVE ENVIRONMENT...................................................... 30
CLIENTS AND DISTRIBUTION CHANNEL .............................................................. 30
FAT – A BYPRODUCT OF HYDROLYSIS PROCESS ................................................ 31
EXPANSION PROJECTS – REVENUES TARGETED TO DOUBLE BY 2022 ............... 32
EXPANDING EXISTING CAPACITY (€38 MN CAPEX) ............................................. 33
GREENFIELD EXPANSION – A NEW HYDROLIZED PROTEIN PLANT (€20 MN
CAPEX) ................................................................................................................ 33
GRANULATED FERTILIZER PLANT (€6 MN CAPEX) .............................................. 35
ESTIMATES / ASSUMPTIONS ............................................................................ 36
FY2019 OPPORTUNITIES AND CHALLENGES ...................................................... 39
BENCHMARKING AND VALUATION REMARKS .................................................. 40
TARGET PRICE €11.60 ....................................................................................... 42
A SUSTAINED PACE OF M&A ............................................................................ 44
SICIT MANAGEMENT ........................................................................................ 45
SPRINT-ITALY SPAC ........................................................................................... 45
PRE-BUSINESS COMBINATION SHAREHOLDER STRUCTURE .............................. 48
NUMBER OF SHARES FOLLOWING THE BUSINESS COMBINATION .................... 48
MULTIPLES SENSITIVITY ................................................................................... 50
APPENDIX ......................................................................................................... 51
AGROCHEMICAL INDUSTRY - INTRODUCTION.................................................... 51
FERTILIZERS –WHY THEY ARE SO IMPORTANT ................................................... 51
MINERAL FERTILIZER INDUSTRY – A MATURE MARKET ..................................... 53
CROP PROTECTION AGROCHEMICALS ................................................................ 56
STATEMENT OF RISK......................................................................................... 57

4
SICIT | July 25, 2019
SICIT - INVESTMENT SUMMARY
Sustainability, eco-efficiency and waste valorisation are the core values of the
company since its foundation. SICIT is a perfect example of the circular economy
coupled with the capacity to generate sound returns from its business.
We believe SICIT has the following appealing features:
1. SICIT is one of the leading company in protein hydrolysates of animal origin for the agriculture and building materials market. Through a process of hydrolysis of residues and waste of the nearby tanning industry, SICIT realizes a high value added product intended for use in agriculture (biostimulants) and in the industry of gypsum (retarding).
2. SICIT enjoys strong demand growth driven by underlying macro-trends.
- Biostimulants (55% revenues) is expected to increase at low double-digit CAGR driven by the farmers’ needs of: 1. Higher yield to feed a growing world’s population; 2. Lower input cost; 3. Sustainable and Organic Farming; 5 Precision Farming.
- Plaster retardants (30% revenues) are expected to expand at high-single-digit CAGR trailing the increasing penetration of gypsum as a building materials
- Fat (15% of revenues) mainly sold for biofuel.
3. The sound margins and ROCE are the result of superior production yield driven by: 1. state-of-the art industrial footprint; 2. Strong chemical and process know how.
4. The business has a high CF conversion, thanks to the recycling economy and the B2B distribution model. The raw materials are part of the revenue stream (about €16/t in 2018E) since the finished product is derived directly by the waste material generated by the tanning industry.
5. Its main clients are the top tier player in the agrochemical and building materials industries.
6. Its proximity to the leather district in Arzignano results in natural monopoly for the access and collection of key raw materials due to the high cost of transportation. Furthermore the disposal of waste is strategically important for the tanning districts due to the high treatment cost. SICIT has a very efficient process and receives waste from the Arzignano district at very convenient price for tanneries. The environmental footprint of its two plants is well above standard.
7. The business combination with SprintItaly will help to support its ambitious growth plan which aims to more than double the EBITDA through the following investments:
- debottleneck its existing two plants (~€38 mn Capex);
- open new capacity in Latam (~€20 mn Capex);
- improvement of its product offering for the agriculture industry through a granular biofertilizer plant - B2B and B2C – (~€6 mn Capex).
8. There is a limited number of listed companies - across Italy and Europe - which have a strong exposure to the sustainability investment feature such as SICIT.
9. The stock trades at ~ 25% discount to EV/EBITDA to focused agrochem players, a compelling valuation for a company exposed to circular economy. Going forward, the spread should narrow – if not reverse to premium - thanks to the stronger growth and profitability as well as M&A potential, .

5
SICIT | July 25, 2019
We would also highlight the following risk/threat factors:
1. Agrochemical demand may suffer from unfavourable weather conditions in key crop regions. This is the case for US region in 1H19. The bad weather may reduce farmer income over the season and have a negative effects on volume demand;
2. Crop prices affects the growers’ economics and change the demand for key inputs like fertilizers, crop protection chemicals and biostimulants;
3. The increase in recycled volumes may need some time (a few quarters) to be shipped to customers due to the different timing of demand. Agrochem companies may need time to launch biostimulant products in new markets due to the R&D and commercial investments needed. Hydrolized proteins have a
long lasting conservation period so, there is quite a limited risk of product
degradation;
4. The outlook for building materials is largely dependent on economic conditions in key regions (Europe, Asia, Americas). We believe the risk of a slowdown in construction activity has increased;
5. SICIT has no track record in the expansion of its capacity abroad. Therefore a risk of delay or higher than expected costs may be taken into consideration;
6. Fat prices are quite volatile and limited FY18 EBITDA growth. We believe the current low level will likely not affect anymore its underlying trend but it is a commodity price with a cyclical trend pattern.

6
SICIT | July 25, 2019
SICIT BRIEF INTRODUCTION
SICIT (acronym of Società Industrie Chimiche Italiane) is a chemical company located
in Arzignano (Vicenza), North-Eastern Italy. It carries out a recycling activity to
recover a particular waste of the tanning industry, aimed at the production of raw
materials (protein hydrolysates) for agricultural and / or industrial use
(biostimulants, plaster retardants and fats).
The company was founded in 1960 and is controlled by Intesa Holding S.p.A. (100%)
whose shareholders are the leather tanning companies of the district of Arzignano
(Vicenza). Since its foundation, the company aimed to address the solid waste
recycling materials of the local tanning industry. The waste – an organic material
from the animal skin (raw hides) - is treated by a chemical recovery process whose
main and most significant characterizing step is hydrolysis, with which “melts” the
protein substance (collagen) contained in the waste is transformed into a "protein
hydrolyzate" (secondary raw material) intended for use in the industrial and
agricultural sectors.
FROM WASTE TO VALUABLE MATERIALS
Source: SICIT, Equita
SICIT provides hydrolyzed proteins for the agrochemicals and construction industries:
- Biostimulants (54% of revenues): biological additives used in agriculture to
improve crop yield thanks to the enhancement of plant growth, health and
productivity.
- Plaster retardants: (29% of revenues) additives used in the production of
plastboard and plasters to extend the workable time of gypsum.
PRODUCT PORTFOLIO AND KEY END MARKETS
Source: SICIT

7
SICIT | July 25, 2019
Furthermore SICIT sells fat (15% of revenues) as a byproduct of its waste treatment of
fleshing. The fat is mainly sold as a a biofuel additive.
Production is carried through two plants in the middle of the tanning industry district:
- Arzignano (Vicenza) site (theoretical 128 ktpa waste input capacity) mainly from
fleshing (carniccio) and hair (pelo) waste material (animal by-products or ABP). It
has started operations in 2004 and is one of the biggest in the world as amino
acids production facilities. The Arzignano plant opened in 2004.
ARZIGNANO SITE
Source: SICIT
- Chiampo (Vicenza) site (theoretical 42 ktpa waste input capacity) from shavings
(rasature) and trimming (rifili). It started its activity in 1960 and was the first plant
to produce special fertilizers based on aminoacids & peptides worldwide. In 2011
it has been completely renewed and automated.
It also operates two R&D site: Trissino for agronomic research and Chiampo for
chemical research. The R&D Centre and Laboratory develop and test the
effectiveness of new processes and new products in special pilot installations. At the
same time they may ensure the production of small quantities of experimental
products, even for testing at customer sites.
The number of employees at the end of 9M18 were 112 units.
PRODUCTION SITE
REACTORS CONCENTRATORS
Source: SICIT

8
SICIT | July 25, 2019
SICIT PRODUCTION PROCESS
Source: SICIT
R&D AND QUALITY CONTROL LABORATORY
Source: SICIT
SHAVINGTRIMMING
FLESHINGHAIR
Chiampo
Arzignano
Grinding and homogenization
Alkaline Process
Grinding and homogenization
Acid hydrolysis and fat extraction
Termic Treatment
Filtration
1
1 2
3
4
5Coal Treatment and concentration
7CaCO3 separation
and refining
6
CaCo3
Bicarbonate/CO3Liquid Storage8
Special ProductionSpray drier
Granulation
Only in Arzignano
Fat purification
RA
W M
ATE
RIA
LSEN
D P
RO
DU
CT
9 10
11
Calcium hydroxide
Sulphuric Acid
• Hydrolysate protein (granule)
• Hydrolysate protein (powder)• Special product (powder)
• Hydrolysate protein (liquid)• Special product (liquid)
• Soil Improver
• Fat

9
SICIT | July 25, 2019
SWOT ANALYSIS
Strenghts:
- State-of-the art industrial footprint and strong chemical and process know how
resulting in superior production yield and economics (high profitability);
- Excellent production process management resulting in high standardisation of
production output;
- Proximity to the leather district in Arzignano resulting in natural monopoly for the
access and collection of key raw materials;
- Long-term client relationship with top-class customers both in biostimulants and
gypsum industries;
- Formulation and innovation abilities allow SICIT to be a reliable partner for its
clients;
- Management track record in production process management and product
quality/innovation;
- Additional installed capacity in Chiampo for the treatment of trimming (which has
high output yield).
Opportunities:
- Highly growing underlying markets: biostimulants and plasterboard;
- Entry in other leather districts abroad that today suffer from not optimal
management of animal waste;
- Low unit price of waste collection vs other tanning districts
Weaknesses:
- High dependence to raw material availability could impact production levels, the
respect of delivery times and final product quality; dependence is mitigated by
the available supply of shaving and trimming from outside the Arzignano district;
- Production has a limited diversification and it is concentrated in the hydrolysis of
animal proteins.
Threats:
- Regulatory changes regarding final products use and production waste; given the
higher quality standard of SICIT’s products, more stringent regulation could also
be an opportunity;
- Potential more aggressive competition from Asian players offering poor quality
product (biostimulants) at low price;
- Animal diseases (such as BSE “Mad Cow” in early ‘90s) which may affect
operations or demand of biostimulants from animal proteins. Today BSE would
not be an issue since SICIT treats only animal by products (ABP) cat. 3.

10
SICIT | July 25, 2019
STRATEGIC POSITIONING - SUMMARY
SICIT is active in the highly attractive markets of biostimulants and gypsum, where
the company shows a high competitive positioning
SICIT STRATEGIC POSITIONING (2017)
Source: Technavio, Dunham Trimmer, Sicit, EQUITA
BIOSTIMULANTS
PLASTER RETARDANTS
Market attractiveness
- market value (€m) ~1,800 <100
- expected value growth (CAGR% 17-22)
~11.0 ~7.0
- price sensitivity Mid-Low
- competitive intensity among distributors
High Low
Competitive positioning SICIT
- market share Low Mid-High
- perceived relative quality High
- price convenience Mid-High
- perceived value High
A HISTORY OF GROWTH
SICIT has been the first company to introduce special fertilizers based on aminoacids
& peptides in the world market in the ‘60s and it’s nowadays the one of the leader
being in its niche markets present in more than 90 Countries.
Over the past five available FY (2014-18 period), revenue increased at 11% CAGR
driven by:
- the increased intake of waste materials (+5% CAGR);
- higher selling volumes of biostimulants (+6% CAGR), plaster retardants (+13%
CAGR) and fat (+8% CAGR);
- higher selling price of biostimulants (+6% CAGR) and fat (+4% CAGR) coupled
with slightly lower price of plaster retardants (-1% CAGR).
SALES VALUE BY PRODUCT (€ MN)
Source: SICIT
Fat
Gypsum re-
tarders
Bio-stimulants
Low High
Low
Hig
h
CO
MP
ETIT
IVE
PO
SITI
ON
ING
MARKET ATTRACTIVENESS
18.8 20.7 23.3 27.8 30.2
10.311.0
12.6
15.015.45.7
6.3
7.1
7.96.7
0.91.0
1.1
3.2 2.9
35.7
39.0
44.1
53.955.1
0
10
20
30
40
50
60
2014 2015 2016 2017 2018
Other
Fat
Retarders
Biostimulants
11%

11
SICIT | July 25, 2019
Europe represents the largest market for biostimulants whereas it is only second in
the retarders’ product cluster. APAC region has been the highest growing market for
both product categories
SALES VALUE BY GEOGRAPHY (€ MN)
BIOSTIMULANTS RETARDERS
Source: SICIT
SICIT enjoyed strong profitability on its product portfolio driven by the superior
process know-how which result in:
- high production yields;
- optimized incidence of chemical products;
The profitability in 2017 had a strong leap forward, driven by the sound growth of
biostimulants and retarders as well as by the strong price of fat commodity. Fat price
“normalized” over 2018.
EBITDA AND EBITDA MARGIN (€ THOUSAND)
Source: SICIT
The main cost items comes from chemicals needed for the hydrolysis process
(mainly base products such as sulphuric acid, ammonium bicarbonate, lime),
transport, sludge treatment, energy and personnel costs.
Revenues from waste collection are less than €2 mn and today do not play a
strategic role of the sound profitability of SICIT. Tanneries pay a toll to SICIT gross of
transport cost in order to dispose the waste material coming from the leather
manufacturing process. Currently the toll is quite low or about €16/t (on average in
FY2018E), driven by the efficiency of SICIT in recycling the waste material. Other
districts such as Tuscany, have been paying a much higher toll (from €50/t to €180/t),
due to the lower efficiency in treating waste materials from their regional recycling
company.
12.0 12.5 13.7 14.6 16.1
4.4 66.4 9.5
10.22.02.1
3.0
3.43.3
0.40.1
0.2
0.3 0.5
18.820.7
23.3
27.8
0
5
10
15
20
25
30
2014 2015 2016 2017 2018
Africa
Americas
Asia Pacific
Europe
30.2
4.2 4.4 5 5.3 5.3
3.9 4.14.9 7 7.5
1.8 2.1
2.2
2.3 2.3
0.40.4
0.5
0.4 0.4
10.311.0
12.6
15.0
-1
1
3
5
7
9
11
13
15
2014 2015 2016 2017 2018
Africa
Americas
Asia Pacific
Europe
15.4
20.0%
25.0%
30.0%
35.0%
40.0%
45.0%
0
5,000
10,000
15,000
20,000
25,000
2014 2015 2016 2017 2018
EBITDA (excl. upsides)
Margin

12
SICIT | July 25, 2019
SOURCING OF RAW MATERIALS – TRANSFORMING WASTE INTO VALUABLE MATERIALS
SICIT sources its input materials from the waste produced in the Chrome tanning
process of the Arzignano district.
The tanning district of Arzignano (Vicenza) is the most important national center and
one of the main European poles in the tanning sector, directly and indirectly
employing ~12,000 employees and €3 bn a year in combined revenues. The district
specializes in the processing of bovine leather, destined for the furniture, footwear,
automotive (car interiors), leather goods and clothing sectors. The district production
is of high quality and mainly involves the treatment and finishing of semi-worked and
already tanned (wet-blue) leathers, although there are companies that still perform
the full-cycle activity.
TANNING DISTRICT IN ITALY
Source: SICIT
The production process of the tanning industry consists in different treatments and
processes that can be merged into two macro-processes:
1. the raw hides treatment, designed to make the skin not putrescible (rot-proof);
2. post-tanning treatments, necessary to finish tanned leather and obtain a high
quality product.
Animal skin (raw hides) is a protein organic material, therefore in its natural state it
is vulnerable to biological decomposition by microorganisms. Tanning is the chemical
process that transforms the putrescible skin into a workable rot-proof material, i.e.
leather.
The leather tanning process generates many types of waste, some of which can be
recovered in various ways, with consequent benefits both from an environmental and
economic point of view. In particular, the residues of tanned leather can be:
- regenerated in leather fibers. This is a poor quality material compared to real
leather, due to reduced flexibility and low mechanical strength.
- recycled through the hydrolization process to obtain amino acids for the
production of biostimulants or retardants.
- disposed for incineration (e.g. in France) or landfill (e.g. in South America)
- used for compost or biogas.
For every ton of raw hides in the tanning process, ~250 kg of leather and ~600 kg of
animal by-products (such as fleshing) and waste (not recoverable) are produced.

13
SICIT | July 25, 2019
TANNERIES INPUTS, OUTPUTS AND WASTE MANAGEMENT
Source: SICIT
Through the plant of Arzignano, SICIT transforms the totality of the fleshing from the
surrounding tanning plants (90-100 ktpa) while the plant in Chiampo recycles only
part of the trimming (40% or 20 ktpa) and shaving available (10% or 3 ktpa)
SICIT - RAW MATERIAL COLLECTION FROM ARZIGNANO DISTRICT - 2017
Source: SICIT
c. 90 c. 90
Fleshing available(1) Collected by SICIT(1)
c. 50
c. 20
Saving available Collected by SICIT
SICIT collects the totality of
the fleshing produced in the
Arzignano district
SICIT collects c. 40% of the
shaving produced in the
Arzignano district
SICIT recently started
collecting trimming, in
competition with ILSA
c.40%
c.100%
c.10%
c. 35
3
Trimming available Collected by SICIT
Wet blue/Crust

14
SICIT | July 25, 2019
ITALIAN TANNING INDUSTRY
Italy is one of the main leather producer (c7% of total volumes in the world). The
industry employs 18k employees in over 1200 companies, generating an annual
turnover around €5 bn, 75% of which is exported around the world. Italian tanning
industry is well-known all over the world thanks to its high quality, developed
technology and environmental care which make this industry unique in the world.
The main end market of the tanning industry are mainly leather goods (for the
automotive and furniture industry) and clothing.
About the 90% of the production is concentered into three main areas:
- Arzignano District (Veneto);
- Santa Croce sull’Arno (Tuscany);
- Solofora (Campania);
TANNING DISTRICTS IN ITALY
Production 2016 (€mn)
2011-16 CAGR (%)
Export Shares
# of Companies Employees
Avg. Company size (€mn)
Veneto 2.735 2,1% 78,0% 459 8.324 6,0
Tuscany 1.417 0,9% 66,0% 527 5.765 2,7
Campania 379 -4,5% 41,0% 158 1.901 2,4
Rest of Italy 442 -4,8% n.a. 41 1.622 6,0
Total 4.973 0,5% 76,0% 33 17.612 4,1 Source: UNIC
THE ARZIGNANO DISTRICT
The Arzignano district is located in the Chiampo valley (Vicenza), with its 130k sqm of
land is one of the largest districts in the world, as well as the most important in Italy.
Born in 1300 the Arzignano district became what is today also thanks to relevant
natural factors, such as the availability of water resources and the initial abundance
of livestock, as well as plants rich in tannin and quality dyeing. This area has been
always characterized by the presence of small-medium companies and large
industrial groups, making the productive model flexible, with strong orientation and
ability to adapt to customer needs.
On the total amount produced by the Italian tanning industry, Arzignano District
accounts for:
- 65% for ABP (Animal by product);
- 55% for tanned waste, like shaving and trimming.
The district of Arzignano has outperformed the other Italian tanning districts in
terms of sales thanks to the specialization of products for the leather goods and the
automotive industry. Due to the increasing “premiumization” of the products coming
from the Arzignano district, local tanneries are relying more and more on raw hides
instead of wet blue/pre tanned raw materials. As a consequence, the availability of
fleshing in the Arzignano district is increasing, as wet blue / pre-treated hides are
already fleshed.
All the raw materials used by SICIT for its productive process come from the
Arzignano District. All the tanneries in fact, have to dispose, as established by the law,
the tanned waste they produce and SICIT collects these materials from the companies
getting a remuneration. In 2017 the total revenues from collection was about €1 mn,
but we estimate it will be greater in the next years due to an increase in average
price. On the total amount produced by the Arzignano District SICIT collects:
- 100% of fleshing
- 40% of shaving
- 10% of trimming

15
SICIT | July 25, 2019
ITALIAN TANNERIES – RAW MATERIALS
Source: SICIT
Arzignano64%
Santa Croce29%
Others 7%
140k ton
Arzignano56%
Santa Croce28%
Others17%
90k ton
Arzignano56%
Santa Croce28%
Others17%
180k ton
Raw hides52%
Wet blue/Crust
48%
Wet Blue and other
waste44%
Shaving22%
Fleshing34%
0%
20%
40%
60%
80%
100%
Raw Materials Waste by type
910k ton 410k ton

16
SICIT | July 25, 2019
BIOSTIMULANTS - GROWTH TREND IS MUCH STRONGER THAN AGROCHEMICALS
Biostimulants are products derived from natural or biological sources that when
applied to a plant, seed or soil provide benefits to the plant development or stress
response. Biostimulants are used in conjunction with other products such as
fertilizers and crop protection chemicals (such as fungicides, insecticides and
herbicides).
As previously described, Biostimulants are designed to help farmers meet growing
agricultural demand sustainably improving crop yield and quality, which has a
positive impact on farm profitability. In particular the main effects are:
- Improvement of the absorption and the efficiency nutrients;
- Reinforcement of plant’s tolerance and recovery to abiotic stress
- Improvement of crop quantity and quality.
BIOSTIMULANTS BENEFITS
Source: EBIC, EQUITA
Biostimulants are a relative new product and in fact they are still not regulated and
categorized as fertilizers.
According to USDA analysis currently Biostimulansts represent c5-10% of farmer’s
expenditure for fertilizers or 0.6%-1.2% of total expenses.
BIOSTIMULANTS ARE A SMALL SHARE OF TOTAL COST FOR GROWERS
Source: USDA
The global biostimulat market was valued at about $2 bn (DunhamTrimmer and
Technavio estimate) in 2017 and is expected to be increase at a double digit CAGR,
hitting the >$3 bn in the 2025. Over the past ten year the market has been growing at
low teens rates driven by the EMEA region, which accounts for the largest share
(40%), and by Latin America, which despite being the smallest market is the fastest
growing one.
Fertilizers and agricoltural
chemicals; 19%
General expenses43%
Labour14%
Seeds and plants11%
Machinery; 7%
Other; 7%
Fertilizer and other soil conditioners
62%
Agricoltural chemicals (PPPs)
38%
Fertilizers90-95%
Biostimulants5-10%
0%
20%
40%
60%
80%
100%
All Additives Crop enhancers
BIOSTIMULANT BY PRODUCT CATEGORY In general the literature proposes various categories for biostimulants, categorized by the active ingredient which is composing the substance. Here follows a classification of biostimulants by product category. Seaweed extracts and botanicals (37% of total biostimulant market): Liquid or solid brown algae extracts containing organic and inorganic composts. They stimulate roots and chlorophyll development and act on hormonal activity and defence mechanism, improving response to abiotic stress.
Humic and fulvic acids (19%): Humic substances (HS) are natural constituents of the soil organic matter, resulting from the decomposition of plant, animal and microbial residues, but also from the metabolic activity of soil microbes using these substrates.
Hydrolysed proteins (32%):
Animal: Mix of peptides and amino acids produced via chemical hydrolysis, they contain high level of organic nitrogen, free amino acids and salinity. This kind of additive augments absorption and assimilation of nutrients and nitrogen and stimulate response to stress. On this category of natural additive SICIT 2000 S.p.A is focusing its attention;
Vegetal: Mix of peptides and amino acids obtained by enzymatic and chemical hydrolysis, they have a lower level of organic nitrogen and they are considered safer for the environment;
Micro-organism (10%): Micro-organism such as bacteria and fungus present in the rhizosphere. According to the Dunham Trimmer estimates this is the type of natural additive product line with the fastest growth;
Other (2%)

17
SICIT | July 25, 2019
BIOSTIMULANT MARKET ($ MN) +13% CAGR OVER THE 2014-17 PERIOD
Source: Technavio
Various factors are contributing to the growth of this market. We identify the main
drivers as follow:
- Yield improvement and cost saving are the two clear benefits of the application
of biostimulants in both cash and commodity crops;
- Global agricultural production is estimated to grow at low-single-digit rate over
the next 10 years, due to the population growth, and driving the needs of
agricultural additives;
- Declining availability of cultivable land is a serious concern, and, to better exploit
the available land, biostimulants should increase their market penetration;
- Climate changes are expected to reduce crop yields in many countries. To
contrast this negative effect an increasing number of agricultural additives, such
as biostimulants, are expected to be use by the farmer;
- Organic food consumption: the customers’ focus is shifting towards organic food
products. The growing attention to the environment is leading to the use of
biostimulants and natural additive instead of chemical products;
- Sustainable farming: Growers are facing increasing demand to incorporate more
sustainable practices. There is an economical and environmental need for
efficient nutrient use, in the form of enhanced efficiency fertilizers and crop
protection that allow growers to increase yields while reducing inputs.
- Precision farming: Smart technologies applied to agriculture will likely be one of
the drivers for the crop yield improvement and/or resource savings;
- Higher product margin for crop protection companies: last but not least the
dominant distributors have strong incentives in including biostimulants in their
product portfolio.
Summing up, because of its clear benefits, the biostimulants market is growing at
low-double-digit rates: faster than any other agricultural input market.
AGROCHEMICAL MARKET SIZE AND GROWTH
$ bn Market size ($ bn) CAGR Past 10 yrs CAGR next 5 yrs
Fertilizers 184 2% 2%
Crop Protection 57 4% 1.5-2.5%
GM Seeds 20 11% 2-4%
Conventional Seeds 17 2% 2%
Yield Enhancers 5.2 16-25% 10-11%
Biocontrol 2.4 16% 15%
Biostimulants 2 12% 11%
Bioyield/biofertilizers 0.8 n.a. n.a. Source: DunhamTrimmer, Philips Mc Dougall, AgbioCrop, Agriservice, Syngnta, Corteva, Sumitomo, Novozymes, Variant Market Research,Technavio, Equita
0.6 0.7 0.8 0.9 1.0 1.1 1.2 1.4 1.5
0.5 0.6 0.70.7 0.8 0.9 1.0 1.1
1.2
0.30.3
0.40.4
0.50.6
0.60.7
0.8
1.41.6
1.82.1
2.32.5
2.83.1
3.5
0.0
0.5
1.0
1.5
2.0
2.5
3.0
3.5
4.0
4.5
2014 2015 2016 2017 2018E 2019E 2020E 2021E 2022E
APAC America EMEA
13.4%
11.1%

18
SICIT | July 25, 2019
#1 GROWTH DRIVER: YIELD AND COST BENEFITS FOR GROWERS
Agricultural biostimulants are biological or biologically derived fertilizer additives and
similar products that are used in crop production to enhance plant growth, health
and productivity. They might achieve this by:
- Helping to improve nutrient-use efficiency (reduce fertilizers applications)
- Helping plants tolerate abiotic stresses like heat, cold, drought, and too much water
- Helping to improve quality attributes like nutritional content, appearance, and
shelf-life
These special products are used at low rates (a few liters or kilograms per hectare),
both by foliar spray and fertigation, and they are able to stimulate plant biological
activities, improving their quality and their yield, without any residues on the crop
nor environmental impact problems, because of their natural origin and their
complete biodegradability.
ABIOTIC STRESSES WILL WORSEN DUE TO CLIMATE CHANGE
Source: Syngenta, USDA, Equita
Therefore biostimulants can help farmers to receive a better return on their
investment in fertilizers. This also reduces nutrient losses and the related
environmental impacts (and thus the cost of clean-up). Biostimulants boost general
plant vigour so that plants require fewer treatments of plant protection products
and respond better to their use.
BIOSTIMULANT APPLICATION – SYNGENTA’S ISABION ON VEGETABLES
Source: Syngenta,
CROP STRESSES
Abiotic BioticClimate Change
Radiation
- High
- Low
- UV
Extreme WeatherEvents
- Drought
- Cyclone
- Halistorms
- Heat wave
- Flooding
Long term impact
- Prolonged drought
- Soil erosion
- Salinity & alkalinity
- Loss of Biodiversity
- Food Security
Animals
- Insects
- Nematodes
- Avians
- Mammals
Water
- Flood
- Drought
Temperature
- High
- Low
- Freezing
Nutrients
- Deficiency
- Toxicity
Pathogens
- Fungi
- Viruses
- Bacteria
- Microbes
Weeds
- Monocots
- Dicots
- Broadleaves
- Parasites

19
SICIT | July 25, 2019
It is difficult to generalise because the exact level of the impacts depends on the crop
in question, the original state of the soil, how well managed crops already are and a
number of other factors. However, there is a broad documentation of the effects
below:
- Minimum yield increases related to biostimulant use are being reported at 5-10%;
- Fertiliser use efficiency is being documented to increase by 5% at a minimum
(and may go as high as 25% or more) when biostimulants are applied. Higher
efficiency rates generally occur where fertilizers and biostimulants are delivered
through precision irrigation (a practice often called fertigation);
- Pesticides savings related to biostimulant use have been reported to range
between 10% and 15%;
- Quality characteristics such as fruit setting, homogenous colour and increased
size are enhanced in some cases by as much as 15% when biostimulants are used.
Increased quality has downstream benefits as well: farmers may be able to garner
higher prices for their produce, and produce is likely to be more tolerant of
storage and handling.
BIOSTIMULANT EFFECT
YIELD INCREASES FERTILIZER EFFICIENCY PESTICIDE SAVINGS
Source: EBIC
Source: EBIC
Source: EBIC
QUANTIFYING THE VALUE FOR FARMERS FROM BIOSTIMULANTS
We calculate that the value for farmers for consuming biostimulants instead of
fertilizer/crop protection products is sizeable. As previously described, biostimulants
can reduce the cost of fertilizer and crop protection application and result in higher
yield. Therefore biostimulants increase revenues and/or reduce cost for growers at
the same time.
For commodity crops, the mark-to-market of the potential increase in revenues from
yield improvement driven by biostimulants is in the range of $102-205/hectare. The
revenue increase does not factor in any improvement in quality of the plant which
has higher importance for cash crops (fruits and vegetables).
BIOSTIMULANTS APPLICATION IMPROVES FARMERS’ REVENUES BY ~$100-200/HECTAR
Yield Price Revenues Revenues from yield increase
Commodity Crops T/ha Tons x hectare 5% 10%
Corn - US 11 $ 150 $ 1,646 $ 82 $ 165
Wheat - France 5.3 € 204 € 1,081 $ 62 $ 124
Rice - China 6.9 $ 390 $ 2,689 $ 134 $ 269
Soybean - Brazil 2.9 $ 900 $ 2,610 $ 131 $ 261
Avg. increase in revenues/ha n.m. n.m. $ 2,007 $ 102 $ 205 Source: Yara, Bloomberg, Equita
It is fair to notice that the eventual yield improvement could be reached – only in the
short run - through more intense fertilizer and crop protection application. Therefore
we could rather measure the cost savings of agrochemicals from the biostimulants
application.
100 5-10
105-110
0
20
40
60
80
100
120
140
Yield withoutbiostimulant
Yield increasedue to
biostimulant
Yield withbiostimulant
100
5-25 105-125
0
20
40
60
80
100
120
140
Fertilizerefficiencywithout
biostimulant
Efficiencyincrease due to
biostimulant
Fertilizerefficiency withbiostimulant
100
5-25 105-125
0
20
40
60
80
100
120
140
Fertilizerefficiencywithout
biostimulant
Efficiencyincrease due to
biostimulant
Fertilizerefficiency withbiostimulant

20
SICIT | July 25, 2019
At m-t-m fertilizer prices, the average savings on Fertilizers costs from the
application of biostimulants is in the range of $7-36/ha.
FERTILIZER APPLICATION FOR DIFFERENT COMMODITY CROPS PER HECTARE
kg/ha
t/ha
Commodity Crops N P2O5 K2O S
Urea DAP MOP other
Corn - US 132 69.3 49.5 15.4
0.26 0.15 0.06 0.03
Wheat - France 111.3 50.3 29.1 9
0.22 0.11 0.04 0.02
Rice - China 89.7 46.2 24.8
0.18 0.10 0.04 0.00
Soybean - Brazil 159.5 34.8 58 8.7 0.33 0.08 0.09 0.02
AVERAGE 123.1 50.2 40.4 11.0
0.25 0.11 0.06 0.02 Source: IPNI, Mosaic, Yara, Equita
FERTILIZERS - PRICE AND AND NUTRIENT CONTENT PER PRODUCT
Price $/t
Urea DAP MOP SOP
285 420 355 500
Content
N P2O5 K2O S
Urea 46% 0% 0% 0%
DAP 18% 46% 0% 0%
MOP 0% 0% 60% 0%
SOP 0% 0% 53% 45% Source: IPNI, Mosaic, Yara, Equita
AGROCHEMICAL SAVINGS FROM BIOSTIMULANT (FERTILIZERS AND CROP PROTECTION)
Fert. Cost Savings range Crop Protection Savings range
Commodity Crops $/ha 5% 25% Cost $/ha 10% 15%
Corn - US 177 8.9 44.3 44.3 4.4 6.6
Wheat - France 133 6.6 33.2 33.2 3.3 5.0
Rice - China 107 5.4 26.8 26.8 2.7 4.0
Soybean - Brazil 167 8.4 41.8 41.8 4.2 6.3
AVERAGE 146.1 7.3 36.5 36.5 3.7 5.5 Source: IPNI, Mosaic, Yara, Equita
Including crop protection chemicals, we calculate the savings increases to $11-42/ha
range (assuming a ratio of 4:1 for fertilizer and crop protection chemicals – Source:
USDA). The average application of biostimulants is in the range of 1-4L per hectare or
a retail cost for farmers of $10-40/ha, as a function of the crop quality. Therefore the
application of biostimulants should yield a value for the average farmer in the
range of $103-207/ha (A+B+C-D).
VALUE OF BIOSTIMULANTS FOR GROWERS
A B C D TOTAL
Revenues Fertilizer
Crop Protection Biostimulants
Value for Growers
Low Range $ 102 $ 7 $ 4 $ 10 $ 103
High Range $ 205 $ 37 $ 5 $ 40 $ 207
Average $ 154 $ 22 $ 5 $ 25 $ 155 Source: Equita
The value for cash crops (i.e. fruits and vegetables) should be even higher since the
improvement in the product quality has a direct effect on its value. The biostimulants
application is therefore more common in cash crops rather than commodity crops
which have much higher revenues per hectare and higher growth potential.

21
SICIT | July 25, 2019
#2 GROWTH DRIVER: HIGHER ROCE FOR CROP PROTECTION COMPANIES
Crop protection chemicals has a high incentive to market biostimulant products,
driven by the higher profitability vs its core portfolio.
Biostimulant products are currently reviewed and approved under fertilizer
regulations in most countries. This means product registration costs are low and
timelines are a few weeks to months for approval. This reduced cost of investment to
develop a biostimulant is quite important when Return on Investment (ROI) is
considered and compared to that of synthetic crop protection products. The
challenge for conventional pesticides/herbicides/fungicides is not only the much
higher registration cost, but also the long period (about 10 years) of investment prior
to sales.
DISCOVERY AND DEVELOPMENT OF A CROP PROTECTION PRODUCT
Source: Syngenta, CropLife
Including commercial costs, the launch of a new molecule in the crop protection
industry has an upfront cost of about $300 mn or more. For biostimulants (and also
biopesticides) the upfront cost is clearly much lower and the development timelines
much shorter. This provides a much more positive NPV to crop protection companies
even if the projected sales are substantially lower compared with synthetic
pesticides/herbicides/fungicides.
Crop protection companies offers products which represents a defense for crop yields
to biotic stress. With biostimulants products, they can diversify and extend their
product portfolio on abiotic stress and fertilizer functions.
The sales price of a biostimulant product (i.e. Syngenta’s Isabion) can be 6x to 8x the
price of its key suppliers such as SICIT. The gross and EBITDA margin of large
agrochemicals from the sale of biostimulants are much higher than their average
product portfolio – we estimate about 40-45% for biostimulants vs 20-25% average
at the EBITDA level. Therefore the incentives of crop protection companies to include
biostimulants in their distribution channel is quite evident.

22
SICIT | July 25, 2019
#3 GROWTH DRIVER: THE AGRICULTURAL CHALLENGE OF GROWING MORE
FROM LESS
One of the long term growth drivers for the biostimulants industry comes from the
increasing demand for food and feed. This requires world agriculture to produce
higher yields from broadly stable cultivated land areas. To ensure food security for
everyone (food in adequate quantity, of good quality and safe in health terms), global
production will have to increase by 70% by 2050. Since 1980, demand for field crops
has increased almost 90%, from 1.2 bn to almost 2.7 bn tons, with the increased
demand for food and feed the key driver. Demand is expected to continue to increase
at an average rate of around 1.4% per year.
DEMAND FOR FIELD CROPS (BN TONS)
Source: USDA, FAPRI, Syngenta
The Food and Agriculture Organization (FAO) projects that, globally, 90% of the
required growth in food production will need to be achieved by increasing crop
yields and cropping intensity. Accounting for much of this percentage, crop yields
will need to rise substantially to meet growing global needs. Policymakers, growers,
non-profits and industry today devote an enormous amount of time planning and
innovating new ways to improve crop yields so that we will be able to meet those
future food needs.

23
SICIT | July 25, 2019
LONG TERM GROWTH DRIVERS
1 Source: FAO
Population Growth
Growing world population. It is estimated that by 2050
the Earth will probably have 9.8 bn inhabitants, or 2.2 bn
more than today
2 Source: International Food Policy Research Institute and FAO
Less arable land but more protein/meat consumption per
capita (KG/CAPITA)
Changing diets toward higher meat/protein consumption
(e.g. 1 kg beef = 8 kg animal feed). Global income growth,
with non OECD countries as a key driver, will result in
greater consumption of high-quality products, including
meat. As a result, the amount of feed needed to produce
the meat will increase by a multiple factor
CHALLENGES
4 Source: FAOSTAT
Arable land per capita is sinking – sqm per person
Shrinking arable land per person: Global population
growth, infrastructure and urban development mean there
is less land per person available for agriculture. A decade
from now, in 2030, there will be approximately 0.2
hectares per person for animal and crop production, less
than half the level in 1950. This trend is not expected to
improve, which will put continued pressure on farmers to
grow more grain on fewer acres.
3 Source: FAO
Increasing periods of extreme weather. Heavy rain,
drought and other extreme weather are becoming more
frequent. This can lead to floods and decreasing water
quality, but also decreasing availability of water resources
in some regions. Changes in climate will further stress the
availability of water, land, and biodiversity necessary for
productive agriculture.
This requires world agriculture to produce higher yields from broadly stable
cultivated land areas. Feeding future populations with today’s crop yields is not viable
as it would require a drastic expansion of planted acreage. However, in many part of
the world additional land is unavailable or the expansion of the planted area would
be environmentally and socially unacceptable. Increasing yields from existing land
requires continuous improvement of agricultural technologies including better
agriculture techniques.
In summary, crop protection, fertilizers, biostimulants and seeds share the
following common growth drivers: population growth, economic growth, dietary
shift due to increase in income of population in emerging markets, land availability,
increased volatility in weather conditions, sustainability and technology.

24
SICIT | July 25, 2019
#4 GROWTH DRIVER: SUSTAINABILTY IN AGRICULTURE
Growers are facing increasing demands to incorporate more sustainable practices.
These demands are coming from wide-ranging interests, from consumers and
advocacy groups to regulators and large companies that are increasingly evaluating
sustainability practices among their produce suppliers. Within the field of agriculture,
too, growers are becoming increasingly more likely to incorporate sustainability
practices into their current operations, motivated by data from agronomic studies
showing that ideas like efficient nitrogen use initiatives can pay both environmentally
and financially. Industry is also calling for efficient nutrient use, in the form of
enhanced efficiency fertilizers that allow growers to increase yields while reducing
inputs.
Simply intensifying current agricultural practices whether by farming more land, using
more irrigation or using more fertilizer—won’t be enough to sufficiently increase crop
yields.
Instead, the next wave of agricultural productivity will have to incorporate new
technologies. It will also have to do so in a sustainable way; that is, by using growing
practices that meet human needs while reducing environmental impacts. This means
using practices that make both environmental sense as well as economic sense for
growers. Agricultural sustainability does not need to come at the cost of economic
sustainability.
Biostimulants are a vital and sustainable solution to address key agriculture
challenges. Industry focus is to develop and commercialize biostimulants that are
compatible with advanced farming techniques used in Integrated Crop Management
(ICM), the cornerstone of sustainable agriculture
#5 GROWTH DRIVER: BIOSTIMULANTS ARE SUITABLE FOR ORGANIC FARMING
A key factor driving the growth of the market is the growth in the organic food
industry which represents only 1.2% of the world’s farmland (source: FiBL). Over the
next five years, the global organic food industry is expected to post a increase of over
14%CAGR. The growing focus on health and environment is increasing the
consumption of organic varieties of fruits, vegetables, and grains. Several
governments across the world encourage the adoption of organic foods, and the
organic food market will register remarkable growth in the coming years. The use of
natural fertilizers for enhancing yield, quality, and immunity will drive the growth of
the global biostimulants market. Biostimulants help in reducing the use of chemicals
in crops and soil and are extensively used in seed treatment.
SICIT hydrolyzed protein (amino acids & peptides) are products of natural origin,
totally biodegradable and without risk for public health and the environment. In
Italy they are authorized for use in organic farming according to the Annex 13 to the
Law Decree 29 April 2010, No. 75. Bioagricert a certifying body affiliated to IFOAM
(International Federation of Organic Farming Movements) releases regular
statements for SICIT products, which certify their compliance with the criteria set by
the organic standards movements according to the IFOAM international standards.
SUSTAINABLE AG OUTCOMES
Water Quality: increased uptake of applied or existing nutrients reduces potential for runoff
Water Use: greater yield from same or less water applied extends available supply for all uses
Soil quality: enhanced microbiome improves composition, organic content, and carbon sequestration
Carbon Emissions: increased plant uptake of applied or existing nutrients reduces N2O emissions
Food loss: improved quality increases harvest of marketable produce and grower profitability
Land Use: greater yield per acre reduces need to cultivate additional acres

25
SICIT | July 25, 2019
#6 GROWTH DRIVER: PRECISION FARMING
The adoption of digital technologies in agriculture has been increasing at a rapid
pace. The reason why this is such a prevalent trend is that digital technologies bring
tremendous value for businesses and individuals. In the agricultural industry, there
are many digital technologies that fall under the category of “precision agriculture”.
Precision agriculture technologies are changing the way that farmers manage their
crops and is being adopted at a growing rate.
Precision Agriculture (PA) is a whole-farm management approach using information
technology, satellite positioning (GNSS) data, remote sensing and proximal data
gathering. These technologies have the goal of optimising returns on inputs whilst
potentially reducing environmental impacts.
Precision farming is growing in popularity owing to the limited availability of land and
enhanced farming practices. In 2016, the global precision farming market is valued at
more than $ 3.5 bn (Source: Technavio) and will register double digit growth over the
next few years. This method of farming uses biostimulants for increasing yield and
productivity. In developed countries such as the US, Germany, the UK, and France,
the increasing demand for precision farming will contribute significantly to the global
biostimulants market.
PRECISION AGRICULTURE
Source: Accenture

26
SICIT | July 25, 2019
SICIT BIOSTIMULANTS PRODUCTS PORTFOLIO
The flexibility of SICIT in manufacturing process allows to obtain a wide range of
products, both liquid and in powder form, which can be customized in terms of total
and free amino acids content, molecular weight distribution, added microelements,
etc. The main reference products are:
- Standard products: solely based on aminoacids & peptides. Useful on all crops,
both by foliar spray or fertigation.
- Special products: based on meso- (secondary fertilizers) and micro- nutrients
complexed to aminoacids & peptides. Specific products to prevent and treat
nutritional deficiencies and to activate plant internal mechanism of resistance to
parasites.
- Organic-mineral products: a combination of different sources of nitrogen, both
organic (from aminoacids & peptides) and inorganic. Useful for foliar spray and
fertigation.
- Crop protection products: this group includes different products, all based on
aminoacids & peptides, with fungicide and bactericide action, insect attractants
and surfactants.
CUSTOMERS: THE MAIN PLAYERS IN THE SECTOR
Sicit is a B2B operator supplying the most important Agro-Chemical multinational
and local companies worldwide, which are currently the main distributors of
aminoacid-based fertilizers. Four out of the five main players in the industry
distributes biostimulants manufactured by SICIT.
The client base is likely quite concentrated – we estimate the top 10 clients
represent about half of biostimulants sales. Customers are also demanding in terms
of product specifications and manufacturing certifications.
This is the result of the concentrated nature of the agrochem industry in the crop
protection (please see the crop protection industry in the appendix). Biostimulants
are mainly distributed by crop protection companies since they can extend their
product portfolio on abiotic stress and fertilizer functions from biotic stress.
Specialized yield enhancer companies are also part of the distribution network as a
niche in the market. Fertilizer companies are much less represented in the
distribution of biostimulants due to the different nature of the products, and the
cannibalization potential of their existing portfolio.
The past few years have seen a strong consolidation process within the major
multinational producers with announced mega-mergers between the following
agricultural chemical input companies:
- Monsanto and Bayer
- Dow and DuPont (Corteva)
- Syngenta and ChemChina
MAIN AGROCHEMICAL COMPANIES - 2018 REVENUES ($ bn) Source: Equita, Bloomberg

27
SICIT | July 25, 2019
SICIT is not only active in the manufacturing process but also in the formulation and
blending for its final customers.
BIOSTIMULANTS CUSTOMER CONCENTRATION – SICIT IS ACTIVE IN SYNTHESIS, FORMULATION AND BLENDING PHASES
Source: SICIT
Most relationships are based on spot periodic purchases. A few major customers
stipulated contracts to regulate supplies. These are requested by the customers in
order to ensure the product availability and to guarantee a specific exclusive
formulation of biostimulant. This sector has a seasonal pattern and sales are
concentrated in the first 2 quarters (approx. 63% of revenues, based on 2017).
Divisional revenues are well diversified on a geographical basis:
- Europe (53%) – Italy and Spain are the main markets.
- Asia (34%) – China and India are the main markets.
- America (12%) Brasil is the main market.
RESEARCH & DEVELOPMENT
CHEMICAL SYNTHESISFORMULATION,
BLENDING & PRODUCTION
COMMERCIALISATION DISTRIBUTION
• Innovative researchin R&D centres andtrial plants
• Goal is discovery ofmolecules
• Development mainlyvia partnerships orlicensing
• Process innovations
• Active ingredientsproduction:hydrolysis reaction,concentration andfiltration
• Blending• Finished product
production• Quality control
• Internationalcompanies focusingon marketing andlocal developmentthanks to a widesales network
• Local presence toserve clients’requests
SPECIALIZED BIOSTIMULANTS COMPANIES
AGROCHEMICAL COMPANIES

28
SICIT | July 25, 2019
A FRAGMENTED COMPETITIVE ENVIRONMENT
The diversified and natural source of raw materials does not allow for large
economies of scale. Furthermore the market is quite young and client awareness is
on the rise. Therefore the market is fragmented, with most players integrated into
development, production and commercialization of the product.
BIOSTIMULANT KEY PLAYERS
COUNTRY Sales Sales EBITDA EBITDA PRODUCT PORTFOLIO
2016 € mn
CAGR 2012-16 2016 (%)
chg %. 2012-16
Humic & Fulvic
Hydrolised Proteins Seaweed
Micro-organism
Groupe Roullier FRANCE c. 1,700 n/a n/a n/a
Krishi Rasayan Exports INDIA c.120 n/a n/a n/a
Tradecorp SPAIN 118.6 8.6[1] 12.4 2.8[1]
Isagro ITALY 105.6 -2.2 10.5 2.8
Biolchim[2] ITALY 44.4 6.1 23.5 11.9
CIFO (Biolchim) ITALY 31.9 1.7 17.4 4.5
Italpollina ITALY 31.4 5.6 6.3 -0.5
Atlantica Agricola SPAIN 23.4 9 26 4.5 Green Has Italia ITALY 16.2 9.8 8 2.8
Arysta Lifescience US n/a n/a n/a n/a
Bioiberica SPAIN 209.3 -3.1 4.4 -4.3
Valagro (B2B/B2C) ITALY 117.7 6.9 22.7 4.1
Agronutrition FRANCE 49.7[1] 11.6[2] 5.5 (3.0) [2]
SICIT (B2B) ITALY 46.8 12.1 37.6 12
ILSA ITALY 22 -4.3 9.4 2.2
Daymsa SPAIN 18.6 16.2 20 8 Consorzio SGS (B2B) ITALY 12.2[1] 7.8 6.1 -1
Grabi Chemical (Valagro) ITALY 11.9[1] 5.6 8.8 4.3
WCM (Biolchim) CANADA n/a n/a n/a n/a
1. 2015-16 CAGR AND CHANGE
2. Unconsolidated data Source: SICIT, Company data, Equita
The market is characterized by a large number of players of different size and from
different sources (animal, vegetable):
- large players not focused on agriculture chemicals;
- small player focused in agricultural niches such as biostimulants mostly located in
India and China, with a more aggressive pricing approach.
Thanks to its leadership in the manufacturing process, SICIT positioned its
biostimulants products in the higher end of the quality range. Its main customers –
the large international agrochem companies - are an evidence of the product
positioning and the specification capability of SICIT.
Contrary to fertilizers, competition is much less based on pricing both for
biostimulants and plaster retardants. Considering the low volume of supply other
criteria drive the purchasing behavior of the clients. In order of importance the three
main factors are:
1. Technical performance. Usually defined as a products’ stability over time or shelf
life.
2. Supplier safety and reliability. In biostimulants in particular, the use in agriculture
for human food needs certifications on supplier’s production process and products
and are strictly regulated. Sourcing continuity – the production process is not
derived from chemical synthesis – and standardized quality is another factor of
concern, given the brand image implications for its multinational customers.
3. Pre-sale service. Customization and formulation capabilities are relevant factors
for customers.

29
SICIT | July 25, 2019
RETARDERS ADDITIVES DRIVEN BY THE HIGHER GYPSUM PENETRATION
Gypsum retarder is used during the production of plasterboard and plasters in
order to extend the workable time of gypsum.
By slowing the chemical crystal formation that causes gypsum plaster to set or
harden, Gypsum Plaster Retarders allow more time to complete each job.
GLOBAL | GYPSUM DEMAND BY CONSTRUCTION MATERIAL IN VOLUMES (2013-27F)
Source: Equita, SICIT,
Plaster retardants growth is strictly related to the world gypsum demand, which
mainly depends on two main factors:
- Construction sector output which is defined as gross fixed investments, including
construction and renovation of residential and non-residential buildings. This
market is expected to growth worldwide in the long term with a 4.2% CAGR 17-
23E;
- Gypsum penetration: among building materials Gypsum has superior
characteristics coupled with a lower cost. Gypsum has better features than other
building materials, since it easy to install, fire resistant, sound isolating, light-
weight and easy to combine with other materials. Production cost is lower, driven
by the energy-efficiency (180°C gypsum vs. 2000°C of bricks). Therefore gypsum
plasterboard is less expensive than most of the other construction materials,
(€5/m2). Gypsum is also particular useful for renovations;
- Regulation is centring on sustainability (e.g. thermal insulation) targeting
emissions and energy reduction as well as minimising construction waste.

30
SICIT | July 25, 2019
GLOBAL | GYPSUM DEMAND BY CONSTRUCTION MATERIAL IN VOLUMES (2013-27F)
Source: Equita, SICIT, Smithers Apex
The global market for plasterboard is estimated to be worth about $20 bn in 2017.
It has showed an annual growth of about 8% over the past five years (2013-17) and
is expected to grow at High Single Digit (HSD) rates CAGR also over the medium
term.
The Asia-Pacific region is the main geographic market for plasterboard, where the
demand is driven by the growing construction sector. North America represents the
second geographical area by value.
In our view this positive growth in world gypsum demand will help the retardants
market to increase its penetration in new sectors and emerging market.
RETARDANTS COMPETITIVE ENVIRONMENT
In the Retardant market Sicit competes with the large chemical multinationals in the
building sector, which offer a wide range of products. The most used retarders in the
plastering world are: Tartaric Acid, Citric Acid, Animal keratins, Synthetic retardants,
Retardan (SIKA), Trilon C (BASF), Versenex (DOWDupont).
The management of Sicit believes that the products supplied by it to its customers
are able to replace all the other retardants, with the sole exception of Tartaric Acid
which has a different grip curve.
Sicit estimates that currently its Plast Retard is among the most used and known
worldwide product for the plaster processing. In this sector the main competitors are:
- SIKA: is the main direct competitor and has launched on the market products very
similar to Sicit retarders, marketed with slightly higher average prices.
- BASF, Akzo Nobel and DowDupont: these are smaller operators that, although
with shares of smaller market, they represent Sicit's historical competitors.
Like biostimulants, competition on quality is more relevant than price. Western gypsum
retarder manufacturers offer high performance products and are highly customer
oriented. Sicit is perceived a safe supplier by its customers – the dependency on
tanneries is not considered an issue – with strong pre and after sales services.
CLIENTS AND DISTRIBUTION CHANNEL
In the retardant sector, shipments have a regular pattern, with sales / orders of its
customers relatively predictable and regular, with a limited seasonality. The peak
season develops from March to September (sales concentration in the 2Q and 3Q
equal to approx. 57% of revenues, based on 2017). Most contracts have a 12 months
length with fixed prices.
Retardant customers are the main companies in the construction sector. Therefore
customer concentration is supposed to be quite significant – we believe the top ten
clients represents >2/3 of Retarders’ revenues. Distribution of retardants takes place
both directly and through specialized dealers.
ADDITIVES COMMONLY USED IN PLASTER PRODUCTION INDUSTRY
Source: SICIT
GYPSUM RETARDERS BY PRODUCT CATEGORY There are three different types of gypsum retarders on the market:
Protein Hydrolysates: Natural additive derived mainly from animal-based protein hydrolysate. This is an high quality retarder because does not modify gypsum’s adherence power and provides high performance at low dosage. They have good retard time but still a mid-low market penetration, also due to the higher price with respect to the other retarders types;
Fruit Acids & Phosphates: This additive, derived from fruit acids and phosphates, is on the market for c.30 years and it is widly used for calcium, sulphate based and dry-mortar. This additive is the best in class with regard to the retard time and a good market penetration, otherwise has some negative effects as the quality variations and strength loss;
Pure Synthetic: Derived from polycondensated amino acids, they are able to form water-soluble complexes over polyvalent ions. They have a medium retard time performance and a good market penetration.
SICIT focus its attention on the first type: Protein hydrolysates. SICIT is currently one of the key producer in the world for this type of retarders, and from our point of view there is room to further penetrate in this market
3.9 4.1 4.5 4.8 5.1 5.5 6.3 6.8 7.3 7.8 8.3
3.2 3.3 3.4 3.5 3.7 3.8 4.0 4.1 4.3 4.5 4.76.7 7.4 8.3 9.2 10.1 10.6 11.4 12.3 13.2 14.2 15.30.5 0.6
0.60.6
0.6 0.60.7
0.80.9
1.01.2
14.2 15.4 16.718.1
19.5 20.522.4
24.025.8
27.629.7
0.0
5.0
10.0
15.0
20.0
25.0
30.0
35.0
40.0
2013 2014 2015 2016 2017 2018E 2019E 2020E 2021E 2022E 2023E
Rest of the World Pacific Asia Europe Nord America
8.3%
7.2%
31
SICIT | July 25, 2019
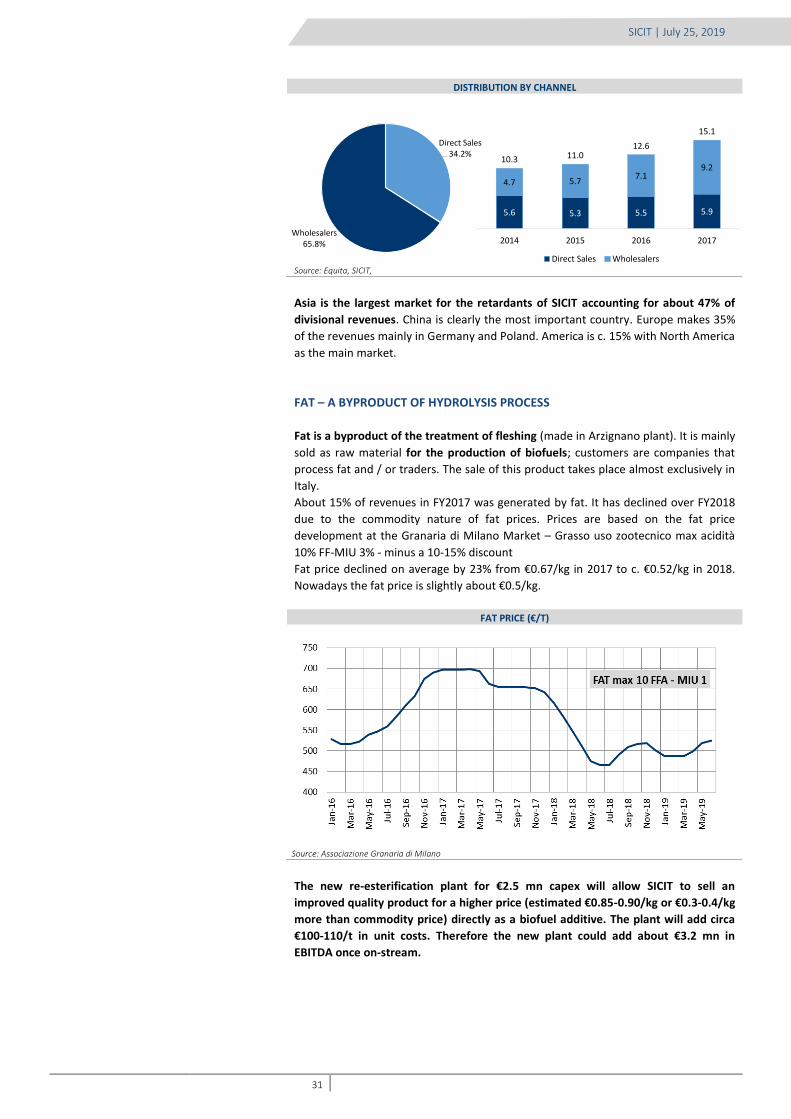
DISTRIBUTION BY CHANNEL
Source: Equita, SICIT,
Asia is the largest market for the retardants of SICIT accounting for about 47% of
divisional revenues. China is clearly the most important country. Europe makes 35%
of the revenues mainly in Germany and Poland. America is c. 15% with North America
as the main market.
FAT – A BYPRODUCT OF HYDROLYSIS PROCESS
Fat is a byproduct of the treatment of fleshing (made in Arzignano plant). It is mainly
sold as raw material for the production of biofuels; customers are companies that
process fat and / or traders. The sale of this product takes place almost exclusively in
Italy.
About 15% of revenues in FY2017 was generated by fat. It has declined over FY2018
due to the commodity nature of fat prices. Prices are based on the fat price
development at the Granaria di Milano Market – Grasso uso zootecnico max acidità
10% FF-MIU 3% - minus a 10-15% discount
Fat price declined on average by 23% from €0.67/kg in 2017 to c. €0.52/kg in 2018.
Nowadays the fat price is slightly about €0.5/kg.
FAT PRICE (€/T)
Source: Associazione Granaria di Milano
The new re-esterification plant for €2.5 mn capex will allow SICIT to sell an
improved quality product for a higher price (estimated €0.85-0.90/kg or €0.3-0.4/kg
more than commodity price) directly as a biofuel additive. The plant will add circa
€100-110/t in unit costs. Therefore the new plant could add about €3.2 mn in
EBITDA once on-stream.
Direct Sales34.2%
Wholesalers65.8%
5.6 5.3 5.5 5.9
4.7 5.77.1
9.210.3 11.0
12.6
15.1
2014 2015 2016 2017
Direct Sales Wholesalers

32
SICIT | July 25, 2019
EXPANSION PROJECTS – REVENUES TARGETED TO DOUBLE BY 2022
The business combination injected €30 mn in SICIT as equity and will support the
growth strategy. The business plans aim to expand its production base through
debottlenecking and two greenfield investments which will account for about €63-64
mn of capex.
Through its expansion program SICIT aims to almost double its revenues and
slightly increase EBITDA margin by 2022. The debottlenecking measures will increase
EBITDA by ~€12 mn or +8% increase CAGR over the 2017-22 period.
SICIT - EBITDA BRIDGE (2018-22E) - € MN
Greenfields: new plant in South America and granules plant in Italy Source: Equita - SICIT
The EBITDA increase from debottlenecking is quite visible, considering the track
record of the company, the type of installations and the expansion in its well-
known markets. The success of the greenfield projects has somewhat a lower
degree of visibility:
- The granulated fertilizer plant will improve the value of its existing products and
it is a sizeable opportunity for SICIT – at full capacity we estimate it can
generate more than €6 mn in EBITDA. The plant will be on-stream by 2021/22
but it might take longer for profits to be fully realized, driven by the slightly
diverse product/clients vs its existing portfolio. Granular and tablet
biostimulants could be more suitable to fertilizer companies (rather than crop
protection industry) since they can be easily integrated in granulated NPK or
Urea.
- The plant in LATAM will maintain the successful manufacturing process of
Arzignano and Chiampo, but the management somewhat lacks track record in
setting up capacity abroad.
Therefore our estimates includes just ~€3.3 mn contribution from the greenfield
projects out of the ~€12-13 mn potential which could require a longer time to be
realized.

33
SICIT | July 25, 2019
EXPANDING EXISTING CAPACITY (€38 MN CAPEX)
Debottleneck investments will allow SICIT to expand the capacity of the existing
plants of Arzignano and Chiampo.
1. Arzignano plant.
The plant will increase/improve its capacity through:
- A new installation for the production of special agro biostimulants in order to
include secondary and micronutrients to fulfil the increasing requests from
clients of more sophisticated products (FY2019);
- A new installation for the treatment of waste from hair (c. 12kt production
expected by 2022);
- a re-esterification plant to improve the quality of its fat production; the
realized price would increase by €300-400/t for an additional estimated opex
cost of ~€100/t (FY2020).
- the expansion of the warehouse (FY2021);
- two cogeneration plant for energy supply for €600 k cost savings (each).
2. Chiampo plant.
The plant will increase/improve its capacity through:
- The increase of treatment of waste from trimming wet-blue (c. 10ktpa
production additional expected by 2022) and shaving (c. 2ktpa production
additional expected by 2022). Average selling price of €1.5/kg;
- the expansion of the warehouse (FY2019-20);
- expansion of capacity of sludge treatment to reduce the cost for the disposal
of waste materials (€1 mn per annum of lower opex from FY2020-21).
- a cogeneration plant for energy supply (FY2020) for €600 k cost savings;.
WASTE INPUTS COLLECTED (2015-22E) – YEARLY ‘000 TONS
Source: SICIT, Equita
GREENFIELD EXPANSION – A NEW HYDROLIZED PROTEIN PLANT (€20 MN CAPEX)
Sicit has identified few opportunities to setup a new plant in Latin America to expand
its manufacturing base close to other tanning industry districts. It aims to leverage
its know-how on its process on hydrolysed proteins. Latam (Brazil, Mexico or
Paraguay) has been identified as potential internationalization routes, due to:
- favourable availability of raw materials;
- waste management practices;
- low cost manufacturing.
The Brazilian and Mexican tanning industries already dispose of tanneries waste via
recycling whereas Paraguay may be targeted despite the relatively scarce availability
of raw material – it benefits from low cost of operations and favourable regulations.
94.0 93.0 91.0 99.6 101.0 102.0 103.0 104.1
14.7 19.3 20.020.4 21.0 21.0 21.0 23.0
1 34 12 12 18 22
0.0
1.55.0
10.012.0
109 113 114124 136
140152
161
0.0
20.0
40.0
60.0
80.0
100.0
120.0
140.0
160.0
180.0
2015 2016 2017 2018 2019E 2020E 2021E 2022E
Hair Trimming/Wet Blue
Shaving Fleshing

34
SICIT | July 25, 2019
REGIONS WHERE SICIT IS EVALUATING THE SET UP OF A NEW PLANT
Source: SICIT
The tanning industry market has assumed a global character, with several important
tanning districts. Asia is the world’s largest tanning cluster, with China producing
annually c. 350 mn m2 of leather.
GLOBAL LEATHER PRODUCTION CLUSTERS (2016)[1]
Notes: [1] Production of light leather from bovine and ovine animals 2016 Source: FAO; SICIT, Equita
Country Raw materials availabilityEase of implement operations
Waste disposal landscape Cost of operations (1) WB – Ease of doing business
Brazil•Very largest production of
leather (170m m2yearly),therefore presenting highavailability in input
•White wet is rarely used
•Consolidated waste treatment chain:- fleshing sold to zootechnic industry- trimming and shaving to recovered
leather producers
•Energy costs: 70• Labour costs: 60•Corporate Tax: 40%
•Overall ranking: 125- Dealing with construction: 170- Trading across border: 139- Starting a Business: 176
Mexico•Average to large production of
leather (55m m2yearly), mainlyfor footwear and automotive
•White wet is used especially inthe automotive sector
•Consolidated waste treatment chain:- fleshing sold to zootechnic industry- trimming and shaving to recovered
leather producers
•Energy costs: 50• Labour costs: 40•Corporate Tax: 30%
•Overall ranking: 50- Dealing with construction: 87- Trading across border: 63- Starting a Business: 90
Paraguay•Small production of leather
(10m2yearly)•White wet is rarely used•Raw hides can be easily imported
from surrounding countries
•All waste is disposed of via landfill.No alternative method is
•Energy costs: 50• Labour costs: 20•Corporate Tax: 10%
•Overall ranking: 108- Dealing with construction: 72- Trading across border: 120- Starting a Business: 146
Vietnam•Average production of leather
(35m m2 yearly), mainly forfootwear
•White wet is rarely used•Raw hides mostly imported
•All waste is disposed of via landfill orincineration
• Low level of enforcement of currentenvironmental laws
•Energy costs: 70• Labour costs: 20•Corporate Tax: 20%
•Overall ranking: 68- Dealing with construction: 20- Trading across border: 94- Starting a Business: 123

35
SICIT | July 25, 2019
GRANULATED FERTILIZER PLANT (€6 MN CAPEX)
Sicit plans to build a new plant to transform hydrolized proteins into granulated
fertilizers suitable for organic farming; it is not excluded that SICIT will sell directly
(B2C) its own products which will not compete with existing business and its current
customer base.
The granulated fertilizer has a polymer coating that contains the nutrients inside the
membrane. It prevents valuable nutrients from leaching into the soil and volatilizing
into the air. The coating provides a semi-permeable membrane around the fertilizer.
Due to the fertilizer's hygroscopic nature, water will permeate through the
membrane, allowing the nutrients to dissolve. The low nutrient concentration outside
the membrane, will act as a driving force to permeate dissolved nutrients through the
membrane into the soil. This process is mainly controlled by temperature and thus
synchronized with the growing process of the plant, leading to an extremely effective
nutrient uptake.
TRADITIONAL FERTILIZER VS GRANULATED (SMART) FERTILIZER
Source: Maire Tecnimont
Whereas traditional fertilizers need to be applied several times during the growing
season of the plant, the use of granular/smart fertilizers requires only a single
application. This makes the application on the field a lot easier, while saving on
labour and fuel costs. A smart fertilizer provides the required nutrients at the right
time and the right rate, resulting in a more efficient use of valuable nutrients.
Granulated fertilizers command a premium vs standard fertilizers driven by the
higher efficiency. The premium is even more evident for consumer products. The
expansion into a higher value-added product could be considered a natural evolution
of the small players with a valuable product portfolio.
The plant will be on-stream by 2021/22 but it might take longer for profits to be fully
realized, driven by the slightly diverse product/clients vs its existing portfolio.
Granular and tablet biostimulants could be more suitable to fertilizer companies
(rather than crop protection industry) since they can be easily integrated in
granulated NPK or Urea.
We also believe the eventual entrance in a new market (B2C) may prove
challenging for SICIT - at least at the beginning - and it could require more time for
the investment to yield the targeted profits. In the consumer segment SICIT will
target products for home and garden not in competition with its existing clients.
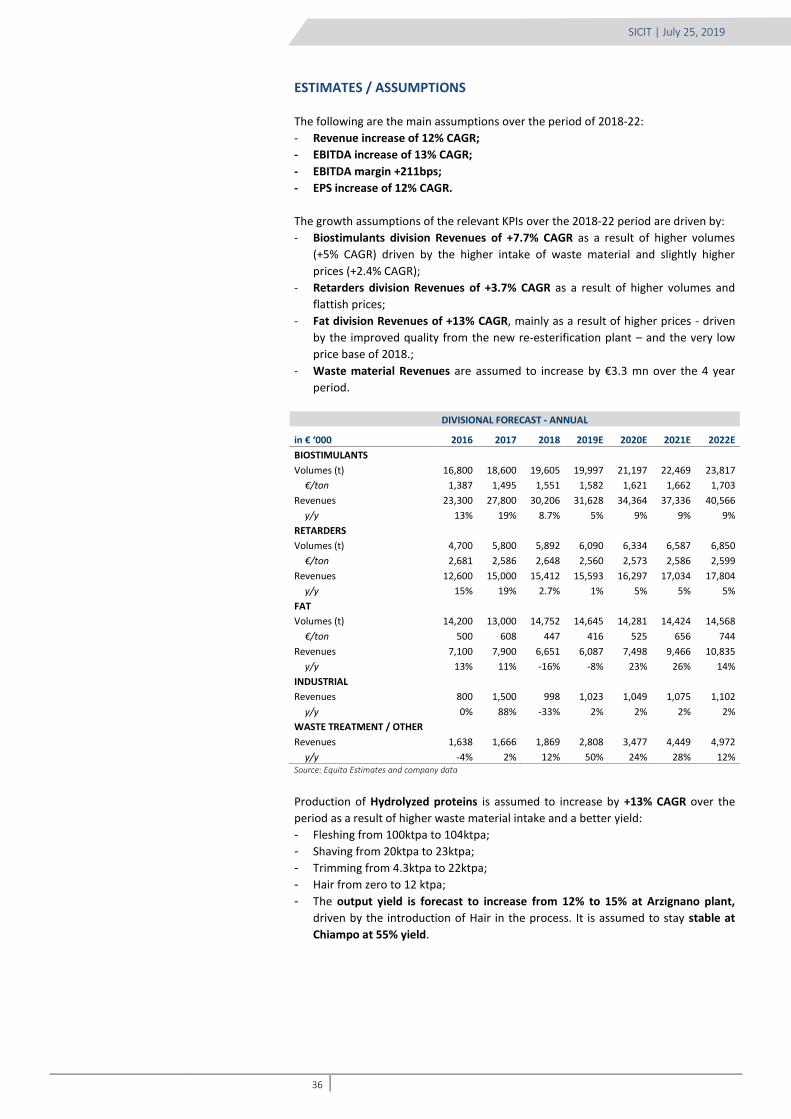
36
SICIT | July 25, 2019
ESTIMATES / ASSUMPTIONS
The following are the main assumptions over the period of 2018-22:
- Revenue increase of 12% CAGR;
- EBITDA increase of 13% CAGR;
- EBITDA margin +211bps;
- EPS increase of 12% CAGR.
The growth assumptions of the relevant KPIs over the 2018-22 period are driven by:
- Biostimulants division Revenues of +7.7% CAGR as a result of higher volumes
(+5% CAGR) driven by the higher intake of waste material and slightly higher
prices (+2.4% CAGR);
- Retarders division Revenues of +3.7% CAGR as a result of higher volumes and
flattish prices;
- Fat division Revenues of +13% CAGR, mainly as a result of higher prices - driven
by the improved quality from the new re-esterification plant – and the very low
price base of 2018.;
- Waste material Revenues are assumed to increase by €3.3 mn over the 4 year
period.
DIVISIONAL FORECAST - ANNUAL
in € ‘000 2016 2017 2018 2019E 2020E 2021E 2022E
BIOSTIMULANTS
Volumes (t) 16,800 18,600 19,605 19,997 21,197 22,469 23,817
€/ton 1,387 1,495 1,551 1,582 1,621 1,662 1,703
Revenues 23,300 27,800 30,206 31,628 34,364 37,336 40,566
y/y 13% 19% 8.7% 5% 9% 9% 9%
RETARDERS
Volumes (t) 4,700 5,800 5,892 6,090 6,334 6,587 6,850
€/ton 2,681 2,586 2,648 2,560 2,573 2,586 2,599
Revenues 12,600 15,000 15,412 15,593 16,297 17,034 17,804
y/y 15% 19% 2.7% 1% 5% 5% 5%
FAT
Volumes (t) 14,200 13,000 14,752 14,645 14,281 14,424 14,568
€/ton 500 608 447 416 525 656 744
Revenues 7,100 7,900 6,651 6,087 7,498 9,466 10,835
y/y 13% 11% -16% -8% 23% 26% 14%
INDUSTRIAL
Revenues 800 1,500 998 1,023 1,049 1,075 1,102
y/y 0% 88% -33% 2% 2% 2% 2%
WASTE TREATMENT / OTHER
Revenues 1,638 1,666 1,869 2,808 3,477 4,449 4,972
y/y -4% 2% 12% 50% 24% 28% 12% Source: Equita Estimates and company data
Production of Hydrolyzed proteins is assumed to increase by +13% CAGR over the
period as a result of higher waste material intake and a better yield:
- Fleshing from 100ktpa to 104ktpa;
- Shaving from 20ktpa to 23ktpa;
- Trimming from 4.3ktpa to 22ktpa;
- Hair from zero to 12 ktpa;
- The output yield is forecast to increase from 12% to 15% at Arzignano plant,
driven by the introduction of Hair in the process. It is assumed to stay stable at
Chiampo at 55% yield.
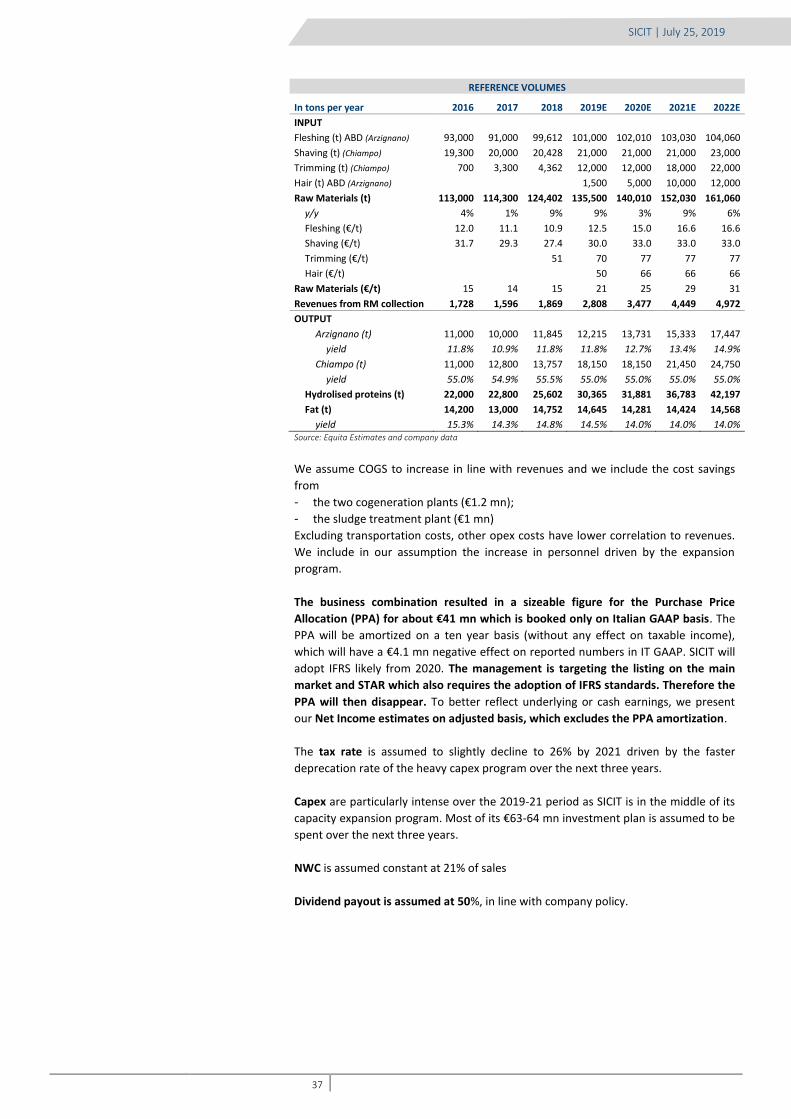
37
SICIT | July 25, 2019
REFERENCE VOLUMES
In tons per year 2016 2017 2018 2019E 2020E 2021E 2022E
INPUT
Fleshing (t) ABD (Arzignano) 93,000 91,000 99,612 101,000 102,010 103,030 104,060
Shaving (t) (Chiampo) 19,300 20,000 20,428 21,000 21,000 21,000 23,000
Trimming (t) (Chiampo) 700 3,300 4,362 12,000 12,000 18,000 22,000
Hair (t) ABD (Arzignano) 1,500 5,000 10,000 12,000
Raw Materials (t) 113,000 114,300 124,402 135,500 140,010 152,030 161,060
y/y 4% 1% 9% 9% 3% 9% 6%
Fleshing (€/t) 12.0 11.1 10.9 12.5 15.0 16.6 16.6
Shaving (€/t) 31.7 29.3 27.4 30.0 33.0 33.0 33.0
Trimming (€/t) 51 70 77 77 77
Hair (€/t) 50 66 66 66
Raw Materials (€/t) 15 14 15 21 25 29 31
Revenues from RM collection 1,728 1,596 1,869 2,808 3,477 4,449 4,972
OUTPUT
Arzignano (t) 11,000 10,000 11,845 12,215 13,731 15,333 17,447
yield 11.8% 10.9% 11.8% 11.8% 12.7% 13.4% 14.9%
Chiampo (t) 11,000 12,800 13,757 18,150 18,150 21,450 24,750
yield 55.0% 54.9% 55.5% 55.0% 55.0% 55.0% 55.0%
Hydrolised proteins (t) 22,000 22,800 25,602 30,365 31,881 36,783 42,197
Fat (t) 14,200 13,000 14,752 14,645 14,281 14,424 14,568
yield 15.3% 14.3% 14.8% 14.5% 14.0% 14.0% 14.0% Source: Equita Estimates and company data
We assume COGS to increase in line with revenues and we include the cost savings
from
- the two cogeneration plants (€1.2 mn);
- the sludge treatment plant (€1 mn)
Excluding transportation costs, other opex costs have lower correlation to revenues.
We include in our assumption the increase in personnel driven by the expansion
program.
The business combination resulted in a sizeable figure for the Purchase Price
Allocation (PPA) for about €41 mn which is booked only on Italian GAAP basis. The
PPA will be amortized on a ten year basis (without any effect on taxable income),
which will have a €4.1 mn negative effect on reported numbers in IT GAAP. SICIT will
adopt IFRS likely from 2020. The management is targeting the listing on the main
market and STAR which also requires the adoption of IFRS standards. Therefore the
PPA will then disappear. To better reflect underlying or cash earnings, we present
our Net Income estimates on adjusted basis, which excludes the PPA amortization.
The tax rate is assumed to slightly decline to 26% by 2021 driven by the faster
deprecation rate of the heavy capex program over the next three years.
Capex are particularly intense over the 2019-21 period as SICIT is in the middle of its
capacity expansion program. Most of its €63-64 mn investment plan is assumed to be
spent over the next three years.
NWC is assumed constant at 21% of sales
Dividend payout is assumed at 50%, in line with company policy.

38
SICIT | July 25, 2019
SICIT: 2016-22 FIGURES (€ MN) – IT GAAP
in € ‘000 2016 2017 2018 2019E 2020E 2021E 2022E
INCOME STATEMENT
Revenues 45,438 53,866 55,136 57,138 62,685 74,960 86,479
y/y 12% 19% 2% 4% 10% 20% 15%
Utilities 4,297 4,064 4,160 4,011 3,800 4,244 4,897
Water Treatment 1,071 1,060 1,085 1,124 1,234 1,475 1,702
Sludge Treatment 2,787 3,133 3,207 3,323 3,646 3,860 3,953
Purchases 8,158 10,547 11,590 12,011 13,177 15,757 18,179
COGS 16,313 18,804 20,042 20,469 21,856 25,337 28,730
Gross Profit 29,125 35,062 35,094 36,669 40,828 49,624 57,749
Gross margin 64% 65% 64% 64% 65% 66% 67%
Services 7,879 7,777 7,960 8,249 9,050 10,823 12,486
Personnel 5,530 6,041 7,655 7,961 8,359 9,655 10,645
Other -1,880 -916 -3,181 -3,200 -3,040 -2,888 -2,744
Other Opex 11,529 12,902 12,434 13,011 14,369 17,589 20,387
EBITDA 17,596 22,160 22,660 23,658 26,459 32,034 37,363
Margin 38.7% 41.1% 41.1% 41.4% 42.2% 42.7% 43.2%
Depreciation 3,837 4,249 4,664 5,048 6,593 8,011 9,323
% sales 8% 8% 8% 9% 11% 11% 11%
EBIT 17,996 18,610 19,866 24,024 28,040
Amortization (PPA) 4,100 4,100 4,100 4,100
D&A Total 3,837 4,249 4,664 9,148 10,693 12,111 13,423
EBIT 13,759 17,911 17,996 14,509 15,765 19,922 23,938
Margin 30% 33% 33% 25% 25% 27% 28%
Financial Expenses -43 185 -238 0 0 0 0
EBT 13,802 17,726 18,233 14,509 15,765 19,922 23,938
taxes 4,022 4,805 4,870 4,838 5,165 6,246 7,290
tax rate 29.1% 27.1% 26.7% 26.0% 26.0% 26.0% 26.0%
Net Income (rep.) 9,780 12,921 13,363 9,671 10,600 13,677 16,648
Net Income (adj.)* 9,780 12,921 13,363 13,771 14,700 17,777 20,748
# shares outstanding (mn) 19.83 19.83 19.83 19.83 19.83 19.83
EPS (€c) - rep. 65.18 67.40 48.78 53.47 68.99 83.98
EPS (€c) - adj.* 65.18 67.40 69.47 74.15 89.67 104.66
yoy 3% 3% 7% 21% 17%
DPS (€c) 34 36 37 45 52
* Amortization of PPA is excluded from Net Profit. The IFRS adoption will exclude it from the income statement
BALANCE SHEET
NFP 12,788 15,439 14,515 27,600 22,627 19,434 28,150
NWC 9,800 11,500 11,551 12,245 13,434 16,064 18,533
%sales 22% 21% 21% 21% 21% 21% 21%
Equity 55,074 61,301 69,886 135,000 137,779 143,363 150,379
Capital Employed 42,286 45,862 55,371 107,400 115,152 123,928 122,230
Roce 33% 39% 33% 13% 13% 15% 19%
CF STATEMENT
EBITDA (excl. upsides) 17,596 22,160 22,660 23,658 26,459 32,034 37,363
Interest cost 43 -185 238 0 0 0 0
Taxes -4,022 -4,805 -4,870 -4,839 -5,165 -6,246 -7,290
Other 139 1,254 -3400 0 0 0 0
NWC change -1,500 -1,700 -51 -694 -1,189 -2,631 -2,469
OpCF 12,256 16,724 14,577 18,125 20,105 23,157 27,604
Capex 6,768 7,380 8,400 17,000 18,000 19,000 10,000
%sales 15% 14% 16% 29% 28% 26% 13%
FCF 5,488 9,344 6,177 1,125 2,105 4,157 17,604
Dividend -2,500 -6,693 -17,982 -18,041 -7,078 -7,350 -8,889
Increase in Equity 30,000
Net FCF 2,988 2,651 -11,805 13,085 -4,973 -3,193 8,715 *adj. for PPA (excluded in IFRS) Source: Equita Estimates and company data

39
SICIT | July 25, 2019
FY2019 OPPORTUNITIES AND CHALLENGES
POSITIVES
In FY19, we expect EBITDA will grow at a more moderate pace (+4% yoy) than its
mid-term potential due by the following drivers:
- First cogeneration plant which will save about €600.000 on a yearly basis
(commissioning on June 2019);
- Higher prices for waste material intake (from an average of €15/t in 2018 to
about €21/t in 2019);
- Slightly higher volume intake of waste material thanks to new capacity
treatment of hair; Sicit announced on 18 July to have anticipated the production
of protein hydrosalate from animal hair. When fully operational, it will result in a
production of additional 4,000 tpa of protein hydrolysates, bringing the total
volumes from the Arzignano plant to 16,000 tpa. The plant yield will improve
about 200bps and production costs will be lowered by about 10-15%.
On total the three drivers may add up to €2 mn to EBITDA. On top of that SICIT may
collect some additional waste material outside the Arzignano leather district due to
operational and economic issues at its main Italian competitor – mainly SGS based in
Tuscany. There is a huge gap between the price applied by the two recyclers and a
few tanners in Tuscany may decide to shift its waste material toward Veneto.
We estimate SICIT may collect up to 20 ktpa of fleshing from the tanners in Tuscany
to reach full theoretical capacity.
NEGATIVES
There are other drivers that may instead affect negatively the EBITDA this year:
- Agrochemical volumes have been weak in 1H19 due to unfavourable weather
conditions in US. BASF just issued a profit warning on 8 July due to, among other
factors, the weak development of the agricultural sector in North America
following unfavourable weather conditions. The planting of key field crops in the
region was down from the previous year and far below the historical average. The
decrease in earnings prospects for farmers and the trade disputes led to lower
demand for agrochemical products;
- The launch of new biostimulants products have been postponed to 2020 due to
the unfavourable market environment. Despite the new capacity of hydrolized
proteins at SICIT, its clients may need some time (12-24 months) to allocate
additional volumes in new markets, requiring some commercial, R&D and testing
activities and investments;
- The outlook for building materials has somewhat weakened despite a positive
momentum for 1Q19.
Therefore the usual growth pattern of its end markets may be suspended in total or
in part this year and it could result in a lower EBITDA expansion than its average
trend. This is the main cause of our conservative rating recommendation.
On FY2020 we are more constructive and we believe SICIT will start to show the
first sizeable benefits of its expansion plan.

40
SICIT | July 25, 2019
BENCHMARKING AND VALUATION REMARKS
When analysing a company that is part of a market niche, it is difficult to find highly
comparable companies or very reliable panel in order to make a reasonable
comparison.
SICIT does not have any listed comparable with the same business characteristics
and/or that competes in the same market. Having said that, we think it is also
reasonable to understand the market dynamics of the agrochemical industry. We
briefly describe four clusters for the valuation comparison, but we believe only the
Crop Protection/Seeds is suitable for our purpose.
PURE CROP PROTECTION/SEEDS
This industry used to represent the main clients in the Biostimulation business and
we believe it is the most relevant cluster. Following the consolidation in the industry
over the past three years, the number of listed competitors in this cluster has
reduced over time. Corteva was recently listed as a spin-off of the Dow/Dupont
merger of the agro business. As previously discussed the growth has been
moderating due to the increasing resistance of pests, herbs and fungi to chemical
formulations. To improve yields, the industry developed more sophisticated GMO
seeds, in combination to chemicals. The revenue/earnings volatility is limited, and
the earnings growth was pretty much steady over time. Despite the difference in
size, competitive environment and value chain, this cluster of agrochemicals is the
most comparable to SICIT in terms of market dynamics. (Please read the crop
protection/agrochemicals industry in the Appendix).
CROP PROTECTION / SEEDS
Market EV/SALES EV/EBITDA P/E EBITDA EPS CAGR
COMPANY Cap (€ bn) 2019 2022 2021 2019 2022 2021 2019 2022 2021 MG 2019 2019-21
Corteva 18.0 1.4x 1.4x 1.3x 9.4x 8.3x 7.5x 24.0x 18.8x 16.4x 15% 21%
FMC Corp 9.6 3.0x 2.8x 2.7x 11.3x 10.3x 9.8x 14.3x 12.4x 11.2x 26% 13%
Nufarm 1.0 0.8x 0.8x 0.7x 6.5x 5.4x 5.1x 16.0x 10.2x 8.7x 12% 36%
KWS Saat 2.1 2.0x 1.9x 1.8x 12.2x 11.5x 11.0x 21.0x 19.8x 18.7x 17% 6%
Vilmorin 1.1 1.5x 1.4x 1.4x 6.6x 6.2x 6.0x 14.5x 12.6x 11.4x 23% 13%
AVERAGE 1.7x 1.7x 1.6x 9.2x 8.4x 7.9x 18.0x 14.7x 13.3x 19% 18% Source: Equita, Bloomberg data
The discount to the cluster is sizeable: SICIT trades at about 25% discount on
EV/EBITDA on current year. To us, the EV/EBITDA trading multiple is more
meaningful as the different financial leverage of the companies will distort
considerations on P/E ratios. At the beginning of its stock listing period, we believe
10-20% discount is more reasonable due to stock liquidity and market cap size. Once
the plan contribution will show its effects in 2020-21 the fair discount should
narrow to zero considering the higher growth potential and the M&A premium.
We believe the biostimulant sector is still fragmented and the company may be
part of the consolidation process in which the big agrochemicals may be active
buyers in this business. The M&A process will likely be driven by: 1. the lack of growth
of its core seeds/crop protection business; 2. The need to increase the exposure to
products which helps growers to be more sustainable.
On top of that, we believe its business model deserves higher trading multiples, due
to the lack of stocks exposed to the circular economy/sustainability trend.
FERTILIZERS
Despite the similar product function, the industry dynamic of fertilizers does not
share much with Biostimulants. Earnings pattern is highly volatile driven by the
commodity nature of its business. Therefore trading multiples follow the earnings
trend cycle from peak to through. On average this industry trades at lower trading
multiples vs chemical average (Please read the fertilizer industry in the Appendix).

41
SICIT | July 25, 2019
FERTILIZERS
Market EV/SALES EV/EBITDA P/E EBITDA EPS CAGR
COMPANY Cap (€ bn) 2019 2022 2021 2019 2022 2021 2019 2022 2021 MG 2019 2019-21
CF Industries 8.7 2.3x 2.2x 2.2x 6.6x 5.8x 5.5x 23.2x 16.7x 14.2x 35% 28%
Incitec Pivot 3.2 1.8x 1.7x 1.7x 10.1x 7.4x 7.4x 25.9x 12.9x 12.6x 18% 43%
ICL 5.8 1.6x 1.5x 1.4x 7.3x 6.9x 6.8x 13.0x 11.9x 11.4x 21% 7%
K+S 3.1 1.5x 1.4x 1.4x 7.8x 6.8x 6.4x 13.4x 10.3x 8.9x 19% 23%
Mosaic 7.9 1.4x 1.4x 1.3x 7.0x 6.1x 5.7x 13.9x 10.0x 8.5x 20% 27%
Nutrien 26.5 1.5x 1.5x 1.4x 6.7x 6.3x 6.1x 17.6x 15.2x 14.0x 23% 12%
OCI 5.0 2.7x 2.4x 2.3x 8.0x 6.4x 5.9x 17.8x 11.1x 9.3x 34% 39%
Tessenderlo 1.2 0.8x 0.7x 0.7x 5.7x 5.4x 4.9x 12.4x 10.8x 9.8x 14% 13%
Yara 11.2 1.2x 1.1x 1.1x 7.7x 6.6x 6.2x 14.7x 11.4x 10.5x 16% 18%
AVERAGE 1.6x 1.5x 1.5x 7.4x 6.4x 6.1x 16.9x 12.2x 11.0x 22% 23% Source: Equita, Bloomberg data
LARGE AGROCHEMICAL CONGLOMERATES
Before the M&A season, these companies used to trade at expensive trading
multiples (18-22x P/E and >10x EV/EBITDA), driven by the steady growth of its
portfolio and the high barriers of entry. By then, the trading multiples derated
substantially due to the lower growth potential and the higher financial leverage
following the M&A process. We also believe this cluster is less suitable for our
valuation considerations.
AGROCHEMICAL CONGLOMERATES
Market EV/SALES EV/EBITDA P/E EBITDA EPS CAGR
COMPANY Cap (€ bn) 2019 2022 2021 2019 2022 2021 2019 2022 2021 MG 2019 2019-21
Bayer 55.5 2.0x 1.9x 1.9x 7.5x 6.9x 6.4x 8.7x 7.6x 7.0x 26% 11%
Basf 55.2 1.2x 1.1x 1.1x 8.7x 7.6x 7.2x 14.2x 12.4x 11.3x 14% 12%
Sumitomo Chem 6.6 0.7x 0.6x 0.6x 4.9x 4.7x 4.4x 8.0x 7.6x 7.2x 13% 6%
AVERAGE 1.3x 1.2x 1.2x 7.0x 6.4x 6.0x 10.3x 9.2x 8.5x 18% 10% Source: Equita, Bloomberg data
DIVERSIFIED AGROCHEMICAL INTERMEDIATES
Though the companies in this cluster are the suppliers of crop protection chemical
companies, it shares limited characteristics with Sicit. The share of revenues for the
agrochemical industries is low (on average <10%). The diversification of its end
markets, lower growth potential and lower profit margins make this cluster less
suitable for a value comparison. (Please read the crop protection/agrochemicals
industry in the Appendix).
INTERMEDIATES DIVERSIFIED
Market EV/SALES EV/EBITDA P/E EBITDA EPS CAGR
COMPANY Cap (€ bn) 2019 2022 2021 2019 2022 2021 2019 2022 2021 MG 2019 2019-21
AlzChem 0.2 0.7x 0.7x 0.6x 5.6x 4.6x 4.2x 11.2x 8.5x 7.3x 13% 23%
Clariant 5.7 1.1x 1.1x 1.0x 7.4x 6.5x 6.0x 12.8x 11.7x 10.5x 15% 10%
Evonik 11.8 1.0x 0.9x 0.9x 5.9x 5.6x 5.3x 12.7x 12.3x 11.2x 16% 7%
LANXESS 4.6 0.9x 0.9x 0.9x 6.6x 6.3x 6.0x 13.2x 11.9x 10.9x 14% 10%
Solvay 9.2 1.0x 1.0x 1.0x 4.7x 4.4x 4.3x 10.3x 9.7x 8.7x 22% 9%
AVERAGE 1.0x 0.9x 0.9x 6.0x 5.5x 5.1x 12.0x 10.8x 9.7x 16% 12% Source: Equita, Bloomberg data

42
SICIT | July 25, 2019
TARGET PRICE €11.60
Our target price is based on a rounded average of our models: DCF, and Target
multiples. Our 12 months target price factors in only a portion of the increase in
EBITDA from the ambitious strategic plan. At current stage, we believe investors will
not be willing to pay a full premium for its ambitious growth plan. Going forward,
when SICIT starts to deliver its earnings growth, we believe the higher visibility on the
plan will allow to be more constructive on its valuation and reduce the current
discount/risk premium applied to our target price.
In our DCF model, we currently assume quite a high beta on the stock despite the
relatively modest earnings volatility over the past few years due to the lack of
reliable comps listed on the market which would help to track its business
performance. Our WACC rate assumption may be lowered following a few quarters of
delivery of its business plan – de facto derisking its earnings growth path.
The assumed number of shares for target price calculation is coherent with the
warrant exercise at the relevant price scenario.
TARGET PRICE CALCULATION
DCF target 50% €11.6
Target multiples 50% €11.6
Average target (rounded) 100% €11.6 Source: EQUITA SIM estimates
ASSUMPTIONS DCF
Terminal growth rate 2.0% 2020E TV
WACC 9.30% Sales 62.7 88.2
EV 204.1 Change % 9.7% 2.0%
Net Cash (Debt) – end 2019 27.6 EBIT 19.9 28.6
Pension -0.5 Margin 32% 32%
Total Equity 231.2 Taxes -5.2 -7.4
Share outstanding 21.1 NOPAT 14.7 21.2
x share 11.0 Capex -18.0 -11.5
7 months compound 0.6 Depreciation 6.6 10.0
Change in Work. Cap -1.2 -0.4
Target price 11.6 Free Cash Flow 2.1 19.3 Source: Company data and EQUITASIM estimates
SENSITIVITY
WACC
8.30% 9.30% 10.30%
LT GROWTH
+1.0% 11.3 10.0 8.9
+2.0% 13.5 11.6 10.1
+3.0% 14.4 12.2 10.6 Source: EQUITA SIM estimates
In our target multiples model we apply a 20% discount to relevant peers average.
We believe some discount would be fair at the beginning of the investment plan
due to the lower market cap and stock liquidity. The stronger growth potential,
higher profitability and M&A appeal should act as mitigants to the sector discount
going forward. We also believe the exposure to the circular economy/sustainability
trend will likely command a premium.

43
SICIT | July 25, 2019
TARGET MULTIPLES
TARGET EV/EBITDA
EBITDA (€ mn) FY21 32
PEERS TRADING MULTIPLE 9.2x
DISCOUNT 20%
TARGET EV/EBITDA 7.4x
# SHARES (MN) 21.3
TARGET PRICE 12.0
TARGET P/E
NET INCOME (€ mn) FY21 17.8
PEERS TRADING MULTIPLE 18.0x
DISCOUNT 20%
TARGET P/E (ex cash) 14.4x
# SHARES (MN) 20.3
TARGET PRICE 12.0
AVERAGE PER SHARE 12.0
DISCOUNT FOR 5 MONTHS AT C.O.E. -0.4
TARGET PRICE 11.6 Source: EQUITA SIM estimates

44
SICIT | July 25, 2019
A SUSTAINED PACE OF M&A
Merger and acquisition activity in the biostimulant and biocontrol sector over the
last five years has been very active and shows no signs of slowing down. The big
crop protection companies (Syngenta, Bayer/Monsanto, BASF, Dupont/Dow) were
particularly active in biocontrol starting from the acquisition of Circle One Global by
Syngenta back in 2009. The process has slowed down following the mega-mergers
process.
THE OLD BIG 6 WERE ACTIVE IN THE BIOCONTROL BUSINESS CLUSTER
Source: Novozymes
In contrast to biocontrol, consolidation in the biostimulant industry has come
mainly from within the sector by companies expanding their presences in other
countries and building broader product portfolios.
Major announcements included:
- Biolchim acquisition of CIFO (2014);
- Multiple acquisition by Verdesian Life Sciences of INTX Microbials, (2013),
Specialty Fertilizer Products (2014), QC corporation (2014);
- Valagro acquisition of Sri Biotech Laboratories (2015).
Multinational companies have not been totally absent in biostimulants with
Novozymes (bbg ticker: NZYMB DC) and Monsanto (now part of Bayer) announcing in
December 2013 the formation of a long term strategic alliance focused on discovery
and development of microbials called the BioAg Alliance as well as the acquisition of
seaweed producer Goemar by Arysta in April 2014.
Biostimulant market is dominated mostly by privately owned companies in a high
fragmented market. This suggests there is an opportunity for much more
consolidation in the industry whose primary driver is the rapid growth trend.

45
SICIT | July 25, 2019
SICIT MANAGEMENT
Chairman - Giuseppe Valter Peretti
Owner and Head of Gruppo Peretti, a company active in the
leather tanning and in the capital goods industry. Vice
chairman of of UNIC (Unione Nazionale Industria Conciaria)
CEO – Massimo Neresini
CEO of SICIT since 2003. He before joining SICIT in 1988 as a
Technical Director, he worked for Ciba Geigy, FIS SpA, Rimar
Engineering, SnamProgetti and Snia Viscosa.
Chemical engineer from the University of Padova.
CFO – Gianpaolo Simionati
Joined SICIT since May 2019, has 15 years of experience in finance and administration
area at KPMG, P&G and Illinois Tool Work.
He graduated in Economics in 2006 from University of Padova.
SPRINT-ITALY SPAC
Listed on the AIM Italia in the July 2017, SPRINT-ITALY was a SPAC (Special Purpose
Acquisition Company), a vehicle that has been created specifically to raise the
financial resources required for a Business Combination (BC). The sole purpose of a
SPAC is to invest in a target company operating in Italy with appealing value creation
potential, a solid market positioning and established international reputation with a
pre-money valuation within a range of €150 mn to €500 mn.
Promoters
SPRINT-ITALY a mixture of private and institutional promoters, with a great
professional experience and deep knowledge of the Italian market.
FINEUROP, Institutional Promoter: Financial and independent group founded in
1966, Fineurop is a partner able to help and follow companies in different growth
paths: from geographic expansion to the exploration of new markets and structural
consolidation. Today Fineurop has a wide network with SMEs in many sector on the
Italian market.
Gerardo Braggiotti, Chairman:
- Banca Leonardo Chairman and G.B.H SpA board member
- Previously, Lazard Europe ldt Chairman
- 18 years in Mediobanca
- Started his professional career at General Electric after a graduation in Finance at
Institut d’Etudes Politiques in Paris.
Matteo Carlotti, Board Member:
- Since 2009 has worked as independent specialist in Private Equity sector
- In 2011 founded and managed MadeinItaly 1, the first SPAC of Italian law that, in
2013, successfully achieved the BC
- Graduated in management at Ca’ Foscari University

46
SICIT | July 25, 2019
Raymond Totah, Board Member:
- Fineurop Ceo
- Entered in Fineurop in 1986, covering different professional roles
- Graduated at Bocconi University
Enrico Ricotta, Board Member:
- Mandarin Advisory Srl Chairman
- 1998-2007 Dresdner Kleinwort Capital Advisory S.p.A Chairman
- 1996-1999 Manager in Imi-Abn Amro Investments S.p.A
- Graduated in Rome
Francesco Pintucci, Board Member:
- Isem Group CEO
- Previous experience in others SPAC and Private Equity
- Graduated in management engineering at Politecnico of Milan
Laura Cioli, Independent Board Member:
- RCS Mediagroup SpA CEO until 2016
- Previously CartaSi CEO
- Experience in companies such as Sky, ENI, Vodafone and Bain&Company
- Graduated in electronic engineering at Bologna University got a master in
Business Administration at Bocconi University
Eugenio Morpurgo, Board Member:
- Fineurop Soditic SpA, company of Fineurop Group, CEO and founding partner
- Deutsche Bank in London, Milan and Frankfurt
- Investment Banking professor at Bocconi University
- Graduated at Bocconi University Before the BC, the Promoters have subscribed €3.0 mn (300k Special Shares at €10 each). Special Shares are not listed, not voting for the BC and subordinated in case of liquidation. The promoters invested a total amount of €12.7mn in ordinary shares too.
The financial resources provided by the Promoters (via Special Shares) have been used to pay SPAC’s constitution fees and expenses, operating expenses, due diligence and acquisition costs (legal costs, auditors, advisors, IPO costs etc.). Investment features
Sprint has raised €150 mn through the issue of 15 mn of ordinary shares. Investors received 3mn warrants at the IPO and they are entitled, at the BC, to additional warrants according to the same ratio: 3 free warrants each 10 Ordinary Shares, which not exercised the withdrawal right. Each warrant entitles investors to receive a formula-based number of new Ordinary Shares in the combined entity:
Number of new shares per warrant = (avg. monthly share price – strike price)
(avg. monthly share price – share subscription price);
- Quasi cashless (subscription price equal to €0.1 per share);
- Strike Price of €9.50;
- Mandatory conversion when Ordinary Share price equals or exceeds €13;
- Exercise period: 5 years from the BC.

47
SICIT | July 25, 2019
Merger
On January 11th 2019, SICIT announced a merger agreement regarding the business
combination between the company and SPRINT. The Merger took effect on Monday
20 May 2019 and the accounting and tax effects will be charged to the financial
statements of the Company as from 1 January 2019. The 20 May 2019 was also the
first day of listing on AIM of the company resulting from the Merger, which was
named "SICIT Group S.p.A.". An ordinary dividend of Euro 0.34 per share was
approved by the Merged Company in favour of the ordinary shareholders of the
company resulting from the Merger and therefore also in favour of the ordinary
shareholders of SpI (who have not exercised their right of withdrawal). It was paid in
June 2019.
SICIT’s implied valuation of the SPAC deal:
- Equity (100%, pre-money) is equal to € 160mn or 2017 Adj. PE=~12x;
- EV is equal to € 156.6 mn, assuming a €3.4 positive NFP after the payment of
€11.3 mn dividend, and 2017 EV/EBITDA=7x.
Deal structure and use of proceeds:
- Reverse merger;
- Sprint total investment: €100 mn, out of € 150mn collected, split as follows: €30
mn for capital increase and €70 mn for the purchase of 7 mn shares from Intesa
Holding (from minority and non-strategic shareholders);
- Following the withdrawal of 1,250,000 shares for €12.5 mn reimbursement, the
excess cash of €37.5 mn was distributed to the remaining pre Business
Combination shareholders.
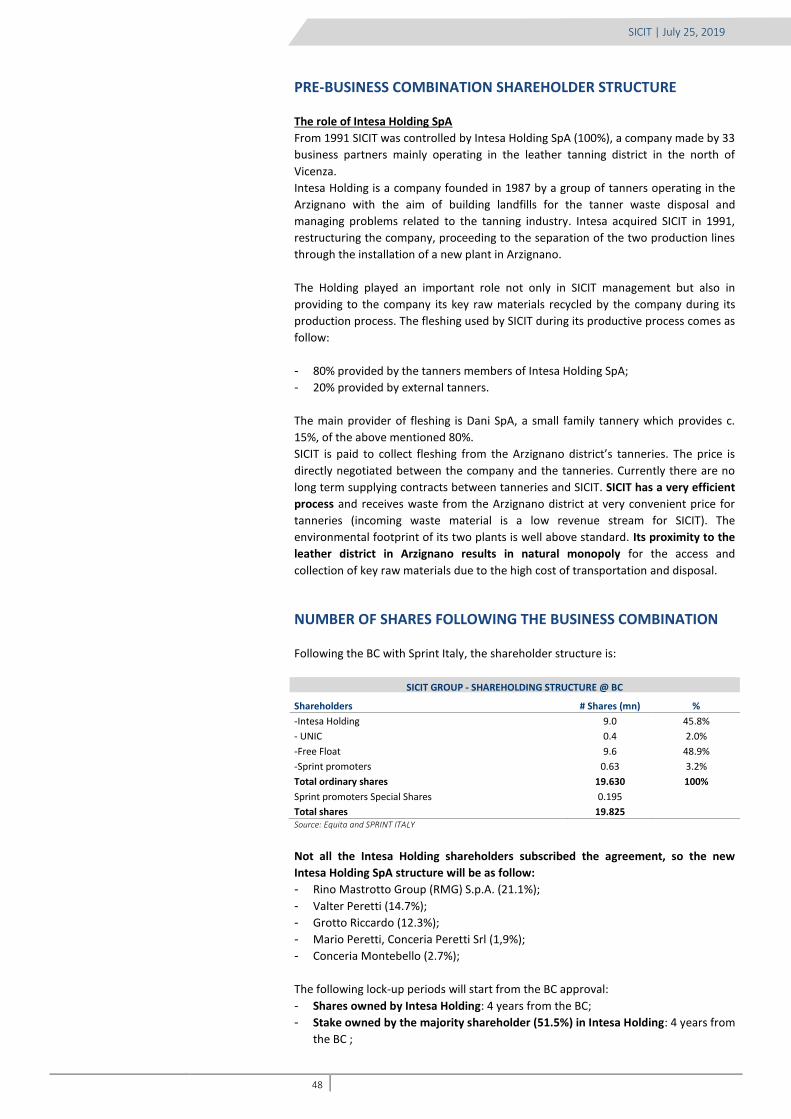
48
SICIT | July 25, 2019
PRE-BUSINESS COMBINATION SHAREHOLDER STRUCTURE
The role of Intesa Holding SpA
From 1991 SICIT was controlled by Intesa Holding SpA (100%), a company made by 33
business partners mainly operating in the leather tanning district in the north of
Vicenza.
Intesa Holding is a company founded in 1987 by a group of tanners operating in the
Arzignano with the aim of building landfills for the tanner waste disposal and
managing problems related to the tanning industry. Intesa acquired SICIT in 1991,
restructuring the company, proceeding to the separation of the two production lines
through the installation of a new plant in Arzignano.
The Holding played an important role not only in SICIT management but also in
providing to the company its key raw materials recycled by the company during its
production process. The fleshing used by SICIT during its productive process comes as
follow:
- 80% provided by the tanners members of Intesa Holding SpA;
- 20% provided by external tanners.
The main provider of fleshing is Dani SpA, a small family tannery which provides c.
15%, of the above mentioned 80%.
SICIT is paid to collect fleshing from the Arzignano district’s tanneries. The price is
directly negotiated between the company and the tanneries. Currently there are no
long term supplying contracts between tanneries and SICIT. SICIT has a very efficient
process and receives waste from the Arzignano district at very convenient price for
tanneries (incoming waste material is a low revenue stream for SICIT). The
environmental footprint of its two plants is well above standard. Its proximity to the
leather district in Arzignano results in natural monopoly for the access and
collection of key raw materials due to the high cost of transportation and disposal.
NUMBER OF SHARES FOLLOWING THE BUSINESS COMBINATION
Following the BC with Sprint Italy, the shareholder structure is:
SICIT GROUP - SHAREHOLDING STRUCTURE @ BC
Shareholders # Shares (mn) %
-Intesa Holding 9.0 45.8%
- UNIC 0.4 2.0%
-Free Float 9.6 48.9%
-Sprint promoters 0.63 3.2%
Total ordinary shares 19.630 100%
Sprint promoters Special Shares 0.195
Total shares 19.825 Source: Equita and SPRINT ITALY
Not all the Intesa Holding shareholders subscribed the agreement, so the new
Intesa Holding SpA structure will be as follow:
- Rino Mastrotto Group (RMG) S.p.A. (21.1%);
- Valter Peretti (14.7%);
- Grotto Riccardo (12.3%);
- Mario Peretti, Conceria Peretti Srl (1,9%);
- Conceria Montebello (2.7%);
The following lock-up periods will start from the BC approval:
- Shares owned by Intesa Holding: 4 years from the BC;
- Stake owned by the majority shareholder (51.5%) in Intesa Holding: 4 years from
the BC ;

49
SICIT | July 25, 2019
Due to SPRINT’s characteristics, we would like to highlight the post-BC potential
dilutive impact.
In fact, new ordinary shares may be issued due to:
- Conversion of the remaining Special Shares: 0.195 mn shares if the official price
of the Ordinary Shares is greater than or equal to the price threshold per Ordinary
Share (€13.5). If this threshold is not surpassed within 5 years Special shares are
converted into ordinary shares automatically (conversion swap = 1:1);
- Exercise of Investors’ warrants: - Up to 7.125 mn;
- Strike Price = €9.5ps;
- Life =5 years;
- Cap = €13ps (mandatory conversion).
The following sensitivity analysis presents the total and potential number of shares,
considering the relevant scenarios of market price and when investors exercise their
warrants.
Sensitivity’s assumptions:
- % of exercised warrants = 100%;
- All warrants on the market exercised at the following alternatives:
mkt price =€10, mkt price=€11, mkt price = €12 and mkt price = €13.
On top of this, conversion of Special Shares and Performance shares are considered.
SICIT GROUP – NUMBER OF SHARES (MN)
Market Price
€ps 10.0 11.0 12.0 13.0 13.5 14.0 14.5
Ordinary shares @ BC 19.0 19.0 19.0 19.0 19.0 19.0 19.0
from market warrant conversion 0.4 1.0 1.5 1.9 1.9 1.9 1.9
from Special share conversion 0.6 0.6 0.6 0.6 1.8 1.8 1.8
Total Ordinary shares (mn) 20.0 20.6 21.1 21.6 22.7 22.7 22.7
special shares non-converted 0.2 0.2 0.2 0.2 0.0 0.0 0.0
Total shares (mn) 20.2 20.8 21.3 21.8 22.7 22.7 22.7 Source: Equita and SPRINT ITALY

50
SICIT | July 25, 2019
MULTIPLES SENSITIVITY
Below are some sensitivities regarding the implied multiples at different stock price.
SICIT GROUP - MKT MULTIPLES SENSITIVITY
Market Price
€ps 10.0 11.0 12.0 13.0 13.5 14.0 14.5
Ordinary shares @ BC 19.0 19.0 19.0 19.0 19.0 19.0 19.0
from mkt warrant conversion 0.4 1.0 1.5 1.9 1.9 1.9 1.9
from Special share conversion 0.6 0.6 0.6 0.6 1.8 1.8 1.8
Total Ordinary shares (mn) 20.0 20.6 21.1 21.6 22.7 22.7 22.7
special shares non-converted 0.2 0.2 0.2 0.2 0.0 0.0 0.0
Total shares (mn) 20.2 20.8 21.3 21.8 22.7 22.7 22.7
Adj. PE (2019) 14.7 16.6 18.6 20.5 22.3 23.1 23.9
Adj. PE (2020) 13.7 15.6 17.4 19.2 20.9 21.6 22.4
Adj. PE (2021) 11.4 12.9 14.4 15.9 17.3 17.9 18.5
Adj. PE ex cash (2019) 12.6 14.6 16.6 18.5 20.3 21.1 21.9
Adj. PE ex cash (2020) 12.2 14.0 15.9 17.7 19.3 20.1 20.9
Adj. PE ex cash (2021) 10.3 11.8 13.3 14.8 16.2 16.8 17.4
Adj.EV/EBITDA (2019) 7.4 8.5 9.6 10.8 11.8 12.3 12.8
Adj.EV/EBITDA (2020) 6.8 7.8 8.8 9.8 10.7 11.2 11.6
Adj.EV/EBITDA (2021) 5.7 6.5 7.4 8.2 9.0 9.3 9.7
Mkt Cap FD (€,mn) 201.8 228.9 255.9 282.9 306.9 318.3 329.6
NFP (2019) 27.7 27.7 27.7 27.7 27.7 27.7 27.7
NFP (2020) 22.8 22.8 22.8 22.8 22.8 22.8 22.8
NFP (2021) 19.6 19.6 19.6 19.6 19.6 19.6 19.6
Adj. NII (2019) 13.8 13.8 13.8 13.8 13.8 13.8 13.8
Adj. NII (2020) 14.7 14.7 14.7 14.7 14.7 14.7 14.7
Adj. NII (2021) 17.8 17.8 17.8 17.8 17.8 17.8 17.8
Adj. EBITDA (2019) 23.7 23.7 23.7 23.7 23.7 23.7 23.7
Adj. EBITDA (2020) 26.5 26.5 26.5 26.5 26.5 26.5 26.5
Adj. EBITDA (2021) 32.0 32.0 32.0 32.0 32.0 32.0 32.0
Mkt Cap ex cash (2019) 174.2 201.2 228.2 255.2 279.2 290.6 302.0
Mkt Cap ex-cash (2020) 179.1 206.1 233.1 260.1 284.1 295.5 306.9
Mkt Cap ex-cash (2021) 182.3 209.3 236.3 263.3 287.3 298.7 310.1 Source: Equita and SPRINT ITALY

51
SICIT | July 25, 2019
APPENDIX
AGROCHEMICAL INDUSTRY - INTRODUCTION
The global agricultural landscape is rapidly changing as farmers continue to face a
variety of challenges, including the need to feed a growing population with limited
land and stricter rules and regulations surrounding biotechnology and chemical
compounds. These rules and regulations, which may be enacted to protect farmers,
consumers or the environment, often vary across geographies and can quickly
change. Consumers are also re-shaping the industry by demanding healthier, more
affordable and safer food, with an increased focus on sustainability and greater
transparency in order to facilitate their understanding of the agricultural products
they purchase and consume.
These challenges, along with available data analysis allowing farmers to better
understand the precise needs of a specific crop in a specific region, create strong
incentives for farmers to invest in high technology inputs (such as seed, crop
protection and digital solutions) to maximize yields, optimize resources and protect
harvests in an environmentally sustainable manner. These technological advances in
the agriculture industry challenge agriculture companies to develop customized
technology-based and solution-based product offerings for farmers that address their
specific needs.
The global agricultural economy also continues to adjust to declines from the peak
commodity prices related to the biofuels demand growth between 2007 and 2010
and the poor weather that reduced global commodity supply into 2013. The declines
in prices and profit margins have led participants at all levels of the agricultural
supply chain to adopt fundamental changes in their respective business models to
maintain competitiveness, improve efficiency and enhance prospects for long-term
growth. These factors, along with the high costs and lengthy time periods required to
gain approvals and launch new products, have contributed to strategic realignments
and consolidation across the agricultural sector. In recent years, the agrochem
industry has undergone significant consolidation, resulting in an increase in market
position by a smaller number of players and changing competitive dynamics.
FERTILIZERS –WHY THEY ARE SO IMPORTANT
Modern plant nutrient products play a vital role in food production. In fact,
agronomists estimate that plant nutrients account for 40% to 60% of crop yields.
Plant nutrients simply are plant food. Just like feed provides the carbohydrates,
protein, fat, vitamins and trace minerals required to nourish animals, plant nutrient
products deliver the essential nutrients needed to nourish plants.
Plants require seventeen nutrients for optimum growth and development. Each of
these nutrients is a chemical element found on the periodic table. Three of the
seventeen elements – carbon, hydrogen and oxygen – are non-mineral elements that
are available from the atmosphere or water. The other fourteen are classified as
primary nutrients, secondary nutrients and micronutrients.
The three primary nutrients are nitrogen (N), phosphorus (P) and potassium (K).
Plants remove large amounts of the primary nutrients during the growing season and
soils become depleted if these nutrients are not replenished after each harvest.

52
SICIT | July 25, 2019
THREE PRIMARY NUTRIENTS
Source: Yara
Nitrogen is by far the largest nutrient, accounting for c. 60% of total consumption and
must be applied every year to maintain yield and biomass. Annual application is not
always needed for Phosphate and Potassium fertilizers - which are primarily applied
to improve crop quality - as the soil absorbs and stores these two nutrients for a
longer period compared with nitrogen.
FERTILIZER NUTRIENTS
Primary (macro) nutrients
Nitrogen (N) The main constituent of proteins, is essential for growth and development in plants. Supply of nitrogen determines a plant’s growth, vigour, colour and yield
Phosphorus (P) Vital for adequate root development and helps the plant resist drought. Phosphorus is also important for plant growth and development, such as the ripening of seed and fruit
Potassium (K) Central to the photosynthesis of crops. Potassium helps improve crop quality and crop resistance to lodging, disease and drought
Secondary (meso) nutrients
Calcium Particularly important for the yield, quality and shelf life of fruit and vegetables
Magnesium Needed for photosynthesis, converting light into chemical energy for nutritional purposes
Sulphur Especially important in the initial growth stages, to produce essential amino acids, proteins, and oils
Each plant nutrient has unique physiological functions which cannot be replaced by any other nutrient
The ‘law of minimum’ is often illustrated with a water barrel, with staves of different
lengths. The barrel`s capacity to hold water is determined by the shortest stave.
Similarly, crop yields are frequently limited by shortages of nutrients or water. Once
the limiting factor (constraint) has been corrected, yield will increase until the next
limiting factor is encountered.
Yield responses to nitrogen are frequently observed, as nitrogen is often the most
limiting factor to crop production, but not the only factor. Balanced nutrition of all
plant nutrients is required to obtain maximum yield and avoid shortages of nutrients.
THE LAW OF MINIMUM – CROP GROWTH IS LIMITED BY THE MOST DEFICIENT NUTRIENT
Source: Yara

53
SICIT | July 25, 2019
As crops take up nutrients from the soil, a substantial proportion of these nutrients
are removed from the field when the crops are harvested. While some nutrients can
be returned to the field through crop residues and other organic matter, this alone
cannot provide optimum fertilization and crop yields over time. Mineral fertilizers can
provide an optimal nutrient balance, tailored to the demands of the specific crop, soil
and climate conditions, maximising crop yield and quality whilst also minimizing
environmental impacts.
MINERAL FERTILIZERS REPLACE NUTRIENTS REMOVED WITH THE HARVEST
Source: Yara
MINERAL FERTILIZER INDUSTRY – A MATURE MARKET
Nitrogen fertilizers are produced in many countries, reflecting the wide availability
of key raw materials (natural gas and air) needed for production. The global nitrogen
market is therefore less consolidated, but some regions such as Europe and the US
have seen significant restructuring and consolidation in the last decade. ThereforE
Nitrogen industry is quite fragmented and the main competitive advantage of the
industry players is driven by the low natural gas cost.
There are fewer large suppliers of phosphate and potash fertilizers, as phosphate
rock and potash mineral deposits are only available in certain regions of the world.
The potash industry is even more consolidated than the phosphate industry.
WORLD’S TEN LARGEST FERTILIZER COMPANIES
Source: Nutrien Fact Book
Crop nutrients, including nitrogen, potash and phosphate, are global commodities
with little or no product differentiation, and customers make their purchasing
decisions principally on the basis of delivered price and, to a lesser extent, on
customer service and product quality.

54
SICIT | July 25, 2019
Historically, selling prices for fertilizers have fluctuated in response to periodic
changes in supply and demand conditions. Variations in grain prices (corn or wheat)
explain approximately 50% of the variations in the urea price (the main fertilizer for
nitrogen nutrient), making grain prices one of the most important factors driving
fertilizer prices.
GRAIN PRICES EXPLAINS ~50% OF THE VARIATIONS IN FERTILIZER PRICES – CORN VS UREA ($/T)
Source: Yara
Periods of high demand, high capacity utilization and increasing operating margins
tend to result in investment in production capacity, which, in the following periods,
may cause supply to exceed demand and selling prices and capacity utilization to
decline.
In general – for nitrogen fertilizers - when demand is low, there tends to be a ”supply-
driven” fertilizer market in which the established “price floor” indirectly determines
fertilizer prices. This price floor is set by the producing region with the highest natural
gas prices. Historically the highest gas prices were in the US and in Western Europe
but since 2009 the Ukrainian and other Eastern European producers have had the
highest production costs together with coal-based producers in China. When fertilizer
demand is high, there is typically a ”demand-driven” market with fertilizer prices
above floor prices for swing (highest cost) regions.
HIGH COST PRODUCERS DRIVES UREA PRICE OVER THE SUPPLY DRIVEN PERIODS
Source: Yara

55
SICIT | July 25, 2019
FERTILIZER INDUSTRY
Nitrogen (Urea)
Phosphate (DAP/MAP/TSP)
Potash (KCI)
How Produced Synthesized from hydrogen source,
steam and air
Mined from sea fossils
Mined from evaporated sea
deposits Number of Major Producing Countries
~65 ~40 15
Percent of Global Production Traded
29% 49% 77%
Largest Importers US, India, Brazil India, Brazil Brazil, US, China,
India Time for Greenfield (including ramp-up)
Minimum 3 years2 Minimum 3-4 years3 Minimum 7 years1
Cost for Greenfield (including infrastructure)
US $1.8-$2.0 bn 1 mn tonnes NH3
US $5.1 bn 1 mn tonnes P2O5
CND $5.1-$6.7 bn 2 mn tonnes KCI
Source: Nutrien Fact Book
The International Fertilizer Association (IFA) forecasts nitrogen fertilizer demand
growth at 1.1% per year through 2021. A growth rate of 1.6% a year is estimated for
phosphate and 2.2% for potassium. Nutrients cannot be substituted and a balanced
fertilization of all nutrients is necessary to achieve optimal yields. Emerging countries,
in particular, should significantly increase the potash proportion of their total
fertilizer application. The average last 10-years’ (2007-2017) consumption growth
rates were 1.2% for nitrogen, 2.1% for phosphate and 2.4% for potash.
FERTILIZER CONSUMPTION - ‘000 METRIC NUTRIENT TONNES PER YEAR
2008/09 2009/10 2010/11 2011/12 2012/13 2013/14 2014/15 2015/16 2016/17 2017/18(f) 10 yrs CAGR
N 89,956 95,711 96,978 100,526 101,194 104,083 102,496 103,820 106,234 106,785 Growth -5.1% 6.4% 1.3% 3.7% 0.7% 2.9% -1.5% 1.3% 2.3% 0.5% 1.2%
P 34,710 39,902 42,420 42,917 43,690 44,998 45,933 46,454 47,894 48,337 Growth -12.0% 15.0% 6.3% 1.2% 1.8% 3.0% 2.1% 1.1% 3.1% 0.9% 2.1%
K 23,499 22,592 28,191 29,039 29,588 31,553 33,520 33,471 34,958 35,571 Growth -16.4% -3.9% 24.8% 3.0% 1.9% 6.6% 6.2% -0.1% 4.4% 1.8% 2.4%
Total NPK 148,165 158,205 167,589 172,482 174,472 180,634 181,949 183,745 189,086 190,693 Total Growth -8.7% 17.5% 32.4% 7.8% 4.4% 12.5% 6.8% 2.3% 9.9% 3.2% 1.6%
Source: IFA Medium-Term Outlook for World Agriculture and Fertilizer Demand 2016/17-2021/22, June 2017

56
SICIT | July 25, 2019
CROP PROTECTION AGROCHEMICALS
The crop protection market value in 2016 was approximately $57 bn (Source: Phillips
McDougall) an increase of circa 4% CAGR over the past ten years.
The industry generally divides product lines into Herbicides (44% market), Insetticides
(22%), Fungicides (26%) and Seed Care (6%) non crop uses (2%). Less than one-third
of the market is based on patented products.
Companies in the industry continuously aim to improve existing product offerings
to counteract regularly occurring natural resistance. For example, over the years,
weeds and pests can evolve to become resistant to current modes of treatment. This
resistance to existing products in turn creates both challenges as well as market
opportunities for development of new forms of genetically engineered seed and
improved complementary crop protection products and applications.
The growth has been moderating due to the increasing resistance of pests, herbs and
fungi to chemical formulations. To improve yields, the industry developed more
sophisticated GMO seeds, in combination to chemicals.
The past few years have seen a strong consolidation process within the major
multinational producers with announced mega-mergers between the following
agricultural chemical input companies:
- Monsanto and Bayer
- Dow and DuPont (Corteva)
- Syngenta and ChemChina
2018 REVENUES ($ bn)
Source: Equita, Bloomberg
These drastic consolidations over the past fifteen years can largely be attributed
but not limited to more profitable opportunities in the seed market and increases in
biotechnology development; more stringent environmental regulatory management
allowing for fewer market opportunities for agricultural chemicals; intellectual
property rights (IPR) protection that made vertical integration in downstream
industries more necessary.
The growing concentration of both crop seeds and biotechnology and crop protection
chemicals highlights the costly and time consuming nature in developing new
products. For example, to bring crop-protection chemicals to market in the United
States, registrations average around $300 mn. To develop a new genetically
modified (GM) seed trait, it takes an average of 13 years and costs about $136 mn.
23.7
15.814.2
8.1
4.7 4.32.9 2.5 1.6 1.3 1.2
0
5
10
15
20
25
Mo
nsa
nto
+ B
aye
r
Ch
em
chin
a (S
ynge
nta
+A
DA
MA
)
Co
rtev
a (D
ow
+ D
up
on
t)
BA
SF
UP
L +
Ary
sta
FMC
Sum
ito
mo
Nu
farm
Vilm
ori
n
Alb
augh
KW
S
CROP PROTECTION CHEMICALS Fungicides prevent and cure diseases which can have severe adverse effects on crop yields and quality. The main markets are fruit and vegetables, cereals and rice. Plant diseases are caused by a great variety of pathogens. Accordingly, this requires many products used singularly or in combination to control the full range of diseases in ways that minimize the chance of resistance building up. Herbicides. Weeds are undesirable plants growing within a crop and they compete for resources such as nutrients, water and light. Without weed control, crop yields can be significantly reduced. Weeds can also cause further problems by harboring pests and diseases, interfering with harvest operations, and increasing costs of cleaning and drying the crop produce. Herbicides are designed to prevent the development of such weeds or delay their growth in order to allow the designated crop to develop optimally. Herbicides are used on different stages of the crop growing process, but mainly prior to planting, before germination and over the crops early stages of development. - Selective herbicides are crop-specific and
control weeds without harming the crop. They have enabled yield improvement in key crops such as corn, rice, soybeans and wheat. The development of genetically modified organisms (GMOs) encouraged the development of selective herbicides designed to destroy weeds of a certain kind (and no other), which therefore do not damage the very crop they are designed to protect.
- Non-Selective herbicides reduce or halt the growth of all vegetation which they come in contact (if absorbed by green tissue) and are used primarily in plantation crops such as rubber, oil palm, orchards and vines. They are applied on weeds growing between the trees to facilitate passage in tropical crops, save moisture in vines and orchards, and to reduce erosion.
Insecticides/Pesticides. Insects like caterpillars and aphids can significantly reduce crop yields and quality. Insecticides help minimize this damage by controlling insect pests. The largest insecticide markets are in fruit and vegetables, cotton, rice and corn. Seed Care products are insecticides and fungicides used to protect growth during the early stages. Seeds carry the genetic potential of crops. They also carry substantial amounts of energy, which makes them highly attractive for pests and diseases. Seed treatments are chemical or biological substances or physical processes applied to seeds or seedlings. They help to protect the seeds and assure optimum emergence of the crop. Application of a chemical to seeds is a very well-targeted method of reducing attacks on the growing plant by insects and diseases.

57
SICIT | July 25, 2019
While the first GM seeds were not sold in the United States until 1997, GM seeds
have become a highly profitable multimillion dollar industry, and such seeds can be
tailored for use with specific pesticides. Consolidation within the industry not only
reflects the cost and subsequent profitability associated with biotechnology advances
within the field, but demonstrates the overall trend of companies’ re-focusing
product development towards biotechnology. This re-focusing is partially driven by
cost, but also can be attributed to a number of factors, including population growth
driving increases in consumer demand for agricultural products.
The increase in demand coincides with difficulties in crop production associated with
climate change and the development of pesticide resistance.
STATEMENT OF RISK
Factors that could negatively impact the stock performance include:
1. Lower crop prices reducing margins for growers;
2. Unfavourable weather conditions in relevant agriculture markets ;
3. Lower availability of waste material due to weaker economic environment for
leather tanning industry in Northern Italy;
4. Significant deterioration in macroeconomic reference scenario for retardants and
fat sales;
5. Execution risk in the expansion program outside Italy

58
SICIT | July 25, 2019
INFORMATION PURSUANT TO EU REGULATION 2016/958 supplementing Regulation EU 596/2014 (c.d. MAR) This publication has been prepared by Massimo Bonisoli, CFA as a financial analyst on behalf of EQUITA SIM SpA (licensed to practice by CONSOB resolution no. 11761 of December 22nd 1998 and registered as no. 67 in the Italian central register of investment service companies and financial intermediaries) to which he is bound by an employment contract. In the past EQUITA SIM has not published studies on SICIT. EQUITA SIM is distributing this publication via e-mail to more than 700 qualified operators from July 26, 2019 at 08:00 AM The prices of the financial instruments shown in the report are the reference prices posted on the day prior to the date indicated on cover page. EQUITA SIM intends to provide continuous coverage of the financial instrument forming the subject of the present publication, with a semi-annual frequency and, in any case, with a frequency consistent with the timing of the issuer’s periodical financial reporting and of any exceptional event occurring in the issuer’s sphere of activity. The information contained in this publication is based on sources believed to be reliable. Although EQUITA SIM makes every reasonable endeavour to obtain information from sources that it deems to be reliable, it accepts no responsibility or liability as to the completeness, accuracy or exactitude of such information. If there are doubts in this respect, EQUITA SIM clearly highlights this circumstance. The most important sources of information used are the issuer’s public corporate documentation (such as, for example, annual and interim reports, press releases, and presentations) besides information made available by financial service companies (such as, for example, Bloomberg and Reuters) and domestic and international business publications. It is EQUITA SIM’s practice to submit a pre-publication draft of its reports for review to the Investor Relations Department of the issuer forming the subject of the report, solely for the purpose of correcting any inadvertent material inaccuracies. This note has been submitted to the issuer. The recommendation was produced using proprietary Excel models that are stored on company servers. The models are backed up at the end of each month. EQUITA SIM has adopted internal procedures able to assure the independence of its financial analysts and that establish appropriate rules of conduct for them. Furthermore, it is pointed out that EQUITA SIM SpA is an intermediary licensed to provide all investment services as per Italian Legislative Decree no. 58/1998. Given this, EQUITA SIM might hold positions in and execute transactions concerning the financial instruments covered by the present publication, or could provide, or wish to provide, investment and/or related services to the issuers of the financial instruments covered by this publication. Consequently, it might have a potential conflict of interest concerning the issuers, financial issuers and transactions forming the subject of the present publication. Equita SIM S.p.A. performs or has performed in the last 12 months the role of intermediary in charge of the execution of the buy back plan approved by the shareholders' meeting of SICIT Group S.p.A. Equita SIM S.p.A. provides or has provided in the last 12 months investment banking services for SprintItaly S.p.A. In addition, it is also pointed out that, within the constraints of current internal procedures, EQUITA SIM’s directors, employees and/or outside professionals might hold long or short positions in the financial instruments covered by this publication and buy or sell them at any time, both on their own account and that of third parties. Research Division management alone determines the remuneration of the analysts who produced the publication, and their remuneration is not linked to Equita SIM’s Investment Banking transactions. It is linked to Equita SIM’s total revenue, which includes the revenue of the Investment Banking and Sales & Trading Divisions. For more details on the policies and principles designed to ensure the integrity and independence of Equita SIM analysts, please refer to the policy on organizational mechanisms of the Research activity available at www.equita.eu on the “Legal notices” section. The recommendations to BUY, HOLD and REDUCE are based on Expected Total Return (ETR – expected absolute performance in the next 12 months inclusive of the dividend paid out by the stock’s issuer) and on the degree of risk associated with the stock, as per the matrix shown in the table. The level of risk is based on the stock’s liquidity and volatility and on the analyst’s opinion of the business model of the company being analysed. Due to fluctuations of the stock, the ETR might temporarily fall outside the ranges shown in the table.
EXPECTED TOTAL RETURN FOR THE VARIOUS CATEGORIES OF RECOMMENDATION AND RISK PROFILE
RECOMMENDATION/RATING Low Risk Medium Risk High Risk
BUY ETR >= 10% ETR >= 15% ETR >= 20%
HOLD -5% <ETR< 10% -5% <ETR< 15% 0% <ETR< 20%
REDUCE ETR <= -5% ETR <= -5% ETR <= 0%
The methods preferred by EQUITA SIM to evaluate and set a value on the stocks forming the subject of the publication, and therefore the Expected Total Return in 12 months, are those most commonly used in market practice, i.e. multiples comparison (comparison with market ratios, e.g. P/E, EV/EBITDA, and others, expressed by stocks belonging to the same or similar sectors), or classical financial methods such as discounted cash flow (DCF) models, or others based on similar concepts. For financial stocks, EQUITA SIM also uses valuation methods based on comparison of ROE (ROEV – return on embedded value – in the case of insurance companies), cost of capital and P/BV (P/EV – ratio of price to embedded value – in the case of insurance companies).
MOST RECENT CHANGES IN RECOMMENDATION AND/OR IN TARGET PRICE (OLD ONES IN BRACKETS):
Date Rec. Target Price (€) Risk Comment
Nil

59
SICIT | July 25, 2019
DISCLAIMER The purpose of this publication is merely to provide information that is up to date and as accurate as possible. The publication does not represent to be, nor can it be construed as being, an offer or solicitation to buy, subscribe or sell financial products or instruments, or to execute any operation whatsoever concerning such products or instruments. EQUITA SIM does not guarantee any specific result as regards the information contained in the present publication, and accepts no responsibility or liability for the outcome of the transactions recommended therein or for the results produced by such transactions. Each and every investment/divestiture decision is the sole responsibility of the party receiving the advice and recommendations, who is free to decide whether or not to implement them. Therefore, EQUITA SIM and/or the author of the present publication cannot in any way be held liable for any losses, damage or lower earnings that the party using the publication might suffer following execution of transactions on the basis of the information and/or recommendations contained therein. The estimates and opinions expressed in the publication may be subject to change without notice.
EQUITY RATING DISPERSION AS OF JUNE 30, 2019 (art. 6, par. 3 Delegated Regulation (EU) 2016/958 of 09 March 2016)
COMPANIES COVERED COMPANIES COVERED WITH BANKING
RELATIONSHIP
BUY 38.7% 53.9%
HOLD 57.8% 44.7%
REDUCE 2.9% 0.0%
NOT RATED 0.6% 1.3%
The list of all conflicts of interest, rating dispersion, last 12 months recommendation made by Equita SIM’s analysts and other important legal disclaimers are available on www.equita.eu in the “Legal notices” section. This document has been provided to you solely for informational purposes and may not be reproduced or distributed, directly or indirectly, to any other person, nor may it be published, wholly or in part, for any reason, without EQUITA SIM’s specific authorisation. By accepting this document, you agree to comply with the limitations indicated above.
Related Documents