138 S.I. Laskar, Naresh Kumar and Sanjay Bist India Meteorological Department, New Delhi Email: [email protected] 1. Introduction Bihar (22-27 0 N, 82-88 0 E) is located in the eastern part of the country (Fig.1). It is an entirely land–locked state, although the outlet to the sea through the port of Kolkata is not far away. Bihar lies mid-way between the humid West Bengal in the east and the sub humid Uttar Pradesh in the west which provides it with a transitional position in respect of climate. It is bounded by Nepal in the north and by Jharkhand in the south. The Bihar plain is divided into two unequal halves by the river Ganga which flows through the middle from west to east. The Himalayan Mountains in the north have a significant bearing on the distribution of monsoon rainfall over Bihar. Agriculture is the vital source of wealth in Bihar. 76% of its population is engaged in agricultural pursuits, agriculture as the primary feeder of rural economy. Agriculture in Bihar is crucially dependent on monsoon. Although around 57 percent of its gross cultivated area is irrigated, irrigation itself is crucially dependent on monsoon as it largely depends on the use of surface water. Total irrigated area in the State is 45.67 lakh hectares, of which nearly 30 percent is fed by canal water. Rainfall plays a vital role in Bihar’s agriculture economy. Moreover, the state experiences floods as well as droughts almost on a regular basis. Variability and trends in rainfall is one of the important aspects of climate variability studies and worldwide several attempts have been made to ABSTRACT An understanding of temporal variation in rainfall distribution is key requirement for the agricultural planning and management of water resources. Bihar is an eastern state in India, where agricultural activities mainly depends on the rainfall. Any change in rainfall distribution may strongly impact the agriculture of this region. Long term rainfall (1871–2011) over the state of Bihar is analyzed for temporal variation on annual and seasonal time scales. Long term changes in rainfall are studied by parametric as well as non-parametric tests like linear regression method and Mann-Kendall test. The investigation showed a long term insignificant declining trends in annual as well as winter and monsoon rainfall, where as a significant increasing trend at 95% level of confidence in pre-monsoon season. There is no significant trend in post-monsoon rainfall during the period 1871–2011. Frequency of Normal, Excess, Deficient and Scanty rainfall over Bihar during the period 1871-2011 have also been obtained by decadal analysis of rainfall. Decadal analysis indicates that the deficient years of annual as well monsoon rainfall is maximum during last decade i.e. 2001-2010. This changing rainfall trend during monsoon months can affect the agricultural activity, hydro power generation and reservoir operation in the region. Keywords: Decling trend, annual and seasonal reinfall, agricaltural activity. Fig.1 The geophysical location of Bihar (region of study) in sub-division map of India Long term Trend in Rainfall over Bihar during the Period 1871-2011

Welcome message from author
This document is posted to help you gain knowledge. Please leave a comment to let me know what you think about it! Share it to your friends and learn new things together.
Transcript

138
S.I. Laskar, Naresh Kumar and Sanjay BistIndia Meteorological Department, New Delhi
Email: [email protected]
1. IntroductionBihar (22-270N, 82-880E) is located in the
eastern part of the country (Fig.1). It is an entirely
land–locked state, although the outlet to the seathrough the port of Kolkata is not far away. Biharlies mid-way between the humid West Bengal inthe east and the sub humid Uttar Pradesh in thewest which provides it with a transitional position inrespect of climate. It is bounded by Nepal in thenorth and by Jharkhand in the south. The Bihar plainis divided into two unequal halves by the riverGanga which flows through the middle from westto east. The Himalayan Mountains in the north havea significant bearing on the distribution of monsoonrainfall over Bihar. Agriculture is the vital source ofwealth in Bihar. 76% of its population is engaged inagricultural pursuits, agriculture as the primaryfeeder of rural economy. Agriculture in Bihar iscrucially dependent on monsoon. Although around57 percent of its gross cultivated area is irrigated,irrigation itself is crucially dependent on monsoonas it largely depends on the use of surface water.Total irrigated area in the State is 45.67 lakhhectares, of which nearly 30 percent is fed by canalwater. Rainfall plays a vital role in Bihar’s agricultureeconomy. Moreover, the state experiences floodsas well as droughts almost on a regular basis.
Variability and trends in rainfall is one of theimportant aspects of climate variability studies andworldwide several attempts have been made to
ABSTRACT
An understanding of temporal variation in rainfall distribution is key requirement for theagricultural planning and management of water resources. Bihar is an eastern state in India,where agricultural activities mainly depends on the rainfall. Any change in rainfall distributionmay strongly impact the agriculture of this region. Long term rainfall (1871–2011) over the stateof Bihar is analyzed for temporal variation on annual and seasonal time scales. Long term changesin rainfall are studied by parametric as well as non-parametric tests like linear regression methodand Mann-Kendall test. The investigation showed a long term insignificant declining trends inannual as well as winter and monsoon rainfall, where as a significant increasing trend at 95%level of confidence in pre-monsoon season. There is no significant trend in post-monsoon rainfallduring the period 1871–2011. Frequency of Normal, Excess, Deficient and Scanty rainfall overBihar during the period 1871-2011 have also been obtained by decadal analysis of rainfall. Decadalanalysis indicates that the deficient years of annual as well monsoon rainfall is maximum duringlast decade i.e. 2001-2010. This changing rainfall trend during monsoon months can affect theagricultural activity, hydro power generation and reservoir operation in the region.
Keywords: Decling trend, annual and seasonal reinfall, agricaltural activity.
Fig.1 The geophysical location of Bihar (region ofstudy) in sub-division map of India
Long term Trend in Rainfallover Bihar during the Period1871-2011

139
study both spatial and temporal variation of therainfall. However, a highly spatial variation has beenobserved at different regions of India by differentresearchers. Jagadish et al (2012) studied temporalvariation in monthly, seasonal and annual rainfallover Orissa (Currently called as “Odisha”) duringthe period from 1871-2006. Guhathakurta andRajeevan (2008) performed linear trend analysisto examine the long-term trends in rainfall overdifferent subdivisions of India and monthlycontribution of each of the monsoon months toannual rainfall. Basistha et al. (2009) reported 1964as the most probable year of change in annual aswell as monsoon rainfall in the Himalayan region ofIndia. In this region, the rainfall was in increasingtrend up to 1964, followed by a decreasing trendduring 1965–1980. Kumar and Jain (2010) analyzedtrends in seasonal and annual rainfall and rainy daysat five stations in Kashmir Valley of India. Theyobserved decreasing rainfall at four stations andincreasing rainfall at one station, but none of theobserved trends in annual rainfall were statisticallysignificant. Mohapatra et al. (2003) studied spatialvariability of daily rainfall over Odisha duringmonsoon season for a period of 20 years (1980–1999) and reported five homogeneous regions ofdaily monsoon rainfall. The frequency of extremerainfall events showed a significant inter annual andinter decadal variations in addition to a statisticallysignificant long term trend (Rajeevan et al. 2008).Keeping in view the larger geographical area of thecountry, various efforts have been made towardsregional and local analyses of rainfall variations (Lal etal. 1992; Sharma et al. 2000; Singh and Sontakke 2002;Singh et al. 2005, Kumar et al., 2013 and 2015 ).
In this paper an attempt has been made to studythe long term trends in rainfall over Bihar using itsmonthly data for the period 1871-2011 (141 years).Seasonal, annual and decadal rainfall pattern havebeen studied by using linear trend of mean anomalyseries of rainfall.
2. Data and MethodologyIn this paper seasonal, annual and decadal
rainfall pattern have been studied by using lineartrend of mean anomaly series of rainfall. For thepurpose the monthly rainfall data from the IndianInstitute of Tropical Meteorology (IITM) for the period1871–2011 “Homogeneous Indian Monthly RainfallData Sets (1871–2011)” during June to Septemberhas been used. The Mann-Kendall non-parametrictest has been employed to ascertain the presenceof statistically significant trend (Kendall, 1976;Kumar and Jain, 2010; Subash et al., 2011, Kumaret al. 2013 & 2015). In the study, trend is consideredto be significant if the confidence level is 95%.
3. Result and Discussion3.1 Mean rainfall characteristics
The rainfall characteristics of Bihar arepresented in Table-1. As seen from Table 1 themean annual rainfall of Bihar based on 141 yearsdata for the period from 1871 to -2011 is 1224 mmwith standard deviation 218 mm and coefficientvariation 17.81%. During winter the mean, standarddeviation and coefficient variation are respectively31 mm, 25 mm and 81.4%. During pre-monsoonthe mean, standard deviation and coefficientvariation are respectively 85 mm, 43 mm and 50.4%.During monsoon the mean, standard deviation andcoefficient variation are respectively 1031 mm, 201mm and 19.5% and during post monsoon the mean,standard deviation and coefficient variation arerespectively 77 mm, 64 mm and 82.8%. it is alsoobserved that the highest coefficient of variation isfound to be during post monsoon season followedby winter, whereas coefficient of variation is foundto be lowest during annual followed by monsoon.During the monsoon season the coefficient ofvariation is very low compared to other seasonwhich shows a dependable monsoon rainfall. About84% of the annual rainfall occurs during monsoonseason, 7% in pre-monsoon season, 6% in post-monsoon and 3% in winter season.
TABLE 1Mean, Standard Deviation and Coefficient of Variability of rainfall over
Bihar during the period from 1871 to 2011.Seasons Mean Rainfall Standard Deviation Coefficient of
(mm) (SD in mm) Variability (CV in %)Winter (Jan-Feb) 31 mm 25 mm 81.4%
Pre-Monsoon (Mar-May) 85 mm 43 mm 50.4%Monsoon (Jun-Sep) 1031 mm 201 mm 19.5%
Post-Monsoon (Oct-Dec) 77 mm 64 mm 82.8%Annual (Jan-Dec) 1224 mm 218 mm 17.81%
140
by 40.2% in the year 1987. Similarly, we have foundthat the lowest rainfall departure was -47.1% in theyear 1908 followed by -37.4% in the year 1972.During the period under study, the highest (173 cm)and lowest (65 cm) annual rainfall are found in theyears 1984 and 1908 respectively.
Fig.2 Annual trend of rainfall over Bihar during the period 1871-2011
3.2 Annual rainfall trend during 1871-2011The annual trend of rainfall over Bihar during
the period 1871-2011 has been shown in Fig.2. Themean annual rainfall over Bihar showed a long terminsignificant declining trend. From the data it hasbeen observed that the highest rainfall departure(41.3%) was observed in the year 1984 followed
Fig.3 Trend of rainfall over Bihar during winter season for the period 1871-2011
3.3 Winter seasonThe trend of rainfall over Bihar during winter
season for the period 1871-2011 has been shownthe Fig.3. The mean rainfall over Bihar during winterseason shows a long term insignificant decliningtrend. From the data it has been observed that the
highest rainfall departure (283.5%) was observedin the year 1984 followed by 242.4% in the year1957. Similarly, it is found that the lowest rainfalldeparture was -100.0% (no rainfall) in the year 2006followed by -99.3% in the year 1999. The highest(120 mm) winter rainfall is found in the years 1984.

141
Fig.5 Trend of rainfall over Bihar during winter season for the period 1871-2011
3.5 Monsoon seasonThe trend of rainfall over Bihar during monsoon
season for the period 1871-2011 has been shownthe Fig.5. The mean rainfall over Bihar during winterseason shows a long term insignificant decliningtrend. From the data it has been observed that thehighest rainfall departure (53.6%) was observed in
the year 1987 followed by 46.6% in the year 1899.Similarly, we have found that the lowest rainfalldeparture was -47.81% in the year 1908 followedby -37.81% in the year 1972. The highest (1580mm) and lowest (540 mm) monsoon rainfall arefound in the years 1987 and 1908 respectively.
Fig.4 Trend of rainfall over Bihar during pre monsoon season for the period 1871-2011
3.4 Pre-monsoon season The trend of rainfall over Bihar during pre-
monsoon season for the period 1871-2011 has beenshown the Fig.4. The mean rainfall over Biharduring pre-monsoon season shows a long termsignificant increasing trend. From the data it hasbeen observed that the highest rainfall departure(208.5%) was observed in the year 1887 followedby 143.7% in the year 2000. Similarly, we have
found that the lowest rainfall departure was -89.6%in the year 1972 followed by -84.1% in the year1935. The highest (260 mm) pre monsoon rainfallis found in the year 1887. The significant increasingtrend of rainfall during the pre-monsoon seasoncould be attributed to increase in thunderstormactivity over the region particularly during the period1961-2011 (Laskar 2009).
142
3.6 Post-Monsoon seasonThe trend of rainfall over Bihar during post
monsoon season for the period 1871-2011 has beenshown the Fig.6. No significant trend was observedin the mean rainfall over Bihar during post monsoonseason. From the data it has been observed thatthe highest rainfall departure (267.7%) wasobserved in the year 1925 followed by 255.6% inthe year 1961. Similarly, we have found that thelowest rainfall departure was -99.5% in the year1875 followed by -99.2% in the year 1935. Thehighest (280 mm) rainfall is found during postmonsoon season in the years 1929.
As in trend analysis studies, the resultssignificantly depend upon the period of data andthe stations whose data are used as a resultthe study of trends using this long period data(1871-2011) may not be the correct depictionof the reality and this aspect needs to beaddressed. Finally, while interpreting the resultsof trend analysis, the observations of Cohn andLins (2005) are worth repeating: ‘that reportedtrends are real yet insignificant indicates aworrisome possibil ity: natural climaticexcursions may be much larger than weimagine.
Decade Annual Winter Pre-Monsoon Monsoon Post-MonsoonN E D S N E D S N E D S N E D S N E D S
1871-1880 7 2 1 0 1 4 3 2 1 3 5 1 6 2 2 0 1 4 2 31881-1890 7 2 1 0 1 2 2 5 3 3 4 0 7 2 1 0 2 4 1 31891-1900 6 2 2 0 1 4 4 1 3 3 3 1 6 2 2 0 0 3 3 41901-1910 8 0 2 0 0 5 1 4 2 4 3 1 7 1 2 0 0 3 2 51911-1920 8 2 0 0 0 3 4 3 1 6 3 0 7 3 0 0 2 4 1 31921-1930 8 0 2 0 2 3 3 2 3 0 5 2 5 3 2 0 0 3 4 31931-1940 7 2 1 0 3 5 0 2 2 3 1 4 7 2 1 0 2 4 1 31941-1950 9 1 0 0 0 5 4 1 2 2 6 0 9 1 0 0 2 4 1 31951-1960 9 0 1 0 2 3 2 3 5 0 4 1 8 0 2 0 0 2 5 31961-1970 8 0 2 0 1 3 2 4 3 2 3 2 8 0 2 0 2 4 1 31971-1980 8 1 1 0 1 4 2 3 6 2 1 1 8 0 2 0 1 5 3 11981-1990 6 2 2 0 1 2 2 5 4 6 0 0 7 2 1 0 1 3 4 21991-2000 6 3 1 0 3 2 3 2 2 5 2 1 6 3 1 0 2 4 2 22001-2010 5 1 4 0 3 2 1 4 3 6 1 0 3 2 5 0 1 2 4 3
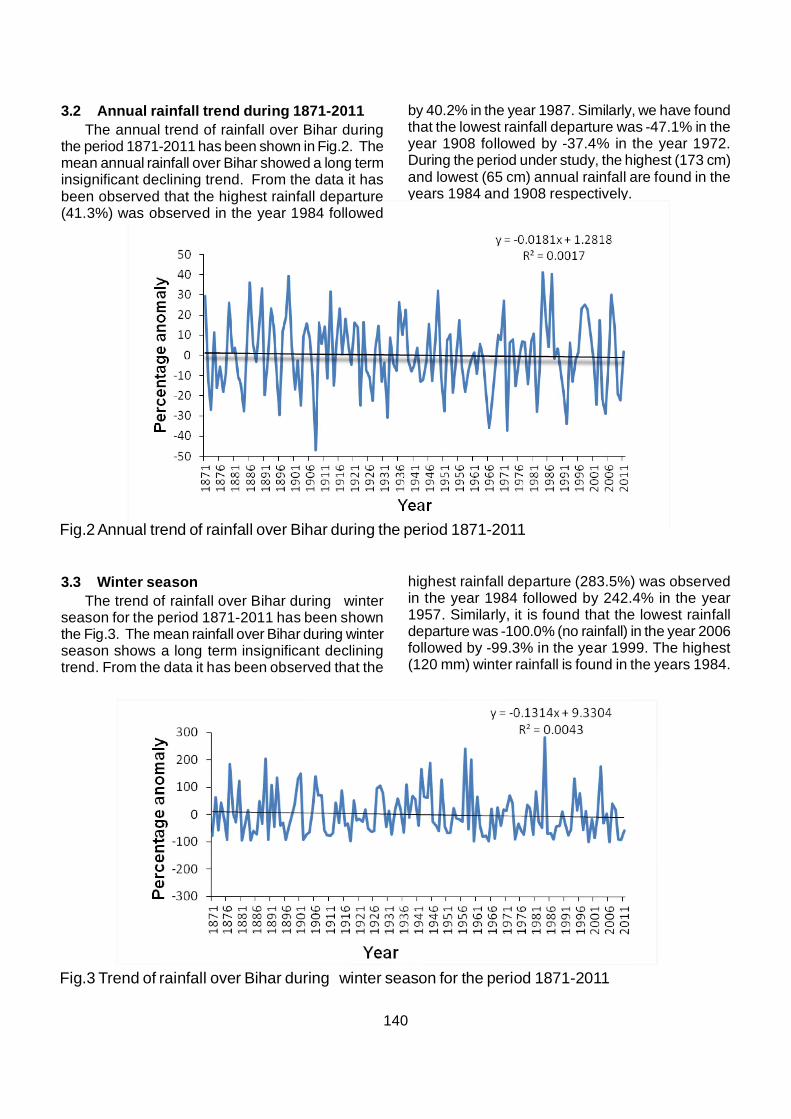
TABLE-2Decadal frequency of Normal (N), Excess (E), Deficient (D) and Scanty (S)
rainfall over Bihar during the period 1871-2011
4. Decadal, Annual and SeasonalRainfall
To study the variability of the rainfall in moredetail, decadal analysis of annual as well asseasonal rainfall has been carried out bycategorizing the rainfall as normal, deficient, excessand scanty when percentage departure of rainfallfrom long period average (1871-2011) are +20%, -20% to -59%, +20% or more and -60% to -99%respectively and the results of the decadal analysisis summarized in Table-2.
Study reveals that during the decade 1991-2000, there were maximum numbers (3) of yearwith excess annual rainfall. Similarly, during thedecade 2001-2010 there were maximum numbers(4) of year with deficit annual rainfall, whereas duringthe period 1871-2011 not a single year receivedscanty annual rainfall.
In winter season during the decades 1901-1910, 1931-40 and 1941-50 there were maximumnumber (5) of years with excess rainfall. Similarly,during the decades 1891-1890, 1911-1920 and1941-1950 there were maximum number(4) of yearswith deficit winter rainfall whereas during thedecades 1881-1890 and 1981-1990 there were
maximum number (5) of years with scanty rainfall.
In pre monsoon season during the decades1911-1920, 1981-1990 and 2001-2010 there were
maximum number (6) of years with excess rainfall.Similarly, during the decade 1941-1950 there weremaximum number(4) of years with deficit winterrainfall whereas during the decades 1931-1940

143
there were maximum number (4) of years withscanty rainfall.
In monsoon season during the decades 1911-1920, 1921-1930 and 1991-2000 there weremaximum number (3) of years with excess rainfall.Similarly, during the decade 2001-2010 there weremaximum number (5) of years with deficit winterrainfall whereas during the period 1871-2011 not asingle year received scanty rainfall.
In post monsoon season during the decade1971-1980 there were maximum number (5) ofyears with excess rainfall. Similarly, during thedecade 1951-1960 there were maximum number(5)of years with deficit winter rainfall whereas duringthe decades 1901-1910 there were maximumnumber (5) of years with scanty rainfall.
5. ConclusionBased on 141 years data for the period 1871-
2011, it is observed that annual mean rainfall ofBihar is 122.4 cm. Its 84% rainfall occurs duringmonsoon, 7% in pre-monsoon, 6% in post-monsoonand 3% in winter season. The study showsdecreasing trend in annual as well as in winter &monsoon season and significant increasing trendin pre-monsoon season. No trend is observed inpost- monsoon rainfall. The significant increasingtrend in pre-monsoon rainfall may be attributed toincrease in thunderstorm activity over the regionparticularly during the period 1961-2011.
In decadal analysis, it is observed thatmaximum number of excess years in annual rainfallis during decade 1991-2000 and maximum numberof deficient year in annual as well as monsoonseason rainfall are during 2001-2010.
ReferencesBasistha, A, Arya, D.S. and Goel N. K. , 2009,“Analysis of historical changes in rainfall in theIndian Himalayas”, Int J Climatol , 29:555–572.
Cohn, T. A. and Lins, H. F., 2005, “Nature’s style:naturally trendy‘. Geophys. Res. Lett., 32, L23402,doi: 10.1029/2005GL024476.
Guhathakurta, P. and Rajeevan, M, 2008, “Trendsin the rainfall pattern over India”. Int. J Climatol,28 (11):1453-1469.
Jagadish, P. Patra, Mishra A, Singh R. andRaghuwanshi N.S., 2012, “Detecting rainfall trendsin twentieth century (1871-2006) over Orissa State,India,” Climate Change, 111: 801-817.
Kendall M, 1976. Time series. Griffin, London,197 pp.
Kumar, N., Yadav, B.P., Gahlot, S. and Singh,M., 2015, “Winter frequency of westerndisturbances and precipitation indices overHimachal Pradesh, India: 1977-2007", Atmósfera,28(1), 67-74.
Kumar N., Yadav, B. P., Tyagi, A. and Jaswal, A.K., 2012, “Trend and spatial distribution of rainfalland rainy days over Andaman and Nicobar islands”,Nat. Hazards 63, 575-587.
Kumar V and Jain, S.K., 2010, “Trends in seasonaland annual rainfall and rainy days in Kashmir Valleyin the last century”, Quat Int, 212, (1):64–69.
Lal B, Duggal, Y.M. and Ram, P., 1992, “Trendsand periodicities of monsoon and annual rainfall ofdistricts of Haryana State and Delhi”, Mausam,43,2:137–142.
Laskar, S.I. 2009, “Some climatological featuresof thunderstorms and squalls over Patna Airport”,Mausam, 60, 4, 533- 537.
Mohapatra, M., Mohanty, U.C. and Behera, S. ,2003, “Spatial variability of daily rainfall overOrissa, India, during the southwest summermonsoon season”. Int J Climatol 23:1867–1887.
Rajeevan, M., Bhate, J. and Jaswal, A.K. , 2008,“ Analysis of variability and trends of extremerainfall events overIndia using 104 years of griddeddaily rainfall data”, Geophys Res Lett, 35:L18707.doi:10.1029/ 2008GL035143.
Sharma, K.P., Moore, B. and Vorosmarty, C.J,2000, “Anthropogenic, climatic and hydrologictrends in the Kosi Basin. Himalaya”, ClimateChange, 47:141–165.
Singh, N., Sontakke, N.A, Singh, H.N. and Pandey,A.K, 2005, “Recent Trend in SpatiotemporalVariation of Rainfall over India - An investigationinto Basin-scale Rainfall Fluctuations”, IAHS-AISHPublication, 296 :273–282.
Singh N, Sontakke, N.A, 2002, “On climaticfluctuations and environmental changes of the Indo-Gangetic Plains, India”, Climatic Change,52,(3):287–313.
Subash N., Sikka, A. K. and Ram Mohan, H. S.,2011, “An investigation into observationalcharacteristics of rainfall and temperature in centralNortheast India – a historical perspective 1889-2008", Theor. Appl. Climatol. 103, 305-319.
Related Documents