Shuming Bao Shuming Bao [email protected] [email protected] China Data Center University of Michigan Aug 23-25, 2001 Fudan University Integrating Spatial Integrating Spatial Attribute Data and CHGIS Attribute Data and CHGIS for Spatial Analysis for Spatial Analysis

Shuming Bao [email protected] China Data Center University of Michigan Aug 23-25, 2001 Fudan University Integrating Spatial Attribute Data and CHGIS for.
Dec 17, 2015
Welcome message from author
This document is posted to help you gain knowledge. Please leave a comment to let me know what you think about it! Share it to your friends and learn new things together.
Transcript
Shuming BaoShuming [email protected]@umich.edu
China Data CenterUniversity of Michigan
Aug 23-25, 2001Fudan University
Integrating Spatial Integrating Spatial Attribute Data and CHGIS Attribute Data and CHGIS
for Spatial Analysisfor Spatial Analysis

TopicsTopics
Introduction
Spatial Data Process
Spatial Analysis
Applications
Tools for spatial analysis
Research Issues
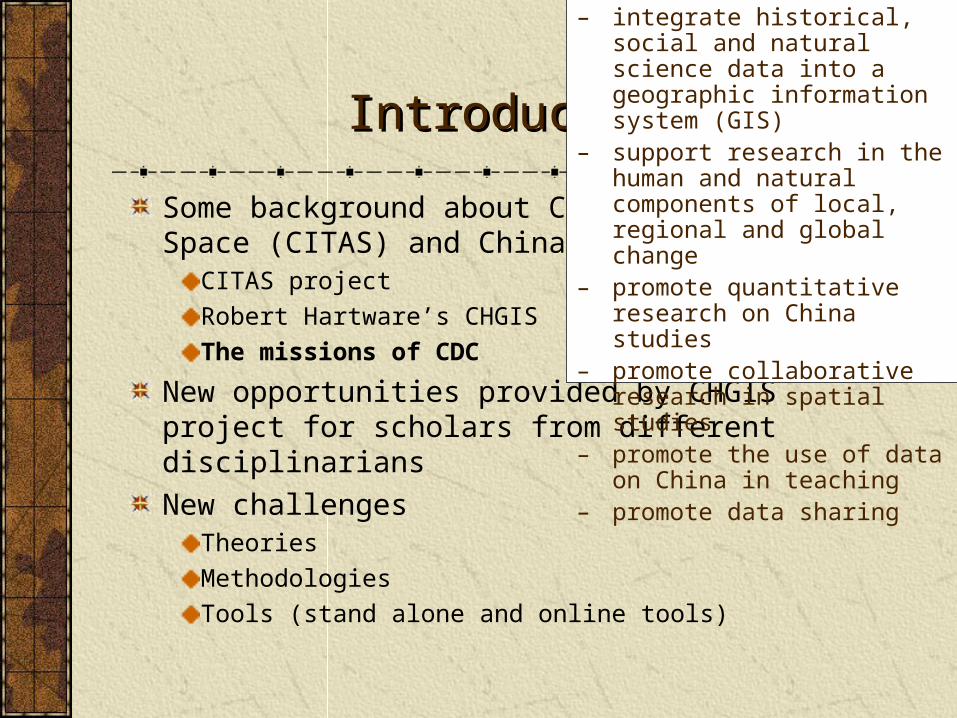
IntroductionIntroduction
Some background about China in Time and Space (CITAS) and China Data Center (CDC)
CITAS project
Robert Hartware’s CHGIS
The missions of CDC
New opportunities provided by CHGIS project for scholars from different disciplinarians
New challenges Theories
Methodologies
Tools (stand alone and online tools)
– integrate historical, social and natural science data into a geographic information system (GIS)
– support research in the human and natural components of local, regional and global change
– promote quantitative research on China studies
– promote collaborative research in spatial studies
– promote the use of data on China in teaching
– promote data sharing

Types of Spatial Data:Types of Spatial Data:
•Geospatial data– Polygons– Points– Lines– Images/Grid
•Socioeconomic data– County/Province statistics– Census data– Social surveys
Spatial Data Sources:Spatial Data Sources:
•Geographic data (polygons, points and lines)•Arc/Info data•Shape files (*.shp, *.shx, and *.dbf)•Grid•Image data (ERDAS Image, JPEG, TIFF, BMP and Arc/Info Image)•Tabular data (dBASE, INFO and TEXT)•SQL•SDE (Spatial Data Engine)
Types of Spatial DataTypes of Spatial Data
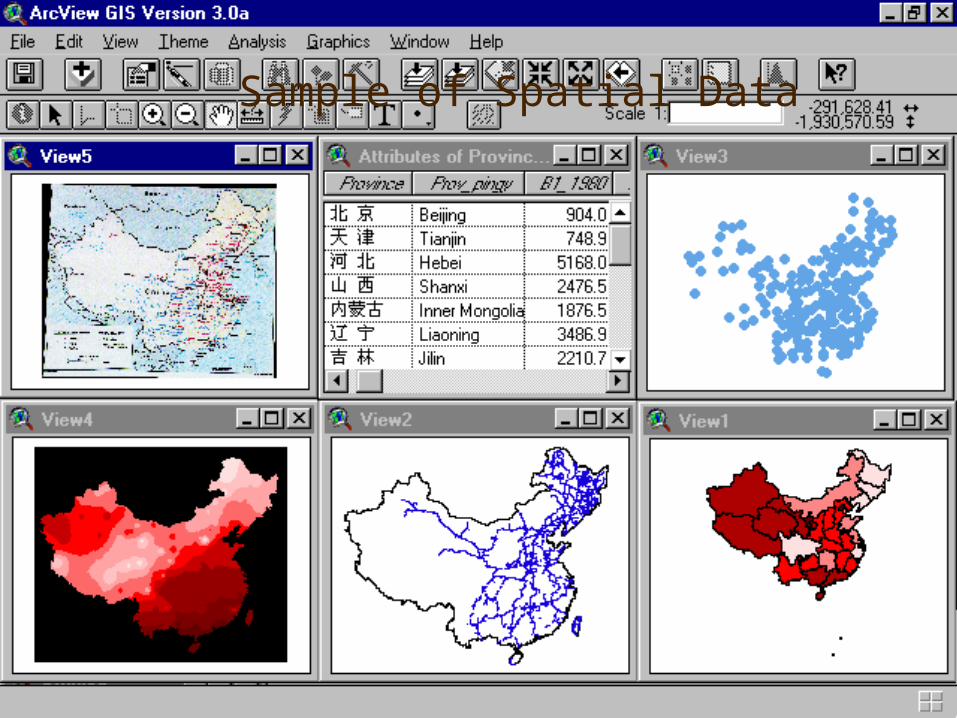
Sample of Spatial Data
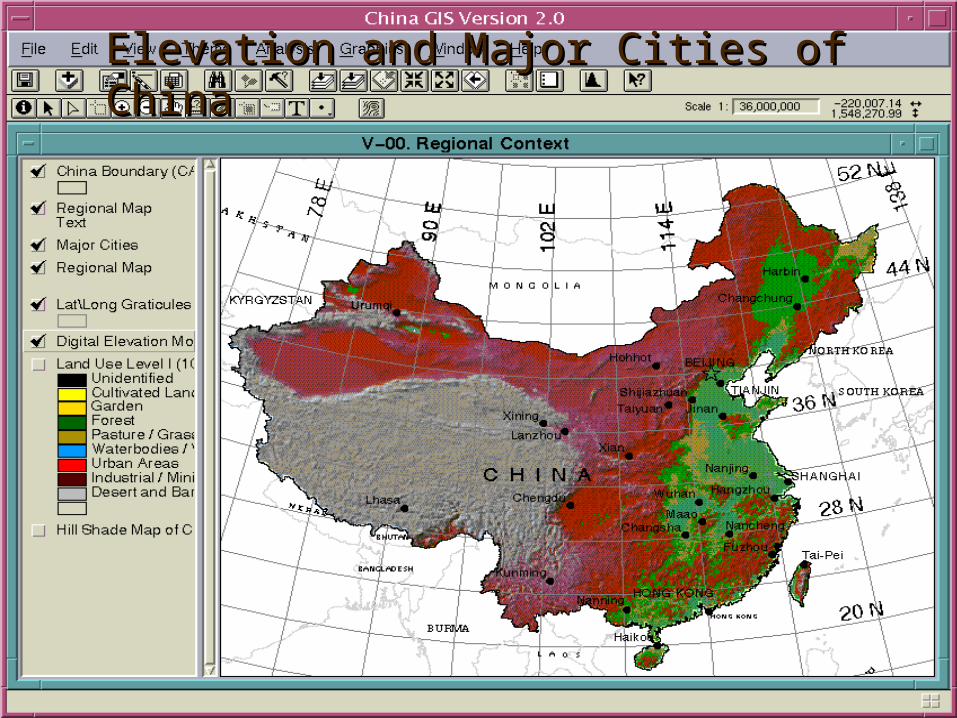
Elevation and Major Cities of ChinaElevation and Major Cities of China
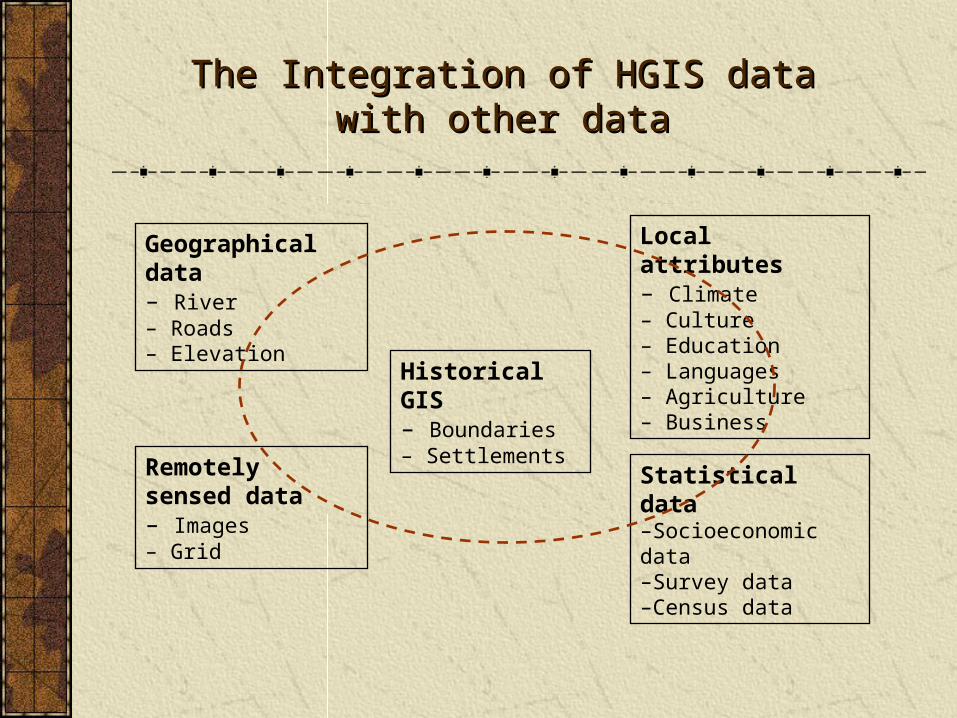
The Integration of HGIS data with The Integration of HGIS data with other dataother data
Historical GIS – Boundaries – Settlements
Local attributes– Climate– Culture– Education– Languages– Agriculture– Business
Geographical data – River– Roads– Elevation
Remotely sensed data– Images– Grid
Statistical data–Socioeconomic data–Survey data–Census data
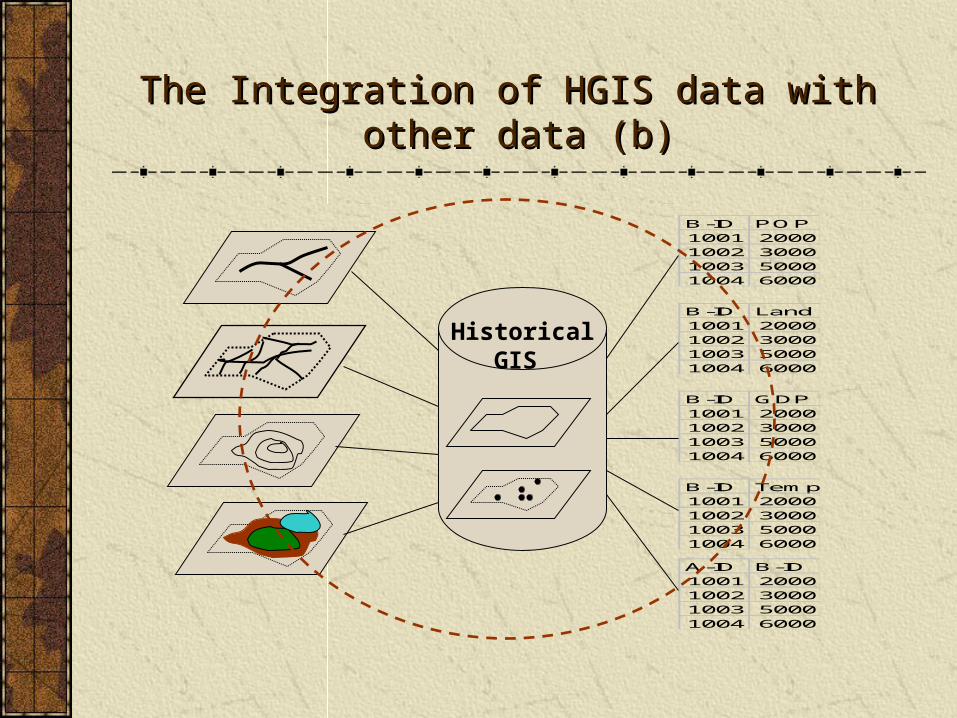
The Integration of HGIS data with The Integration of HGIS data with other data (b)other data (b)
Historical GIS
B-ID POP1001 20001002 30001003 50001004 6000
A-ID B-ID1001 20001002 30001003 50001004 6000
B-ID Tempreture1001 20001002 30001003 50001004 6000
B-ID GDP1001 20001002 30001003 50001004 6000
B-ID Land1001 20001002 30001003 50001004 6000
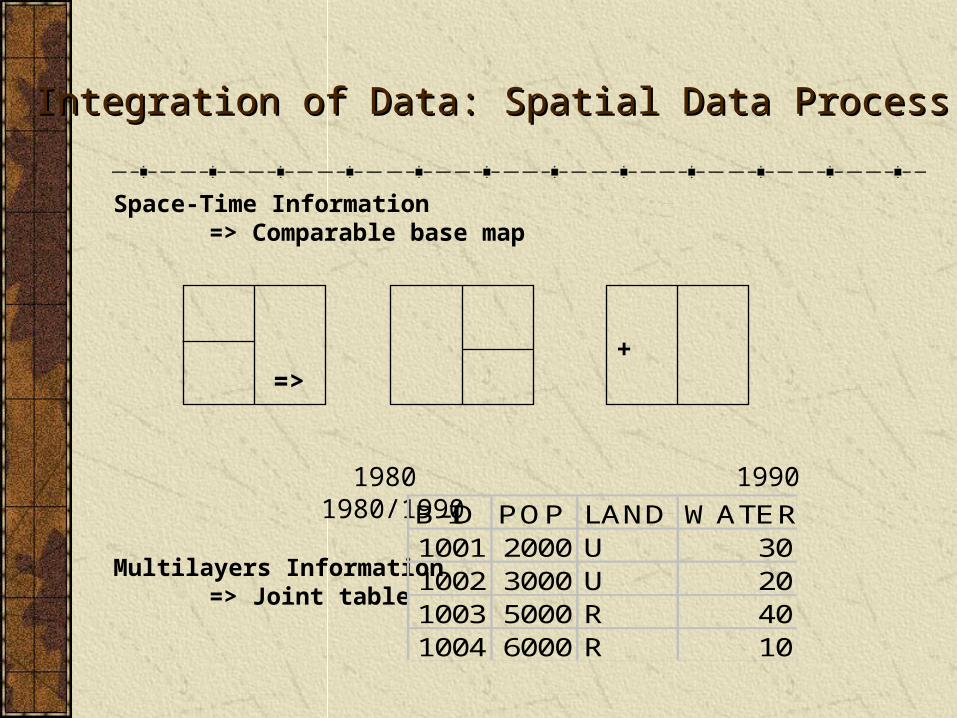
Space-Time Information=> Comparable base map
+ =>
1980 1990 1980/1990
Multilayers Information=> Joint table
B-ID POP LAND WATER1001 2000 U 301002 3000 U 201003 5000 R 401004 6000 R 10
Integration of Data: Spatial Data ProcessIntegration of Data: Spatial Data Process

Buffer:
Overlay: A B C
Join:
A-ID U/R10 R20 U
B-ID POP1001 20001002 30001003 50001004 6000
C-IDB-ID POP A-IDU/R1 1001 2000 10 U2 1001 2000 20 R3 1002 3000 10 U4 1002 3000 20 R5 1003 5000 10 U6 1003 5000 20 R7 1004 6000 10 U8 1004 6000 20 R
Integration of Data: Spatial OperationsIntegration of Data: Spatial Operations
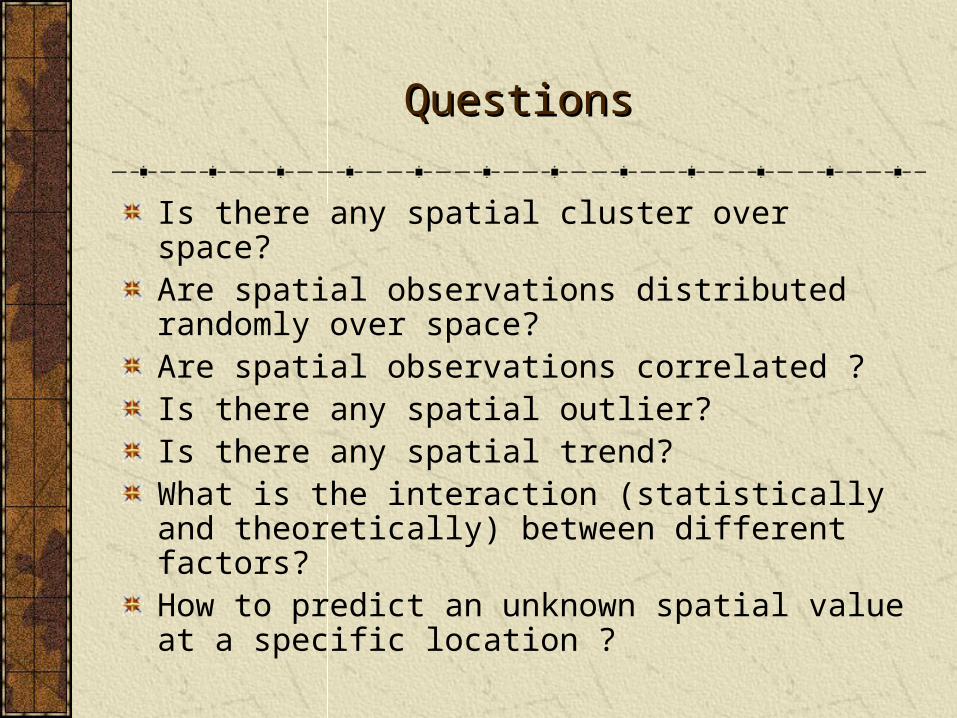
Is there any spatial cluster over space?Are spatial observations distributed randomly over space?Are spatial observations correlated ?Is there any spatial outlier?Is there any spatial trend?What is the interaction (statistically and theoretically) between different factors?How to predict an unknown spatial value at a specific location ?
QuestionsQuestions

Why spatial data is different from non-spatialWhy spatial data is different from non-spatial data ? (spatial neighborhood)
Statistical property for spatial data:Statistical property for spatial data: Spatial dependence (autocorrelation) Heterogeneity Spatial trend (non-stationarity)
Sensitive to spatial boundaries and spatial unitSensitive to spatial boundaries and spatial unit (Country, County, Tract) Lat / Long grid
Why Spatial is Special ?Why Spatial is Special ?
Spatial AnalysisSpatial Analysis
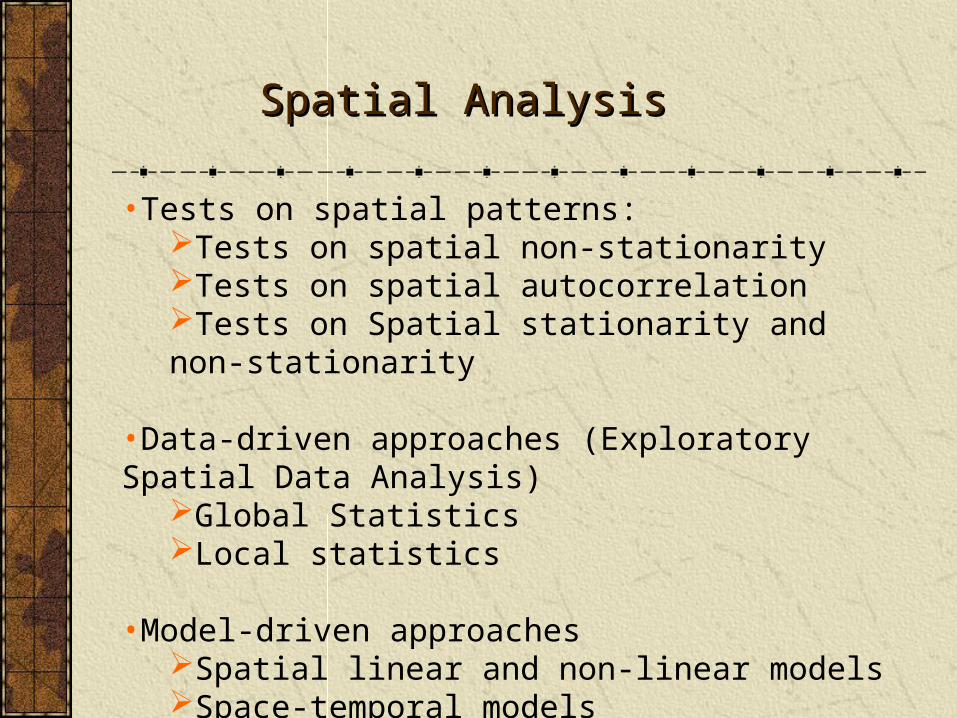
•Tests on spatial patterns:Tests on spatial non-stationarityTests on spatial autocorrelation Tests on Spatial stationarity and non-stationarity
•Data-driven approaches (Exploratory Spatial Data Analysis)
Global StatisticsLocal statistics
•Model-driven approachesSpatial linear and non-linear modelsSpace-temporal models
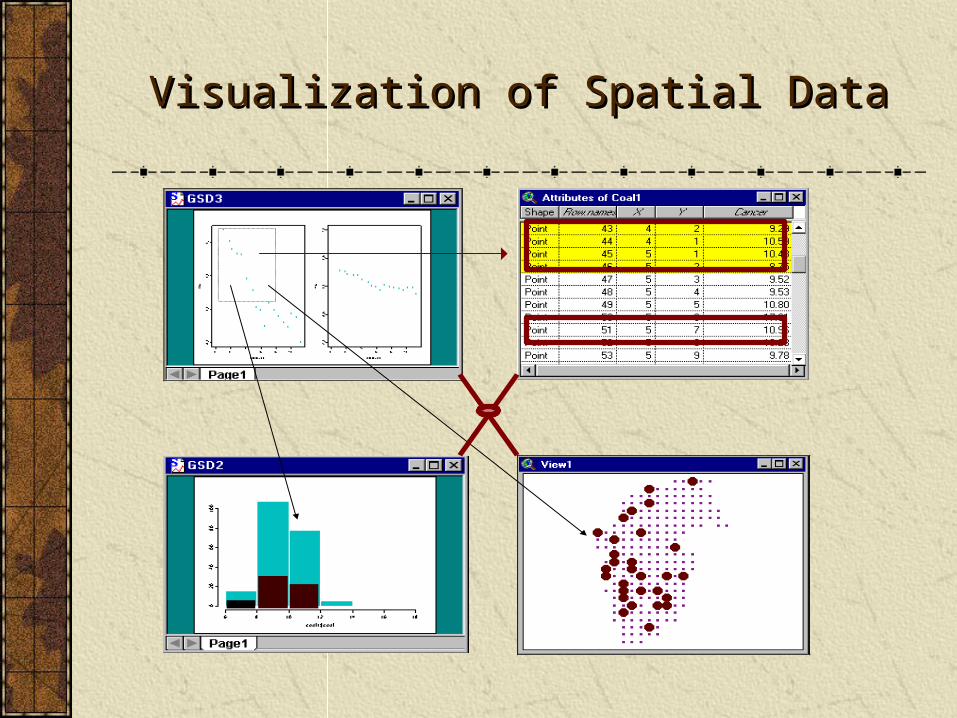
Visualization of Spatial DataVisualization of Spatial Data
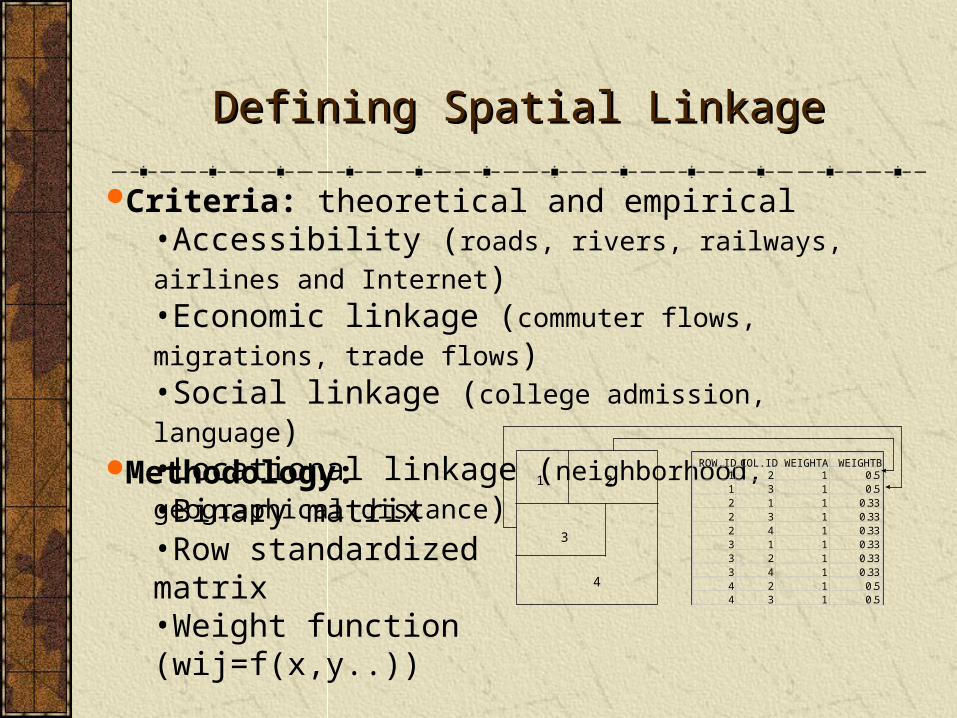
Criteria: theoretical and empirical•Accessibility (roads, rivers, railways, airlines and Internet)•Economic linkage (commuter flows, migrations, trade
flows)•Social linkage (college admission, language)•Locational linkage (neighborhood, geographical
distance)Methodology:
•Binary matrix•Row standardized matrix •Weight function (wij=f(x,y..))
1 2
3
4
ROW.ID COL.ID WEIGHTA WEIGHTB1 2 1 0.51 3 1 0.52 1 1 0.332 3 1 0.332 4 1 0.333 1 1 0.333 2 1 0.333 4 1 0.334 2 1 0.54 3 1 0.5
Defining Spatial LinkageDefining Spatial Linkage
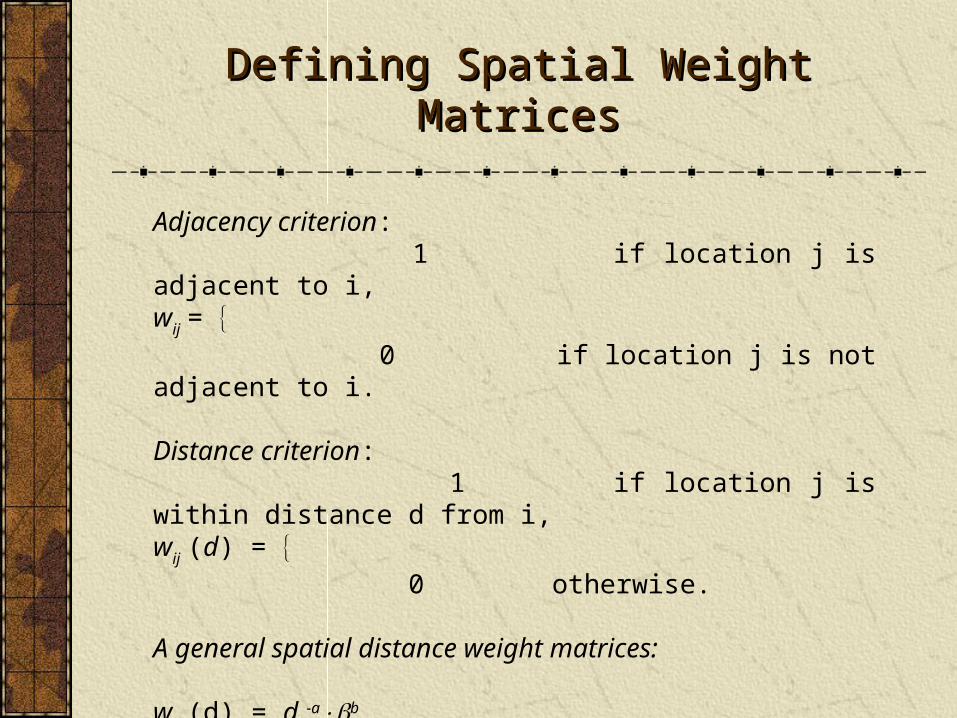
Adjacency criterion: 1 if location j is adjacent to i,wij = 0 if location j is not adjacent to i. Distance criterion: 1 if location j is within distance d from i,wij (d) = 0 otherwise. A general spatial distance weight matrices: wij (d) = dij
-ab
Defining Spatial Weight MatricesDefining Spatial Weight Matrices
Identifying Spatial OutliersIdentifying Spatial Outliers
Mapping
Table analysis
Exploratory spatial data analysis
Statistical analysis
Distance h
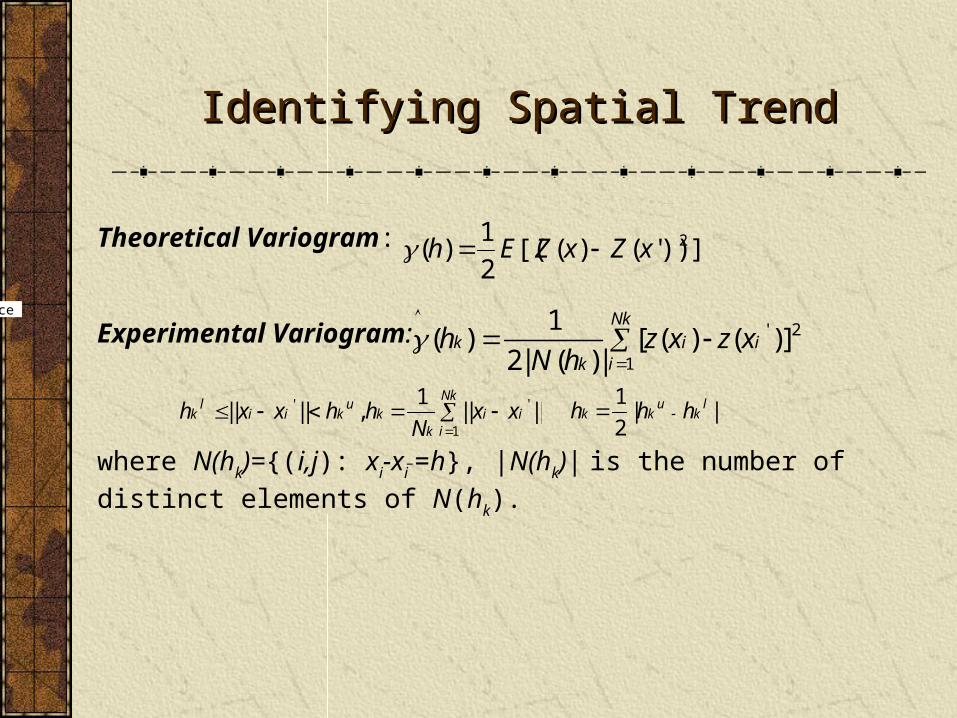
Theoretical Variogram:
Experimental Variogram:
where N(hk)={(i,j): xi-xi_=h}, |N(hk)| is the number of distinct
elements of N(hk).
]))'()([(2
1)( 2xZxZEh
( )
| ( )|[ ( ) ( )]'h
N hz x z xk
ki
i
Nk
i1
2 1
2
h x x h hN
x xkl
i i ku
kk
i ii
Nk
|| || , || ||' '1
1h h hk k
ukl
1
2| |
Identifying Spatial TrendIdentifying Spatial Trend

•1) Exponenti•2) Gaussian•3) Spherical•4) Linear•5) Power
a. Exponential
b. Gaussian
c. Spherical
d. Linear
e. Power
Theoretical variogram:
Empirical variogram:
Theoretical Variogram Models Theoretical Variogram Models & Empirical Variogram& Empirical Variogram
I d w x x x x S wij i jj
n
i
n
ijj
n
i
n
( ) ( )( ) ( )
2
Sn
x xii
n2 21
( ) xn
xii
n
11
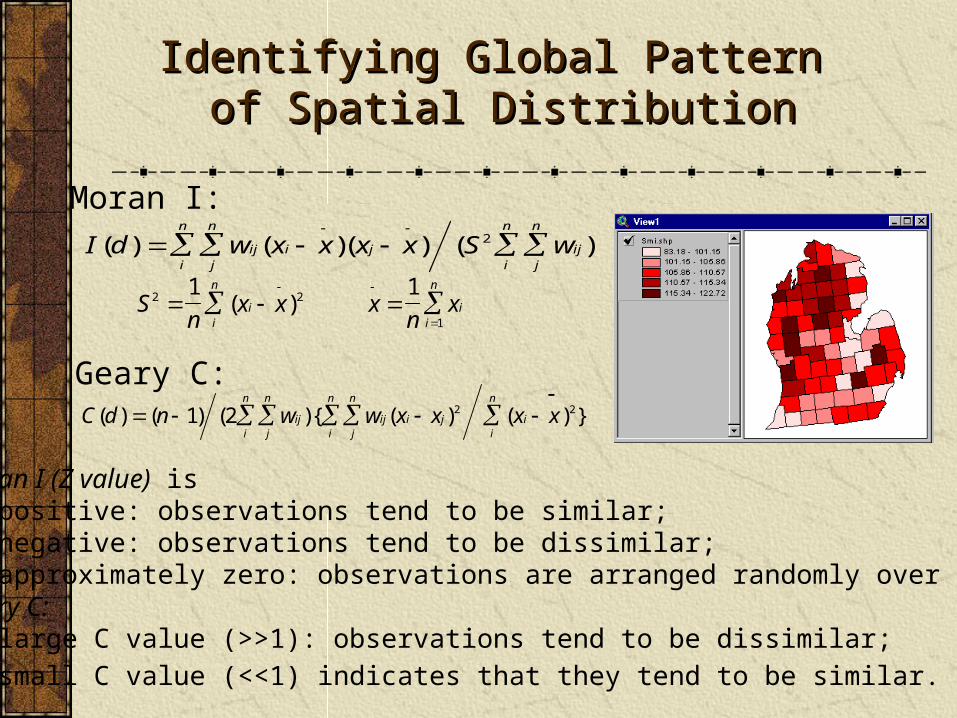
Moran I (Z value) is • positive: observations tend to be similar;• negative: observations tend to be dissimilar;• approximately zero: observations are arranged randomly over space. Geary C:• large C value (>>1): observations tend to be dissimilar;• small C value (<<1) indicates that they tend to be similar.
Moran I:
C d n w w x x x xijj
n
i
n
ij i jj
n
i
n
ii
n
( ) ( ) ( ){ ( ) ( ) }
1 2 2 2
Geary C:
Identifying Global Pattern Identifying Global Pattern of Spatial Distributionof Spatial Distribution
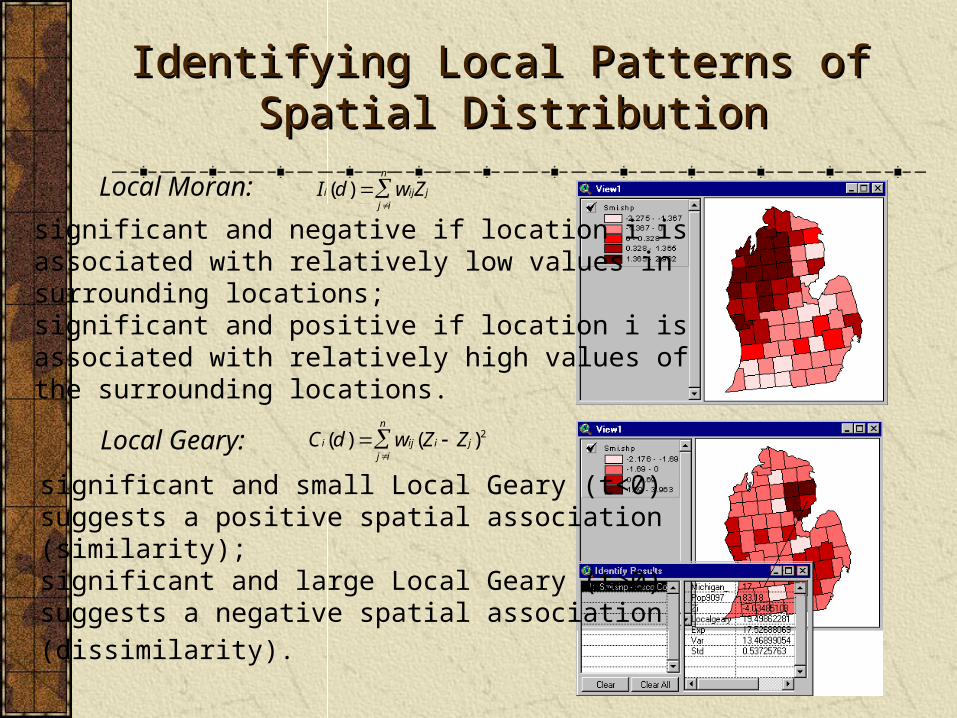
Local Moran: I d w Zi ij jj i
n
( )
Local Geary: C d w Z Zi ij i jj i
n
( ) ( ) 2
• significant and negative if location i is associated with relatively low values in surrounding locations;• significant and positive if location i is associated with relatively high values of the surrounding locations.
• significant and small Local Geary (t<0) suggests a positive spatial association (similarity);• significant and large Local Geary (t>0) suggests a negative spatial association
(dissimilarity).
Identifying Local Patterns of Identifying Local Patterns of Spatial DistributionSpatial Distribution
Identifying Factors for Spatial Identifying Factors for Spatial ChangesChanges
Spatially autoregressive model
Spatial moving average model
Semi-parametric model
Kriging

Y = WY +
where y is an observed variable over space D: {Y(si): si D, i=1?n },
W is a spatial weight matrix (nxn), is the spatial autoregressive parameter, and ~ N(0, 2).
OLSOLS estimates are biased and inconsistent: estimates are biased and inconsistent:
^
( )' ( ) ( )' ( )' ( ) ( )'
Wy Wy Wy y Wy Wy Wy1 1
E( )^
A Simple Spatial Autoregressive A Simple Spatial Autoregressive
ModelModel
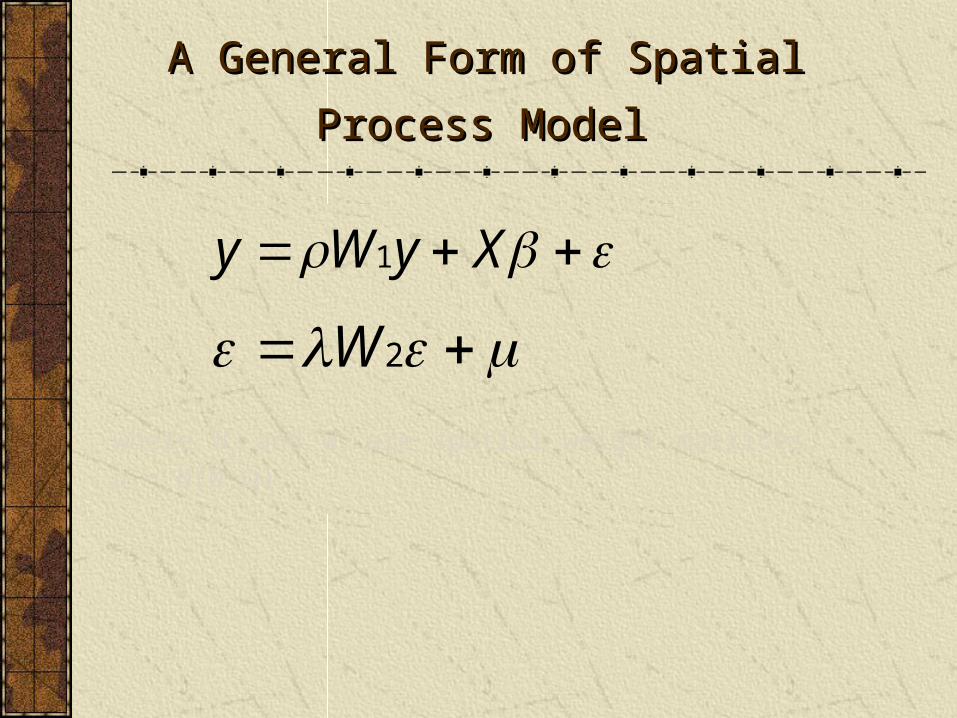
A General Form of Spatial A General Form of Spatial
Process ModelProcess Model
where W1 and W2 are spatial weight matrices, ~ N(0,).
y W y X 1
W 2

Historical studies Socioeconomic development Environment Religion Anthropology studies Population studies Minority studies….
ApplicationsApplications
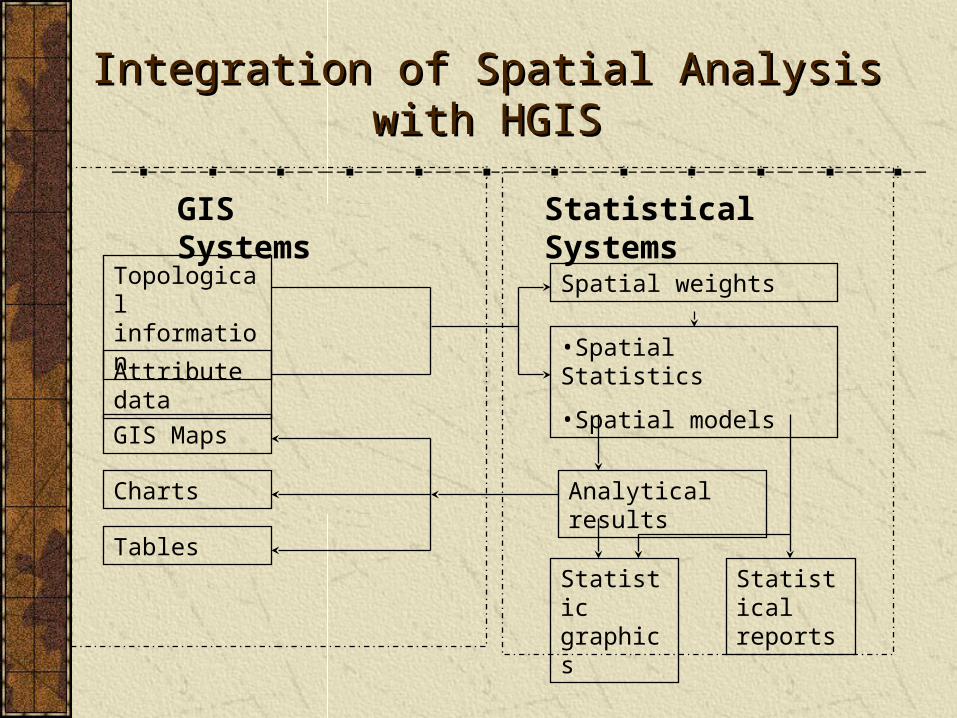
GIS Systems
Topological information
Tables
Statistical Systems
•Spatial Statistics
•Spatial modelsAttribute data
Analytical results
Statistical reports
Statistic graphics
Charts
GIS Maps
Spatial weights
Integration of Spatial Analysis with Integration of Spatial Analysis with HGISHGIS
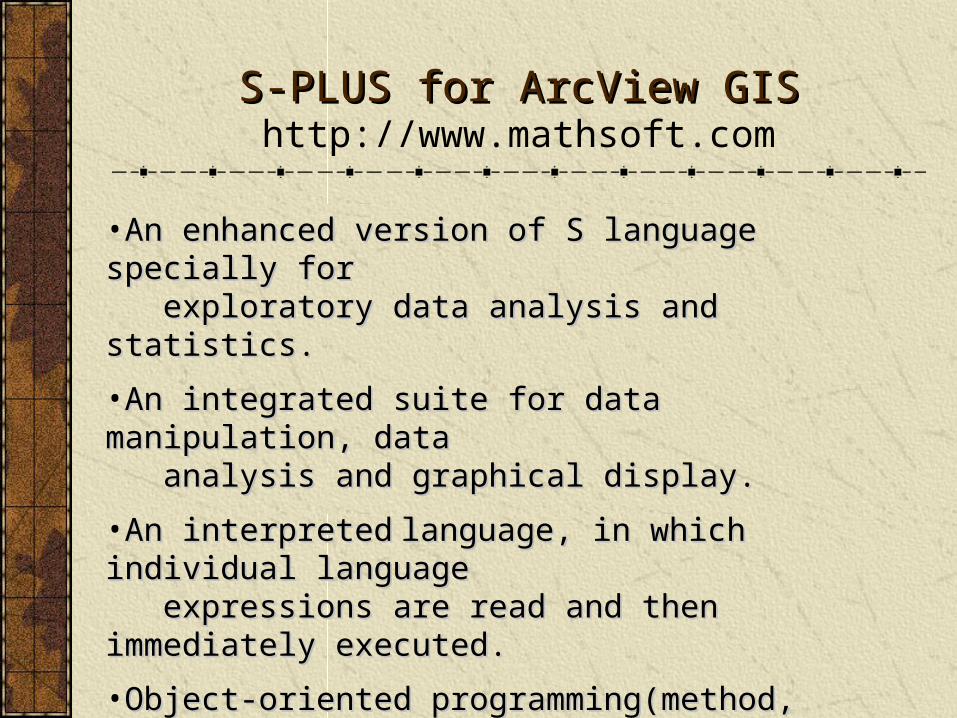
•An enhanced version of S language specially for An enhanced version of S language specially for exploratory data analysis and statistics.exploratory data analysis and statistics.
•An integrated suite for data manipulation, data An integrated suite for data manipulation, data analysis and graphical display.analysis and graphical display.
•An interpretedAn interpreted language, in which individual language language, in which individual language expressions are read and then immediately executed.expressions are read and then immediately executed.
•Object-oriented programming(method, class, and object).Object-oriented programming(method, class, and object).
•S+SpatialStatsS+SpatialStats for geostatistical data, polygon data for geostatistical data, polygon data and point data (2000+ analytical functions).and point data (2000+ analytical functions).
S-PLUS for ArcView GISS-PLUS for ArcView GIShttp://www.mathsoft.com

China Data
Attribute data:
GIS map data:
Application Interface
ArcView GIS
S-PLUS/SpatialStats
Maps
Analysis
Reports
Statistical Graphics
S-PLUS for ArcViewS-PLUS for ArcView
Spatial data process (missing data, fuzzy data, large Spatial data process (missing data, fuzzy data, large volume of data, space-time data structure, references)volume of data, space-time data structure, references)
Spatial data sharing and management (Metadata, GIS Spatial data sharing and management (Metadata, GIS data, attribute data; distributed centers; update, search, data, attribute data; distributed centers; update, search, online analysis)online analysis)
Integration of CHGIS with natural and social informationIntegration of CHGIS with natural and social information
Development of new methodology and tools for spatial Development of new methodology and tools for spatial data analysis (sampling, survey, clustering, data analysis (sampling, survey, clustering, autocorrelation, association, modeling, simulation, web autocorrelation, association, modeling, simulation, web tools)tools)
Applications of GIS, database, and new technology in Applications of GIS, database, and new technology in historical and other studieshistorical and other studies
Research IssuesResearch Issues
Related Documents