Shriram Transport Finance Company Ltd Corporate Presentation – March 2019 Just another milestone in our growth journey

Welcome message from author
This document is posted to help you gain knowledge. Please leave a comment to let me know what you think about it! Share it to your friends and learn new things together.
Transcript

Shriram Transport Finance Company Ltd Corporate Presentation – March 2019
Just another milestone in our growth journey
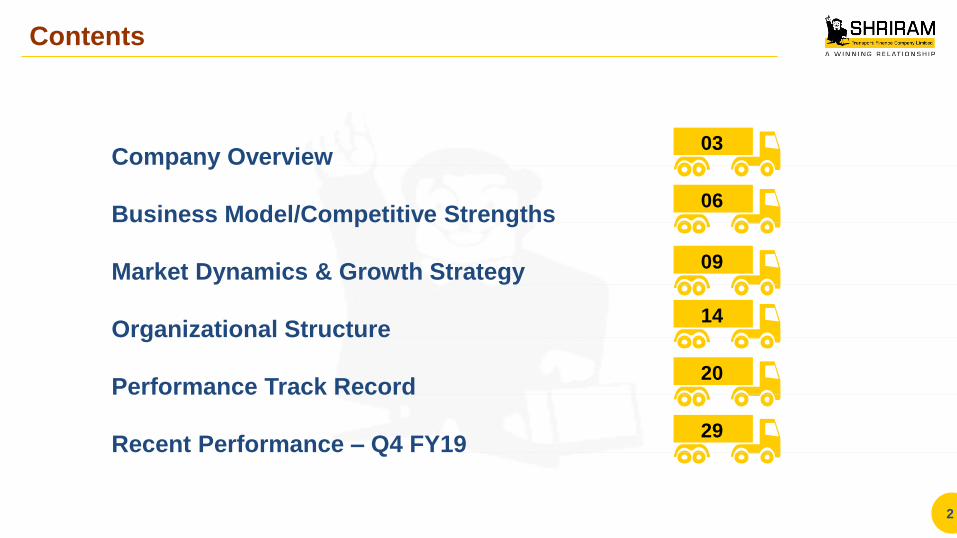
Company Overview
Business Model/Competitive Strengths
Market Dynamics & Growth Strategy
Organizational Structure
Performance Track Record
Recent Performance – Q4 FY19
03
06
09
14
20
29
Contents
2

COMPANY OVERVIEW
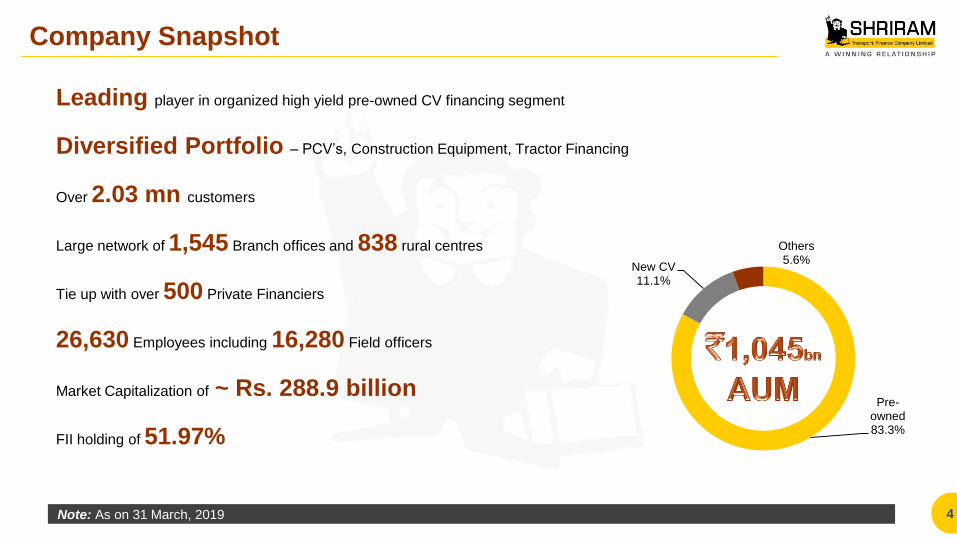
Company Snapshot
Leading player in organized high yield pre-owned CV financing segment
Diversified Portfolio – PCV’s, Construction Equipment, Tractor Financing
Over 2.03 mn customers
Large network of 1,545 Branch offices and 838 rural centres
Tie up with over 500 Private Financiers
26,630 Employees including 16,280 Field officers
Market Capitalization of ~ Rs. 288.9 billion
FII holding of 51.97%
4 Note: As on 31 March, 2019
Pre-owned 83.3%
New CV 11.1%
Others 5.6%
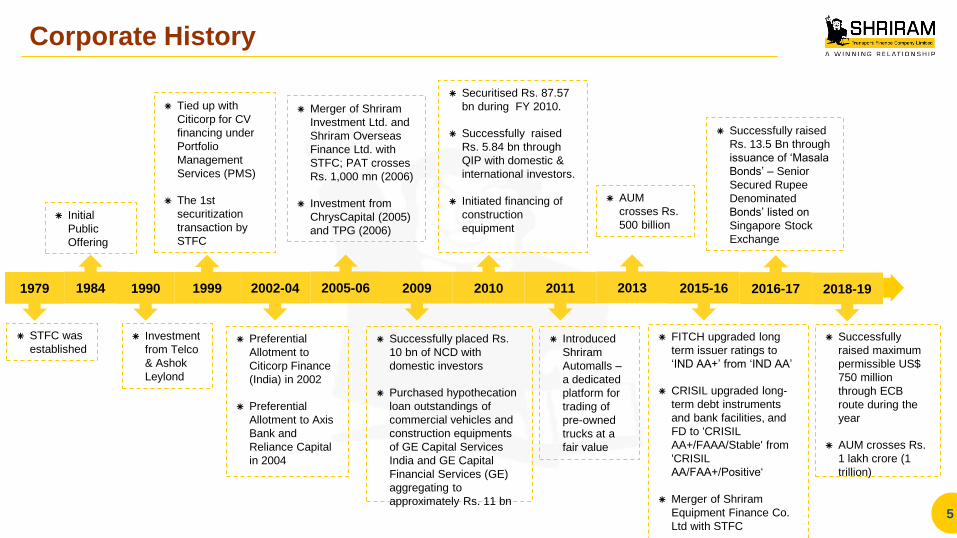
Corporate History
5
Successfully placed Rs.
10 bn of NCD with
domestic investors
Purchased hypothecation
loan outstandings of
commercial vehicles and
construction equipments
of GE Capital Services
India and GE Capital
Financial Services (GE)
aggregating to
approximately Rs. 11 bn
Securitised Rs. 87.57
bn during FY 2010.
Successfully raised
Rs. 5.84 bn through
QIP with domestic &
international investors.
Initiated financing of
construction
equipment
Merger of Shriram
Investment Ltd. and
Shriram Overseas
Finance Ltd. with
STFC; PAT crosses
Rs. 1,000 mn (2006)
Investment from
ChrysCapital (2005)
and TPG (2006)
Tied up with
Citicorp for CV
financing under
Portfolio
Management
Services (PMS)
The 1st
securitization
transaction by
STFC
Initial
Public
Offering
Preferential
Allotment to
Citicorp Finance
(India) in 2002
Preferential
Allotment to Axis
Bank and
Reliance Capital
in 2004
Investment
from Telco
& Ashok
Leylond
STFC was
established Introduced
Shriram
Automalls –
a dedicated
platform for
trading of
pre-owned
trucks at a
fair value
1979 1984 1990 1999 2002-04 2005-06 2009 2010 2011 2013 2015-16 2016-17
AUM
crosses Rs.
500 billion
FITCH upgraded long
term issuer ratings to
‘IND AA+’ from ‘IND AA’
CRISIL upgraded long-
term debt instruments
and bank facilities, and
FD to 'CRISIL
AA+/FAAA/Stable' from
'CRISIL
AA/FAA+/Positive‘
Merger of Shriram
Equipment Finance Co.
Ltd with STFC
Successfully raised
Rs. 13.5 Bn through
issuance of ‘Masala
Bonds’ – Senior
Secured Rupee
Denominated
Bonds’ listed on
Singapore Stock
Exchange
Successfully
raised maximum
permissible US$
750 million
through ECB
route during the
year
AUM crosses Rs.
1 lakh crore (1
trillion)
2018-19
BUSINESS MODEL /
COMPETITIVE STRENGTHS
2 3 4 5 1 6 11
16-24%
7 8 9 10 12
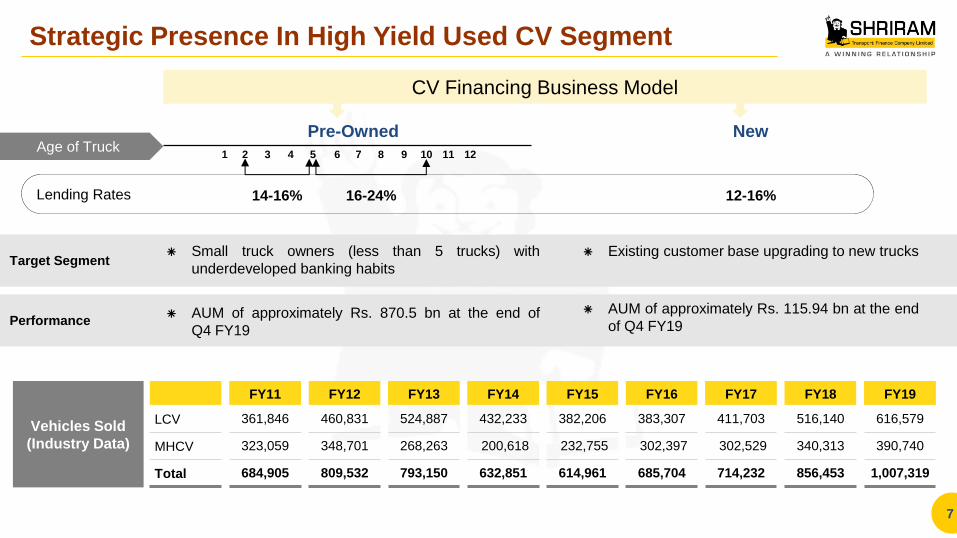
Strategic Presence In High Yield Used CV Segment
Pre-Owned
7
CV Financing Business Model
New
FY11 FY12 FY13 FY14 FY15 FY16 FY17 FY18 FY19
LCV 361,846 460,831 524,887 432,233 382,206 383,307 411,703 516,140 616,579
MHCV 323,059 348,701 268,263 200,618 232,755 302,397 302,529 340,313 390,740
Total 684,905 809,532 793,150 632,851 614,961 685,704 714,232 856,453 1,007,319
Small truck owners (less than 5 trucks) with
underdeveloped banking habits
AUM of approximately Rs. 870.5 bn at the end of
Q4 FY19
Existing customer base upgrading to new trucks
AUM of approximately Rs. 115.94 bn at the end
of Q4 FY19
Target Segment
Performance
Vehicles Sold
(Industry Data)
Age of Truck
12-16% 14-16% Lending Rates
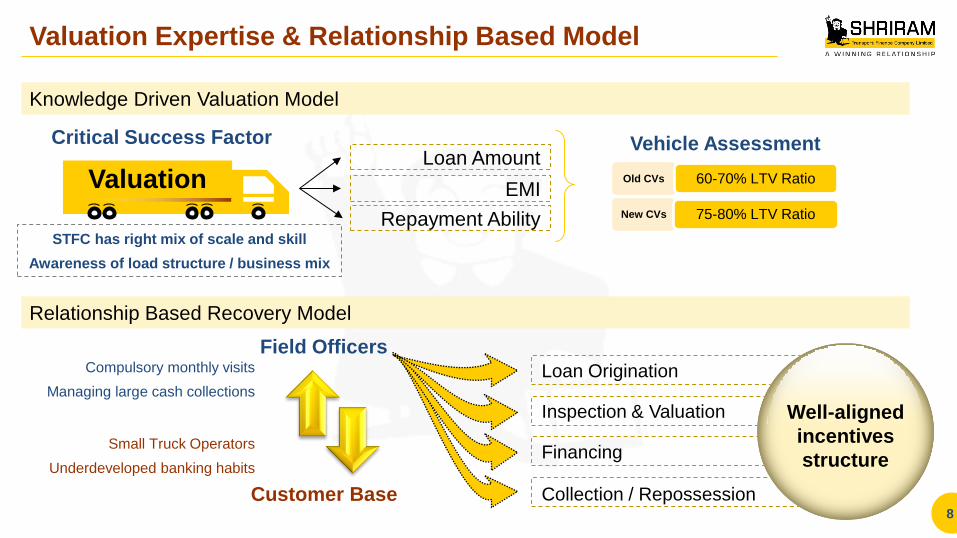
Valuation Expertise & Relationship Based Model
8
Knowledge Driven Valuation Model
Loan Amount
EMI
Repayment Ability
Valuation
Critical Success Factor Vehicle Assessment
Old CVs
New CVs
60-70% LTV Ratio
75-80% LTV Ratio
Relationship Based Recovery Model
Field Officers
Loan Origination
Inspection & Valuation
Financing
Collection / Repossession
Well-aligned
incentives
structure
Customer Base
Compulsory monthly visits
Managing large cash collections
Small Truck Operators
Underdeveloped banking habits
STFC has right mix of scale and skill
Awareness of load structure / business mix

MARKET DYNAMICS & GROWTH
STRATEGY
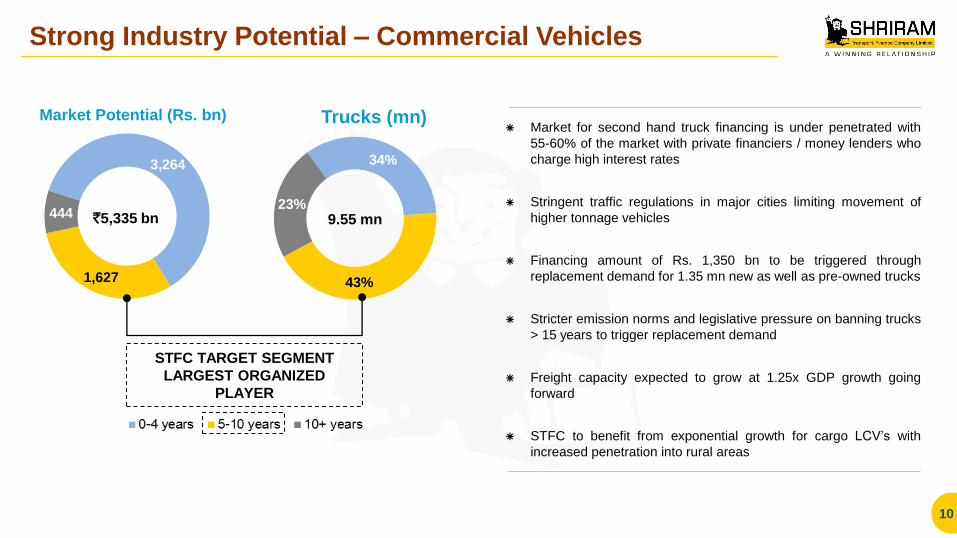
Strong Industry Potential – Commercial Vehicles
10
STFC TARGET SEGMENT
LARGEST ORGANIZED
PLAYER
3,264
1,627
444
Market Potential (Rs. bn)
34%
43%
23%
Trucks (mn)
9.55 mn `5,335 bn
Market for second hand truck financing is under penetrated with
55-60% of the market with private financiers / money lenders who
charge high interest rates
Stringent traffic regulations in major cities limiting movement of
higher tonnage vehicles
Financing amount of Rs. 1,350 bn to be triggered through
replacement demand for 1.35 mn new as well as pre-owned trucks
Stricter emission norms and legislative pressure on banning trucks
> 15 years to trigger replacement demand
Freight capacity expected to grow at 1.25x GDP growth going
forward
STFC to benefit from exponential growth for cargo LCV’s with
increased penetration into rural areas
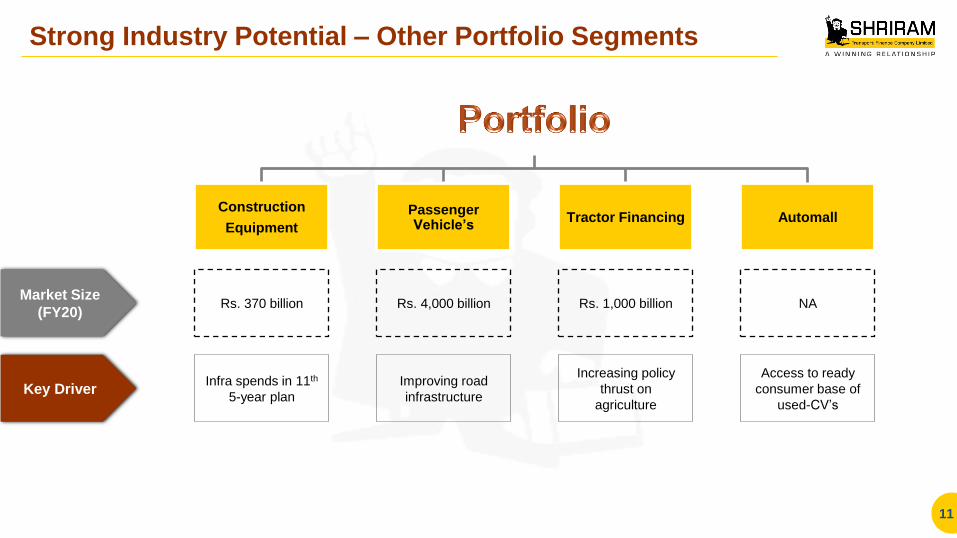
Strong Industry Potential – Other Portfolio Segments
11
Market Size
(FY20)
Key Driver
Rs. 370 billion
Infra spends in 11th
5-year plan
Rs. 4,000 billion
Improving road
infrastructure
Construction
Equipment
Passenger Vehicle’s
Tractor Financing Automall
Rs. 1,000 billion
Increasing policy
thrust on
agriculture
NA
Access to ready
consumer base of
used-CV’s
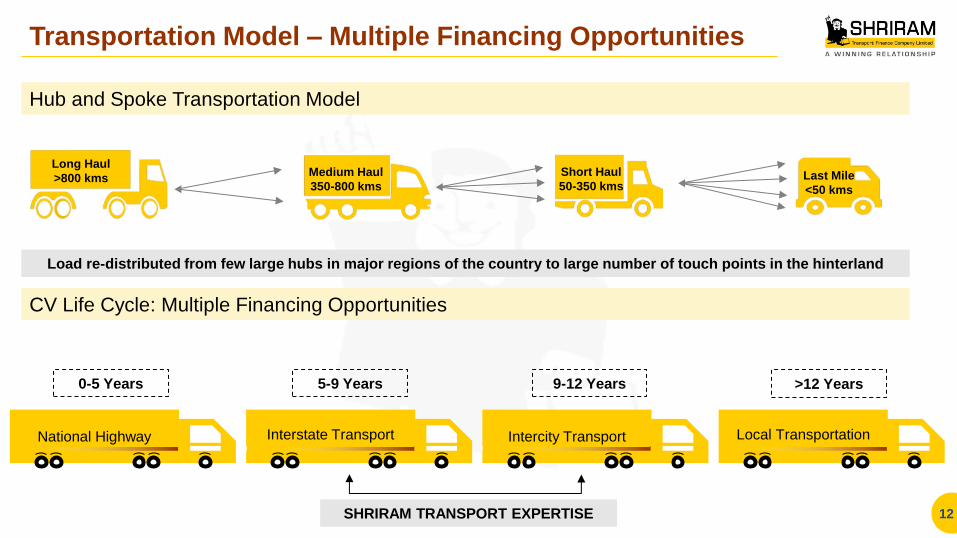
Hub and Spoke Transportation Model
CV Life Cycle: Multiple Financing Opportunities
Transportation Model – Multiple Financing Opportunities
12
Long Haul
>800 kms Medium Haul
350-800 kms
Short Haul
50-350 kms Last Mile
<50 kms
Load re-distributed from few large hubs in major regions of the country to large number of touch points in the hinterland
National Highway
0-5 Years 5-9 Years 9-12 Years >12 Years
Interstate Transport
Intercity Transport Local Transportation
SHRIRAM TRANSPORT EXPERTISE
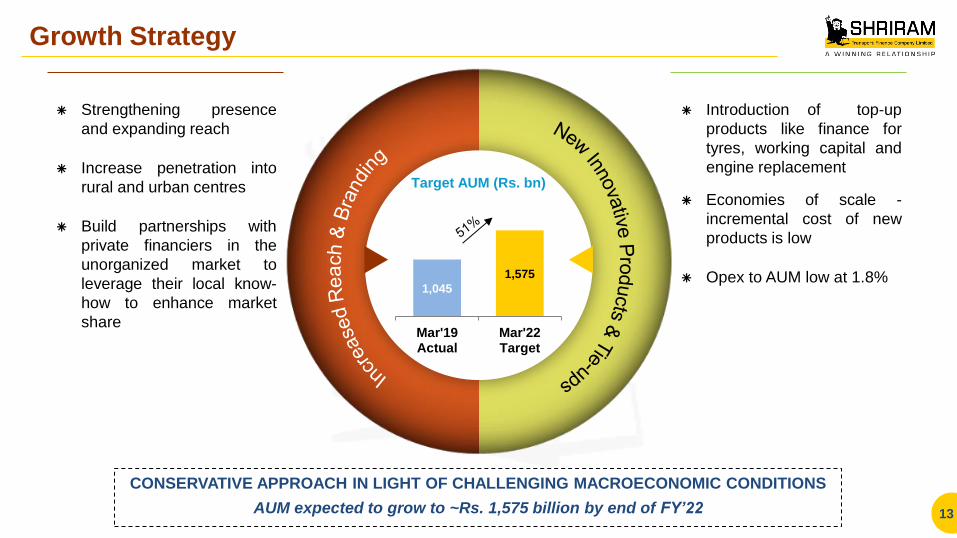
Growth Strategy
Strengthening presence
and expanding reach
Increase penetration into
rural and urban centres
Build partnerships with
private financiers in the
unorganized market to
leverage their local know-
how to enhance market
share
13
Introduction of top-up
products like finance for
tyres, working capital and
engine replacement
Economies of scale -
incremental cost of new
products is low
Opex to AUM low at 1.8%
CONSERVATIVE APPROACH IN LIGHT OF CHALLENGING MACROECONOMIC CONDITIONS
AUM expected to grow to ~Rs. 1,575 billion by end of FY’22
1,045
1,575
Mar'19Actual
Mar'22Target
Target AUM (Rs. bn)

ORGANIZATIONAL STRUCTURE,
MANAGEMENT TEAM & BOARD OF
DIRECTOR’S
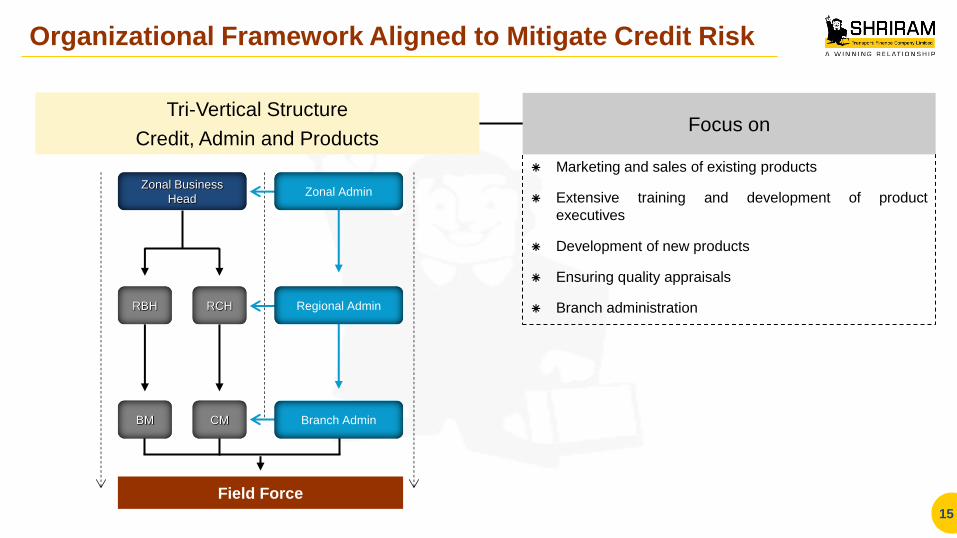
Marketing and sales of existing products
Extensive training and development of product
executives
Development of new products
Ensuring quality appraisals
Branch administration
Tri-Vertical Structure
Credit, Admin and Products
Organizational Framework Aligned to Mitigate Credit Risk
15
Focus on
Field Force
Zonal Business
Head Zonal Admin
RBH Regional Admin
Branch Admin
RCH
BM CM
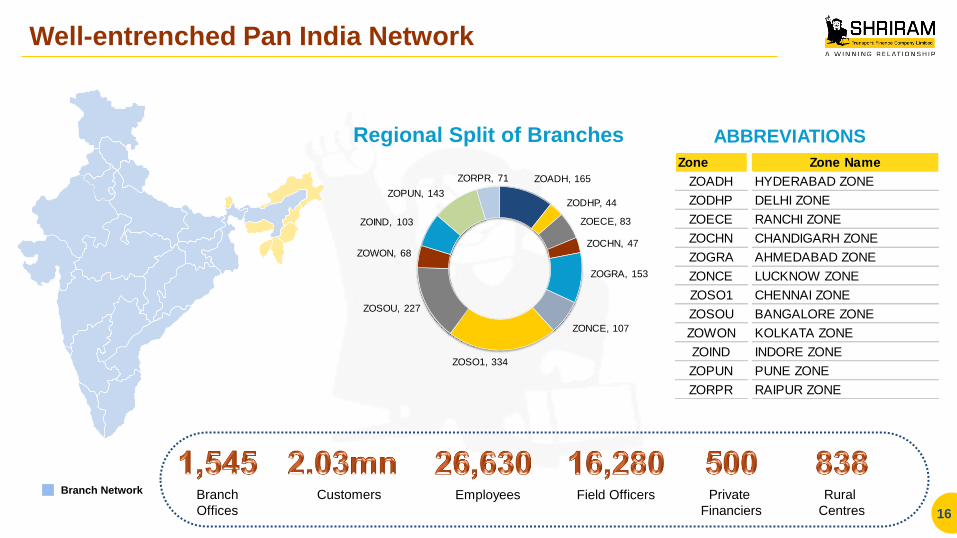
Well-entrenched Pan India Network
16
Branch Network Branch
Offices
Rural
Centres
Private
Financiers
Field Officers Customers
Regional Split of Branches
Employees
ABBREVIATIONS
ZOADH, 165
ZODHP, 44
ZOECE, 83
ZOCHN, 47
ZOGRA, 153
ZONCE, 107
ZOSO1, 334
ZOSOU, 227
ZOWON, 68
ZOIND, 103
ZOPUN, 143
ZORPR, 71
Zone Zone Name
ZOADH HYDERABAD ZONE
ZODHP DELHI ZONE
ZOECE RANCHI ZONE
ZOCHN CHANDIGARH ZONE
ZOGRA AHMEDABAD ZONE
ZONCE LUCKNOW ZONE
ZOSO1 CHENNAI ZONE
ZOSOU BANGALORE ZONE
ZOWON KOLKATA ZONE
ZOIND INDORE ZONE
ZOPUN PUNE ZONE
ZORPR RAIPUR ZONE

Professional Management Team with Vast Industry Experience
17
• Joined as an Executive Trainee in 1987. He has been associated with Shriram Group for over 30 years and has shouldered
various responsibilities and worked in several key roles of business operations.
• Holds a degree in MBA Finance.
• Over 28 years experience in finance industry.
• Joined in 1995 and now heads the Finance function, a qualified Cost Accountant.
• Over 28 years experience in finance industry.
• Joined in 1995 and now heads the Accounts and Administration function, a qualified Cost Accountant.
• Over 25 years experience in the finance Industry.
• Joined in 2007, a qualified Company Secretary.
Umesh Revankar
MD & CEO
Parag Sharma
Executive Director
& CFO
S. Sunder
Executive Director
Accounts & Admin
Sanjay K Mundra
President -
Investor and Media
Relations
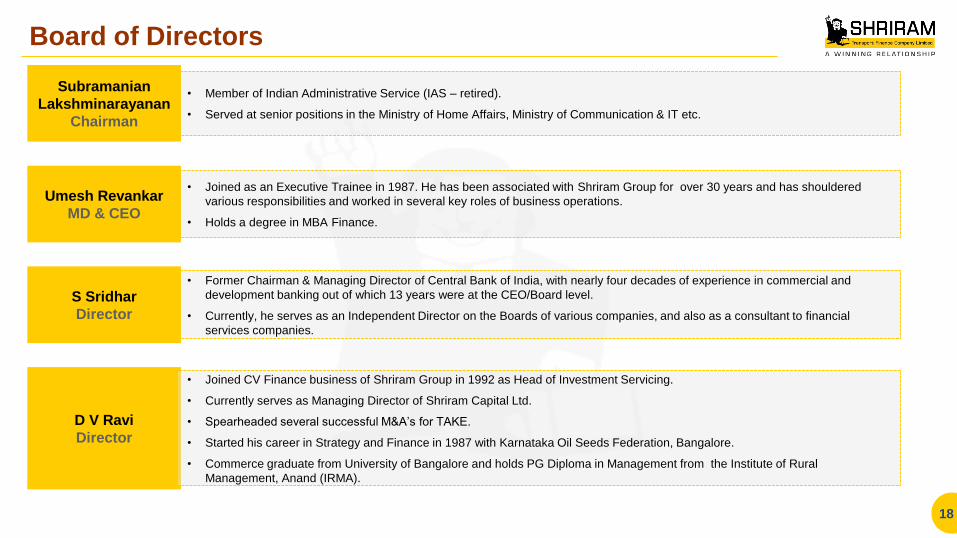
D V Ravi
Director
Board of Directors
18
• Member of Indian Administrative Service (IAS – retired).
• Served at senior positions in the Ministry of Home Affairs, Ministry of Communication & IT etc.
• Joined as an Executive Trainee in 1987. He has been associated with Shriram Group for over 30 years and has shouldered
various responsibilities and worked in several key roles of business operations.
• Holds a degree in MBA Finance.
• Joined CV Finance business of Shriram Group in 1992 as Head of Investment Servicing.
• Currently serves as Managing Director of Shriram Capital Ltd.
• Spearheaded several successful M&A’s for TAKE.
• Started his career in Strategy and Finance in 1987 with Karnataka Oil Seeds Federation, Bangalore.
• Commerce graduate from University of Bangalore and holds PG Diploma in Management from the Institute of Rural
Management, Anand (IRMA).
Subramanian
Lakshminarayanan
Chairman
Umesh Revankar
MD & CEO
• Former Chairman & Managing Director of Central Bank of India, with nearly four decades of experience in commercial and
development banking out of which 13 years were at the CEO/Board level.
• Currently, he serves as an Independent Director on the Boards of various companies, and also as a consultant to financial
services companies.
S Sridhar
Director
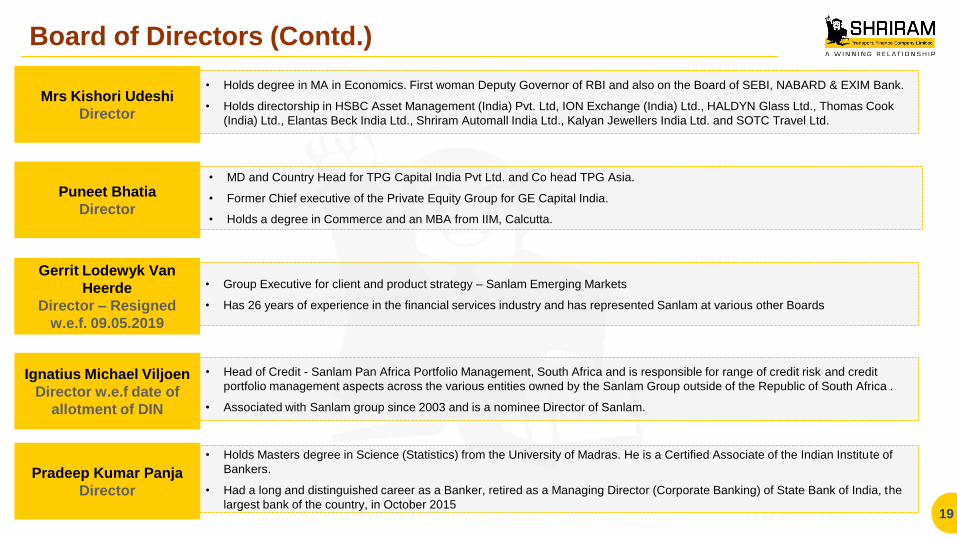
Board of Directors (Contd.)
19
• Holds degree in MA in Economics. First woman Deputy Governor of RBI and also on the Board of SEBI, NABARD & EXIM Bank.
• Holds directorship in HSBC Asset Management (India) Pvt. Ltd, ION Exchange (India) Ltd., HALDYN Glass Ltd., Thomas Cook
(India) Ltd., Elantas Beck India Ltd., Shriram Automall India Ltd., Kalyan Jewellers India Ltd. and SOTC Travel Ltd.
• Head of Credit - Sanlam Pan Africa Portfolio Management, South Africa and is responsible for range of credit risk and credit
portfolio management aspects across the various entities owned by the Sanlam Group outside of the Republic of South Africa .
• Associated with Sanlam group since 2003 and is a nominee Director of Sanlam.
• Holds Masters degree in Science (Statistics) from the University of Madras. He is a Certified Associate of the Indian Institute of
Bankers.
• Had a long and distinguished career as a Banker, retired as a Managing Director (Corporate Banking) of State Bank of India, the
largest bank of the country, in October 2015
Ignatius Michael Viljoen
Director w.e.f date of
allotment of DIN
Pradeep Kumar Panja
Director
Puneet Bhatia
Director
• MD and Country Head for TPG Capital India Pvt Ltd. and Co head TPG Asia.
• Former Chief executive of the Private Equity Group for GE Capital India.
• Holds a degree in Commerce and an MBA from IIM, Calcutta.
Mrs Kishori Udeshi
Director
• Group Executive for client and product strategy – Sanlam Emerging Markets
• Has 26 years of experience in the financial services industry and has represented Sanlam at various other Boards
Gerrit Lodewyk Van
Heerde
Director – Resigned
w.e.f. 09.05.2019
PERFORMANCE TRACK RECORD
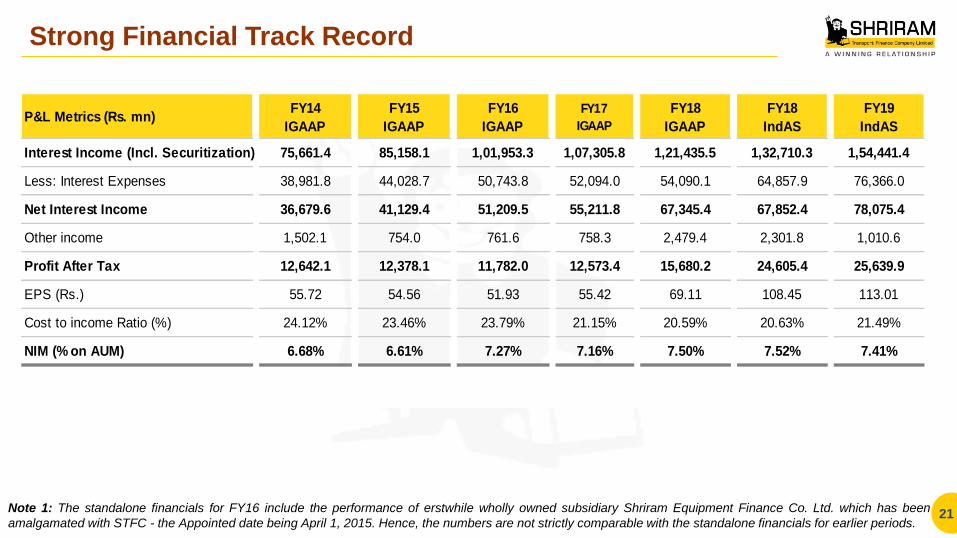
Strong Financial Track Record
21 Note 1: The standalone financials for FY16 include the performance of erstwhile wholly owned subsidiary Shriram Equipment Finance Co. Ltd. which has been
amalgamated with STFC - the Appointed date being April 1, 2015. Hence, the numbers are not strictly comparable with the standalone financials for earlier periods.
P&L Metrics (Rs. mn)FY14
IGAAP
FY15
IGAAP
FY16
IGAAP
FY17
IGAAP
FY18
IGAAP
FY18
IndAS
FY19
IndAS
Interest Income (Incl. Securitization) 75,661.4 85,158.1 1,01,953.3 1,07,305.8 1,21,435.5 1,32,710.3 1,54,441.4
Less: Interest Expenses 38,981.8 44,028.7 50,743.8 52,094.0 54,090.1 64,857.9 76,366.0
Net Interest Income 36,679.6 41,129.4 51,209.5 55,211.8 67,345.4 67,852.4 78,075.4
Other income 1,502.1 754.0 761.6 758.3 2,479.4 2,301.8 1,010.6
Profit After Tax 12,642.1 12,378.1 11,782.0 12,573.4 15,680.2 24,605.4 25,639.9
EPS (Rs.) 55.72 54.56 51.93 55.42 69.11 108.45 113.01
Cost to income Ratio (%) 24.12% 23.46% 23.79% 21.15% 20.59% 20.63% 21.49%
NIM (% on AUM) 6.68% 6.61% 7.27% 7.16% 7.50% 7.52% 7.41%
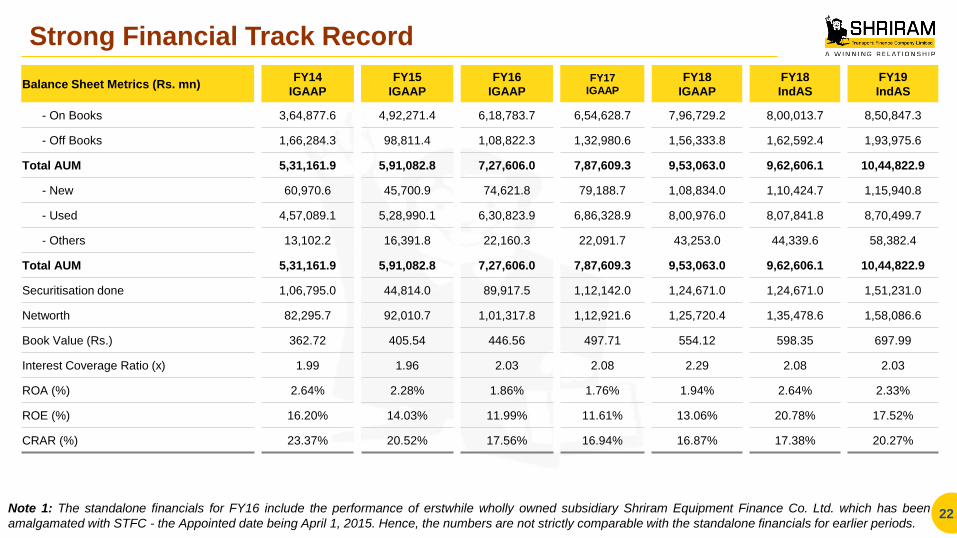
Strong Financial Track Record
22 Note 1: The standalone financials for FY16 include the performance of erstwhile wholly owned subsidiary Shriram Equipment Finance Co. Ltd. which has been
amalgamated with STFC - the Appointed date being April 1, 2015. Hence, the numbers are not strictly comparable with the standalone financials for earlier periods.
Balance Sheet Metrics (Rs. mn) FY14
IGAAP
FY15
IGAAP
FY16
IGAAP FY17
IGAAP
FY18
IGAAP FY18
IndAS
FY19
IndAS
- On Books 3,64,877.6 4,92,271.4 6,18,783.7 6,54,628.7 7,96,729.2 8,00,013.7 8,50,847.3
- Off Books 1,66,284.3 98,811.4 1,08,822.3 1,32,980.6 1,56,333.8 1,62,592.4 1,93,975.6
Total AUM 5,31,161.9 5,91,082.8 7,27,606.0 7,87,609.3 9,53,063.0 9,62,606.1 10,44,822.9
- New 60,970.6 45,700.9 74,621.8 79,188.7 1,08,834.0 1,10,424.7 1,15,940.8
- Used 4,57,089.1 5,28,990.1 6,30,823.9 6,86,328.9 8,00,976.0 8,07,841.8 8,70,499.7
- Others 13,102.2 16,391.8 22,160.3 22,091.7 43,253.0 44,339.6 58,382.4
Total AUM 5,31,161.9 5,91,082.8 7,27,606.0 7,87,609.3 9,53,063.0 9,62,606.1 10,44,822.9
Securitisation done 1,06,795.0 44,814.0 89,917.5 1,12,142.0 1,24,671.0 1,24,671.0 1,51,231.0
Networth 82,295.7 92,010.7 1,01,317.8 1,12,921.6 1,25,720.4 1,35,478.6 1,58,086.6
Book Value (Rs.) 362.72 405.54 446.56 497.71 554.12 598.35 697.99
Interest Coverage Ratio (x) 1.99 1.96 2.03 2.08 2.29 2.08 2.03
ROA (%) 2.64% 2.28% 1.86% 1.76% 1.94% 2.64% 2.33%
ROE (%) 16.20% 14.03% 11.99% 11.61% 13.06% 20.78% 17.52%
CRAR (%) 23.37% 20.52% 17.56% 16.94% 16.87% 17.38% 20.27%
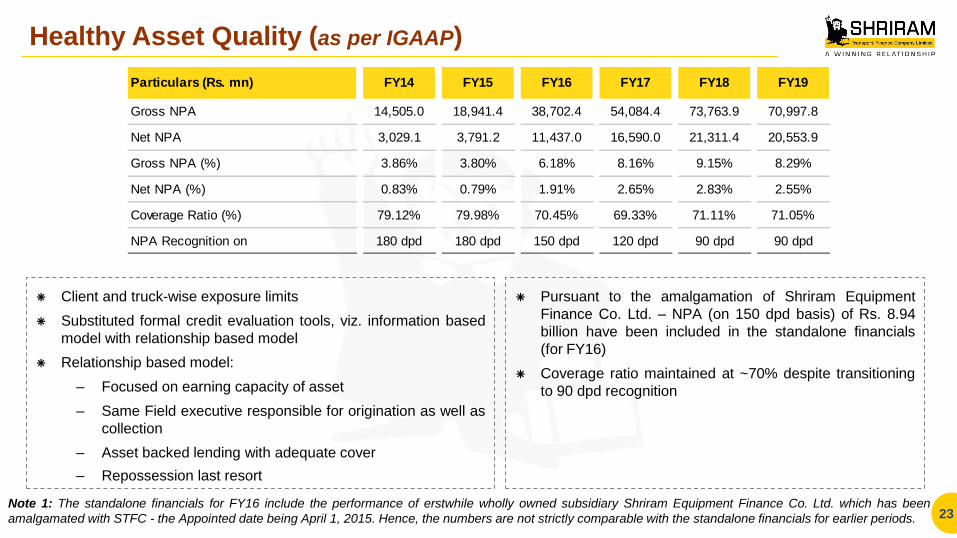
Client and truck-wise exposure limits
Substituted formal credit evaluation tools, viz. information based
model with relationship based model
Relationship based model:
– Focused on earning capacity of asset
– Same Field executive responsible for origination as well as
collection
– Asset backed lending with adequate cover
– Repossession last resort
Healthy Asset Quality (as per IGAAP)
23
Pursuant to the amalgamation of Shriram Equipment
Finance Co. Ltd. – NPA (on 150 dpd basis) of Rs. 8.94
billion have been included in the standalone financials
(for FY16)
Coverage ratio maintained at ~70% despite transitioning
to 90 dpd recognition
Note 1: The standalone financials for FY16 include the performance of erstwhile wholly owned subsidiary Shriram Equipment Finance Co. Ltd. which has been
amalgamated with STFC - the Appointed date being April 1, 2015. Hence, the numbers are not strictly comparable with the standalone financials for earlier periods.
Particulars (Rs. mn) FY14 FY15 FY16 FY17 FY18 FY19
Gross NPA 14,505.0 18,941.4 38,702.4 54,084.4 73,763.9 70,997.8
Net NPA 3,029.1 3,791.2 11,437.0 16,590.0 21,311.4 20,553.9
Gross NPA (%) 3.86% 3.80% 6.18% 8.16% 9.15% 8.29%
Net NPA (%) 0.83% 0.79% 1.91% 2.65% 2.83% 2.55%
Coverage Ratio (%) 79.12% 79.98% 70.45% 69.33% 71.11% 71.05%
NPA Recognition on 180 dpd 180 dpd 150 dpd 120 dpd 90 dpd 90 dpd
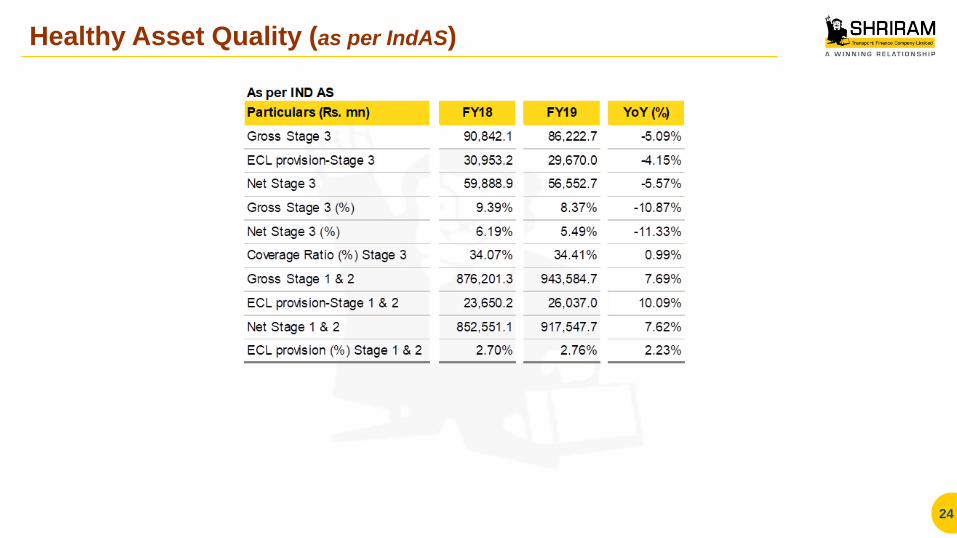
Healthy Asset Quality (as per IndAS)
24
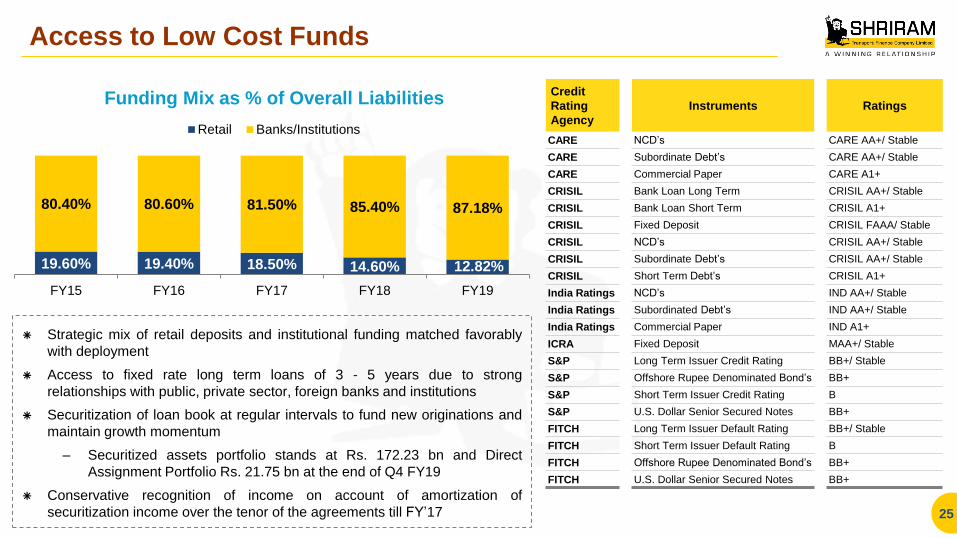
Access to Low Cost Funds
Strategic mix of retail deposits and institutional funding matched favorably
with deployment
Access to fixed rate long term loans of 3 - 5 years due to strong
relationships with public, private sector, foreign banks and institutions
Securitization of loan book at regular intervals to fund new originations and
maintain growth momentum
– Securitized assets portfolio stands at Rs. 172.23 bn and Direct
Assignment Portfolio Rs. 21.75 bn at the end of Q4 FY19
Conservative recognition of income on account of amortization of
securitization income over the tenor of the agreements till FY’17 25
19.60% 19.40% 18.50% 14.60% 12.82%
80.40% 80.60% 81.50% 85.40% 87.18%
FY15 FY16 FY17 FY18 FY19
Funding Mix as % of Overall Liabilities
Retail Banks/Institutions
Credit
Rating
Agency
Instruments Ratings
CARE NCD’s CARE AA+/ Stable
CARE Subordinate Debt’s CARE AA+/ Stable
CARE Commercial Paper CARE A1+
CRISIL Bank Loan Long Term CRISIL AA+/ Stable
CRISIL Bank Loan Short Term CRISIL A1+
CRISIL Fixed Deposit CRISIL FAAA/ Stable
CRISIL NCD’s CRISIL AA+/ Stable
CRISIL Subordinate Debt’s CRISIL AA+/ Stable
CRISIL Short Term Debt’s CRISIL A1+
India Ratings NCD’s IND AA+/ Stable
India Ratings Subordinated Debt’s IND AA+/ Stable
India Ratings Commercial Paper IND A1+
ICRA Fixed Deposit MAA+/ Stable
S&P Long Term Issuer Credit Rating BB+/ Stable
S&P Offshore Rupee Denominated Bond’s BB+
S&P Short Term Issuer Credit Rating B
S&P U.S. Dollar Senior Secured Notes BB+
FITCH Long Term Issuer Default Rating BB+/ Stable
FITCH Short Term Issuer Default Rating B
FITCH Offshore Rupee Denominated Bond’s BB+
FITCH U.S. Dollar Senior Secured Notes BB+
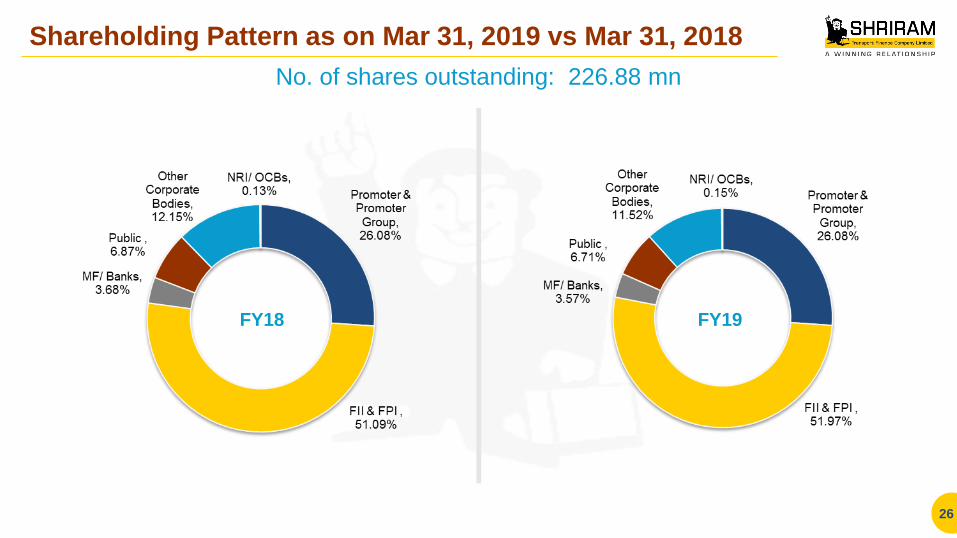
Shareholding Pattern as on Mar 31, 2019 vs Mar 31, 2018
26
No. of shares outstanding: 226.88 mn
FY18 FY19
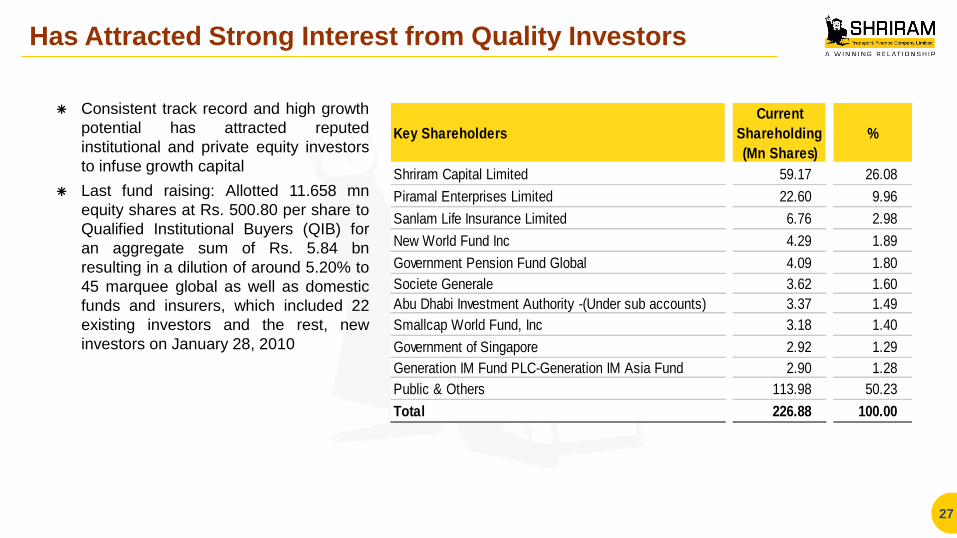
Has Attracted Strong Interest from Quality Investors
Consistent track record and high growth
potential has attracted reputed
institutional and private equity investors
to infuse growth capital
Last fund raising: Allotted 11.658 mn
equity shares at Rs. 500.80 per share to
Qualified Institutional Buyers (QIB) for
an aggregate sum of Rs. 5.84 bn
resulting in a dilution of around 5.20% to
45 marquee global as well as domestic
funds and insurers, which included 22
existing investors and the rest, new
investors on January 28, 2010
27
Key Shareholders
Current
Shareholding
(Mn Shares)
%
Shriram Capital Limited 59.17 26.08
Piramal Enterprises Limited 22.60 9.96
Sanlam Life Insurance Limited 6.76 2.98
New World Fund Inc 4.29 1.89
Government Pension Fund Global 4.09 1.80
Societe Generale 3.62 1.60
Abu Dhabi Investment Authority -(Under sub accounts) 3.37 1.49
Smallcap World Fund, Inc 3.18 1.40
Government of Singapore 2.92 1.29
Generation IM Fund PLC-Generation IM Asia Fund 2.90 1.28
Public & Others 113.98 50.23
Total 226.88 100.00
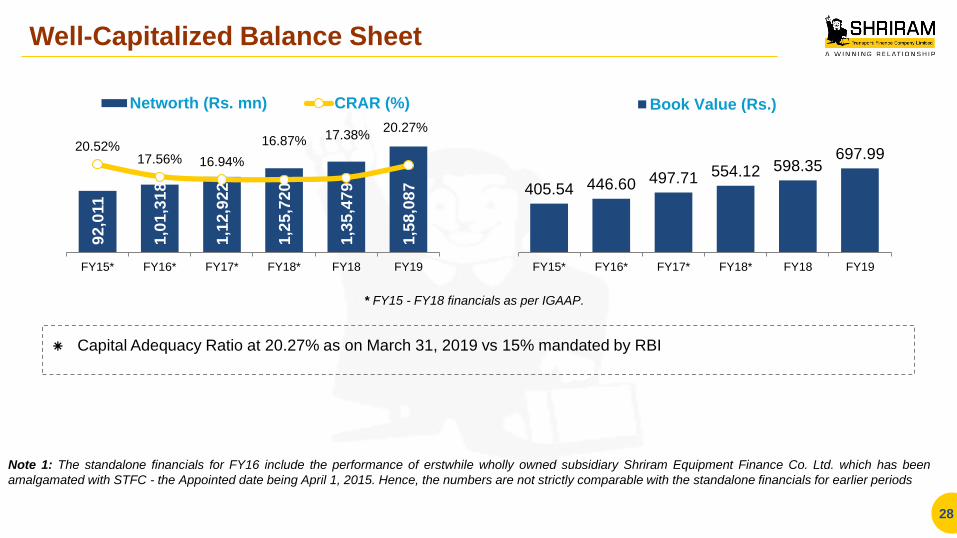
Well-Capitalized Balance Sheet
Capital Adequacy Ratio at 20.27% as on March 31, 2019 vs 15% mandated by RBI
28
92
,011
1,0
1,3
18
1,1
2,9
22
1,2
5,7
20
1,3
5,4
79
1,5
8,0
87
20.52% 17.56% 16.94%
16.87% 17.38% 20.27%
FY15* FY16* FY17* FY18* FY18 FY19
Networth (Rs. mn) CRAR (%)
405.54 446.60 497.71 554.12 598.35 697.99
FY15* FY16* FY17* FY18* FY18 FY19
Book Value (Rs.)
Note 1: The standalone financials for FY16 include the performance of erstwhile wholly owned subsidiary Shriram Equipment Finance Co. Ltd. which has been
amalgamated with STFC - the Appointed date being April 1, 2015. Hence, the numbers are not strictly comparable with the standalone financials for earlier periods
* FY15 - FY18 financials as per IGAAP.

RECENT PERFORMANCE
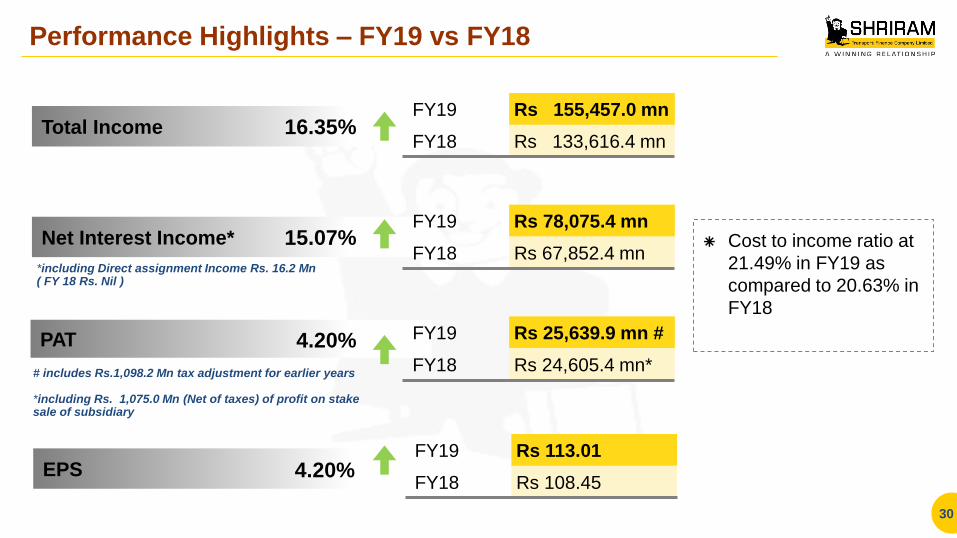
EPS
Performance Highlights – FY19 vs FY18
30
Total Income
Net Interest Income*
PAT
*including Direct assignment Income Rs. 16.2 Mn ( FY 18 Rs. Nil )
16.35%
15.07%
4.20%
4.20%
FY19 Rs 155,457.0 mn
FY18 Rs 133,616.4 mn
FY19 Rs 113.01
FY18 Rs 108.45
FY19 Rs 78,075.4 mn
FY18 Rs 67,852.4 mn
FY19 Rs 25,639.9 mn #
FY18 Rs 24,605.4 mn*
Cost to income ratio at
21.49% in FY19 as
compared to 20.63% in
FY18
# includes Rs.1,098.2 Mn tax adjustment for earlier years *including Rs. 1,075.0 Mn (Net of taxes) of profit on stake sale of subsidiary
PAT
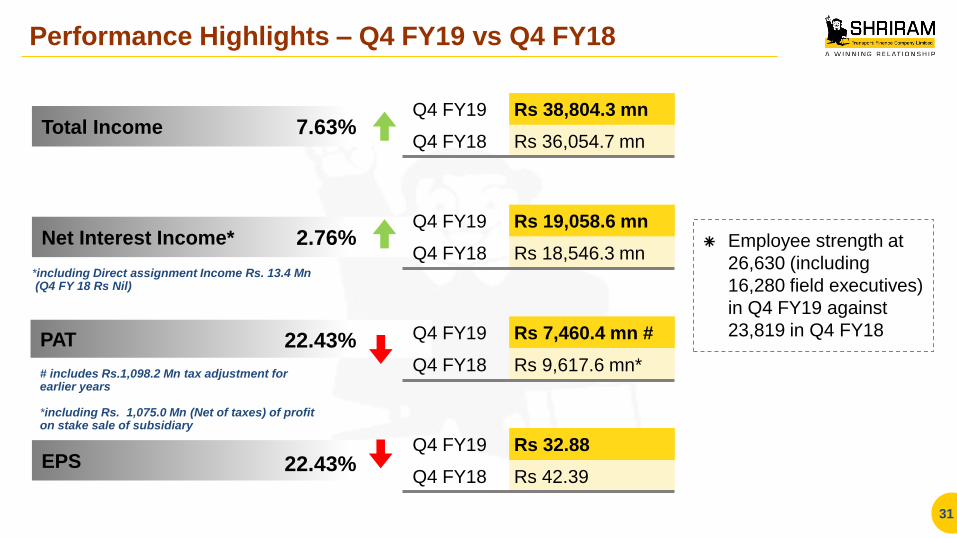
EPS
Performance Highlights – Q4 FY19 vs Q4 FY18
31
Total Income
Net Interest Income*
*including Direct assignment Income Rs. 13.4 Mn (Q4 FY 18 Rs Nil)
Employee strength at
26,630 (including
16,280 field executives)
in Q4 FY19 against
23,819 in Q4 FY18
7.63%
2.76%
22.43%
22.43%
Q4 FY19 Rs 38,804.3 mn
Q4 FY18 Rs 36,054.7 mn
Q4 FY19 Rs 32.88
Q4 FY18 Rs 42.39
Q4 FY19 Rs 19,058.6 mn
Q4 FY18 Rs 18,546.3 mn
Q4 FY19 Rs 7,460.4 mn #
Q4 FY18 Rs 9,617.6 mn* # includes Rs.1,098.2 Mn tax adjustment for earlier years *including Rs. 1,075.0 Mn (Net of taxes) of profit on stake sale of subsidiary
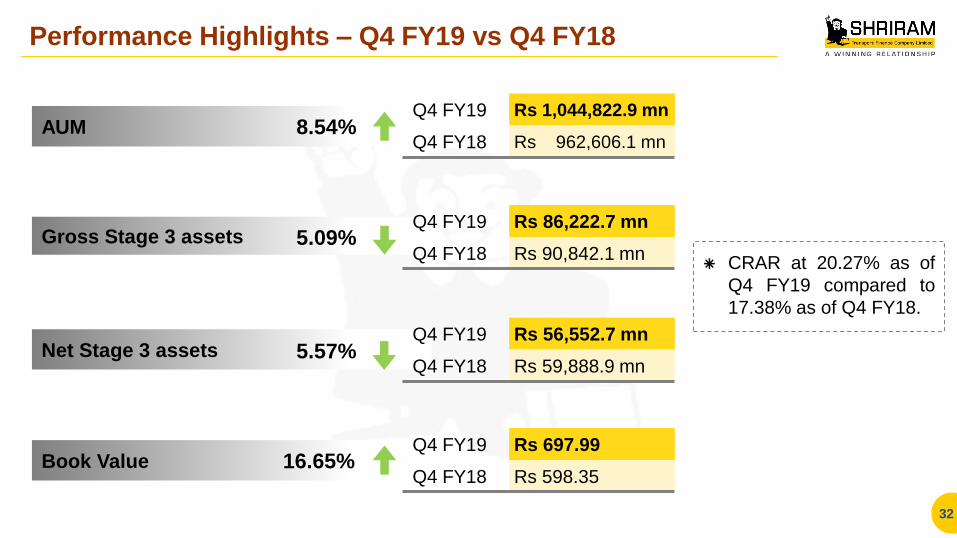
Performance Highlights – Q4 FY19 vs Q4 FY18
32
AUM
Gross Stage 3 assets
Net Stage 3 assets
Book Value
8.54%
5.09%
5.57%
16.65%
Q4 FY19 Rs 1,044,822.9 mn
Q4 FY18 Rs 962,606.1 mn
Q4 FY19 Rs 697.99
Q4 FY18 Rs 598.35
Q4 FY19 Rs 86,222.7 mn
Q4 FY18 Rs 90,842.1 mn
Q4 FY19 Rs 56,552.7 mn
Q4 FY18 Rs 59,888.9 mn
CRAR at 20.27% as of
Q4 FY19 compared to
17.38% as of Q4 FY18.
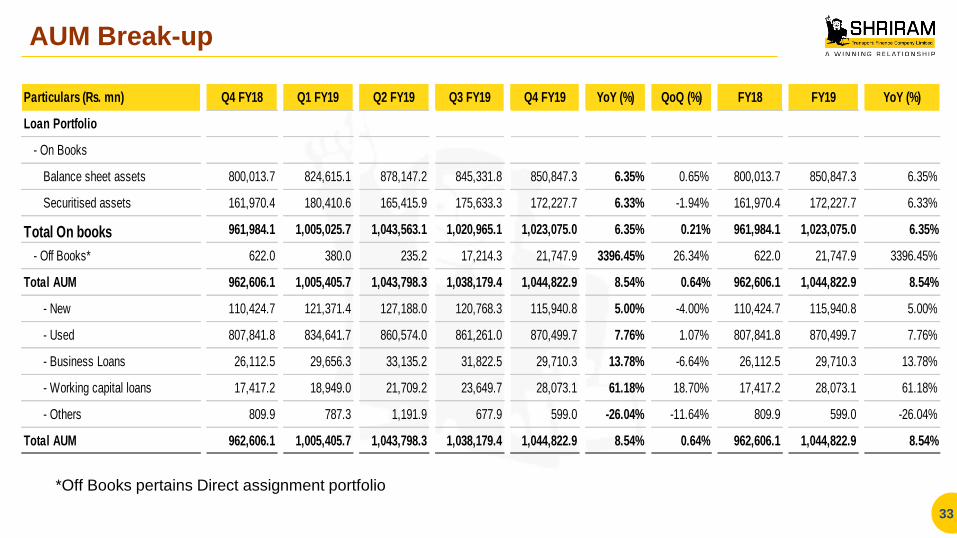
AUM Break-up
33
*Off Books pertains Direct assignment portfolio
Particulars (Rs. mn) Q4 FY18 Q1 FY19 Q2 FY19 Q3 FY19 Q4 FY19 YoY (%) QoQ (%) FY18 FY19 YoY (%)
Loan Portfolio
- On Books
Balance sheet assets 800,013.7 824,615.1 878,147.2 845,331.8 850,847.3 6.35% 0.65% 800,013.7 850,847.3 6.35%
Securitised assets 161,970.4 180,410.6 165,415.9 175,633.3 172,227.7 6.33% -1.94% 161,970.4 172,227.7 6.33%
Total On books 961,984.1 1,005,025.7 1,043,563.1 1,020,965.1 1,023,075.0 6.35% 0.21% 961,984.1 1,023,075.0 6.35%
- Off Books* 622.0 380.0 235.2 17,214.3 21,747.9 3396.45% 26.34% 622.0 21,747.9 3396.45%
Total AUM 962,606.1 1,005,405.7 1,043,798.3 1,038,179.4 1,044,822.9 8.54% 0.64% 962,606.1 1,044,822.9 8.54%
- New 110,424.7 121,371.4 127,188.0 120,768.3 115,940.8 5.00% -4.00% 110,424.7 115,940.8 5.00%
- Used 807,841.8 834,641.7 860,574.0 861,261.0 870,499.7 7.76% 1.07% 807,841.8 870,499.7 7.76%
- Business Loans 26,112.5 29,656.3 33,135.2 31,822.5 29,710.3 13.78% -6.64% 26,112.5 29,710.3 13.78%
- Working capital loans 17,417.2 18,949.0 21,709.2 23,649.7 28,073.1 61.18% 18.70% 17,417.2 28,073.1 61.18%
- Others 809.9 787.3 1,191.9 677.9 599.0 -26.04% -11.64% 809.9 599.0 -26.04%
Total AUM 962,606.1 1,005,405.7 1,043,798.3 1,038,179.4 1,044,822.9 8.54% 0.64% 962,606.1 1,044,822.9 8.54%
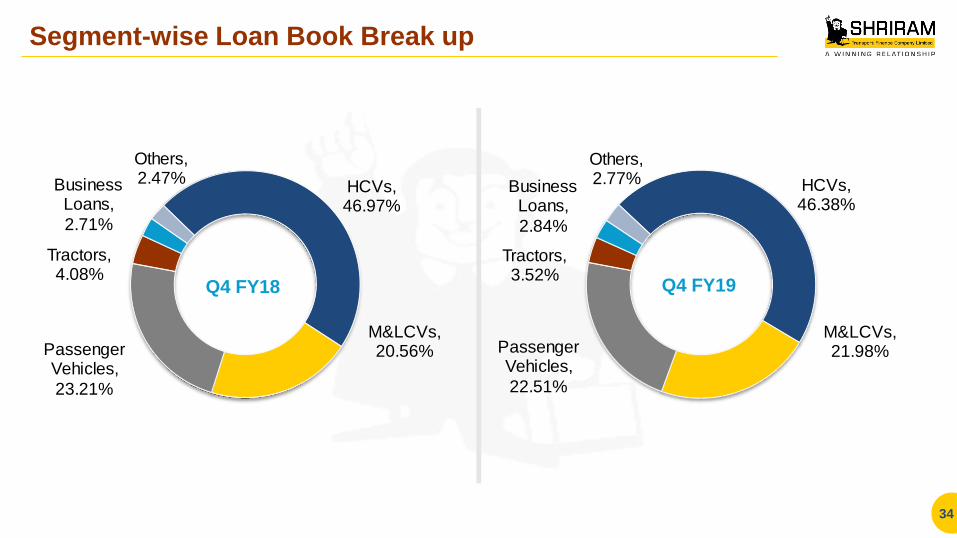
Segment-wise Loan Book Break up
34
Q4 FY18 Q4 FY19
HCVs, 46.97%
M&LCVs, 20.56%Passenger
Vehicles,
23.21%
Tractors, 4.08%
Business Loans,
2.71%
Others, 2.47% HCVs,
46.38%
M&LCVs, 21.98%Passenger
Vehicles,
22.51%
Tractors, 3.52%
Business Loans,
2.84%
Others, 2.77%
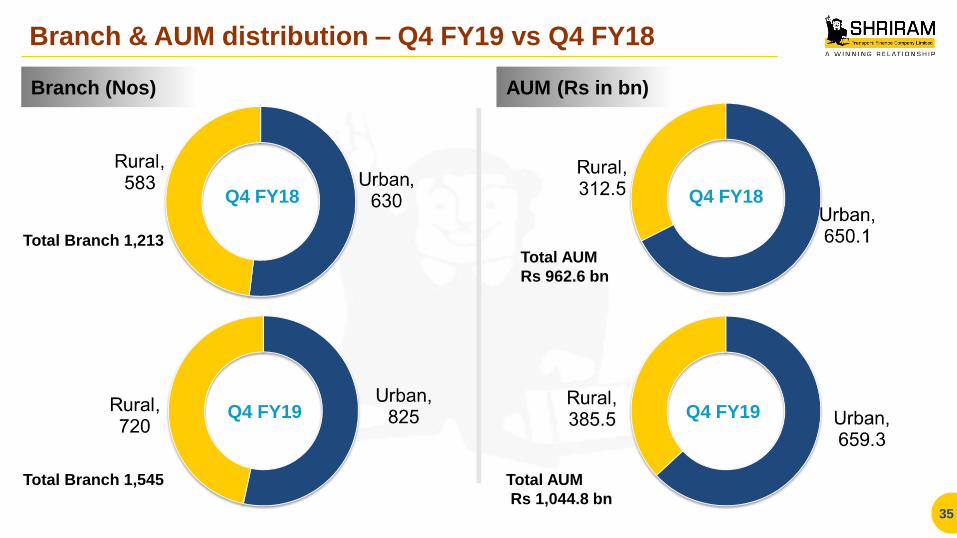
Branch & AUM distribution – Q4 FY19 vs Q4 FY18
35
Branch (Nos) AUM (Rs in bn)
Total AUM
Rs 962.6 bn
Total AUM
Rs 1,044.8 bn
Total Branch 1,213
Total Branch 1,545
Q4 FY18
Q4 FY19
Q4 FY18
Q4 FY19
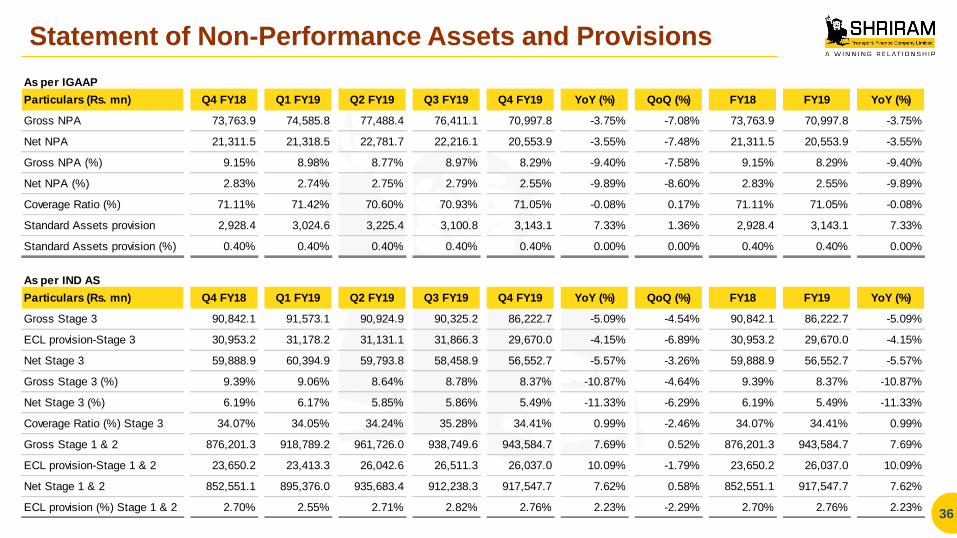
Statement of Non-Performance Assets and Provisions
36
As per IGAAP
Particulars (Rs. mn) Q4 FY18 Q1 FY19 Q2 FY19 Q3 FY19 Q4 FY19 YoY (%) QoQ (%) FY18 FY19 YoY (%)
Gross NPA 73,763.9 74,585.8 77,488.4 76,411.1 70,997.8 -3.75% -7.08% 73,763.9 70,997.8 -3.75%
Net NPA 21,311.5 21,318.5 22,781.7 22,216.1 20,553.9 -3.55% -7.48% 21,311.5 20,553.9 -3.55%
Gross NPA (%) 9.15% 8.98% 8.77% 8.97% 8.29% -9.40% -7.58% 9.15% 8.29% -9.40%
Net NPA (%) 2.83% 2.74% 2.75% 2.79% 2.55% -9.89% -8.60% 2.83% 2.55% -9.89%
Coverage Ratio (%) 71.11% 71.42% 70.60% 70.93% 71.05% -0.08% 0.17% 71.11% 71.05% -0.08%
Standard Assets provision 2,928.4 3,024.6 3,225.4 3,100.8 3,143.1 7.33% 1.36% 2,928.4 3,143.1 7.33%
Standard Assets provision (%) 0.40% 0.40% 0.40% 0.40% 0.40% 0.00% 0.00% 0.40% 0.40% 0.00%
As per IND AS
Particulars (Rs. mn) Q4 FY18 Q1 FY19 Q2 FY19 Q3 FY19 Q4 FY19 YoY (%) QoQ (%) FY18 FY19 YoY (%)
Gross Stage 3 90,842.1 91,573.1 90,924.9 90,325.2 86,222.7 -5.09% -4.54% 90,842.1 86,222.7 -5.09%
ECL provision-Stage 3 30,953.2 31,178.2 31,131.1 31,866.3 29,670.0 -4.15% -6.89% 30,953.2 29,670.0 -4.15%
Net Stage 3 59,888.9 60,394.9 59,793.8 58,458.9 56,552.7 -5.57% -3.26% 59,888.9 56,552.7 -5.57%
Gross Stage 3 (%) 9.39% 9.06% 8.64% 8.78% 8.37% -10.87% -4.64% 9.39% 8.37% -10.87%
Net Stage 3 (%) 6.19% 6.17% 5.85% 5.86% 5.49% -11.33% -6.29% 6.19% 5.49% -11.33%
Coverage Ratio (%) Stage 3 34.07% 34.05% 34.24% 35.28% 34.41% 0.99% -2.46% 34.07% 34.41% 0.99%
Gross Stage 1 & 2 876,201.3 918,789.2 961,726.0 938,749.6 943,584.7 7.69% 0.52% 876,201.3 943,584.7 7.69%
ECL provision-Stage 1 & 2 23,650.2 23,413.3 26,042.6 26,511.3 26,037.0 10.09% -1.79% 23,650.2 26,037.0 10.09%
Net Stage 1 & 2 852,551.1 895,376.0 935,683.4 912,238.3 917,547.7 7.62% 0.58% 852,551.1 917,547.7 7.62%
ECL provision (%) Stage 1 & 2 2.70% 2.55% 2.71% 2.82% 2.76% 2.23% -2.29% 2.70% 2.76% 2.23%

P&L Statement
37 *Before Provisions & Contingencies
** FY18 Financials as per IGAAP
Particulars (Rs. mn) Q4 FY18 Q1 FY19 Q2 FY19 Q3 FY19 Q4 FY19 YoY (%) QoQ (%) FY18** FY18 FY19 YoY (%)
Interest income 35,718.1 37,116.6 39,184.0 39,691.2 38,449.6 7.65% -3.13% 121,435.5 132,710.3 154,441.4 16.37%
Interest expended 17,171.8 18,887.6 18,674.9 19,412.5 19,391.0 12.92% -0.11% 54,090.1 64,857.9 76,366.0 17.74%
Net interest income 18,546.3 18,229.0 20,509.1 20,278.7 19,058.6 2.76% -6.02% 67,345.4 67,852.4 78,075.4 15.07%
Other Operating Income 36.5 41.9 59.0 67.4 73.4 101.10% 8.90% 121.0 121.0 241.8 99.83%
Operating income 18,582.8 18,270.9 20,568.1 20,346.1 19,132.0 2.96% -5.97% 67,466.4 67,973.4 78,317.2 15.22%
Operating expenditure 4,227.6 4,348.4 4,515.8 4,328.4 4,288.0 1.43% -0.93% 14,885.3 14,913.0 17,480.7 17.22%
Core operating profit * 14,355.2 13,922.5 16,052.3 16,017.7 14,844.0 3.41% -7.33% 52,581.1 53,060.4 60,836.5 14.66%
Other income 1,697.2 134.7 173.8 183.8 276.4 -83.71% 50.38% 2,358.4 2,180.8 768.8 -64.75%
Operating profit 16,052.4 14,057.2 16,226.1 16,201.5 15,120.4 -5.81% -6.67% 54,939.5 55,241.2 61,605.3 11.52%
Loan Losses & Provision 971.5 5,226.7 6,835.8 6,362.1 5,398.0 455.64% -15.15% 31,221.2 17,223.2 23,822.6 38.32%
Profit before tax 15,080.9 8,830.5 9,390.3 9,839.4 9,722.4 -35.53% -1.19% 23,718.3 38,018.0 37,782.7 -0.62%
Tax Expense 5,463.3 3,101.4 3,294.5 3,484.9 2,262.0 -58.60% -35.09% 8,038.1 13,412.6 12,142.8 -9.47%
Profit after tax 9,617.6 5,729.1 6,095.8 6,354.5 7,460.4 -22.43% 17.40% 15,680.2 24,605.4 25,639.9 4.20%
Other comprehensive Income (Net) -3.1 -11.8 -0.7 -12.6 1.9 -161.29% -115.08% 0.0 -12.9 -23.2 79.84%
Total Comprehensive Income 9,614.5 5,717.3 6,095.1 6,341.9 7,462.3 -22.38% 17.67% 15,680.2 24,592.5 25,616.7 4.16%
EPS (Rs) 42.39 25.25 26.86 28.02 32.88 -22.43% 17.34% 69.11 108.45 113.01 4.20%
Tier I CRAR % 14.47% 14.34% 14.27% 14.96% 15.62% 7.97% 4.40% 14.24% 14.47% 15.62% 7.97%
Tier II CRAR % 2.92% 2.58% 2.42% 4.76% 4.65% 59.48% -2.33% 2.63% 2.92% 4.65% 59.48%
Total CRAR % 17.38% 16.92% 16.69% 19.72% 20.27% 16.61% 2.78% 16.87% 17.38% 20.27% 16.61%
Book Value (Rs) 598.35 623.55 643.18 665.10 697.99 16.65% 4.95% 554.12 598.35 697.99 16.65%
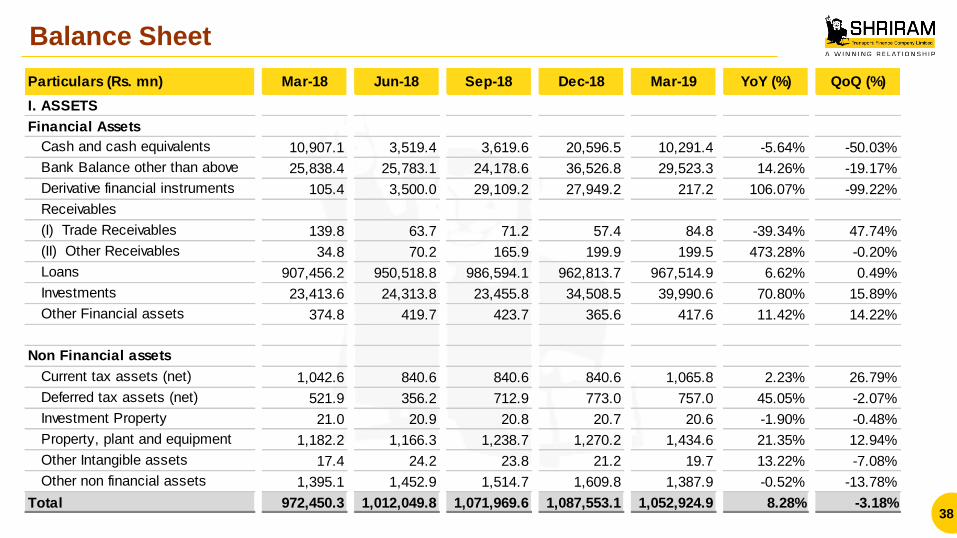
Balance Sheet
38
Particulars (Rs. mn) Mar-18 Jun-18 Sep-18 Dec-18 Mar-19 YoY (%) QoQ (%)
I. ASSETS
Financial Assets
Cash and cash equivalents 10,907.1 3,519.4 3,619.6 20,596.5 10,291.4 -5.64% -50.03%
Bank Balance other than above 25,838.4 25,783.1 24,178.6 36,526.8 29,523.3 14.26% -19.17%
Derivative financial instruments 105.4 3,500.0 29,109.2 27,949.2 217.2 106.07% -99.22%
Receivables
(I) Trade Receivables 139.8 63.7 71.2 57.4 84.8 -39.34% 47.74%
(II) Other Receivables 34.8 70.2 165.9 199.9 199.5 473.28% -0.20%
Loans 907,456.2 950,518.8 986,594.1 962,813.7 967,514.9 6.62% 0.49%
Investments 23,413.6 24,313.8 23,455.8 34,508.5 39,990.6 70.80% 15.89%
Other Financial assets 374.8 419.7 423.7 365.6 417.6 11.42% 14.22%
Non Financial assets
Current tax assets (net) 1,042.6 840.6 840.6 840.6 1,065.8 2.23% 26.79%
Deferred tax assets (net) 521.9 356.2 712.9 773.0 757.0 45.05% -2.07%
Investment Property 21.0 20.9 20.8 20.7 20.6 -1.90% -0.48%
Property, plant and equipment 1,182.2 1,166.3 1,238.7 1,270.2 1,434.6 21.35% 12.94%
Other Intangible assets 17.4 24.2 23.8 21.2 19.7 13.22% -7.08%
Other non financial assets 1,395.1 1,452.9 1,514.7 1,609.8 1,387.9 -0.52% -13.78%
Total 972,450.3 1,012,049.8 1,071,969.6 1,087,553.1 1,052,924.9 8.28% -3.18%
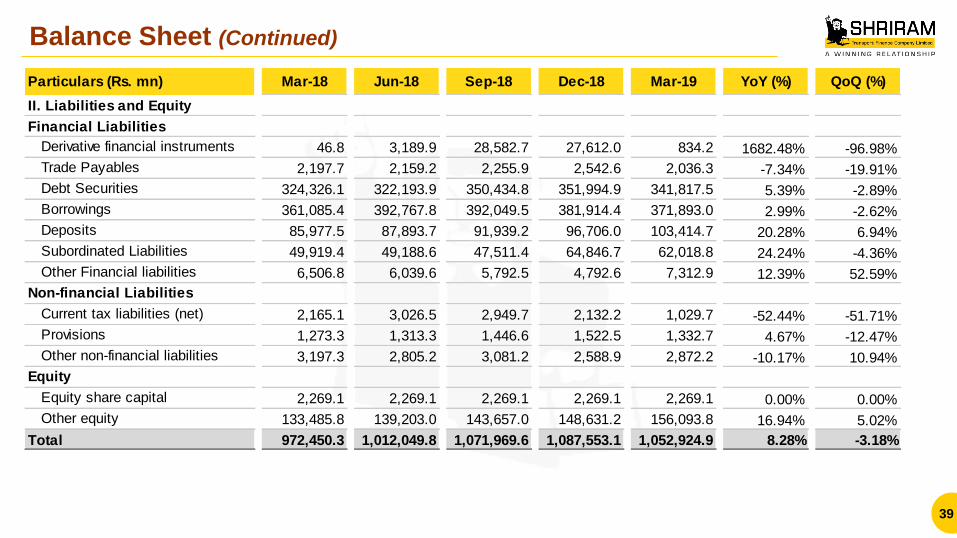
Balance Sheet (Continued)
39
Particulars (Rs. mn) Mar-18 Jun-18 Sep-18 Dec-18 Mar-19 YoY (%) QoQ (%)
II. Liabilities and Equity
Financial Liabilities
Derivative financial instruments 46.8 3,189.9 28,582.7 27,612.0 834.2 1682.48% -96.98%
Trade Payables 2,197.7 2,159.2 2,255.9 2,542.6 2,036.3 -7.34% -19.91%
Debt Securities 324,326.1 322,193.9 350,434.8 351,994.9 341,817.5 5.39% -2.89%
Borrowings 361,085.4 392,767.8 392,049.5 381,914.4 371,893.0 2.99% -2.62%
Deposits 85,977.5 87,893.7 91,939.2 96,706.0 103,414.7 20.28% 6.94%
Subordinated Liabilities 49,919.4 49,188.6 47,511.4 64,846.7 62,018.8 24.24% -4.36%
Other Financial liabilities 6,506.8 6,039.6 5,792.5 4,792.6 7,312.9 12.39% 52.59%
Non-financial Liabilities
Current tax liabilities (net) 2,165.1 3,026.5 2,949.7 2,132.2 1,029.7 -52.44% -51.71%
Provisions 1,273.3 1,313.3 1,446.6 1,522.5 1,332.7 4.67% -12.47%
Other non-financial liabilities 3,197.3 2,805.2 3,081.2 2,588.9 2,872.2 -10.17% 10.94%
Equity
Equity share capital 2,269.1 2,269.1 2,269.1 2,269.1 2,269.1 0.00% 0.00%
Other equity 133,485.8 139,203.0 143,657.0 148,631.2 156,093.8 16.94% 5.02%
Total 972,450.3 1,012,049.8 1,071,969.6 1,087,553.1 1,052,924.9 8.28% -3.18%
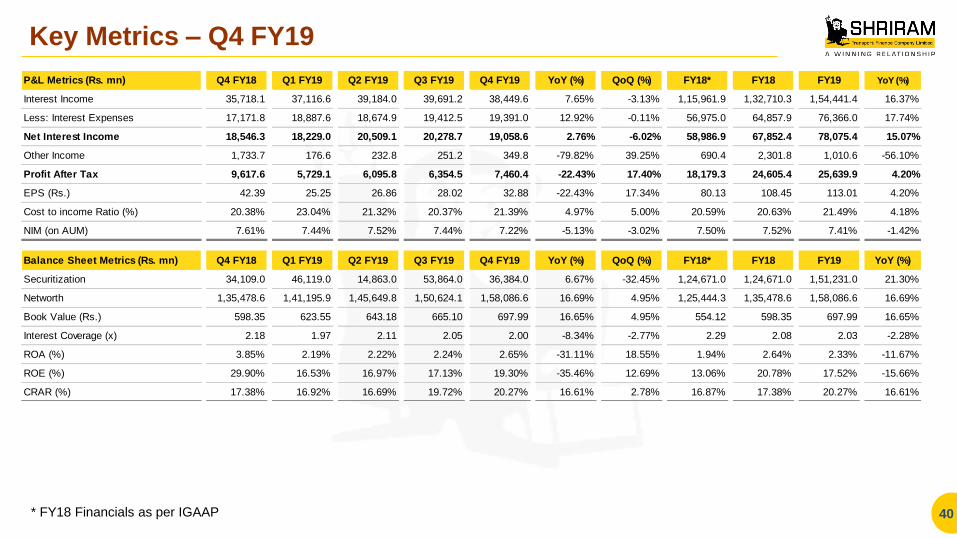
Key Metrics – Q4 FY19
40 * FY18 Financials as per IGAAP
P&L Metrics (Rs. mn) Q4 FY18 Q1 FY19 Q2 FY19 Q3 FY19 Q4 FY19 YoY (%) QoQ (%) FY18* FY18 FY19 YoY (%)
Interest Income 35,718.1 37,116.6 39,184.0 39,691.2 38,449.6 7.65% -3.13% 1,15,961.9 1,32,710.3 1,54,441.4 16.37%
Less: Interest Expenses 17,171.8 18,887.6 18,674.9 19,412.5 19,391.0 12.92% -0.11% 56,975.0 64,857.9 76,366.0 17.74%
Net Interest Income 18,546.3 18,229.0 20,509.1 20,278.7 19,058.6 2.76% -6.02% 58,986.9 67,852.4 78,075.4 15.07%
Other Income 1,733.7 176.6 232.8 251.2 349.8 -79.82% 39.25% 690.4 2,301.8 1,010.6 -56.10%
Profit After Tax 9,617.6 5,729.1 6,095.8 6,354.5 7,460.4 -22.43% 17.40% 18,179.3 24,605.4 25,639.9 4.20%
EPS (Rs.) 42.39 25.25 26.86 28.02 32.88 -22.43% 17.34% 80.13 108.45 113.01 4.20%
Cost to income Ratio (%) 20.38% 23.04% 21.32% 20.37% 21.39% 4.97% 5.00% 20.59% 20.63% 21.49% 4.18%
NIM (on AUM) 7.61% 7.44% 7.52% 7.44% 7.22% -5.13% -3.02% 7.50% 7.52% 7.41% -1.42%
Balance Sheet Metrics (Rs. mn) Q4 FY18 Q1 FY19 Q2 FY19 Q3 FY19 Q4 FY19 YoY (%) QoQ (%) FY18* FY18 FY19 YoY (%)
Securitization 34,109.0 46,119.0 14,863.0 53,864.0 36,384.0 6.67% -32.45% 1,24,671.0 1,24,671.0 1,51,231.0 21.30%
Networth 1,35,478.6 1,41,195.9 1,45,649.8 1,50,624.1 1,58,086.6 16.69% 4.95% 1,25,444.3 1,35,478.6 1,58,086.6 16.69%
Book Value (Rs.) 598.35 623.55 643.18 665.10 697.99 16.65% 4.95% 554.12 598.35 697.99 16.65%
Interest Coverage (x) 2.18 1.97 2.11 2.05 2.00 -8.34% -2.77% 2.29 2.08 2.03 -2.28%
ROA (%) 3.85% 2.19% 2.22% 2.24% 2.65% -31.11% 18.55% 1.94% 2.64% 2.33% -11.67%
ROE (%) 29.90% 16.53% 16.97% 17.13% 19.30% -35.46% 12.69% 13.06% 20.78% 17.52% -15.66%
CRAR (%) 17.38% 16.92% 16.69% 19.72% 20.27% 16.61% 2.78% 16.87% 17.38% 20.27% 16.61%
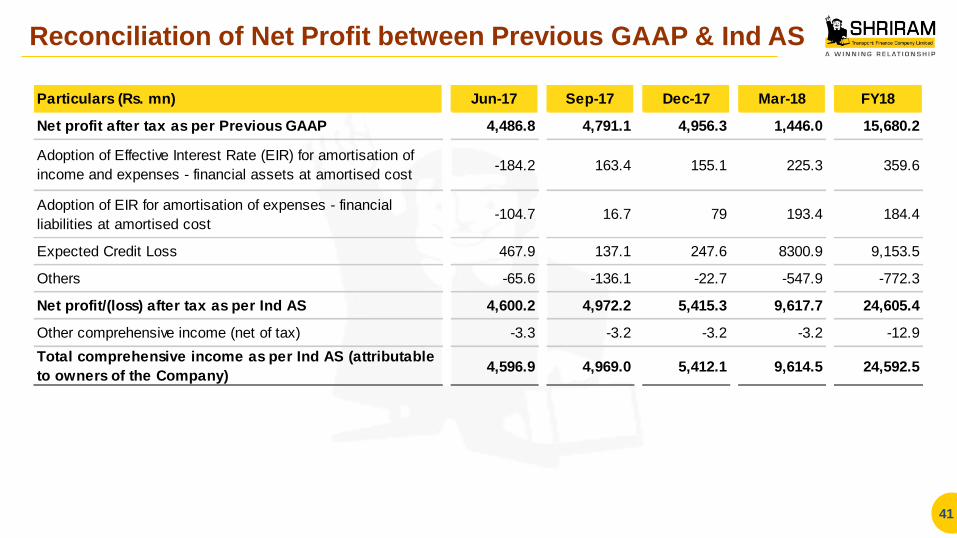
Reconciliation of Net Profit between Previous GAAP & Ind AS
41
Particulars (Rs. mn) Jun-17 Sep-17 Dec-17 Mar-18 FY18
Net profit after tax as per Previous GAAP 4,486.8 4,791.1 4,956.3 1,446.0 15,680.2
Adoption of Effective Interest Rate (EIR) for amortisation of
income and expenses - financial assets at amortised cost-184.2 163.4 155.1 225.3 359.6
Adoption of EIR for amortisation of expenses - financial
liabilities at amortised cost-104.7 16.7 79 193.4 184.4
Expected Credit Loss 467.9 137.1 247.6 8300.9 9,153.5
Others -65.6 -136.1 -22.7 -547.9 -772.3
Net profit/(loss) after tax as per Ind AS 4,600.2 4,972.2 5,415.3 9,617.7 24,605.4
Other comprehensive income (net of tax) -3.3 -3.2 -3.2 -3.2 -12.9
Total comprehensive income as per Ind AS (attributable
to owners of the Company)4,596.9 4,969.0 5,412.1 9,614.5 24,592.5
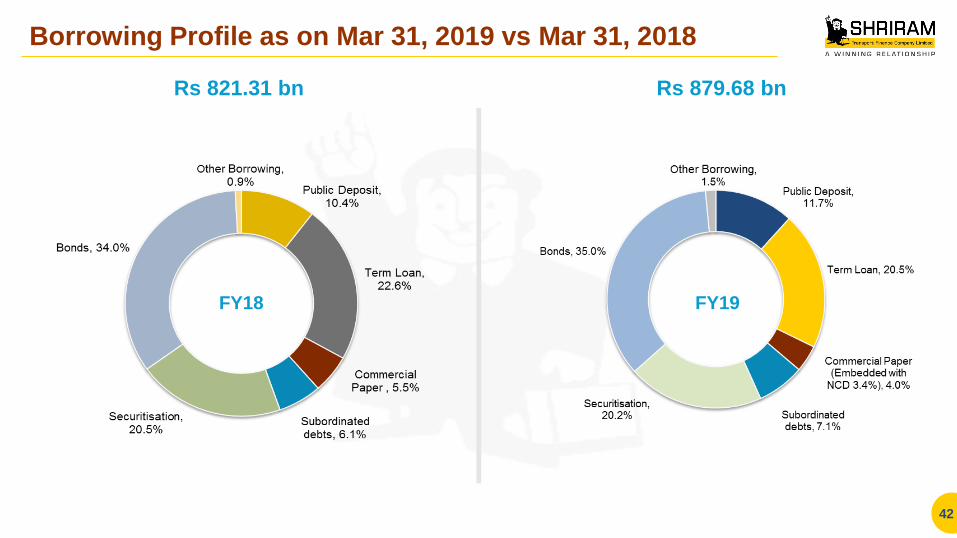
Borrowing Profile as on Mar 31, 2019 vs Mar 31, 2018
42
Rs 821.31 bn Rs 879.68 bn
FY18 FY19

Contact Us
43
For any Investor Relations
queries please contact
Sanjay K. Mundra Shriram Transport Finance Co. Ltd
Email: [email protected]
Tel. No. +91-22-4095 9507
About Us
About Shriram Transport Finance Co. Ltd.
Shriram Transport Finance Co Ltd. is the largest asset financing NBFC in India with Assets on Balance sheet of Rs. 104,482.29
crores. The company is a leader in organized financing of pre-owned trucks with strategic presence in 5-10 year old trucks. It has a
pan-India presence with a network of 1,545 branches, and employs 26,630 employees including 16,280 field officers. The
company has built a strong customer base of approx. 2.03 mn. Over the past 39 years, it has developed strong competencies in
the areas of loan origination, valuation of pre-owned trucks and collection. It has a vertically integrated business model and offers a
number of products which include: Pre-owned CV financing, New CV financing and other loans like accidental repair loans, tyre
loans and working capital finance, etc. For more information please visit www.stfc.in
Forward Looking Statement
Certain statements in this document with words or phrases such as “will”, “should”, etc., and similar expressions or variation of
these expressions or those concerning our future prospects are forward looking statements. Actual results may differ materially
from those suggested by the forward looking statements due to a number of risks or uncertainties associated with the expectations.
These risks and uncertainties include, but are not limited to, our ability to successfully implement our strategy and changes in
government policies. The company may, from time to time, make additional written and oral forward looking statements, including
statements contained in the company’s filings with the stock exchanges and our reports to shareholders. The company does not
undertake to update any forward-looking statements that may be made from time to time by or on behalf of the company.
44

Thank You
Related Documents