CHAPTER 1: - INTRODUCTION 1.1HISTORY OF TEXTILE The history of textile is almost as old as that of human civilization and as time moves on the history of textile has further enriched itself. In the 6th and 7th century BC, the oldest recorded indication of using fiber comes with the invention of flax and wool fabric at the excavation of Swiss lake inhabitants. In India the culture of silk was introduced in 400AD, while spinning of cotton traces back to 3000BC. In China, the discovery and consequent development of sericulture and spin silk methods got initiated at 2640 BC while in Egypt the art of spinning linen and weaving developed in 3400 BC. The discovery of machines and their widespread application in processing natural fibers was a direct outcome of the industrial revolution of the 18th and 19th centuries. The discoveries of various synthetic fibers like nylon created a wider market for textile products and gradually led to the invention of new and improved sources of natural fiber. The development of transportation and communication facilities facilitated the path of transaction of localized skills and textile art among various countries. 1.1.1 TEXTILE HISTORY IN INDIA Indian textile enjoys a rich heritage and the origin of textiles in India traces back to the Indus valley Civilization where people used homespun cotton for weaving their clothes. Rig-Veda, 1 | Page

Welcome message from author
This document is posted to help you gain knowledge. Please leave a comment to let me know what you think about it! Share it to your friends and learn new things together.
Transcript
CHAPTER 1: - INTRODUCTION
1.1HISTORY OF TEXTILE
The history of textile is almost as old as that of human
civilization and as time moves on the history of textile has
further enriched itself. In the 6th and 7th century BC, the
oldest recorded indication of using fiber comes with the
invention of flax and wool fabric at the excavation of Swiss lake
inhabitants. In India the culture of silk was introduced in
400AD, while spinning of cotton traces back to 3000BC. In China,
the discovery and consequent development of sericulture and spin
silk methods got initiated at 2640 BC while in Egypt the art of
spinning linen and weaving developed in 3400 BC. The discovery of
machines and their widespread application in processing natural
fibers was a direct outcome of the industrial revolution of the
18th and 19th centuries. The discoveries of various synthetic
fibers like nylon created a wider market for textile products and
gradually led to the invention of new and improved sources of
natural fiber. The development of transportation and
communication facilities facilitated the path of transaction of
localized skills and textile art among various countries.
1.1.1 TEXTILE HISTORY IN INDIA
Indian textile enjoys a rich heritage and the origin of textiles
in India traces back to the Indus valley Civilization where
people used homespun cotton for weaving their clothes. Rig-Veda,
1 | P a g e
the earliest of the Veda contains the literary information about
textiles and it refers to weaving. Ramayana and Mahabharata, the
eminent Indian epics depict the existence of wide variety of
fabrics in ancient India. These epics refer both to rich and
stylized garment worn by the aristocrats and ordinary simple
clothes worn by the common people. The contemporary Indian
textile not only reflects the splendid past but also cater to the
requirements of the modern times.
Each and every region of India contributes in creating a myriad
of textile tradition. The hilly region of the country produces a
rich variety of woolen textiles. The pashmina and shahtoosh
shawls of Kashmir, shawls and woolen garments of Himachal Pradesh
and other north eastern states provides excellent examples of
world famous woolen Indian textiles. The barren and semi barren
regions like Rajasthan and Gujarat usually prefers embroidered
bright colored textiles. The coastal areas of the south eastern
regions prefer light colored fabrics and particularly cotton and
silk textiles are very popular over here. The home furnishing
utilitarian textile products like bedspreads and sheets, pillows
and cushions, linens and mats, curtains and napkins, carpets and
rugs and many such other items are produced by all parts of the
country.
Textiles are GUJARAT'S forte and one can find an immense variety
of textile traditions here that range from robust folk textiles
2 | P a g e
to fine brocades. In fact, the oldest known printed fabrics from
India were the resist dyed and printed cottons of Gujarat. These
printed fabric traditions are still going strong in Gujarat and
are considered an essential part of any fashionable Indian
woman's wardrobe. The ajrakh prints of the Kutch region and the
sodagiri prints of Paithapur are just two examples of Gujarat's
excellently printed textiles. The Matani-Pachedi print produced
by the Vaghari community priests in honor of the mother goddess
is another example of Gujarati skills in printing. Gujarat also
boasts of the patola, one of the finest hand woven textiles found
in Patan. In this process the warp and the weft are first tie-
dyed and then woven together, an act requiring highly specialized
skills.
One cannot ignore the intricate bandhej (tie-dyed fabric) of
Jamnagar, Mandavi, and Bhuj, which are used for wedding outfits
such as the gharchola odhni and saris. Brocades woven in
Jamnagar, Mehsana, Ahmedabad, and Surat with traditional patterns
of popat vel, (stylised parrot-flower borders) or asharfi
(circular gold coin) were once highly prized possessions.
Unfortunately, brocades are no longer produced, as they were
earlier. The only types available now are the brocade borders
woven on the power loom in Surat or simple patterns done in
Mehsana. Gujarat also has a vibrant mashru tradition, a fabric
with an interesting story behind its creation.
3 | P a g e
Mashru is woven with a combination of silk and cotton, the cotton
being the lower layer in touch with the skin. The fabric was
woven for Muslim men who were prohibited from wearing pure silk.
Though mashru is found all over India, Gujarati mashru has bold
patterns and colors that lend it an attractiveness of its own.
SURAT, the financial hub of the state of Gujarat, is known as the
textile city of Gujarat. And, the epithet is perfectly suited to
the city. The textile industry is one of the oldest and the most
widespread industries in Surat. A major part of the city's
population is associated with the textile industry. Surat is well
known for its synthetic products market. It is mainly engaged in
the production and trading of synthetic textile products.
Nearly 30 million metres of raw fabric and 25 million metres of
processed fabric are produced in Surat daily. The city has
several textile markets that exist since times immemorial. Zampa
Bazaar, Bombay Market, JJ Textile Market and Jash Market are
among them. Sachin, Kadodra and Pandesara are the areas of Surat
where manufacturing is mainly concentrated.
1.2 CONTRIBUTION OF TEXTILE INDUSRTY TO INDIAN ECONOMY
The textile industry is one of the leading sectors in the Indian
economy as it contributes nearly 14 percent to the total
industrial production. The textile industry in India is claimed
to be the biggest revenue earners in terms of foreign exchange
4 | P a g e
among all other industrial sectors in India. This industry
provides direct employment to around 35 million people, which has
made it one of the most advantageous industrial sectors in the
country. Some of the important benefits offered by the Indian
textile industry are as follows:
India covers 61 percent of the international textile market.
India covers 22 percent of the global market.
India is known to be the third largest manufacturer of cotton
across the globe.
India claims to be the second largest manufacturer as well as
provider of cotton yarn and textiles in the world.
India holds around 25 percent share in the cotton yarn
industry across the globe.
India contributes to around 12 percent of the world's
production of cotton yarn and textiles.
1.3 COMPANY DETAILS
COMPANY NAME: SHREE RAM DESIGNS PRIVATE LIMITED
5 | P a g e
FOUNDER/ DIRECTOR: Mr. Vijay Agrawal and Mr. Sushil Agrawal
COUNTRY/TERRITORY: India
YEAR OF ESTABLISHMENT: 2005
FUNCTIONS OF THE COMPANY: Dyeing of fancy sarees and dress
materials
ANNUAL SALES RANGE: Rs 25 crore (approx)
NO. OF EMPLOYEES: 300 employees
ADDRESS: Factory: Plot -7 Block 296/301
Tanthi -thaiya,
Kadodra,
Surat,
Gujarat
Office: 130, Reshamwala market,
Ring road,
Surat, Gujarat
WORKING HOURS: Three shifts each of 8 hours.
COMPANY GUIDE: Mr. Rishu Agrawal (Manager)
6 | P a g e
Contact No. 96240-51021
Shree Ram Designs Pvt. Ltd is a dyeing house, i.e. they provide
dyeing service to their customers who are actually business
organizations the wholesalers of sarees in Surat city textile
market. Their job is to dye the sarees as per the orders of the
customers.
1.4 HISTORY OF COMPANY
The company was established in the year 2005.The company was
started by MR. VIJAY AGARWAL & MR. SUSHIL AGRAWAL. As the company
is small scale private limited and recently developed, there is
no such big history or details regarding that. The owners started
the company after 10 years of experience in trading line in
Surat. In trading, the office of the firm was in Ashoka tower
with the name of Vijay silk mills.
1.5 BOND OF TRUST
Its bond of trust is consistent upon this remarkable notion given
below:
“We are proud to have some of the most reputable name in the
city. This has been achieved over time through the approach of
work fast and work smart. The bond of trust has been developed
because of our ability to fulfill our commitments to deliver the
7 | P a g e
right product at the right time. Check and balances are placed
from the initial stages to eliminate any possibility of error. “
1.6 VISION OF COMPANY
The company undertakes to apply the vision in letter and spirit
under the following guiding principles:
In time action
Clear understanding of customer’s instructions.
Clear communication with vendors
Clear instructions for production
Strict compliance with quality control system.
Total devotion maintains first class quality standard.
Absolute efforts for in time dispatch.
1.7 MISSION STATEMENT
Mission statement focused on its major commitments i.e. “QUALITY
WITH QUANTITY”
CORPORATE VALUES
Team work
Integrity
Excellence
Commitment to buyer.
8 | P a g e
Maintenance of consistent standard
GOALS
Continuous improvement.
Customer’s satisfaction.
Quality of product and system.
Company is also planning to starts its own trading unit which
will add to the profit margin of the company.
9 | P a g e
CHAPTER 2: - ORGANISATION STRUCTURE
The activities of Shree Ram Designs Pvt. Ltd can be grouped under
four departments, namely: - the Marketing Department, Production
Department, Financial Department and the Human Resource
Department.
The activities of Marketing Department and Production Market are
the responsibility of the Master and the activities of Financial
Department and Human Resource Department are the responsibility
of the Directors.
10 | P a g e
DIRECTORSALES PERSONASSISTANTSUPERVISORHEAD LABOURASSISTANTFINANCE HEADCOLLECTION MAN
2.1 MARKETING DEPARTMENT Thought there is no formal marketing department in the company
but the marketing activities are undertaken by the masters and
their sub-ordinates. Hence the marketing activities of the
masters and their sub-ordinates can be structured and categorized
under a separate Marketing Department.
2.1.1 ORGANIZATION STRUCTURE OF THE MARKETING DEPARTMENT
11 | P a g e
2.1.2 SALES VOLUME
Dress: 2,19,00,000 meters per year(approx)
Sarees:1,82,50,000 meters per year(approx)
Padding: approx 50% of dress material & 25% of sarees.
2.1.3 UNIQUE FEATURES OF THE PRODUCT
Strong color bonding
Color toning up to 92-100%
Less shrinkage
No color loss from the cloth even after repeated washes.
2.1.4 SEGMENTATION, TARGETING AND POSITIONING
12 | P a g e
First of all this is a business to business organization i.e.
they are a firm who firm who deals with saree wholesalers in the
Surat city. They are a Business to Business (B2B) organization.
The firm does not deal with final consumers.
Segmentation
Geographically - Northern India: - The Company has segmented
its market on geographical basis. It has segmented by
concentrating on those wholesalers who are trading with
retailers in North India. So it is making color ranges which
are more popular with trends of North Indian states.
Targeting
High end customer: - After geographically segmenting the
market, the company is targeting the high end customers, i.e.
to the big whole sellers who give bulk orders so that the
company never runs short of demand for its products.
Medium taste: - SHREE RAM DESIGNS is targeting the customers
who have medium taste clients. They are dyeing saris and dress
material which is worn by the middle and lower class women.
Positioning
Creating a brand image: - It has positioned itself by creating
a brand image in the market about its color ranges, good work,
on-time delivery and loyalty towards old customers.
13 | P a g e
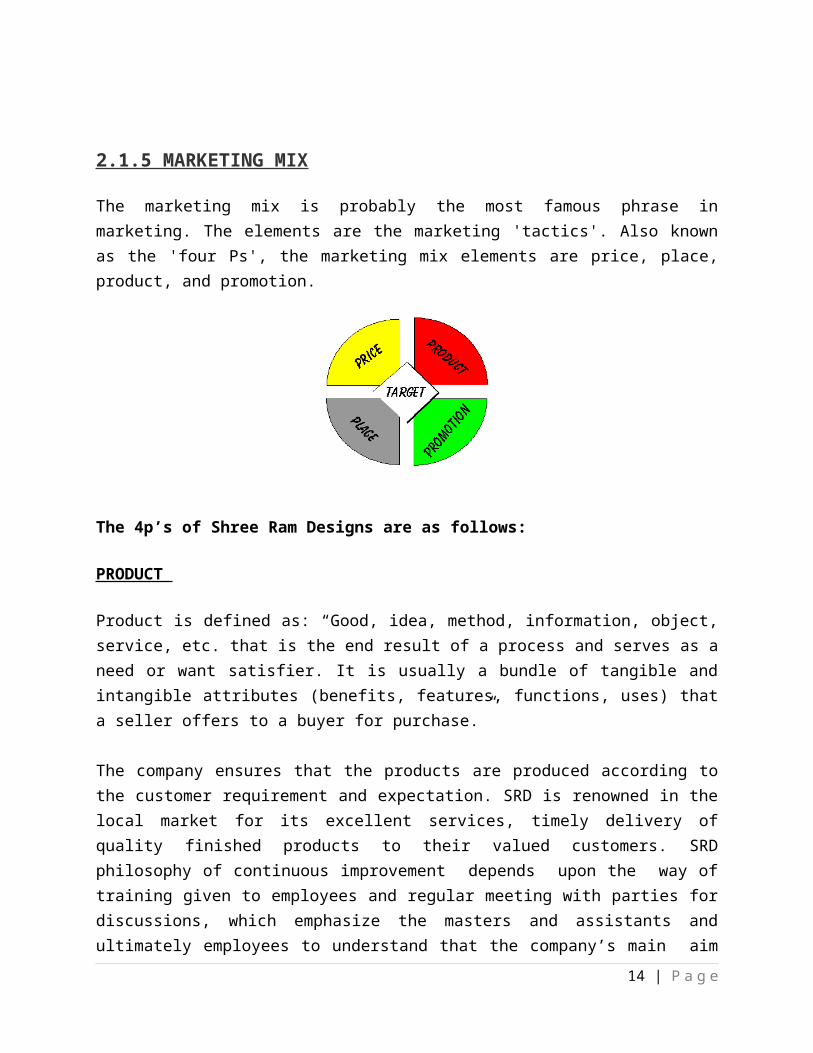
2.1.5 MARKETING MIX
The marketing mix is probably the most famous phrase inmarketing. The elements are the marketing 'tactics'. Also knownas the 'four Ps', the marketing mix elements are price, place,product, and promotion.
The 4p’s of Shree Ram Designs are as follows:
PRODUCT
Product is defined as: “Good, idea, method, information, object,service, etc. that is the end result of a process and serves as aneed or want satisfier. It is usually a bundle of tangible andintangible attributes (benefits, features, functions, uses) thata seller offers to a buyer for purchase.”
The company ensures that the products are produced according tothe customer requirement and expectation. SRD is renowned in thelocal market for its excellent services, timely delivery ofquality finished products to their valued customers. SRDphilosophy of continuous improvement depends upon the way oftraining given to employees and regular meeting with parties fordiscussions, which emphasize the masters and assistants andultimately employees to understand that the company’s main aim
14 | P a g e
is to respond the customer’s ever changing needs in the mostefficient way.
They discover new color and designs by actively following thetrends of colors seen worn by actresses or popular ladies ontelevision daily soaps, which help them know which color may bepopularly accepted by all.
Since this is a dyeing unit, there are a variety of colors andquality of grey which are processed at Shree Ram Designs, but onein particular, the Russian quality of grey is the most popularorder received by this firm. Of all the orders received themajority orders received are of Russian quality.PRICE (PRICING POLICY)
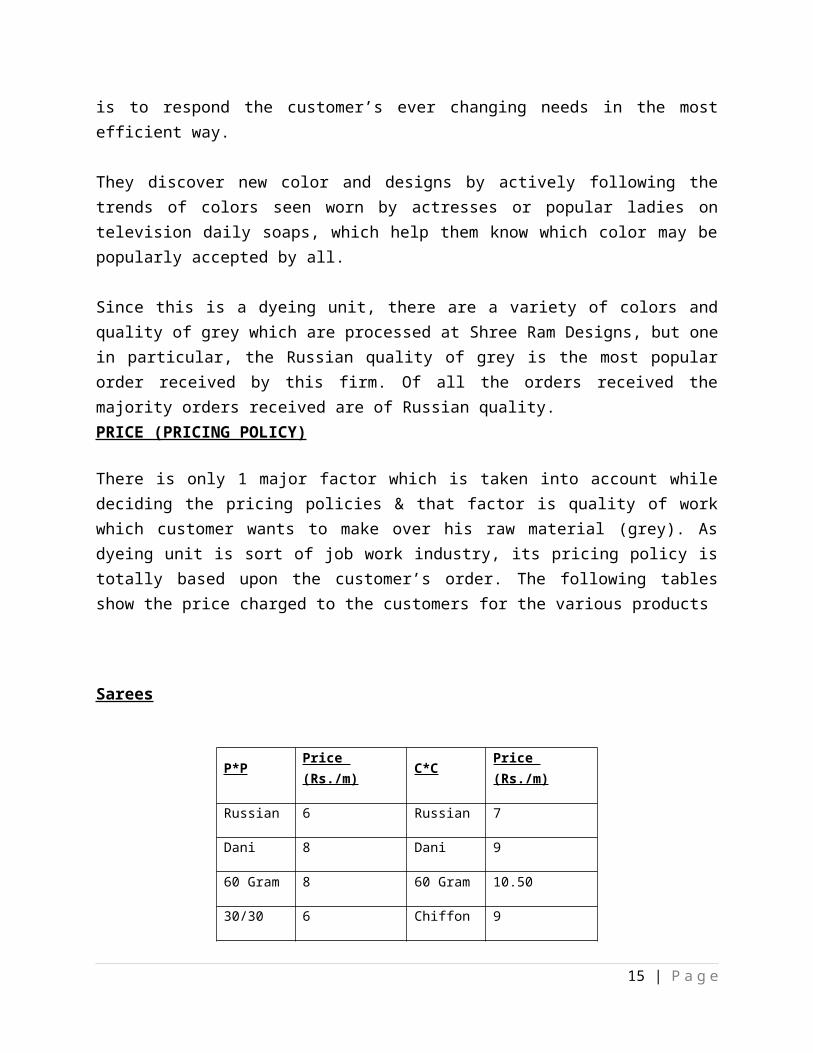
There is only 1 major factor which is taken into account whiledeciding the pricing policies & that factor is quality of workwhich customer wants to make over his raw material (grey). Asdyeing unit is sort of job work industry, its pricing policy istotally based upon the customer’s order. The following tablesshow the price charged to the customers for the various products
Sarees
P*P Price (Rs./m) C*C Price
(Rs./m)
Russian 6 Russian 7
Dani 8 Dani 9
60 Gram 8 60 Gram 10.50
30/30 6 Chiffon 9
15 | P a g e
Georgette 8
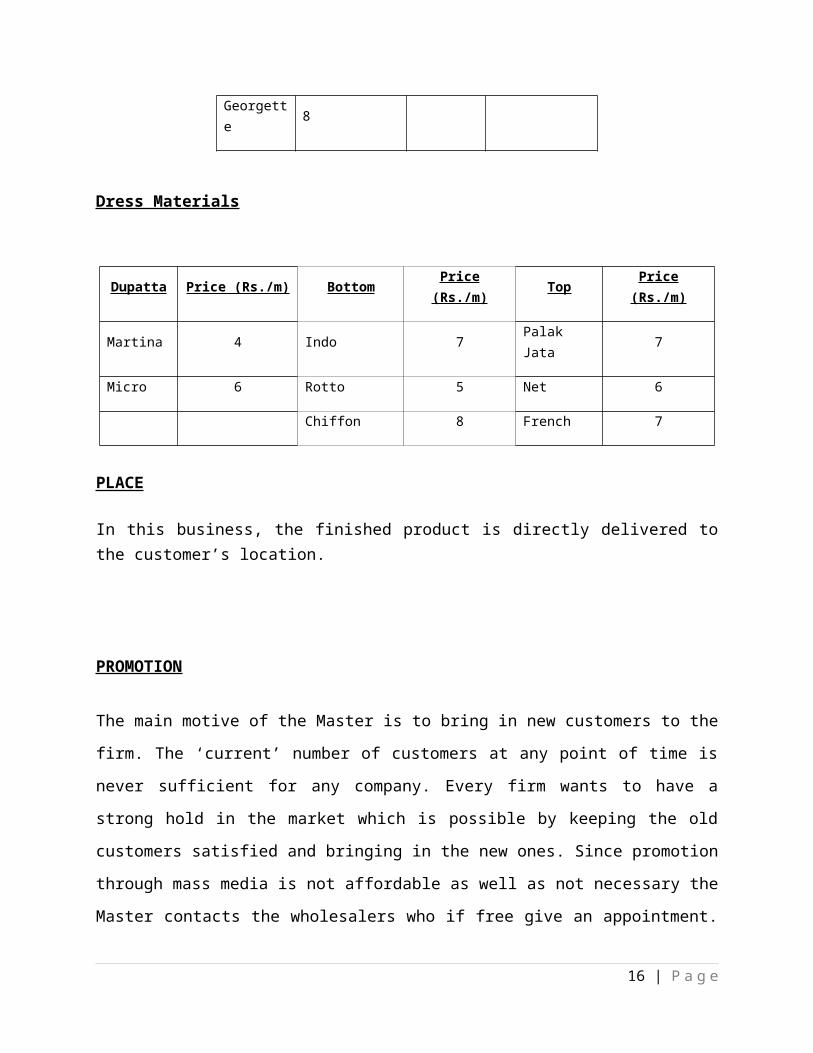
Dress Materials
Dupatta Price (Rs./m) Bottom Price(Rs./m) Top Price
(Rs./m)
Martina 4 Indo 7 Palak Jata 7
Micro 6 Rotto 5 Net 6
Chiffon 8 French 7
PLACE
In this business, the finished product is directly delivered tothe customer’s location.
PROMOTION
The main motive of the Master is to bring in new customers to the
firm. The ‘current’ number of customers at any point of time is
never sufficient for any company. Every firm wants to have a
strong hold in the market which is possible by keeping the old
customers satisfied and bringing in the new ones. Since promotion
through mass media is not affordable as well as not necessary the
Master contacts the wholesalers who if free give an appointment.
16 | P a g e
So to learn the way to rope in new customers, I alongwith Mr.
Chetan Gupta a Master in the firm, went to visit some prospective
wholesalers in the market. Some of them were: -
M/s Shree Shyam Sarees: - We offered them Russian sarees with a
yellow dyeing. They were already having their orders processed at
Shree Vasudev mills, so the Mr. Chetan knew about the pricing of
the Vasudev so he offered him a price of 2.95 rs/ metre
guaranteeing a flawless dyeing and on-time delivery. And next day
a grey lot of 50 takas(1taka = 100 metre), form M/s Shree Shyam
Sarees was supplied to the factory.
M/s Orange Sarees: - Situated in Millenium Textile Market, they
are challenging suppliers in the market. They were asking for
different colors. They wanted a certain shade in orange; they did
not bargain much in price, they were getting what they exactly
needed, so they placed an order of 36 takas.
M/s Khaitan Slk Mills: - They are big time wholesalers, judging
by the size and number of shops. They demanded quicker delivery,
while the standard time is 7 to 9 days. They were demanding the
delivery to be completed in 5 days, no discounts in price. They
offered if the delivery is made in 5 days, as this was not
possible so Chetan Master charged them a higher price by charging
them 10p/m extra.
17 | P a g e
M/s Varun Prints: - These are also resellers in the market. They
wanted to have 20000 meters processed in 3 day’s time, which was
not possible, so the master offered him completion of definite
produce within 1 week. They were in urgency so the time was
negotiated to 4 days.
M/s Anshi Silk Mills: - A person visited the factory from their
firm, they were looking for a new color to sell. They got what
they were looking for, some kind of shade in Green. They were
offered a price which was acceptable. Now this was not the
exactly marketing part, because the person was by himself out in
the field to explore, and though being a new customer himself he
was treated well. He was not treated as if forced to do so. The
Master was polite and even being busy gave him sufficient
attention.
2.1.6 THREATS TO THE COMPANY
Industry competitors (segment rivalry): - There is very internal
segment rivalry. There is high amount of competition existing in
the textile industry. There is a very large no. of textile
processing mills in Surat.
Threat of buyers’ growing bargaining power: - As mentioned above
that there is heavy segment rivalry among the dyeing and printing
units, so the customer bargaining power is quite high here.
Moreover there is nothing like customer loyalty existing in this
18 | P a g e
industry. Regular customer of one firm if offered similar quality
at another firm will switch off immediately. Only quality or
product differentiation plays very less role in retaining of the
customer.
Threat of suppliers’ growing bargaining power: - The suppliers in
this industry are suppliers of coal, dyes, chemicals, Bagasse,
lignite, etc. now in this for lignite there is quota system for
every dyeing and printing units, and that they get from
government so there is no quota system as such but for the rest
of the commodities the bargaining power is quite high because
there is large availability for these goods. Here the company
gets equitation from different suppliers and then it orders goods
as per rates, payment conditions, etc.
Threat of substitute products: - The Company does not need to
fear about the substitute products, because there is no
substitute available for dyeing in sarees or dress materials in
the market. As it’s a dyeing mill value addition which is in
recent boom also do not affect.
Threat of new entrants: - This threat always remains with a
growing industry. Outsiders are lured by the profits of the
existing business firms. Surat textile industry is a growing
industry. Here the entry barrier is also not quite high as
compared to the profits so many new firms are coming these days.
Therefore there is a high threat of new entrants in this
industry.
19 | P a g e
2.1.7 DIFFERENT REPORTS GENERATED IN MARKETING DEPARTMENT
The following reports are not exactly termed as reports as they
are just records which the Masters and their respective teams
which need to be maintained the Master regularly.
DAILY REPORT
SALES REPORT: - This report shows nothing but the total dispatch
made by the firm on a particular day. It is made on basis of no.
of grey dispatched after finishing from the unit. The main aim
for preparing this is to check whether the production capacity is
increasing, decreasing or remaining same.
MARKET FEEDBACK: - This report shows whether the customers got
their lots fully or not. And second thing prepared by this is
that whether the tone and finishing of the color and chemical are
set as per order or not. The main aim for preparing this is to
check whether the party getting their order on time or not and
whether it is up to their standard defined or not.
WEEKLY
QUALITY RELATED ISSUE REPORT: - These reports are prepared on
weekly basis to check out whether all the parties have got their
tone and finishing of their fabric as per their requirement or
not. Moreover, it is analyzed that for a particular tone only
problem or whether there is overall problem in tone which may be
20 | P a g e
possible due to problem in machinery. This is prepared and
actions are taken for machines if overall there is disturbance in
Color-tone setting or else masters are asked and recheck if the
problem occurs in any particular tone only.
COMPETITORS’ PRICE REPORT: - To check out the changes in the
prices charged by the competitors (increasing or decreasing) and
finding out reasons behind that. If the competitors’ prices are
increasing, it is well and good for the profit of the firm but in
case of decrease in price, the firm also has to reduce the rates
which may decrease the firm’s profits. This job is not done only
by the Master, but the Directors also keep a track of the
competitor’s prices and they keep on passing the necessary
information to the Master.
MONTHLY
PAYMENT RECOVERY AND OUTSTANDING REPORTS: - The payment recovery
and payment outstanding repots are prepared to know what amount
of a particular party is recovered and what amount is still
pending. As in processing system of Surat, there is payment
period of 90 days. In spite of paying fully at the end of 3
months, party’s use to pay part payments on regular period. This
report maintains amount pending and recovered in that particular
month of all the party’s of the firm.
2.1.8 DETAILS OF CUSTOMERS
21 | P a g e
Since it is a Job Based firm. That is the work is based totally
on the job as ordered by the client. So it is not a fixed list,
but some of the clients whose orders are regularly processed at
Shree Ram Designs are:
Divya textiles
Gopi silk mills
Lifestyle Sarees Private Ltd.
Oswal Sarees
Monica textiles
Sarita enterprise
Samiksha Sarees Ltd.
Shripal enterprise
Sonu fashion
Shorya fashion
Tanvi desigers
Veer vijay silk mills
Vaibhav silks
Neer international
Mansi fabrics
Ritu fabrics
Sumit sarees
Supriya sarees
2.1.10 TYPES AND CLASSIFICATION OF THE PRODUCT
22 | P a g e
DRESS MATERIALS
In Shree Ram dyeing mills, we can find out the best quality in
this segment (range). The qualities in the dress section majorly
produced in this firm are salwar, dupatta and Kurta. The major
production is of dress materials every day due to increasing
demand. Every day nearby 60,000 meters are dyed of dress
division. The Company is well known for best settling down the
roughness of grey in its range.
SAREES
23 | P a g e
In sarees section, only two types of qualities are produced in
this firm. They are catonic by catonic (C*C) and polyester by
polyester (P*P). The per day production of sarees are nearby
40000 to 50000mts per day. Generally one stenter is allotted to
sarees master and remaining two are given to the dress master.
Production of sarees fabric takes shorter time span than one
batch of dress materials products.
24 | P a g e
2.2 PRODUCTION DEPARTMENT
2.2.1 ORGANIZATION STRUCTURE OF PRODUCTION DEPARTMENT
25 | P a g e

26 | P a g e
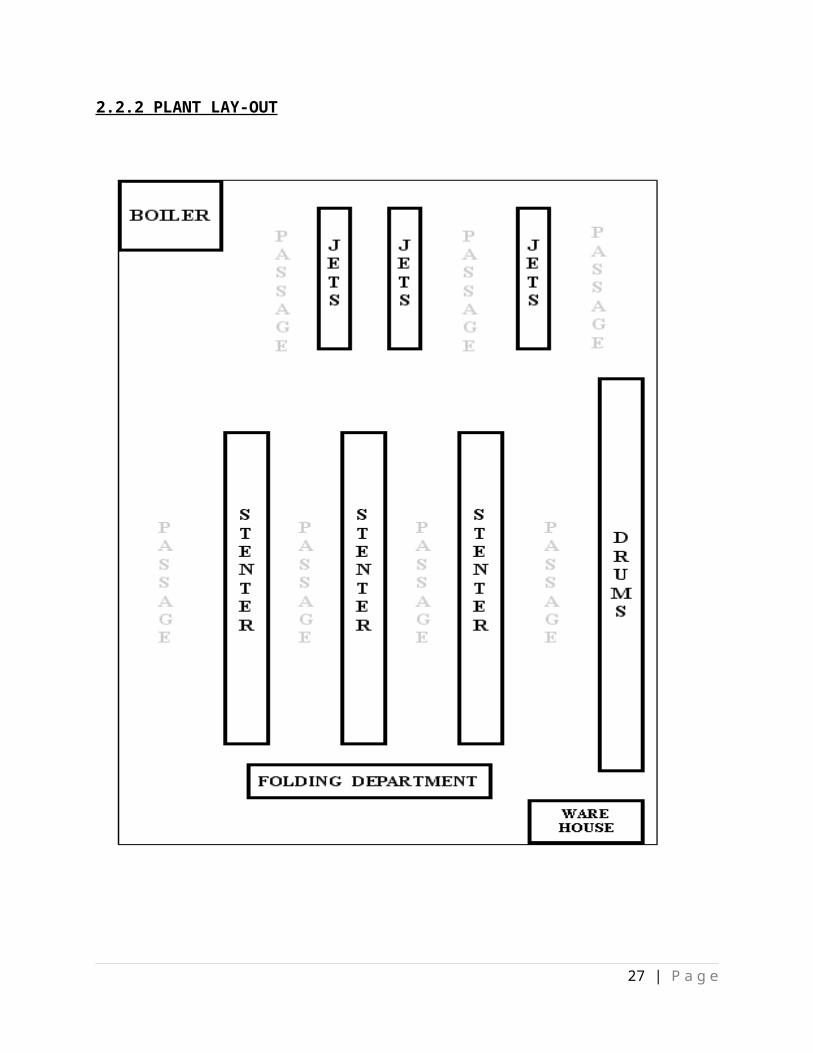
2.2.2 PLANT LAY-OUT
27 | P a g e
2.2.3 MACHINERY AND EQUIPMENTS
STENTER
The main job of this machine is to align the borderline of the
cloth and remove of the wrinkles from the cloth.
Capacity: 5 chambers
Company: Stenmech
No. of stenters: 3
The final number of meters produced in this machine is the final
produce of the day.
JET
This machine is used for dyeing the fabric.
Capacity: 200kgs
Company: Accurate
No. of jets: 24
DRUM
This machine is used to make the fabric compact before dying.
Capacity: 450kg in 1 shift
Company: Laxmi engineering
No. of Drums: 7
FOLDING MACHINE
28 | P a g e
This machine is used to fold the cloth for packing.
Capacity: 50-70 meters/min
Company: Larsen And Turbo ; Siemens
No. of machine: 7
2.2.4 MATERIAL HANDLING EQUIPMENTS
Material handling equipment is all equipment that relates to the
movement, storage, control and protection of materials, goods and
products throughout the process of manufacturing, distribution,
consumption and disposal. Material handling equipment is the
mechanical equipment involved in the complete system. The main
material handling equipments used in the company are:
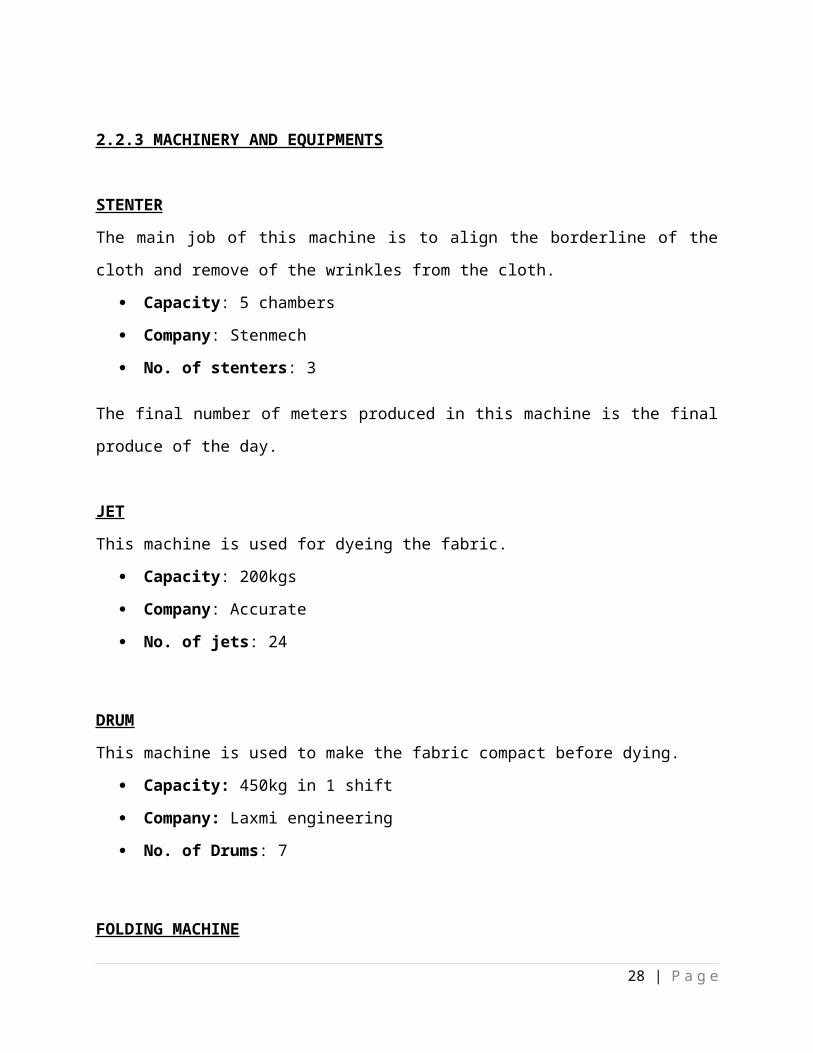
TROLLEY :
Trolley is used for movement of cloths from department to
another.
29 | P a g e
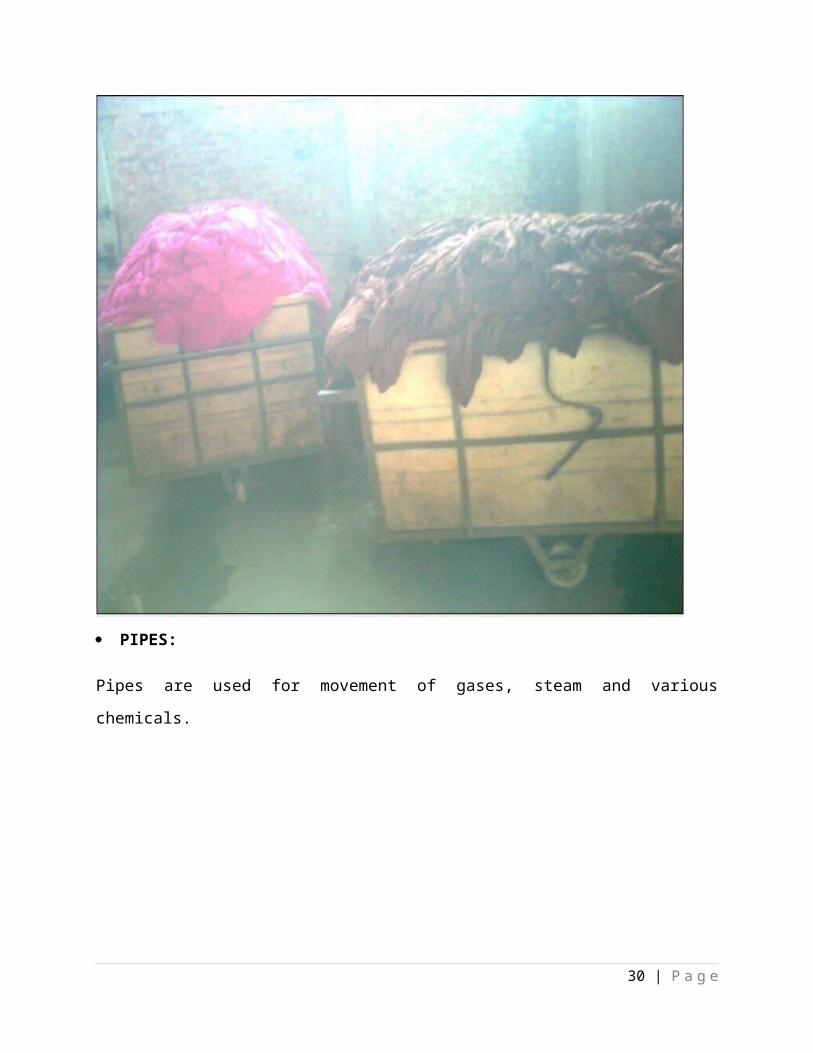
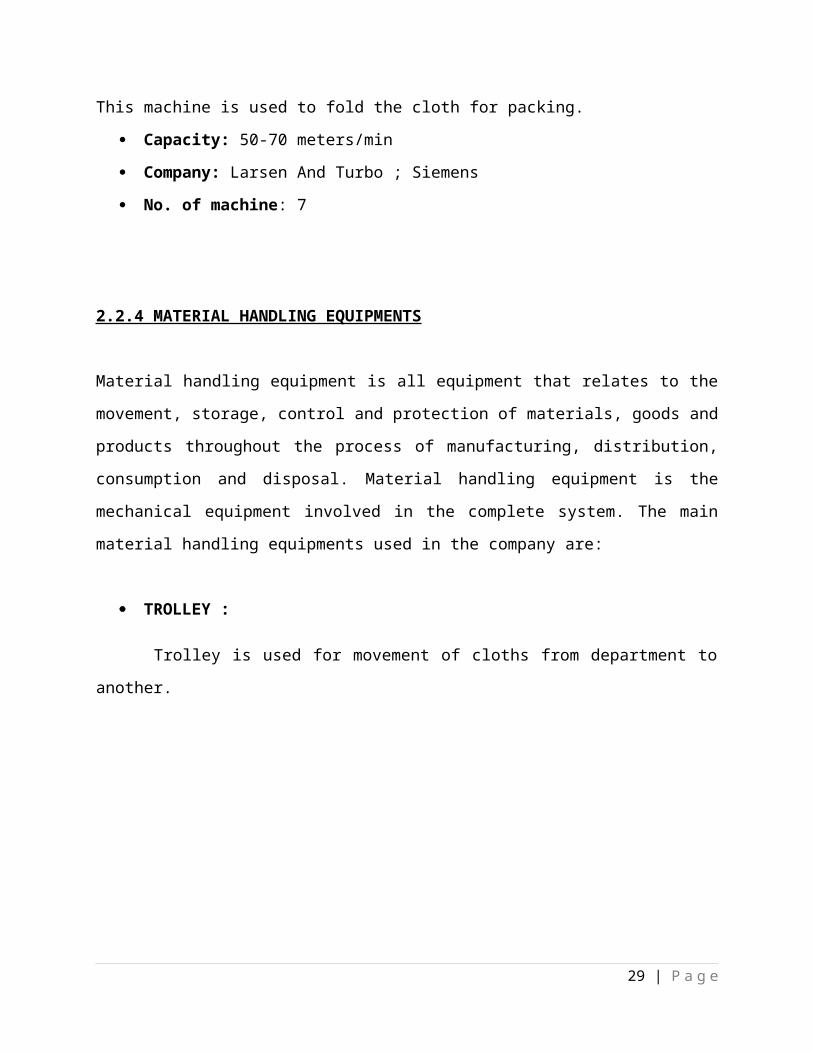
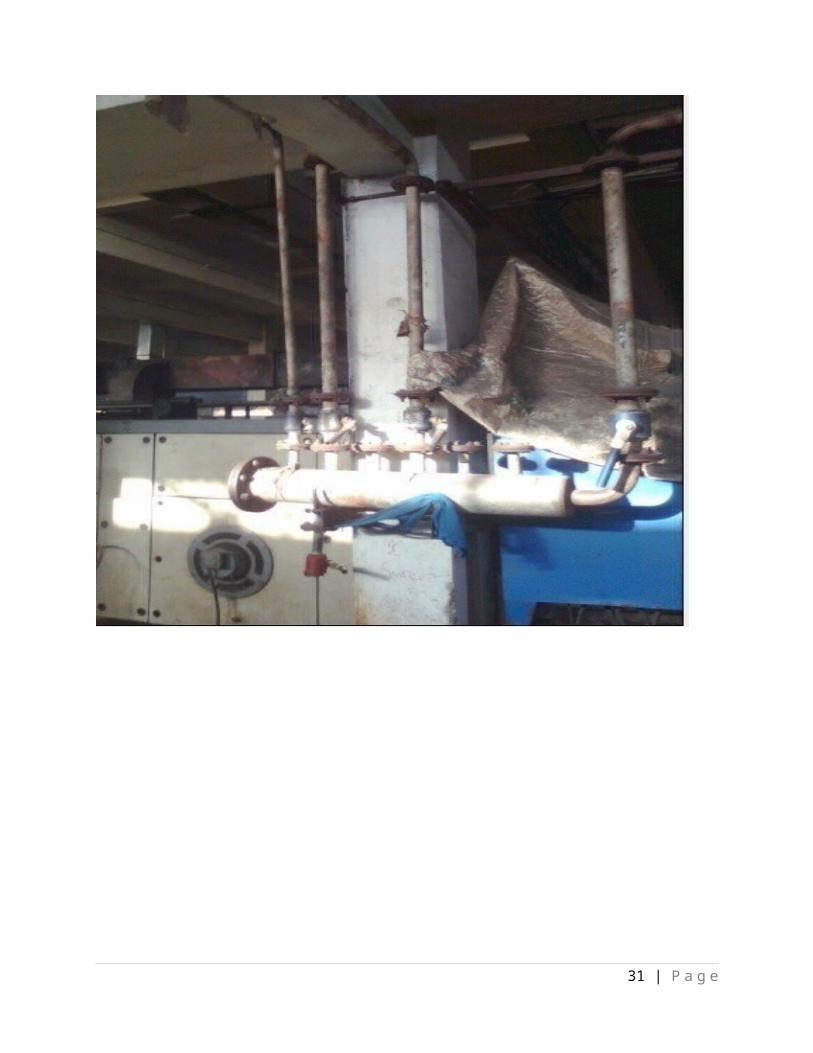
PIPES:
Pipes are used for movement of gases, steam and various
chemicals.
30 | P a g e
31 | P a g e
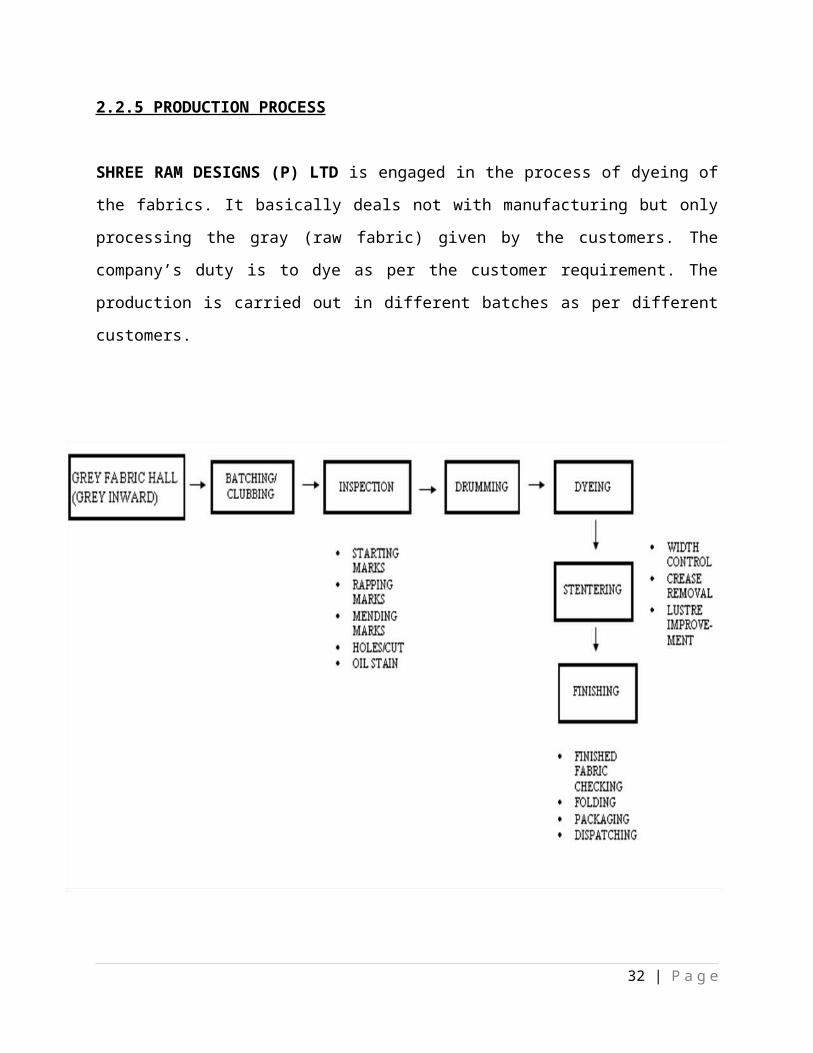
2.2.5 PRODUCTION PROCESS
SHREE RAM DESIGNS (P) LTD is engaged in the process of dyeing of
the fabrics. It basically deals not with manufacturing but only
processing the gray (raw fabric) given by the customers. The
company’s duty is to dye as per the customer requirement. The
production is carried out in different batches as per different
customers.
32 | P a g e
The process goes as: -
Deposition of grey
Batching/clubbing
Inspection
Drumming
Dyeing or printing or both
Stentering
Folding
Packing
Dispatching
The gray cloth, which belongs to the customer, is being deposited
by the customer in the company. As and when the company receives
the material from the customer lot no. along with the customer
code is been provided for safety purpose, so that the gray cloth
of different customers and of same or different quality do not
get mixed. Now lots of grey are batched according to master
production plan. The lots which have to undergo same process are
33 | P a g e
clubbed together. Then the fabric is inspected .the following
faults may appear:
Starting marks
Rapping marks
Mending marks
Holes/cut
Oil stain
The next step is to remove impurities and protruding fibers from
the fabric in the machine called DRUM. While drumming, the fabric
is being washed to remove the dirt, dust and impurities from the
cloth. This is done, because the color does not fix properly on
dirty fabric. After washing of the cloth, some chemical and steam
is given to set the grains to the fabric and to whiten the
fabric. The drumming process takes around 5-6 hours
approximately, depending upon the quality of the fabric.
34 | P a g e
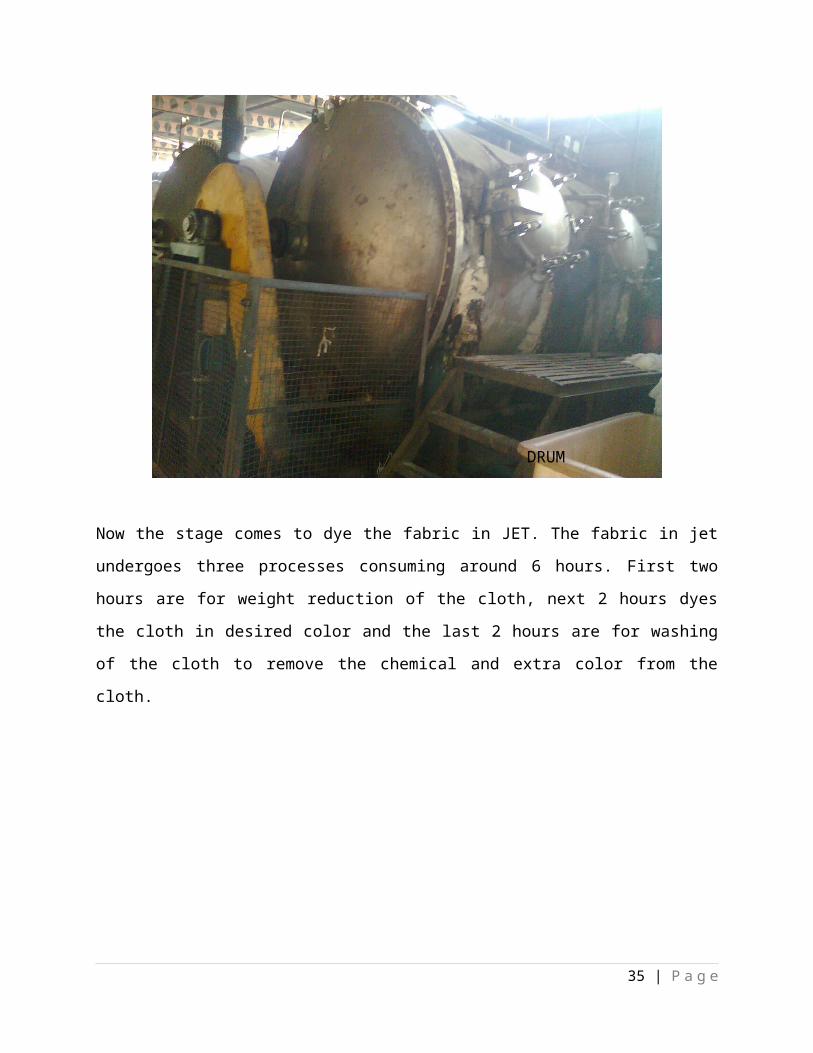
Now the stage comes to dye the fabric in JET. The fabric in jet
undergoes three processes consuming around 6 hours. First two
hours are for weight reduction of the cloth, next 2 hours dyes
the cloth in desired color and the last 2 hours are for washing
of the cloth to remove the chemical and extra color from the
cloth.
35 | P a g e
DRUM
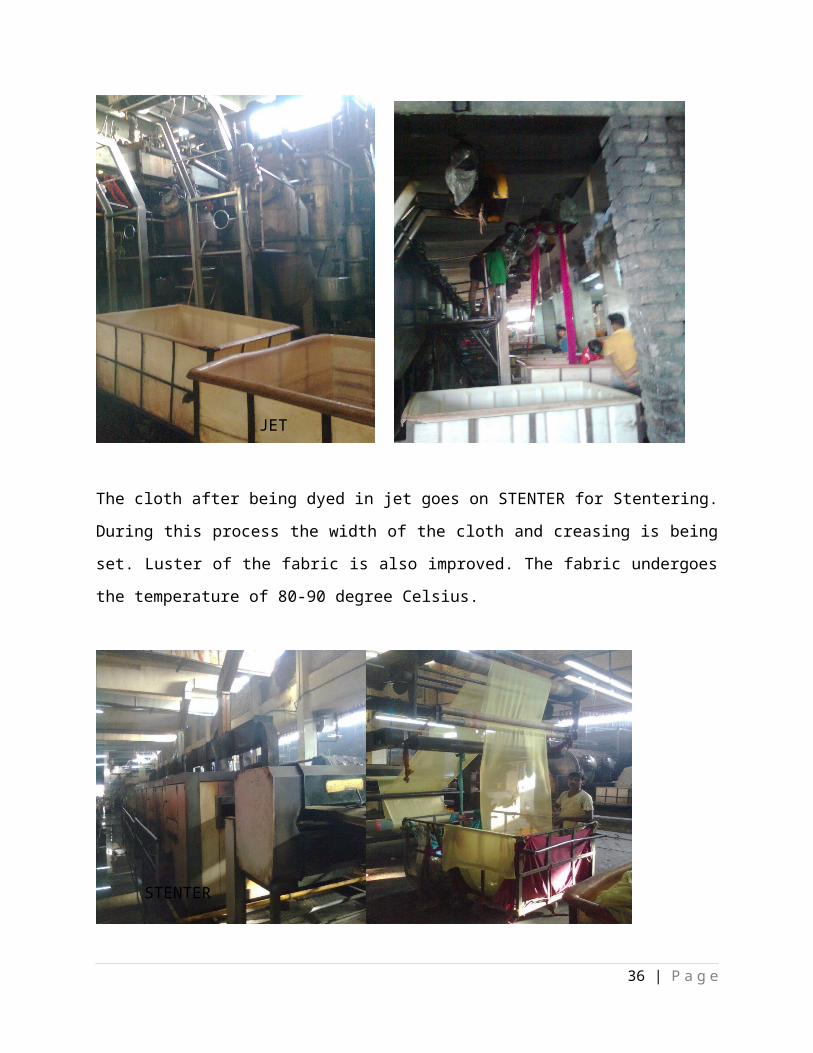
The cloth after being dyed in jet goes on STENTER for Stentering.
During this process the width of the cloth and creasing is being
set. Luster of the fabric is also improved. The fabric undergoes
the temperature of 80-90 degree Celsius.
36 | P a g e
JET
STENTER
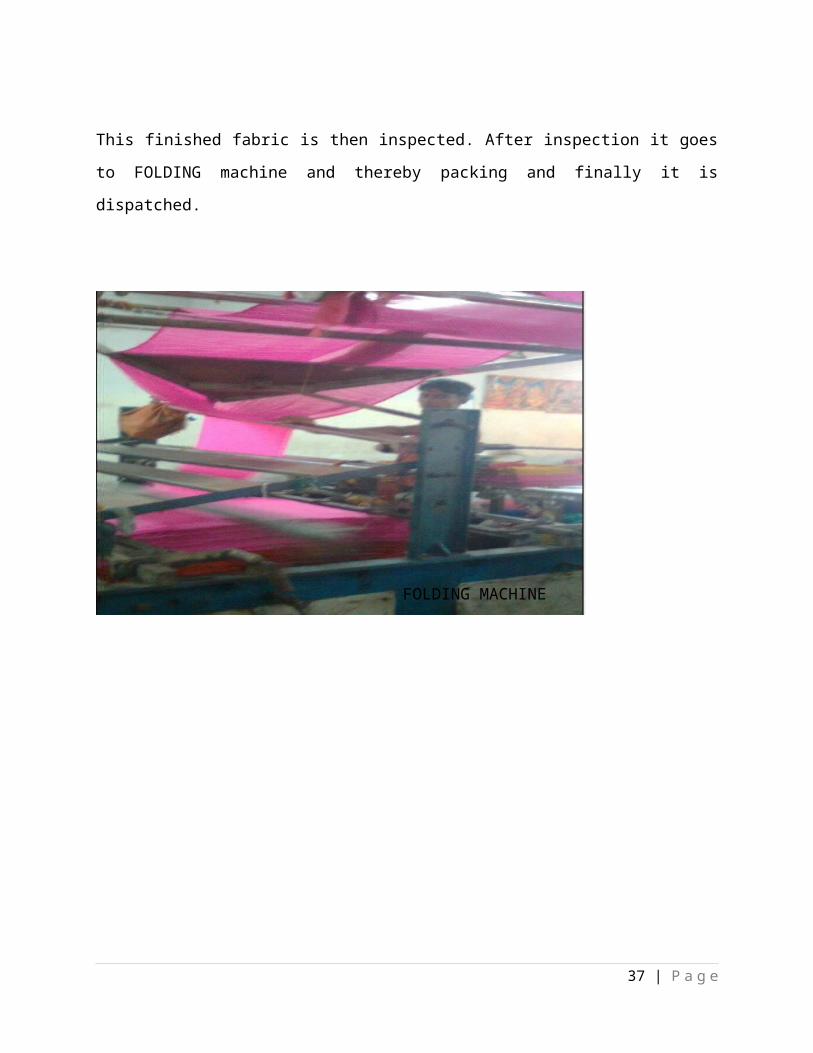
This finished fabric is then inspected. After inspection it goes
to FOLDING machine and thereby packing and finally it is
dispatched.
37 | P a g e
FOLDING MACHINE
38 | P a g e
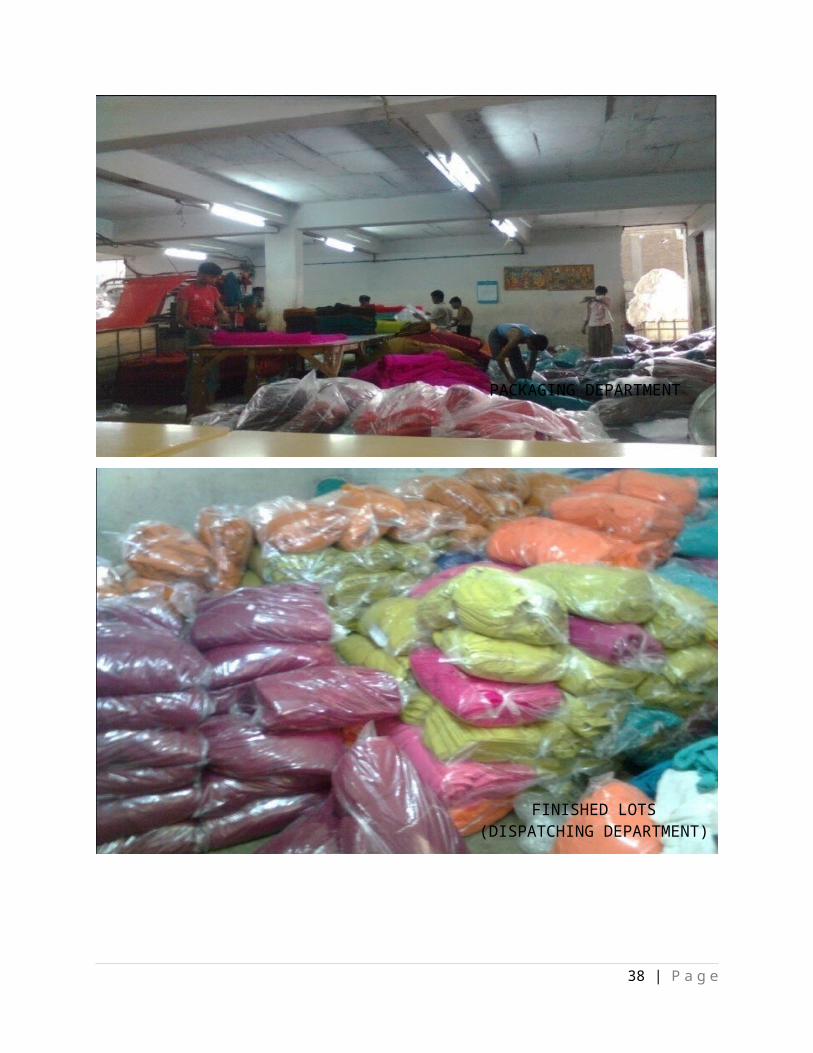
PACKAGING DEPARTMENT
FINISHED LOTS(DISPATCHING DEPARTMENT)
2.2.6 MAINTENANCE PLANNING SYSTEM
Maintenance is generally carried out of full unit once in a
month. The main purpose of the maintenance is to prevent any loss
due to negligence. In case of stenter, if it is find necessary
twice a month is also done. Clearing of boiler is done once in 3
months. Regular maintenance of small equipments is carried out
and no separate time is given to it. It is done within process
time only. Generally maintenance is done on end of month and the
production is meant to be closed for that time period.
Maintenance generally includes cleaning, oiling, wearing, tearing
checking of nut-bolt, etc. of various machineries. Maintenance is
39 | P a g e
carried out to check for any wear and tear in machine parts. Also
it is carried out as to check whether all the equipments are
working properly and to prevent any accidents or faulty
production.
2.2.7 WASTE MANAGEMENT
Waste management is very important from all points of view. In
this company, ETP (EFFLUENT TREATMENT PLANT) had been constructed
at the time of its inception. The process is fully automated. All
the liquid and solid wastes of colors, chemicals and fuel are
passed into this treatment plant through well constructed
pipelines within the firm. After making it safe to release,
wastes are dump to nearby drainage System through pipelines.
Recently, a CETP (COMMON EFFLUENT TREATMENT PLANT) has been
developed by government for waste management in every industrial
area. The best part of this is that the management of CETP is
taken care by government and owners of the dyeing units have are
liable only to pay for the service they receive from this
treatment plant developed by government. All the old mils, which
had already developed their own ETP, have not been the part of
CETP but new units which are developing do not miss this
opportunity of becoming its member and getting burden free
totally from management of mill waste.
40 | P a g e
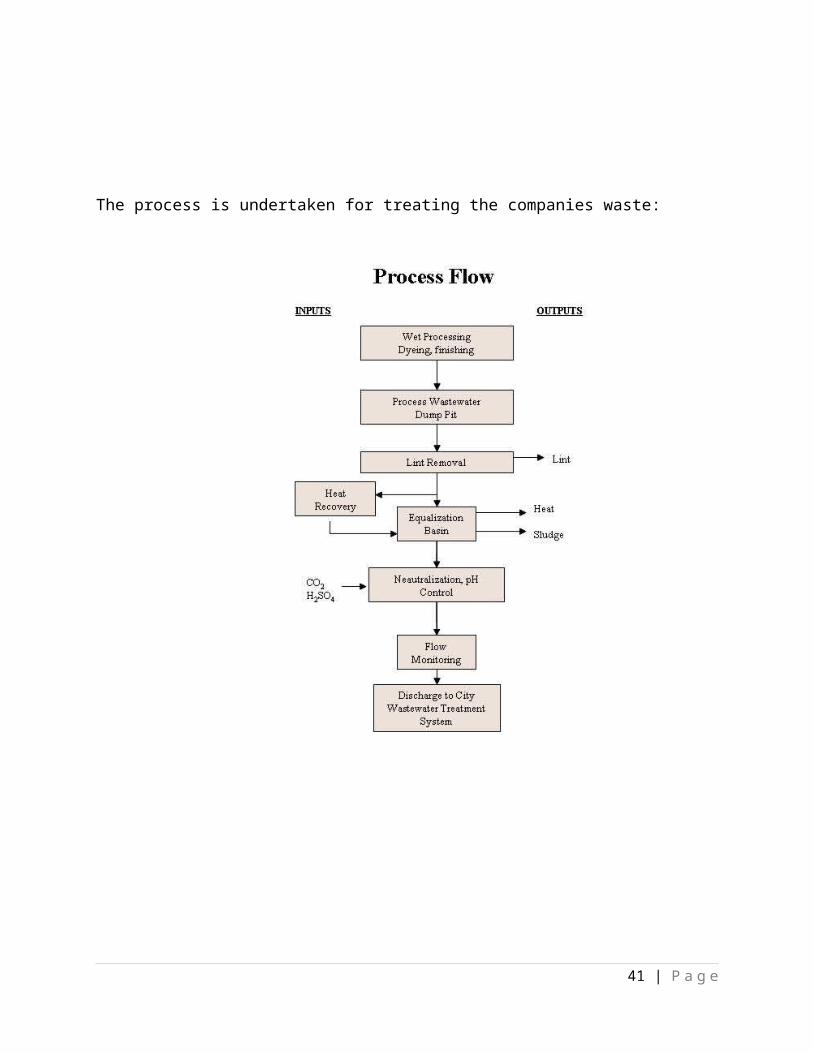
The process is undertaken for treating the companies waste:
41 | P a g e
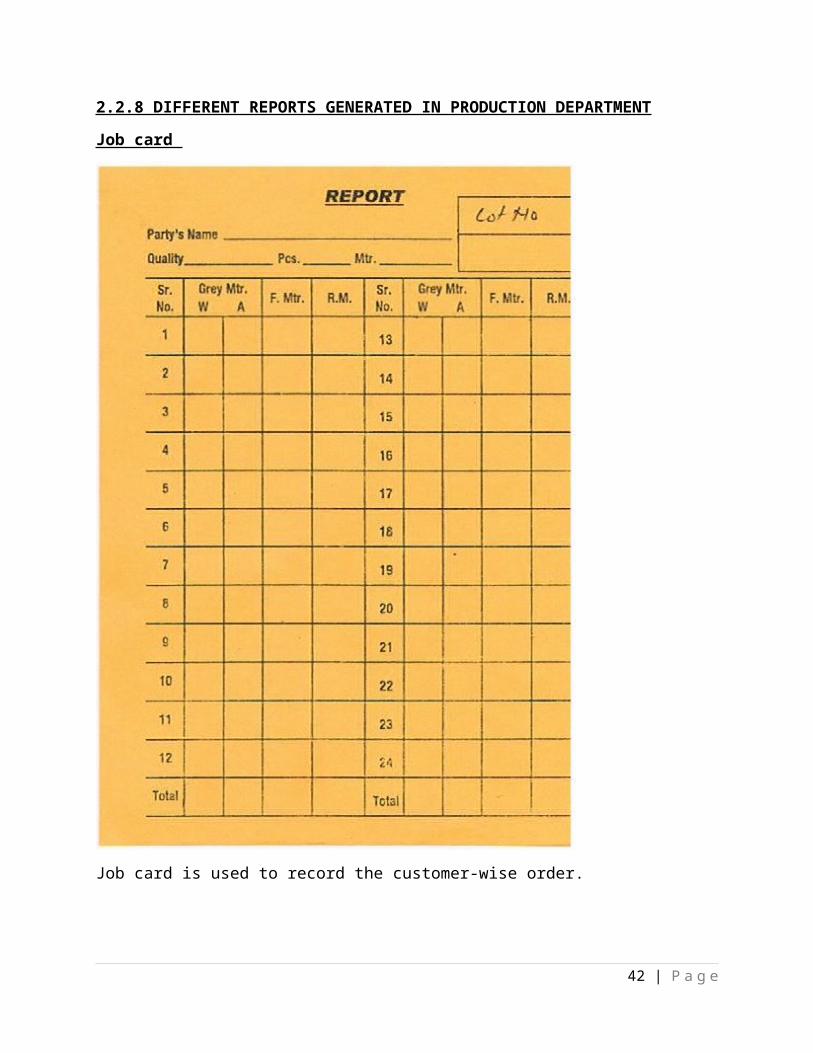
2.2.8 DIFFERENT REPORTS GENERATED IN PRODUCTION DEPARTMENT
Job card
Job card is used to record the customer-wise order.
42 | P a g e

43 | P a g e
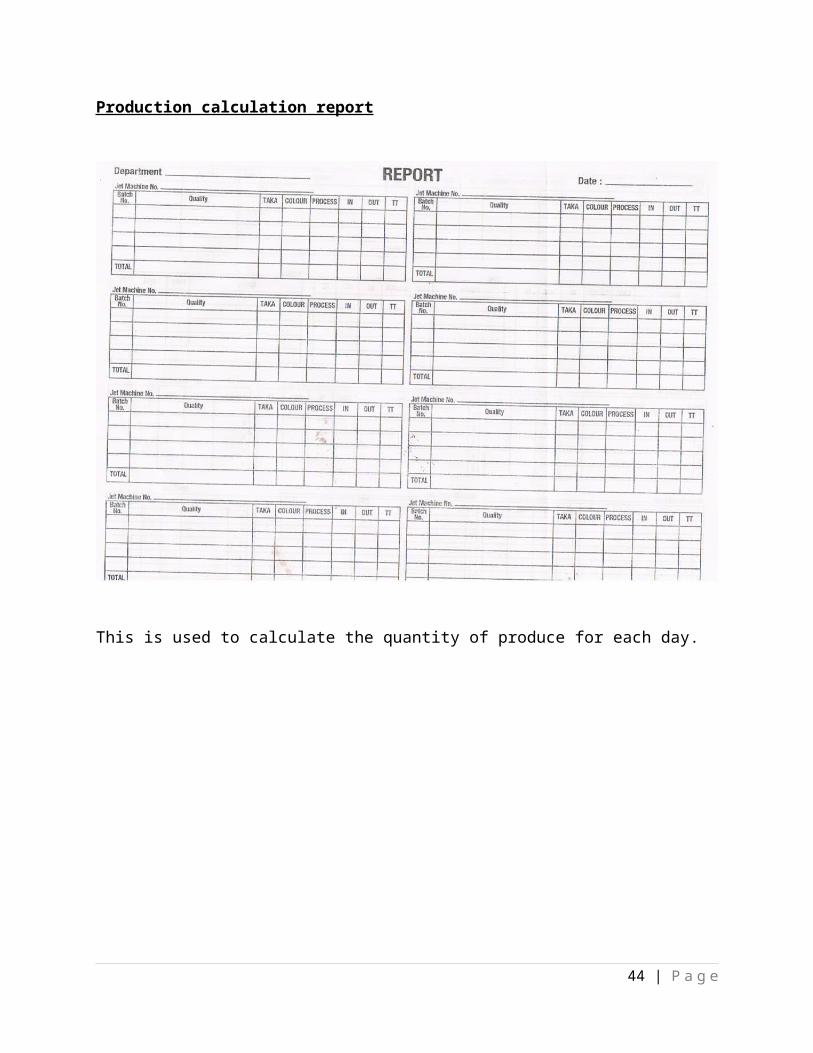
Production calculation report
This is used to calculate the quantity of produce for each day.
44 | P a g e
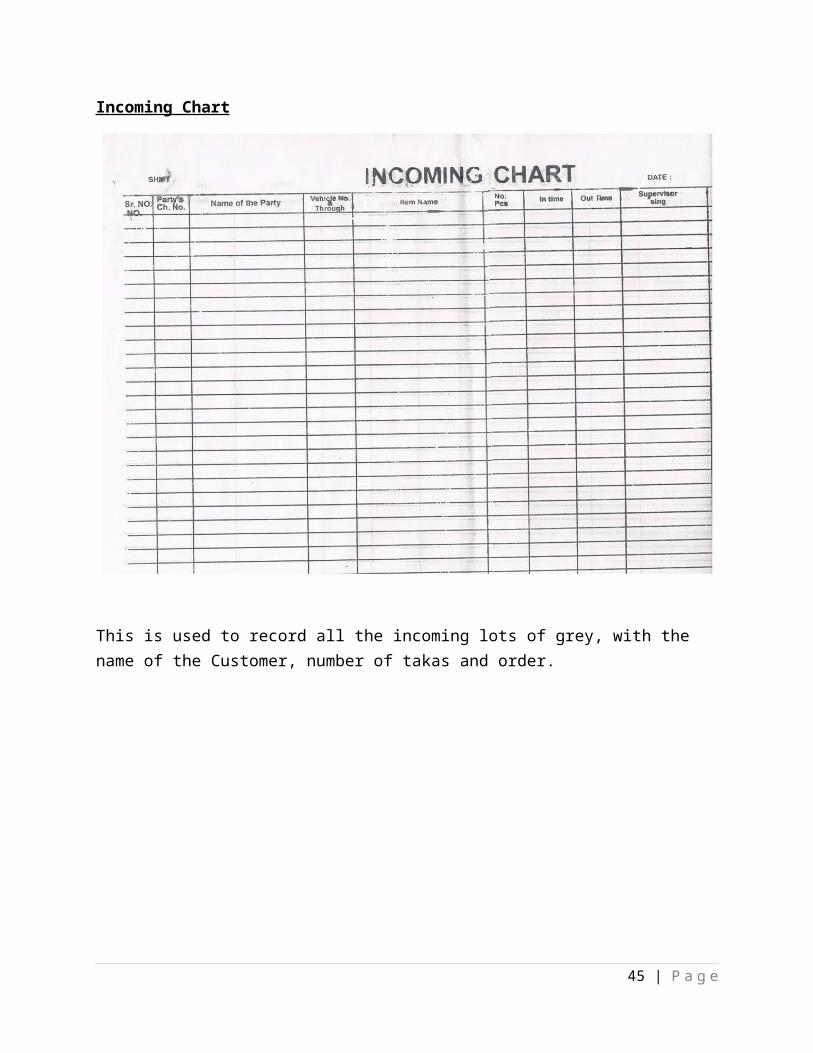
Incoming Chart
This is used to record all the incoming lots of grey, with the name of the Customer, number of takas and order.
45 | P a g e
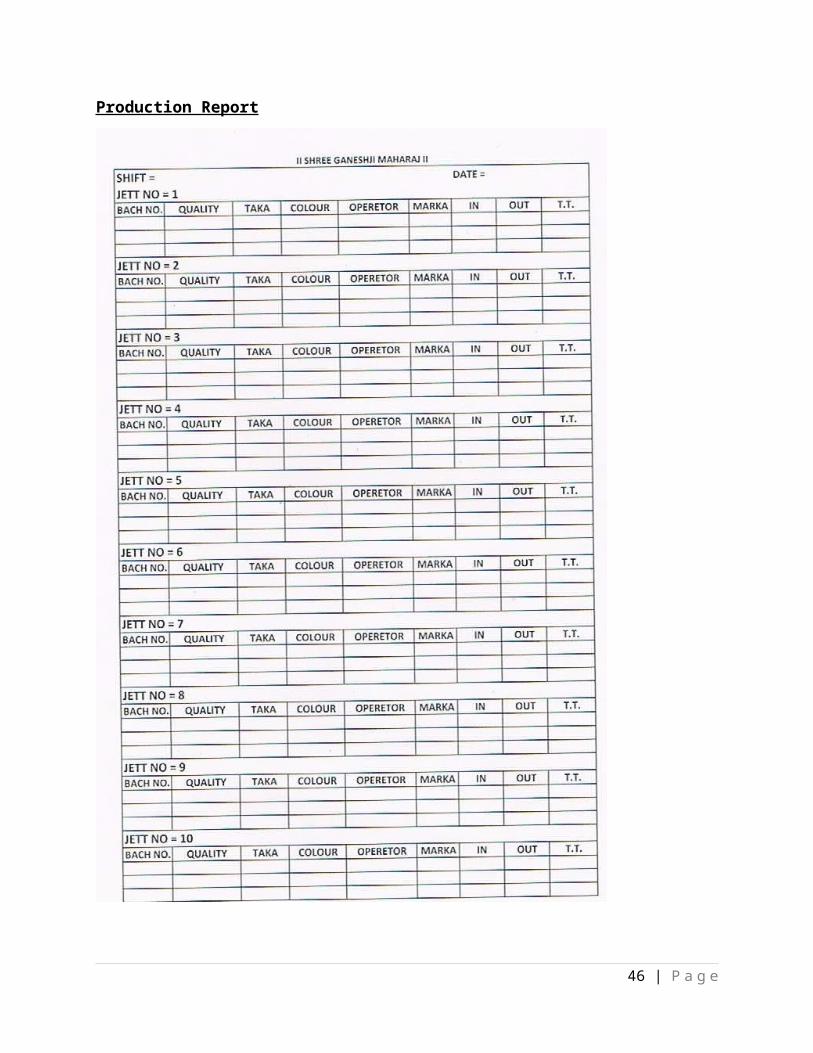
Production Report
46 | P a g e
This report is used to direct the operator about the quantity and
the quality to be processed with the name of the colour.
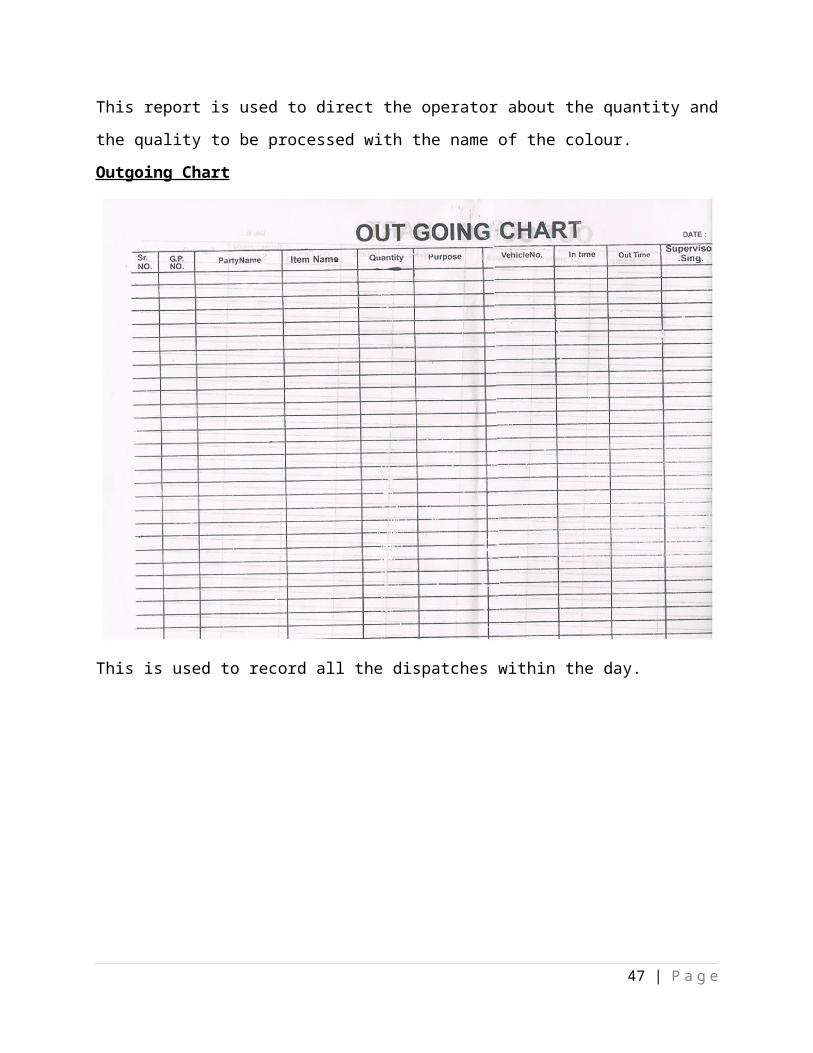
Outgoing Chart
This is used to record all the dispatches within the day.
47 | P a g e
2.2.9 PRODUCTION PLANNING AND CONTROL
Production Planning and Control (PPC) is the nervous system of
the organization and its basic task is to receive information
from the customer and link it to the production. It involves the
Pre-Production Analysis to ensure quality and reproducibility.
PPC has two further branches:
A) Material Resource Planning
B) Production Planning and Monitoring
Material Resource Planning: - Material Resource Planning is done
for the material procurement, like dyes, fuels, etc. It is
basically done to analyze that how much is needed, what is
needed, when is needed, what is the cost of the material and how
to acquire the resources. Generally, the stock is maintained for
a month and new supply is ordered just before the end of every
month
Production Planning: - It includes the planning like the Dyeing
Plan (we can also call it as the Master Plan). Back Ward
Production Planning is done and this Production Time Line
involves when’s and what’s of the production. Date Wise Plans are
made from work order to delivery.
Monitoring: - It is the different entity. Monitoring is done for
the whole production process and in this we check out the
48 | P a g e
planning implementation. If the planning is failed, re-planning
is done for that. Off- the- track and on-the- track planning is
also done by the PPC.
Documents Generated In PPC
Store Plan: - It involves all the documentation about the
sundries being used in the production of the order. It also
involves the information about Fuel, etc .Store Plan is basically
a Quantity Plan.
Dyeing Plan: - It is related with the Dyeing of the fabric that
how much dyes and chemicals are required. For the procurement of
the materials, PPC goes for the purchase department.
The Production Planning and Control is the nervous system of our
organization and undoubtedly it is our key success factor. The
nucleus of Shree Ram Design’s remarkable success has been its
impeccable system. PPC conducts detailed pre- production analysis
to ensure quality and reproducibility.
2.2.10 MATERIAL CODIFICATION SYSTEM
It is necessary that the raw materials from two customers should
not get mixed or exchanged .for this purpose, the following
coding practice is followed in the company:
Every customer of the company is given a unique identity code.
For example, the code of the “Radhe Silk Mills “is RSM. Only Top
Management is aware about what this code stands for. The entire
49 | P a g e
process in the factory now goes on the basis of work of ‘RSM’.
After the customer code, lot number is given according to the
number of grey lots received by the company i.e. 1, 2, 3, 4, etc.
Many a time’s all lots are not supposed to undergo the same
process. Suppose 50 lot of a RSM are received and of which 40
are for drumming (whitening) and remaining are of regular dyeing
procedure. Then the allotment is made in the following way:
CUSTOMER’S CODE, GREY NO., and PROCESS NAME.”RSM-1-D” which means
Radhe silk mill lot no. 1 is for drumming. RSM-41-N” which means
Radhe silk mill lot no. 41 is for normal dyeing. Then the grey
collection cards are sent to the respective Dyeing Masters of the
customers. the whole procedure of dyeing goes on as per the
master program given to the operators of different machines.
Finally the dispatching of finished dyed grey lots is made
according to the identity code and the priorities to the various
customers.
2.2.11 MATERIALS INWARD PROCESS
Material inward procedure generally begins with the gate entry
made by the security guard on the no. of grey lot entered into
the firm and at what time with the no. of tempo. Then the gate
entry pass is given to the grey checking section supervisor. The
details of gate pass are cross checked, and then the grey lots
are separated according to the parties. Then every grey lots of a
particular party are given with a unique identity code. The job
50 | P a g e
card of every party’s grey lot is prepared. Then the grey lots
are sent for the process as per the program made by the
respective master.
2.2.12 ANALYSIS OF PLANT LOCATION
The location of the plant has a crucial effect on the
profitability of a project, and the scope for future expansion.
Many factors must be considered while selecting a suitable site.
The following are the factors which have made the owners select
the site:
Industrial Area: - Tanti Thaiya is an area under G.I.D.C., so it
is an area assigned for Industrial development. This area is also
situated very far from residential areas, so no harm to common
man due to Industrial pollution.
Situated near the Textile Market: - Kadodra is the industrial
area nearest to Ring Road, the Business hub for the textile
industry in Surat. So, all the suppliers and buyers may first
visit the companies in this area when on a search for new
processor.
Easy availability of colors and chemicals: - Colors and chemicals
are the major essentials for dyeing process and the suppliers for
these products are also located in Sachin and Pandesara which are
near to Tanti Thaiya.
Availability of Labor: - Labor is easily available in this area.
51 | P a g e
Other factors are:
Availability of Utilities: Water, Fuel, Power.
Availability of Suitable Land.
Environmental Impact, And Effluent Disposal.
Local Community Considerations.
Climate.
Political Strategic Considerations.
52 | P a g e
2.2.13 INVENTORY CONTROL
Inventory control is the delicate balance of the costs versus
profits associated with having stock on hand.
Inventory control means keeping the overall costs associated with
having inventory as low as possible without creating problems.
This is also sometimes called stock control. It is an important
part of any business that must have a stock of products or items
on hand. Correctly managing inventory control is a delicate
balance at all times between having too much and too little in
order to maximize profits. The costs associated with holding
stock, running out of stock, and placing orders must all be
looked at and compared in order to find the right formula for a
particular business.
The raw materials, work-in-process
goods and completely finished goods that are considered to be the
portion of a business's assets those are ready or will be
ready for sale. Inventory represents one of the most important
assets that most businesses possess, because the turnover of
inventory represents one of the primary sources
of revenue generation and subsequent earnings for the company's
shareholders/owners
Being a process house, the company’s inventory constitutes of:
Dyes
Chemicals
Fuel
53 | P a g e
Dyes can be bifurcated into two types:
a. Reactive dyes: These types of dyes are used especially for
cotton cloth. For example; Golden Yellow HER, Orange H2ER,
etc.
b. Disperse Dyes: These types of dyes are utilized for the
polyester cloth. For Example: Rubine B-Red 167, Dark Red 2B,
etc.
Chemicals, also known as intermediaries are used at almost all
the stages. For example: - during washing, drumming, dyeing and
finishing.
The chemicals which company uses are:
Acetic Acid Caustic Soda
Citric Acid Common Salt
DyeAux FinAux
KSD Levecol NID
Manali T.K.P. Ran-SC
Sandosoft CWS Sodium-Hydro-Sulphite
Tangoline UDA Powder
Fuel, in the process house consists of:
(a) Coal
(b) Bagasse
(c) Wood
54 | P a g e
(d) Electricity
The objectives of inventory control are:
Quality – products need to be maintained in as good a condition
as possible while they are being stored. For perishable products
this means not storing them for very long.
Speed – inventories must be in the right place to ensure fast
response to customer requests.
Dependability – the right stock must be in the right place at the
right time to satisfy customer demand. There is no point having
the wrong products in stock.
Flexibility – stock should be managed to allow the operation to
be flexible. For example, that may mean keeping sufficient stock
to allow the operations processes to switch to producing
something else and yet being able to satisfy customers during
that period from existing stock levels.
Cost – if possible the total cost of managing stock levels should
be minimized.
2.2.14 INVENTORY VALUATION METHOD
ABC analysis
The ABC classification process is an analysis of a range of
objects, such as finished products, items lying in Inventory or
customers into three categories. It’s a system of categorization,
with similarities to Pareto analysis, and the method usually
55 | P a g e
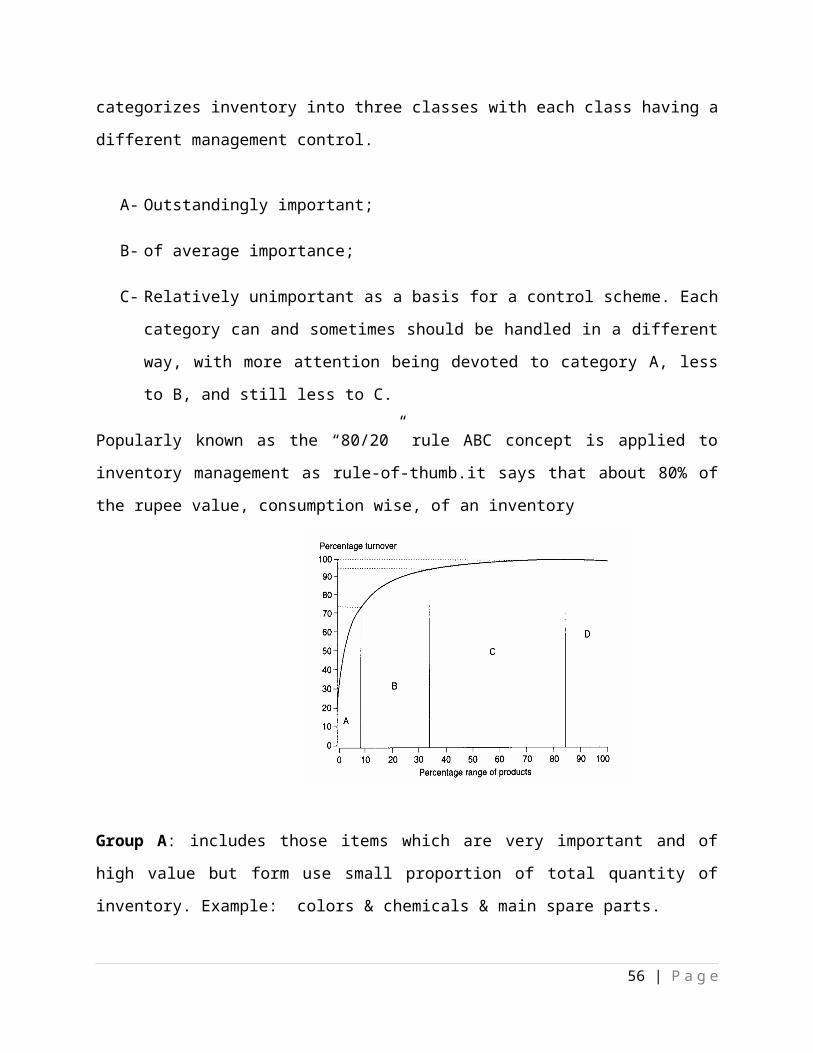
categorizes inventory into three classes with each class having a
different management control.
A- Outstandingly important;
B- of average importance;
C- Relatively unimportant as a basis for a control scheme. Each
category can and sometimes should be handled in a different
way, with more attention being devoted to category A, less
to B, and still less to C.
Popularly known as the “80/20” rule ABC concept is applied to
inventory management as rule-of-thumb.it says that about 80% of
the rupee value, consumption wise, of an inventory
Group A: includes those items which are very important and of
high value but form use small proportion of total quantity of
inventory. Example: colors & chemicals & main spare parts.
56 | P a g e
Group B: includes those items which are less important and of
low value but form use large proportion of items they group A.
Example: Bagasse & other fuels
Group C: the remaining items must be placed in category C.
VED analysis
As per VED classification, items can be divided in three groups:
Vital items
Essential items
Desirable items
VITAL ITEMS:
They are those items without which production will stop
instantly. All raw materials are vital items. For example:
colors, chemicals, grey, etc
ESSENTIAL ITEMS: - They are those items without which production
may not stop instantly but there can be problems like slow-down
of production. Example: Coal, bagasse.etc
DESIRABLE ITEMS: - They are those items without which production
may not stop instantly nor it will slow down but there may be
some inconvenience in manufacturing. For example: trolleys.
2.2.15 INVENTORY MANAGEMENT
57 | P a g e
The inventory plays an important role in the capital investment
and balance sheet of the business. Shree Ram Designs (P) ltd.
being a process house constitutes more than 200 items in its
inventory. As inventory management policy, the company implies
nothing scientifically. It is the trend that they manage it on
the basis of their experience. The below is the record of EOQ and
Re-Order Level of few inventories. The production department
intimates his daily requisition to the store manager and thereby
to the purchase department and order is being placed for the
same, after going through the last purchases done.
CHEMICALS
The chemicals which company uses are:
Acetic Acid Caustic Soda
Citric Acid Common Salt
DyeAux FinAux
KSD Levecol NID
Manali T.K.P. Ran-SC
Sandosoft CWS Sodium-Hydro-Sulphite
Tangoline UDA Powder
It can be seen that the EOQ and ROL for the chemicals are more in
most cases than actual practice. Therefore, it can be appreciated
that the co., without being stock-out blocks only needed amount
of working capital.
FUELS
58 | P a g e
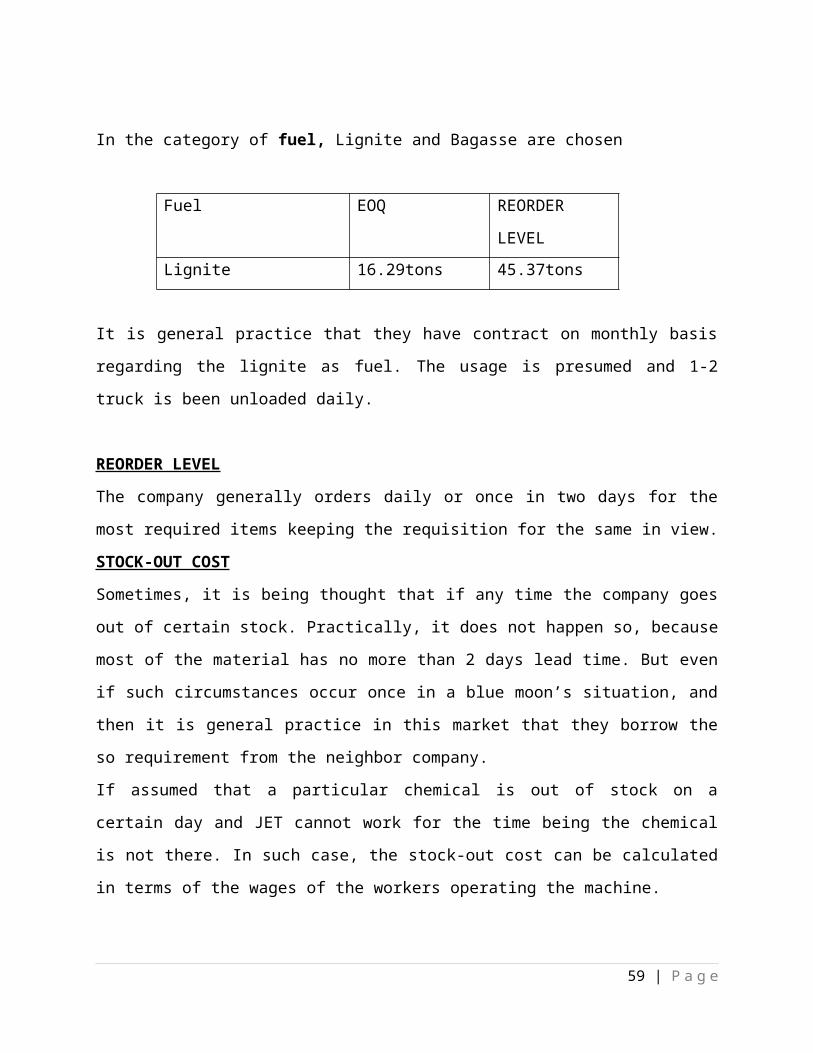
In the category of fuel, Lignite and Bagasse are chosen
Fuel EOQ REORDER
LEVELLignite 16.29tons 45.37tons
It is general practice that they have contract on monthly basis
regarding the lignite as fuel. The usage is presumed and 1-2
truck is been unloaded daily.
REORDER LEVEL
The company generally orders daily or once in two days for the
most required items keeping the requisition for the same in view.
STOCK-OUT COST
Sometimes, it is being thought that if any time the company goes
out of certain stock. Practically, it does not happen so, because
most of the material has no more than 2 days lead time. But even
if such circumstances occur once in a blue moon’s situation, and
then it is general practice in this market that they borrow the
so requirement from the neighbor company.
If assumed that a particular chemical is out of stock on a
certain day and JET cannot work for the time being the chemical
is not there. In such case, the stock-out cost can be calculated
in terms of the wages of the workers operating the machine.
59 | P a g e
MAJOR SUPPLIERS OF THE INVENTORY
1. DYES: - Color-Tex (P) Ltd., Anubha Polyweaves (P) Ltd.; an
agency of Spectrum, Tanmay Traders, etc.
2. CHEMICALS: - Manali Gum Industries (P) Ltd., United Organic,
Dye cells India, etc.
3. FUEL: - Parth Traders, G.M.D.C. for lignite and Gujarat
Electricity Board for Electricity.
2.2.16 PURCHASE DEPARTMENT
Every aspect of organization for the manufacturing of the product
like sundries,
stationary, parts of machineries that can be available locally,
chemicals and dyes etc. have to be purchase locally from the
local markets. These are usually the general items, involve local
purchase. For the purchase of machines, machinery that is not
available in the local market, import department involves in such
purchases. This whole import department is concerned with the
high involvement machinery. Things are purchased according the
buyer demand. No buying is done without the order. As such no
inventory level is maintained for such goods as these goods are
utilized immediately and plan is made for the minimum for the
week.
Three most important documents used in the purchase department
are:
60 | P a g e
Store Plan: - Store plan comes from the purchase & store
requisition. a level of all the colors & chemicals are
maintained in the storage dept. colors & chemicals which are
very commonly used are kept in good quantity & rare used are
kept with minimum fixed level. Purchase is made prior to 4-5
days before when it will be required and it is not available
in stock.
MPR: Material Procurement Recognition: - Every department
issues this then the purchase department is responsible for
procurement.
MRP: Material Requirement and Planning: - This document is
used within factory for issuing the material.
61 | P a g e
2.2.17 QUALITY CONTROL SYSTEM
Quality Control refers to setting certain standards for
production and matching production with those standards.
Management of every company is specially committed to the good
quality both in production and end results. The Management of SRM
has been successful in creating and maintaining the quality
culture in the organization. Daily quality report is sent to the
manager.
Quality Control Process
The process of quality control starts from the suppliers and ends
at customer. They start quality control right from the receiving
of grey to purchase of chemicals, dyes and other materials. For
this purpose, inspection is made to see whether the purchased
material is up to required quality standard or not. If not, it is
rejected. If accepted, Dyes and chemicals are also examined for
their brands, proper combinations, quality, colors and other
characteristics.
Inspection for quality standards is made throughout the step by
step manufacturing process, especially during grey inspection for
weight, width and blend ratio.
Some of the important tests carried out are:
Weight check and measure
Quality check and measure
62 | P a g e
Construction check and measure
Blend ratio check and measure
Size % check and measure
Absorbency check and measure
Whitener check and measure
pH check and measure
Washing fastness check and measure
Light check and measure
Shrinkage check and measure
Staring check and measure
2.2.18 CHEMICALS USED:
ACETIC ACID: - This chemical is used during the process of
dyeing. It helps to maintain basic ‘pH’ level, thereby helps
for better leveling of the dyes. After being purchased, Acetic
Acid is sent for Lab Testing, where it is observed that if its
freezing point is -4 degree Celsius and it constitutes 98% of
Glacial Acetic Acid. The lead time for this chemical is 1
week.
CAUSTIC SODA: - Caustic Soda is used during Drumming of the
cloth. It acts as a swelling agent. It helps in opening up all
the pores of the yarn and thereby discarding the impurities.
It also helps in better penetration of the dyes in the cloth.
Caustic Soda Flakes constitutes 90% of Common Salt. Its lead
time is 3 days.
63 | P a g e
CITRIC ACID: - Citric Acid helps to retain the brightness of
the dyes during the finish process Citric Acid is also used as
a substitute of Acetic Acid at some crucial stages, where the
latter turns to be volatile. Its lead time is 2 days. During
heat setting, sometimes Acetic Acid loses its strength after
drying, in such case Citric Acid is used in place of Acetic
Acid.
COMMON SALT: - It is a cheap substitute of Caustic Soda. It is
seasonal item, not available in rainy season. Its lead time is
4 days. The co. purchases it from Bhuj in Gujarat.
DYEAUX: - The DyeAux is used at the stage of dyeing of the
cloth. It is a Dyeing Auxiliary, helps in increasing the
fastness of the color. Its lead time is 2 days.
FINAUX: - This is a chemical used at the time of giving finish
to the fabric. It is used for better smoothening of the cloth.
Its lead time is 2 days.
KSD: - This chemical is being used at almost all stages. It is
deforming agent, prevents the formation of foam during the
process; be it; washing, dyeing, bleaching, Stentering,
printing or padding. Its lead time is 5-6 hours.
LEVECOL NID: - It is a cleaning agent, used while washing and
bleaching the cloth. It helps in removing stains and dirt. Its
lead time is 2 days.
MANALI T.K.P.: - This is a type of gum, acts as major
constituent in printing paste. It is 100% natural product made
64 | P a g e
out of ‘Gawar seeds’. It is seasonal item and is scarce in
rainy season. Its lead time is 1 week.
RAN-SC: - This chemical is used during finish. It acts a major
thickening agent, helps in filling up the fibers of the
fabric. Its lead time is 14 days. The co. purchases this item
from Nagpur.
SANDOSOFT CWS: - Sandosoft CWS is used during finish stage on
stenter. It is used to get better lusture feel of the fabric.
Its lead time is 2 days.
SODIUM-HYDRO-SULPHITE: - It is used during bleaching and
washing after printing. It removes all the impurities
including extra chemicals and dyes present in the fabric
during the process. Its lead time is 5 days.
The above chemicals constitute upto 34% of the total cost of the
entire process. There is no fixed cost of an individual
chemical. The contribution to cost of each and evcery chemical
varies as per the requirement of the quality and colour of the
order.
65 | P a g e
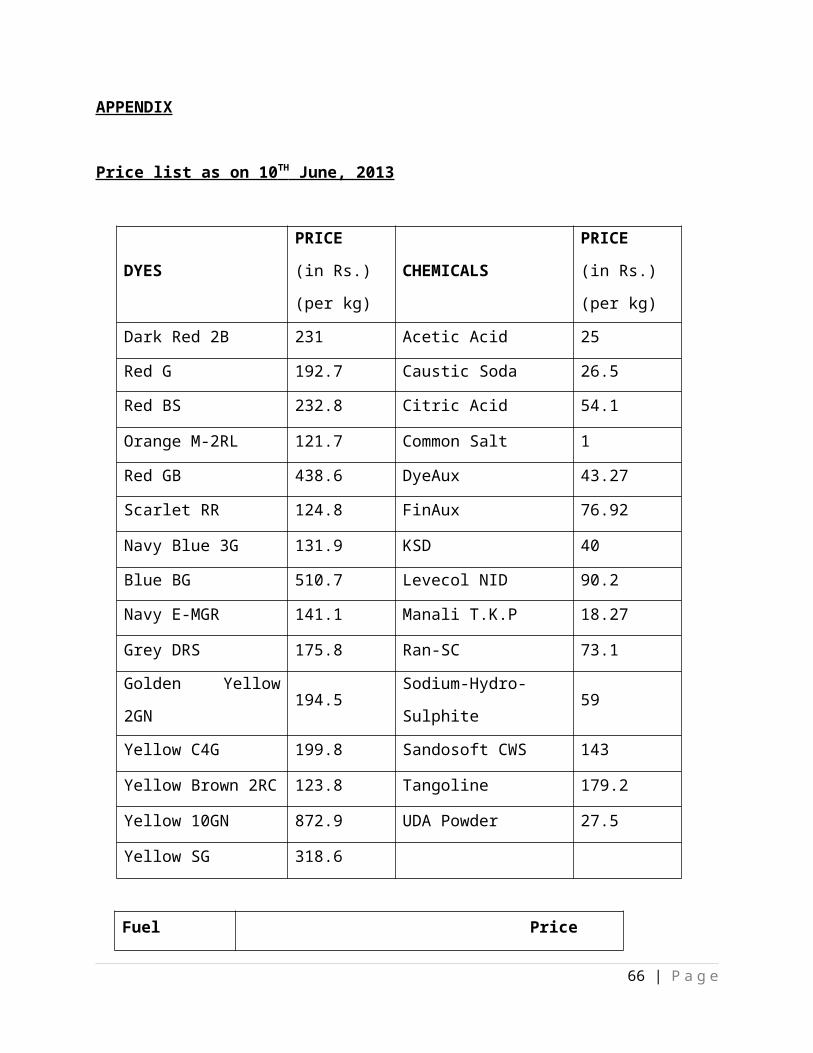
APPENDIX
Price list as on 10 TH June, 2013
DYES
PRICE
(in Rs.)
(per kg)
CHEMICALS
PRICE
(in Rs.)
(per kg)
Dark Red 2B 231 Acetic Acid 25
Red G 192.7 Caustic Soda 26.5
Red BS 232.8 Citric Acid 54.1
Orange M-2RL 121.7 Common Salt 1
Red GB 438.6 DyeAux 43.27
Scarlet RR 124.8 FinAux 76.92
Navy Blue 3G 131.9 KSD 40
Blue BG 510.7 Levecol NID 90.2
Navy E-MGR 141.1 Manali T.K.P 18.27
Grey DRS 175.8 Ran-SC 73.1
Golden Yellow
2GN194.5
Sodium-Hydro-
Sulphite59
Yellow C4G 199.8 Sandosoft CWS 143
Yellow Brown 2RC 123.8 Tangoline 179.2
Yellow 10GN 872.9 UDA Powder 27.5
Yellow SG 318.6
Fuel Price
66 | P a g e
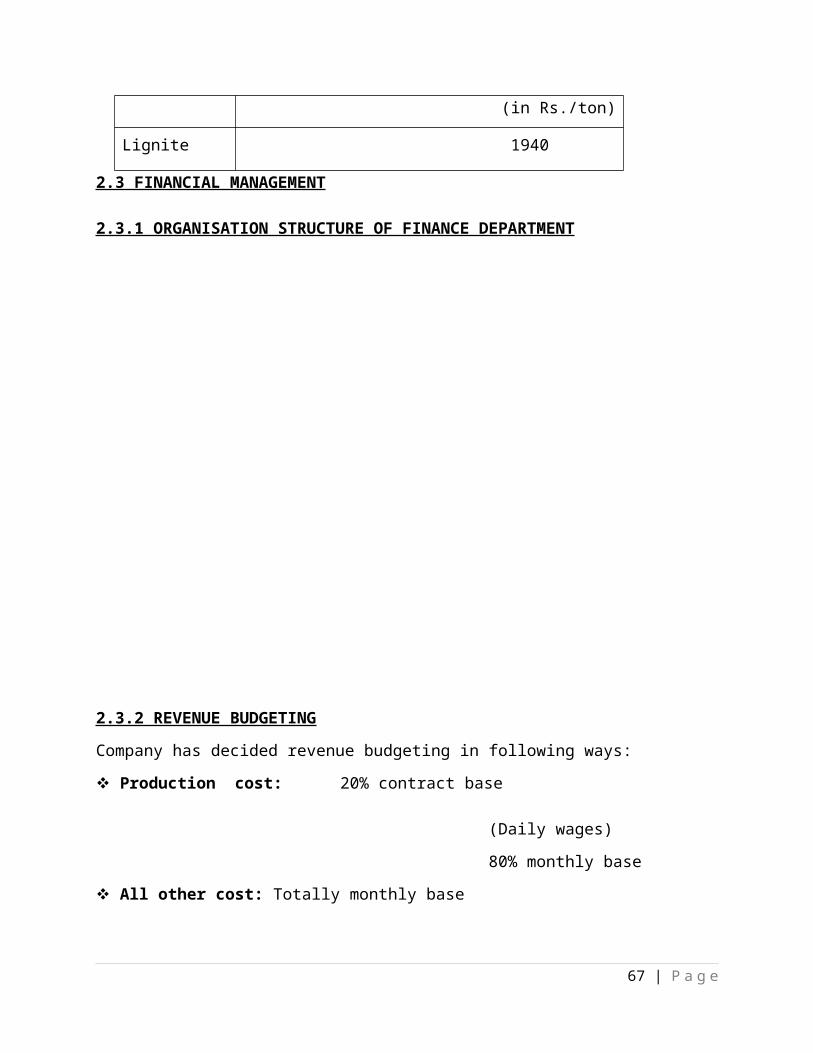
(in Rs./ton)
Lignite 1940
2.3 FINANCIAL MANAGEMENT
2.3.1 ORGANISATION STRUCTURE OF FINANCE DEPARTMENT
2.3.2 REVENUE BUDGETING
Company has decided revenue budgeting in following ways:
Production cost: 20% contract base
(Daily wages)
80% monthly base
All other cost: Totally monthly base
67 | P a g e
DirectorBankingInsuranceTime Keeper
2.3.3 COSTING METHOD
Cost is calculated on the basis of batch.
Factors affecting the cost:
Labor
Raw material
Machinery
Maintenance
Electricity
Transportation
Dyes
Chemical
Gas
The total cost of
Classification of Cost in Different Categories
In order to make the job more easily, cost are classified into
different categories. The classification is as follows:
Fuel:
Coal and Lignite
Gas
68 | P a g e
Electricity
Diesel
Oil
Salary:
Salary
Labor (to contractor)
Wages
Color/ Chemical
Administrative expense
Other Expenses
Interest
Octroi
Packing
Store
Thread
Water
Other expense
2.3.4 COST STRUCTURE
Cost is anything incurred for producing a particular product or
service which is valuable in terms of money. And costing is
defined as a “technique & process of ascertaining cost.” Cost structure is
a statement showing all the cost incurred in the firm while
production process is taken place. The cost structure of this
firm is as follows:-
69 | P a g e
Direct Expenses: -
a) Colour
b) Chemical
c) Coal
d) Carriage/ Transport Expenses for bringing Grey
e) Labour Wages
Indirect Expenses
Factory Expenses: -
a) Electricity
b) Salary to Operators
c) Raw Material Testing
d) Stores
e) Maintenance of Machinery
f) Depreciation of Machinery
70 | P a g e
Administrative Expenses:-
a) Salary to Directors
b) Salary to Master
c) Salary to Supervisors
d) Salary to other Staff members
Selling Expenses:-
a) Packing
b) Transportation Cost
c) Sampling for Display
d) Collection
Other Expenses:-
a) Water Treatment
b) Sewage and Waste Treatment Plant
c) Printing
2.3.5 CAPITAL BUDGETING
Capital budgeting is a process of planning expenditures incurred
on assets whose cash flow is expected to range beyond one year.
In other words, it is defined as a process that requires planning
for setting up budgets on projects expected to have long-term
implications. It can be used for processes such as the purchase
of new equipment or launching of a new product in the market.
Businesses prefer to intricately study a project before taking it
on, as it has a great impact on the Company’s Financial
Performance.
71 | P a g e
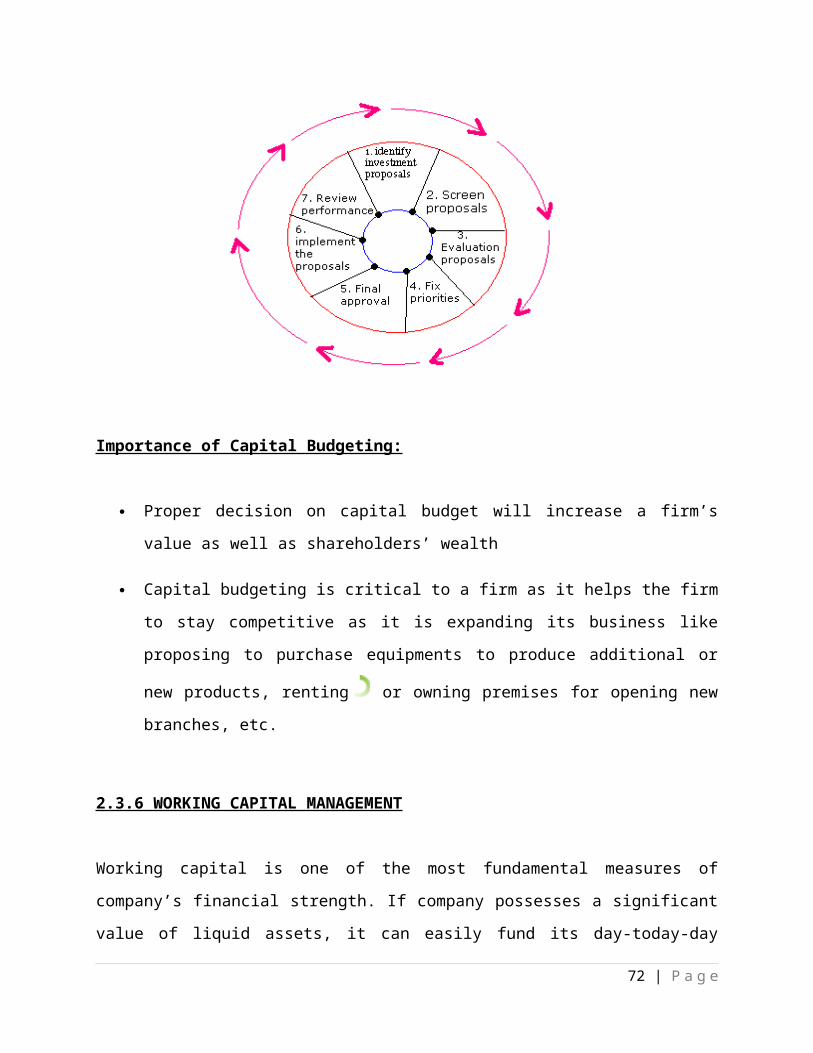
Importance of Capital Budgeting:
Proper decision on capital budget will increase a firm’s
value as well as shareholders’ wealth
Capital budgeting is critical to a firm as it helps the firm
to stay competitive as it is expanding its business like
proposing to purchase equipments to produce additional or
new products, renting or owning premises for opening new
branches, etc.
2.3.6 WORKING CAPITAL MANAGEMENT
Working capital is one of the most fundamental measures of
company’s financial strength. If company possesses a significant
value of liquid assets, it can easily fund its day-today-day
72 | P a g e
business obligation. Working capital also provides insight on how
efficiency a company’s management able to oversee the company
operation. The speed at which the company is able to manage its
short term assets and short term liabilities are also crucial to
its business success. Keeping working capital level to minimum
required for efficient operation keeps cost down. This means
controlling buying, handling, storing, and managing stock
property.
In simple terms, working capital refers to the cash a company
requires in order to finance its day to day business operation or
In other words, working capital refers to the amount of capital
which is already available to an organization. The term working
capital is more an accounting term a management concept. There
are two concept of working capital for the purpose of definition-
Gross concept and Net concept. Gross concept refers to firm’s
current assets. The firm’s total current assets are termed as
gross working capital .net concept refers to current assets less
current liabilities. That means, working capital is difference
between resources in cash or readily convertible into cash will
soon be required.
Working Capital= Current Assets – Current Liabilities
The total working capital of the company is Rs.3, 63, 53,612.
Statement Showing Flow Of Funds (in ‘000 Rs)Sources of Funds Amt Application of Funds Amt
73 | P a g e
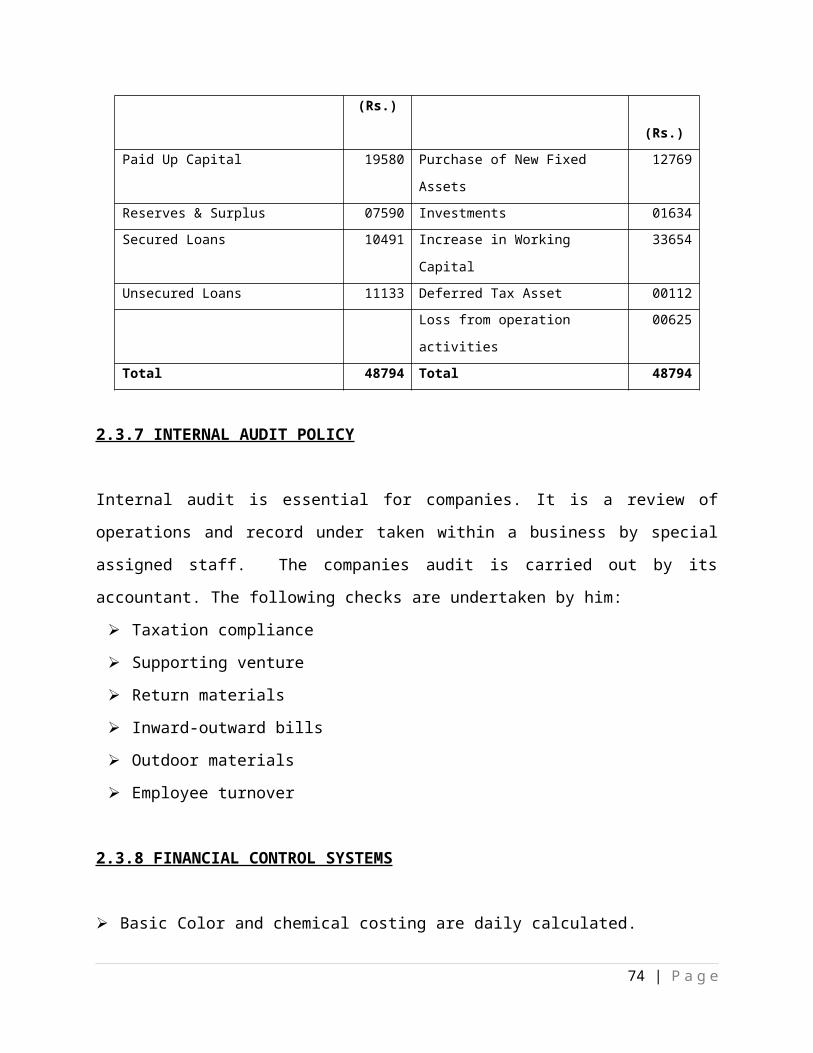
(Rs.)
(Rs.)Paid Up Capital 19580 Purchase of New Fixed
Assets
12769
Reserves & Surplus 07590 Investments 01634Secured Loans 10491 Increase in Working
Capital
33654
Unsecured Loans 11133 Deferred Tax Asset 00112Loss from operation
activities
00625
Total 48794 Total 48794
2.3.7 INTERNAL AUDIT POLICY
Internal audit is essential for companies. It is a review of
operations and record under taken within a business by special
assigned staff. The companies audit is carried out by its
accountant. The following checks are undertaken by him:
Taxation compliance
Supporting venture
Return materials
Inward-outward bills
Outdoor materials
Employee turnover
2.3.8 FINANCIAL CONTROL SYSTEMS
Basic Color and chemical costing are daily calculated.
74 | P a g e
Stock and debtors are daily reporting in marketing department
Sales or profit are monthly and quarterly reporting
Expenses are yearly reporting
2.3.9 ACCOUNTING POLICIES
Basis of preparation of financial statements: - The financial
statements are prepared under the historical cost convention,
on and comply with of accounting standards referred to in
section 211(3C) of the companies act, 1956.
Fixed assets: - Fixed assets (expected land) are stated at
costs and include incidental and installation expenses
incurred in putting the assets to use and less depreciation.
Depreciation: - Depreciation on Fixed Assets has been provided
on Written down Value Method at the rate specified in the
Schedule XIV of the Companies Act, 1956.
Investment: - Investments are stated at cost of acquisition.
Inventories: - Items include Color & Chemicals, Packing
Materials, Coal & Lignite, Fuel, and Consumable Stores &
Spares are valued at Cost. Work in Process includes materials,
labor cost and other relative overheads.
Revenue Recognition: - Revenue is recognized on its accrual,
sales is accounted when goods are supplied and recorded net of
trade discount and rebates but including excise duty and value
added tax. Late payment charges/ discounts are recognized on
the ground of prudence as and when recovered.
75 | P a g e
Retirement Benefits: - Estimated liability for gratuity on the
Balance Sheet date has not been quantified, the same is
accounted for on actual payment basis.
Borrowing Cost: - Borrowing costs that are directly
attributable to the acquisition, construction or production of
qualifying assets are capitalized as part of the cost of the
asset. Other borrowing costs are recognized as an expense in
the period in which they are incurred.
Segment Accounting: - The company has identified only one
segment viz. TEXTILES, and commission income credited is also
identified to be relating to textile segment exclusively.
Deferred Taxation: - In accordance with the accounting
standard 22, accounting for taxes on income, issued by the
institute of chartered accountants of India (‘ICAI’), the
company has provided for deferred tax at 31st march, 2013.
Deferred tax resulting from timing differences between boo k
and tax profits is accounted for, at the current rate of tax,
to extent that the timing differences are expected to
crystallize.
Deferred tax on account of unabsorbed depreciation and other
provisions are recognized only when there is a virtual certainty
supported by convincing evidence that such assets will be
realized.
2.3.10 INVENTORY VALUATION METHOD
76 | P a g e
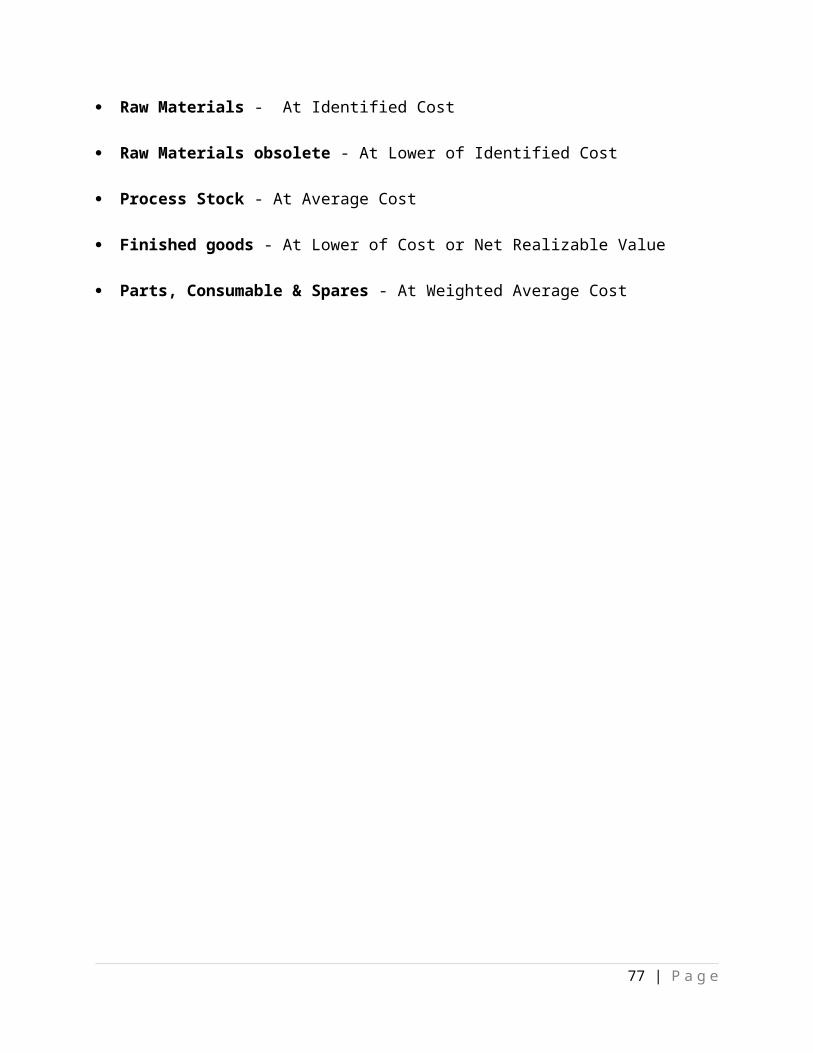
Raw Materials - At Identified Cost
Raw Materials obsolete - At Lower of Identified Cost
Process Stock - At Average Cost
Finished goods - At Lower of Cost or Net Realizable Value
Parts, Consumable & Spares - At Weighted Average Cost
77 | P a g e
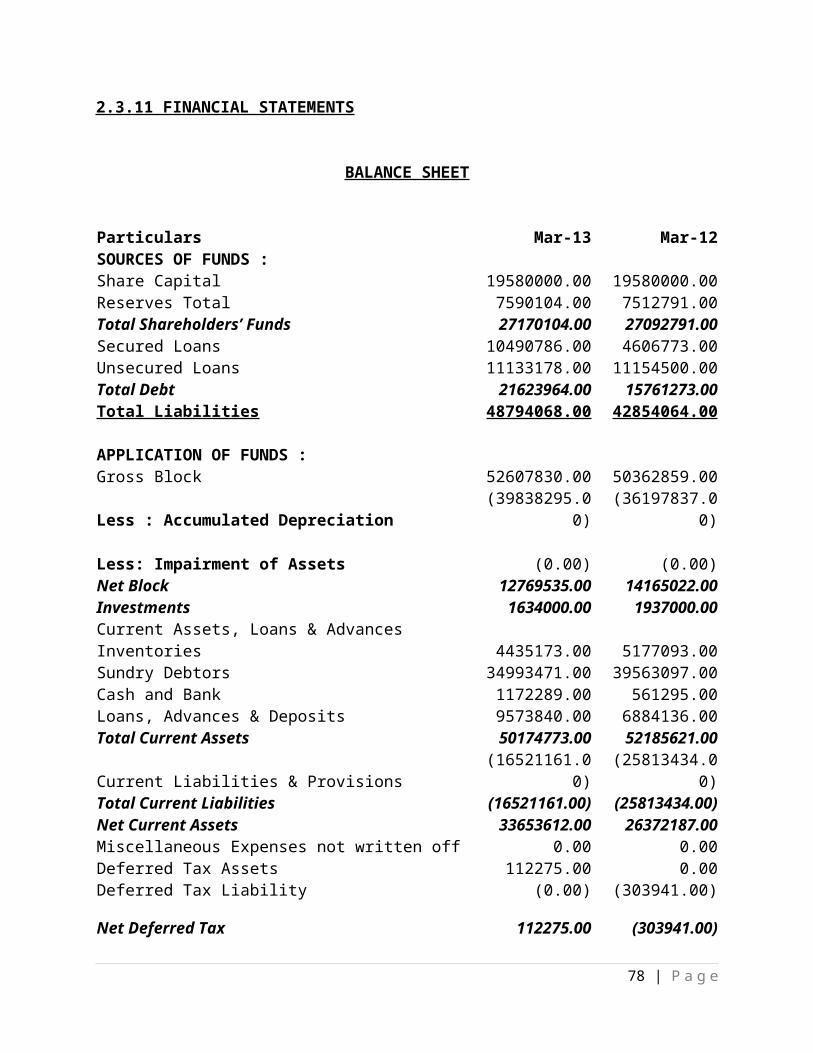
2.3.11 FINANCIAL STATEMENTS
BALANCE SHEET
Particulars Mar-13 Mar-12SOURCES OF FUNDS :Share Capital 19580000.00 19580000.00Reserves Total 7590104.00 7512791.00Total Shareholders’ Funds 27170104.00 27092791.00Secured Loans 10490786.00 4606773.00Unsecured Loans 11133178.00 11154500.00Total Debt 21623964.00 15761273.00Total Liabilities 48794068.00 42854064.00
APPLICATION OF FUNDS :Gross Block 52607830.00 50362859.00
Less : Accumulated Depreciation(39838295.0
0)(36197837.0
0)
Less: Impairment of Assets (0.00) (0.00)Net Block 12769535.00 14165022.00Investments 1634000.00 1937000.00Current Assets, Loans & AdvancesInventories 4435173.00 5177093.00Sundry Debtors 34993471.00 39563097.00Cash and Bank 1172289.00 561295.00Loans, Advances & Deposits 9573840.00 6884136.00Total Current Assets 50174773.00 52185621.00
Current Liabilities & Provisions(16521161.0
0)(25813434.0
0)Total Current Liabilities (16521161.00) (25813434.00)Net Current Assets 33653612.00 26372187.00Miscellaneous Expenses not written off 0.00 0.00Deferred Tax Assets 112275.00 0.00Deferred Tax Liability (0.00) (303941.00)
Net Deferred Tax 112275.00 (303941.00)
78 | P a g e
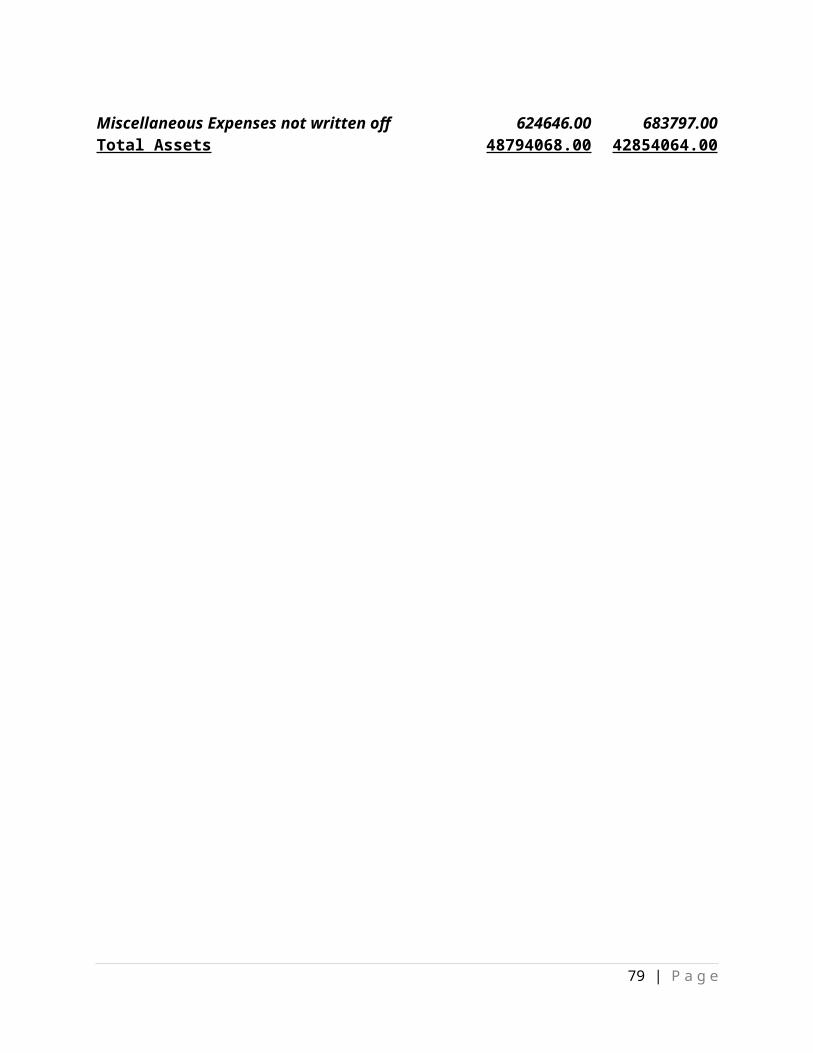
Miscellaneous Expenses not written off 624646.00 683797.00Total Assets 48794068.00 42854064.00
79 | P a g e
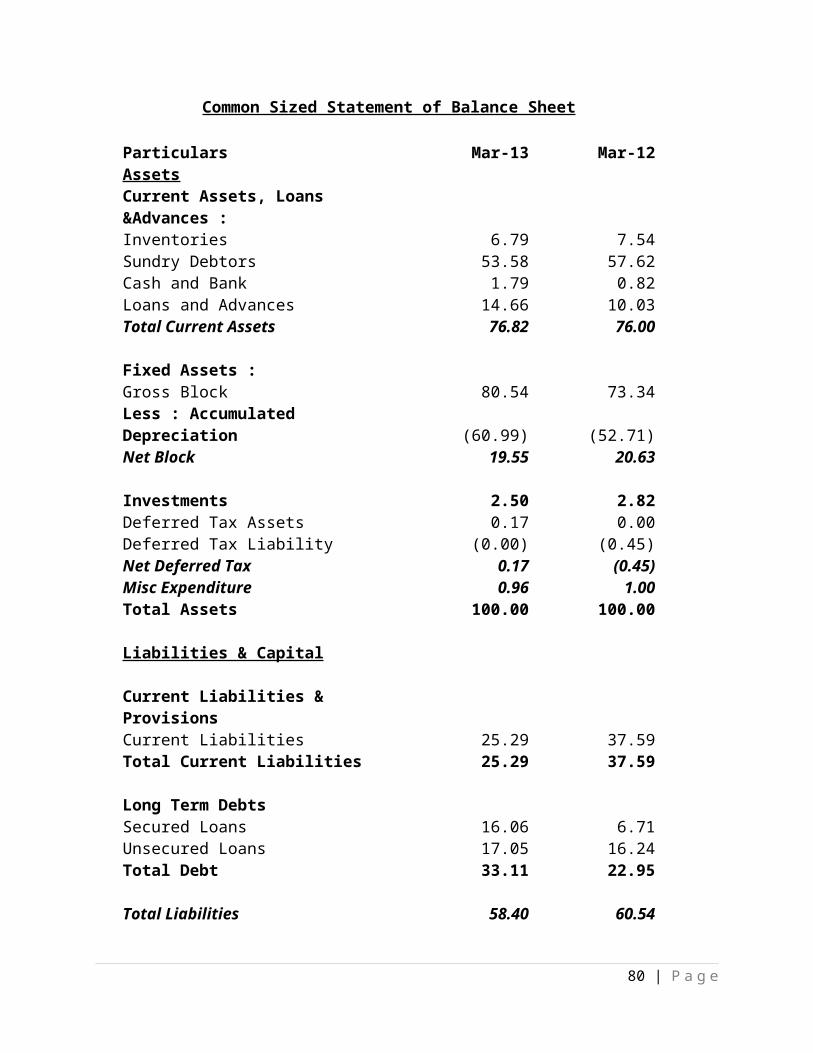
Common Sized Statement of Balance Sheet
Particulars Mar-13 Mar-12AssetsCurrent Assets, Loans &Advances :Inventories 6.79 7.54Sundry Debtors 53.58 57.62Cash and Bank 1.79 0.82Loans and Advances 14.66 10.03Total Current Assets 76.82 76.00
Fixed Assets :Gross Block 80.54 73.34Less : Accumulated Depreciation (60.99) (52.71)Net Block 19.55 20.63
Investments 2.50 2.82Deferred Tax Assets 0.17 0.00Deferred Tax Liability (0.00) (0.45)Net Deferred Tax 0.17 (0.45)Misc Expenditure 0.96 1.00Total Assets 100.00 100.00
Liabilities & Capital
Current Liabilities & ProvisionsCurrent Liabilities 25.29 37.59Total Current Liabilities 25.29 37.59
Long Term DebtsSecured Loans 16.06 6.71Unsecured Loans 17.05 16.24Total Debt 33.11 22.95
Total Liabilities 58.40 60.54
80 | P a g e
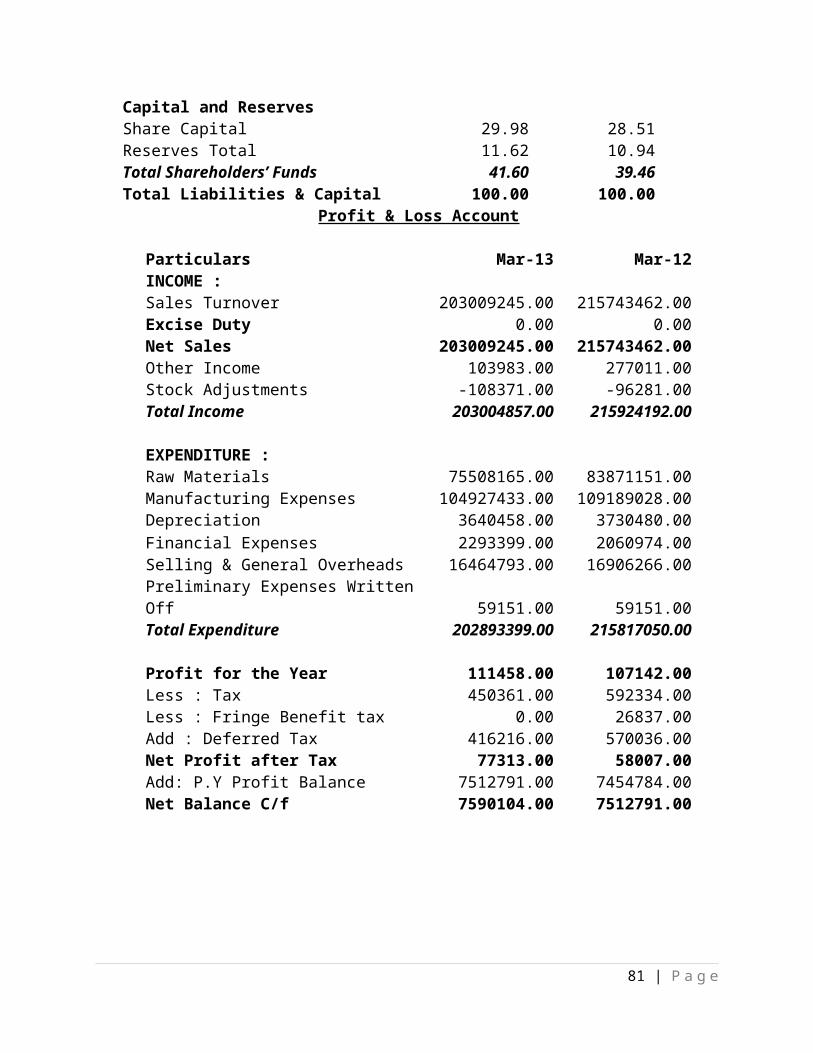
Capital and ReservesShare Capital 29.98 28.51Reserves Total 11.62 10.94Total Shareholders’ Funds 41.60 39.46Total Liabilities & Capital 100.00 100.00
Profit & Loss Account
Particulars Mar-13 Mar-12INCOME :Sales Turnover 203009245.00 215743462.00Excise Duty 0.00 0.00Net Sales 203009245.00 215743462.00Other Income 103983.00 277011.00Stock Adjustments -108371.00 -96281.00Total Income 203004857.00 215924192.00
EXPENDITURE :Raw Materials 75508165.00 83871151.00Manufacturing Expenses 104927433.00 109189028.00Depreciation 3640458.00 3730480.00Financial Expenses 2293399.00 2060974.00Selling & General Overheads 16464793.00 16906266.00Preliminary Expenses WrittenOff 59151.00 59151.00Total Expenditure 202893399.00 215817050.00
Profit for the Year 111458.00 107142.00Less : Tax 450361.00 592334.00Less : Fringe Benefit tax 0.00 26837.00Add : Deferred Tax 416216.00 570036.00Net Profit after Tax 77313.00 58007.00Add: P.Y Profit Balance 7512791.00 7454784.00Net Balance C/f 7590104.00 7512791.00
81 | P a g e

82 | P a g e
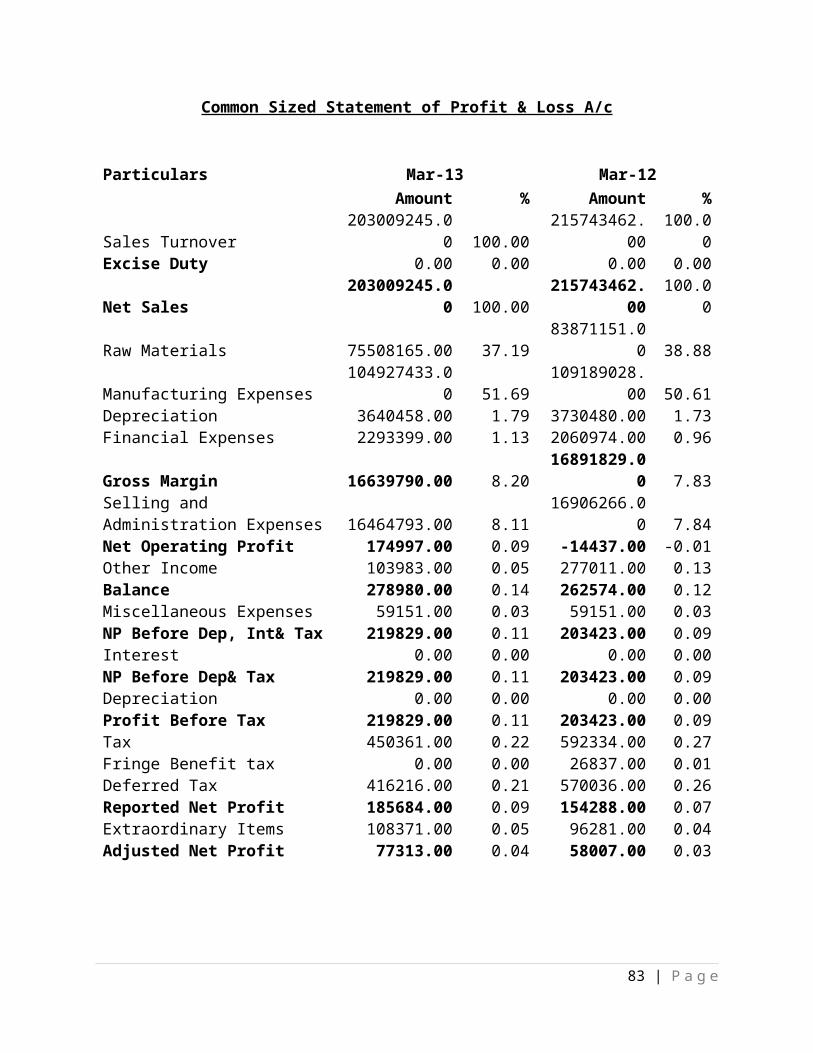
Common Sized Statement of Profit & Loss A/c
Particulars Mar-13 Mar-12Amount % Amount %
Sales Turnover203009245.0
0 100.00215743462.
00100.0
0Excise Duty 0.00 0.00 0.00 0.00
Net Sales203009245.0
0 100.00215743462.
00100.0
0
Raw Materials 75508165.00 37.1983871151.0
0 38.88
Manufacturing Expenses 104927433.0
0 51.69109189028.
00 50.61Depreciation 3640458.00 1.79 3730480.00 1.73Financial Expenses 2293399.00 1.13 2060974.00 0.96
Gross Margin 16639790.00 8.2016891829.0
0 7.83Selling and Administration Expenses 16464793.00 8.11
16906266.00 7.84
Net Operating Profit 174997.00 0.09 -14437.00 -0.01Other Income 103983.00 0.05 277011.00 0.13Balance 278980.00 0.14 262574.00 0.12Miscellaneous Expenses 59151.00 0.03 59151.00 0.03NP Before Dep, Int& Tax 219829.00 0.11 203423.00 0.09Interest 0.00 0.00 0.00 0.00NP Before Dep& Tax 219829.00 0.11 203423.00 0.09Depreciation 0.00 0.00 0.00 0.00Profit Before Tax 219829.00 0.11 203423.00 0.09Tax 450361.00 0.22 592334.00 0.27Fringe Benefit tax 0.00 0.00 26837.00 0.01Deferred Tax 416216.00 0.21 570036.00 0.26Reported Net Profit 185684.00 0.09 154288.00 0.07Extraordinary Items 108371.00 0.05 96281.00 0.04Adjusted Net Profit 77313.00 0.04 58007.00 0.03
83 | P a g e

84 | P a g e
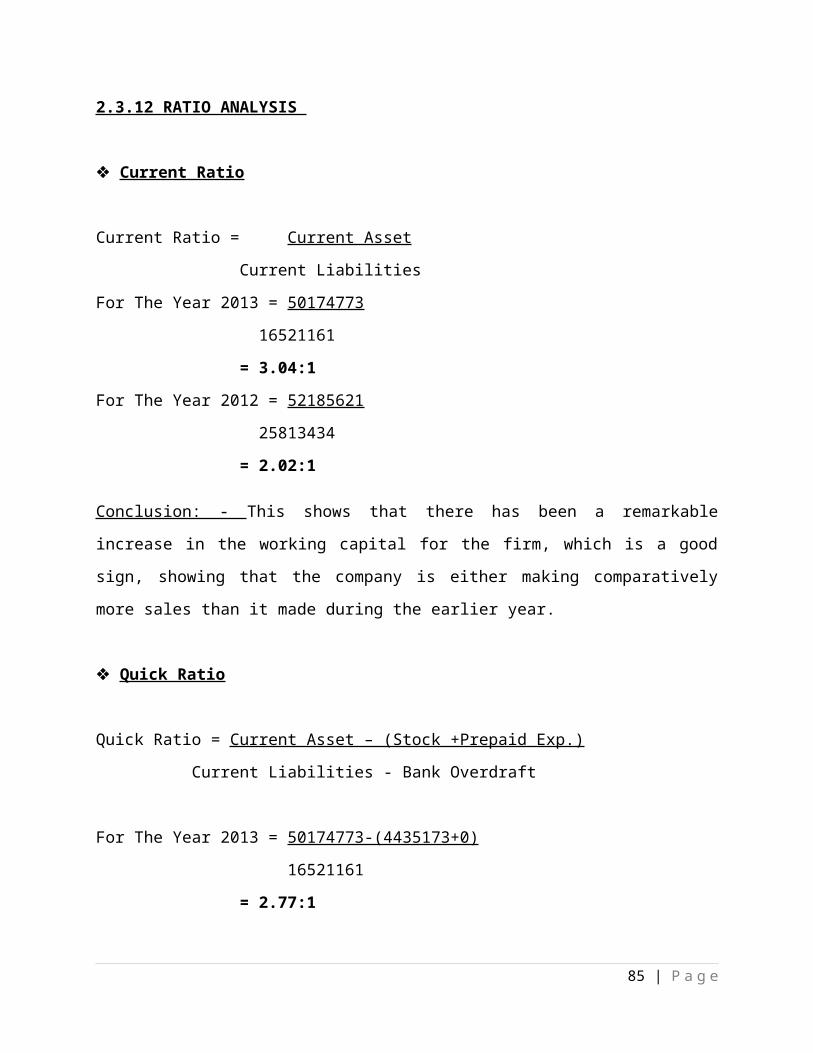
2.3.12 RATIO ANALYSIS
Current Ratio
Current Ratio = Current Asset
Current Liabilities
For The Year 2013 = 50174773
16521161
= 3.04:1
For The Year 2012 = 52185621
25813434
= 2.02:1
Conclusion: - This shows that there has been a remarkable
increase in the working capital for the firm, which is a good
sign, showing that the company is either making comparatively
more sales than it made during the earlier year.
Quick Ratio
Quick Ratio = Current Asset – (Stock +Prepaid Exp.)
Current Liabilities - Bank Overdraft
For The Year 2013 = 50174773-(4435173+0)
16521161
= 2.77:1
85 | P a g e
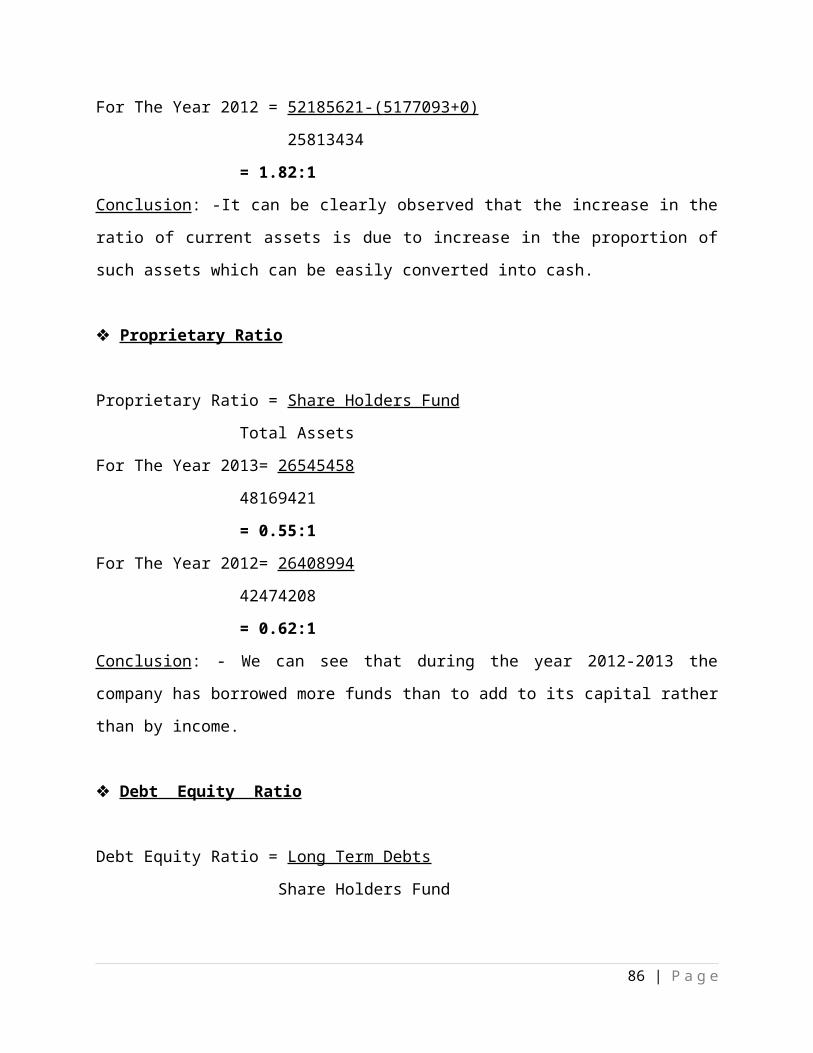
For The Year 2012 = 52185621-(5177093+0)
25813434
= 1.82:1
Conclusion: -It can be clearly observed that the increase in the
ratio of current assets is due to increase in the proportion of
such assets which can be easily converted into cash.
Proprietary Ratio
Proprietary Ratio = Share Holders Fund
Total Assets
For The Year 2013= 26545458
48169421
= 0.55:1
For The Year 2012= 26408994
42474208
= 0.62:1
Conclusion: - We can see that during the year 2012-2013 the
company has borrowed more funds than to add to its capital rather
than by income.
Debt Equity Ratio
Debt Equity Ratio = Long Term Debts
Share Holders Fund
86 | P a g e
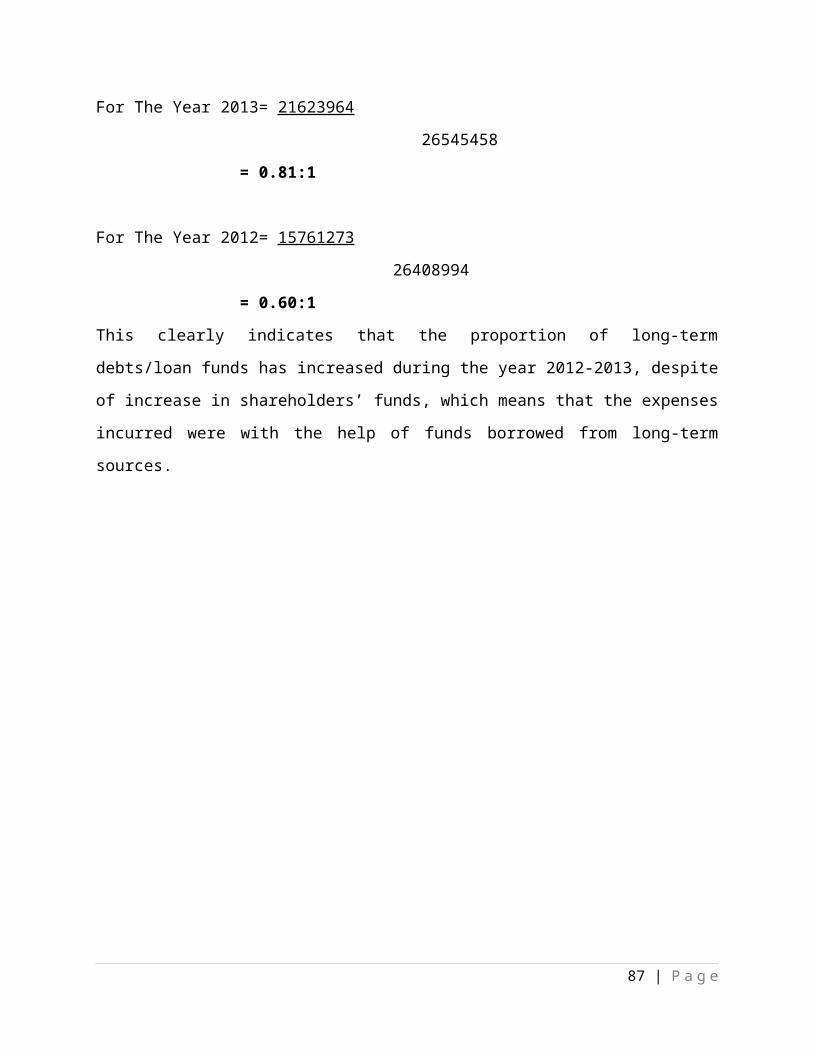
For The Year 2013= 21623964
26545458
= 0.81:1
For The Year 2012= 15761273
26408994
= 0.60:1
This clearly indicates that the proportion of long-term
debts/loan funds has increased during the year 2012-2013, despite
of increase in shareholders’ funds, which means that the expenses
incurred were with the help of funds borrowed from long-term
sources.
87 | P a g e
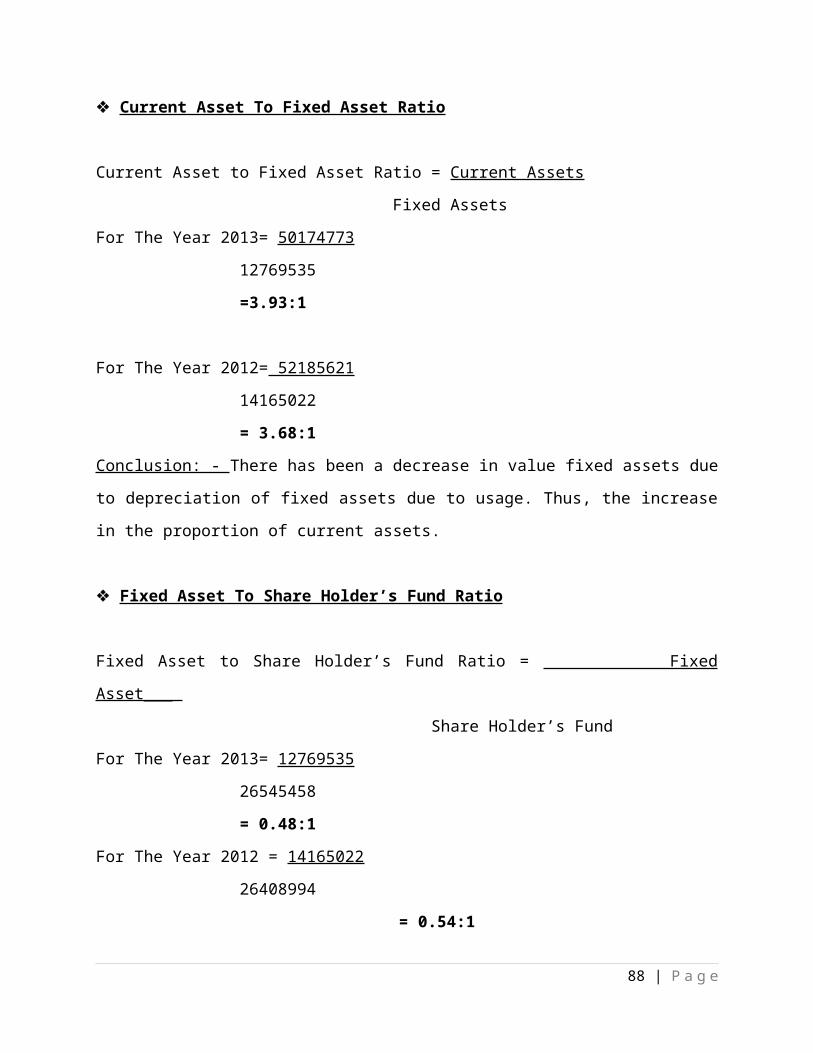
Current Asset To Fixed Asset Ratio
Current Asset to Fixed Asset Ratio = Current Assets
Fixed Assets
For The Year 2013= 50174773
12769535
=3.93:1
For The Year 2012= 52185621
14165022
= 3.68:1
Conclusion: - There has been a decrease in value fixed assets due
to depreciation of fixed assets due to usage. Thus, the increase
in the proportion of current assets.
Fixed Asset To Share Holder’s Fund Ratio
Fixed Asset to Share Holder’s Fund Ratio = Fixed
Asset___
Share Holder’s Fund
For The Year 2013= 12769535
26545458
= 0.48:1
For The Year 2012 = 14165022
26408994
= 0.54:1
88 | P a g e

Conclusion: - The decrease in the proportion of fixed assets to
the shareholders’ funds partly due to depreciation and we can
also see that there has been a slight increase in the value of
shareholders’ funds.
89 | P a g e
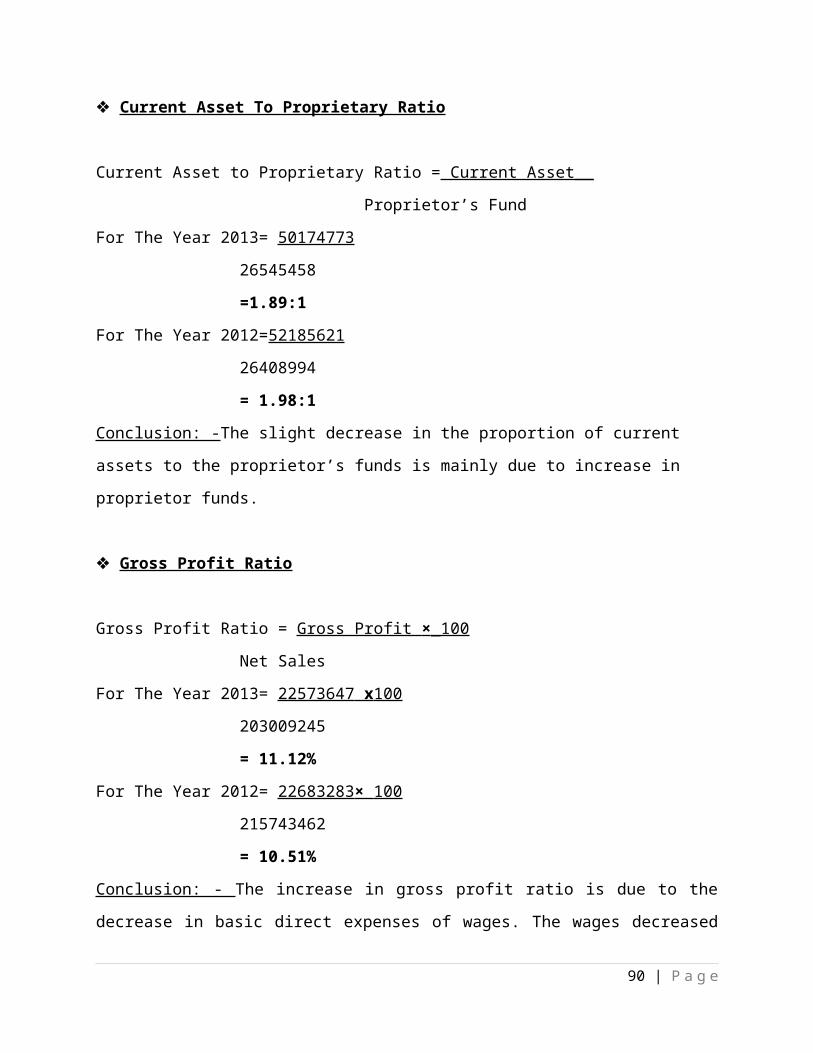
Current Asset To Proprietary Ratio
Current Asset to Proprietary Ratio = Current Asset__
Proprietor’s Fund
For The Year 2013= 50174773
26545458
=1.89:1
For The Year 2012=52185621
26408994
= 1.98:1
Conclusion: -The slight decrease in the proportion of current
assets to the proprietor’s funds is mainly due to increase in
proprietor funds.
Gross Profit Ratio
Gross Profit Ratio = Gross Profit × _100
Net Sales
For The Year 2013= 22573647 x 100
203009245
= 11.12%
For The Year 2012= 22683283 × 100
215743462
= 10.51%
Conclusion: - The increase in gross profit ratio is due to the
decrease in basic direct expenses of wages. The wages decreased
90 | P a g e
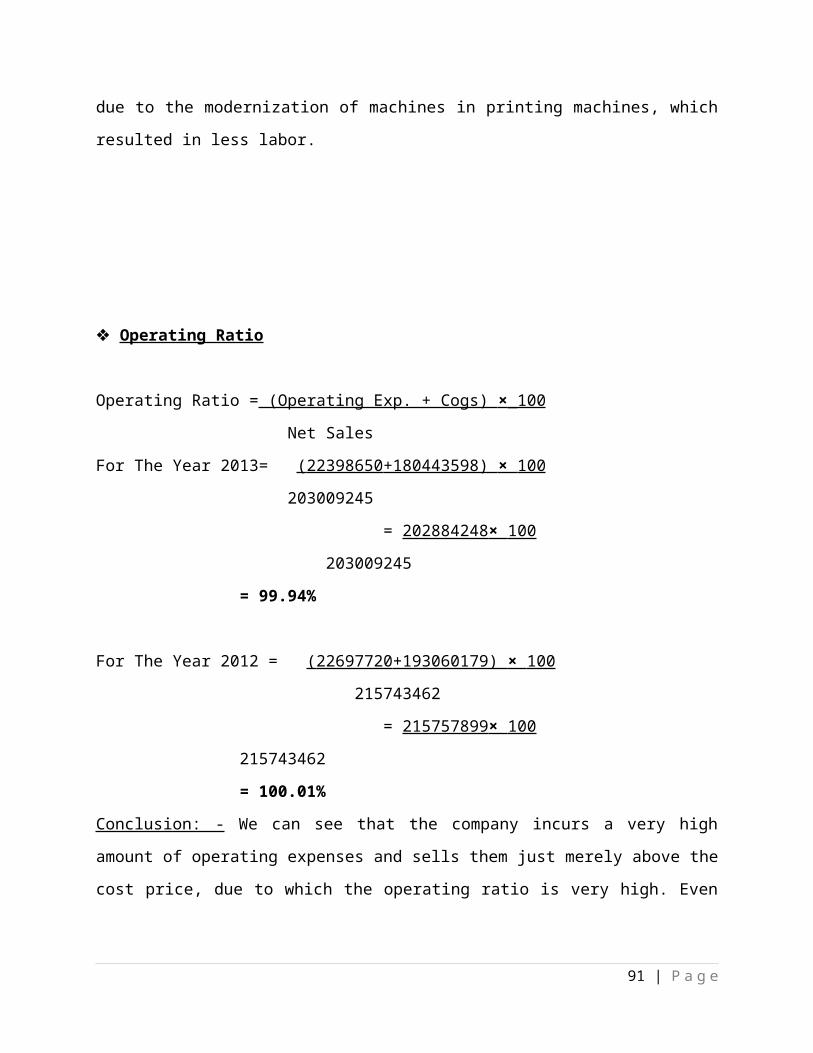
due to the modernization of machines in printing machines, which
resulted in less labor.
Operating Ratio
Operating Ratio = (Operating Exp. + Cogs) × _100
Net Sales
For The Year 2013= ( 22398650 +180443598) × 100
203009245
= 202884248 × 100
203009245
= 99.94%
For The Year 2012 = ( 22697720 +193060179) × 100
215743462
= 215757899 × 100
215743462
= 100.01%
Conclusion: - We can see that the company incurs a very high
amount of operating expenses and sells them just merely above the
cost price, due to which the operating ratio is very high. Even
91 | P a g e
the small decrease in the operating ratio was due to
improvisation in the production techniques.
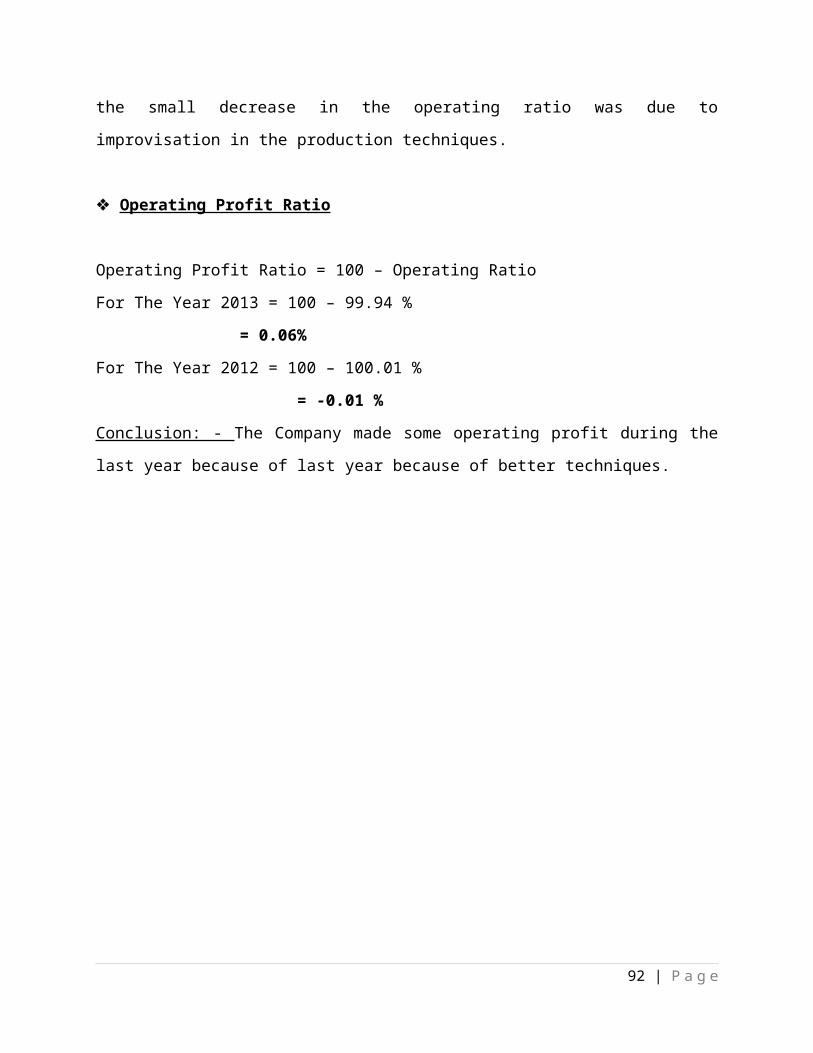
Operating Profit Ratio
Operating Profit Ratio = 100 – Operating Ratio
For The Year 2013 = 100 – 99.94 %
= 0.06%
For The Year 2012 = 100 – 100.01 %
= -0.01 %
Conclusion: - The Company made some operating profit during the
last year because of last year because of better techniques.
92 | P a g e
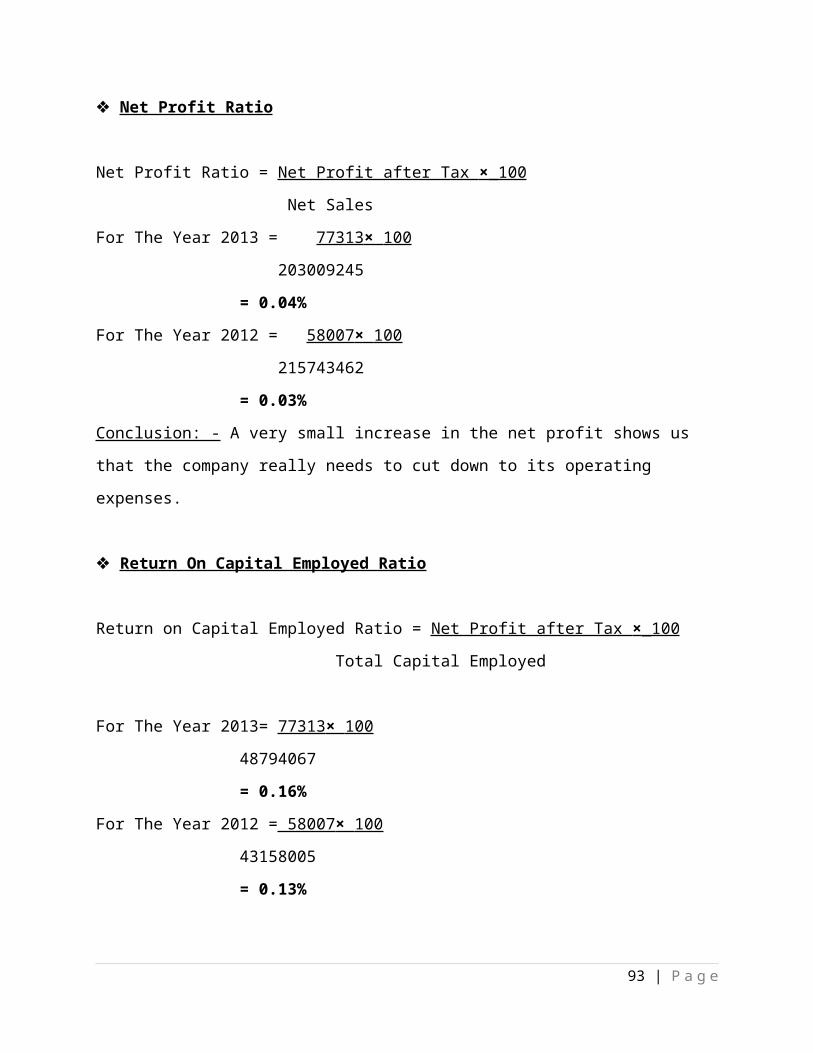
Net Profit Ratio
Net Profit Ratio = Net Profit after Tax × _100
Net Sales
For The Year 2013 = 77313 × 100
203009245
= 0.04%
For The Year 2012 = 58007 × 100
215743462
= 0.03%
Conclusion: - A very small increase in the net profit shows us
that the company really needs to cut down to its operating
expenses.
Return On Capital Employed Ratio
Return on Capital Employed Ratio = Net Profit after Tax × _100
Total Capital Employed
For The Year 2013= 77313 × 100
48794067
= 0.16%
For The Year 2012 = 58007 × 100
43158005
= 0.13%
93 | P a g e
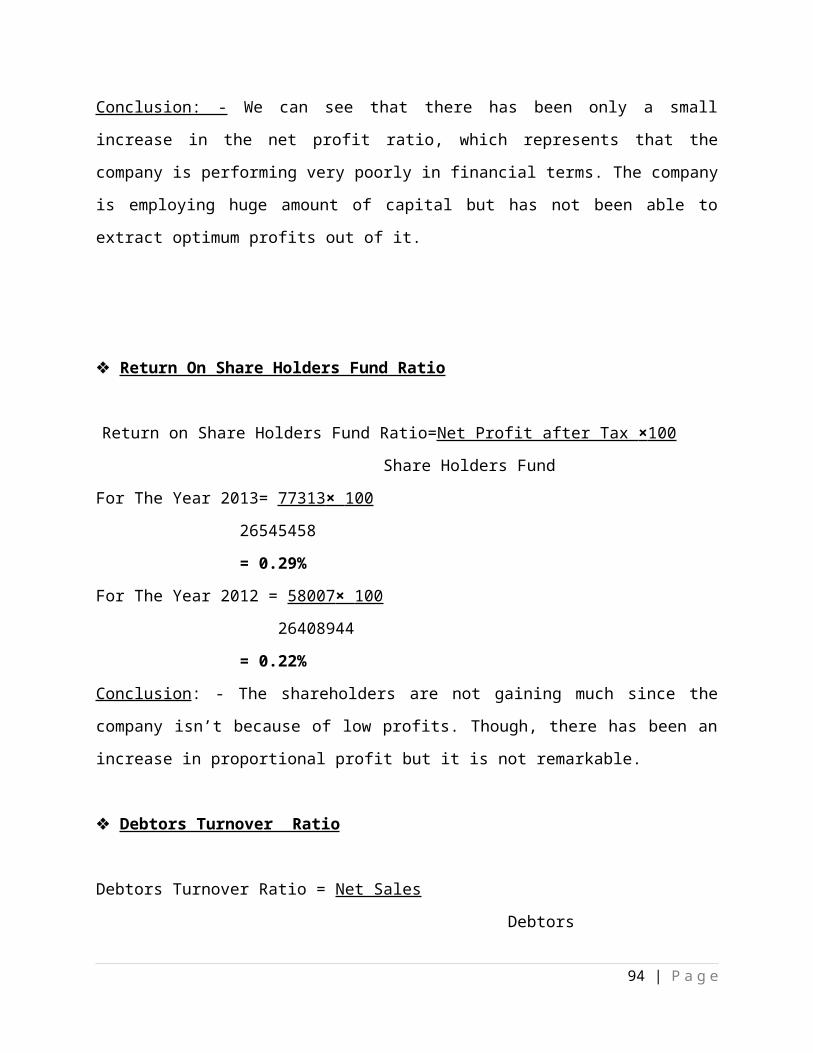
Conclusion: - We can see that there has been only a small
increase in the net profit ratio, which represents that the
company is performing very poorly in financial terms. The company
is employing huge amount of capital but has not been able to
extract optimum profits out of it.
Return On Share Holders Fund Ratio
Return on Share Holders Fund Ratio=Net Profit after Tax × 100
Share Holders Fund
For The Year 2013= 77313 × 100
26545458
= 0.29%
For The Year 2012 = 58007 × 100
26408944
= 0.22%
Conclusion: - The shareholders are not gaining much since the
company isn’t because of low profits. Though, there has been an
increase in proportional profit but it is not remarkable.
Debtors Turnover Ratio
Debtors Turnover Ratio = Net Sales
Debtors
94 | P a g e
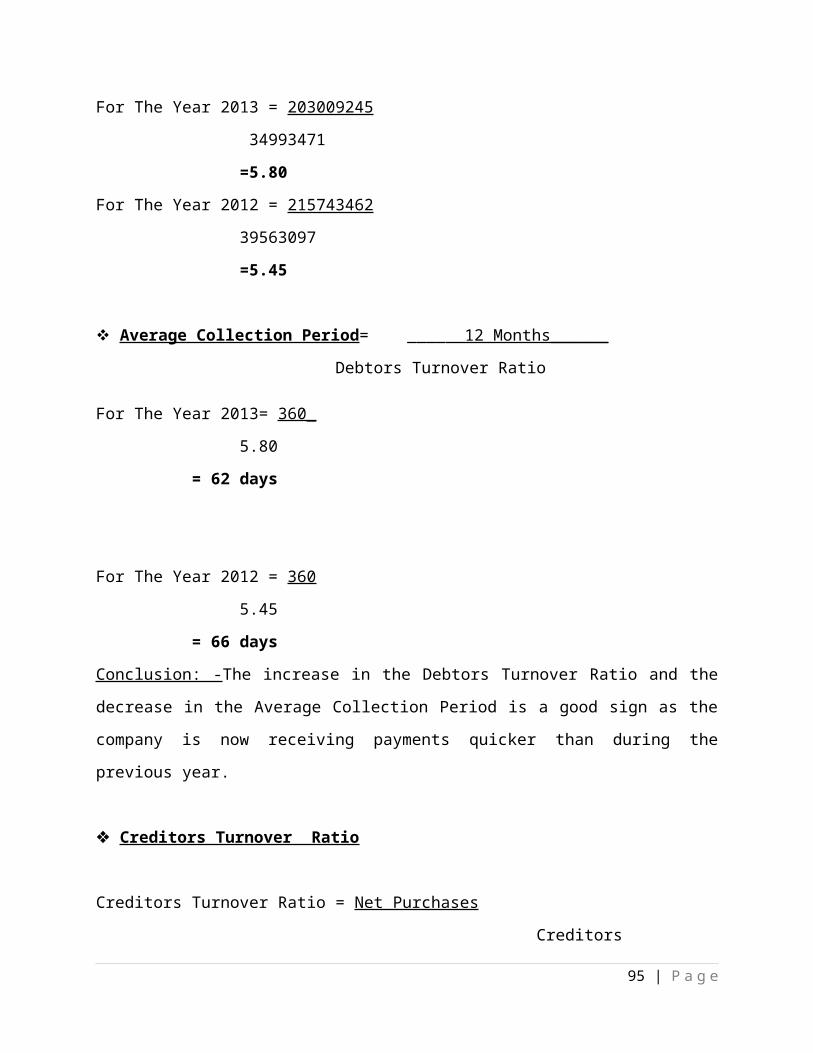
For The Year 2013 = 203009245
34993471
=5.80
For The Year 2012 = 215743462
39563097
=5.45
Average Collection Period = ____ 12 Months______
Debtors Turnover Ratio
For The Year 2013= 360_
5.80
= 62 days
For The Year 2012 = 360
5.45
= 66 days
Conclusion: -The increase in the Debtors Turnover Ratio and the
decrease in the Average Collection Period is a good sign as the
company is now receiving payments quicker than during the
previous year.
Creditors Turnover Ratio
Creditors Turnover Ratio = Net Purchases
Creditors
95 | P a g e
For The Year 2013= 75508165
16521161
=4.57
For The Year 2012 = 83871151
25813434
=3.25
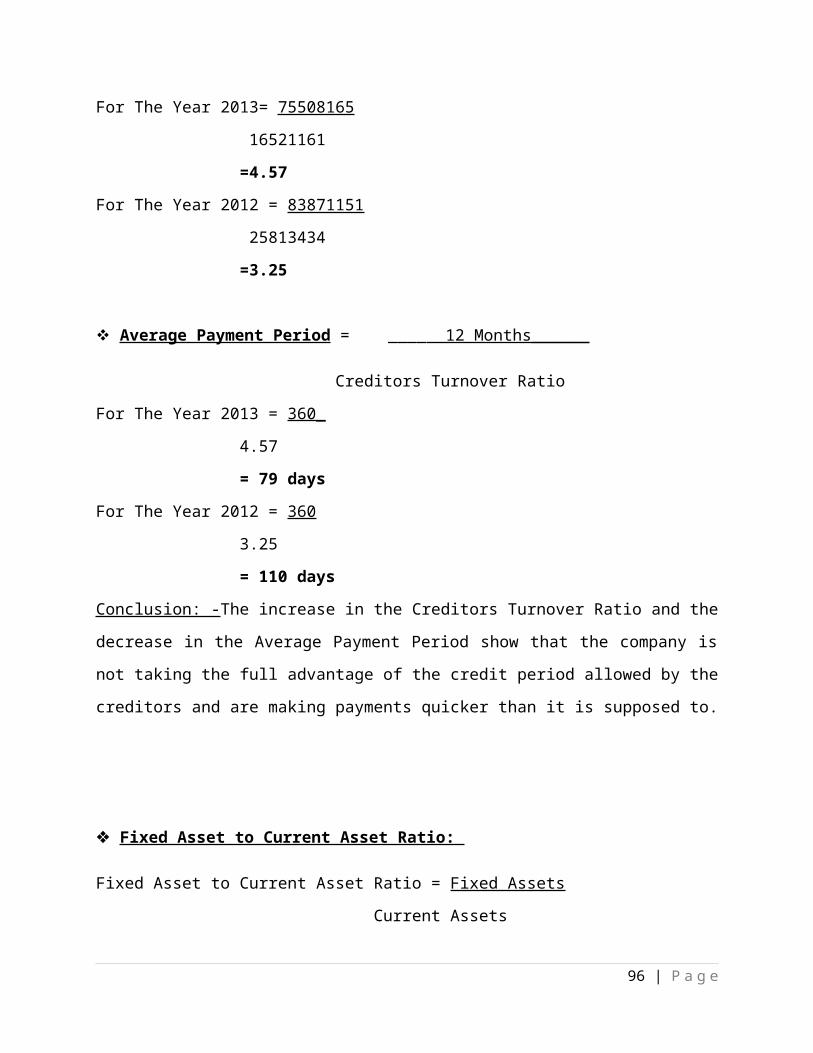
Average Payment Period = ____ 12 Months______
Creditors Turnover Ratio
For The Year 2013 = 360_
4.57
= 79 days
For The Year 2012 = 360
3.25
= 110 days
Conclusion: -The increase in the Creditors Turnover Ratio and the
decrease in the Average Payment Period show that the company is
not taking the full advantage of the credit period allowed by the
creditors and are making payments quicker than it is supposed to.
Fixed Asset to Current Asset Ratio:
Fixed Asset to Current Asset Ratio = Fixed Assets
Current Assets
96 | P a g e
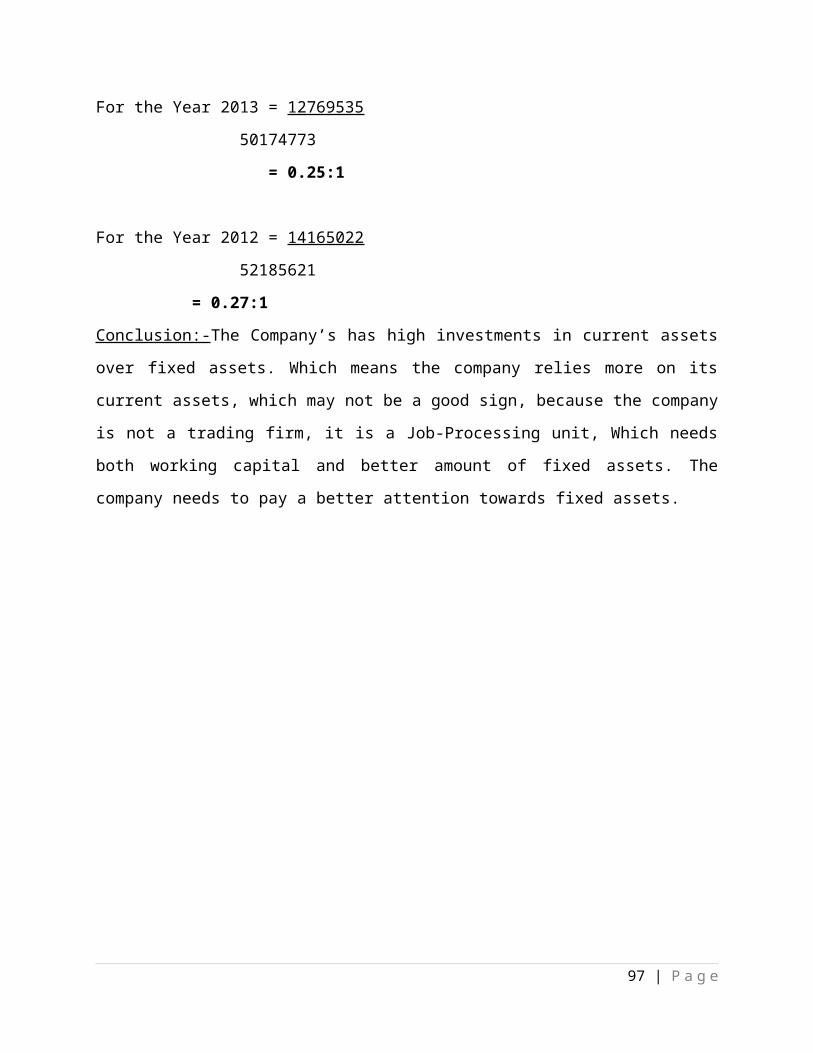
For the Year 2013 = 12769535
50174773
= 0.25:1
For the Year 2012 = 14165022
52185621
= 0.27:1
Conclusion:-The Company’s has high investments in current assets
over fixed assets. Which means the company relies more on its
current assets, which may not be a good sign, because the company
is not a trading firm, it is a Job-Processing unit, Which needs
both working capital and better amount of fixed assets. The
company needs to pay a better attention towards fixed assets.
97 | P a g e
2.4 HUMAN RESOURCE MANAGEMENT
2.4.1 ORGANIZATION STRUCTURE OF HUMAN RESOURCE DEPARTMENT
98 | P a g e
2.4.2 ORGANIZATIONAL CULTURE
Shree Ram considers its employees to be its biggest assets.
Adequate facilities exist and are constantly upgraded to improve
the social environment.
The organization has following statement for their social
culture:
‘We strictly, under all cost, forbid child labor and forced
labor’
2.4.3 HUMAN RESOURCE PLANNING PROCESS
Shree Ram designs have no scientific human resource planning
process. They have to determine and assuming that the company
will have an adequate number of qualified persons, available at
the proper times, performing jobs which meet the need of company
and which provide satisfaction for the company and individuals.
2.4.4 RECRUITMENT, TRAINING, COMPENSATION AND LAYING-OFF
Human resource department is responsible for
Recruiting
99 | P a g e
Training
Compensation
Performance appraisal
Laying-off
Recruiting
In Shree ram for management hiring three interviews are conducted
if they are
experienced. If they fresh graduate then first oral test is done
after this interview
interview. If he is passed, he is kept for work on 1 month trial
basis. If he is fonnd suitable, then he is appointed and all
terms & conditions are decided. This process is done for
management Trainees.
Training
On the job training is mostly provided. But sometimes for
management we conduct seminars; some lectures are scheduled.
Compensation
For management trainees they provide Rs.12000 and other according
to job requirement and skills of the employee. They also
compensate according market going situation.
100 | P a g e
For workers they are providing minimum Rs. 3000 according to
government rolls. For officers the G.M decide how much salary
will be provided. This depends on the nature of the job and
skills, experience of the employees.
Laying-off
If any employee is not doing his job very well then the Head of
the department fire the concerned employee is taken care of.
2.4.5 WELFARE ACTIVITIES
Employee welfare means, such services, facilities and amenities
such as canteens, rest and recreation facilities, arrangement for
travel to and for the accommodation of workers employed at a
distance from their home, and such other services, amenities and
facilities including social security measures as contribute to
improve the condition under which workers are employed.
Employee welfare may be viewed as a total concept, as a social
concept and a relative concept. The total concept is a desirable
state of existence involving the physical, mental, moral and
emotional well-being. The social concept of welfare implies, of
man, his family and his community.
101 | P a g e
The relative concept of welfare implies that welfare is relative
in time and place. Employee welfare implies the setting up of
minimum desirable standards and the provision of facilities like
health, food, clothing housing, medical allowance, education,
insurance, job security, such as to safeguard his health and
protect him against occupational hazards. The worker should also
be equipped with necessary training and a certain level of
general education.
STATUTORY EMPLOYEE WELFARE FACILITIES
Sections 42 to 50 of the factories act of 1948, deal with the
provisions for the welfare of the workers. And to fulfill the
requirements of those provisions the firm provides the following
facilities to its workers: -
Sitting Facilities: - Every factory shall provide for suitable
arrangements for sitting for all workers who are Obliged to
work in a standing position .
First Aid Facilities: - For every 150 workers, there must be
readily accessible and well equipped first – aid box. This box
must contain the prescribed contents and it must be in charge
of a responsible person who holds a certificate in first –
aid.
Canteen: - Every factory where 250 workers are employed, the
occupier has to maintain a canteen for the use of workers.
102 | P a g e
Shelter, Rest and Lunch Rooms: - In every factory where in 150
workers are employers are employed, the occupier shall provide
shelter, rest rooms and lunch rooms.
Lighting: - All things used by the employees must be in sight.
In every part of a manufacturing process where workers are
working or passing, they are provided and
maintained sufficient and suitable light, natural artificial
both.
Drinking water: - The Shree ram designs working place is so
hard, employees are need to emphasize the important of
providing liberals supply of cool and pure water. The lay down
that in every places effective arrangement must be made to
provide and main at suitable place conveniently situated for
all workers employed there in a sufficient supply of drinking
water.
Welfare Officers: - The occupier of every factory employing
500 or more workers shall employee the prescribed number of
welfare officer.
NON – STATUTORY EMPLOYEE WELFARE FACILITIES
Educational Facilities: - Educational facilities are important
that the children of the workers should be provided with
educational facilities.
Medical Facilities: - Employers, whether in private or in
public sectors have been providing medical facilities for
their workers and their families. Besides general medical
103 | P a g e
treatment and health-care, separate arrangements for
specialist treatment for diseases like T.B. cancer, leprosy,
and mental disease.
Transport Facilities: - Transport facilities to workers
residing at a long distance are essential to relieve them from
strain and anxiety. Such facilities also provide greater
opportunity for relaxation and recreation and help in reducing
the rate of absenteeism.
Recreation Facilities: - Recreation facilities afford the
worker an opportunity to develop his sense of physical and
mental discipline. It has an important bearing on the
individual’s personality as well as his capacity to contribute
to social development.
Housing Facilities: - Some of the industrial employers both in
public and private sector have provided housing facilities to
their employees. The company also renders assistance to the
co-operative housing societies formed by its employees.
2.4.6 EMPLOYMENT RECORD
SHREE RAM DESIGNS keeps a special file to maintain record of each
employee. The following details are included:
Name of the employees
Date of appointment
Concern department
104 | P a g e
Monthly contribution
Attendance of the employee
105 | P a g e
2.4.9 JOB DESCRIPTION
Job description is an important document, which is basically
descriptive in nature and contains statement of job analysis. A
job description is a list of the general tasks, or functions, and
responsibilities of a position. Typically, it also includes to
whom the position reports, specifications such as the
qualifications needed by the person in the job, salary range for
the position, etc. Job description is very useful for the job
guiding and basification transfer and promotion adjustment and
grievances in hiring specification. Job description tells about
what should be done and why and where it should be promoted.
Following are the contents of description:
ELEMENTS OF JOB DESCRIPTION:
Job identification
Transfer and promotion
Job summary
Relation to their subordinate
Duties and responsibilities
Supervision
Working condition
Machine tools and equipment
Posting and status in organization
Salary
106 | P a g e
Studies at health fatigue
2.4.10 JOB SPECIFICATION
Job specification for major positions in the Shree Ram Designs is
as follows:
DIRECTOR
New project and implementation
Policy making and approvals
Routine issue
Follow up with department
Finance & monitory aspect
Technology up gradation
HEAD IN CHARGE
Follow the policies frame by director
Performance of the sub-ordinate & reporting
Department issue
MASTER
107 | P a g e
To set the program for production
To maintain its successfully management
To make best setting of tone and finishing
To bring in new customers.
2.4.11 PROMOTION, DEMOTION, INCREMENT POLICY
Promotion
A promotion is the appointment of a current, active classified
employee (“employee”) to a position in a higher salary range than
the one to which the employee is presently assigned. A promotion
is also advancement to a position that requires performing
accountabilities of significantly increased complexity or
responsibility. Most promotions will occur as a result of a job
posting. Before a company promotes an employee to a particular
position it ensures that the person is trained to handle the
added responsibilities. On following three bases promotion is
provided:
Vacancy
Seniority
Performance
Demotion
A demotion occurs when an employee is reassigned to a position
with a salary range that is lower than the salary range of the
former position. A demotion occurs when:
108 | P a g e
An individual is assigned to a position that requires
performing accountabilities of significantly decreased
complexity or responsibility; or
The employee was unable to perform satisfactorily in the
higher-level position; or
As a result of a reorganization, if the reorganization results
in a reduction-in-force,
Or as a result of disciplinary action.
Increment Policy
The company has no formal increment policies. It is purely based
on performance. It depends on experience, knowledge of the
employee and his association with the company.
2.4.12 TRAINING AND DEVELOPMENT
Training is a learning process that involves the acquisition of
knowledge, sharpening of skills, concepts, rules, or changing of
attitudes and behaviors to enhance the performance of employees.
Development is a long-term educational process and utilizing a
systematic or organized procedure by which managerial personnel
learn conceptual and theoretical knowledge for general purpose.
109 | P a g e
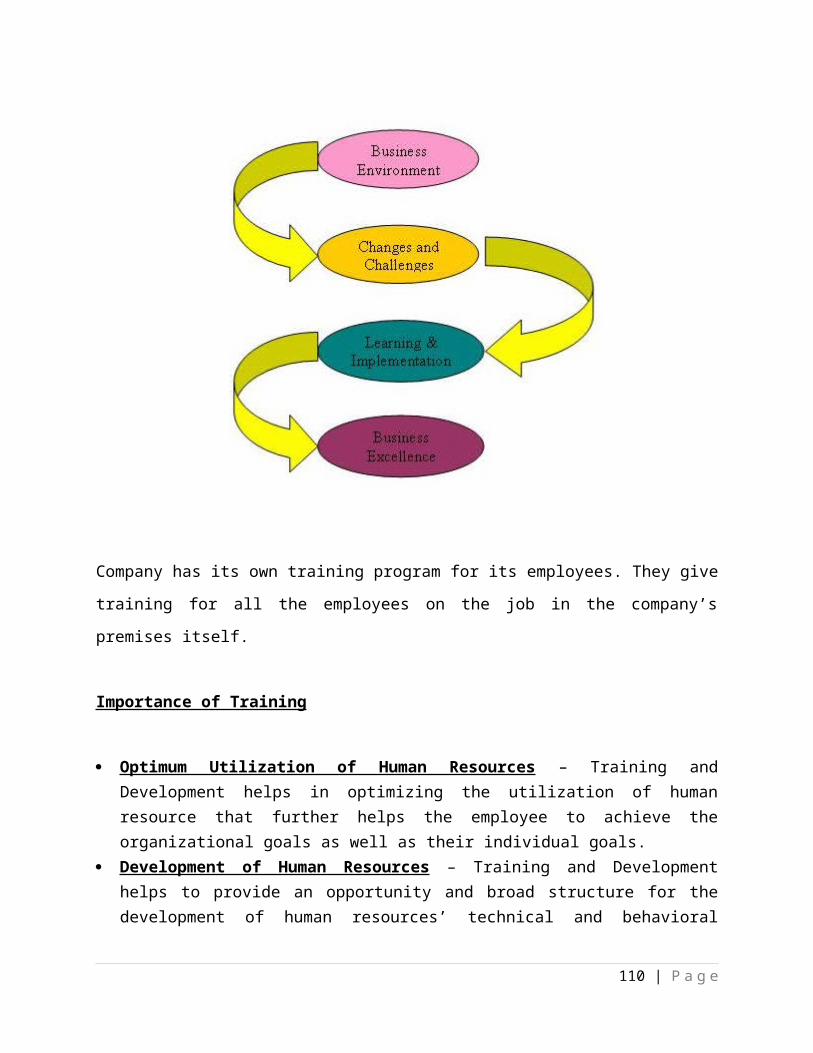
Company has its own training program for its employees. They give
training for all the employees on the job in the company’s
premises itself.
Importance of Training
Optimum Utilization of Human Resources – Training andDevelopment helps in optimizing the utilization of humanresource that further helps the employee to achieve theorganizational goals as well as their individual goals.
Development of Human Resources – Training and Developmenthelps to provide an opportunity and broad structure for thedevelopment of human resources’ technical and behavioral
110 | P a g e
skills in an organization. It also helps the employees inattaining personal growth.
Development of skills of employees – Training and Developmenthelps in increasing the job knowledge and skills of employeesat each level. It helps to expand the horizons of humanintellect and an overall personality of the employees.
Productivity – Training and Development helps in increasingthe productivity of the employees that helps the organizationfurther to achieve its long-term goal.
Team spirit – Training and Development helps in inculcatingthe sense of team work, team spirit, and inter-teamcollaborations. It helps in inculcating the zeal to learnwithin the employees.
Organization Culture – Training and Development helps todevelop and improve the organizational health culture andeffectiveness. It helps in creating the learning culturewithin the organization.
Organization Climate – Training and Development helps buildingthe positive perception and feeling about the organization.The employees get these feelings from leaders, subordinates,and peers.
Quality – Training and Development helps in improving upon thequality of work and work-life.
Healthy work environment – Training and Development helps increating the healthy working environment. It helps to buildgood employee, relationship so that individual goals alignswith organizational goal.
Health and Safety – Training and Development helps inimproving the health and safety of the organization thuspreventing obsolescence.
Morale – Training and Development helps in improving themorale of the work force.
Image – Training and Development helps in creating a bettercorporate image.
111 | P a g e
Profitability – Training and Development leads to improvedprofitability and more positive attitudes towards profitorientation.
Induction Training
It is the first step of the company towards gaining an employees'
commitment, it is aimed at introducing the job and organization
to the recruit and him or her to the organization. It involves
orientation and training of the employee in the organizational
culture, and showing how he or she is interconnected to (and
interdependent on) everyone else in the organization. Human
resource manager and department head conducts this training.
Training Need Identification
Training needs identified on the basis of working culture, work
environment, the gap between existing and required level levels
of performance& attitude of the employees
2.4.13 WAGES AND SALARY
Wages and salary constitutes the compensation paid to employees.
Wage is a terminology used for daily allowances rendered to a
worker or a laborer. This is more in use for blue collar type
jobs which are temporary. Salary is administered on a monthly112 | P a g e
basis to permanent employees in an organization. The company
follows the minimum wages scale declared by the Government.
In SHREE RAM DESIGNS (P) LTD, Compensation is to be provided to
all the employees who are working in the firm from last 1 year.
The compensation include bonus on Diwali, extra payment on
occurrence of any known or unknown cases like marriage, fever,
accidents, etc. the amount provided on these cases has generally
a limit of double amount of the salary of that particular
employee. All the employees who are on working from long time are
also provided the facility of general insurance cover. The
premium of which is made paid by the firm only. Other type of
compensation provided to the employee is accidental compensation.
In case of accident of any employee during the working hour, all
the expenses of his treatment is taken by the firm only and the
no. of days he/she is advised to rest, the firm has to pay the
wages /salary of all those days till he/she recovers fully from
his injury. In case of death due to accident during the working
hour, the firm bears the compensation to be made paid regularly
to next 2 years to the family member of that employee. Accidental
expenses are to be paid by the firm for all the employees. It
does not matter whether they are new to the firm or working from
long time.
113 | P a g e
CHAPTER 3: - LEARNINGS AND SWOT
Shree Ram Designs is doing a good job by providing the customers
a quality product, as it is their policy to provide customers
values for their money. But every company is lacking somewhere.
So following are some suggestions, which will play an important
role for the company to become a successful player in a
competitive market. There were some major things which I got to
learn while training at the firm, which were: -
It is the value of the word of mouth, there are no orders
made on paper, a phone call is sufficient for communication
and placing orders.
To keep up with the customers it is necessary to maintain
personal touch. This is possible by sending gifts such as
small hand pouches, calendar sheets, etc. at regular time
intervals.
It is also necessary to supervise the sub-ordinates, as for
the Master who is the total man-in-charge for production and
marketing department. His work is also kept under scrutiny
so as to make sure that the company’s working is being
carried out optimally..
3.1 SWOT ANALYSIS
3.1.1 Strengths
114 | P a g e
Experienced Top-Level Management: - The Directors of the
firm carry a great amount experience from the Surat Textile
Industry.
Financial Soundness: - The Company is financially sound. The
capital structure consists of more equity than debt.
Strongly Positive Reputation: The firm also enjoys a
positive image in the market.
3.1.2 Weakness
Less profitability: - though the capital structure of the
firm is sound and positive, but the firm somehow is not able
to generate enough profits.
3.1.3 Opportunities
Wide Scope for Expansion: - A dyeing firm always has an
option to integrate into printing.
3.1.4 Threats
Fluctuating trade cycles: - Saree business suffers from high
fluctuations in trade cycles.
Decreasing popularity of Sarees: - The trend of sarees is
decreasing with increasing popularity of western style
clothing, due to which demand is falling.
115 | P a g e
Related Documents