Copyright by Goodidar Hemmanoor Arjun Shounak 2016

Welcome message from author
This document is posted to help you gain knowledge. Please leave a comment to let me know what you think about it! Share it to your friends and learn new things together.
Transcript

Copyright
by
Goodidar Hemmanoor Arjun Shounak
2016

The Thesis Committee for Goodidar Hemmanoor Arjun Shounak Certifies that this is the approved version of the following thesis:
Extension of Activity Analysis Methodology to Maintenance, Shutdown,
and Turnarounds in Petrochemical Facilities
APPROVED BY
SUPERVISING COMMITTEE:
Carlos H. Caldas
John D. Borcherding
Supervisor:

Extension of Activity Analysis Methodology to Maintenance and
Shutdown Turnarounds for Petrochemical Facilities
by
Goodidar Hemmanoor Arjun Shounak, B.E
Thesis
Presented to the Faculty of the Graduate School of
The University of Texas at Austin
in Partial Fulfillment
of the Requirements
for the Degree of
Master of Science in Engineering
The University of Texas at Austin
August 2016

iv
Acknowledgements
First, I would like to thank my advisor Dr. Carlos H. Caldas who always kept the
door to his office open whenever I needed guidance, professionally and personally. He
consistently motivated me to put in my own thoughts into research, and also steered me
in the right direction whenever he thought I needed it.
I would also like to acknowledge Dr. John D. Borcherding as the second reader of
this thesis, and I am gratefully indebted to him and my colleague Jungyeol Kim for
providing field study opportunities, hands on training and valuable comments on various
topics related to this research. I express my gratitude to Dr. Steven Mulva and Dr. Daniel
Oliveira for grooming me as a researcher at Construction Industry Institute, and Dr. Bon
Gang Hwang and his research team for their continuous support and feedback during the
past year.
I am thankful to my roommates Shariq Iqbal and Surya Dhulipala for the lessons
– “living in the United States 101”. My journey at the university would have never been
as enjoyable without my fellow longhorns Harsha Shetty, Pratik Kakkar, Piyush Jajpuria,
Ashish Gupta, Varad Kelkar, Edwin Thomas, Jojo France-Mensah, Ankur Bhambotta,
Bharathwaj Sankaran, Gurpreet Kaur, Nassim Hamed, Samuel P Dal Ross and Ryan
Griego.

v
Be it from the southern hemisphere or the northern half of the globe, online, or
offline, Bhushan Suresh, Sharath Simha, Rohan Shenoy, Gaurav Shetty, Harsha Shetty,
Amit Jain, Anand Rajavikrama, Praneeth Rachapalli, Aditya MP, Jatin Shetty and Anil
Hunagund have stood by me and supported all my endeavors.
Finally, I must express my very profound gratitude to Amma and Appa for their
faith in me with unfailing support, opportunities and continuous encouragement
throughout my life, to make me a better person. This accomplishment would not have
been possible without them. I would like to thank my grandparents, and family for their
support and love. Most importantly, I would like to thank my wife Nayantara Kurpad for
enduring and sharing this experience with me as a graduate student, with tolerance,
patience and unwavering love.
vi
Abstract
Extension of Activity Analysis Methodology to Maintenance and
Shutdown Turnarounds in Petrochemical Facilities
Goodidar Hemmanoor Arjun Shounak, M.S.E
The University of Texas at Austin, 2016
Supervisor: Carlos H. Caldas
Studies show that construction productivity has been stagnant for decades.
Interestingly, other industries like manufacturing, automobile and agriculture have
witnessed a steep increase in productivity, nearly twice, over the same period of time. It
has been the norm for many continuous improvement methods, employed by these
industries, to claim credit for this trend. While inadequacies in a range of parameters like
management practices, organizational behavior, contractual differences, and other
planning functions affect poor productivity, the first step towards any improvement
program is to measure the existing condition. The importance of measuring and
improving productivity has become increasingly critical and significant with raging
project capital costs and complexity, especially in the petroleum industry.

vii
This research focusses on providing a productivity language for petrochemical
owners and contractors. The developed methodology helps them to communicate
improvement strategies with each other and within their organization beyond construction
leading into maintenance and shutdown turnarounds. Activity Analysis is a productivity
assessment and improvement method developed by the Construction Industry Institute
(CII) in 2010.
This thesis describes the adaptation of activity analysis methodology that was
developed to measure productivity indicators at petrochemical facilities on construction,
maintenance and shutdown turnaround activities between 2015 and 2016. It also provides
an overview on the activity analysis software developed for data collection, which is a
byproduct of this research. This study also provides a summary of expected trends and
challenges in petrochemical industries, and strategies that could be implemented to
enhance the direct work rate in both construction and maintenance environment.
viii
Table of Contents
List of Tables ....................................................................................................... xiii
List of Figures ...................................................................................................... xiv
Chapter 1: Introduction ............................................................................................1
RESEARCH MOTIVATION .........................................................................1
RESEARCH OBJECTIVES ...........................................................................2
RESEARCH SCOPE AND LIMITATIONS ..................................................3
READER’S GUIDE........................................................................................4
Chapter 2: Research Framework ..............................................................................5
CONDUCT BACKGROUND RESEARCH ..................................................6
EXTEND ACTIVIVTY ANALYSIS PLANNING PHASE ..........................7
DEVELOP ACTIVITY ANALYSIS SOFTWARE .......................................8
EXTEND ACTIVIVTY ANALYSIS SAMPLE PHASE...............................9
DEVELOP ACTIVIVTY ANALYSIS REPORT GENERATION TOOL ..10
ix
RECOMMEND PRACTICES TO PLAN AND IMPLEMENT
PRODUCTIVITY IMPROVEMENTS ...............................................10
WRITE RESEARCH REPORT ....................................................................11
Chapter 3: Background Review .............................................................................12
PRODUCTIVITY AND PERFORMANCE .................................................12
WORK SAMPLING .....................................................................................13
CII’S ACTIVITY ANALYSIS OVERVIEW ...............................................13
SAMPLE SIZE AND ERRORS IN ACTIVITY ANALYSIS .....................16
DIRECT WORK AVERAGES IN THE PAST ............................................20
Chapter 4: Extending Activity Analysis Plan Phase ..............................................29
ACTIVITY CATEGORY DEFINITION .....................................................29
Direct work ..........................................................................................29
Waiting .................................................................................................33
Preparatory work ..................................................................................36
Material handling .................................................................................38
Tools and equipment ............................................................................39

x
Travel ...................................................................................................40
Personal ................................................................................................41
Other issues ..........................................................................................41
ACTIVITY ANALYSIS SOFTWARE ........................................................43
Features ................................................................................................43
Observation summary ..........................................................................46
Chapter 5: Extending Activity Analysis Sample Phase .........................................47
PREPARING FOR DATA COLLECTION .................................................47
DATA COLLECTION CHALLENGES ......................................................49
ACTIVITY ANALYSIS SAMPLING .........................................................50
MINIMUM NUMBER OF SAMPLES ........................................................50
Chapter 6: Activity Analysis Report Generation ...................................................53
EXPORT DATA FROM ACTIVITY ANALYSIS SOFTWARE ...............53
EXAMPLE CALCULATION FOR ANALYSIS .........................................55
ACTIVITY ANALYSIS REPORT GENERATION ....................................57
xi
Report Generation Sheet (RGS) Content .............................................57
Datasheet .....................................................................................57
Direct Work Dashboard ..............................................................58
Aggregate Results .......................................................................58
Results by Trade .........................................................................59
Using the Report Generation Sheet......................................................61
Step 1 – Copy Data .....................................................................61
Step 2 – Paste Data .....................................................................61
Step 3 – Review Result Tabs ......................................................62
Chapter 7: Recommendations to Plan and Implement Improvements ...................63
Expected proportions in activity category percentages .......................63
Interpretation of results ........................................................................64
Probable causes for low direct work rates ...........................................65
World class direct work rates ...............................................................67
Best Practices - First and Last Work Hours of the Day .......................68

xii
Best Practices - Lunch Breaks .............................................................71
Best Practices - Weather Breaks ..........................................................72
Best Practices - Transition Periods for Multiple Shifts .......................73
Chapter 8: Conclusions and Recommendations ....................................................74
CONCLUSIONS...........................................................................................74
RECOMMENDATIONS FOR FUTURE RESEARCH ...............................76
References ..............................................................................................................78

xiii
List of Tables
Table 1: Aggregate work sampling result for 123 construction projects (Gong et
al. 2010) ............................................................................................21
Table 2: Direct work rate by industry type (Gong et al. 2010) .......................22
Table 3: Direct work rate in E.L Hamm’s study (Waidelich 1997) ................22
Table 4: Wrench time study in US paper mill (Yolton 2008) .........................23
Table 5: Case studies by Strandell, 1976 and Hedding, 2003 (Smith 2006) ..25
Table 6: Work sampling results by trade or craft (Oglesby, Parker, and Howell
1989) .................................................................................................26
Table 7: Work sampling results by trade for a power plant construction
(Strandell, 1976) ...............................................................................27
Table 8: Maintenance management improvement case study result (Palmer 2006)
...........................................................................................................28
Table 9: Minimum sample size based on number of workers (“Guide to Activity
Analysis” 2010) ................................................................................51
Table 10: Organization of activity analysis data - example ..............................54
Table 11: Direct work calculation - example ....................................................55
Table 12: Direct work rate quartile ranges ........................................................67
xiv
List of Figures
Figure 1: Research framework ...........................................................................5
Figure 2: Activity analysis methodology (“Guide to Activity Analysis” 2010) 7
Figure 3: Activity analysis software ...................................................................9
Figure 4: Activity analysis phases and guidelines (CII IR252_2d, 2013) ........15
Figure 5: Sample size for varying confidence levels (Thompson, 1987) .........18
Figure 6: Work sampling projects in Austin Texas - Industry types (Gong et al.
2010) .................................................................................................20
Figure 7: US paper mill wrench time case study hourly trend (Yolton 2008) .24
Figure 8: A screenshot of the observation setup screen ...................................44
Figure 9: Export .csv file example ...................................................................53
Figure 10: Example activity category distribution pie chart ..............................56
Figure 11: An example of direct work dashboard tab ........................................58
Figure 12: An example of aggregate result tab in RGS.....................................60
Figure 13: Screenshot of pasting software export data into RGS ......................61

1
Chapter 1: Introduction
RESEARCH MOTIVATION
Activity analysis can be extended to be effective on different types of projects
ranging from medium to large capital projects, construction to maintenance, and low to
high performing teams. It can help a project team monitor labor’s work efficiency and
maintain high performance. Some of the features and objectives of activity analysis
include (“Guide to Activity Analysis” 2010):
• Identifies challenges and implements processes to reduce the number of work
hours required to complete a certain unit of work.
• Helps to clearly understand what is happening throughout the day at construction
work-faces with a focus on craft workers.
• Maximizes “Direct Work” rate by identifying and optimizing support work and
idle times observed on a project.
• Facilitates performance assessment in less time and lower cost as compared to
other continuous observation studies.
• Provides an opportunity to canvas and inspect or study an entire job site.
• Does not require disruption of regular job site activities.
• Avoids resistance to study from craft workers since they are more likely to accept
activity analysis over other continuous observation studies.

2
• Identifies specific areas for productivity improvement.
RESEARCH OBJECTIVES
Activity Analysis is a productivity assessment and improvement method
developed by the Construction Industry Institute (CII). This method was further
developed to adapt to the conditions and activities seen in petrochemical facilities.
Activity Analysis aims to categorize activities of craft workers into direct work,
supportive work, and non-productive work. The result is the classification or distribution
of labor time represented in percentages along with relevant observations and
recommendations to improve direct work.
The key objectives of extending the activity analysis methodology for petrochemical
facilities included the following:
• Provide a common productivity language and a yardstick for petrochemical
facility owners and contractors to communicate improvement strategies.
• Extend activity categories and develop activity analysis software customized to
activities and conditions observed on petrochemical construction, maintenance,
shutdown and turnarounds.
• Develop a report generation tool to process the data extracted from the software
• Identify potential opportunities and provide best practices to plan and implement
productivity improvements for petrochemical facilities.

3
RESEARCH SCOPE AND LIMITATIONS
The purpose of activity analysis is to study and identify productivity barriers and then
implement improvements to eliminate or reduce these barriers. The intent is to reduce
activities that do not actively advance the finished product, thereby increasing the direct
work rate. In case of maintenance activities a new finished product may not exist, and
hence it is important to understand the classification of productive work, supportive work
and other categories that are considered non-productive. This research thesis focuses on
extending the scope of activity analysis methodology to be effective on:
• Construction projects
• Maintenance of plants or units
• Shutdown, turnaround and outages at petrochemical facilities
The research aims to identify the various categories of work time on a craft person’s
typical work day that are relevant to the above mentioned scenarios in different
petrochemical plants. The activity analysis software developed also revolves around these
activities and conditions. The study intends to provide a methodology to sample
productivity indicators on construction, maintenance and shutdown turnaround projects
before activity analysis, implement improvement strategies and re-measure changes and
improvements after a period of time. The study however does not evaluate individual
activities observed on construction projects or maintenance activities.

4
READER’S GUIDE
The thesis is organized into eight chapters. Chapter 1 presents the motivation,
objectives and scope of the research along with this outline of the thesis. Chapter 2
discusses the framework of the research that guided the preparation, methodology
development, and documentation of recommendations. Chapter 3 provides an overview
of the findings from background review that will help in understanding the concept of
work sampling, the relationship between direct work and labor productivity, and similar
studies conducted in the past. Chapter 4 presents the extension of activity categories
developed to incorporate maintenance and shutdown turnaround activities, and also
provides an overview of the software that supports this methodology. Chapter 5 describes
the extension of sample phase, along with the data collection challenges and methods.
Chapter 6 discusses the type of data collected, and the various analyses that can be
conducted using the developed report generation tool. Chapter 7 identifies trends
observed, key improvement opportunities on projects, recommendations, strategies and
some best practices to improve direct work. Finally, Chapter 8 concludes the thesis with
discussions and recommendations to the industry along with the future scope for research
and implementation.

5
Chapter 2: Research Framework
The milestones of this research can be placed on a time line between August 2015
and July 2016. The following section entails the framework of the study with the major
tasks as shown in Figure 1 below.
Figure 1: Research framework
6
CONDUCT BACKGROUND RESEARCH
Planning and preparing involved background research on existing sampling
methodologies, and adapting these to suit the needs of the petrochemical facilities. To
meet the research objectives of measuring labor time utilization on construction,
maintenance and shutdown turnaround in petrochemical facilities, it was important to
determine the appropriate activity categories. The features of the tool had to
accommodate these customized categories and support the data collection.
A cyclic five step activity analysis methodology, developed by CII (“Guide to
Activity Analysis” 2010) was used as a starting point to develop the extended
methodology for petrochemical maintenance, shutdown and turnarounds. Figure 2 below
shows this continuous improvement methodology adopted for pilot projects.

7
Figure 2: Activity analysis methodology (“Guide to Activity Analysis” 2010)
This background review also provided direct work averages for various industries
and trades, which are presented in Chapter 3 of this thesis.
EXTEND ACTIVIVTY ANALYSIS PLANNING PHASE
After conducting exhaustive brainstorming sessions with the researchers at the
Construction Industry Institute and UT Austin, a comprehensive list of activity categories
was developed to accommodate the various kinds of activities observed on petrochemical
plants. The sub categories chosen were carefully designed to suit the most commonly
observed activity categories for different phases including construction, maintenance and
shutdown turnarounds in a plant. The final set of categories is summarized in Chapter 4.
Plan Study
Sample
Analyze Plan Improvements
Implement Improvements

8
DEVELOP ACTIVITY ANALYSIS SOFTWARE
The tool conceptualization involved establishing the various variables and
parameters involved in data collection like plants, projects, weather conditions, and other
observation details along with the categories. An entity relation was established to design
the database and a preliminary user interface, using MS access. Various test cases were
documented and handed over to a New York based software development firm.
Researchers partnered with Enstoa to develop the software and after numerous
conversations, touch based user interface screens and features of the activity analysis
software were developed to operate on a Windows 8 platform.
In order to use the activity analysis software in a petrochemical plant, the device
(Tablet) used in the facility had to be intrinsically safe and research revealed some
options and common industry practices in this regard. Intrinsically safe tablet
manufacturing companies across the United States were consulted to ensure adequate
certification to make sure these tablets would be safe to be used in plants. The rugged
tablets from Xplore technologies – “Bobcat” with class 1 division-2 certification were
procured provided to Enstoa for final application development.
The activity analysis software (shown in Figure 3 below) was installed on all the
devices (intrinsically safe tablets) and tested for errors. Minor bugs were fixed.

9
Figure 3: Activity analysis software
Chapter 4 summarizes the features of the activity analysis tool and describes how
it supports data collection.
EXTEND ACTIVIVTY ANALYSIS SAMPLE PHASE
Activity sampling should be conducted in order to collect a representative data
sample from the various activities observed during construction, maintenance and
shutdown turnarounds. Each discrete data sample or observation should be categorized as
direct work, preparatory work, tools and equipment, material handling, waiting (and its
sub categories), travel, or personal. These categories and sub categories developed can be
sampled effectively using the software. Chapter 5 describes the sampling phase with
insights to collecting data in petrochemical facilities.
10
DEVELOP ACTIVIVTY ANALYSIS REPORT GENERATION TOOL
The data collected from activities observed on petrochemical facilities, can be
tabulated in MS excel spreadsheets to determine activity category percentages. A report
generation sheet was developed to accommodate the data from the activity analysis
software and generate analysis tables and charts. The resulting percentages were analyzed
to determine which types of activities were beyond acceptable ranges. Chapter 6
describes the type of data collected and some examples to demonstrate the analyses that
can be conducted.
RECOMMEND PRACTICES TO PLAN AND IMPLEMENT PRODUCTIVITY
IMPROVEMENTS
After the potential causes for unacceptable variances were identified, several
potential solutions, especially the low hanging fruits to improve productivity were
considered. These improvement strategies were based on a set of factors that included
feasibility, logistics, schedule, and costs. Improvements selected in the planning stage
should be implemented to increase the direct work rate and reduce other support
categories and ones that cause delay.
Trends with activity categories were recognized, key opportunities were identified
and best practices to improve direct work were documented. Chapter 7 captures these
best practices to plan and implement productivity improvements.

11
WRITE RESEARCH REPORT
This thesis includes the extended methodology, identified patterns and best
practices for improving direct work on construction, maintenance and shutdown
turnaround activities. The recommendations from this thesis are broader to the
petrochemical industry. The conclusion and recommendations of this research is
summarized in Chapter 8.

12
Chapter 3: Background Review
PRODUCTIVITY AND PERFORMANCE
A project’s performance can be assessed using the following (Oglesby, Parker,
and Howell 1989):
• Quality compliance refers to meeting the specifications agreed in the contract.
• Schedule compliance involves completing tasks on time by sticking to the
promised timeline of project milestones
• Safety compliance aims at achieving an accident free project
• Productivity addresses the challenge of delivering the project at a fair price to the
owner with reasonable profit to the contractor
Productivity is defined by the relationship between completed work in place or
outputs and the amount of effort put in to accomplish it, in the construction industry.
However, depending on the scope of work, companies and context, definition of unit of
output and input can vary. Most of the time, output is a unit of the physical output in
place, when a unit of input is defined by unit cost of labor, equipment and material or
work hours. To evaluate predictability, some companies’ measure “Performance
Productivity” (“Guide to Activity Analysis” 2010) which is a ratio of actual work hours
to budgeted or expected work hours on a project.

13
WORK SAMPLING
Work sampling is an effective way of gathering data to measure and classify the
utilization of craft workers time on construction projects (Waidelich 1997). During work
sampling on a job site, craft worker’s activity time is classified into either direct work,
support work or non-contributory work to identify particular areas that require
improvement. Direct work involves tasks adding to unit being constructed while support
work like reading plans, site clean-up, handling material (Waidelich 1997) help workers
to perform direct work. Non-Contributory work involves delay, personal time and idle
time. It is a statistical technique that collects random observation samples from the work
force engaged on various activities, and determines the proportion of time spent on the
categories mentioned above. Work sampling has been derived from industrial engineers
and was documented to have been used by the construction industry as early as 1969 by
the Great Britain Building Research Station (Goodrum et al. 2012).
Although work sampling results may not determine the actual productivity
numbers, direct work rates on projects can be used as an effective indicator in a
productivity projection model (Liou & Borcherding, 1986).
CII’S ACTIVITY ANALYSIS OVERVIEW
Established in 1983 at the University of Texas at Austin, the Construction
Industry Institute (CII) is a consortium of owners, engineering and construction
contractors and academia. CII funds research projects led by faculty from various
14
universities in the United States along with research team members from industry, to
develop best practices that address various challenges in the construction industry.
Inspired by the continuous improvement process suggested by Oglesby, Parker and
Howell in 1989, one such research program on craft productivity at CII, developed the
activity analysis process in 2010 (Goodrum et al. 2012).
Activity analysis is a workface assessment tool developed as an extension of work
sampling to conduct deeper analysis and monitor progress continuously (CII IR252_2d,
2013). CII’s implementation resource 252_2a Guide to Activity Analysis provides a five
step methodology to conduct activity analysis. A set of activity categories, that capture
the different activities observed on a selected project, is defined during the planning
phase. An example of activity category set is – direct work, waiting, material handling,
tools and equipment, preparatory work, travel, and personal time (“Guide to Activity
Analysis” 2010). The collected data is tabulated under these categories to derive the
activity category percentages which will help in identifying categories that are outside the
norm, in comparison with historical data and experience. Once potential productivity
barriers have been identified, ways to improve the situation on projects are evaluated on
various parameters like feasibility, logistics, impact on cost and schedule. Developed
strategies are documented and implemented on projects with a goal to enhance direct
work percentage.
15
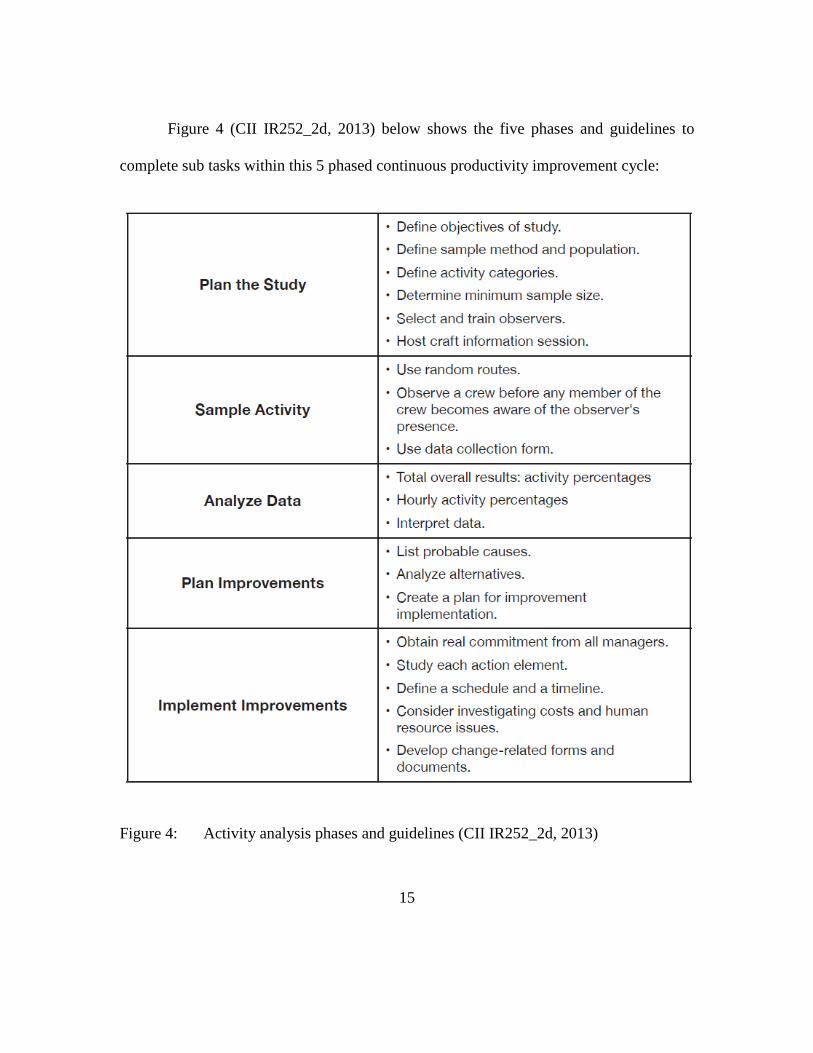
Figure 4 (CII IR252_2d, 2013) below shows the five phases and guidelines to
complete sub tasks within this 5 phased continuous productivity improvement cycle:
Figure 4: Activity analysis phases and guidelines (CII IR252_2d, 2013)

16
SAMPLE SIZE AND ERRORS IN ACTIVITY ANALYSIS
Since activity analysis methodology is driven by statistics, it is important to
understand the challenges and errors in data collection. Hence it is also critical to
determine the number of observations that need to be collected during activity analysis
for the results to significantly reflect the actual site conditions observed.
Thomas in 1982 published an article that lists the errors that would apply to
activity analysis as well (Thomas Jr. et al., 1982):
• Human Limitations to cover all areas on a job site
• Variation between observers
• Procedural deficiencies that may not be anticipated
• Bias in observer judgment
• Fatigue during hourly data collection
• Identification of population under observation
• Hawthorne effect leading to abnormal worker’s behavior
17
One way to reduce these errors is to have defined sampling procedures and
training material to achieve consistency in the process (“Guide to Activity Analysis”
2010). Sampling errors can be quantified using statistics however, during activity
analysis planning; errors can be limited by increasing the number of samples (Goodrum
et al. 2012)
Five percent error with a confidence level of 95% is generally acceptable in most
industries. The minimum sample size to achieve this sample size can be obtained
considering the data as binomial distribution or multinomial distribution. A binomial
sample size equation would govern the activity categories that fall into either one or the
other category for example – productive work and non-productive work. However,
activity analysis involves more than two categories and hence the solution proposed by
S.K Thompson in 1987, to determine sample size for multinomial distribution, is used for
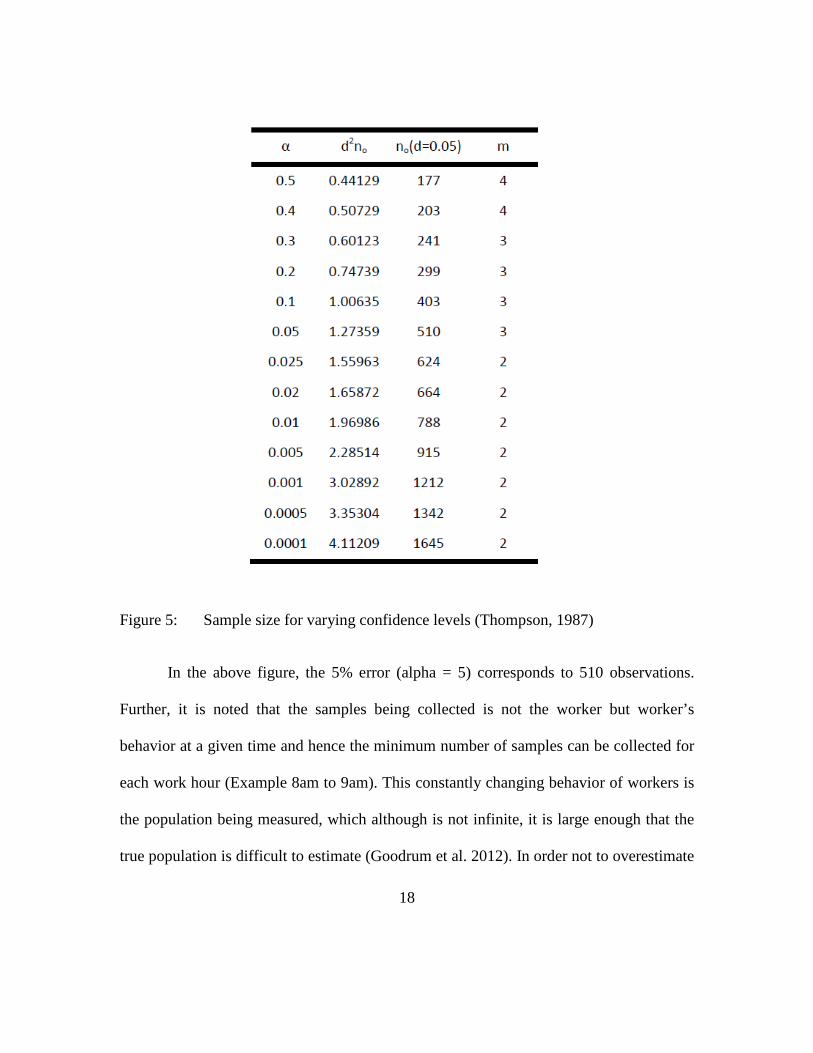
activity analysis. He wrote an article – “Sample size for estimating multinomial
proportions” in The American Statistician which presented a table to determine the
sample size of a multinomial distribution for different confidence levels as shown in
Figure 5 below:
18
Figure 5: Sample size for varying confidence levels (Thompson, 1987)
In the above figure, the 5% error (alpha = 5) corresponds to 510 observations.
Further, it is noted that the samples being collected is not the worker but worker’s
behavior at a given time and hence the minimum number of samples can be collected for
each work hour (Example 8am to 9am). This constantly changing behavior of workers is
the population being measured, which although is not infinite, it is large enough that the
true population is difficult to estimate (Goodrum et al. 2012). In order not to overestimate
19
sample size and collect redundant samples a finite population correction factor can be
applied as shown below (Goodrum et al. 2012):
Minimum sample size per hour = 1/((1/(𝑁𝑁𝑁𝑁𝑁𝑁𝑁𝑁𝑁𝑁𝑁𝑁 𝑜𝑜𝑜𝑜 𝑤𝑤𝑜𝑜𝑁𝑁𝑤𝑤𝑁𝑁𝑁𝑁𝑤𝑤) + 1/𝑛𝑛0) )
Where n0 is determined from Figure 5, for example:
Minimum number of observations with a confidence level of 95% for 300 workers can be
determined as follows:
Minimum sample size per hour = 1/((1/300 + 1/510) ) = 189 samples per hour.
Since it may be difficult to collect so many samples in one hour, sample
collection may be distributed over several data collection days during the same one hour
period (Goodrum et al. 2012). Table 9 summarizes the number of samples to be collected
across a range of worker population observed during activity analysis (“Guide to Activity
Analysis” 2010).
20
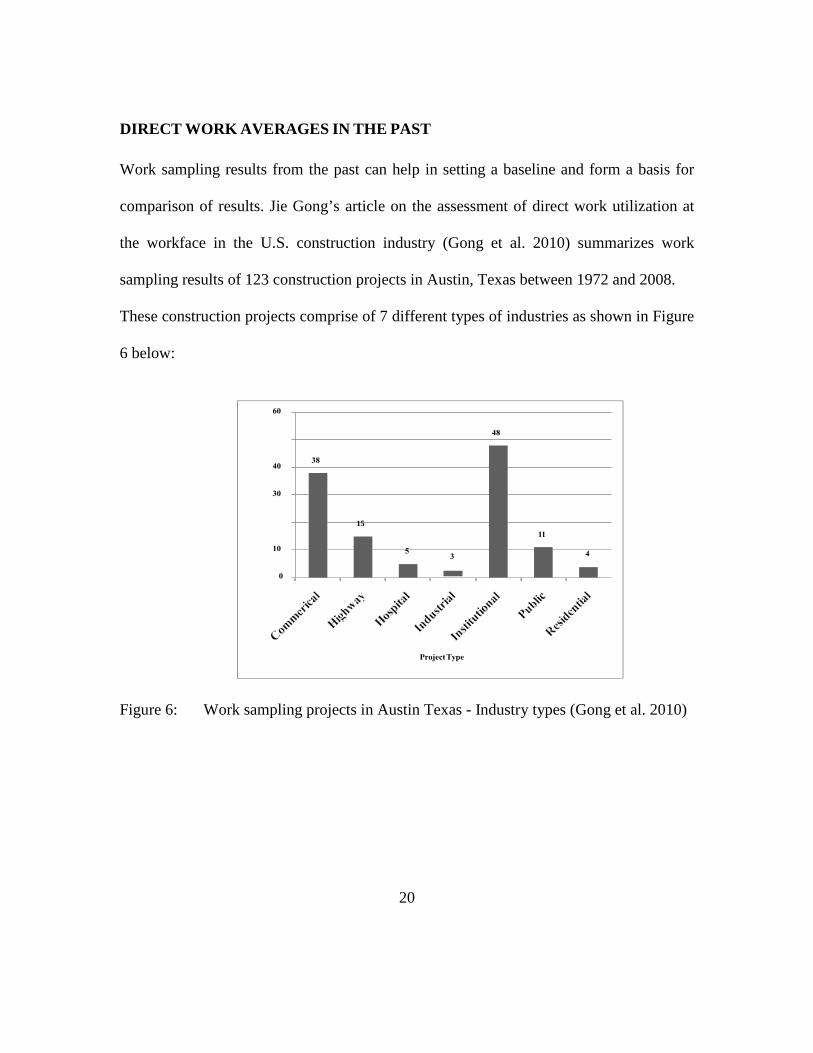
DIRECT WORK AVERAGES IN THE PAST
Work sampling results from the past can help in setting a baseline and form a basis for
comparison of results. Jie Gong’s article on the assessment of direct work utilization at
the workface in the U.S. construction industry (Gong et al. 2010) summarizes work
sampling results of 123 construction projects in Austin, Texas between 1972 and 2008.
These construction projects comprise of 7 different types of industries as shown in Figure
6 below:
Figure 6: Work sampling projects in Austin Texas - Industry types (Gong et al. 2010)
15
21
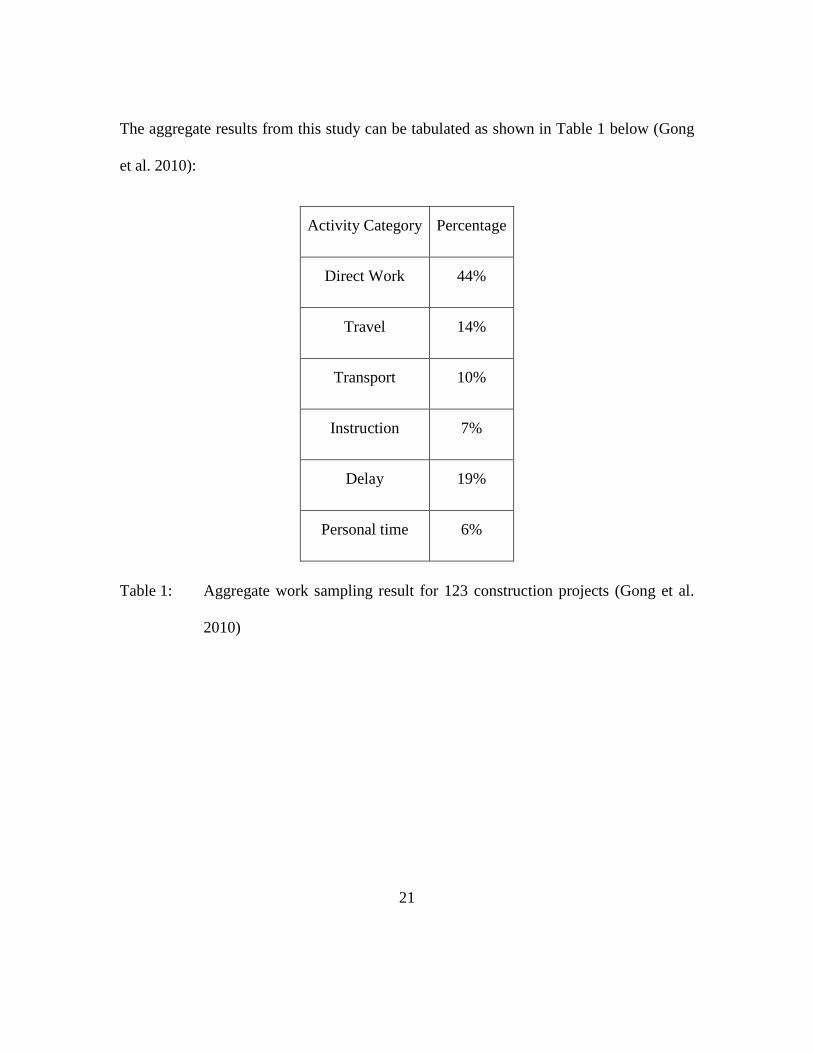
The aggregate results from this study can be tabulated as shown in Table 1 below (Gong
et al. 2010):
Activity Category Percentage
Direct Work 44%
Travel 14%
Transport 10%
Instruction 7%
Delay 19%
Personal time 6%
Table 1: Aggregate work sampling result for 123 construction projects (Gong et al.
2010)
22
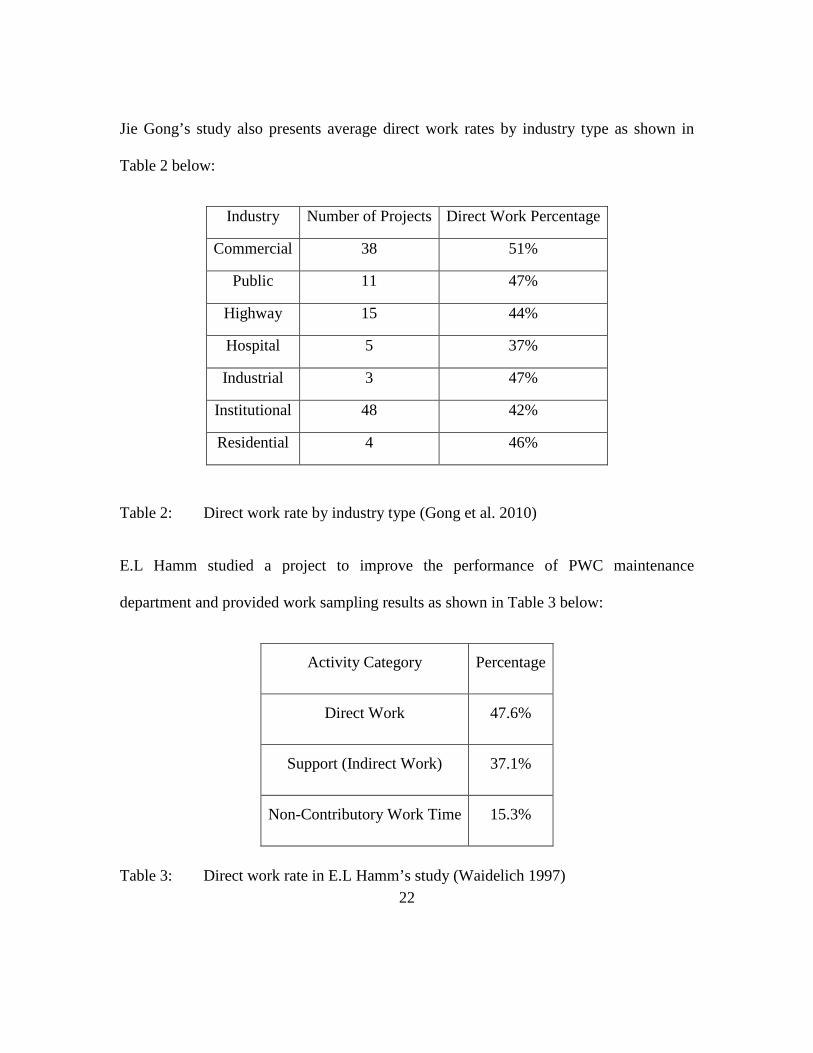
Jie Gong’s study also presents average direct work rates by industry type as shown in
Table 2 below:
Industry Number of Projects Direct Work Percentage
Commercial 38 51%
Public 11 47%
Highway 15 44%
Hospital 5 37%
Industrial 3 47%
Institutional 48 42%
Residential 4 46%
Table 2: Direct work rate by industry type (Gong et al. 2010)
E.L Hamm studied a project to improve the performance of PWC maintenance
department and provided work sampling results as shown in Table 3 below:
Activity Category Percentage
Direct Work 47.6%
Support (Indirect Work) 37.1%
Non-Contributory Work Time 15.3%
Table 3: Direct work rate in E.L Hamm’s study (Waidelich 1997)

23
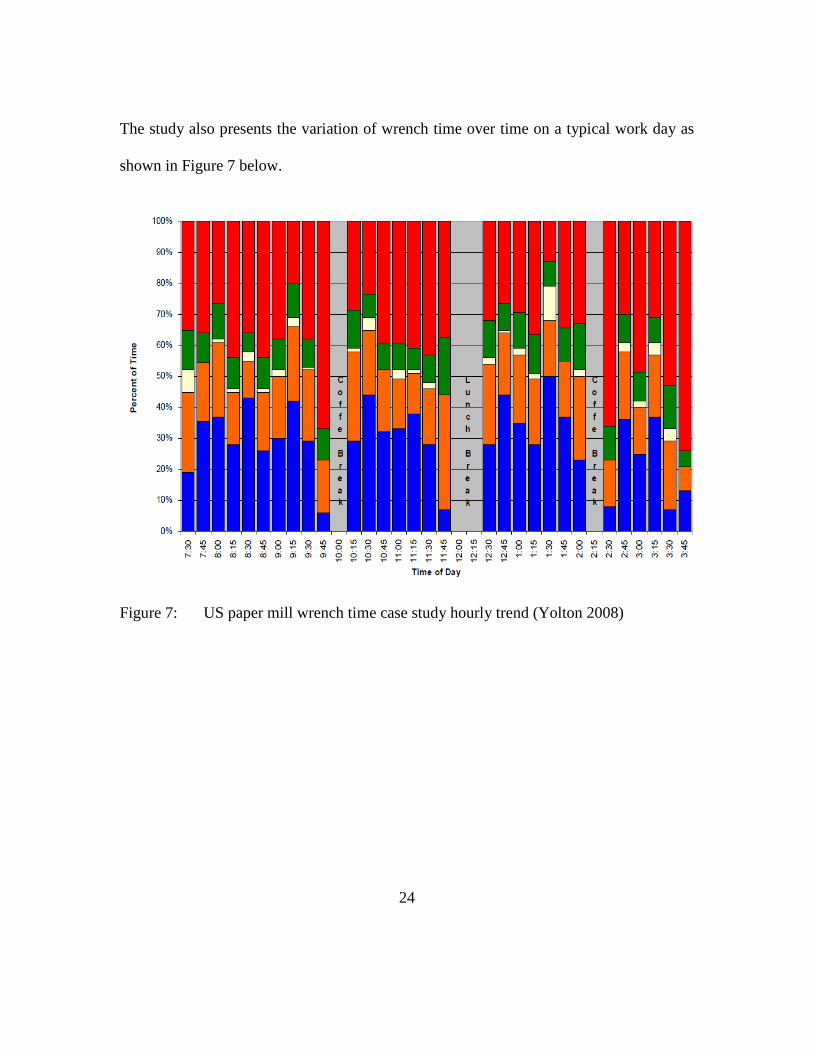
As part of maintenance improvement initiatives, sometimes, direct work is referred as
“wrench time” while following similar data collection and analysis methodology as work
sampling. SKF reliability systems published one such study in an article (Yolton 2008).
The results of this study conducted in a paper mill in USA are shown in Table 4 below.
Activity Category Percentage
Wrench Time 24.7%
Travel and Waiting 19.0%
Material Handling 9.6%
Meeting & Personal time 35.8%
Remaining (Not accounted) 10.9%
Table 4: Wrench time study in US paper mill (Yolton 2008)
24
The study also presents the variation of wrench time over time on a typical work day as
shown in Figure 7 below.
Figure 7: US paper mill wrench time case study hourly trend (Yolton 2008)
25
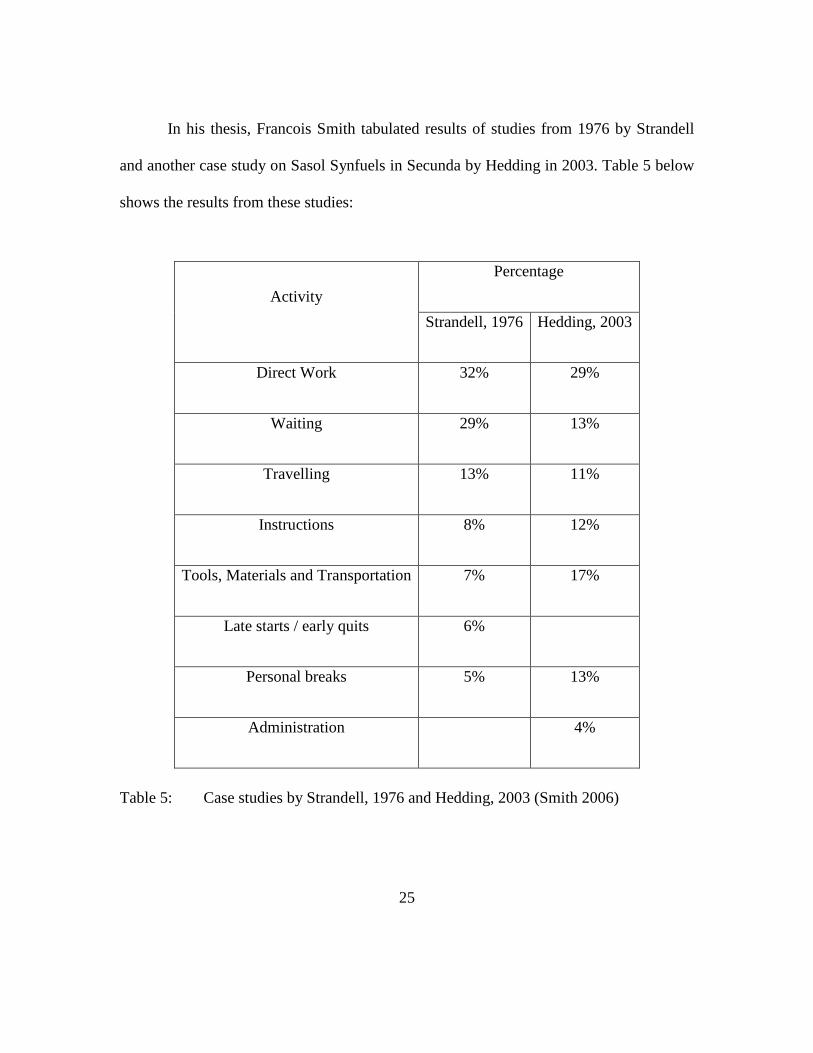
In his thesis, Francois Smith tabulated results of studies from 1976 by Strandell
and another case study on Sasol Synfuels in Secunda by Hedding in 2003. Table 5 below
shows the results from these studies:
Activity Percentage
Strandell, 1976 Hedding, 2003
Direct Work 32% 29%
Waiting 29% 13%
Travelling 13% 11%
Instructions 8% 12%
Tools, Materials and Transportation 7% 17%
Late starts / early quits 6%
Personal breaks 5% 13%
Administration 4%
Table 5: Case studies by Strandell, 1976 and Hedding, 2003 (Smith 2006)
26
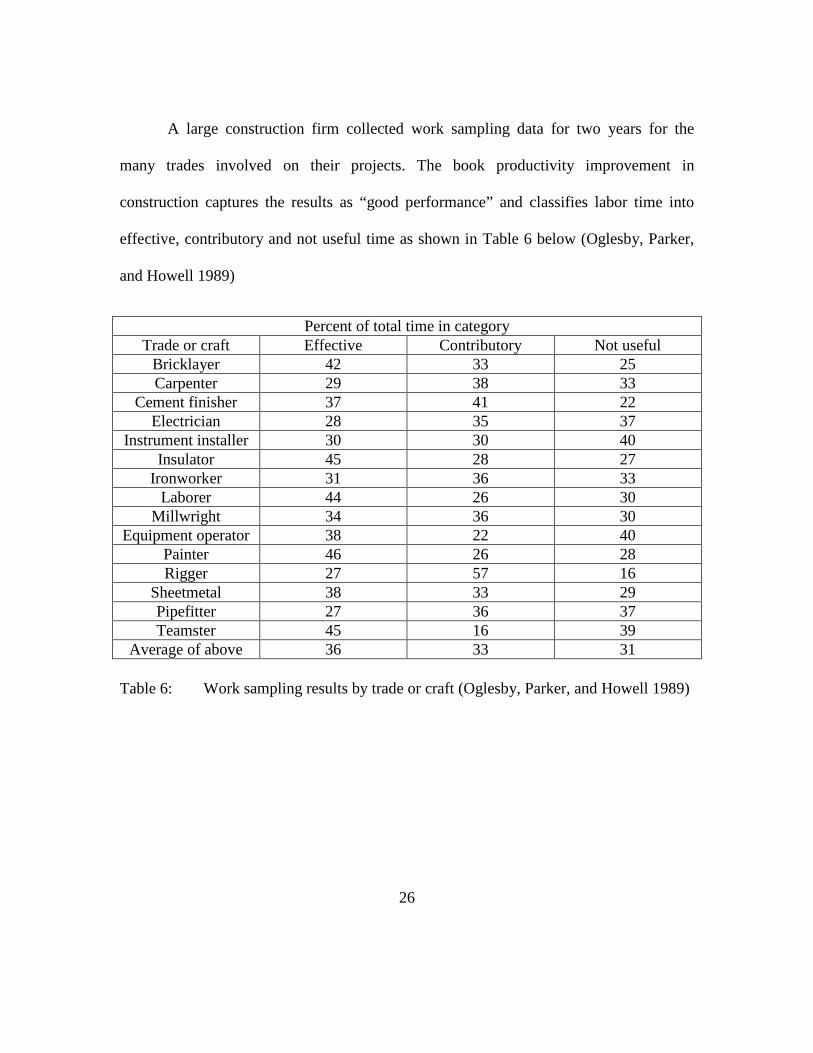
A large construction firm collected work sampling data for two years for the
many trades involved on their projects. The book productivity improvement in
construction captures the results as “good performance” and classifies labor time into
effective, contributory and not useful time as shown in Table 6 below (Oglesby, Parker,
and Howell 1989)
Percent of total time in category Trade or craft Effective Contributory Not useful
Bricklayer 42 33 25 Carpenter 29 38 33
Cement finisher 37 41 22 Electrician 28 35 37
Instrument installer 30 30 40 Insulator 45 28 27
Ironworker 31 36 33 Laborer 44 26 30
Millwright 34 36 30 Equipment operator 38 22 40
Painter 46 26 28 Rigger 27 57 16
Sheetmetal 38 33 29 Pipefitter 27 36 37 Teamster 45 16 39
Average of above 36 33 31
Table 6: Work sampling results by trade or craft (Oglesby, Parker, and Howell 1989)

27
Marjjata Strandell also captured in the 1976 AACE transactions, direct work rates
of trades working in a power plant construction project. Table 7 below shows the finding
from this study.
Trade or craft Direct work (%)
Pipefitters/Welders 28%
Boilermakers 27%
Electrical Workers 28%
Laborers 41%
Carpenters 42%
Insulators 26%
Operating Engineers 39%
Ironworkers 31%
Millwrights 32%
Table 7: Work sampling results by trade for a power plant construction (Strandell,
1976)

28
A maintenance management improvement case study in Palmers book (2006)
published wrench time by trades working on maintenance as shown in Table 8 below.
Trade or craft Wrench time % Hours/10-hour day
Mechanics 34.24 3.5
Painters 35.69 2.5
Welders 33.75 3.5
Machinists 50.67 5
Apprentices 40.21 4
Trainees 30.80 3
Table 8: Maintenance management improvement case study result (Palmer 2006)
29
Chapter 4: Extending Activity Analysis Plan Phase
ACTIVITY CATEGORY DEFINITION
Defining the objectives of a study is crucial to providing relevant and useful data.
Categories were customized to specific objectives. For this study, the objective was to
quantify time expended by a craft worker on productive and non-productive activities
into various sub categories so that productivity improvements may be determined and
implemented.
This study incorporated the following activity categories to reflect construction,
maintenance, and shutdown turnaround activities. Each of these categories includes
examples of events which helped as references to achieve consistency in judgment during
observation with the activity analysis software. Most of these categories and examples
are an adaptation from the CII’s implementation resource 252 (“Guide to Activity
Analysis” 2010).
Direct work
Exerting physical effort directed towards an activity or physically assisting in
these activities, direct work often involved workers installing materials and/or equipment
but also included the physical effort of support groups. Direct work was observed during
installation or demolition work. The following are some specific examples of direct work
during construction or maintenance activities:

30
Laborers:
• Installing forms, pipes, and other equipment
• Casting concrete
• Carrying out excavation works
Scaffolders:
• Erecting or dismantling scaffolding
• Modifying scaffolding
Pipefitters:
• Fitting or dismantling pipes
• Grinding or welding an installation
• Connecting or disconnecting a pump or other equipment
• Installing or uninstalling blinds
• Hydro testing or physically assisting in similar activities
Carpenters:
• Erecting or stripping formwork
• Erecting or dismantling temporary structures
• Installing doors and finishes
• Installation of shoring

31
Truck drivers: (only those involved in the work being observed)
• Driving trucks to pick up or discard material
• Delivering material and equipment
• Decommissioning and transporting material or equipment
Ironworkers:
• Erecting, welding, grinding, bolting, and positioning
• Dismantling steel structures
• Rigging material
• Positioning, tying, and placing rebar
Cement finishers:
• Actively engaged in a concrete pour or assisting with a concrete pour
• Finishing concrete
• Grouting
Operators: (only those involved in the work being observed)
• Lifting or transporting materials
• Actively positioning equipment, boom, or hook
• Oilers actively engaged in maintenance of equipment
• Assisting with placement of equipment

32
Millwrights:
• Installing equipment
• Aligning equipment
• Adjusting equipment
• Installing or adjusting shims
Electricians:
• Installing temporary power
• Installing raceway
• Cable pulling
• Installing duct bank
• Pulling or terminating cable
• Testing systems
Painters:
• Preparing surfaces
• Applying coating material
• Removal of paint

33
Insulators:
• Laying out patterns
• Shearing metal
• Fitting components
• Installing insulation
• Removing old insulation
Sheet metal workers:
• Cutting or shaping metal
• Fabricating activities
• Welding, fitting, or repair activities
• Installing or demolition of ductwork
Note: Indirect labor like management or safety officers/engineers involved with such
work should not be counted in the sampling process.
Waiting
Periods of waiting or idleness even if attentive to ongoing work by other craft was
classified as waiting and here are some of examples that helped in identifying the
subcategories under waiting.

34
Permits:
• Waiting for permits or to be signed off the task
• Waiting to gain access to the work area
• Waiting at the clock to clock in or clock out
Instruction:
• Waiting for instruction or a job assignment from foreman or other supervisor
• Stand by activities caused by trade practices or jurisdictions
• Waiting to receive instructions at the gang box or foreman’s station (Craft
personnel are not attentive to the work going on)
Material:
• Waiting in line at a warehouse or any other material or parts storage area
• Waiting for a concrete bucket to return with the next load of concrete
• Waiting for a truck to be loaded or unloaded (truck driver)
• Waiting for a weld or material to cool down

35
Equipment:
• Waiting on scaffolding
• Waiting for a truck, crane, or a bus to arrive to transport material or personnel
• Waiting for a cable pull to begin
• Waiting for a crane to hook to return for the next lift
• Waiting for an opportunity to maintain equipment
• Waiting for an opportunity to assist an operator (oiler)
• Waiting for an item to lift or move (operator)
• Waiting for the elevator
• Waiting for equipment to cool down
• Waiting for another crew or technician to finish using tools or equipment
QA/QC:
• Waiting for safety/QA/QC to sniff out a tank before entering
36
Unknown:
Since it was challenging to distinguish and classify some of these instances, they
were categorized under “unknown”. In such scenarios, a voice recording narrating the
observations of the site conditions at that time helped during the development of the
observation summary. Here are some such instances:
• Waiting for a welder to complete a weld (pipefitter).
• A worker waiting at the top of the column.
• A utility crew waits while a back hoe operator digs a trench.
• Millwrights wait while electricians disconnect a pump.
• Waiting on a crew member while he gets material or parts.
Preparatory work
Activities related to receiving assignments and determining requirements prior to
performing tasks was categorized as preparatory time. They included stretching activities,
safety talks, and start card processes. This also includes discussions to explain or plan the
task at the work location. These discussions took place between craft persons or between
supervisor and craft.
• Receiving preparatory instructions at the gang box or foreman’s station (craft
personnel were observed to be attentive).

37
• Any craft actively engaged in performing fire watch, confined space watch,
providing tool or rod room attendant services, or physically assisting in another
crafts direct work.
• Setting-up works, such as covering the work area with canvas prior to welding
works.
• Painters mixing paint prior to carrying out the task.
• Providing flagging or rigging support.
• Flagging an operator.
• Actively involved in general traffic flagging or control.
• Assisting with concrete pours.
• Assisting with excavations.
• Distributing water and assisting other crafts with direct work.
• Clearing debris and housekeeping works.
• Receiving drawings, specifications, or other task related and necessary
information.
• Using telephones or radios for work related reasons.
• Inspecting the work area with supervision, safety, or other craft to determine task
requirements.
• Discussing material, tool, or equipment needs.
• Actively participating in stretching, safety talks, or the start card process.

38
Material handling
This category included activities associated with obtaining, adjusting, and
transporting material from one part of the facility to another. This category did not
include moving items such as beams, pipe spools, permanent plant equipment, conduit,
wire, rebar, etc. in the general area of the task or into their final position.
• Supporting crafts transporting bulk materials from the laydown area to project
work areas (operators and teamsters are direct work, but supporting crafts are
material handling.)
• All craft persons physically carrying steel, pipe, insulation, etc. from one location
to another.
• Scaffolders handling materials and unloading materials at different locations.

39
Tools and equipment
This category included activities associated with obtaining, transporting, or
adjusting tools or equipment in preparation of performing direct work. Specific instances
like the ones below were used to describe this category.
• Locating a grinder or other tool in a gang box and transporting it to the task area.
• Running welding leads to the work area or adjusting the welding machine.
• Connecting electrical supply or air supply to tools or construction equipment.
• Obtaining and transporting slings, shackles, or similar tools equipment.
• Putting on safety harnesses, face shields, cleaning safety glasses, or physically
adjusting PPE (does not include donning/ doffing or adjusting personal clothing).
• Adjusting the location of a JGL, Scissors lift in the immediate vicinity of the
work.

40
Travel
Walking or riding empty handed or without tools, materials or technical
information was categorized as travel. Following are some instances that described travel.
• Any craftsperson walking or riding with empty hands or carrying normal tool belt
tools.
• An operator of any equipment using the equipment to travel from one site location
to another.
• If the travel of equipment does not include adjusting position in the general
vicinity of the work.
• Craftsmen travelling to and from work areas and store during normal working
hours.
• Walking to or from breaks and lunch.
• Travelling for work at height.
• Walking with drawings, prints, work packages, etc.
41
Personal
• Rest periods or coffee breaks during normal work hours.
• Smoking breaks or snack breaks during normal work hours.
• Rest room or water breaks during normal work hours.
• Obvious socializing and being non attentive to work on the job site.
• Sleeping during normal work hours.
• Donning, doffing, or adjusting personal clothing.
• Personal clean up time before or after breaks.
• Personal conversation not related to the task.
Other issues
Although the above list tries to capture various activities and their categories,
there are instances during the time of observation where it is difficult to categorize an
activity under a particular category. Some of these instances may be:
Craft working in hidden areas, confined spaces and work at height
Craft workers working in areas without access or clear vision for observation are
hard to sample.

42
Weather delays due to lightning, rain etc.
When work at the job site is paused due to weather, the activity analysis software
should be paused. In order to capture additional information and explain some of these
specific challenges observed at the site, the recording feature of the software is useful.
43
ACTIVITY ANALYSIS SOFTWARE
Researchers in collaboration with Enstoa (Software development firm) developed
activity analysis software to help with the sampling process of activity analysis at
Singaporean petrochemical facilities. The tool consists of an intrinsically safe tablet
computer that runs the activity analysis application on a windows 8 platform.
Features
This software allows a user to organize activity analysis data by capturing the
following:
• Name of plant or facility being observed
• Project name
• Companies (Contractors/Subcontractors) involved in the projects
It also allows observers to capture the following parameters that may impact labor
productivity:
• Study location (field or shop).
• Activity type (construction, maintenance or shutdown turnaround )
• Weather (temperature/humidity/rain)
• Number of workers (to determine the minimum sample size)
44
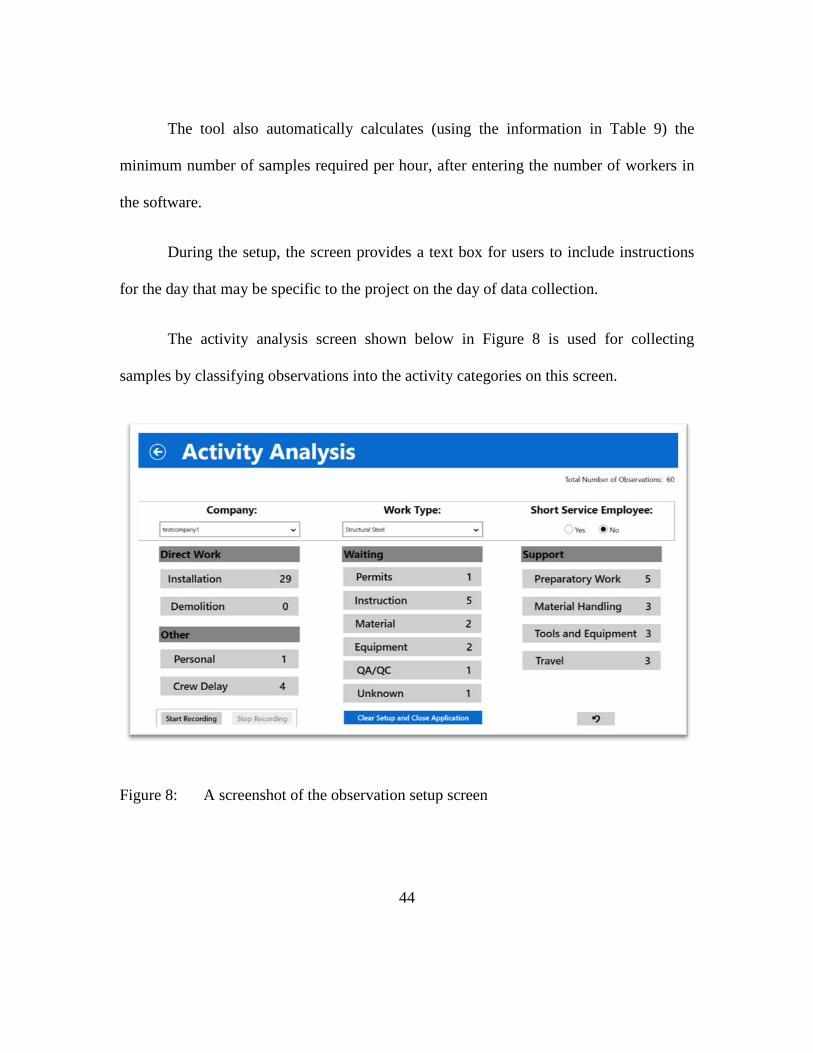
The tool also automatically calculates (using the information in Table 9) the
minimum number of samples required per hour, after entering the number of workers in
the software.
During the setup, the screen provides a text box for users to include instructions
for the day that may be specific to the project on the day of data collection.
The activity analysis screen shown below in Figure 8 is used for collecting
samples by classifying observations into the activity categories on this screen.
Figure 8: A screenshot of the observation setup screen

45
The software keeps track of the total number of samples observed at the top of the
screen. The number in front of each category represents the count for that category.
By default, the tool records each craft worker as a full time employee; however
the tool also provides an option of selecting short service employees.
The record audio feature on the tool can be enabled by selecting “start recording”
on the screen. This feature can be used to capture observations, challenges, and
communications with workers or superintendents on the field. These are especially useful
during analysis to generate recommendations to improve direct work time
After collecting the required number of samples, the observation can be exported
to a .csv file from the activity analysis software. The .csv file exported from this software
is easier to work with when saved as an MS Excel file. This can be done by opening the
exported .csv file and clicking on “save as” under the file menu. This spreadsheet is now
ready to proceed with further analysis as described in Chapter 6.

46
Observation summary
While the tool provides support in collecting samples, capturing and making notes
about other observations and comments on the site during activity analysis provides
critical data that will be extremely useful during the analysis and recommendation phases
of the study. The team performing activity analysis is highly encouraged to make several
relevant comments be them in audio or written notes. It is recommended that the written
notes and other comments are compiled frequently and electronically as an “observation
summary” in the interest of preserving every observation and to enable future sharing of
data.
47
Chapter 5: Extending Activity Analysis Sample Phase
PREPARING FOR DATA COLLECTION
The following steps will help in planning and executing activity analysis data
collection effectively in both construction and maintenance environments at
petrochemical facilities:
1. Provide an overview of activity analysis to the selected project team
2. Collect project details shown below, from the project manager using an
information sheet:
a. Location.
b. Area description.
c. Scope of work.
d. Safety instructions.
Complete the required safety training a few days before the
sampling day.
Verify the safety requirements and ensure the availability of
Personal Protective Equipment (PPE).

48
e. Description of contractors and subcontractors on the project.
Identify the companies (contractor and subcontractors) involved in
the project and observe the differences in uniform, safety vest
colors, logos, and hard hat colors, etc. to differentiate one from the
other during sampling.
Look for identifiers to differentiate craft from foreman,
superintendents, safety, quality personnel, and management.
f. Propose and coordinate for meeting and data collection dates.
3. Study the scope of work along with the information collected in the previous step.
4. Coordinate logistics, facility permits and finalize data collection dates.
5. Request and attend a preparatory meeting and site walk through with project
manager.
6. Conduct data collection.
a. Request the plant manager to provide a site layout and sketch random
routes within the vicinity of the plan to ensure significant workers on the
job site.
b. Schedule sufficient days to achieve the minimum number of observations
based on the expected number of workers on the project being observed.

49
DATA COLLECTION CHALLENGES
The observers may experience a few challenges in a petrochemical setting and
being prepared for the following will make the process effective:
• Observations may have to be paused during weather breaks (rain or lightning).
• Observing workers in confined spaces or at heights can be challenging.
Sometimes a crew supervisor may be consulted to understand the activity
category in such cases.
• It can be difficult to keep track and be consistent while observing a large group of
workers clustered in a work area. On the other hand, it may be hard to meet the
number of observations for smaller groups.
• Although it might take some time to get used to, it is important to differentiate
indirect labor like management, or safety officers and engineers involved in
projects being observed.

50
ACTIVITY ANALYSIS SAMPLING
In order to maintain consistency across the observers within the data collection team,
the following rules of sampling were implemented.
• Every observation in a tour was a mental snapshot, which was recorded as a count
under the relevant category for each craft worker.
• The rating was taken at the first instant of observation and observers avoided
anticipation of a worker’s action.
• Observers kept moving and tried to vary the routes to keep the process of
sampling random.
• Observations were not be made during lunch hours.
• Observers did not consider foreman or site management during sampling and
focused only on the labor or craft workers.
MINIMUM NUMBER OF SAMPLES
For the data to reflect the distribution of work time effectively, it was critical to
collect a significant number of samples from the activities being observed. Table 9 below
was used to define the minimum number of samples to be collected based on the number
of craft workers involved with the activities that were being observed (“Guide to Activity
Analysis” 2010):

51
Number of craft workers Minimum sample size per hour
0-50 46
51-100 84
101-150 116
151-200 144
201-250 168
251-300 189
301-350 208
351-400 225
401-450 240
451-500 253
501-550 265
551-600 276
601-650 286
651-700 296
701-750 304
751-800 312
801-850 319
851-900 326
901-950 332
951-1000 338
Table 9: Minimum sample size based on number of workers (“Guide to Activity
Analysis” 2010)

52
Note: when the number of workers exceeds 1000, the minimum sample size per hour for
a specific number of workers “n”, was calculated using the following formula (Thompson
1987): Minimum sample size per hour = (n*510) / (n+510)
The following example shows the process that was used to monitor the minimum
number of samples collected:
Assuming the number of workers on a certain project to be observed is 300; Table
9 suggests that a minimum of 189 observations for every hour of a typical work day
should be collected to reach 95% confidence level. To make 189 observations in each
hour, sampling could be spread across 3 days in order to satisfy this minimum sample
size per hour. Here are two hypothetical cases that meet the minimum requirement:
Case 1
63 observations from 8am to 9am on each of the three days of the study
Case 2
50 observations from 8am to 9am on day 1;
69 observations from 8am to 9am on day 2;
70 observations from 8am to 9am on day 3;
The intent is to capture the minimum required samples under each hour of a work
day spread across all the days of the study.

53
Chapter 6: Activity Analysis Report Generation
EXPORT DATA FROM ACTIVITY ANALYSIS SOFTWARE
Shown below in Figure 9 is a screenshot of the .csv file generated from activity
analysis software.
Figure 9: Export .csv file example
The information from this file can be tabulated and organized using MS Excel
spreadsheets. An example of one such spreadsheet is shown in Table 10 below. Note that
the data in this Table 10 is for demonstration purposes only.

54
Analysis Time 7:00 8:00 9:00 10:00 11:00 1:00 2:00 3:00 4:00
Daily Total
Category total
Percent of observations
8:00 9:00 10:00 11:00 12:00 2:00 3:00 4:00 5:00
Direct work
Day 1 52 42 37 55 36 38 44 35 61 364
916 44.88% Day 2 35 38 32 31 38 32 32 42 24 266
Day 3 28 36 33 39 42 25 35 40 50 286
Prep work
Day 1 18 8 8 12 11 8 8 12 18 92
285 13.96% Day 2 6 12 21 15 25 15 20 24 16 129
Day 3 8 5 7 12 8 7 5 12 8 64
Tools/equip
Day 1 22 12 8 2 3 10 12 2 15 83
214 10.49% Day 2 15 6 5 5 4 5 6 5 12 59
Day 3 12 16 2 6 2 2 16 6 12 72
Material Handling
Day 1 20 8 12 9 18 6 8 19 1 83
187 9.16% Day 2 3 4 8 13 12 8 6 13 3 58
Day 3 4 8 7 4 5 7 8 4 4 46
Waiting
Day 1 3 5 9 10 12 9 5 10 3 54
189 9.26% Day 2 8 12 12 8 5 8 11 8 12 79
Day 3 2 12 8 6 7 8 12 6 2 56
Travel
Day 1 5 11 8 8 9 8 11 8 5 64
208 10.19% Day 2 7 6 11 9 4 11 6 5 7 62
Day 3 8 8 12 12 11 12 9 12 9 82
Personal
Day 1 3 1 2 3 2 0 5 1 2 17
42 2.06% Day 2 0 3 1 0 2 3 2 2 2 13
Day 3 1 2 2 2 3 2 0 2 1 12
Total Hourly 260 255 245 261 259 224 261 268 267 2041 2041 100.00%
Table 10: Organization of activity analysis data - example
55
EXAMPLE CALCULATION FOR ANALYSIS
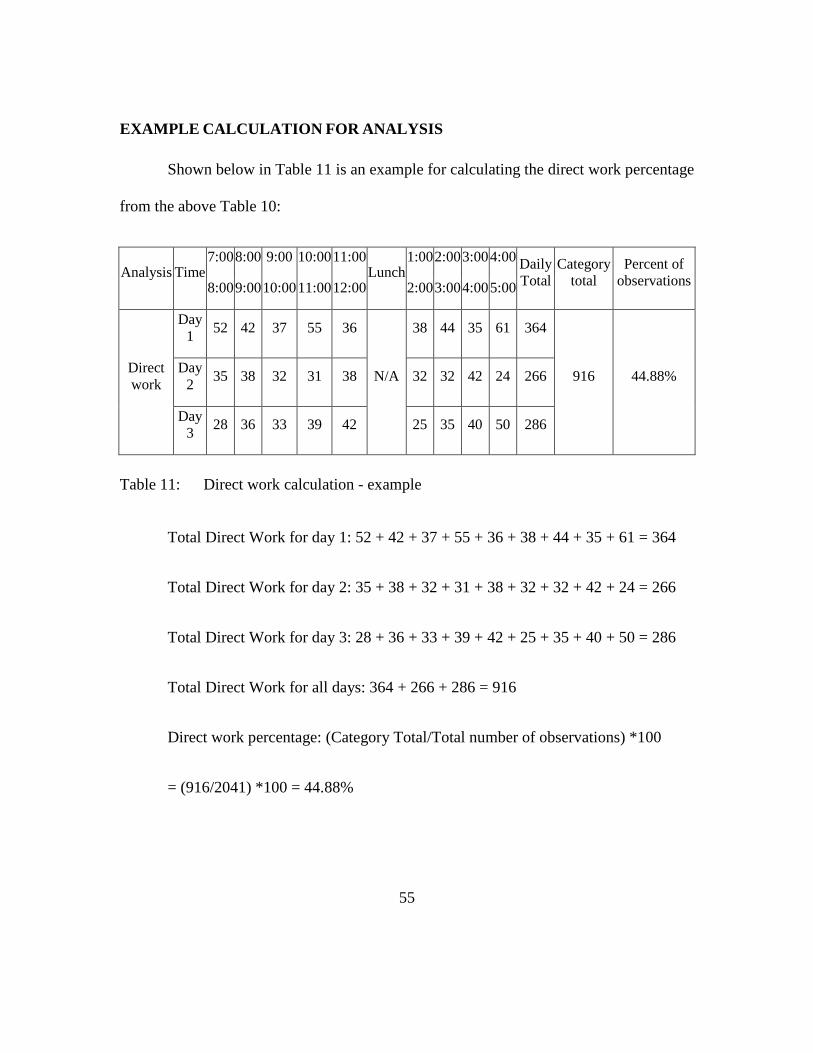
Shown below in Table 11 is an example for calculating the direct work percentage
from the above Table 10:
Analysis Time 7:00 8:00 9:00 10:00 11:00
Lunch 1:00 2:00 3:00 4:00 Daily
Total Category
total Percent of
observations 8:00 9:00 10:00 11:00 12:00 2:00 3:00 4:00 5:00
Direct work
Day 1 52 42 37 55 36
N/A
38 44 35 61 364
916 44.88% Day 2 35 38 32 31 38 32 32 42 24 266
Day 3 28 36 33 39 42 25 35 40 50 286
Table 11: Direct work calculation - example
Total Direct Work for day 1: 52 + 42 + 37 + 55 + 36 + 38 + 44 + 35 + 61 = 364
Total Direct Work for day 2: 35 + 38 + 32 + 31 + 38 + 32 + 32 + 42 + 24 = 266
Total Direct Work for day 3: 28 + 36 + 33 + 39 + 42 + 25 + 35 + 40 + 50 = 286
Total Direct Work for all days: 364 + 266 + 286 = 916
Direct work percentage: (Category Total/Total number of observations) *100
= (916/2041) *100 = 44.88%
56
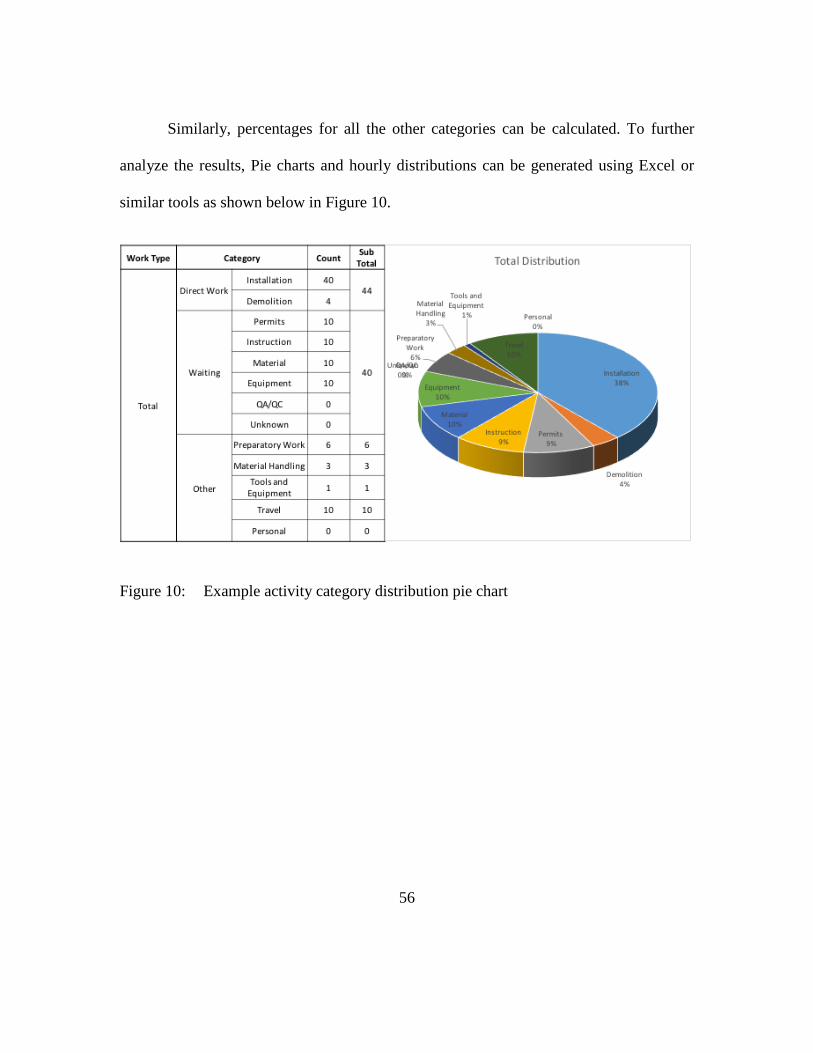
Similarly, percentages for all the other categories can be calculated. To further
analyze the results, Pie charts and hourly distributions can be generated using Excel or
similar tools as shown below in Figure 10.
Figure 10: Example activity category distribution pie chart

57
ACTIVITY ANALYSIS REPORT GENERATION
Report Generation Sheet (RGS) Content
A report generation sheet (RGS) was developed using Microsoft Excel to analyze
the data exported from the activity analysis software in an aggregated manner; query by
trades; and also to visualize time trends. RGS contains the following tabs:
• Datasheet
• Direct Work Dashboard
• Aggregate Results
• Results by Trade
Datasheet
The datasheet tab holds the raw data exported from the activity analysis software
as seen earlier in Figure 9. The data from all the multiple projects can be collated into this
datasheet for aggregate analysis. The result tabs are classified into three sections – direct
work dashboard, aggregate results and results by trade.

58
Direct Work Dashboard
This dashboard presents a quick glimpse of the direct work percentages for the types of
project or trade as shown in this Figure 11 below.
Figure 11: An example of direct work dashboard tab
Aggregate Results
Aggregate result tabs present activity analysis results for:
• All types of activities combined
• Construction activities
• Maintenance and Shutdown/Turnaround activities combined
• Maintenance activities
• Shutdown/Turnaround activities

59
Results by Trade
These tabs query the activity category percentages for the different trades to be observed
during sampling:
• Equipment
• Site Work
• Scaffolding
• Piping
• Electrical
• Structural Steel
• Insulation
• Concrete
• Cleaning/Blasting
• Painting
• Instrumentation

60
Each result tab mentioned above contains the following representations as shown in
Figure 12:
• Table and pie charts with activity category percentages
• Table and Histogram representing variation of activity category percentages with
time during a typical 8 hour work day
Figure 12: An example of aggregate result tab in RGS

61
Using the Report Generation Sheet
Step 1 – Copy Data
1. Open the saved excel spreadsheet that was exported from the activity analysis
software. (Combine data from projects for aggregated analysis as desired)
2. Select all the cells that contains the data
3. Right click and copy all the selected cells
Step 2 – Paste Data
1. Open the Report Generation Spreadsheet (RGS)
2. Select the “Data sheet” tab
3. Right click on the highlighted cell (A1) and paste the copied data as shown in
Figure 13 below:
Figure 13: Screenshot of pasting software export data into RGS

62
Step 3 – Review Result Tabs
1. Once the data has been pasted on to the datasheet tab correctly, all the result tabs
will be automatically populated
2. Now, the desired result tabs can be view to analyze the respective result tables
and charts

63
Chapter 7: Recommendations to Plan and Implement Improvements
Multiple cycles of activity analysis will facilitate verification of the
implementation of productivity enhancements at petrochemical facilities.
The intention of collecting data in cycles is to measure improvements after
implementing intervention between cycles.
Percent change for direct work can be measured as:
(Direct work in cycle 2 – Direct Work in Cycle 1) / (Direct Work in Cycle 1)
The following section compiles some trends that can help in comparing and
analyzing activity analysis studies at petrochemical facilities.
Expected proportions in activity category percentages
Many projects witness a significant amount of time on preparatory work, material
handling and traveling, in proportion with the observed productive direct work time while
performing construction, maintenance and shutdown turnarounds activities. A
considerable amount of time is also spent on information exchange while maintaining
these facilities.

64
Interpretation of results
The primary objective here is to decipher the numbers and prepare
recommendations to improve the direct work time and other activity categories observed.
This can be achieved by following these steps:
• Compare collected data with industry averages and world class direct work rates
available from background review, past experience of researchers and subject
matter experts from the industry (presented in Table 12 in the next section of this
chapter).
• Determine the categories that are outside the norm and identified the main reasons
causing this discrepancy. The observations and notes from activity analysis will
come in handy during this stage.
• Analyze how policies, execution flaws, challenges, or management processes
affect too much waiting, too much travel, or too much personal time.
• Each project and/or plant is unique, but the data provides clues on what to look
for and a sense of direction for improvement.
• Based on these interpretations, each team can develop recommendations to
implement improvements on their projects

65
The direct work percentage can be ranked into its respective quartile from Table 12
and prepare for realistic targets to eventually reach the first quartile. Reviewing the
results in detail and analyzing other activity categories pointed towards key areas of
opportunity for improvement.
Probable causes for low direct work rates
This section discusses some potential causes for certain scenarios such as high
waiting time, high travel time, or high personal time, which was observed during activity
analysis. However other project specific causes may need further investigation in addition
to the following:

66
• Lack of supervision in both front line and superintendents.
• Significant design issues.
• Overmanning issues.
• Poor planning of material availability on site.
• Tools and equipment availability issues.
• Site access issues such as toilets and stores in isolated locations.
• Workers waiting for the scaffolding modification during the course of work.
• Material and tools store are placed far away from work place travel.
• Constantly changing priorities due to management decisions, for instance material
procurement.
• Poor coordination between trades.
• Unestablished first line supervision and job expectations.
• Weather conditions.
• Permits.
• Resources not scheduled or levelled appropriately.
• Poorly managed starts, stops, and breaks.
67
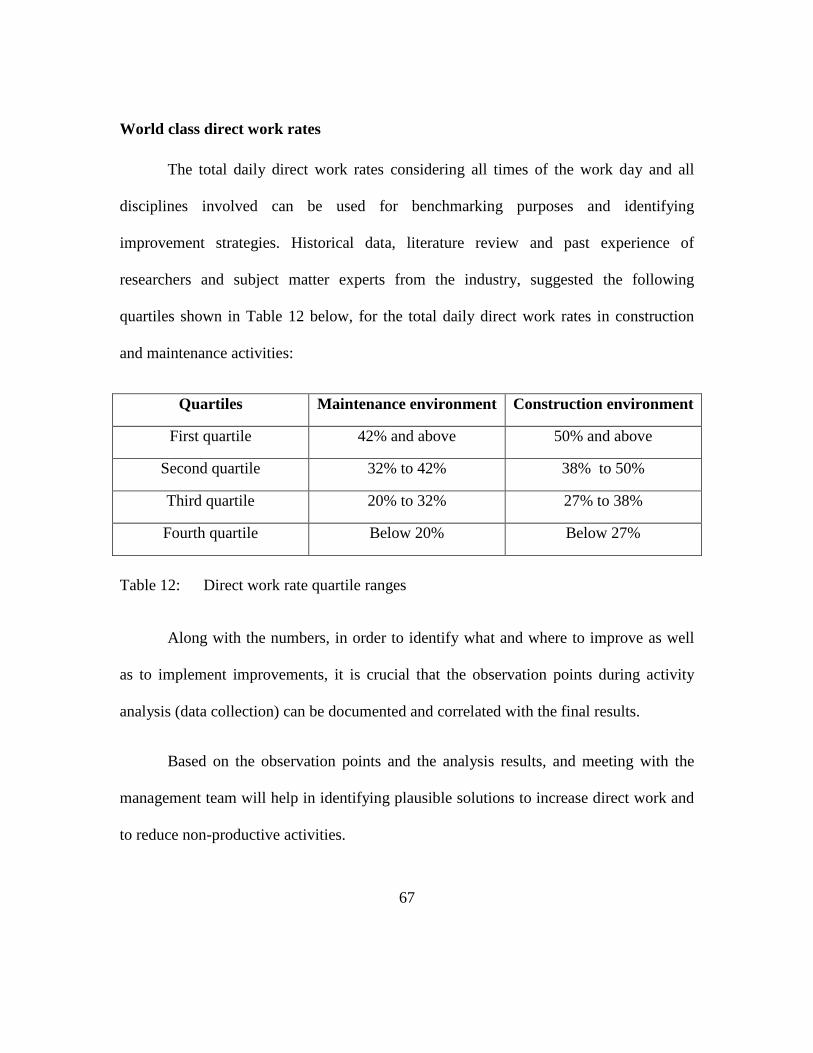
World class direct work rates
The total daily direct work rates considering all times of the work day and all
disciplines involved can be used for benchmarking purposes and identifying
improvement strategies. Historical data, literature review and past experience of
researchers and subject matter experts from the industry, suggested the following
quartiles shown in Table 12 below, for the total daily direct work rates in construction
and maintenance activities:
Quartiles Maintenance environment Construction environment
First quartile 42% and above 50% and above
Second quartile 32% to 42% 38% to 50%
Third quartile 20% to 32% 27% to 38%
Fourth quartile Below 20% Below 27%
Table 12: Direct work rate quartile ranges
Along with the numbers, in order to identify what and where to improve as well
as to implement improvements, it is crucial that the observation points during activity
analysis (data collection) can be documented and correlated with the final results.
Based on the observation points and the analysis results, and meeting with the
management team will help in identifying plausible solutions to increase direct work and
to reduce non-productive activities.

68
Best Practices - First and Last Work Hours of the Day
The first and last work hours of the day typically experience lower direct work rates.
Certain steps when planning and scheduling maintenance activities are suggested to
reduce and control this drop:
• Weekly planning meetings should be scheduled with the participation of all
interested parties from both the owner and contractors to discuss and finalize the
schedule for the next week. Attendees should include planners, schedulers,
operations personnel, and maintenance teams.
• The maintenance team should have an adequate number of maintenance planners
and schedulers. A typical rate is one planner for every 25 maintenance workers
and one scheduler for every four planners.
• Once the work orders for the next week have been created by the planner, the
ready-to-schedule information should be shared with the scheduler to verify
conflicts and schedule the tasks. The planner should confirm the approval of the
tasks from operations and ensure that the materials are procured and reserved for
the task using a maintenance management information system.
• Daily plans should be confirmed on the previous day and shared with front line
supervisors and foremen in advance.
• Supervisors and foremen should arrive one hour earlier than the start of the work
day to check the plan and start obtaining work permits.

69
• Supervisors and foremen should set up detailed objectives and clear work
expectations for the maintenance team in advance.
• Planners and schedulers should account for the possibility of emergency
corrective maintenance tasks being requested on a given day. Organizing short
early morning planning meetings should help in adjusting the plans and schedules
to resolve such last minute requests.
• The “first job rule” should be applied when considering last minute maintenance
requests. This means that the schedule for the first job of the day should not be
altered even in the case of corrective maintenance requests (pending an
emergency). This will enable the craft workers to get the permits and begin to
work according to the original plan. The remaining part of the day can be re-
adjusted by the planners, schedulers, supervisors, and foremen to accommodate
the last minute corrective maintenance requests.
• Schedule compliance is a top priority for many contractors. A common practice to
achieve this compliance has been to resource load the schedule to 80% and not
100% of their potential resources. This may impact the direct work rates by
having unaccounted resources on the job site to handle emergency corrective
tasks that may come up during the day.
• In order to improve direct work rates and better coordination between workers
and supervisors, it is highly recommended to conduct a short pre-start talk/ tool
box meeting every day prior to the commencement of work.

70
• The supervisor/ foreman should conduct a pre inspection of the work location
prior to pre-start talk.
• The pre-start talk should be conducted adjacent to the work locations if possible.
• All workers involved in the task and the safety personals should be present during
the pre-start talk.
• The specific task of the day should be clearly explained in detail to all the
workers.
• It is recommended the person who conducts the pre-start talk should be
enthusiastic and able to speak the same language as the group of workers assigned
for the task.
• The supervisor should actively encourage the workers to participate in the pre
start talk.
• A pre-start talk form should be developed in order to document the specific work
task in steps, work site hazard, mitigation measures and identify nearby
operations.

71
Best Practices - Lunch Breaks
Following are recommended practices to enhance direct work around breaks:
• Employees should be allowed to take breaks when it is convenient for the job
under way, rather than at a specific time of the day. This would allow workers to
take a break when in route to a new task instead of taking a separate trip.
• Some permits expire when a worker breaks for lunch. Thus, it is important to plan
and streamline the process of renewing permits for the tasks to be performed in
the afternoon.
• In some situations, it may be advantageous to stagger lunch hours for different
crews. This can help in ensuring continuity of work throughout the day and also
in controlling traffic at the permit offices.
• Supervisors and foremen should actively supervise the work in the hour before
and after the lunch break.
• Ensuring adequate transportation and sufficient restrooms in the vicinity of the
work area could reduce travel and personal time.
72
Best Practices - Weather Breaks
Following are some recommended practices to be prepared for weather breaks:
• Weather stoppages may require workers to renew some permits depending on
their type. (e.g.: hot work permit, welding permit). Thus, it is important to plan
and streamline the process of renewing permits for the tasks to be performed after
the work resumes.
• Supervisors and foremen should actively direct the workers to return to the work
place as soon as the activities are authorized to resume.
• In some cases, the office that issue permits may be understaffed and not able to
issue multiple permits in a short period of time. Setting up multiple permitting
desks may help reduce the time involved in preparing to start the work after such
breaks.
• Supervisors and foremen should be able to start working on permits before the
work resumes.
• Some maintenance tasks may be conducted in shelters during weather stoppages.

73
Best Practices - Transition Periods for Multiple Shifts
These suggestions are provided to help with monitoring transition between shifts:
• Shutdowns and turnarounds typically require more front end planning since it
involves larger crews that are usually not familiar with the facility and permitting
processes. In this situation, supervisors and foremen should arrive one hour early
to arrange work permits and confirm the schedule of the day.
• Shut down and turnarounds may involve multiple shifts (e.g.: two 12-hour shifts)
during a prolonged period of time. Workers’ motivation and health should be
considered when planning and scheduling the work.
• Craft workers should be incentivized to keep high motivation levels. To ensure
effectiveness and reliability of the work, incentives may be designed to consider
metrics such as productivity, quality, safety, schedule, and rework.
• Ergonomics of the nature of work may impact direct work and hence it is
important to create an appropriate work environment, especially on shifts with
such long hours.
• Alternative work shifts may be considered. For instance, two 10-hour shifts may
be more effective to address the concerns mentioned above. In this case, a small
transition crew may work in the two hours’ in-between shifts to plan the transition
and make it more effective.

74
Chapter 8: Conclusions and Recommendations
CONCLUSIONS
The main objective of this study was to establish the idea of implementing a
continuous improvement program to enhance labor productivity at petrochemical
facilities. The activity analysis software that was developed worked well and safely with
the intrinsically safe tablets at various petrochemical units that were studied. The
extended methodology also provides a way to monitor the various trades working on
projects and help in recognizing the benefits of this continuous improvement program.
The first round of activity analysis in a plant provides an assessment of the
existing conditions and provides a baseline for monitoring a labor productivity indicator –
“direct work”. Trends with activity categories and fluctuation of direct work over a work
day especially around day start, end, breaks and during transition of shifts can be
expected in petrochemical maintenance and construction activities.
Selecting projects with similar scope of work in multiple activity analysis cycles
will help in analyzing and monitoring results that are truly reflective of the conditions
observed at the job site. Sampling craft working in enclosed spaces or at heights in a
maintenance environment can make it difficult for observers to predict the nature of work
and categorize the activity. Direct work on projects may or may not improve much as

75
within the first few cycles, but sticking to the continuous improvement process will
eventually enhance the performance.
Improvement depends on identifying and removing constraints and also
management and supervisory effort to identify problems and implement suggestions.
Multiple cycles of activity analysis can demonstrate quantifiable improvements to
monitor progress. Identifying key improvement opportunities, especially the low hanging
fruits, will help to see the value of activity analysis, get comfortable with the process and
spread awareness among several teams on construction projects, maintenance and
shutdown turnaround activities.

76
RECOMMENDATIONS FOR FUTURE RESEARCH
This research has provided a framework along with results for a continuous
improvement technique that works on various types of activities in a petrochemical
facility. In order to practice this efficiently, it is important for the top management of
companies to believe in the methodology and stay committed to the process. Nominating
a productivity sponsor for an organization can drive a dedicated task force to select
appropriate projects and measure, monitor and enhance performance. This can be
achieved by identifying challenges such as reduction of direct work around first hour,
lunch, weather breaks and taking steps to focus, schedule, plan and prepare for such
situations. Documenting, prioritizing and acting upon the identified opportunities can
help in reducing the time spent on preparatory work, material handling, tools and
equipment, and travel.
Creating a systematic lessons learned practice in the organization and recording
every strategy developed and implemented over the various activity analysis cycles can
lead to a comprehensive knowledge database for productivity improvement.
Along with time stamp data, collecting location coordinates for observations can
help in mapping the routes and further extend the scope of analyses to identify
bottlenecks on site, coordination issues between trades due to site layout, material storage
and tool room distances from work site.

77
Technology is rapidly changing the way things work in all industries. Work
sampling in the past was manually conducted using paper and pencil and we have come a
long way by using touch screen tablet computers to work efficiently and collect a lot
more samples in a given time. In the future, controlling such software remotely, using
technology like drones can address the challenge of getting around hazardous areas or
work at height with much less human fatigue.
78
References
Goodrum, Paul M., Dong Zhai, Yongwei Shan, Gabriel Dadi, Carl T. Haas, Michael C.
Gouett, Mahdi Safa, Di Zhang, Carlos H. Caldas, and Maria Benzekri. 2012.
“Craft Productivity Research Program Phase 2.” Research Report 252-11a.
Construction Industry Institute.
“Guide to Activity Analysis.” 2010. Construction Industry Institute.
Oglesby, Clarkson H., Henry W. Parker, and Gregory A. Howell. 1989. Productivity
Improvement In Construction. McGraw-Hill Book Company.
Palmer, Richard D. 2006. Maintenance Planning and Scheduling Handbook. Second
Edition. McGraw-Hill Book Company.
Smith, Francois. 2006. “A Human Resource Forecast Model to Support New Plants in the
Oil and Gas Industry.” University of Stellenbosch.
Waidelich, Scott Jacob. 1997. “THE NAVY PUBLIC WORKS CENTER SAN DIEGO
CRAFTSMEN PRODUCTIVITY ANALYSIS.” The University of Texas at
Austin.
Yolton, John. 2008. “Calculating Wrench Time - Statistical Activity Surveys.” San
Diego, CA: SKF Reliability Systems.
Thompson, S.K. (1987). “Sample size for estimating multinomial proportions.” The
American Statistician, 41, 42-46.

79
Liou, F. & Borcherding, J. D (1986). “Work sampling can predict unit rate productivity.”
Journal of Construction Engineering and Management, 112(1).
“Calculating Wrench Time – Statistical Activity Surveys” 2008. SKF Group
Marjatta Strandell (1976). “Productivity in power plant construction.” 1976 AACE
Transactions, pp. 334-337
Related Documents