1 人文論集 第 53 巻 Should Japanese University Students’ TOEIC Scores Be Expected to Increase? Brian D. Bresnihan Abstract This paper discusses the question as to whether or not it is reasonable, given the usual schedule of English classes at most Japanese colleges and universities for students who are not majoring in English, to expect students’ TOEIC scores to increase during their time of study. After briefly describing the pervasive use of the TOEIC in Japan, the paired TOEIC scores of 792 university students are analyzed and examined to determine if significant increases in a majority of the students’ scores actually occurred. Finding that this was not the case, the ensuing discussion offers explanations for why this is not surprising. Introduction English language testing is a huge business, as anyone having anything to do with the field of English language education knows. For Japanese college and university students, the TOEIC is undoubtably one of the most well known and most often taken. In 2014, the TOEIC was sat for at least 972,380 times by students in Japan from primary school children to graduate school students: 692,163 times by the 2,885,529 university students, 11,964 times by the 136,534 two-year college students, 24,470 times by the 57,677 technical college students, and 53,075 times by the 251,013 graduate school students. (IIBC, n.d., pp. 4, 7; Statistics Bureau, 2015a, 2015b, 2015c, 2015d) The TOEIC is used in schools for many purposes. Trew (2007) says, “In Japan, a significant proportion of the universities and colleges surveyed used the test for purposes of accreditation, course placement, and measuring progress within a curriculum. (p. 4) Takahashi (2011) expands that list stating that some of the ways Japanese universities use TOEIC scores are for“assessment of newly enrolled students, measurement of curriculum effectiveness, encouragement of students’ independent studies, placement CORE Metadata, citation and similar papers at core.ac.uk

Welcome message from author
This document is posted to help you gain knowledge. Please leave a comment to let me know what you think about it! Share it to your friends and learn new things together.
Transcript

1人文論集 第 53 巻
Should Japanese University Students’
TOEIC Scores
Be Expected to Increase?
Brian D. Bresnihan
AbstractThis paper discusses the question as to whether or not it is reasonable, given the
usual schedule of English classes at most Japanese colleges and universities for students
who are not majoring in English, to expect students’ TOEIC scores to increase during
their time of study. After briefl y describing the pervasive use of the TOEIC in Japan,
the paired TOEIC scores of 792 university students are analyzed and examined to
determine if signifi cant increases in a majority of the students’ scores actually occurred.
Finding that this was not the case, the ensuing discussion off ers explanations for why
this is not surprising.
IntroductionEnglish language testing is a huge business, as anyone having anything to do
with the fi eld of English language education knows. For Japanese college and university
students, the TOEIC is undoubtably one of the most well known and most often taken.
In 2014, the TOEIC was sat for at least 972,380 times by students in Japan from primary
school children to graduate school students: 692,163 times by the 2,885,529 university
students, 11,964 times by the 136,534 two-year college students, 24,470 times by the
57,677 technical college students, and 53,075 times by the 251,013 graduate school
students. (IIBC, n.d., pp. 4, 7; Statistics Bureau, 2015a, 2015b, 2015c, 2015d)
The TOEIC is used in schools for many purposes. Trew (2007) says, “In Japan, a
signifi cant proportion of the universities and colleges surveyed used the test for purposes
of accreditation, course placement, and measuring progress within a curriculum. (p. 4)
Takahashi (2011) expands that list stating that some of the ways Japanese universities
use TOEIC scores are for “assessment of newly enrolled students, measurement of
curriculum effectiveness, encouragement of students’ independent studies, placement
CORE Metadata, citation and similar papers at core.ac.uk
tests, requirements for credits, [and] job-hunting support.” (p. 130) To these, it should
be added that the TOEIC has become the main content of a sizable percentage of the
Japanese college and university English language courses, appearing in many of their
names and syllabi, and textbooks, as can be seen in their titles and advertising.
Students at Japanese colleges and universities are nearly always required to pass
a few English language courses, often the equivalent of four one-semester, once a week
courses, but sometimes up to eight. (Of course, those majoring in English take many
more.) These are usually taken during the first two years of study. Elective English
classes are also regularly offered. In most schools, all of these courses meet for 90
minutes once a week, and semesters are 15 weeks long with summer vacation between
the two semesters.
The Research Subjects, Procedures, and QuestionsThe present study examines the TOEIC IP Test1 scores of 792 fi rst-year students
at a Japanese public university, achieved over a period of four consecutive years. It then
discusses the implications for the students. All were in the same department and not
majoring in English. All took the test twice in the school year. Some of the students, 189,
were enrolled in three mandatory English courses each semester, the 3M group. They
had applied for and were accepted into a program that required them to take one extra
English class throughout their fi rst year. The rest of the students, 603, were enrolled
in two, the 2M group. These courses were not integrated, but enrollment for each did
continue from the fi rst semester to the second. No data was collected concerning how
many other English courses they were enrolled in nor in their own private studies of
or experiences involving English. The schedule for each of the English courses was the
norm as described in the previous paragraph, meeting 90 minutes once a week. All of
the students sat for the TOEIC IP Test administered on campus twice in the school
year, towards the end of each semester. Scores are reported for this paper test in
increments of 5 points, from 5 to 495 for the listening (L) and reading (R) sections and
from 10 to 990 for the total (T). The data was analyzed using InStat Version 3 and JMP
Version 11 for Macintosh and Becker’s eff ect size calculator (2000).
The specifi c research questions are:1 The IP (Institutional Program) test is scheduled and administered by an institution. The SP (Secure
Program) test is administered at locations and times scheduled by ETS (Educational Testing Service), the test’s producer, or an affi liate.
2
Should Japanese University Students’ TOEIC Scores Be Expected to Increase?
人文論集 第 53 巻
1. Are any of the means of the students’ scores on the two administrations for any of
the three measures for either group diff erent, and if so, are the diff erences signifi cant?
2. How many students’ scores for any of the three measures increased on the second
administration, and how many of these increases demonstrated a real improvement in
TOEIC score and presumably English ability?
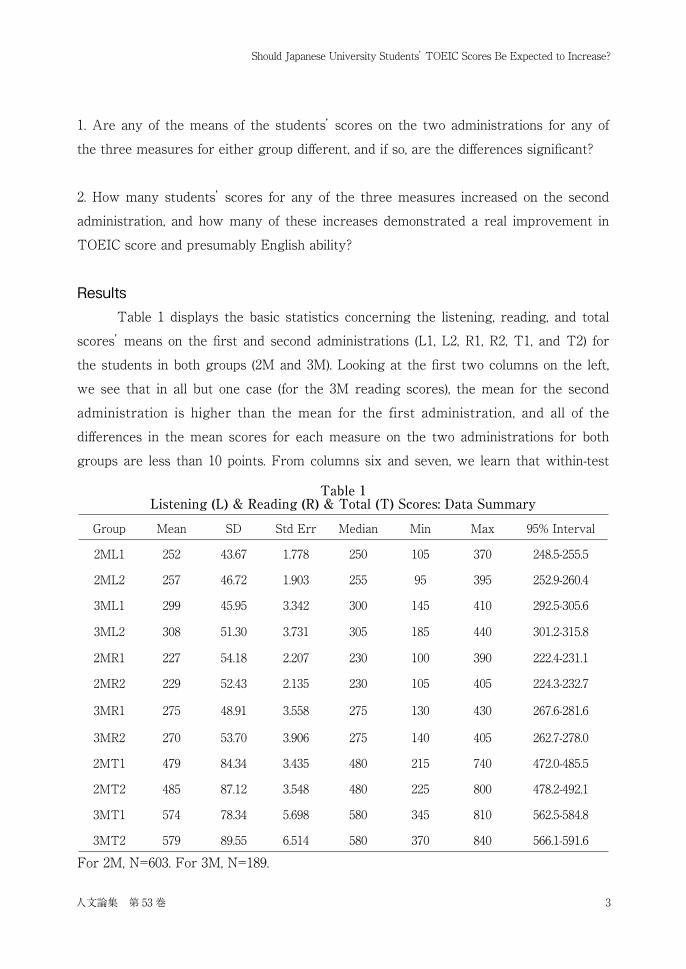
ResultsTable 1 displays the basic statistics concerning the listening, reading, and total
scores’ means on the fi rst and second administrations (L1, L2, R1, R2, T1, and T2) for
the students in both groups (2M and 3M). Looking at the fi rst two columns on the left,
we see that in all but one case (for the 3M reading scores), the mean for the second
administration is higher than the mean for the first administration, and all of the
diff erences in the mean scores for each measure on the two administrations for both
groups are less than 10 points. From columns six and seven, we learn that within-test
Table 1Listening (L) & Reading (R) & Total (T) Scores: Data Summary
Group Mean SD Std Err Median Min Max 95% Interval
2ML1 252 43.67 1.778 250 105 370 248.5-255.5
2ML2 257 46.72 1.903 255 95 395 252.9-260.4
3ML1 299 45.95 3.342 300 145 410 292.5-305.6
3ML2 308 51.30 3.731 305 185 440 301.2-315.8
2MR1 227 54.18 2.207 230 100 390 222.4-231.1
2MR2 229 52.43 2.135 230 105 405 224.3-232.7
3MR1 275 48.91 3.558 275 130 430 267.6-281.6
3MR2 270 53.70 3.906 275 140 405 262.7-278.0
2MT1 479 84.34 3.435 480 215 740 472.0-485.5
2MT2 485 87.12 3.548 480 225 800 478.2-492.1
3MT1 574 78.34 5.698 580 345 810 562.5-584.8
3MT2 579 89.55 6.514 580 370 840 566.1-591.6
For 2M, N=603. For 3M, N=189.
Should Japanese University Students’ TOEIC Scores Be Expected to Increase?
3人文論集 第 53 巻
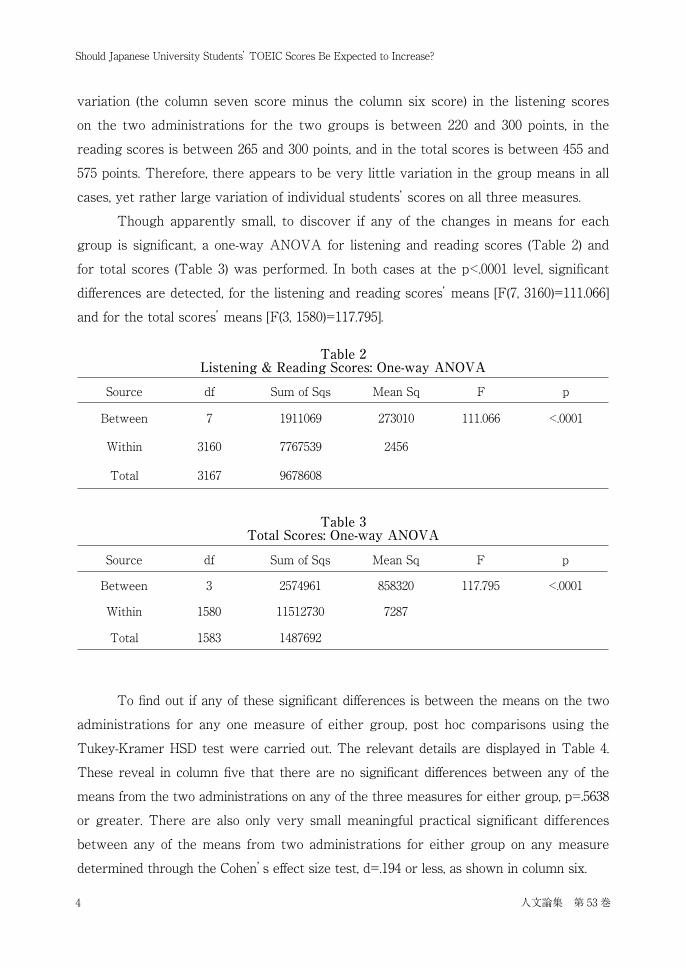
variation (the column seven score minus the column six score) in the listening scores
on the two administrations for the two groups is between 220 and 300 points, in the
reading scores is between 265 and 300 points, and in the total scores is between 455 and
575 points. Therefore, there appears to be very little variation in the group means in all
cases, yet rather large variation of individual students’ scores on all three measures.
Though apparently small, to discover if any of the changes in means for each
group is signifi cant, a one-way ANOVA for listening and reading scores (Table 2) and
for total scores (Table 3) was performed. In both cases at the p<.0001 level, signifi cant
diff erences are detected, for the listening and reading scores’ means [F(7, 3160)=111.066]
and for the total scores’ means [F(3, 1580)=117.795].
Table 2Listening & Reading Scores: One-way ANOVA
Source df Sum of Sqs Mean Sq F p
Between 7 1911069 273010 111.066 <.0001
Within 3160 7767539 2456
Total 3167 9678608
Table 3Total Scores: One-way ANOVA
Source df Sum of Sqs Mean Sq F p
Between 3 2574961 858320 117.795 <.0001
Within 1580 11512730 7287
Total 1583 1487692
To fi nd out if any of these signifi cant diff erences is between the means on the two
administrations for any one measure of either group, post hoc comparisons using the
Tukey-Kramer HSD test were carried out. The relevant details are displayed in Table 4.
These reveal in column fi ve that there are no signifi cant diff erences between any of the
means from the two administrations on any of the three measures for either group, p=.5638
or greater. There are also only very small meaningful practical significant differences
between any of the means from two administrations for either group on any measure
determined through the Cohen’s eff ect size test, d=.194 or less, as shown in column six.
4
Should Japanese University Students’ TOEIC Scores Be Expected to Increase?
人文論集 第 53 巻

Therefore, the answer to our fi rst question (Are any of the means of the students’
scores on the two administrations for any of the three measures for either group
diff erent, and if so, are the diff erences signifi cant?) is yes, all of the means are diff erent,
but none of the diff erences are signifi cant.
Table 4Change in L & R & T Scores Within Groups: Tukey-Kramer HSD & Cohen’s Eff ect Size
Compared Mean Dif Std Err Dif 95% Interval p d
2ML2-2ML1 4.64 2.855 -4.025-13.295 .7362 .103
3ML2-3ML1 9.44 5.100 -6.024-24.913 .5844 .194
2MR2-2MR1 1.75 2.855 -6.910-10.410 .9987 .033
3MR2-3MR1 -4.23 5.100 -19.701-11.236 .9914 .082
2MT2-2MT1 6.38 4.916 -6.258-19.028 .5638 .074
3MT2-3MT1 5.21 8.781 -17.371-27.794 .9341 .062
For 2M, N=603. For 3M, N=189.
Our second question is: How many students’ scores for any of the three measures
increased on the second administration, and how many of these increases demonstrated
a real improvement in TOEIC score and presumably English ability? Table 5 presents
the number of students whose scores changed and the range of these changes. Looking
at the fourth column, we see in all cases except one, the 3M group’s reading scores, that
over half of the students achieved a higher score on the second administration than the
Table 5Number of Changes in L & R & T Scores: Data Summary
Group Decrease No Change Increase Min Max
2ML 260 26 317 -120 145
3ML 76 10 103 -135 125
2MR 266 18 319 -140 125
3MR 94 8 87 -115 105
2MT 261 21 321 -205 215
3MT 86 5 98 -200 185
For 2M, N=603. For 3M, N=189.
Should Japanese University Students’ TOEIC Scores Be Expected to Increase?
5人文論集 第 53 巻
fi rst. So, more students than not achieved at least one higher score on the second test
administration than the fi rst, but not a very large majority of them.
To determine if two TOEIC scores are truly different, ETS explains that the
standard error of difference must be employed. Although it would be preferable to
calculate these for each test administration, it is impossible to do this without the raw
scores, which cannot be obtained. However, ETS says the standard errors of diff erence
for the listening and the reading sections of the TOEIC are approximately +/-35 points
each. This allows for decisions concerning improvement with 67% confi dence. For 95%
confi dence, this amount must be nearly doubled. (The Chauncey, 1998, pp. IV.4-IV.7) ETS
does not publish a standard error of diff erence for the total score. As the listening and
reading scores are simply added to create the total score, the same method will be used
here to create a standard error of diff erence for the total score, though this is likely not
as accurate as would be desirable.
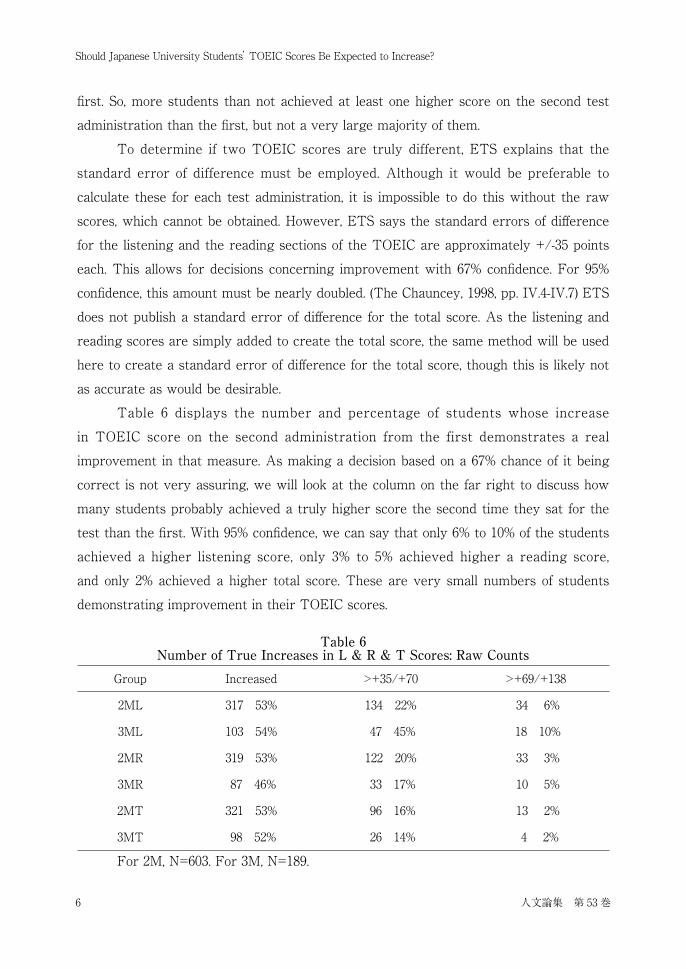
Table 6 displays the number and percentage of students whose increase
in TOEIC score on the second administration from the first demonstrates a real
improvement in that measure. As making a decision based on a 67% chance of it being
correct is not very assuring, we will look at the column on the far right to discuss how
many students probably achieved a truly higher score the second time they sat for the
test than the fi rst. With 95% confi dence, we can say that only 6% to 10% of the students
achieved a higher listening score, only 3% to 5% achieved higher a reading score,
and only 2% achieved a higher total score. These are very small numbers of students
demonstrating improvement in their TOEIC scores.
Table 6Number of True Increases in L & R & T Scores: Raw Counts
Group Increased >+35/+70 >+69/+138
2ML 317 53% 134 22% 34 6%
3ML 103 54% 47 45% 18 10%
2MR 319 53% 122 20% 33 3%
3MR 87 46% 33 17% 10 5%
2MT 321 53% 96 16% 13 2%
3MT 98 52% 26 14% 4 2%
For 2M, N=603. For 3M, N=189.
6
Should Japanese University Students’ TOEIC Scores Be Expected to Increase?
人文論集 第 53 巻
DiscussionThe students in this study had been studying in at least two or three English
classes per week for about 15 weeks between the two test administrations. There were
no significant differences in the means of any of the three TOEIC score measures,
listening, reading, or total, on the fi rst and second test administrations for both groups.
Of the students’ scores that were higher on the second test than the fi rst, which totaled
a little over 50% in most cases, only a very small number of them demonstrated real
improvement as per the method described by ETS to make such a judgment. The
vast majority did not indicate real improvement. Those who taught these students
might wonder what they did wrong for so many of them, and perhaps worry what the
administrators might think. Administrators might suppose these teachers were not very
good at their jobs and ought to be let go, considering that nearly half of the students did
not achieve higher TOEIC scores. After all, one could expect many of the students to
achieve higher scores the second time they sat for the test simply due to the practice
eff ect of taking the test again. And after attending all of those English classes, many of
these students must not have felt very good about their second test scores nor very
enthusiastic about studying English any more. How should teachers, administrators, and
students feel about these results, and what can account for them?
The fi rst thing to consider is whether or not the students had studied English
long enough for expectations of signifi cant increases in scores to be justifi able. Perhaps
there is only one research article that attempts to discover and then predict how many
hours of English language classroom study are needed to expect that the majority of
the students would demonstrate an increase in English language ability through a real
increase in TOEIC scores. This is by Saegusa (1985) using paired test scores of 1,173
businessmen, all college graduates in their 20s and 30s, who had studied English in their
in-company classes taught by native English speakers for between 50 and 249 hours.
(p. 167, 173) For the most part, class size was approximately 10 students, classes met
for two hours one, two, or three times a week, and attendance was about 80%. (p. 167)
Using standard errors of measurement and linear regression analysis (pp. 171-174) he
concluded, “less than 80 hours of (English language) instruction is not very effective.
In such classes, a majority will make little or no progress. If eff ectiveness is given top
priority, at least more than 100 hours of instruction, and ideally 200 hours of instruction,
as a unit should be recommended.” (p. 171)
Should Japanese University Students’ TOEIC Scores Be Expected to Increase?
7人文論集 第 53 巻
However, Bresnihan (2010, pp. 213-214) pointed out that Saegusa should have used
standard errors of difference, which are 29% greater, rather than standard errors of
measurement. This means that Saegusa’s predictions of the amounts of English language
classroom study time needed for the majority of students to increase their TOEIC
scores by certain amounts are quite a bit too low.2
The students in the present study had been enrolled in at least two or three
English language courses that would allow them to study in classes for at least 45 or
67.5 hours between the two test administrations. About 25% to 40% of those hours were
before the summer break of more than two months’ duration, and the rest were after
it. Also, as mentioned earlier, the diff erent courses were not integrated. These aspects
of the classes exclude them from being considered a unit, as Saegusa recommends
above. The number of students per class was between 25 and 35, not 10. The required
attendance was 67%. Less than half of the teachers were native English speakers. These
circumstances are quite far from what Saegusa says is probably necessary for a majority
of students to make demonstrable improvement in their English abilities, despite having
understated the required amount of classroom study time. Therefore, it is not surprising
that few students made the kind of progress that could be measured with their TOEIC
scores.
Also, if one considers the standard errors of diff erence, it is clear that students’
achieved TOEIC scores will go up and down to a certain extent regardless of
improvement or lack of improvement in their English abilities. Childs (1995), in his study
of 113 businessmen’s TOEIC scores, states very strongly that “jumping around is in the
nature of TOEIC scores” (p. 73) and that “if [students] take the test several times, they
can expect that by chance alone they will achieve a score that is higher than their true
score.” (p. 74) Of course, they can also expect to sometimes achieve a score lower than
their true score.
ConclusionAs has been made clear, it is no one’s fault that a large number of these students
did not achieve a higher TOEIC score the second time they took the test. Increases 2 The standard error of measurement (about +/-25 points for both the listening scores and the reading
scores) is used to estimate the error band surrounding an achieved score within which the true score should fall. The standard error of measurement (about +/-35 for both the listening scores and the reading scores) is used to determine if two achieved scores are truly similar or diff erent. (The Chauncey, 1998, pp. IV.4-IV.7)
8
Should Japanese University Students’ TOEIC Scores Be Expected to Increase?
人文論集 第 53 巻
in TOEIC scores could not reasonably be expected from students studying English
in circumstances similar to those of these students, which are the norm at Japanese
universities. The students did not study nearly enough to expect a good majority of
them to achieve meaningfully higher scores the second time they sat for the test.
Other aspects of their English classroom study situation were also not favorable for
them to improve their English abilities enough to be detected by the TOEIC. In such
circumstances, most students’ scores will rise and fall randomly, and the amounts will
not demonstrate changes in English abilities as measured by the TOEIC. They will
simply fall within the expected range indicated by the standard errors of diff erence.
Considering these things, it is obvious that college and university courses should
not be using TOEIC scores as part of the evaluation of their students. Administrators
and teachers who use the TOEIC should understand these aspects of TOEIC scores,
and students should be informed about them, as well. Students should not have to face
decreases in their TOEIC scores, which about half of them will, after studying English
in a few classes for a whole semester, or even a whole year, without understanding
why this might happen. It must be depressing and demotivating for them, and it is
certainly unfair. It is also dishonest to penalize or reward students for changes in their
achieved TOEIC scores, unless the learning situation is rigorous enough to support
realistic expectations of true increases in TOEIC scores, even if it is done out of a lack
of knowledge about how TOEIC scores function.
ReferencesBecker, L. (2000, March 20). Eff ect size calculators. Retrieved from http://www.uccs.edu/̃lbecker/Bresnihan, B. (2010). Possible reliability problems affecting use of TOEIC IP Test scores. Kobe:
Institute for Policy Analysis and Social Innovation, University of Hyogo.Childs, M. (1995). Good and bad uses of TOEIC by Japanese companies. In J. D. Brown & S. O.
Yamashita (Eds.), Language testing in Japan (pp. 12-19). Tokyo: JALT.IIBC (The Institute for International Business Communication). (n.d.). TOEIC program data &
analysis 2014. Tokyo: Author. Retrieved from http://www.toeic.or.jp/library/toeic_data/toeic_en/pdf/data/TOEIC_Program_DAA.pdf
Saegusa, Y. (1985). Prediction of English profi ciency progress. Musashino English and American Literature, Vol. 18. 165-185.
Statistics Bureau, Ministry of Internal Aff airs (総 務 省 統 計 局). (2015a). Number of Graduate Schools and Graduate Students (大学院を設置する学校数、大学院の在籍者数). Tokyo: Author. Accessed from http://www.e-stat.go.jp/SG1/estat/List.do?bid=000001015843
Statistics Bureau, Ministry of Internal Aff airs (総 務 省 統 計 局). (2015b). Number of Technical
Should Japanese University Students’ TOEIC Scores Be Expected to Increase?
9人文論集 第 53 巻
Colleges, Students, and Faculty Members (高等専門学校の学校数、在籍者数、教職員数). Tokyo: Author. Accessed from http://www.e-stat.go.jp/SG1/estat/List.do?bid=000001015843
Statistics Bureau, Ministry of Internal Aff airs (総 務 省 統 計 局). (2015c). Number of Two-year Colleges, Students, and Faculty Members (短期大学の学校数、在籍者数、教職員数). Tokyo: Author. Accessed from http://www.e-stat.go.jp/SG1/estat/List.do?bid=000001015843
Statistics Bureau, Ministry of Internal Aff airs (総務省 統計局). (2015d). Number of Universities, Students, and Faculty Members (大 学 の 学 校 数、 在 籍 者 数、 教 職 員 数). Tokyo: Author. Accessed from http://www.e-stat.go.jp/SG1/estat/List.do?bid=000001015843
Takahashi, J. (2011). An overview of the issues on incorporating the TOEIC test into the university English curricula in Japan. Tama University Global Studies Departmental Bulletin, Vol. 4, 127-138. Accessed from https://tama.repo.nii.ac.jp/?action=pages_view_main&active_action=repository_view_main_item_detail&item_id=234&item_no=1&page_id=13&block_id=52
The Chauncey Group International & ETS (Educational Testing Service). (1998). TOEIC Technical Manual. Princeton: Author.
Trew, G. (2007). A teacher’s guide to TOEIC Listening and Reading Test: Preparing your students for success. Oxford University Press. Retrieved from https://elt.oup.com/elt/students/exams/pdf/elt/toeic_teachers_guide_international.pdf
10
Should Japanese University Students’ TOEIC Scores Be Expected to Increase?
人文論集 第 53 巻
Related Documents