Should Diesel Cars in Europe be discouraged ? by Inge MAYERES Stef PROOST Public Economics Center for Economic Studies Discussions Paper Series (DPS) 00.18 http://www.econ.kuleuven.be/ces/discussionpapers/default.htm August 2000

Welcome message from author
This document is posted to help you gain knowledge. Please leave a comment to let me know what you think about it! Share it to your friends and learn new things together.
Transcript

Should Diesel Cars in Europe be discouraged ? by Inge MAYERES Stef PROOST Public Economics Center for Economic Studies Discussions Paper Series (DPS) 00.18 http://www.econ.kuleuven.be/ces/discussionpapers/default.htm
August 2000

1
Should diesel cars in Europe be discouraged?
11 August 2000
Inge Mayeres, Stef Proost∗Centre for Economic Studies, K.U.Leuven
AbstractThis paper examines the rationale for the different tax treatment of gasoline and diesel carscurrently observed in Europe. First, we analyse possible justifications for a different taxtreatment: pure tax revenue considerations, externality considerations and constraints on thetax instruments used for cars and trucks. Next, an applied general equilibrium model is usedto assess the welfare effects of revenue neutral changes in the vehicle and fuel taxes on dieseland gasoline cars. The model integrates the effects on tax revenue, environmentalexternalities, road congestion, accidents and income distribution.
∗ Address for correspondence: Naamsestraat 69, 3000 Leuven, Belgium; e-mail:[email protected]. The research reported in this paper was financed by theFund for Scientific Research – Flanders and the Sustainable Mobility Program initiated by theBelgian State - OSTC (project MD/DD/008). We thank Alain Henry for the provision ofAUTO-OIL data and Leo De Nocker and Luc Int Panis for the provision of the ExternEresults for Belgium. Valuable comments by Ken Small, an anonymous reviewer and byparticipants at seminars in Leuven, Kopenhagen and Crete (EAERE) are gratefullyacknowledged. Any errors are the sole responsibility of the authors.

2
1 Introduction
In Europe, the share of diesel cars has been growing strongly. In the UK, diesel cars
accounted for 3% of the car stock in 1990. They will represent almost 15% of the car stock in
2000. The market share of diesel cars varies strongly over the different countries. In 1995 it
was smaller than 10% in Finland and in Greece, while in Belgium and France, it amounted to
39% and 28%, respectively (Auto-oil programme, 1999).
The relative taxation of diesel and gasoline cars is one of the most important policy
variables in passenger transport. This paper analyses positive and normative aspects of the tax
treatment of diesel and gasoline. We start with a comparison between different EU countries
of the market share of diesel cars. This is put in relation to the differences in the tax treatment.
We show that the relative share of diesel cars can be explained principally by tax variables.
The next section examines the theoretical prescriptions for the relative taxation of diesel and
gasoline cars. Three aspects are analysed: pure tax efficiency, environmental damage and the
link with the use of diesel by trucks. The final section of the paper uses an applied general
equilibrium model to assess the welfare effects of revenue-neutral changes in the vehicle and
fuel taxes on diesel and gasoline cars. This model integrates the different government
objectives: raising tax revenue, environmental goals, transport policy goals and income
distribution concerns.
The main result of the paper is that it is difficult to justify the present favourable
treatment of diesel cars in the European Union. It is shown that a revenue-neutral shift, which
consists of discouraging diesel cars and of favouring gasoline cars via a change in ownership
taxes, can generate important welfare gains. This is explained by two reasons. First, even
when the different external costs of the two car types are not considered, welfare can be
improved by shifting taxation from gasoline to diesel cars. The tax on gasoline car use is very

3
high in comparison to that on diesel car use. Reducing it makes it possible to achieve large
welfare gains which are only partly undone by the distortions created by the higher diesel tax.
Secondly, the environmental costs of diesel cars are much higher than those of gasoline cars.
Diesel cars have high emissions of particulate matter, which have a high social cost.
The emphasis in this paper is on the relative taxation of two car types. The policy
changes examined are limited to revenue-neutral changes using the existing tax instruments.
Other promising tax reforms focussing on the substitution of fuel taxes by road pricing are not
considered in this study1.
2 The growing share of diesel cars and their fiscal treatment
Table 1 shows that the share of diesel cars in the car stock differs strongly over EU
countries. In Belgium and France, diesel cars are expected to have a share close to 40% in
2000. Taking into account the larger mileage of diesel cars, more passenger car miles will be
driven by diesel car than by gasoline car. In some countries (UK, Ireland, France and
Belgium) the diesel share is growing strongly, while in others, it is stable or falling.
[ Table 1: The share of diesel cars in the car stock ]
The overall growth in the diesel share can be due to technological changes. The arrival of
smaller and more performant diesel engines (turbo and direct injection) in the nineties means
that the performance of diesel cars and gasoline cars is almost the same. Given the fact that
1 See Proost and Van Dender (2000) and Mayeres (2000) for a comparison of the likelyeffects of different transport and environment policies on welfare.

4
the producer prices of diesel cars have not dropped more than those of gasoline cars, , this
could explain the growing share with unchanged tax parameters. However, as more or less the
same car models are offered on the different European car markets, the differences in the
diesel share have to be explained by differences in preferences and/or differences in tax
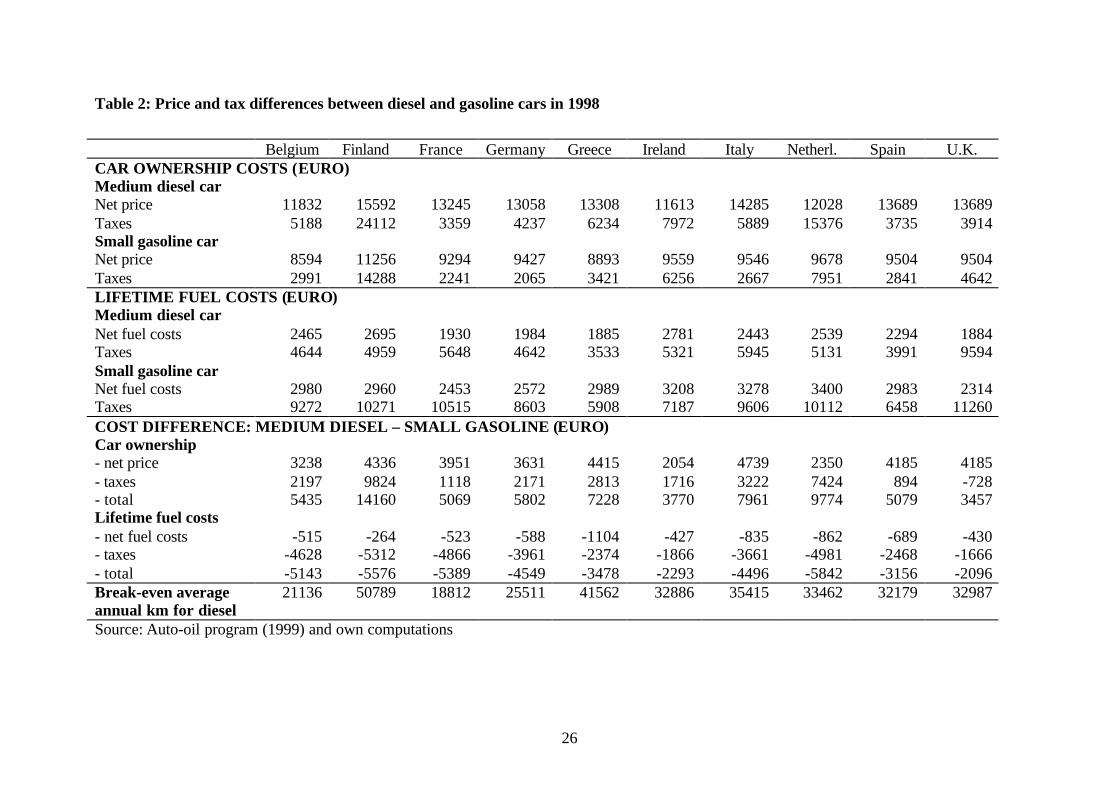
treatment. Table 22 gives an idea of the car ownership costs and the fuel costs in 1998 of the
two types of vehicles, with and without taxes. Low diesel shares can be found in those
countries where there is either a relatively higher tax on the ownership of diesel cars (Finland,
Netherlands, Greece) or where relatively high fuel taxes on diesel are present (UK and
Ireland).
[ Table 2: Price and tax differences between diesel and gasoline cars in 1998 ]
Table 1 shows changes in the share of diesel cars in the car stock. It is more instructive to
analyse the changes in car sales. An econometric analysis of the share of diesel cars in total
car sales in nine European countries over the period 1990-96, using a fixed effects logit
model, shows that the lifetime cost of car use is the most significant determinant of the
gasoline/diesel choice (Janssen, 1999). The fixed effects represent the differences in
preferences between different European countries.
A more thorough analysis of Table 2 shows that the car manufacturers absorb part of the
tax advantages of diesel cars by adjusting their sales prices accordingly. Verboven (1996)
examined the price setting behaviour on the monopolistic European car market and found that
2 Table 2 makes a comparison between medium diesel cars (1400-2000cc) and small gasolinecars (<1400cc) because these two car types have corresponding engine power. Thesecategories also form an important segment of the car market. The lifetime fuel costs arecalculated using the following assumptions: an average lifetime of 10 years, an average fueluse of 6.9 l/100 km for diesel cars and 8.3 l/100 km for gasoline cars, an average annualkilometrage of 20000 km/year and a real interest rate of 4%.

5
the manufacturers adjusted the pre-tax prices in function of the overall taxation level and of
the gasoline-diesel tax differential. This implies that the relation between relative tax levels
and relative user prices is not one to one. The price discrimination on the different national
markets was possible because car manufacturers made parallel imports from other countries
very difficult. In the future, the possibilities for price discrimination will decrease because of
a reinforced European competition policy.

6
3 What is the appropriate tax treatment of diesel and gasolinecars?
This question has many aspects and is probably too difficult to grasp in one simple
theoretical model. We therefore proceed in three steps. We first give the main intuition using
a simple model for the optimal taxation of private passenger car transport in the presence of
fiscal revenue requirements and different types of external costs. In the second step, we
discuss the appropriate tax treatment of professional car use. In the final step, we discuss
different complications that may arise in an open economy when there are restrictions on the
available tax instruments.
3.1 Optimal taxation of diesel and gasoline car use for consumptionpurposes
We use a simple model for a closed economy with N identical consumers. There are
three commodities: car kilometres driven by gasoline car (xG), car kilometres driven by diesel
car (xD) and a composite commodity, including all other commodities. The composite
commodity is assumed to be untaxed. It serves as numéraire. Its marginal and average
production cost equals unity and is assumed to be constant. The marginal and average
production costs of gasoline and diesel kilometres are assumed to be fixed. They are denoted
by pG and pD. It is assumed that all commodities are produced by perfectly competitive
industries.
There are two types of externalities in the economy: those linked to total car km
(congestion, accidents) and those linked to the type of fuel used (air pollution). The first
category is represented by the total external cost function EC(X) which is an increasing
function of total car km X=N(xG+xD). The second category is given by EFi(Nx i)
(i=G,D;∂EFi/∂xi>0).

7
We assume furthermore that the government is interested in raising a given total R of
fiscal revenue from the use of cars3. The optimal taxation problem of the government is then
to choose the taxes on xG and xD (tG and tD) such that the social welfare function (W) is
maximised subject to the government budget constraint:
,,
(1, , , ) ( ) ( )
. .
( )
G Dt t G D i ii G D
G G D D
Max W N V q q Y EC X EF N x
s t
Nt x N t x R µ
=
= − −
+ ≤
∑(1)
qi is the consumer price of commodity i (qi=pi+ti). V(1, qG, qD, Y) is the consumer’s indirect
utility function, and Y denotes his income. µ is the Lagrange multiplier associated with the
government budget constraint. In an interior solution, the optimal tax rates have to satisfy the
following type of conditions 4 as well as the revenue requirement:
( ) ( )
11 , , ;
jii j
j jii ji
i j i i
MEC MEFMEC MEFt t
q xEL EL
q q q x
i j G D i j
µ λ µ λ
µ λ
+++ +
+
= − = ≠
(2)
MEC and MEFi are defined as follows:
(1/ ) ( / )MEC EC Xλ= − ∂ ∂ (3)
(1/ )( / ) ,i i iMEF EF x i G Dλ= − ∂ ∂ = (4)
MEC stands for the marginal external cost of car km that is not related to fuel use. MEFi is the
marginal external cost related to the use of fuel i. λ represents the marginal private utility of
income, so that µ/λ stands for the marginal cost of public funds, that is, the welfare cost of
raising one more unit of tax revenue via taxes on the use of cars. ELij (i,j=G,D) stands for the
3 It is assumed that R does not enter the utility function, or equivalently, that it entersseparably. Mayeres and Proost (1997) study – in a more general framework - the implicationswhen a public good enters the utility function in a non-separable way.4 For the derivation of these conditions, see Appendix I.
8
uncompensated own-price and cross-price elasticities.We will now discuss the implications of
(2) in more detail.
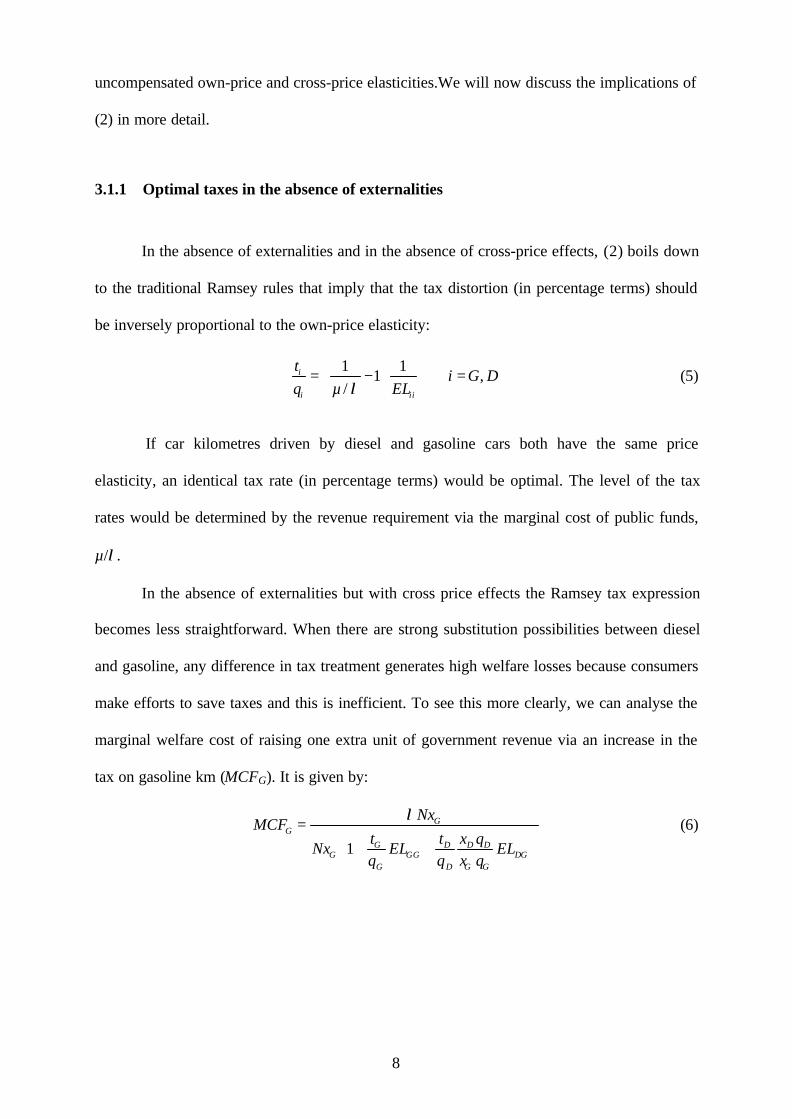
3.1.1 Optimal taxes in the absence of externalities
In the absence of externalities and in the absence of cross-price effects, (2) boils down
to the traditional Ramsey rules that imply that the tax distortion (in percentage terms) should
be inversely proportional to the own-price elasticity:
1 11 ,
/i
i ii
ti G D
q µ ELλ
= − =
(5)
If car kilometres driven by diesel and gasoline cars both have the same price
elasticity, an identical tax rate (in percentage terms) would be optimal. The level of the tax
rates would be determined by the revenue requirement via the marginal cost of public funds,
µ/λ.
In the absence of externalities but with cross price effects the Ramsey tax expression
becomes less straightforward. When there are strong substitution possibilities between diesel
and gasoline, any difference in tax treatment generates high welfare losses because consumers
make efforts to save taxes and this is inefficient. To see this more clearly, we can analyse the
marginal welfare cost of raising one extra unit of government revenue via an increase in the
tax on gasoline km (MCFG). It is given by:
1
GG
G D D DG GG DG
G D G G
NxMCF
t t x qNx EL EL
q q x q
λ=
+ +
(6)
9
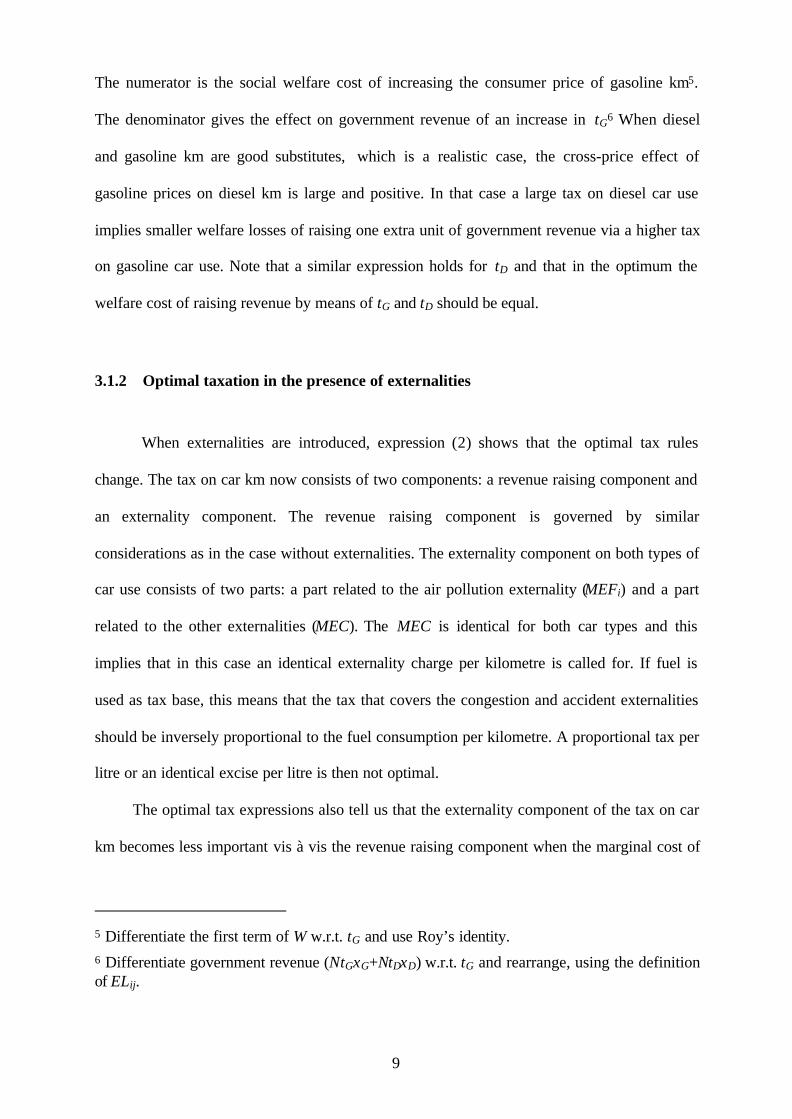
The numerator is the social welfare cost of increasing the consumer price of gasoline km5.
The denominator gives the effect on government revenue of an increase in tG6 When diesel
and gasoline km are good substitutes, which is a realistic case, the cross-price effect of
gasoline prices on diesel km is large and positive. In that case a large tax on diesel car use
implies smaller welfare losses of raising one extra unit of government revenue via a higher tax
on gasoline car use. Note that a similar expression holds for tD and that in the optimum the
welfare cost of raising revenue by means of tG and tD should be equal.
3.1.2 Optimal taxation in the presence of externalities
When externalities are introduced, expression (2) shows that the optimal tax rules
change. The tax on car km now consists of two components: a revenue raising component and
an externality component. The revenue raising component is governed by similar
considerations as in the case without externalities. The externality component on both types of
car use consists of two parts: a part related to the air pollution externality (MEFi) and a part
related to the other externalities (MEC). The MEC is identical for both car types and this
implies that in this case an identical externality charge per kilometre is called for. If fuel is
used as tax base, this means that the tax that covers the congestion and accident externalities
should be inversely proportional to the fuel consumption per kilometre. A proportional tax per
litre or an identical excise per litre is then not optimal.
The optimal tax expressions also tell us that the externality component of the tax on car
km becomes less important vis à vis the revenue raising component when the marginal cost of
5 Differentiate the first term of W w.r.t. tG and use Roy’s identity.6 Differentiate government revenue (NtGxG+NtDxD) w.r.t. tG and rearrange, using the definitionof ELij.

10
public funds (µ/λ) increases. This is the case when the revenue needs to finance public goods
or transfers to the poor become more important.
The model used here is a simple model with only three commodities and a fixed amount
of government revenue R that needs to be raised from private car transport. This simple model
is sufficient to discuss the relative taxation of the two types of cars when we adopt the
following two assumptions. The first assumption is that gasoline and diesel car km stand in
the same complementary relationship with other consumption goods and in particular with
labour supply. If this assumption is not satisfied, reducing the tax rate on the good that is
more complementary with labour reduces the efficiency losses of the labour tax. The second
assumption is that both types of cars are used in the same proportion by the different income
classes7.
3.2 Optimal taxation of the commercial use of gasoline and diesel cars
An important share of total car km is for commercial purposes. In the absence of
externalities, and if taxes on labour and consumption can be set optimally, Diamond and
Mirrlees (1971) show that taxes on intermediate goods should equal zero, so that productive
efficiency is preserved. Therefore, commercial car use should not be taxed at all in the
absence of externalities.
When externalities are present and have the same dual structure as in the previous
section, the optimal externality tax equals the marginal external cost and the marginal cost of
public funds plays no role (Mayeres and Proost, 1997).
7 One can consult Atkinson and Stiglitz (1980), lecture 12 for a more detailed treatment of thisproblem.

11
3.3 Restrictions on the use of tax instruments
The tax treatment of gasoline and diesel cars may be restricted by several constraints.
Three main types of constraints should be taken into account. First, there is the impossibility
to tax car use directly, such that only inputs for car use can be taxed. Secondly, there is the
difficulty to distinguish between the private and the commercial use of cars. Moreover, it can
be difficult to know whether diesel fuel is used for commercial car use or for use in trucks.
Finally, due to the proximity of borders in Europe, cars and trucks can fuel abroad, which
limits the possibilities to use the fuel tax instrument.
At present electronic road pricing does not yet exist so that the taxation of road use
means a combination of taxes on ownership (including registration taxes, circulation taxes,
taxes on insurance etc.) and taxes on fuel use. Fuel use is probably a better tax basis for
externality taxes than the ownership of a car. Nevertheless, fuel taxes have a number of
shortcomings. Too high fuel taxes will lead to too much fuel saving efforts by car users.
Moreover, fuel taxes cannot be differentiated according to time of day, location or the
emission technology of the vehicle. Some of these shortcomings can be remedied partly by
the use of ownership taxes. An ownership tax offers extra discrimination possibilities since it
can be differentiated as a function of the location of the owner (more or less congested area)
or as a function of the air pollution characteristics of the car (the presence or absence of a
catalytic converter, etc.).
The second type of restrictions has to do with the fact that it is costly for the tax
authorities to observe the type of use that is made of a car and of the fuel. The largest problem
exists for the tax on diesel fuel, since it is used both by cars and trucks. In addition, it is
difficult to distinguish between private and professional car use and fuel consumption. Table
3 summarises three administrative tax differentiation possibilities for diesel fuel and diesel
cars.
12
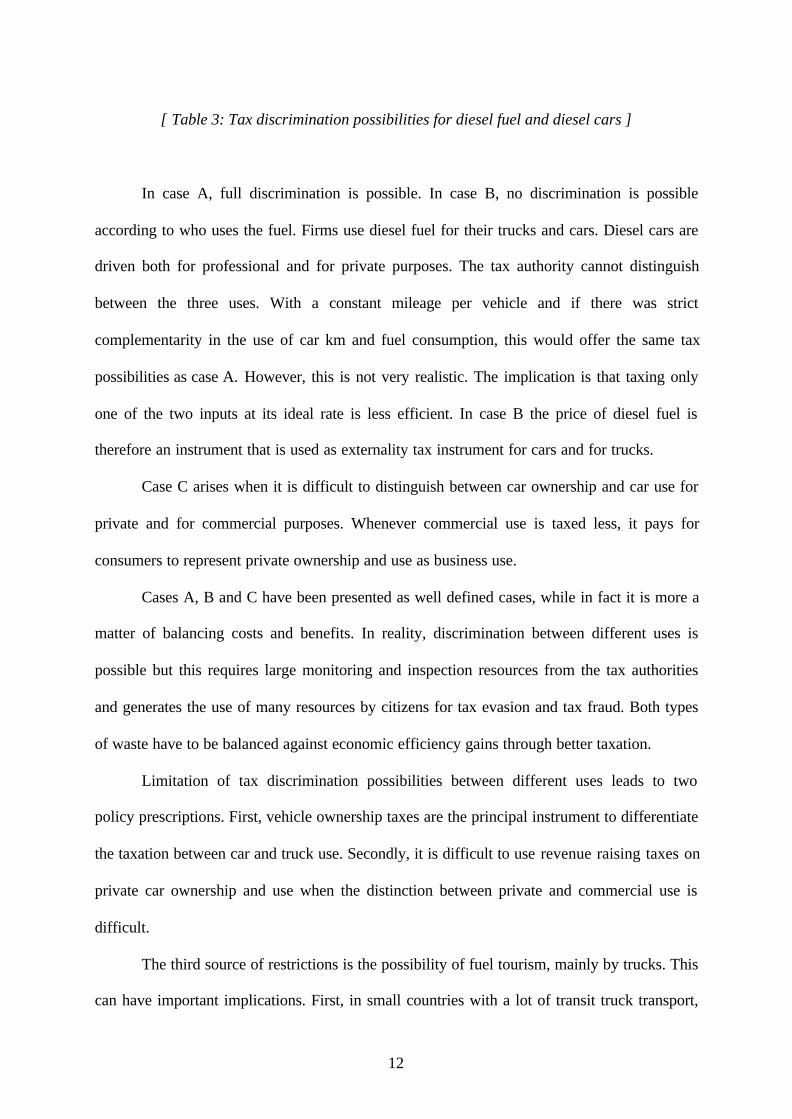
[ Table 3: Tax discrimination possibilities for diesel fuel and diesel cars ]
In case A, full discrimination is possible. In case B, no discrimination is possible
according to who uses the fuel. Firms use diesel fuel for their trucks and cars. Diesel cars are
driven both for professional and for private purposes. The tax authority cannot distinguish
between the three uses. With a constant mileage per vehicle and if there was strict
complementarity in the use of car km and fuel consumption, this would offer the same tax
possibilities as case A. However, this is not very realistic. The implication is that taxing only
one of the two inputs at its ideal rate is less efficient. In case B the price of diesel fuel is
therefore an instrument that is used as externality tax instrument for cars and for trucks.
Case C arises when it is difficult to distinguish between car ownership and car use for
private and for commercial purposes. Whenever commercial use is taxed less, it pays for
consumers to represent private ownership and use as business use.
Cases A, B and C have been presented as well defined cases, while in fact it is more a
matter of balancing costs and benefits. In reality, discrimination between different uses is
possible but this requires large monitoring and inspection resources from the tax authorities
and generates the use of many resources by citizens for tax evasion and tax fraud. Both types
of waste have to be balanced against economic efficiency gains through better taxation.
Limitation of tax discrimination possibilities between different uses leads to two
policy prescriptions. First, vehicle ownership taxes are the principal instrument to differentiate
the taxation between car and truck use. Secondly, it is difficult to use revenue raising taxes on
private car ownership and use when the distinction between private and commercial use is
difficult.
The third source of restrictions is the possibility of fuel tourism, mainly by trucks. This
can have important implications. First, in small countries with a lot of transit truck transport,

13
the maximisation of tax revenue becomes an important objective besides the internalisation of
external costs. Consideration of the revenue raising objective will it make attractive for the
government to undercut slightly the taxes of neighbouring countries (see Kanbur and Keen,
1993). Secondly, it means that fuel becomes an even less interesting tax base for cars.
The conclusion of this section therefore is that ownership taxes on diesel cars are an
important instrument in the presence of restrictions on the tax instruments.

14
4 Tax reform analysis
This section investigates numerically the possibilities for welfare improving changes in
the taxation of gasoline and diesel vehicles and fuel. The analysis focuses on revenue-neutral
marginal tax reforms. It proceeds as follows. First, we use an applied general equilibrium
model to calculate the marginal costs of public funds (MCF) of three types of instruments: the
vehicle ownership tax on gasoline and diesel cars, and the excise and the VAT on gasoline
and diesel fuel. In a next step, the MCF of these instruments are compared. From the tax
reform literature (see Mayeres and Proost, 2000), we know that in the optimum the MCF
should be equal for all tax instruments available to the government. If this is not the case, and
if, for example, MCFi>MCFj (i≠j), then welfare can be improved marginally by increasing the
tax on commodity j and cutting simultaneously the tax on commodity i, such that government
revenue is unaffected.
The exercise is performed for Belgium, using an applied general equilibrium model. The
model is described in a detailed way in Mayeres (1999). It is a model for small open
economy, calibrated to the situation in Belgium in 1990. It includes four categories of
economic agents: non-identical consumers (corresponding with the quintiles of the Belgian
household budget survey), fourteen production sectors, the government and the rest of the
world. Several transport commodities are considered in the model. It makes a distinction
between passenger and freight transport, between three transport modes (road, rail and inland
navigation), between vehicle types and, for road transport, between peak and off-peak
transport. The model considers three types of transport externalities: congestion, air pollution,
and accidents. The model assumes that air pollution and accidents affect the consumers’

15
welfare, but not their behaviour. Congestion also has a negative impact on the consumers’
welfare, but in addition it affects the transport choices of the consumers8.
4.1 A description of the simulations
The simulations are of the balanced-budget incidence type: we introduce a small
increase in government expenditure9 and assume that it is accompanied by a change in a tax
instrument such that government budget balance is maintained. The following tax instruments
are considered:
a. The vehicle ownership tax: this instrument consists of increasing the vehicle ownership
tax to be paid annually by the owners of gasoline or diesel passenger cars. Both
households and production sectors are subject to the tax increase.
b. The fuel excise: the excise on gasoline or diesel fuel is raised. The fact that the excise
rather than the VAT is raised, makes that both the consumers and the domestic producers
face a higher tax on the use of these fuels. Foreign road transport users are not subject to
the tax increase, since the model assumes that they buy their fuel abroad. The tax rate on
fuel used by rail transport and inland navigation is kept constant.
c. The VAT rate on fuel: the VAT rate on diesel or gasoline is increased. Only the
households are subject to this tax increase.
8 In reality air pollution and accident risks also affect the consumption choices. Such feedbackeffects are not yet included in the model.9 We assume that the accompanying change in the level of government spending does notaffect the behaviour of the consumers.

16
For each instrument g, the marginal cost of public funds is calculated. It is defined as the
marginal cost in terms of social welfare of raising an additional unit of government revenue
by means of each instruments g. It is given by the negative of the ratio between the monetary
value of the change in social welfare (dWg) and the change in government revenue (dREVg)
brought about by instrument g. The change in government revenue takes into account the
effect on the tax revenue from all taxed commodities.
g
ig
i
g
gg dREV
SGa
dREV
dWMCF
∑=−=−=
5
1
)()()(
εεε (7)
It depends on the degree of inequality aversion ε. A value of ε = 0 means that the social
welfare function gives an equal weight to the welfare of individuals belonging to different
consumer groups. As the value of ε increases, society has a higher degree of inequality
aversion. In expression (7) ai is the number of consumers in quintile i. SGg is the social
equivalent gain (King, 1983) associated with an increase in instrument g. It is defined as the
sum of money which, if equally distributed to all individuals in the initial equilibrium, would
produce a social welfare equal to that obtained after the change in the tax system.
For reasons of comparability it is assumed that each instrument generates an equal real
yield.
The findings of the model are compared with the MCF calculations for a model which
is identical to the first one, except that it assumes the speed of road transport, the emissions
and the accidents to remain constant at the level of the initial equilibrium. It can be interpreted
as a model without externalities. The MCF calculated by this model is referred to by MCF*.
The MCF calculations are made for the existing tax system in the benchmark year
1990. In that year the marginal labour income tax was 45% and the capital income tax rate
was 24%. Together they raised 66% of government revenue. The VAT, vehicle ownership

17
taxes and other indirect taxes raised another 24% of government revenue. In 1990 government
spending amounted to approximately 50% of GDP.
4.2 The marginal external costs of transport and the taxes in the referenceequilibrium
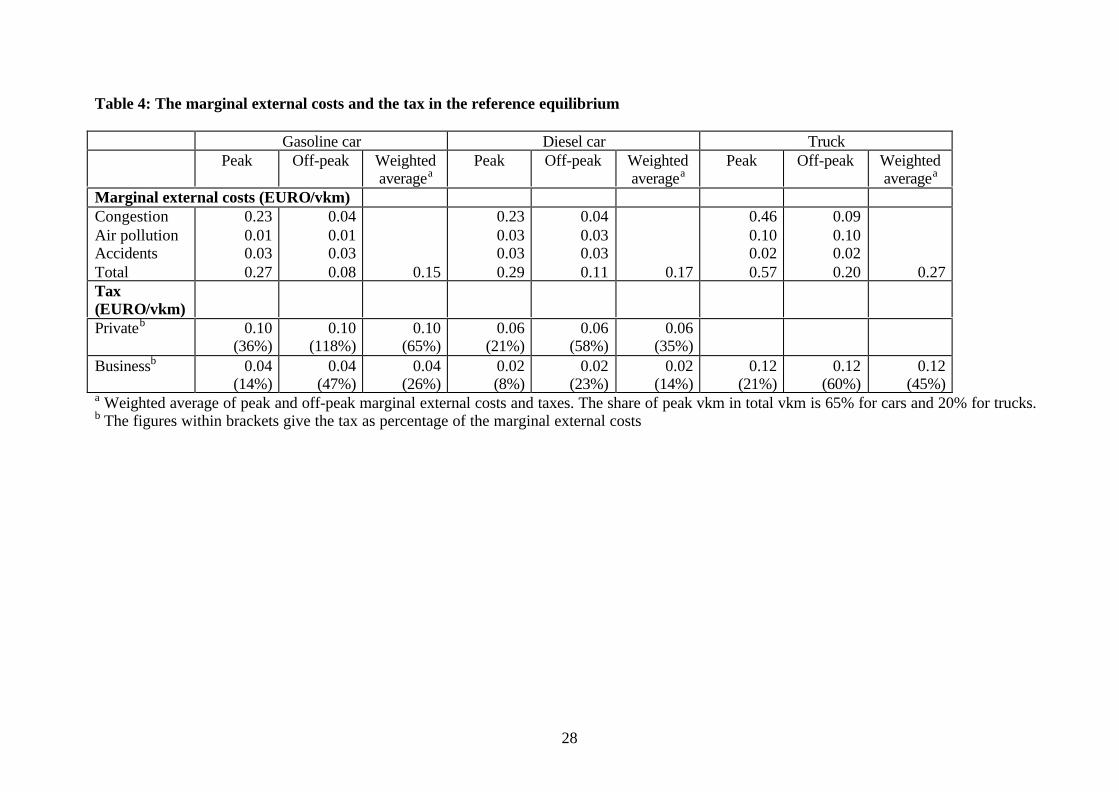
The simulations start from the situation in Belgium in 1990. Table 4 gives an estimate
of the various marginal external costs associated with car and truck transport in Belgium in
the reference equilibrium. They are expressed in EURO per vehicle km (vkm). The figures
presented are averages for Belgium. The simulations will consider only spatially
undifferentiated transport policies. For more details on the derivation of the marginal external
congestion and accident costs, see Mayeres (1999). The air pollution costs take into account
the costs of the emissions of NOx, SOx, NMVOC, CO, CO2 and PM2.5. Table 4 is constructed
using for each vehicle type emission factors for an average vehicle in 1998. The emission
factors are based on European Commission (1999). The monetary valuation of the transport
emissions in Belgium of all pollutants except CO2 is taken from De Nocker et al. (2000) who
apply the ExternE methodology to Belgium.10 The ExternE study uses the impact pathway
methodology, which undertakes the following steps for calculating the costs of emissions:
simulation of atmospheric dispersion, impact assessment with dose-response functions and
monetary valuation of the impacts. The effects on health are the dominant impacts. The
monetary valuation of CO2emissions (14.55 EURO/tonne CO2) is based on Fankhauser
(1995).
10 De Nocker et al. (2000) present values for 2000. They are converted to 1990 by using anelasticity of 0.3 for the marginal willingness-to-pay for a reduction in emissions w.r.t. incomeand combining this with the annual income growth rate between 1990 and 2000. This givesthe following costs per unit of emissions (in prices of 1998): 200.2 EURO/kg PM2.5, 8.4EURO/kg SOx, 1.1 EURO/kg/NOx, 1.5 EURO/tonne CO and 1.5 EURO/kg NMVOC.

18
The table compares the marginal external costs with the tax paid per vkm. The tax
contains taxes on the ownership of vehicles, as well as fuel excises and VAT (for
households)11. Since this paper only presents simulations for transport instruments which
cannot be differentiated according to the period of travel, the table also compares the tax per
vkm with a weighted average of the marginal external costs in the peak and the off-peak
period.
The first conclusion that we can draw from Table 4 is that the marginal external costs
of diesel cars are higher than those of gasoline cars. This is due to the high air pollution
damage attributed to particulate emissions in the ExternE-methodology. Diesel cars emit more
PM2.5 per vkm than gasoline cars. Diesel cars have lower emissions of CO2 and CO but the
damage that is attributed to these pollutants is relatively small.
The second conclusion is that the difference in marginal external costs is not reflected
in the relative tax rates. At least for business uses, diesel car use should be taxed more than
gasoline use, as their taxes should approximate marginal external costs, if the government can
make use of perfect instruments. We see that the reverse holds (for example, in the peak
period the tax amounts to only 8% of the marginal external costs). Also for diesel trucks the
tax is smaller than the marginal external costs. For consumptive uses, there is an even larger
gap between the tax treatment of diesel and gasoline cars: the tax on diesel car use is 0.04
EURO/vkm lower than that on gasoline car use.
A third conclusion is that taxes on car and truck use are in general too low to cover
marginal external costs (except for off-peak gasoline cars). This is also the case when we
11 The AGE model is a static general equilibrium model and models the effects of transportpolicies on both vehicle ownership and vehicle use. This explains why the ownership taxesare included in the tax per vkm.

19
compare the tax with the weighted average of the marginal external costs in the peak and the
off-peak.
[ Table 4: The marginal external costs and the tax in the reference equilibrium ]
4.3 The simulation results
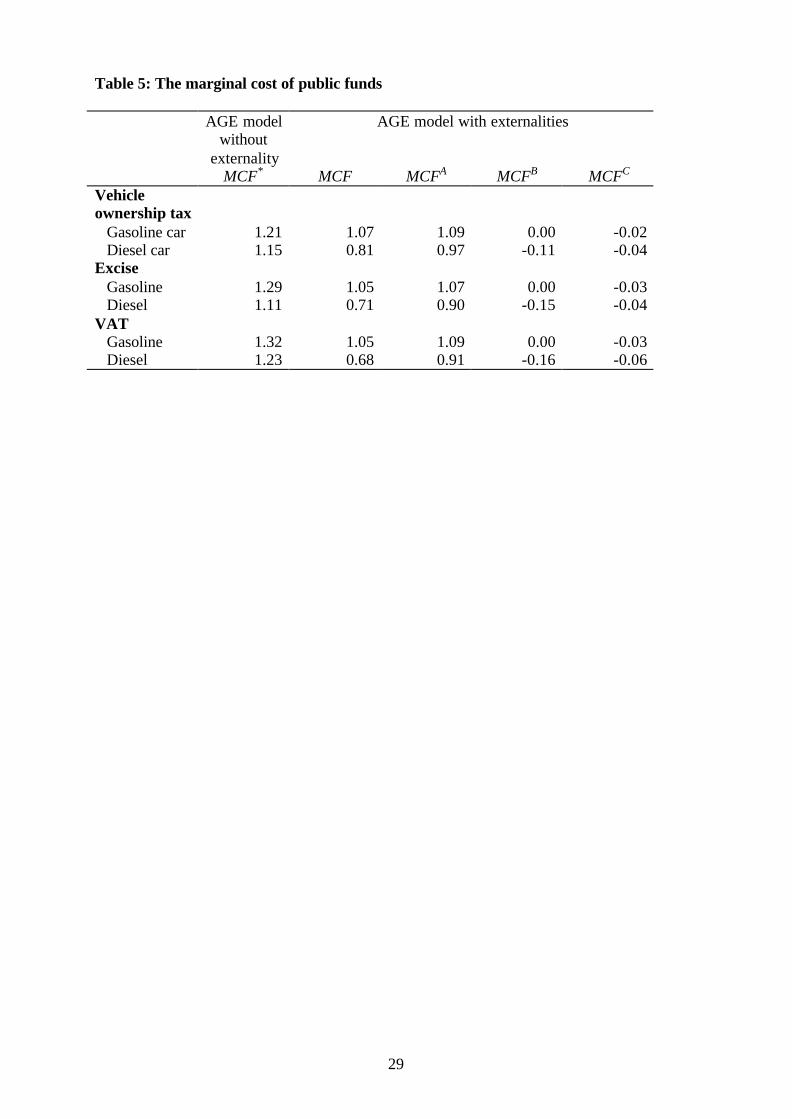
Table 5 summarises the simulation results for the efficiency case (ε = 0). The results for
higher degrees of inequality aversion are not significantly different from those presented in
Table 512. Therefore they are not reproduced here.
It should be noted that the marginal welfare costs of the fuel taxes are likely to be
underestimated. The AGE model does not yet take into account the possibility to switch to
more fuel efficient vehicles or the existence of fuel tourism. Taking into account these two
aspects can be expected to increase the MCF of the excise and VAT on fuels.
[ Table 5: The marginal cost of public funds ]
Table 5 shows that even when one does not consider the transport externalities,
welfare can be improved by increasing diesel taxation and by using the revenue to reduce
gasoline taxation. This is the case for the three tax instruments considered here. Diesel use by
road transport is undertaxed. For example, a higher vehicle ownership tax on diesel cars
accompanied by a lower vehicle ownership tax on gasoline cars, together revenue neutral,
yields a welfare gain of EURO0.06 (=1.21–1.15) per EURO of shift in government revenue
from one source to the other. So, following a pure Ramsey rule, it would be beneficial to
12 The 1995-96 household budget survey for Belgium shows that the distribution of theconsumption of car fuels over the quintiles is very similar for diesel and gasoline.

20
increase the vehicle ownership taxes on diesel cars and to cut these taxes on gasoline cars.
The relatively high MCF* for the taxes on gasoline can be explained by the high tax rate on
gasoline transport in the reference equilibrium. This means that even with a moderate own
price elasticity for gasoline car ownership or car use, the taxes on gasoline should be
increased by more in order to raise a given amount of government revenue, compared with the
case of a lower initial tax rate. This leads to larger distortions. It should also be noted that in
the case of diesel taxation, the MCF* is smaller for the excise on diesel fuel than for the two
other instruments. This is explained by the relatively large tax base of this instrument, which
implies that the excise has to be raised less in order to finance the same increase in
government spending.
Note that – ceteris paribus – the MCF* of a tax on car ownership or use will be higher
if the demand for these commodities becomes more sensitive to its own price. A higher own-
price elasticity implies that large distortions are generated when raising a given amount of
revenue. On the other hand, given the fact that gasoline and diesel are substitutes, a higher
cross-price elasticity entails – ceteris paribus – a lower MCF*. In that case, raising the tax on
gasoline has a larger positive effect on the demand for taxed diesel, such that a given amount
of revenue can be obtained with less distortions.
In the model with externalities the discrepancy between the MCF of gasoline and
diesel becomes larger than in the model without externalities. The second part of Table 5
gives the results in this case. The table also decomposes the marginal cost of public funds into
three terms.
Cg
Bg
Agg MCFMCFMCFMCF ++= (8)
The first term (MCFgA) is defined as the MCF when the emissions of air pollutants and the
number of accidents are assumed to remain at the reference level. However, it takes into
account the effect of the change in the congestion level. The second term (MCFgB) presents

21
the marginal welfare impact associated with the change in emissions. The last term (MCFgC)
is the marginal welfare impact of the change in accidents caused by the tax reform.
When externalities are taken into account, it is even more interesting to increase diesel
taxation and to cut gasoline taxation. For example, consider an increase in the vehicle
ownership tax on diesel cars, accompanied by an equal revenue cut in the same tax on
gasoline cars. The benefit in the presence of externalities is EURO0.26 (=1.07-0.81) per
EURO of government revenue in the presence of externalities. The difference with the model
without externalities is explained mainly by the welfare impact of the change in emissions
caused by the tax reform, which equals EURO0.11 (=0.00+0.11) per EURO of government
revenue. The main reason is that diesel cars have higher emissions of particulate matter,
which has a high social cost. The imposition of stricter emission standards for particulate
matter could in the future reduce the environmental costs of diesel cars. Note, however, that
our results show that even in the absence of externalities the relative taxation on diesel should
increase.
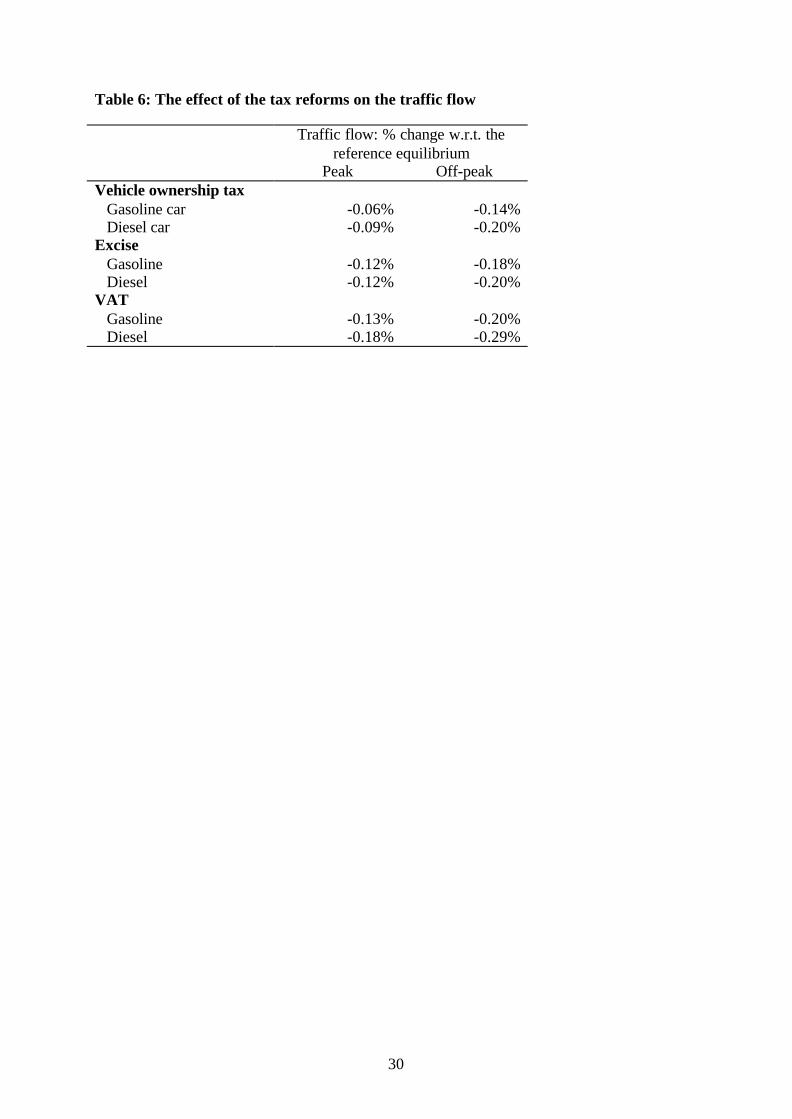
Each instrument (vehicle ownership tax, excise and VAT) has more or less the same
effect on congestion13 and accidents whether it is applied to gasoline or diesel. In the model
both external costs are determined mainly by the traffic flow. Table 6 gives the effect of the
six tax reforms on the traffic flow. For the vehicle ownership tax and the VAT the effect of
the tax on diesel is somewhat larger than for the tax on gasoline. This is because the tax base
13 The AGE model does not yet incorporate the complementary relationship between labourand commuting transport. Considering this relationship would mean that the MCF of thetransport instruments considered here will be somewhat lower than in Table 5. The beneficialeffect of the instruments on congestion imply that the time costs of travelling to work arereduced and that at the margin labour supply will be higher than if this effect is not taken intoaccount. This effect is considered explicitly by Parry and Bento (1999) and Calthrop et al.(2000).

22
is smaller for these instruments and the tax on diesel needs to be raised more than that on
gasoline in order to raise the same amount of real government revenue.
[ Table 6: The effect of the tax reforms on the traffic flow ]
Note that the effect on the three externalities can be expected to be lower as the own-
price elasticity of car ownership and use falls. Moreover, raising the tax on diesel will have
less effect on pollution if the cross-price elasticity of the demand for gasoline with respect to
diesel is higher.
5 Conclusions
In this paper we have studied the tax treatment of diesel cars. Recent evidence on
environmental damages shows that diesel cars are more polluting than gasoline cars. The
obvious policy response would be to correct the relative taxation of diesel and gasoline cars to
reflect this new information.
The fuel taxes and vehicle ownership taxes have to fulfil many objectives ranging from
revenue raising to second best congestion tolls for cars and trucks. In the presence of large
congestion externalities and in the absence of a road toll, the theoretical prescription is that
taxes on diesel car use should be higher on a per km basis than taxes on the use of gasoline
cars. This is an important change compared to the present practice that is closer to an equal
percentage tax rule.
From a tax administration point of view, the change in the vehicle ownership taxes is the
easiest way to alter the relative taxation of both types of cars. With a numerical model we
show that a revenue neutral increase of diesel ownership taxes brings about important
environmental as well as total welfare benefits.

23
References
Atkinson, A.B. and J.E. Stiglitz, 1980, Lectures on public economics (McGraw-Hill, NewYork).
Auto-oil programme, 1999, Final report and background material for cost-effectivenessanalysis.
Calthrop, E., S. Proost and K. Van Dender, 2000, Optimal urban road tolls in the presence ofdistortionary taxes, paper presented at the EAERE 2000 Conference, Crete, June 2000.
De Nocker, L., L. Int Panis and I. De Vlieger, 2000, The environmental external costs oftransport in Belgium, Application and extension of the ExternE methodology, workingpaper, VITO, Mol.
Diamond, P.A. and J.A. Mirrlees, 1971, Optimal taxation and public production I: Productionefficiency and II: Tax rules, American Economic Review 61, 8-27 and 261-278.
European Commission, 1999, MEET - Methodology for calculating transport emissions andenergy consumption (Luxembourg, Office for Official Publications of the EuropeanCommunities).
Fankhauser, S., 1995, Valuing climate change: the economics of the greenhouse (Earthscan,London).
Janssen, M., 1999, Specification and estimation of equations for the choice of vehicles,working paper, C.E.S., K.U.Leuven.
Kanbur, R. and M. Keen, 1993, Jeux sans frontières: tax competition and tax coordinationwhen countries differ in size, American Economic Review 83, 877-892.
King, M.A., 1993, Welfare analysis of tax reforms using household data, Journal of PublicEconomics 21, 183-214.
Mayeres, I., 1999, The Control of Transport Externalities: A General Equilibrium Analysis,Ph.D. Dissertation, Faculty of Economics and Applied Economics, K.U.Leuven.
Mayeres, I., 2000, The efficiency effects of transport policies in the presence of externalitiesand distortionary taxes, Journal of Transport Economics and Policy 34, 233-260.
Mayeres, I. and S. Proost, 1997, Optimal tax and public investment rules for congestion typeof externalities, Scandinavian Journal of Public Economics 99, 261-279.
Mayeres, I. and S. Proost, 2000, Tax reform, externalities and income distribution, Journal ofPublic Economics, forthcoming.
Parry, I.W.H. and A. Bento, 1999, Revenue recycling and the welfare effects of road pricing,Discussion paper no. 99-45, Resources for the Future, Washington D.C.
Proost, S. and K. Van Dender, 2000, The welfare impacts of alternative policies to addressatmospheric pollution in urban road transport, Regional Science and UrbanEconomics, forthcoming.
Verboven, F., 1996, International price discrimination in the European car market, RANDJournal of Economics 27, 240-268.

24
Appendix I
Using Roy’s identity (( / ) )i iV q xλ∂ ∂ = − , the F.O.C. for ti can be written as:
( ) ( )
0 , , ;
j ji ii
i i j i
jii i j
i i
EF xEF xEC ECNx N N
X N x t X N x t
xxN x t t i j G D i j
t t
λ
µ
∂ ∂ ∂ ∂∂ ∂− − + − + ∂ ∂ ∂ ∂ ∂ ∂
∂ ∂+ + + = = ≠ ∂ ∂
Using expressions (3) and (4), dividing by N, µ, and xi and using the definitions of the own-price and the cross-price elasticities ELij, one obtains (2).

25
Table 1: The share of diesel cars in the car stock
1990 1995 2000BelgiumFinlandFranceGermanyGreeceIrelandItalyNetherlandsSpainUKEurope
3310171439201217314
3982814212141117816
43535161141111161417
Source: Auto-oil program (1999) and own computations
26
Table 2: Price and tax differences between diesel and gasoline cars in 1998
Belgium Finland France Germany Greece Ireland Italy Netherl. Spain U.K.CAR OWNERSHIP COSTS (EURO)Medium diesel carNet priceTaxes
118325188
1559224112
132453359
130584237
133086234
116137972
142855889
1202815376
136893735
136893914
Small gasoline carNet priceTaxes
85942991
1125614288
92942241
94272065
88933421
95596256
95462667
96787951
95042841
95044642
LIFETIME FUEL COSTS (EURO)Medium diesel carNet fuel costsTaxes
24654644
26954959
19305648
19844642
18853533
27815321
24435945
25395131
22943991
18849594
Small gasoline carNet fuel costsTaxes
29809272
296010271
245310515
25728603
29895908
32087187
32789606
340010112
29836458
231411260
COST DIFFERENCE: MEDIUM DIESEL – SMALL GASOLINE (EURO)Car ownership- net price- taxes- totalLifetime fuel costs- net fuel costs- taxes- total
323821975435
-515-4628-5143
43369824
14160
-264-5312-5576
395111185069
-523-4866-5389
363121715802
-588-3961-4549
441528137228
-1104-2374-3478
205417163770
-427-1866-2293
473932227961
-835-3661-4496
235074249774
-862-4981-5842
4185894
5079
-689-2468-3156
4185-7283457
-430-1666-2096
Break-even averageannual km for diesel
21136 50789 18812 25511 41562 32886 35415 33462 32179 32987
Source: Auto-oil program (1999) and own computations

27
Table 3: Tax discrimination possibilities for diesel fuel and diesel cars
Commodities and their use A B CVehicle ownership Diesel car – households Diesel car – production sectors Diesel truck – production sectors
t1t2t3
t1t2t3
t1t1t3
Fuel consumption Diesel car – households Diesel car – production sectors Diesel truck – production sectors
t4t5t6
t4t4t4
t4t4t4
28
Table 4: The marginal external costs and the tax in the reference equilibrium
Gasoline car Diesel car TruckPeak Off-peak Weighted
averageaPeak Off-peak Weighted
averageaPeak Off-peak Weighted
averagea
Marginal external costs (EURO/vkm)CongestionAir pollutionAccidentsTotal
0.230.010.030.27
0.040.010.030.08 0.15
0.230.030.030.29
0.040.030.030.11 0.17
0.460.100.020.57
0.090.100.020.20 0.27
Tax(EURO/vkm)Privateb 0.10
(36%)0.10
(118%)0.10
(65%)0.06
(21%)0.06
(58%)0.06
(35%)Businessb 0.04
(14%)0.04
(47%)0.04
(26%)0.02(8%)
0.02(23%)
0.02(14%)
0.12(21%)
0.12(60%)
0.12(45%)
a Weighted average of peak and off-peak marginal external costs and taxes. The share of peak vkm in total vkm is 65% for cars and 20% for trucks.b The figures within brackets give the tax as percentage of the marginal external costs
29
Table 5: The marginal cost of public funds
AGE modelwithout
externality
AGE model with externalities
MCF* MCF MCFA MCFB MCFC
Vehicleownership tax Gasoline car Diesel car
1.211.15
1.070.81
1.090.97
0.00-0.11
-0.02-0.04
Excise Gasoline Diesel
1.291.11
1.050.71
1.070.90
0.00-0.15
-0.03-0.04
VAT Gasoline Diesel
1.321.23
1.050.68
1.090.91
0.00-0.16
-0.03-0.06
30
Table 6: The effect of the tax reforms on the traffic flow
Traffic flow: % change w.r.t. thereference equilibrium
Peak Off-peakVehicle ownership tax Gasoline car Diesel car
-0.06%-0.09%
-0.14%-0.20%
Excise Gasoline Diesel
-0.12%-0.12%
-0.18%-0.20%
VAT Gasoline Diesel
-0.13%-0.18%
-0.20%-0.29%

Copyright © 2000 @ the author(s). Discussion papers are in draft form. This discussion paper is distributed for purposes of comment and discussion only. It may not be reproduced without permission of the copyright holder. Copies of working papers are available from the author.
Related Documents