1 Shotgun Proteomic Analysis of Hibernating Arctic Ground Squirrels Chunxuan Shao 1 , Yuting Liu 1 , Hongqiang Ruan 2 , Ying Li 1 , Haifang Wang 1 , Franziska Kohl 3 , Anna V. Goropashnaya 3 , Vadim B. Fedorov 3 , Rong Zeng 2 , Brian M. Barnes 3 , and Jun Yan 1, * 1 CAS-MPG Partner Institute for Computational Biology, Shanghai Institutes of Biological Sciences, 320 Yue Yang Road, Shanghai, 200031, China 2 Institute of Biochemistry and Cell Biology, Shanghai Institutes of Biological Sciences, 320 Yue Yang Road, Shanghai, 200031, China 3 Institute of Arctic Biology, University of Alaska Fairbanks, Fairbanks, AK, 99775, USA Running head: Protein Expression in Hibernating Arctic Ground Squirrels. *Corresponding author: Jun Yan, Mailing address: CAS-MPG Partner Institute for Computational Biology, Shanghai Institutes of Biological Sciences, 320 Yue Yang Road, Shanghai, 200031, China. E-mail: [email protected] , Tel: 86-21-549- 20474. Fax: 86-21-549-20451. MCP Papers in Press. Published on November 20, 2009 as Manuscript M900260-MCP200 Copyright 2009 by The American Society for Biochemistry and Molecular Biology, Inc. by guest on January 2, 2019 http://www.mcponline.org/ Downloaded from

Welcome message from author
This document is posted to help you gain knowledge. Please leave a comment to let me know what you think about it! Share it to your friends and learn new things together.
Transcript

1
Shotgun Proteomic Analysis of Hibernating Arctic Ground Squirrels Chunxuan Shao1, Yuting Liu1, Hongqiang Ruan2, Ying Li1, Haifang Wang1,
Franziska Kohl3, Anna V. Goropashnaya3, Vadim B. Fedorov3, Rong Zeng2, Brian
M. Barnes3, and Jun Yan1, *
1CAS-MPG Partner Institute for Computational Biology, Shanghai Institutes of
Biological Sciences, 320 Yue Yang Road, Shanghai, 200031, China
2Institute of Biochemistry and Cell Biology, Shanghai Institutes of Biological
Sciences, 320 Yue Yang Road, Shanghai, 200031, China
3Institute of Arctic Biology, University of Alaska Fairbanks, Fairbanks, AK, 99775,
USA
Running head: Protein Expression in Hibernating Arctic Ground Squirrels.
*Corresponding author: Jun Yan, Mailing address: CAS-MPG Partner Institute for
Computational Biology, Shanghai Institutes of Biological Sciences, 320 Yue Yang
Road, Shanghai, 200031, China. E-mail: [email protected], Tel: 86-21-549-
20474. Fax: 86-21-549-20451.
MCP Papers in Press. Published on November 20, 2009 as Manuscript M900260-MCP200
Copyright 2009 by The American Society for Biochemistry and Molecular Biology, Inc.
by guest on January 2, 2019http://w
ww
.mcponline.org/
Dow
nloaded from

2
Abbreviations
AGS: Arctic Ground Squirrel
LC-MS/MS: liquid chromatography and tandem mass spectrometry
EA: early arousal
LT: late torpor
PR: post-reproduction
SAF: spectral abundance factor
NSAF: normalized spectral abundance factor
PLGEM: power law global error model
StN: signal-to-noise
FDR: false discovery rate
GO: Gene Ontology
by guest on January 2, 2019http://w
ww
.mcponline.org/
Dow
nloaded from

3
Summary
Mammalian hibernation involves complex mechanisms of metabolic
reprogramming and tissue protection. Previous gene expression studies of
hibernation have mainly focused on changes at the mRNA level. Large-scale
proteomic studies on hibernation have lagged behind, largely due to the lack of an
adequate protein database specific for hibernating species. We constructed a
ground squirrel protein database for protein identification and used a label-free
shotgun proteomic approach to analyze protein expression throughout the torpor-
arousal cycle during hibernation in arctic ground squirrels (Urocitellus parryii).
We identified more than 3,000 unique proteins from livers of arctic ground
squirrels. Among them, 517 proteins showed significant differential expression
comparing animals sampled after at least 8 days of continuous torpor (late torpid),
within 5 hours of a spontaneous arousal episode (early aroused), and 1-2 months
after hibernation had ended (non-hibernating). Consistent with changes at the
mRNA level shown in a previous study on the same tissue samples, proteins
involved in glycolysis and fatty acid synthesis were significantly under-expressed
at the protein level in both late torpid and early aroused animals compared to non-
hibernating animals, whereas proteins involved in fatty acid catabolism were
significantly over-expressed. On the other hand, when we compared late torpid and
early aroused animals, there were discrepancies between mRNA and protein levels
by guest on January 2, 2019http://w
ww
.mcponline.org/
Dow
nloaded from

4
for a large number of genes. Proteins involved in protein translation and
degradation, mRNA processing, and oxidative phosphorylation were significantly
over-expressed in early aroused animals compared to late torpid animals, whereas
no significant changes at the mRNA levels between these stages had been observed.
Our results suggest that there is substantial post-transcriptional regulation of
proteins during torpor-arousal cycles of hibernation.
Introduction
Hibernation is a survival strategy of regulated metabolic suppression adopted by a
wide range of mammalian species to survive environmental conditions of low or
unpredictable food availability (1, 2). Through complex cellular and molecular
reorganization, hibernators have evolved the ability to sustain and spontaneously
reverse profoundly low levels of body temperature and rates of oxygen
consumption. For example, during torpor the arctic ground squirrel, Urocitellus
parryii, adopts a core body temperature of -2.9 °C and a minimum metabolic
demand that is 2% of its normal, basal metabolic rate (3, 4). However, during the
hibernation season arctic ground squirrels, like all other small mammalian
hibernators, alternate between prolonged torpor (to 24 days) and periodic arousal
episodes, when they spontaneously rewarm to euthermic body temperatures (36-
by guest on January 2, 2019http://w
ww
.mcponline.org/
Dow
nloaded from

5
37°C) for 10-15 hours before returning to torpor. The genetic and molecular
mechanisms of regulation and tolerance of hibernation and the functional
significance of arousal episodes remain central questions in hibernation research.
In addition, understanding the molecular mechanisms of hibernation has the
potential of leading to the development of novel preventive and therapeutic
approaches to the treatment of human maladies such as trauma, cardiovascular
disease, stroke, and ischemia/reperfusion injury.
Nearly two decades of gene expression studies on hibernating mammals have
suggested that the hibernation phenotype results from the differential expression of
existing genes rather than the evolution of novel genes (1, 5, 6). Recently, several
laboratories have utilized large-scale genomic approaches to investigate
differential gene expression during hibernation in different ground squirrel species
(7, 8). In initial studies of the arctic ground squirrel (AGS), we compared mRNA
levels in brown adipose tissue (BAT) using mouse microarrays and identified 625
genes that were differentially expressed between torpid and summer active animals
(9). We subsequently designed Illumina beadarrays that measured expression of
about 1,400 genes in five AGS tissues using probes based on pooled mRNA
sequences of three ground squirrel species, comparing four hibernation stages
during spontaneous torpor-arousal cycles with non-hibernating AGS. Using the
by guest on January 2, 2019http://w
ww
.mcponline.org/
Dow
nloaded from

6
beadarrays as well as Real-Time PCR assays, we identified significant differences
in hibernating animals compared to non-hibernating animals in mRNA levels of
genes involved in metabolism and tissue protection and genes related to circadian
rhythm and cell growth during the torpor-arousal cycle (10).
Transcripts of mRNA are protected while translation is inhibited during torpor in
ground squirrels (11, 12). Therefore, protein variety and abundance can be very
different from corresponding gene expression at the mRNA level, and differential
protein expression may more directly reflect regulatory changes related to
hibernation. Martin et al. observed a slow loss of protein integrity during
prolonged torpor in golden-mantled ground squirrels (Callospermophilus lateralis)
and proposed that replenishment of proteins may be a cause for arousal episodes
(13). These results call for investigating hibernation at the proteomic in addition to
transcriptomic levels. However, due to the difficulty of developing high-
throughput proteomic technologies for non-model organisms, large-scale
hibernation proteomics have lagged behind hibernation transcriptomics (14). Initial
hibernation proteomic studies were based on two-dimensional (2D) gel
electrophoresis. Using 2D gels followed by tandem mass spectrometry (MS/MS),
Epperson et al. compared protein expression in the livers of golden-mantled
ground squirrels entering torpor and summer active animals and identified 68
by guest on January 2, 2019http://w
ww
.mcponline.org/
Dow
nloaded from

7
differentially expressed proteins (15). Using a similar approach, Martin et al. then
identified 27 different proteins showing significant differential expression in the
intestines of thirteen-lined ground squirrels (Ictidomys tridecemlineatus) sampled
during interbout arousal, compared to summer active animals (16). However, 2D
gel-based proteomic approaches have intrinsic problems such as limited coverage,
low sensitivities, and unidentifiable spots (17, 18). Another obstacle in hibernation
proteomics is the lack of a protein database for any hibernating species. Towards
overcoming this problem, Russeth et al. combined multiple software packages to
search for proteins in metazoan protein databases to analyze the electrospray
ionization (ESI) and matrix assisted laser desorption ionization MS results of seven
spots that showed differential expression between active and hibernating animals
on 2D gels of skeletal muscle and heart of thirteen-lined ground squirrels (14).
More quantitative MS-based methods have been developed, including stable
isotope labeling such as isotope-coded affinity tag (ICAT), stable isotope labeling
by amino acids in cell culture (SILAC), and isobaric tags for relative and absolute
quantitation (iTRAQ). Unfortunately, these methods are expensive and time-
consuming. Recently, an alternative label-free shotgun proteomic strategy based on
spectral counting has become available (19). In this method, relative protein
abundance is estimated from the number of spectral matches for a given protein
by guest on January 2, 2019http://w
ww
.mcponline.org/
Dow
nloaded from

8
species across samples. The low-abundant proteins that may be randomly picked
up in the experiment can be filtered out. Appropriate statistical methods have been
developed to analyze such label-free spectral data (20, 21). Although considered
less accurate than the isotope labeling methods, this approach has an advantage of
higher proteome coverage, higher dynamic range, and a simpler experimental
protocol and is therefore more convenient for global protein expression studies (22).
Here we apply a label-free shotgun proteomic approach for the first time on a
hibernating species. We collected MS spectra using liquid chromatography and
tandem mass spectrometry (LC-MS/MS), and results were searched against a
ground squirrel protein database that we constructed by combining Ensembl
annotation of the newly available thirteen-lined ground squirrel genome along with
pooled EST sequences from three closely-related ground squirrel species. We then
compared protein expression results with our previously published mRNA results
using the same tissue samples (10). We also designed additional Real-Time PCR
assays for mRNA of newly identified proteins in the high-throughput proteomic
study. Selected differential expressed proteins identified in our approach were
further validated by Western blot analyses. Our analysis results indicate the
potentially significant role of post-transcriptional regulation in torpor-arousal
cycles during hibernation.
by guest on January 2, 2019http://w
ww
.mcponline.org/
Dow
nloaded from

9
Experimental Procedures
Construction of a ground squirrel protein database
Thirteen-lined ground squirrel genome and annotations for 17,920 protein-coding
and non-coding genes containing splice sites information as well as 14,830 protein
sequences of protein-coding genes were downloaded from Ensembl release 49
(speTri1, Jun. 2006; http://www.ensembl.org/index.html). EST (expressed
sequence tags) sequences of golden-mantled ground squirrel (8,803 sequences) and
thirteen-lined ground squirrel (5,256 sequences) were obtained from NCBI
(http://www.ncbi.nlm.nih.gov). Arctic ground squirrel EST sequences (13,505
sequences) were obtained from the EST sequencing project in University of Alaska
Fairbanks. These ground squirrel EST sequences were aligned to the thirteen-lined
ground squirrel genome using the blastn program (23) to identify the genomic
contigs that the ESTs belong to, using a minimum alignment score of 160 as
criterion. To identify the precise splice sites, the EST sequences were re-aligned to
the corresponding genomic contigs using the sim4 program (24). To identify the
human and mouse homologous genes in the thirteen-lined ground squirrel genome
that could have been missed in Ensembl gene annotations, we further aligned the
human and mouse RefSeq mRNA sequences (25) to the thirteen-line ground
by guest on January 2, 2019http://w
ww
.mcponline.org/
Dow
nloaded from

10
squirrel genome by the same procedure. In the sim4 alignments, we required that
the mapped portion of the EST or RefSeq alignment is at least 50% of the full
sequence, and that match identities were higher than 95% for ground squirrel EST
sequences and 85% for human and mouse RefSeq sequences. We clustered the
EST alignments, RefSeqs alignments, and Ensembl gene annotations on the same
contig into “Gene Clusters” based on the splice site information and the mutual
overlaps, i.e. they were clustered if they shared at least one common splice site or
they overlapped for at least 50% of the shorter sequence’s length. The ESTs that
could not be reliably aligned to the genome were clustered into “Unaligned
Clusters” by the blastclust program. To remove the redundancy of Gene Clusters
due to genome duplication or incomplete assembly, Gene Clusters were further
clustered to “Unique Gene Clusters” if a Gene Cluster shared at least 80% of its
members with another Gene Cluster.
If the Unique Gene Cluster contained Ensembl gene annotations, the protein
sequences from Ensembl annotations were used directly. There were gaps in some
Ensembl protein sequences due to incomplete genome sequences. In this case, we
aligned the ground squirrel ESTs onto the protein sequences with the blastx
program and used the protein translation of EST sequences to fill in the gaps in
Ensembl protein sequences. In this way, a total of 1,246 Ensembl protein
by guest on January 2, 2019http://w
ww
.mcponline.org/
Dow
nloaded from

11
sequences were “patched”. If the Unique Gene Cluster did not have any Ensembl
annotation but had human RefSeq alignment, the genomic regions aligned to the
human RefSeq were translated into protein sequence according to the open reading
frames in human. If the Unique Gene Cluster had neither Ensembl annotation nor
human RefSeq alignment but had mouse RefSeq alignment, the genomic regions
aligned to the mouse RefSeq were translated into protein sequence. If the Unique
Gene Cluster had none of the above, the genomic regions aligned to the ESTs in
that cluster to the maximum spanning length were obtained and aligned to the nr
database by the blastx program. The protein sequences were obtained by
translating the aligned genomic regions using the open reading frame of the
aligned nr proteins. For the “Unaligned Clusters”, we also aligned the EST
sequences to the nr database and selected the longest translated protein sequence in
that cluster. All protein sequences were merged to form the ground squirrel protein
database. They were further aligned to human RefSeq protein sequences by the
blastp program to obtain their corresponding human gene symbols, where a
minimum alignment score of 100 was used as criteria. The scheme of the ground
squirrel protein database construction is shown in Figure S1. The protein amino
acid sequences of ground squirrel protein database and their annotations are
provided as supplementary materials (Table S1 and Table S2).
by guest on January 2, 2019http://w
ww
.mcponline.org/
Dow
nloaded from

12
Animals
Animals and tissues used in this proteomic study were the same as were analyzed
in our previous microarray study (10). We included two more post-reproductive
animals in the western blot validation. Briefly, Urocitellus parryii were trapped in
July near the Toolik Field Station in northern Alaska (68.6°N 149.4°W, elevation
809 m) and transported to the University of Alaska Fairbanks. Animals were
housed at 20±2°C with a 16:8-h light:dark photoperiod and provided with Mazuri
Rodent Chow and water ad libitum. Hibernating animals were implanted with
temperature-sensitive radiotransmitters in their abdominal cavities and maintained
at a 4:20-h photoperiod. Body temperature (Tb) was monitored for the precise stage
of torpor and arousal by an automated telemetry system that measures and records
Tb every 10 min (4). Animals late in a torpor bout (LT; n = 4) were collected after
80-90% of the duration of the previous torpor bout (8-12 days). Animals sampled
early after spontaneously arousing from torpor (EA; n = 4) were collected 1-2
hours after core Tb had increased above 30°C during rewarming. Post-reproductive
summer euthermic animals sampled in May and June 1-2 months after ending
hibernation (PR; n = 4) were used as non-hibernating controls. These animals had
completed reproductive regression as assessed by external inspection of gonads
and genitalia and had entered molt. Torpid animals were euthanized by
decapitation without anesthesia. Aroused and post-reproductive animals were
by guest on January 2, 2019http://w
ww
.mcponline.org/
Dow
nloaded from

13
deeply anesthetized with iso-flurane and decapitated. Liver tissue was rapidly
dissected, frozen in liquid N2 and stored at -80°C. Frozen tissues were transported
to Shanghai, China on dry ice where proteomic and Real-Time PCR analyses were
conducted.
Protein digestion
Liver samples (1 mg) were homogenized in a Dounce glass grinder using 1 mL
lysis buffer consisting of 9.5 M urea, 4% CHAPS (w/v), 65 mM Tris, 10 mM DTT,
and a mixture protease inhibitor cocktail (100/1, Merck). The crude tissue extracts
were centrifuged for 45 min at 15,000 × g for removing the undissolved pellets.
The tissue lysates (1 mg) were reduced for 2 hours at room temperature by addition
of 1 M DTT to a final concentration of 10 mM DTT and then alkylated for 45 min
by addition of 1 M IAA to final 50 mM. After reduction and alkylation, the lysates
were precipitated using 5 volumes of ice-cold TCA/Acetone. The pellets were then
washed three times with ice-cold pure acetone and resuspended in 200 µL 100 mM
NH4HCO3. For in-solution digestion, 20 µg of modified trypsin (sequencing grade,
Promega) were added and the mixtures were digested at 37 °C for 1,000 rpm
overnight in Thermomixer compactTM (Eppendorf). Trypsin activity was quenched
by acidification using trifluorocacetic acid (TFA) to a final concentration of 1%.
by guest on January 2, 2019http://w
ww
.mcponline.org/
Dow
nloaded from

14
The mixed digests were further ultrafiltered by microconTM (10 kDa, Millipore) to
remove the large molecules.
Strong cation exchange chromatography
The Strong Cation Exchange (SCX) fractionation protocol mainly followed a
previous report (26) with slight modification. Briefly, the mixed digests were
loaded onto a 2.1 mm × 10 cm SCX column (CTI) equilibrated with 0.1 % formic
acid, 20 % acetonitrile and 5 mM ammonium formate (NH4HCO2) using an HPLC
1090 system. The peptides were separated by a linear gradient of NH4HCO2 from 5
mM to 100 mM with a flow rate of 0.5 mL per minute. A total of six fractions
including flow-through were collected and each fraction was dried with
ConcentratorTM (Eppendorf). The pellets were resuspended by adding 100 µL 0.1
% formic acid before the LC-MS run.
Mass spectrometric analysis
The fractionated digests were analyzed by C18 reversed-phase micro-scale liquid
chromatography tandem mass spectrometry. In this study, EttanTM MDLC
controlled by UNICORNTM software (GE Healthcare), a system for automated
multi-dimensional chromatography was used for desalting and separation of
by guest on January 2, 2019http://w
ww
.mcponline.org/
Dow
nloaded from
15
peptides prior to LTQ analyses. The mass spectrometer was operated in the data-
dependent mode to automatically switch between MS and MS/MS acquisition. A
Finnigan LTQ linear ion trap mass spectrometer equipped with a micro-spray
interface was used as the detector for the peptides separated on the RPC column.
Each scan cycle consisted of one full scan mass spectrum (m/z 400-1800) followed
by ten MS/MS events of the most intense ions with the following dynamic
exclusion settings: repeat count 2, repeat duration 30 seconds, exclusion duration
90 seconds (27). The samples were loaded onto the trap column firstly with 10
µL/min flow rate, and then the desalted samples were eluted at a flow rate of 1300
nL/min in MDLC by applying a linear gradient of 0-50 % buffer (0.1% FA, 84%
ACN) for 180 min. The Finnigan LTQ linear ion trap mass spectrometer was used
for the MS/MS experiment with an ion transfer capillary of 160 °C and ISpary
voltage of 3 kV. Normalized collision energy was 35.0 %.
Assigning peptide sequences using SEQUEST
Peak lists were generated using Bioworks 3.1(Thermo), with default parameters.
All acquired MS/MS spectra from 12 AGS samples were searched against 19,297
proteins in the ground squirrel protein database using SEQUEST (version 3.1).
Searches were performed using the “trypsin enzyme” parameter of the software.
Methionine oxidation was only specified as a variable modification and cysteine
by guest on January 2, 2019http://w
ww
.mcponline.org/
Dow
nloaded from

16
carboxamidomethylation was specified as the fixed modification. The peptide
database search was carried out with the following parameters: peptide mass
tolerance = 3.0 Da; mass tolerance for fragment ions = 0 Da; maximum number of
internal cleavage sites = 2; number of allowed errors in matching auto-detected
peaks, match peak tolerance = 1. SEQUEST results were filtered using the
following parameter: Xcorr > 1.55 and ΔCn > 0.15 for the peptides in +1 charged
state, Xcorr > 1.85 and ΔCn > 0.16 for the peptides in +2 charged state, and Xcorr
> 2.6 and ΔCn > 0.22 for the peptides in +3 charged state (28). These thresholds
were determined to maximize the number of peptides identified while satisfying a
false discovery rate (FDR) ≤0.05. The FDR was calculated based on the following
formula: FDR= nrev / ntar (29). The nrev is the number of peptide hits matched to the
“reverse” protein, and ntar is the number of peptide hits matched to the “target”
protein. Peptides exactly matched to more than one protein in our database were
included in all proteins that they mapped onto. All output results were combined
using in-house software named buildsummary.
Protein data analysis
The SEQUEST program identified 3,594 AGS proteins that had at least two unique
peptide hits to ground squirrel proteins in our database (Table S3, supplementary
materials). 3,537 of these AGS proteins have homologous human gene symbols.
by guest on January 2, 2019http://w
ww
.mcponline.org/
Dow
nloaded from

17
The remaining 57 AGS proteins were manually annotated by aligning with nr
database by BLAST. While removing redundant proteins corresponding to the
same gene symbols, we kept the one with highest number of spectral counts. After
removing this redundancy, we obtained 3,104 unique proteins with at least two
unique peptide counts. For reliable protein quantification, we selected 1,209 unique
proteins satisfying peptide counts
!
" 2 for every animal sample in at least one
physiological state (EA, LT, and PR). The total numbers of spectral hits of
peptides within each protein in the ground squirrel protein database were used to
quantify the protein expression level in each sample. Spectral counts in each
sample were divided by protein length to obtain the spectral abundance factor
(SAF). Normalized spectral abundance factors (NSAF) were obtained by further
dividing SAF values by the sum of SAF values in each sample according to
Pavelka et al. (30). The dynamic range of our NSAF values was computed by the
base 10 logarithm of the ratio between the 99.95th percentile and the 0.05th
percentile after removing the zero values according to Pavelka et al. NSAF values
were analyzed by the PLGEM-StN method (Bioconductor package) (31) to
compute the statistical significance of protein expression differences in pair-wise
comparisons among EA, LT, and PR stages. The FDR-adjusted p value < 0.05 was
used as criterion for statistical significance. A heatmap of the 25 most significant
proteins (FDR-adjusted p-value < 0.001) was generated by heatmap2 in gplots
by guest on January 2, 2019http://w
ww
.mcponline.org/
Dow
nloaded from
18
package (Bioconductor package) (31). The red-green colors represented scaled
NSAF values. The hierarchical clustering of genes was based on the distances
defined as one subtracts Pearson correlation coefficients (Figure 2). Log2-
transformed protein changes were calculated as log2-based ratios of mean NSAF
values in EA, LT, and PR stages. Spectral count data were also analyzed using the
Qspec program obtained from the authors (20). Bayes factor > 10 and |fold change|
> 1.5 were used as the criteria for statistical significance in pair-wise comparisons.
The combined PLGEM and Qspec results are listed in Table S4 (supplementary
materials). Functional analyses using Database for Annotation, Visualization, and
Integrated Discovery (DAVID) (32) program were conducted using default
background gene set.
To compare our results with those of Epperson et al.’s, we extracted fold changes
of significant proteins shown comparing animal during entrance into torpor (Ent)
vs. non-hibernating animals sampled in summer (SA) from Table I and II in their
paper (15). Homologous human gene symbols were obtained from the accession
number of identified proteins listed in the tables. Fold changes of proteins with the
same gene symbols were averaged. MDH1 protein was removed because it
appeared in both over- and under-expressed protein lists. Fold changes of both
by guest on January 2, 2019http://w
ww
.mcponline.org/
Dow
nloaded from
19
Epperson’s Ent vs. SA and our LT vs. PR comparisons were log2-transformed and
plotted in Figure 4.
mRNA data analysis
We used normalized gene expression values from our previously published
Illumina Beadarray experiment (10). For Real-Time PCR analysis, total RNA was
prepared from frozen tissues by homogenizing in liquid N2 the Trizol reagent
(Invitrogen) with mortar and pestle. Total RNA quantities were measured by a
Nanodrop spectrometer. RNA quality was assessed by an Agilent Bioanalyzer. 500
ng of total RNA from each sample was reverse transcribed using random hexamer
and reverse transcriptase (Invitrogen) in 20 µL reaction. 5 µL of RT product (1:10
diluted) was used in Real-Time PCR and SYBR Green I Master Mix (Roche) in a
20 µL reaction on LightCycler 480 (Roche). The 18S RNA was used as reference
in Real-Time PCR. The primer sequences of genes tested in Real-Time PCR are
listed in Table S5 (supplementary materials). The specificity of PCR reaction was
checked by melting curve analysis. The critical threshold (CT) value is the PCR
cycle number where the PCR growth curve crosses a defined threshold in the linear
range of the reaction. Gene expression values can be calculated from CT by the
formula:
!
235"C
T . In every Real-Time PCR assay, 18S RNA was used as the control
for significant bias of starting materials across samples. The critical threshold
by guest on January 2, 2019http://w
ww
.mcponline.org/
Dow
nloaded from

20
values are listed in Table S6 (supplementary materials). We again used the
PLGEM-StN method to analyze the Illumina Beadarray and Real-Time PCR gene
expression data. FDR-adjusted p-value < 0.05 was used as criterion for statistical
significance. Log2-transformed mRNA changes were calculated as log2-based
ratios of mean expression values in EA, LT, and PR stages for Illumina Beadarray
and Real-Time PCR data.
Western blot validation
Liver samples of arctic ground squirrels were washed with ice-cold PBS for three
times to remove blood, then homogenized in lysis buffer (8 M urea, 4% CHAPS,
65 mM DTT, 40 mM Tris with cocktail protease inhibitor, 200 mg wet tissue/mL)
with a motor-driven homogenizer (Glas-Col) until no sample pieces were visible.
The homogenate was sonicated for a total of 3 minutes followed by centrifugation
at 25,000 g for 1 hour at 4°C. Proteins in the supernatant were separated by SDS-
PAGE and transferred to nitrocellulose (NC) membranes. Each NC membrane was
incubated with blotting buffer (5% milk, 150mM NaCl, 20mM Tris·HCl (pH 8.0),
0.05% (V/V) Tween 20) with gentle shaking at room temperature for 1 hour. The
NC membrane was then incubated with primary antibody in fresh blotting buffer at
the concentration specified by the manufacturer with gentle shaking at 4°C for 12
hours. Primary antibodies were: Goat Anti-COPG (C-19) Polyclonal (sc-14167,
by guest on January 2, 2019http://w
ww
.mcponline.org/
Dow
nloaded from

21
Santa Cruz Biotechnology), Mouse Anti-PRP8 Monoclonal Antibody (clone E-5)
(sc-55533, Santa Cruz Biotechnology), Goat Anti-ATIII (C-18) Polyclonal
Antibody (sc-32453, Santa Cruz Biotechnology), Goat Anti-ALB (P-20)
Polyclonal Antibody (sc-46293, Santa Cruz Biotechnology), Rabbit Anti-Human
Ornithine Carbamoyltransferase (OTC) Precursor Polyclonal (LS-C31865,
Lifespan Biosciences), Goat Anti-mHMGCS (C-20) Polyclonal Antibody(sc-
32426, Santa Cruz Biotechnology), Goat Anti-Human Liver FBPase (C-17)
Polyclonal(sc-32432, Santa Cruz Biotechnology), Mouse Anti-NDUFS3 (17D95)
Monoclonal(sc-58393, Santa Cruz Biotechnology), and Mouse Anti-Human Factor
H (L20/3) Monoclonal(sc-47686, Santa Cruz Biotechnology). After being
incubated with the HRP-conjugated secondary antibody in fresh blotting buffer at
1:10000 for 1h, the NC membranes were detected using the Pierce
Chemiluminescence kit. To ensure the signals were in the linear range of the X-
ray film, immunoblots were exposed for variable lengths of time. Images were
captured with the Luminescent Image Analyzer LAS-4000 (FUJIFILM). All bands
were quantified using Multi Gauge Software (FUJIFILM). Protein expression was
measured in arbitrary densitometric units. Significant differences in protein
expression among different stages of hibernation were determined by ANOVA and
compared to LC-MS/MS data.
by guest on January 2, 2019http://w
ww
.mcponline.org/
Dow
nloaded from

22
Results
The ground squirrel protein database
Three ground squirrel species well-studied in hibernation research, the thirteen-
lined ground squirrel, golden-mantled ground squirrel, and arctic ground squirrel
are closely-related and share high mRNA sequence identities at the nucleotide
level (9). We obtained 14,830 unique ground squirrel proteins from genome
annotations of the thirteen-lined ground squirrel genome in the Ensembl database
(http://www.ensembl.org). To extract any proteins missed in the Ensembl genome
annotation, we mapped all human and mouse RefSeq mRNA sequences onto the
thirteen-lined ground squirrel genome and, after removing overlaps with Ensembl-
annotated ground squirrel proteins, we obtained 624 additional ground squirrel
proteins. We then mapped all available Expressed Sequence Tag (EST) sequences
of the three ground squirrel species onto thirteen-lined ground squirrel genome and
obtained 473 additional ground squirrel proteins. Taking into account the
incompleteness of the thirteen-lined ground squirrel genome, we further clustered
the ESTs that had failed to be mapped onto this genome and obtained 3,370 more
ground squirrel proteins. We thus created a ground squirrel protein database of in
total 19,297 ground squirrel proteins, with their sequences and annotations
available in Table S1 and S2 (supplementary materials). The detailed scheme of
by guest on January 2, 2019http://w
ww
.mcponline.org/
Dow
nloaded from

23
the ground squirrel protein database construction is described in Experimental
Procedures and shown in Figure S1 (supplementary materials).
The arctic ground squirrel liver proteome
To survey hibernation-related protein expression profiles in AGS, we conducted a
large-scale hibernation proteomics study using label-free LC-MS/MS. We studied
liver tissues from 12 AGS sampled in three physiological stages: late torpor (LT)
after 8-12 days of continuous torpor during winter, early arousal (EA) in euthermic
animals early after spontaneous arousal from torpor during winter, and post-
reproduction (PR) in euthermic, post-hibernation, and post-reproductive animals
sampled in May and June, which are used as non-hibernating controls. These three
stages were chosen because they showed the most significant differences in across
group comparisons in our previous gene expression study (10). Four animals were
sampled from each stage as Pavelka et al. suggested that four or five replicates
represents a reasonable compromise between cost and accuracy of label-free
experiments (30). To be able to make direct comparisons, we sampled from the
same tissues analyzed in the previous experiment. Six fractionations prior to
MS/MS analysis were collected to increase the coverage and dynamic range of our
data. We chose liver for this initial study due to its important role in energy
metabolism, and the large amplitude of change in metabolic rate that hibernators
by guest on January 2, 2019http://w
ww
.mcponline.org/
Dow
nloaded from

24
display. The spectra generated from LC-MS/MS were searched against our ground
squirrel protein database using the SEQUEST program (28) with a false discovery
rate (FDR<0.05). The complete results are listed in Table S3 (supplementary
materials).
We detected 3,104 unique AGS proteins with at least two unique peptide counts in
the ground squirrel protein database. We annotated these proteins by the gene
symbols of their homologous human proteins. Enriched Gene Ontology (GO)
categories of ground squirrel liver proteins as indicated by the Database for
Annotation, Visualization, and Integrated Discovery (DAVID) program are shown
in Figure 1A-1C (FDR<10-4) (32, 33). We compared our result with the mouse liver
protein expression data obtained by a similar label-free LC-MS/MS method (19). In
the mouse liver dataset, we were able to annotate 1,591 mouse proteins with
homologous human gene symbols and 1,010 of these overlapped with AGS liver
proteins in our study. There is a general consistency of biological functions of the
liver proteomes of mouse and ground squirrel.
Differential protein expression during hibernation
To reliably quantify levels of protein expression across 12 AGS liver samples, we
selected 1,209 proteins with spectral counts larger than or equal to 2 in every
by guest on January 2, 2019http://w
ww
.mcponline.org/
Dow
nloaded from

25
animal sample in at least one physiological group (EA, LT, or PR). Under these
conditions, zero values only consisted of a 4.94% of the total data. To correct the
bias due to large proteins leading to more spectral matches, spectral counts in each
sample were divided by protein length to obtain a spectral abundance factor (SAF).
Normalized spectral abundance factors (NSAF) were obtained after further
dividing SAF values by the sum of SAF values in each sample. Our NSAF values
spanned a 3.61 order of magnitude, according to the dynamic range defined by
Pavelka et al. (30). NSAF values have been shown to carry similar statistical
properties as microarray data and can be modeled by a power law global error
model (PLGEM). Instead of the traditional signal-to-noise (StN) method, we
applied the PLGEM-StN method on NSAF values to access the statistical
significance of protein expression differences among EA, LT, and PR stages.
PLGEM-StN analysis identified 517 proteins that showed significant differences
(FDR-adjusted p-value <0.05) in at least one pair-wise comparison: 188 proteins
between LT and PR, 279 proteins between EA and PR, and 325 proteins between
EA and LT. Statistics for the 25 most significant proteins (FDR-adjusted p-value <
0.001) in at least one pair-wise comparison are shown in Table 1, and their NSAF
values are displayed as a heatmap in Figure 2.
by guest on January 2, 2019http://w
ww
.mcponline.org/
Dow
nloaded from

26
We also analyzed our results with an alternative statistical method, Qspec, which
was recently developed to analyze spectral count data in label-free proteomics (20).
It is based on a Poisson model with generalized linear mixed effects, where the
parameters are estimated by a hierarchical Bayesian approach. We used the
original spectral counts and protein lengths as direct inputs for Qspec and
identified 216 proteins showing significant differences in at least one pair-wise
comparison: 117 proteins between LT and PR, 98 proteins between EA and PR,
and 82 proteins between EA and LT showing significant differences by default
parameters. The PLGEM-StN and Qspec results are shown side-by-side in Table
S4 (supplementary materials). 107 (91%, LT vs. PR), 98 (100%, EA vs. PR), and
81 (99%, EA vs. LT) Qspec-identified significant proteins were also identified as
significant by PLGEM-StN. We chose the PLGEM-StN result for our subsequent
analyses.
We then analyzed GO enrichment among six groups of differentially expressed
proteins in pair-wise comparisons of differences in abundance (EA>LT, EA<LT,
EA>PR, EA< PR, LT>PR, and LT<PR) by the DAVID program using FDR<0.05
as criteria. No significantly enriched GO categories were identified in LT>PR
group, presumably due to the small number of proteins over-expressed in LT
by guest on January 2, 2019http://w
ww
.mcponline.org/
Dow
nloaded from

27
compared to PR. The significantly enriched GO categories in the other five groups
are listed in Table 2.
Comparison between protein and mRNA expression
We have previously reported mRNA levels measured in liver tissues from the same
animals used in this study, measured using Illumina Beadarray and Real-Time
PCR (10). In the present study, we conducted new Real-Time PCR assays on 53
additional genes that showed differential protein expression in our LC-MS/MS
results (Table S5, supplementary materials). Combining these with previous data,
we obtained Real-Time PCR measurements for 188 genes (Table S6,
supplementary materials). Illumina Beadarray and Real-Time PCR data were
analyzed by PLGEM-StN method. There were 104 genes shared between LC-
MS/MS and Real-time PCR data. We compared the log2-transformed protein
expression fold changes and mRNA expression fold changes for the genes
significantly differentially expressed either at the protein or the mRNA level in
pair-wise comparisons among EA, LT, and PR stages. The Pearson correlation
coefficients between protein and mRNA changes for the same genes are 0.065
between EA vs. LT, 0.58 between EA vs. PR, and 0.62 between LT vs. PR (Figure
3A-3C). We further computed Pearson correlation coefficients and their statistical
significances between protein and mRNA levels across the same set of animals for
by guest on January 2, 2019http://w
ww
.mcponline.org/
Dow
nloaded from

28
each gene. There were 30 genes (28.8%) that were significantly correlated (p<0.05)
between two datasets, and all were positively correlated except SLC27A2. We also
compared the protein levels measured by LC-MS/MS with the mRNA levels
measured by previous Illumina Beadarray study. There were 85 genes shared
between LC-MS/MS and Illumina Beadarray experiment. The comparisons of
log2-transformed protein expression fold changes and mRNA expression fold
changes also showed high correlations in LT vs. PR (r=0.57) and EA vs. PR
(r=0.58) comparisons but again low correlation in EA vs. LT (r=0.098) comparison
(Figure S2A-S2C, supplementary materials). There were 17 genes (20%) that were
significantly correlated between two datasets (p<0.05), and all were positively
correlated. Thus, there is overall good correlation between mRNA and protein
levels among AGS liver genes.
Comparison with previous proteomic studies
Epperson et al. identified 68 differentially expressed proteins in the livers of
golden-mantled ground squirrels during entrance into torpor (Ent) compared to
summer active euthermic (SA) animals (15). 58 of these are quantified in our study.
We plotted the log2-fold changes of these proteins in LT vs. PR comparison in our
study vs. those in Ent vs. SA in Epperson et al.’s study (Figure 4). We observed a
significant positive Pearson’s correlation (r=0.47, p=0.0002) between the log2-fold
by guest on January 2, 2019http://w
ww
.mcponline.org/
Dow
nloaded from

29
changes. In our analysis, HMGCS2 and FABP1 were significantly over-expressed
in LT vs. PR, whereas ACADS, ACADSB, ALDH1A1, IVD, NIT2, and PAH were
significantly under-expressed, consistent with Epperson et al.’s result. However,
AASS, ALDH7A1, CES2, and GSTM1 were significantly under-expressed in our
result but over-expressed in Epperson et al.’s study. The animals we sampled were
in different hibernation stages than in Epperson et al.’s study. Ent animals used in
Epperson et al.’s study were sampled during the entrance into torpor when body
temperatures were 16-30 °C, whereas our LT animals were sampled after 8-12
days of continuous torpor with body temperatures near 4 °C. SA animals in their
study were non-hibernating euthermic animals but not necessarily in the post-
reproductive stage. The limited overlap of proteins that were found to be
differentially expressed in the two studies could be due to these differences in
sample times, as well as the different ground squirrel species and technologies used.
Western blot validation
We conducted Western blot validation on nine selected ground squirrel proteins
that showed significant differential expression in our study using anti-bodies
derived from non-ground squirrel species (Experimental Procedures). Multiple
bands were present in the blotting of PRPF8 and CFH indicating non-specific
bindings, and HMGCS2 hybridized at a band with a different molecular weight.
by guest on January 2, 2019http://w
ww
.mcponline.org/
Dow
nloaded from

30
These results were not pursued. Six ground squirrel proteins, OTC, FBP1, ALB,
COPG, NDUFS3, and SERPINC1, bound to their corresponding antibodies at a
unique band with the correct molecular weight. The gel images and quantitative
densitometric analysis are shown in Figure 5A and 5B respectively. In the Western
blot analyses, ALB showed significant (p<0.05, ANOVA) over-expression in both
EA and LT vs. PR. COPG showed significant over-expression in EA vs. PR. OTC
showed significant under-expression in both EA and LT vs. PR. FBP1 showed
significant under-expression in EA vs. LT. SERPINC1 showed significant over-
expression LT vs. PR. Although the over-expression of NDUFS3 in EA vs. LT is
not considered as significant (p=0.11), its Western result still correlated well with
its NSAF values across the same 12 animals with Pearson correlation r=0.71. Thus,
these semi-quantitative Western blot results were in general consistent with our
LC-MS/MS results.
Discussion
Metabolic shift
A consistent result in molecular studies of hibernation has been the observation of
a shift of metabolic fuel use from glucose to fatty acids as animals enter
hibernation season. In this study, in support of these previous findings, glucokinase
by guest on January 2, 2019http://w
ww
.mcponline.org/
Dow
nloaded from

31
(GCK) catalyzing the irreversible reaction in glycolysis, was significantly under-
expressed at the protein level in livers of arctic ground squirrels sampled in EA vs.
PR, consistent with its mRNA changes. Many proteins involved in fatty acid
catabolism were significantly over-expressed during compared to after hibernation.
Carnitine palmitoyltransferase 1A (CPT1A) was significantly over-expressed in
EA vs. PR. Liver-specific fatty acid binding protein (FABP1), responsible for the
intracellular transport of fatty acids, was significantly over-expressed in both EA
and LT vs. PR at both mRNA and protein levels. FABP1 was also significantly
under-expressed in EA vs. LT. However, brain-specific fatty acid binding protein
(FABP7) was significantly under-expressed in both EA and LT vs. PR at both
mRNA and protein levels and showed no significant difference between EA and
LT. Several types of fatty acid binding proteins exist in mammals that have
different ligand-binding affinities (34). FABP1 is the predominant form in liver and
can bind two fatty acids simultaneously, while FABP7 is expressed at lower level
in liver and binds only one fatty acid. The opposite changes of FABP1 and FABP7
protein expression may increase the efficiency of fatty acid transport during
hibernation and facilitate fatty acid beta-oxidation in liver. Acyl-CoA
dehydrogenases (ACAD) catalyze the dehydrogenation of acyl-CoA derivatives as
the first step of fatty acid beta-oxidation. ACADS and ACADSB, acting on short
chained and short branched chained fatty acid respectively, were both significantly
by guest on January 2, 2019http://w
ww
.mcponline.org/
Dow
nloaded from

32
under-expressed at the protein level in both EA and LT vs. PR consistent with
Epperson et al.’s results (15). ACADM and ACADL, acting on medium and long
chained fatty acid respectively, however, were not differentially expressed in our
study. El Kebbaj et al. observed that the activity of ACADM decreased in the
livers of hibernating jerboa (Jaculus orientalis) compared to euthermic active
animals (35) but increased compared to pre-hibernating animals. Epperson et al.
showed that ACADL was significantly over-expressed in the livers of thirteen-
lined ground squirrel in Ent vs. SA (15). Therefore, the effect of protein expression
changes of ACAD proteins on fatty acid beta-oxidation during hibernation is still
unclear and deserves further studies.
On the other hand, proteins involved in fatty acid biosynthesis such as acetyl-CoA
carboxylase (ACACA and ACACB) were under-expressed in both EA and LT
during the hibernation season vs. PR animals sampled after hibernation had ended.
These results were consistent with the mRNA level changes of ACACA and
ACACB in our microarray experiment. A decrease in enzyme activities involved in
fatty acid biosynthesis was also observed by Wang et al. in hibernating compared
to summer active golden-mantled ground squirrel (36). Proteins involved in amino
acid metabolism such as branched chain keto acid dehydrogenase (BCKDHA and
BCKDHB) were under-expressed in LT vs. PR. BCKDHA was also over-
by guest on January 2, 2019http://w
ww
.mcponline.org/
Dow
nloaded from

33
expressed in EA vs. LT. Those involved in urea cycle such as carbamoyl phosphate
synthetase I (CPS1) were under-expressed in EA vs. PR. Ornithine
aminotransferase (OAT) involved in pathway that converts arginine and ornithine
into glutamate and GABA and 4-aminobutyrate aminotransferase (ABAT)
responsible for catabolism of GABA were both under-expressed in EA and LT
compared to PR but over-expressed in EA compared to LT.
As an important enzyme in ketone body formation in the mitochondrion, HMG-
CoA synthase (HMGCS2), was significantly over-expressed at both protein and
mRNA levels in LT vs. PR, and under-expressed in EA vs. LT, returning in EA to
a similar level as in PR. The over-expression of HMGCS2 during hibernation was
also observed in Epperson et al.’s study (15). During starvation and diabetes,
gluconeogenesis and ketone body production are up-regulated. Ketone bodies
including acetoacetate and D-β-hydroxybutyrate are exported from liver as an
energy source to heart, skeletal muscle, kidney, and brain. Andrews et al. recently
demonstrated that D-β-hydroxybutyrate reaches the highest level in serum during
torpor in thirteen-lined ground squirrel and is selectively metabolized in the brain
and heart (37). Use of ketone as a metabolic fuel may be protective for the brain
and other organs during ischemia and hypoxia (38).
by guest on January 2, 2019http://w
ww
.mcponline.org/
Dow
nloaded from

34
Detoxification and tissue protection
Aldehyde oxidase (AOX1) produces hydrogen peroxide and catalyzes the
formation of superoxide. AOX1 was significantly under-expressed in both EA and
LT vs. PR. Superoxide dismutase 2 (SOD2) binding with superoxide was also
significantly under-expressed in LT vs. PR, over-expressed in EA vs. LT, and in
EA returned to the similar level as PR. Cytochrome P450 family proteins:
(CYP1A2, CYP2C70, CYP3A4, and CYP3A5) catalyzing drug metabolism and
synthesis of cholesterol, steroids and other lipids were all significantly under-
expressed in LT vs. PR. All except CYP2C70 were also under-expressed in EA vs.
PR. All except CYP3A4 showed over-expression in EA vs. LT. It is appealing to
speculate that the drastically reduced basal metabolic rate during torpor may have
rendered anti-oxidant protection and detoxification less necessary. Hibernators
may mainly require protection against reactive oxidative species (ROS) generated
during arousal (39), when the metabolic rate rapidly returns to normal. This is
consistent with our observation that the levels of anti-oxidant proteins such as
SOD2 in EA indeed returned to similar levels as in PR.
Regucalcin (RGN), or senescence marker protein-30, was significantly over-
expressed in both EA and LT vs. PR. RGN shows decreased expression in the
livers of aging rats (40). It has been proposed that RGN regulates calcium
by guest on January 2, 2019http://w
ww
.mcponline.org/
Dow
nloaded from

35
homeostasis in cells (41), suppresses cell proliferation (42), and promotes cell
survival (43). RGN may play an important role for tissue protection against
damages in liver during hibernation.
Blood coagulation
Alpha-2-macroglobulin (A2M) was the first gene shown to be differentially
expressed during hibernation at both mRNA and protein levels (6). It is suggested
that A2M plays an important role in preventing blood clotting in hibernators,
although A2M also plays a major role as a proteinase inhibitor (44). In our study,
A2M was also over-expressed in both EA and LT vs. PR. In addition to A2M,
serpin peptidase inhibitor (SERPINC1) and histidine-rich glycoprotein (HRG)
have serine-type endopeptidase inhibitor activity and are involved in blood
coagulation. Both SERPINC1 and HRG were over-expressed in LT vs. PR, under-
expressed in EA vs. LT, and in EA returned to a similar level as in PR.
Torpor-arousal cycle
Although the metabolic shift and tissue protective changes during the hibernation
season are largely known, the functional significance of spontaneous arousal
episodes during hibernation and how they are regulated are still unclear. Our
previous gene expression study showed that a subset of metabolic genes decreased
by guest on January 2, 2019http://w
ww
.mcponline.org/
Dow
nloaded from

36
in expression during the transition from late torpor to early arousal. In this
proteomic study, we observed this pattern not only in metabolic enzymes such as
HMGCS2 but also in transport proteins such as albumin (ALB). The expression of
these proteins increased in LT vs. PR, but in EA decreased to a level similar to in
PR. This is unlikely to be a simple temperature-dependent effect, as the expression
of many other metabolic proteins involved in fatty acid catabolism remained high
during arousal. Our previous gene expression study also suggested that the
circadian rhythm and cell cycle were suspended during torpor and resumed during
arousal. Although we did not identify any key circadian rhythm proteins showing
differential expression in liver in this study, we observed that cell division cycle 42
(CDC42), involved in cell proliferation, were significantly over-expressed in EA
vs. LT and EA vs. PR, and protein phosphatase (PPP2CA), which prompts cell
growth, was under-expressed in LT vs. PR but over-expressed in EA vs. LT.
In contrast to the results at mRNA level in our previous study, we observed a large
number of proteins showing differential expression between EA and LT, many of
which have not shown changes at mRNA level. Proteins involved in protein
translation and degradation, mRNA processing, and oxidative phosphorylation
were significantly over-expressed in EA compared to LT during the torpor-arousal
cycle, whereas such changes were not significant at the mRNA level. Seven
by guest on January 2, 2019http://w
ww
.mcponline.org/
Dow
nloaded from

37
eukaryotic translation initiation factors, 13 ribosomal proteins, and 12 subunits of
proteasome were significantly over-expressed in EA vs. LT. Proteins involved in
mRNA processing such as two pre-mRNA processing factors, three heterogeneous
nuclear ribonucleoproteins, and six splicing factors were all significantly over-
expressed in EA vs. LT. Proteins involved in oxidative phosphorylation and
electron transport chain including seven subunits of ATP synthases, two subunits
of cytochrome c oxidase, and seven subunits of NADH dehydrogenase were also
significantly over-expressed in EA vs. LT. However, the mRNA levels of these
proteins as measured by Real-Time PCR and Illumina Beadarray, did not show any
significant changes between EA and LT. The disassociation of change in protein
from change in mRNA during LT to EA transition is also reflected in the poor
correlation between log ratios of protein and mRNA expression in Figure 3A. This
may indicate significant post-transcriptional modifications leading to rapid protein
turnover, mRNA processing, and oxidative phosphorylation during the torpor-
arousal cycle.
Conclusion
The availability of the thirteen-lined ground squirrel genome and various ground
squirrel EST resources enabled us to construct a ground squirrel protein database
with minimal redundancy. In spite of its incompleteness compared to the protein
by guest on January 2, 2019http://w
ww
.mcponline.org/
Dow
nloaded from
38
databases in model organisms, searching the spectra generated from label-free
shotgun LC-MS/MS in the constructed ground squirrel protein database allowed us
to identify thousands of ground squirrel proteins in AGS liver with unprecedented
coverage and depth. Considering the noisy nature of LC-MS/MS data, we carefully
filtered out the low spectral count data and applied established statistical methods
in protein quantification. We identified hundreds of differentially expressed
proteins comparing early aroused, late torpid, and non-hibernating animals.
Furthermore, we were able to compare global protein expression with global gene
expression across the same set of AGS samples. The positive correlations with
gene expression data on the same set of animals supported that our protein data
were reproducible and our results reflected the real biological differences among
animal groups. Consistent with our previous gene expression study, we observed
the significant protein changes that suggested down-regulation of glycolysis, fatty
acid synthesis, and urea cycle, but up-regulation of gluconeogenesis, fatty acid
catabolism, and ketone body metabolism in hibernating season. Our proteomic
results are also in support of our previous hypotheses put forward in our gene
expression study, that a subset of metabolic genes decreased their expression
during the transition from late torpor to early arousal, and the cell cycle was
suspended during torpor and resumed during arousal. For these genes, the changes
at the mRNA level have clearly penetrated to the protein levels.
by guest on January 2, 2019http://w
ww
.mcponline.org/
Dow
nloaded from

39
Our finding of Pearson correlations r~0.6 (r2~0.4) between significant mRNA and
protein changes in two pairwise comparisons (LT vs. PR and EA vs. PR) are
compatible with the estimate in other studies that differences in mRNA expression
can only explain about 40% of protein differences (45). In contrast, the Pearson
correlation r~0.1 (r2~0.01) in the EA vs. LT comparison is strikingly low. This may
be largely due to that expression of proteins involved in protein turnover, mRNA
processing, and oxidative phosphorylation are increased at the protein level from
LT to EA, but show no significant changes at the mRNA level. Global post-
transcriptional modifications could be crucial for torpor-arousal cycles during
hibernation as transcriptional changes at the mRNA level may not be fast enough
to respond in such a short time. This is also consistent with the hypothesis that
animals arouse to synthesize new proteins during hibernation (12). RNA binding
proteins bind specific mRNA transcripts and influence their stabilities and
translation at the post-transcriptional level. One of them, RBM3, has previously
been shown to be significantly over-expressed during hibernation (10). Systematic
identification of its binding targets will help to explain some of the discrepancies
between the mRNA and protein results. miRNAs might represent another
important post-transcriptional regulatory mechanism in hibernation. Combining
gene expression, protein expression, and miRNA expression with bioinformatic
by guest on January 2, 2019http://w
ww
.mcponline.org/
Dow
nloaded from

40
approaches will enable the identification of regulatory targets of miRNAs, and
further the understanding of molecular mechanism of hibernation at the systems
level.
Acknowledgements
We thank Loren Buck and Martin A. Carrasco for helpful discussions, Nathan
Stewart for help in arctic ground squirrel ESTs sequencing, and Mehmet Somel
and anonymous referees for suggestions on the manuscript. The Qspec program
was kindly provided by Alexey I. Nesvizhskii and Damian Fermin.
Grants
We wish to acknowledge supports from National Basic Research Program of China
grant 2006CB910700, Shanghai Science and Technology Committee grant
08QA1407500 (J. Yan), and NSF grant 0732755 and US Army Medical Research
and Material Command grant #05178001 (B. M. Barnes).
References
by guest on January 2, 2019http://w
ww
.mcponline.org/
Dow
nloaded from

41
1. Carey, H. V., Andrews, M. T., and Martin, S. L. (2003) Mammalian hibernation: cellular
and molecular responses to depressed metabolism and low temperature. Physiol. Rev. 83, 1153-
1181.
2. Buck, C. L., and Barnes, B. M. (1999) Temperatures of hibernacula and changes in body
composition of arctic ground squirrel over winter. J. Mammal. 80, 1264-1276.
3. Barnes, B. M. (1989) Freeze avoidance in a mammal: body temperatures below 0 degree
C in an arctic hibernator. Science 244, 1593-1595.
4. Buck, C. L., and Barnes, B. M. (2000) Effects of ambient temperature on metabolic rate,
respiratory quotient, and torpor in an arctic hibernator. Am. J. Physiol. Regul. Integr. Comp.
Physiol. 279, R255-262.
5. Boyer, B. B., and Barnes, B. M. (1999) Molecular and metabolic aspects of mammalian
hibernation. BioScience 49, 713-724.
6. Srere, H. K., Wang, L. C., and Martin, S. L. (1992) Central role for differential gene
expression in mammalian hibernation. Proc. Natl. Acad. Sci. U. S. A. 89, 7119-7123.
7. Williams, D. R., Epperson, L. E., Li, W., Hughes, M. A., Taylor, R., Rogers, J., Martin,
S. L., Cossins, A. R., and Gracey, A. Y. (2005) Seasonally hibernating phenotype assessed
through transcript screening. Physiol. Genomics 24, 13-22.
8. Brauch, K. M., Dhruv, N. D., Hanse, E. A., and Andrews, M. T. (2005) Digital
transcriptome analysis indicates adaptive mechanisms in the heart of a hibernating mammal.
Physiol. Genomics 23, 227-234.
9. Yan, J., Burman, A., Nichols, C., Alila, L., Showe, L. C., Showe, M. K., Boyer, B. B.,
Barnes, B. M., and Marr, T. G. (2006) Detection of differential gene expression in brown adipose
by guest on January 2, 2019http://w
ww
.mcponline.org/
Dow
nloaded from

42
tissue of hibernating arctic ground squirrels with mouse microarrays. Physiol. Genomics 25, 346-
353.
10. Yan, J., Barnes, B. M., Kohl, F., and Marr, T. G. (2008) Modulation of gene expression
in hibernating arctic ground squirrels. Physiol. Genomics 32, 170-181.
11. Van Breukelen, F., and Martin, S. L. (2002) Reversible depression of transcription during
hibernation. J. Comp. Physiol. [B] 172, 355-361.
12. Knight, J. E., Narus, E. N., Martin, S. L., Jacobson, A., Barnes, B. M., and Boyer, B. B.
(2000) mRNA stability and polysome loss in hibernating Arctic ground squirrels (Spermophilus
parryii). Mol. Cell. Biol. 20, 6374-6379.
13. Martin, S. L., Dahl, T. A., and Epperson, L. E. (2004) Life in the cold: Evolution,
mechanisms, adaptation, and application. Twelfth International Hibernation Symposium.
University of Alaska, Fairbanks, Alaska, USA., 199-208.
14. Russeth, K. P., Higgins, L., and Andrews, M. T. (2006) Identification of proteins from
non-model organisms using mass spectrometry: application to a hibernating mammal. J.
Proteome Res. 5, 829-839.
15. Epperson, L. E., Dahl, T. A., and Martin, S. L. (2004) Quantitative analysis of liver
protein expression during hibernation in the golden-mantled ground squirrel. Mol. Cell.
Proteomics 3, 920-933.
16. Martin, S. L., Epperson, L. E., Rose, J. C., Kurtz, C. C., Ane, C., and Carey, H. V. (2008)
Proteomic analysis of the winter-protected phenotype of hibernating ground squirrel intestine.
Am. J. Physiol. Regul. Integr. Comp. Physiol. 295, R316-328.
by guest on January 2, 2019http://w
ww
.mcponline.org/
Dow
nloaded from

43
17. Wolff, S., Otto, A., Albrecht, D., Zeng, J. S., Buttner, K., Gluckmann, M., Hecker, M.,
and Becher, D. (2006) Gel-free and gel-based proteomics in bacillus subtilis: A comparative
study. Mol. Cell. Proteomics 5, 1183-1192.
18. Mikel R. Roe, T. J. G. (2006) Gel-free mass spectrometry-based high throughput
proteomics: Tools for studying biological response of proteins and proteomes. Proteomics 6,
4678-4687.
19. Kislinger, T., Cox, B., Kannan, A., Chung, C., Hu, P., Ignatchenko, A., Scott, M. S.,
Gramolini, A. O., Morris, Q., Hallett, M. T., Rossant, J., Hughes, T. R., Frey, B., and Emili, A.
(2006) Global survey of organ and organelle protein expression in mouse: Combined proteomic
and transcriptomic profiling. Cell 125, 173-186.
20. Choi, H., Fermin, D., and Nesvizhskii, A. I. (2008) Significance analysis of spectral
count data in label-free shotgun proteomics. Mol. Cell. Proteomics 7, 2373-2385.
21. Qian, W.-J., Liu, T., Monroe, M. E., Strittmatter, E. F., Jacobs, J. M., Kangas, L. J.,
Petritis, K., Camp, D. G., and Smith, R. D. (2004) Probability-Based Evaluation of Peptide and
Protein Identifications from Tandem Mass Spectrometry and SEQUEST Analysis: The Human
Proteome. J. Proteome Res. 4, 53-62.
22. Bantscheff, M., Schirle, M., Sweetman, G., Rick, J., and Kuster, B. (2007) Quantitative
mass spectrometry in proteomics: a critical review. Anal. Bioanal. Chem. 389, 1017-1031.
23. Altschul, S., Gish, W., Miller, W., Myers, E., and Lipman, D. (1990) Basic local
alignment search tool. J. Mol Biol. 215, 403-410.
24. Florea, L., Hartzell, G., Zhang, Z., Rubin, G. M., and Miller, W. (1998) A computer
program for aligning a cDNA sequence with a genomic DNA sequence. Genome Res. 8, 967-
974.
by guest on January 2, 2019http://w
ww
.mcponline.org/
Dow
nloaded from

44
25. Pruitt, K. D., and Maglott, D. R. (2001) RefSeq and LocusLink: NCBI gene-centered
resources. Nucl. Acids Res. 29, 137-140.
26. Olsen, J. V., Blagoev, B., Gnad, F., Macek, B., Kumar, C., Mortensen, P., and Mann, M.
(2006) Global, in vivo, and site-specific phosphorylation dynamics in signaling networks. Cell
127, 635-648.
27. Li, R.-X., Chen, H.-B., Tu, K., Zhao, S.-L., Zhou, H., Li, S.-J., Dai, J., Li, Q.-R., Nie, S.,
Li, Y.-X., Jia, W.-P., Zeng, R., and Wu, J.-R. (2008) Localized-Statistical Quantification of
Human Serum Proteome Associated with Type 2 Diabetes. PLoS ONE 3, e3224.
28. Eng, J. K., McCormack, A. L., and Yates, J. R. (1994) An approach to correlate tandem
mass spectral data of peptides with amino acid sequences in a protein database. J. Am. Soc.
Mass. Spectrom. 5, 976-989.
29. Elias, J. E., and Gygi, S. P. (2007) Target-decoy search strategy for increased confidence
in large-scale protein identifications by mass spectrometry. Nat. Methods 4, 207-214.
30. Pavelka, N., Fournier, M. L., Swanson, S. K., Pelizzola, M., Ricciardi-Castagnoli, P.,
Florens, L., and Washburn, M. P. (2007) Statistical similarities between transcriptomics and
quantitative shotgun proteomics data. Mol. Cell. Proteomics, M700240-MCP700200.
31. Gentleman, R. C., Carey, V. J., Bates, D. M., Bolstad, B., Dettling, M., Dudoit, S., Ellis,
B., Gautier, L., Ge, Y., Gentry, J., Hornik, K., Hothorn, T., Huber, W., Iacus, S., Irizarry, R.,
Leisch, F., Li, C., Maechler, M., Rossini, A. J., Sawitzki, G., Smith, C., Smyth, G., Tierney, L.,
Yang, J. Y., and Zhang, J. (2004) Bioconductor: open software development for computational
biology and bioinformatics. Genome Biol. 5, R80.
32. Huang, D. W., Sherman, B. T., and Lempicki, R. A. (2008) Systematic and integrative
analysis of large gene lists using DAVID bioinformatics resources. Nat. Protocols 4, 44-57.
by guest on January 2, 2019http://w
ww
.mcponline.org/
Dow
nloaded from
45
33. Dennis, G., Jr., Sherman, B. T., Hosack, D. A., Yang, J., Gao, W., Lane, H. C., and
Lempicki, R. A. (2003) DAVID: Database for Annotation, Visualization, and Integrated
Discovery. Genome Biol. 4, P3.
34. Richieri, G. V., Ogata, R. T., Zimmerman, A. W., Veerkamp, J. H., and Kleinfeld, A. M.
(2000) Fatty acid binding proteins from different tissues show distinct patterns of fatty acid
Interactions. Biochemistry 39, 7197-7204.
35. El Kebbaj, Z., Andreoletti, P., Mountassif, D., Kabine, M., Schohn, H., Dauca, M.,
Latruffe, N., El Kebbaj, M. H. S., and Cherkaoui-Malki, M. (2009) Differential Regulation of
Peroxisome Proliferator-Activated Receptor (PPAR)-{alpha}1 and Truncated PPAR{alpha}2 as
an Adaptive Response to Fasting in the Control of Hepatic Peroxisomal Fatty Acid {beta}-
Oxidation in the Hibernating Mammal. Endocrinology 150, 1192-1201.
36. Wang, P., Walter, R., Bhat, B., Florant, G., and Coleman, R. (1997) Seasonal changes in
enzymes of lipogenesis and triacylglycerol synthesis in the golden-mantled ground squirrel
(Spermophilus lateralis). Comp Biochem Physiol B Biochem Mol Biol. 118, 261-267.
37. Andrews, M. T., Russeth, K. P., Drewes, L. R., and Henry, P.-G. (2008) Adaptive
mechanisms regulate preferred utilization of ketones in the heart and brain of a hibernating
mammal during arousal from torpor. Am. Physiol. Regul. Integr. Comp. Physiol., 90795.92008.
38. Suzuki, M., Suzuki, M., Kitamura, Y., Mori, S., Sato, K., Dohi, S., Sato, T., Matsuura,
A., and Hiraide, A. (2002) Beta-hydroxybutyrate, a cerebral function improving agent, protects
rat brain against ischemic damage caused by permanent and transient focal cerebral ischemia.
Jpn. J. Pharmacol. 89, 36-43.
by guest on January 2, 2019http://w
ww
.mcponline.org/
Dow
nloaded from

46
39. Toien, O., Drew, K. L., Chao, M. L., and Rice, M. E. (2001) Ascorbate dynamics and
oxygen consumption during arousal from hibernation in Arctic ground squirrels. Am. J. Physiol.
Regul. Integr. Comp. Physiol. 281, R572-583.
40. Maruyama, N., Ishigami, A., Kuramoto, M., Handa, S., Kubo, S., Imasawa, T., Seyama,
K., Shimosawa, T., and Kasahara, Y. (2004) Senescence marker protein-30 knockout mouse as
an aging model. Ann. N. Y. Acad. Sci. 1019, 383-387.
41. Fujita, T., Shirasawa, T., and Maruyama, N. (1999) Expression and structure of
senescence marker protein-30 (SMP30) and its biological significance. Mech. Ageing. Dev. 107,
271-280.
42. Yamaguchi, M., and Daimon, Y. (2005) Overexpression of regucalcin suppresses cell
proliferation in cloned rat hepatoma H4-II-E cells: Involvement of intracellular signaling factors
and cell cycle-related genes. J. Cell. Biochem. 95, 1169-1177.
43. Matsuyama, S., Kitamura, T., Enomoto, N., Fujita, T., Ishigami, A., Handa, S.,
Maruyama, N., Zheng, D., Ikejima, K., Takei, Y., and Sato, N. (2004) Senescence marker
protein-30 regulates Akt activity and contributes to cell survival in Hep G2 cells. Biochem.
Biophys. Res. 321, 386-390.
44. Sottrup-Jensen, L. (1989) Alpha-macroglobulins: structure, shape, and mechanism of
proteinase complex formation. J. Biol. Chem. 264, 11539-11542.
45. Tian, Q., Stepaniants, S. B., Mao, M., Weng, L., Feetham, M. C., Doyle, M. J., Yi, E. C.,
Dai, H., Thorsson, V., Eng, J., Goodlett, D., Berger, J. P., Gunter, B., Linseley, P. S., Stoughton,
R. B., Aebersold, R., Collins, S. J., Hanlon, W. A., and Hood, L. E. (2004) Integrated genomic
and proteomic analyses of gene expression in mammalian cells. Mol. Cell. Proteomics 3, 960-
969.
by guest on January 2, 2019http://w
ww
.mcponline.org/
Dow
nloaded from

47
Tables.
Table 1. 25 Most Significant Differentially expressed proteins in PLGEM-StN
analysis. 25 most significant differentially expressed proteins in PLGEM-StN
analysis (FDR-adjusted p-value < 0.001). Original spectral counts in 12 samples
and FDR-adjusted p-values in EA vs. LT, EA vs. PR, and LT vs. PR comparisons
are also included. Bold values indicate they are also significant in Qspec result.
p-va
lue
(LT
vs. P
R)
7.01
E-04
5.
79E-
04
4.16
E-03
3.
43E-
03
7.07
E-02
3.
21E-
04
1.21
E-03
3.
19E-
03
4.56
E-01
3.
69E-
03
7.78
E-04
4.
96E-
05
8.90
E-04
6.
88E-
02
1.78
E-01
2.
67E-
02
2.65
E-03
1.
94E-
02
5.92
E-02
9.
86E-
03
1.94
E-02
7.
32E-
03
2.72
E-02
1.
24E-
01
by guest on January 2, 2019http://w
ww
.mcponline.org/
Dow
nloaded from

48
p-va
lue
(EA
vs.
PR)
3.17
E-03
4.
63E-
04
7.28
E-05
2.
38E-
04
5.26
E-04
1.
85E-
01
7.94
E-04
9.
50E-
01
8.21
E-04
9.
20E-
04
2.12
E-03
1.
09E-
04
1.65
E-03
5.
03E-
04
8.07
E-04
1.
22E-
02
4.40
E-02
3.
05E-
02
3.97
E-04
1.
27E-
01
2.95
E-02
4.
76E-
04
7.76
E-03
5.
04E-
03
p-va
luec (E
A v
s. LT
) 1.
13E-
02
4.51
E-03
4.
86E-
02
5.89
E-02
5.
88E-
03
2.98
E-04
5.
82E-
02
4.57
E-04
1.
42E-
03
3.21
E-01
1.
79E-
02
3.11
E-02
2.
82E-
02
5.72
E-03
3.
38E-
03
4.47
E-04
1.
75E-
04
7.54
E-04
4.
47E-
03
7.61
E-04
5.
33E-
04
2.41
E-01
3.
14E-
04
8.44
E-04
PR7
23
12
0 61
2 77
36
5 3 88
15
103
91
3 0 0 229
19
4 5 0 0 9 2
PR4
48
23
0 132 9 86
32
0 1 68
41
39
163 2 6 5 182
20
5 5 2 0 4 7
PR2
41
47
0 201 6 124
49
5 0 183
17
100
191 3 1 0 133
11
3 4 2 0 2 3
PR1
29
10
0 77
11
81
37
2 0 89
24
33
92
4 3 0 205
19
10
5 2 1 5 2
LT5
14
0 2 77
3 258
17
0 2 79
9 351
35
4 3 1 180 4 3 2 1 5 3 1
LT3 7 2 5 79
4 314 3 1 0 110 8 205
74
1 0 0 172
16
2 2 1 2 5 2
LT2 2 0 2 39
3 179 0 0 2 29
5 114
10
2 7 0 359
46
4 0 0 3 3 2
LT1
11
0 4 63
7 238 1 0 1 28
2 185 9 1 4 0 444
43
4 2 0 2 0 3
EAE
A4 18
0 6 59
2 142 8 4 4 36
11
162
17
0 14
2 229
17
1 8 2 9 7 17
EA3
19
1 8 28
0 143 1 5 5 39
7 206
29
0 16
4 244
25
2 6 4 2 11
11
EA2
22
11
8 95
2 109
24
3 5 116 9 103
104 1 7 6 143
13
1 9 4 1 19
9
EA1
16
5 5 33
3 111 5 2 6 42
20
252
87
2 4 5 112 2 1 8 4 4 12
5
PCb
60%
26
%
27%
71
%
37%
79
%
31%
45
%
40%
41
%
50%
84
%
25%
57
%
56%
16
%
73%
16
%
17%
48
%
63%
21
%
37%
27
%
UPC
a 12
21
8 17
5 26
27
5 3 16
10
11
48
3 4 5 12
2 3 7 4 4 5 5
by guest on January 2, 2019http://w
ww
.mcponline.org/
Dow
nloaded from

49
Gen
e Sy
mbo
l A
BA
T A
CLY
A
DFP
A
KR
1C3
AK
R1D
1 A
LB
AO
X1
AR
HG
DIB
B
AN
F1
BH
MT
CY
P3A
5 FA
BP1
FA
SN
GN
G12
H
3F3B
H
AO
2 H
BB
HB
E1
HSD
3B2
MTC
H2
NU
TF2
PNPO
PT
MA
R
PL14
ENSE
MB
L Pr
o ID
EN
SSTO
P000
0000
4452
EN
SSTO
P000
0000
5420
EN
SSTO
P000
0000
7189
EN
SSTO
P000
0000
3215
EN
SSTO
P000
0000
0753
N
one
ENSS
TOP0
0000
0064
09
Non
e EN
SSTO
P000
0000
7259
EN
SSTO
P000
0000
5260
N
one
ENSS
TOP0
0000
0042
32
ENSS
TOP0
0000
0092
35
ENSS
TOP0
0000
0040
30
ENSS
TOP0
0000
0139
49
ENSS
TOP0
0000
0038
11
Non
e N
one
Non
e N
one
ENSS
TOP0
0000
0025
74
ENSS
TOP0
0000
0055
55
ENSS
TOP0
0000
0093
73
Non
e
AG
S Pr
o ID
A
GS_
1431
A
GS_
1119
1 A
GS_
5977
A
GS_
590
AG
S_54
42
AG
S_15
305
AG
S_13
709
AG
S_15
506
AG
S_10
99
AG
S_14
254
AG
S_15
328
AG
S_20
65
AG
S_93
1 A
GS_
8158
A
GS_
2985
A
GS_
7005
A
GS_
1613
2 A
GS_
1896
3 A
GS_
1728
7 A
GS_
1757
8 A
GS_
7129
A
GS_
7834
A
GS_
1897
A
GS_
1542
4
a UPC: Unique Peptide Counts; b PC: Peptide Coverage; c p-value: FDR-adjusted p-value; Table 2. Enriched GO categories in five differentially expressed protein
groups. Enriched GO categories identified by DAVID program (FDR<0.05) in
five differentially expressed protein groups: EA>LT, EA<LT, EA>PR, EA<PR,
and LT<PR. No significantly enriched GO category was identified in LT>PR
group.
GO Term Protein Count P value FDR
by guest on January 2, 2019http://w
ww
.mcponline.org/
Dow
nloaded from

50
EA>LT Oxidoreductase 33 1.48E-11 2.36E-08
Protein Biosynthesis 19 2.11E-10 3.37E-07 Proteasome 12 9.48E-10 1.51E-06
Phosphoprotein 113 7.96E-11 1.27E-07 Ribosome 10 3.95E-07 6.29E-04
Ribonucleoprotein 17 1.78E-06 2.8 E-03 EA<LT
Steroid Metabolic Process 7 1.10E-05 0.02 Lipid Metabolic Process 11 3.01E-05 0.04
EA>PR Translation 28 1.61E-10 3.07E-07
Phosphoprotein 78 3.95E-08 6.29E-05 EA<PR
Oxidoreductase 36 1.10E-29 1.75E-26 Electron Transport 24 1.85E-15 3.61E-12
Lipid Metabolic Process 25 4.22E-12 8.07E-09 Response to Chemical Stimulus 17 2.92E-07 5.59E-04 Amino Acid Metabolic Process 12 1.34E-06 2.57E-03
LT<PR Electron Transport 26 5.06E-14 9.68E-11
Lipid Metabolic Process 29 6.88E-12 1.32E-08 Amine Metabolic Process 19 2.21E-08 4.24E-05
Response to Chemical Stimulus 20 2.94E-07 5.62E-04
Figures Legends.
by guest on January 2, 2019http://w
ww
.mcponline.org/
Dow
nloaded from

51
Figure 1. Number of proteins in enriched GO categories in AGS liver proteome
related to (A) biological processes, (B) cellular component, and (C) molecular
functions identified by DAVID (FDR<10-4). Numbers above the bars are FDRs for
enriched GO categories.
Figure 2. Heatmap of NSAF values of 25 most significant differentially expressed
proteins in Table 1. Red color corresponds to high levels of expression and green
color corresponds to low levels of expression.
Figure 3. Log2-transformed protein expression fold changes and mRNA
expression fold changes for the genes significantly differentially expressed either
at the protein or the mRNA level in pair-wise comparisons among EA, LT, and PR
stages. The mRNA levels were measured using Real-Time PCR. (A) EA vs. LT.
(B) EA vs. PR. (C) LT vs. PR. Red color represents significant at the protein level
but not mRNA level. Green color represents significant at the mRNA level but not
protein level. Purple color represents significant at both levels. The dash line
represents y=x.
Figure 4. Comparison of log2-transformed protein expression fold changes
between our LT vs. PR result and Epperson et al.’s Ent vs. SA result. 58 significant
proteins in Epperson et al’s results are shown. Red color represents the proteins
also significant in our LT vs. PR result and their gene symbols are listed. The dash
line represents y=x.
by guest on January 2, 2019http://w
ww
.mcponline.org/
Dow
nloaded from

52
Figure 5. Western blot (A) gel images and (B) quantitative densitometric analysis
for ALB, COPG, OTC, NDUFS3, FBP1, and SERPINC1 protein expression in 14
AGS liver samples. * represents p<0.05 and ** represents p<0.01 in ANOVA
analysis.
by guest on January 2, 2019http://w
ww
.mcponline.org/
Dow
nloaded from

53
by guest on January 2, 2019http://w
ww
.mcponline.org/
Dow
nloaded from

54
by guest on January 2, 2019http://w
ww
.mcponline.org/
Dow
nloaded from

55
by guest on January 2, 2019http://w
ww
.mcponline.org/
Dow
nloaded from
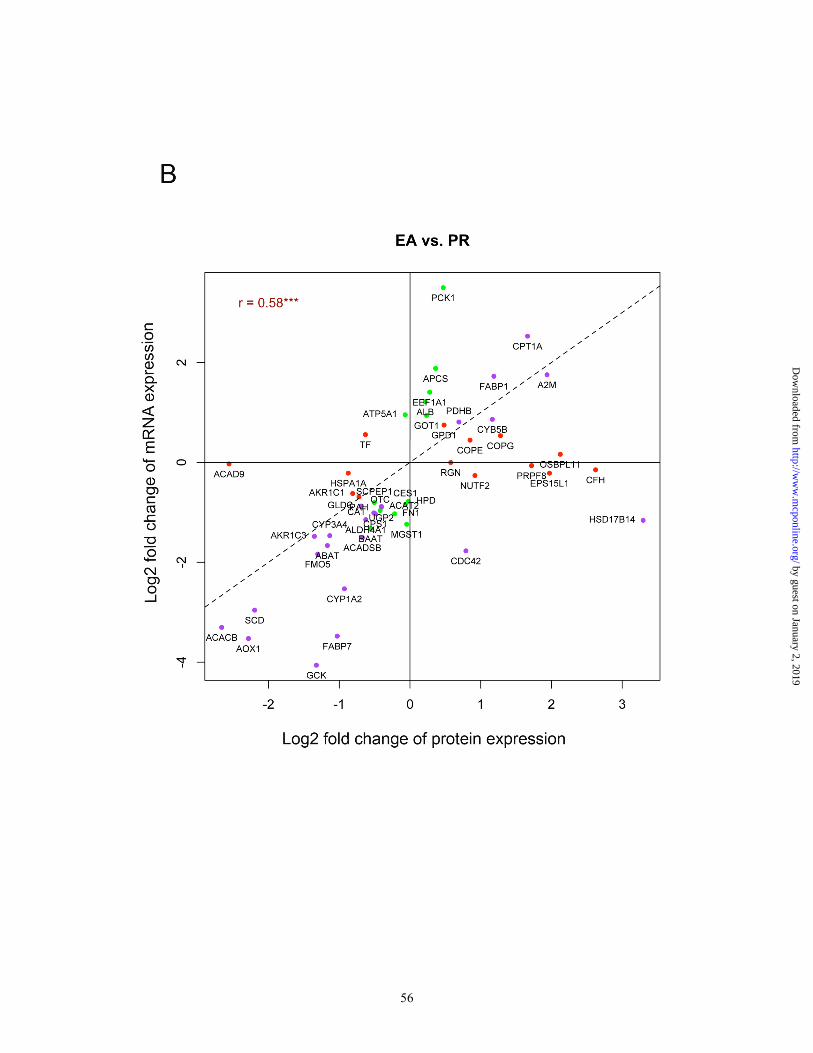
56
by guest on January 2, 2019http://w
ww
.mcponline.org/
Dow
nloaded from

57
by guest on January 2, 2019http://w
ww
.mcponline.org/
Dow
nloaded from

58
by guest on January 2, 2019http://w
ww
.mcponline.org/
Dow
nloaded from

59
by guest on January 2, 2019http://w
ww
.mcponline.org/
Dow
nloaded from

60
Supplementary materials
Table S1. The protein sequences of ground squirrel protein database in FASTA
format.
Table S2. The protein annotations of proteins in ground squirrel protein database.
by guest on January 2, 2019http://w
ww
.mcponline.org/
Dow
nloaded from

61
Table S3. The complete results of proteins identified by SEQUEST program with
at least two unique peptide hits.
Table S4. The combined PLGEM-StN and Qspec results. (a) EA vs. LT
comparison; (b) EA vs. PR comparison; (c) LT vs. PR comparison.
Table S5. The primer sequences of 53 genes tested in this experiment by Real-
Time PCR.
Table S6. The critical thresholds (CT) of genes tested in Real-Time PCR. It is the
combined result of 53 genes tested in this experiment and 135 genes tested in
previous experiment (10).
Figure S1. The scheme of the ground squirrel protein database construction.
Figure S2. Log2-transformed protein expression fold changes and mRNA
expression fold changes for the genes significantly differentially expressed either
at the protein or the mRNA level in pair-wise comparisons among EA, LT, and PR
stages. The mRNA levels were measured using Illumina Beadarray. (A) EA vs.
LT. (B) EA vs. PR. (C) LT vs. PR. Red color represents significant at the protein
level but not mRNA level. Green color represents significant at the mRNA level
but not protein level. Purple color represents significant at both levels. The dash
line represents y=x.
by guest on January 2, 2019http://w
ww
.mcponline.org/
Dow
nloaded from
Related Documents