2000 SSSAJ: Volume 75: Number 5 • September–October 2011 Soil Sci. Soc. Am. J. 75:2000–2007 Posted online 23 Aug. 2011 doi:10.2136/sssaj2011.0026 Received 20 Jan. 2011. *Corresponding author (lisagardner@ufl.edu) © Soil Science Society of America, 5585 Guilford Rd., Madison WI 53711 USA All rights reserved. No part of this periodical may be reproduced or transmitted in any form or by any means, electronic or mechanical, including photocopying, recording, or any information storage and retrieval system, without permission in writing from the publisher. Permission for printing and for reprinting the material contained herein has been obtained by the publisher. Short-Term Response of Carbon Cycling to Salinity Pulses in a Freshwater Wetland Wetland Soils T he soil microbial pool is responsible for many ecosystem processes, includ- ing the transfer of C from the organic pool (e.g., biomass) to the inorganic pool (e.g., CO 2 and CH 4 ) (Wetzel, 2001). e rate at which microbes mineralize C is especially important in wetlands, where the high level of primary productiv- ity means changes in the C source–sink potential of wetlands could have impli- cations for the global C cycle. Salinity is a prevalent environmental stressor with the potential to alter the rate of C cycling in wetlands (e.g., Pattnaik et al., 2000; Sangiorgio et al., 2008; Wong et al., 2008). e impact of soil salinity in arid and semiarid regions on crop productivity and nutrient cycling has been studied exten- sively. Findings indicate that high salt concentrations in upland and paddy soils can decrease the size of the soil microbial community (Muhammad et al., 2006; Pattnaik et al., 2000), decrease the rate of microbial respiration (Gennari et al., 2007; Muhammad et al., 2006; Pathak and Rao, 1998), and decrease the rate of methanogenesis (Pattnaik et al., 2000). Such an overall decrease in the rate of C cycling in these systems is oſten attributed to osmotic or ionic stress inflicted on the microbial population by increased conductivity in the soil-water environment (Frankenberger and Bingham, 1982; Gennari et al., 2007). Rising sea level and increasing frequency of saltwater intrusion events also cause stress to microbial populations in freshwater wetlands near the coast. It is estimated that during the 20th century, the sea level rose ?1.7 mm yr −1 . Since 1993, this rate has increased to 2.8 to 3.1 ± 0.7 mm yr −1 (Intergovernmental Panel Lisa G. Chambers* K. Ramesh Reddy Todd Z. Osborne Wetland Biogeochemistry Lab. Soil and Water Science Dep. Univ. of Florida Gainesville, FL 32611-0510 Sea level rise increases the frequency and intensity of storm surges and extreme tidal events in coastal freshwater wetlands. Seawater affects soil biogeochemical processes by inducing osmotic stress and stimulating SO 4 2− reduc- tion. e objective of this study was to determine the mechanism by which salinity alters C mineralization rates by quantifying the relative importance of ionic stress, compared with the addition of the SO 4 2− electron acceptor, on the production of CO 2 and CH 4 . A batch incubation study measured potential anaerobic respiration and methanogenesis with time in a freshwater wetland soil exposed to varying concentrations (3.5, 14, and 35 g kg −1 ) of seawater or salt (NaCl) solutions. Seawater addition induced a short-term (2-wk) stimulation of CO 2 produc- tion (20–32% greater than the freshwater control) and a continuous suppression of CH 4 production (up to 94% less than freshwater). Ionic stress (represented by NaCl) did not reduce CO 2 production at all but did decrease CH 4 production for 2 wk in both the 14 and 35 g kg −1 NaCl treatments. Our results indicate that microbial populations rebound quickly from ionic stress. e intrusion of dilute seawater (3.5 g kg −1 ) to freshwater wetlands can accelerate organic C mineralization through the short-term increase in SO 4 2− –induced respiration without inhibiting methanogenesis. Overall, the organic C mineralization rate was 17% higher for 3.5 g kg −1 seawater than the freshwater control. e temporary nature of the microbial response suggests that “pulses” of seawater may have a greater influence on the rate of C cycling in freshwater wetlands than a gradual sea level rise. Abbreviations: MBC, microbial biomass carbon; OC, extractable organic carbon; TOC, total extractable organic carbon.

Welcome message from author
This document is posted to help you gain knowledge. Please leave a comment to let me know what you think about it! Share it to your friends and learn new things together.
Transcript
2000 SSSAJ: Volume 75: Number 5 • September–October 2011
Soil Sci. Soc. Am. J. 75:2000–2007Posted online 23 Aug. 2011doi:10.2136/sssaj2011.0026Received 20 Jan. 2011.*Corresponding author (lisagardner@ufl .edu) © Soil Science Society of America, 5585 Guilford Rd., Madison WI 53711 USAAll rights reserved. No part of this periodical may be reproduced or transmitted in any form or by any means, electronic or mechanical, including photocopying, recording, or any information storage and retrieval system, without permission in writing from the publisher. Permission for printing and for reprinting the material contained herein has been obtained by the publisher.
Short-Term Response of Carbon Cycling to Salinity Pulses in a Freshwater Wetland
Wetland Soils
The soil microbial pool is responsible for many ecosystem processes, includ-ing the transfer of C from the organic pool (e.g., biomass) to the inorganic
pool (e.g., CO2 and CH4) (Wetzel, 2001). Th e rate at which microbes mineralize C is especially important in wetlands, where the high level of primary productiv-ity means changes in the C source–sink potential of wetlands could have impli-cations for the global C cycle. Salinity is a prevalent environmental stressor with the potential to alter the rate of C cycling in wetlands (e.g., Pattnaik et al., 2000; Sangiorgio et al., 2008; Wong et al., 2008). Th e impact of soil salinity in arid and semiarid regions on crop productivity and nutrient cycling has been studied exten-sively. Findings indicate that high salt concentrations in upland and paddy soils can decrease the size of the soil microbial community (Muhammad et al., 2006; Pattnaik et al., 2000), decrease the rate of microbial respiration (Gennari et al., 2007; Muhammad et al., 2006; Pathak and Rao, 1998), and decrease the rate of methanogenesis (Pattnaik et al., 2000). Such an overall decrease in the rate of C cycling in these systems is oft en attributed to osmotic or ionic stress infl icted on the microbial population by increased conductivity in the soil-water environment (Frankenberger and Bingham, 1982; Gennari et al., 2007).
Rising sea level and increasing frequency of saltwater intrusion events also cause stress to microbial populations in freshwater wetlands near the coast. It is estimated that during the 20th century, the sea level rose ?1.7 mm yr−1. Since 1993, this rate has increased to 2.8 to 3.1 ± 0.7 mm yr−1 (Intergovernmental Panel
Lisa G. Chambers*K. Ramesh ReddyTodd Z. Osborne
Wetland Biogeochemistry Lab.Soil and Water Science Dep.Univ. of FloridaGainesville, FL 32611-0510
Sea level rise increases the frequency and intensity of storm surges and extreme tidal events in coastal freshwater wetlands. Seawater aff ects soil biogeochemical processes by inducing osmotic stress and stimulating SO4
2− reduc-tion. Th e objective of this study was to determine the mechanism by which salinity alters C mineralization rates by quantifying the relative importance of ionic stress, compared with the addition of the SO4
2− electron acceptor, on the production of CO2 and CH4. A batch incubation study measured potential anaerobic respiration and methanogenesis with time in a freshwater wetland soil exposed to varying concentrations (3.5, 14, and 35 g kg−1) of seawater or salt (NaCl) solutions. Seawater addition induced a short-term (2-wk) stimulation of CO2 produc-tion (20–32% greater than the freshwater control) and a continuous suppression of CH4 production (up to 94% less than freshwater). Ionic stress (represented by NaCl) did not reduce CO2 production at all but did decrease CH4 production for 2 wk in both the 14 and 35 g kg−1 NaCl treatments. Our results indicate that microbial populations rebound quickly from ionic stress. Th e intrusion of dilute seawater (3.5 g kg−1) to freshwater wetlands can accelerate organic C mineralization through the short-term increase in SO4
2−–induced respiration without inhibiting methanogenesis. Overall, the organic C mineralization rate was 17% higher for 3.5 g kg−1 seawater than the freshwater control. Th e temporary nature of the microbial response suggests that “pulses” of seawater may have a greater infl uence on the rate of C cycling in freshwater wetlands than a gradual sea level rise.
Abbreviations: MBC, microbial biomass carbon; OC, extractable organic carbon; TOC, total extractable organic carbon.

SSSAJ: Volume 75: Number 5 • September–October 2011 2001
on Climate Change, 2007). Increasing sea level will amplify the impacts of storm surges and increase the area inundated by ex-treme tidal events (Michener et al., 1997). In contrast to saline conditions caused by high evaporation rates in arid and semiarid inland soils, seawater contains a relatively uniform mixture of several salts and macro- and micronutrients (Kester et al., 1967). Of particular importance to wetland soils is the abundance of SO4
2− in seawater, which can function as an alternative electron acceptor during anaerobic microbial respiration. Sulfate concen-trations in seawater are normally between 20 and 30 mmol L−1 compared with concentrations of 0.1 to 0.2 mmol L−1 of SO4
2− observed in fresh water (Capone and Kiene, 1988).
Studies investigating the eff ect of seawater on C cycling have historically been performed along existing salinity gradients in estuaries and coastal zones or using intact soil cores to measure long-term fl uxes. In Louisiana coastal wetlands, microbial respi-ration rates are highest in freshwater wetlands, followed by salt marshes, and lowest in brackish wetlands (Nyman and DeLaune, 1991; Smith et al., 1983). Methane production rates are signifi -cantly lower in salt marshes than freshwater wetlands because the abundant SO4
2− is more energetically favorable for anaero-bic respiration than methanogenesis (Bartlett et al., 1987; King and Wiebe, 1980; Magenheimer et al., 1996). It has been found that within 12 d of 10 g kg−1 seawater addition to a freshwater tidal marsh soil in Georgia, the dominant microbial pathway switched from methanogenesis to SO4
2− reduction (Weston et al., 2006). Despite the extensive knowledge regarding competi-tion between methanogens and SO4
2−–reducing bacteria, few studies have directly addressed the mechanistic process by which salinity exposure infl uences microbial mineralization pathways and rates. Specifi cally, no studies have attempted to distinguish between the importance of ionic stress (increased conductivity) and the addition of the SO4
2− electron acceptor in altering C
mineralization rates following a saltwater pulse. Th is is impor-tant for evaluating the relevance of the trends observed in C cy-cling in agricultural saline soils (i.e., the documented decrease in the size, activity, and composition of the microbial population) and coastal soils subjected to saltwater pulses.
Th is study sought to determine the process by which salin-ity aff ects C cycling in a freshwater wetland soil. Specifi cally, is the microbial community inhibited by ionic stress or the ad-dition of SO4
2−, and what eff ect does this have on the overall rate of C cycling? Th is was done by comparing how microbial respiration, methanogenesis, and microbial population size re-sponded to diff erent concentrations of seawater (containing SO4
2−) and salt (strictly NaCl) additions. We hypothesized that potential respiration rates would be reduced by additions of both seawater and NaCl due to increased ionic stress to the microbial community, but potential methanogenesis would be reduced to a much greater extent in the seawater treatments due to competi-tion with SO4
2− reducers. We also anticipated a reduction in the size of the microbial population with increasing concentrations of both seawater and NaCl.
MATERIALS AND METHODSExperimental Design
A bulk fi eld composite peat soil sample (0–10 cm) was collected from St John’s Marsh Conservation Area (27.91833° N, −80.77389° W), a freshwater wetland dominated by an even mix of Typha spp. and Salix spp. (Fig. 1). Following return to the laboratory, the soil was ho-mogenized and approximately 15 g (wet weight) of soil was added to 70-mL glass serum bottles. Seven treatments were evaluated. Th ey consisted of seawater at concentrations of 35, 14, and 3.5 g kg−1, NaCl at concen-trations of 35, 14, and 3.5 g kg−1, and a deionized (DI) water treatment to serve as the freshwater control. Th e seawater and NaCl treatments functioned as discrete analogs of ionic stress (measured in g kg−1) while allowing isolation of the SO4
2− reduction eff ect on C mineralization. All treatments were prepared in triplicate. Fift een milliliters of a ran-domly assigned treatment solution was added to each bottle to form a soil slurry.
Th ree concentrations of seawater were made using Neomarine Reef Salt mix (Brightwell Aquatics, Elysburg, PA). Th irty-fi ve grams of salt mix was diluted in 1 L of DI water to create 35 g kg−1 seawater. Th e solution was purged with ambient air for several hours to establish the CO2/HCO3 equilibrium, and then the pH and specifi c conductivity (μS m−1) were measured. Th e seawater solution was further diluted with DI water to 14 and 3.5 g kg−1 and the pH and specifi c conductivity were again noted. Th e ionic content of the artifi cial seawater mimicked that of natural seawater without any additional nutrients or C. Sulfate was the only available electron acceptor in the seawater treatments.
Th ree concentrations of NaCl were made by diluting 35 g of crys-talline NaCl in 1 L of DI water. Th e solution was purged with ambient air for several hours to establish the CO2/HCO3 equilibrium, and then the pH and specifi c conductivity were measured. Th e NaCl solution was further diluted with DI water to 14 and 3.5 g kg−1 and the pH and spe-cifi c conductivity were again noted.
Fig. 1. Location of freshwater marsh soils collected for this manipulative laboratory experiment.
2002 SSSAJ: Volume 75: Number 5 • September–October 2011
Th e bottles were capped with butyl stoppers and aluminum crimp caps, evacuated to −75 kPa, and fl ushed with O2–free N2 gas for 1 min to create anaerobic conditions. Th e incubation bottles were then placed in the dark on a circulating shaker at 30°C. Headspace was extracted and measured on a gas chromatograph (GC 8A, Shimadzu Scientifi c Instruments, Columbia, MD) fi tted with a thermal conductivity detec-tor and fl ame ionization detector to determine the concentrations of CO2 and CH4, respectively. Headspace samples were measured aft er 1, 2, 4, and 6 d to produce a daily rate of production. All bottles were then purged with O2–free N2 gas for 1 min to prevent CO2 accumulation in the headspace, and the sampling cycle was repeated again. Th e sampling and purging sequence was repeated for 3 wk and the rates of potential CO2–C and CH4–C production were calculated with time.
Soil PropertiesBulk density was determined aft er oven drying a known volume
of subsample at 70°C until constant weight. Th e organic matter con-tent was determined using the loss-on-ignition method (Nelson and Sommers, 1996). Th ree grams of triplicate ground, dried soils were placed in a muffl e furnace at 550°C for 4 h, cooled, and reweighed. Th e percentage weight loss was calculated as the diff erence between the soil weight before and aft er ashing, multiplied by 100.
Soil pH and specifi c conductivity were measured on all samples aft er completion of the 3-wk incubation period. A 2:1 (water/soil) sus-pension was created and allowed to equilibrate for 30 min before mea-surement (Th omas, 1996; USEPA, 1982). Th e pH was measured using an Accument Research AR50 pH meter (Fisher Scientifi c, Waltham, MA) and the specifi c conductivity was measured on a Markson Model 1054 electrical conductivity meter (Amber Scientifi c, Eugene, OR).
Total extractable organic C (TOC), extractable organic C (OC), and microbial biomass C (MBC) were determined for all samples fol-lowing the 3-wk incubation period using the fumigation–extraction method of Vance et al. (1987). Th e TOC was defi ned as the extractable organic C extracted from the fumigated samples and OC was defi ned as the extractable organic C extracted from the unfumigated samples. Microbial biomass C (MBC) was determined by subtracting the extract-able C of an unfumigated sample from the corresponding fumigated sample. Duplicate 5-g (wet weight) samples were prepared in 25-mL cen-trifuge tubes. One set was fumigated with chlo-roform for 24 h and the other set served as the unfumigated control. Following the chloroform treatment, both fumigated and unfumigated samples were extracted with 25 mL of 0.5 mol L−1 K2SO4, agitated for 30 min on a circulating shaker, and centrifuged at 5000 rpm for 10 min. Th e supernatant was vacuum fi ltered through Whatman no. 42 fi lter paper and stored at 4°C until analysis for total organic C (TOC 5050A, Shimadzu Scientifi c Instruments, Columbia, MD). An extraction effi ciency coeffi cient of kEC = 0.37 was applied to all samples (Sparling et al., 1990).
Data AnalysisStatistical analysis was performed using SAS version 9.1 (SAS
Institute, Cary, NC). All data sets were fi rst tested to determine if the assumptions of homogeneity and normality were met using Levene’s test and the Shapiro–Wilk test, respectively. Where these assumptions were not met, the raw data were logarithmically transformed and fur-ther statistical analysis was conducted using the data set that fulfi lled the assumptions of homogeneity and normality. A two-way repeated measures ANOVA (α = 0.05) was used to determine the interaction between CO2 and CH4 production, treatment, and time. Signifi cant diff erences were identifi ed using the least square means post-hoc test. One-way ANOVA models (α = 0.05) were also used to identify sig-nifi cant diff erences between pH, conductivity, SO4
2− concentration, NaCl concentration, extractable C indicators, and microbial biomass. Pearson’s product correlations were performed to determine if correla-tions existed between CO2 and CH4 production and SO4
2− concentra-tion, NaCl concentration, pH, conductivity, extractable C indicators, and microbial population indicators.
RESULTSSoil Properties
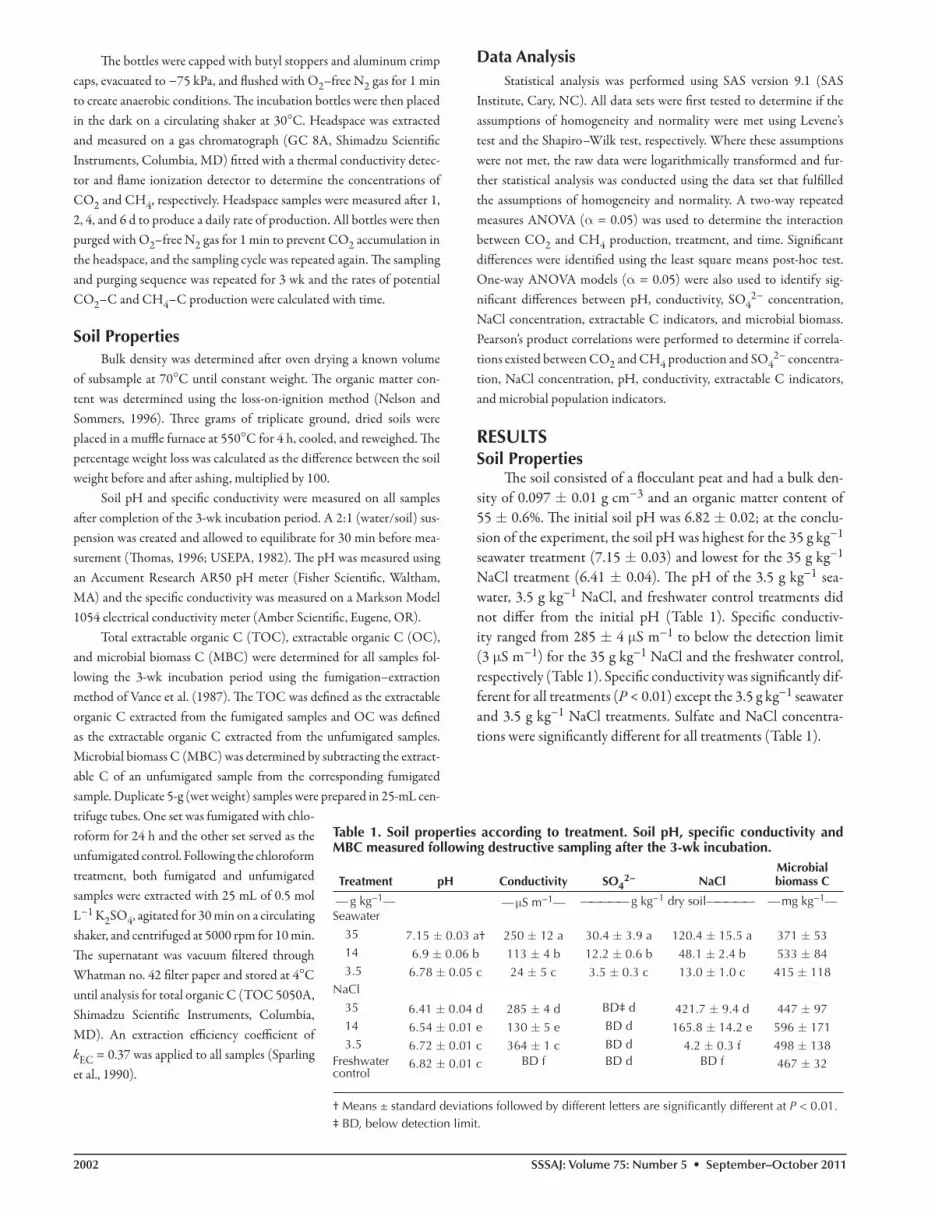
Th e soil consisted of a fl occulant peat and had a bulk den-sity of 0.097 ± 0.01 g cm−3 and an organic matter content of 55 ± 0.6%. Th e initial soil pH was 6.82 ± 0.02; at the conclu-sion of the experiment, the soil pH was highest for the 35 g kg−1 seawater treatment (7.15 ± 0.03) and lowest for the 35 g kg−1 NaCl treatment (6.41 ± 0.04). Th e pH of the 3.5 g kg−1 sea-water, 3.5 g kg−1 NaCl, and freshwater control treatments did not diff er from the initial pH (Table 1). Specifi c conductiv-ity ranged from 285 ± 4 μS m−1 to below the detection limit (3 μS m−1) for the 35 g kg−1 NaCl and the freshwater control, respectively (Table 1). Specifi c conductivity was signifi cantly dif-ferent for all treatments (P < 0.01) except the 3.5 g kg−1 seawater and 3.5 g kg−1 NaCl treatments. Sulfate and NaCl concentra-tions were signifi cantly diff erent for all treatments (Table 1).
Table 1. Soil properties according to treatment. Soil pH, specifi c conductivity and MBC measured following destructive sampling after the 3-wk incubation.
Treatment pH Conductivity SO42− NaCl
Microbial biomass C
— g kg−1— —μS m−1— ————— g kg−1 dry soil————— — mg kg−1—Seawater
35 7.15 ± 0.03 a† 250 ± 12 a 30.4 ± 3.9 a 120.4 ± 15.5 a 371 ± 53 14 6.9 ± 0.06 b 113 ± 4 b 12.2 ± 0.6 b 48.1 ± 2.4 b 533 ± 84 3.5 6.78 ± 0.05 c 24 ± 5 c 3.5 ± 0.3 c 13.0 ± 1.0 c 415 ± 118NaCl
35 6.41 ± 0.04 d 285 ± 4 d BD‡ d 421.7 ± 9.4 d 447 ± 97 14 6.54 ± 0.01 e 130 ± 5 e BD d 165.8 ± 14.2 e 596 ± 171 3.5 6.72 ± 0.01 c 364 ± 1 c BD d 4.2 ± 0.3 f 498 ± 138Freshwater control
6.82 ± 0.01 c BD f BD d BD f 467 ± 32
† Means ± standard deviations followed by different letters are signifi cantly different at P < 0.01.‡ BD, below detection limit.

SSSAJ: Volume 75: Number 5 • September–October 2011 2003
Potential Microbial Respiration
Th e rate of potential CO2 production was signifi cantly high-er in the 35 and 14 g kg−1 seawater treatments than the freshwater control and NaCl treatments during Week 1 (P < 0.01) but did not diff er signifi cantly during Weeks 2 and 3 (Fig. 2). Th ere were no signifi cant diff erences in the CO2 production rate between the NaCl treatments throughout the entire study. Considering all the treatments, time was a signifi cant factor for CO2 production (P < 0.001) as well as the time × treatment interaction (P < 0.001). Signifi cantly greater rates of microbial respiration occurred dur-ing Week 1 than Weeks 2 and 3 for all treatments (Fig. 2). Th e contribution of SO4
2− reduction to respiration decreased with time, however, as seen by the diff erence in CO2 production be-tween the seawater treatments and the freshwater control. During
Week 1, it can be estimated that 44% of anaerobic respiration was mediated by SO4
2− reduction, while SO42− reduction accounted
for 21 and 15% of respiration during Weeks 2 and 3, respectively.Th e total amount of CO2 produced during the 3-wk incu-
bation period was signifi cantly greater (P < 0.01) for all the sea-water treatments than the freshwater control (Fig. 3). Total CO2 production was 32% higher in the 35 g kg−1 seawater treatment than the freshwater control, 29% higher in the 14 g kg−1 seawater treatment, and 20% higher in the 3.5 g kg−1 seawater treatment. Total CO2 produced by the NaCl treatments did not diff er from the freshwater control (Fig. 3).
Th e variables that correlated with CO2 production diff ered between the seawater and NaCl treatments. Seawater respiration rates were positively correlated (P < 0.01) with indicators of ex-tractable C (TOC and OC) (Table 2). Respiration in the NaCl treatments was positively correlated with pH and negatively cor-related with conductivity and OC (P < 0.01) (Table 2).
Potential MethanogenesisTh e rate of potential CH4 production was signifi cantly low-
er (P < 0.001) for the 35 and 14 g kg−1 seawater treatments than the 3.5 g kg−1 seawater treatment and the freshwater control for all 3 wk (Fig. 4). Th e 35 and 14 g kg−1 NaCl treatments also had a signifi cantly lower rate of CH4 production during Weeks 1 and 2 than the 3.5 g kg−1 NaCl treatment and the freshwater control but did not diff er signifi cantly during Week 3 (Fig. 4). Time was not a signifi cant factor for the CH4 production rate.
Th e total amount of CH4 produced during the 3-wk incuba-tion period was signifi cantly less for the 35 and 14 g kg−1 seawater and NaCl treatments than the freshwater control (Fig. 5). Total CH4 production was 94 and 79% lower in the 35 and 14 g kg−1 seawater treatments, respectively, than the freshwater control. Total methane production was reduced by 55 and 23% in the 35 and 14 g kg−1 NaCl treatment, respectively, compared with the freshwater control (Fig. 5). Neither the seawater nor the 3.5 g kg−1 NaCl treat-ments diff ered from the freshwater control in CH4 production.
In contrast to respiration, CH4 production in the seawater treatments was not correlated with indicators of extractable C but
Fig. 2. Anaerobic microbial respiration rate by treatment during the 3-wk incubation period. Error bars represent standard deviations; n = 3 for all treatments; different letters indicate signifi cant differences at P < 0.01.
Fig. 3. Mean total anaerobic CO2 produced during the 3-wk incubation period by treatment and concentration. Horizontal lines represent the mean (solid line) and standard deviation (dotted lines) of total production by the freshwater control. Percentages represent differences in mean total production compared with the freshwater control (P < 0.05). Error bars represent standard deviations; NS = not signifi cant; n = 3 for all treatments.
Table 2. Pearson’s product correlation coeffi cients (r) for the correlation of anaerobic respiration and methanogenesis rates with soil parameters; for all values, n = 9 and df = 7.
Parameter TreatmentCO2
productionCH4
production
pHseawater NS −0.75*NaCl 0.84** 0.94**
Conductivityseawater NS −0.81**
NaCl −0.90** −0.96**
Total extractable organic C (fumigated samples)
seawater 0.76* NS
NaCl NS −0.72*
Extractable organic C (unfumigated samples)
seawater 0.85** NS
NaCl −0.82** −0.93**
Microbial biomass Cseawater NS NSNaCl NS NS
* At r = 0.67, P = 0.05; NS = not signifi cant.** At r = 0.80, P = 0.01.

2004 SSSAJ: Volume 75: Number 5 • September–October 2011
did show a signifi cant negative correlation with pH and conduc-tivity (Table 2). Th e NaCl treatments showed a signifi cant positive correlation with pH and a negative correlation with conductivity (P < 0.01) (Table 2). Th e negative correlation between NaCl and OC suggests methanogens were not C limited (Table 2).
Sulfate vs. Sodium ChlorideSulfate (i.e., seawater treatments) and NaCl additions had
signifi cantly diff erent eff ects on potential respiration, potential methanogenesis, and other variables of interest. Sulfate in high concentrations produced a short-term increase in microbial res-piration (Fig. 2). Th is relationship between SO4
2− and CO2 was also observed as a signifi cant positive correlation between these variables (r = 0.64, P < 0.01) (Table 3). In contrast, methano-genesis decreased as the SO4
2− concentration increased (Fig. 4). A signifi cant negative correlation existed between CH4 and SO4
2− concentration (r = −0.80, P < 0.01) (Table 3). Sulfate also showed a strong (P < 0.01) positive correlation with the CO2/CH4 production ratio and pH (Table 3). Th e CO2/CH4 ratio was similar for all NaCl treatments, the 3.5 g kg−1 seawater treatment, and the freshwater control (2.0 ± 0.5), but signifi -cantly higher for the 14 g kg−1 seawater (11.2 ± 1.4) and 35 g kg−1 seawater (43.3 ± 4.0) treatments.
Th e NaCl addition had no eff ect on potential respiration (Fig. 2) nor was there a correlation between NaCl concentration and respiration (Table 3). Th e eff ect of the NaCl addition on methanogenesis was slightly greater than on respiration, with the 35 and 14 g kg−1 NaCl treatments reducing CH4 production for 2 wk (Fig. 4). Sodium chloride concentrations >13 mg L−1 may negatively impact methanogenesis but concentrations below this (as seen in the 3.5 g kg−1 seawater and NaCl treatments) were
not correlated with methanogenesis (Table 3). Th e main eff ect of NaCl was a signifi cant increase in conductivity, TOC, OC, and pH (Tables 1 and 3).
DISCUSSIONHigh concentrations of seawater (14 and 35 g kg−1) caused
a signifi cant increase in pH, while high concentrations of NaCl (14 and 35 g kg−1) decreased pH (Table 1). Th e increase in pH caused by seawater was probably a result of the high CaCO3 content of the seawater mix and a product of SO4
2− reduction, while strictly NaCl additions may have displaced H+ ions from the cation exchange complex and caused the pH to decrease. A similar displacement of NH4
+ ions from sediments by NaCl has been observed (Baldwin et al., 2006) and is further supported by the strong negative correlation between pH and NaCl con-centration in this study (Table 3). While it is unlikely that this near-neutral range in pH between treatments (6.4–7.2) could have caused microbial inhibition, it is an interesting side eff ect of salinization that could select for specifi c microbial species in
Fig. 4. Methanogenesis rate by treatment during the 3-wk incubation period. Error bars represent standard deviations; n = 3 for all treatments; different letters indicate signifi cant differences at P < 0.01 for Week 1, P < 0.05 for Weeks 2 and 3.
Fig. 5. Mean total CH4 produced during the 3-wk incubation period by treatment and concentration. Horizontal lines represent the mean (solid line) and standard deviation (dotted lines) of total production by the freshwater control. Percentages represent differences in mean total production compared with the freshwater control (P < 0.05). Error bars represent standard deviations; NS = not signifi cant; n = 3 for all treatments.
Table 3. Pearson’s product correlation coeffi cients (r) for the correlation of treatment water properties with soil param-eters; for all values, n = 21 and df = 19.
Parameter SO42− NaCl Conductivity pH
——— g kg−1——— — μS m−1—
CO2 production 0.64** NS NS 0.71**
CH4 production −0.80** NS −6.1** NS
CO2/CH4 production ratio
0.97** NS 5.4* 0.76**
Conductivity 0.48* 0.83** – NS
pH 0.82** −0.59** NS –
Total extractable organic C (fumigated samples)
NS 0.69** 5.4* NS
Extractable organic C (unfumigated samples)
NS 0.84** 8.2** NS
* At r = 0.44, P = 0.05; NS = not signifi cant.** At r = 0.55, P = 0.01.
SSSAJ: Volume 75: Number 5 • September–October 2011 2005
the long term. Specifi c conductivity signifi cantly increased in all 14 and 35 g kg−1 treatments (Table 1) but did not mirror the conductivity of the added solution due to a dilution eff ect by the soil pore water. Conductivity was most strongly correlated with NaCl concentration (Table 3).
Potential Microbial RespirationIn general, seawater additions had a stimulatory eff ect on
the potential CO2 production rate (Fig. 2), and the total amount of CO2 produced was directly related to the concentration of seawater added (Fig. 3). During the 3-wk incubation, the total CO2 production was 32% higher in the 35 g kg−1 seawater treat-ment, 29% higher in the 14 g kg−1 seawater treatment, and 20% higher in the 3.5 g kg−1 seawater treatment than the freshwater control. Th e stimulation of the respiration rate was short lived, however; all seawater treatments returned to a CO2 production rate similar to the freshwater control by Week 3 (Fig. 2). Th e dif-ference in the magnitude of the increase in CO2 production in the seawater treatments can be attributed to the increased avail-ability of SO4
2− to serve as a terminal electron acceptor in an-aerobic microbial respiration. Using the theoretical relationship of 1 mol SO4
2−/2 mol CO2,
26 2 6 4 2 2 2C H O 3SO 6H 3H S 6CO 6H O- ++ + = + + [1]
indicates that only ?20% of the SO42− added was reduced.
Th erefore, SO42− depletion was also not responsible for the de-
cline in activity over time in the seawater treatments.All of the treatments produced signifi cantly more CO2 in
the fi rst week than in Weeks 2 and 3 (Fig. 2). Th is could be a limi-tation of the experimental design. Because CO2 measurements were taken from a closed system with a fi nite supply of bioavail-able C, with time the substrate limitation would have surpassed the alternative electron acceptor availability in regulating the rate of microbial activity. Th e agitation of the soil slurry may have ex-aggerated the initial pulse of available electron donors by releas-ing C compounds previously protected within soil aggregates. Regardless, because all incubations were composed of replicate soil substrate, the diff erence in response among treatments can be attributed to the concentration of SO4
2− electron acceptors.Th e positive correlation between CO2 production and indi-
cators of extractable C (P < 0.05) supports the hypothesis of a C limitation. A signifi cant decrease in the C fl ux rate with time has also been observed in studies of intact soil cores, with the decline in CO2 and CH4 production attributed to progressive C limita-tion (Weston et al., 2011).
Previous work has indicated that the percentage of micro-bial respiration mediated by SO4
2− reduction increases as total respiration increases (Howarth, 1984). Th e present study also found a logarithmic increase in the percentage of respiration at-tributed to SO4
2− reduction as the respiration rate increased. When respiration rates were highest (Week 1), 44% of respira-tion was mediated by SO4
2− reducers, and when respiration was low (Week 3), only 15% of respiration was mediated by SO4
2−
reducers. Th is was owing to the assumption that SO42− was the
only alternative electron acceptor present in the seawater that was not present in the freshwater control or NaCl treatments and the fact that the soils were maintained under anaerobic con-ditions from the time of collection to the conclusion of the study.
In contrast to the seawater, NaCl addition had no eff ect on CO2 production (Fig. 2). Because NaCl does not function as an electron carrier the way SO4
2− does, we can conclude that ionic stress alone does not aff ect microbial community respiration. Th ese fi ndings, however, do not address whether the microbial community structure or diversity was altered by the NaCl ad-dition. Baldwin et al. (2006) performed a detailed analysis of microbial community structure using phospholipid fatty acid biomarkers and discovered that NaCl >50 μS m−1 decreased the microbial diversity but did not alter the microbial biomass. No signifi cant diff erences in MBC among the NaCl treatments were identifi ed in the present study either (Table 1). Our fi ndings sug-gest that the tolerance of anaerobic microbes to ionic stress may be higher than initially anticipated, and the microbial commu-nity may have the ability to adapt to increased ionic stress within the period of 1 wk (Fig. 2). Th e high species richness of fresh-water sediments is believed to allow the community to switch biochemical pathways in a matter of days (Edmonds et al., 2009).
Potential MethanogenesisSulfate reduction is thermodynamically preferred over meth-
anogenesis because of the higher net energy yield for obligate an-aerobes (Capone and Kiene, 1988). Th e higher concentrations of SO4
2− in seawater led to the hypothesis that CH4 production would be lower in seawater wetlands than freshwater wetlands. Th is has been confi rmed by numerous studies (e.g., Abril and Iversen, 2002; Purvaja and Ramesh, 2001; Reeburgh and Heggie, 1977). Some research, however, has found that maximum CH4 emissions occur at intermediate salinities (Bartlett et al., 1987; Sotomayor et al., 1994) and may still be substantial in saltwater wetlands with high C inputs (Biswas et al., 2007; Purvaja and Ramesh, 2001).
By comparing the repression of CH4 in seawater and NaCl treatments, this study was able to diff erentiate between the ef-fect of SO4
2− competition and ionic stress on methanogenic microbes. A low concentration (3.5 g kg−1) of seawater or NaCl did not aff ect CH4 production (Fig. 4). Seawater additions of 14 g kg−1 and above did signifi cantly, and persistently, reduce methanogenesis (Fig. 4). Other work has proposed that a salinity of ≥13 g kg−1 is required to alter CH4 fl ux (Bartlett et al., 1987). Total CH4 production in this study was 94 and 79% lower in the 35 g kg−1 and 14 g kg−1 seawater treatments, respectively, than the freshwater control. A strong negative correlation (P < 0.01) between the SO4
2− concentration and CH4 production (Table 3) suggests that SO4
2− reduction replaced methanogenesis as the main form of anaerobic respiration. Th e increase in CO2 can-not be directly calculated from the decrease in CH4, however, because of the use of competitive and noncompetitive substrates between the two groups of anaerobes (Capone and Kiene, 1988).
2006 SSSAJ: Volume 75: Number 5 • September–October 2011
An inverse correlation between conductivity and CH4 produc-tion was found previously by Magenheimer et al. (1996).
Sodium chloride decreased CH4 production but to a lesser extent than the seawater did (Fig. 4). Overall, the 35 g kg−1 NaCl reduced CH4 production by 55% and 14 g kg−1 NaCl reduced CH4 production by 23% relative to the freshwater control. Th is repression of methanogenesis by NaCl is slightly less than found by Baldwin et al. (2006), where as little as 10 μS m−1 decreased CH4 production by 30% during approximately 1 mo.
Although the soil slurry design used in this study limits the interpretation of the CH4 fl ux rates to an estimation of potential methanogenesis, it does provide evidence for a diff erential sensi-tivity of methanogens to salt. Th e fact that the decline in CH4 production was not directly correlated with the increase in CO2 production suggests that heterotrophic methanogens, rather than autotrophic (CO2 or H2 using) methanogens, dominate in this soil and were most strongly aff ected by salt additions. Other work has suggested that high concentrations of NaCl will inhibit acetoclastic (heterotrophic) methanogens (Baldwin et al., 2006), which may have driven the short-term decrease in CH4 produc-tion in the 35 and 14 g kg−1 NaCl treatments (Fig. 4).
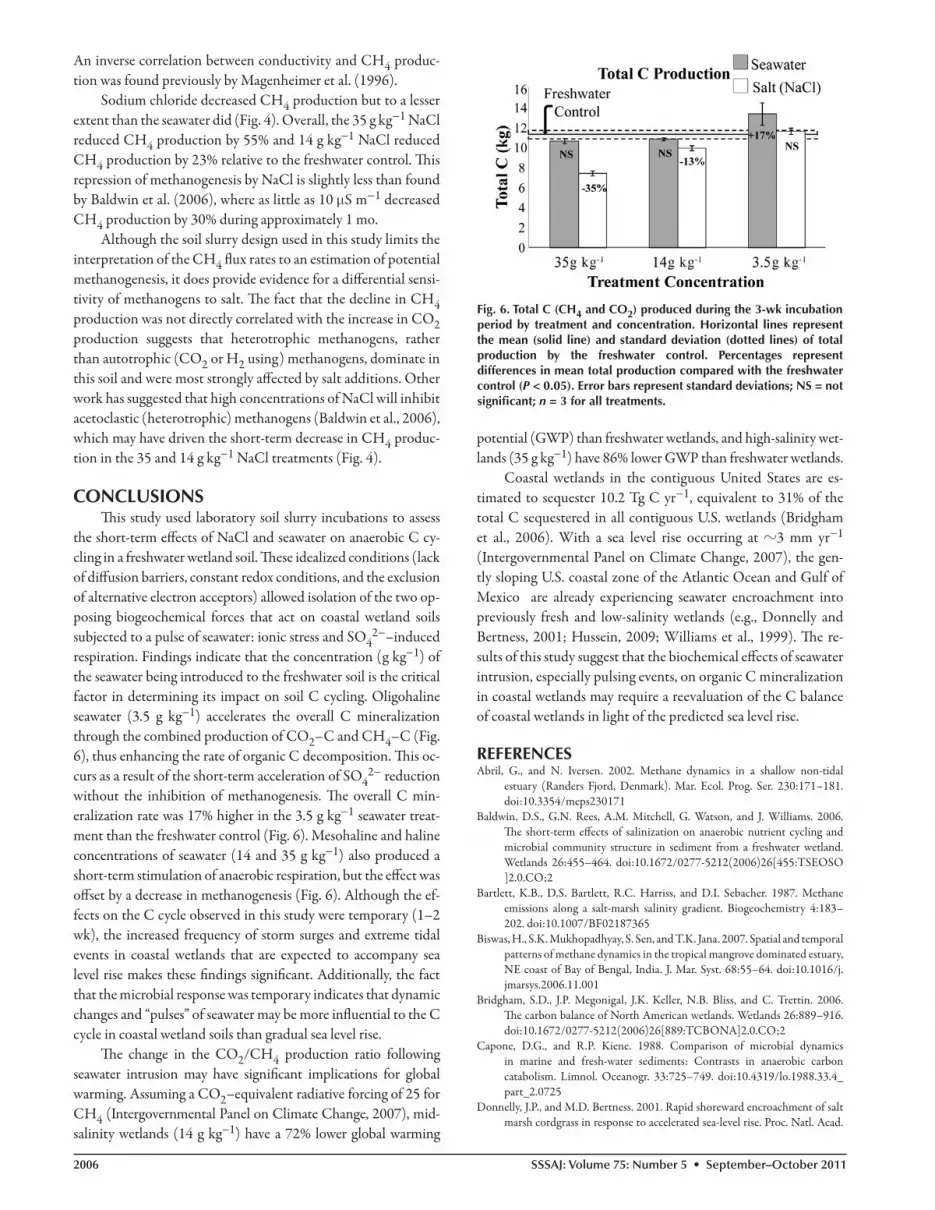
CONCLUSIONSTh is study used laboratory soil slurry incubations to assess
the short-term eff ects of NaCl and seawater on anaerobic C cy-cling in a freshwater wetland soil. Th ese idealized conditions (lack of diff usion barriers, constant redox conditions, and the exclusion of alternative electron acceptors) allowed isolation of the two op-posing biogeochemical forces that act on coastal wetland soils subjected to a pulse of seawater: ionic stress and SO4
2−–induced respiration. Findings indicate that the concentration (g kg−1) of the seawater being introduced to the freshwater soil is the critical factor in determining its impact on soil C cycling. Oligohaline seawater (3.5 g kg−1) accelerates the overall C mineralization through the combined production of CO2–C and CH4–C (Fig. 6), thus enhancing the rate of organic C decomposition. Th is oc-curs as a result of the short-term acceleration of SO4
2− reduction without the inhibition of methanogenesis. Th e overall C min-eralization rate was 17% higher in the 3.5 g kg−1 seawater treat-ment than the freshwater control (Fig. 6). Mesohaline and haline concentrations of seawater (14 and 35 g kg−1) also produced a short-term stimulation of anaerobic respiration, but the eff ect was off set by a decrease in methanogenesis (Fig. 6). Although the ef-fects on the C cycle observed in this study were temporary (1–2 wk), the increased frequency of storm surges and extreme tidal events in coastal wetlands that are expected to accompany sea level rise makes these fi ndings signifi cant. Additionally, the fact that the microbial response was temporary indicates that dynamic changes and “pulses” of seawater may be more infl uential to the C cycle in coastal wetland soils than gradual sea level rise.
Th e change in the CO2/CH4 production ratio following seawater intrusion may have signifi cant implications for global warming. Assuming a CO2–equivalent radiative forcing of 25 for CH4 (Intergovernmental Panel on Climate Change, 2007), mid-salinity wetlands (14 g kg−1) have a 72% lower global warming
potential (GWP) than freshwater wetlands, and high-salinity wet-lands (35 g kg−1) have 86% lower GWP than freshwater wetlands.
Coastal wetlands in the contiguous United States are es-timated to sequester 10.2 Tg C yr−1, equivalent to 31% of the total C sequestered in all contiguous U.S. wetlands (Bridgham et al., 2006). With a sea level rise occurring at ?3 mm yr−1 (Intergovernmental Panel on Climate Change, 2007), the gen-tly sloping U.S. coastal zone of the Atlantic Ocean and Gulf of Mexico are already experiencing seawater encroachment into previously fresh and low-salinity wetlands (e.g., Donnelly and Bertness, 2001; Hussein, 2009; Williams et al., 1999). Th e re-sults of this study suggest that the biochemical eff ects of seawater intrusion, especially pulsing events, on organic C mineralization in coastal wetlands may require a reevaluation of the C balance of coastal wetlands in light of the predicted sea level rise.
REFERENCESAbril, G., and N. Iversen. 2002. Methane dynamics in a shallow non-tidal
estuary (Randers Fjord, Denmark). Mar. Ecol. Prog. Ser. 230:171–181. doi:10.3354/meps230171
Baldwin, D.S., G.N. Rees, A.M. Mitchell, G. Watson, and J. Williams. 2006. Th e short-term eff ects of salinization on anaerobic nutrient cycling and microbial community structure in sediment from a freshwater wetland. Wetlands 26:455–464. doi:10.1672/0277-5212(2006)26[455:TSEOSO]2.0.CO;2
Bartlett, K.B., D.S. Bartlett, R.C. Harriss, and D.I. Sebacher. 1987. Methane emissions along a salt-marsh salinity gradient. Biogeochemistry 4:183–202. doi:10.1007/BF02187365
Biswas, H., S.K. Mukhopadhyay, S. Sen, and T.K. Jana. 2007. Spatial and temporal patterns of methane dynamics in the tropical mangrove dominated estuary, NE coast of Bay of Bengal, India. J. Mar. Syst. 68:55–64. doi:10.1016/j.jmarsys.2006.11.001
Bridgham, S.D., J.P. Megonigal, J.K. Keller, N.B. Bliss, and C. Trettin. 2006. Th e carbon balance of North American wetlands. Wetlands 26:889–916. doi:10.1672/0277-5212(2006)26[889:TCBONA]2.0.CO;2
Capone, D.G., and R.P. Kiene. 1988. Comparison of microbial dynamics in marine and fresh-water sediments: Contrasts in anaerobic carbon catabolism. Limnol. Oceanogr. 33:725–749. doi:10.4319/lo.1988.33.4_part_2.0725
Donnelly, J.P., and M.D. Bertness. 2001. Rapid shoreward encroachment of salt marsh cordgrass in response to accelerated sea-level rise. Proc. Natl. Acad.
Fig. 6. Total C (CH4 and CO2) produced during the 3-wk incubation period by treatment and concentration. Horizontal lines represent the mean (solid line) and standard deviation (dotted lines) of total production by the freshwater control. Percentages represent differences in mean total production compared with the freshwater control (P < 0.05). Error bars represent standard deviations; NS = not signifi cant; n = 3 for all treatments.

SSSAJ: Volume 75: Number 5 • September–October 2011 2007
Sci. 98:14218–14223. doi:10.1073/pnas.251209298Edmonds, J.W., N.B. Weston, S.B. Joye, X. Mou, and M.A. Moran. 2009.
Microbial community response to seawater amendment in low-salinity tidal sediments. Microbiol. Aquat. Syst. 58:558–568.
Frankenberger, W.T., and F.T. Bingham. 1982. Infl uence of salinity on soil enzyme activities. Soil Sci. Soc. Am. J. 46:1173–1177. doi:10.2136/sssaj1982.03615995004600060011x
Gennari, M., C. Abbate, V. La Porta, A. Baglieri, and A. Cignetti. 2007. Microbial response to Na2SO4 additions in a volcanic soil. Arid Land Res. Manage. 21:211–227. doi:10.1080/15324980701428732
Howarth, R.W. 1984. Th e ecological signifi cance of sulfur in the energy dynamics of salt marsh and coastal marine sediments. Biogeochemistry 1:5–27. doi:10.1007/BF02181118
Hussein, A.H. 2009. Modeling of sea-level rise and deforestation in submerging coastal Ultisols of Chesapeake Bay. Soil Sci. Soc. Am. J. 73:185–196. doi:10.2136/sssaj2006.0436
Intergovernmental Panel on Climate Change. 2007. Climate change 2007: A synthesis report. Cambridge Univ. Press, Cambridge, UK.
Kester, D.R., I.W. Duedall, D.N. Connors, and R.M. Pytkowic. 1967. Preparation of artifi cial seawater. Limnol. Oceanogr. 12:176–178.
King, G.M., and W.J. Wiebe. 1980. Regulation of sulfate concentrations and methanogenesis in salt marsh soils. Estuar. Coast. Mar. Sci. 10:215–223. doi:10.1016/S0302-3524(80)80059-4
Magenheimer, J.F., T.R. Moore, G.L. Chmura, and R.J. Daoust. 1996. Methane and carbon dioxide fl ux from a macrotidal salt marsh, Bay of Fundy, New Brunswick. Estuaries 19:139–145. doi:10.2307/1352658
Michener, W.K., E.R. Blood, K.L. Bildstein, M.M. Brinson, and L.R. Gardner. 1997. Climate change, hurricanes and tropical storms, and rising sea level in coastal wetlands. Ecol. Appl. 7:770–801. doi:10.1890/1051-0761(1997)007[0770:CCHATS]2.0.CO;2
Muhammad, S., T. Muller, and R.G. Joergensen. 2006. Decomposition of pea and maize straw in Pakistani soils along a gradient in salinity. Biol. Fertil. Soils 43:93–101. doi:10.1007/s00374-005-0068-z
Nelson, M.L., and L.E. Sommers. 1996. Total carbon, organic carbon, and organic matter: Loss-on-ignition method. p. 1004–1005. In D.L. Sparks (ed.) Methods of soil analysis. Part 3. Chemical methods. SSSA Book Ser. 5. SSSA, Madison, WI.
Nyman, J.A., and R.D. DeLaune. 1991. CO2 emission and soil Eh responses to diff erent hydrological conditions in fresh, brackish, and saline marsh soils. Limnol. Oceanogr. 36:1406–1414. doi:10.4319/lo.1991.36.7.1406
Pathak, H., and D.L.N. Rao. 1998. Carbon and nitrogen mineralization from added organic matter in saline and alkali soils. Soil Biol. Biochem. 30:695–702. doi:10.1016/S0038-0717(97)00208-3
Pattnaik, P., S.R. Mishra, K. Bharati, S.R. Mohanty, N. Sethunathan, and T.K. Adhya. 2000. Infl uence of salinity on methanogenesis and associated microfl ora in tropical rice soils. Microbiol. Res. 155:215–220.
Purvaja, R., and R. Ramesh. 2001. Natural and anthropogenic methane emission from coastal wetlands of South India. Environ. Manage. 27:547–557. doi:10.1007/s002670010169
Reeburgh, W.S., and D.T. Heggie. 1977. Microbial methane consumption reactions and their eff ects on methane distributions in freshwater and marine environments. Limnol. Oceanogr. 22:1–9. doi:10.4319/lo.1977.22.1.0001
Sangiorgio, F., A. Basset, M. Pinna, L. Sabetta, M. Abbiati, M. Ponti, et al. 2008. Environmental factors aff ecting Phragmites australis litter decomposition in Mediterranean and Black Sea transitional waters. Aquat. Conserv. Mar. Freshwater Ecosyst. 18:S16–S26. doi:10.1002/aqc.955
Smith, C.J., R.D. DeLaune, and W.H. Patrick, Jr. 1983. Carbon dioxide emission and carbon accumulation in coastal wetlands. Estuarine Coastal Shelf Sci. 17:21–29. doi:10.1016/0272-7714(83)90042-2
Sotomayor, D., J.E. Corredor, and J.M. Morell. 1994. Methane fl ux from mangrove sediments along the southwestern coast of Puerto Rico. Estuaries 17:140–147. doi:10.2307/1352563
Sparling, G.P., C.W. Feltham, J. Reynolds, A.W. West, and P. Singleton. 1990. Estimation of soil microbial C by a fumigation–extraction method: Use on soils of high organic matter content, and a reassessment of the kEC factor. Soil Biol. Biochem. 22:301–307. doi:10.1016/0038-0717(90)90104-8
Th omas, G.W. 1996. Soil pH and soil acidity. p. 475–490. In D.L. Sparks (ed.) Methods of soil analysis. Part 3. Chemical methods. SSSA Book Ser. 5. SSSA, Madison, WI.
USEPA. 1982. Method 120.1: Conductance by conductivity meter. In Methods for the chemical analysis of water and wastes. EPA/600/4-79/020. USEPA Environ. Monitoring Syst. Lab., Cincinnati, OH.
Vance, E.D., P.C. Brookes, and D.S. Jenkinson. 1987. An extraction method for measuring soil microbial biomass C. Soil Biol. Biochem. 19:703–707. doi:10.1016/0038-0717(87)90052-6
Weston, N.B., R.E. Dixon, and S.B. Joye. 2006. Ramifi cations of increased salinity in tidal freshwater sediments: Geochemistry and microbial pathways of organic matter mineralization. J. Geophys. Res. 111:G01009. doi:10.1029/2005JG000071
Weston, N.B., M.A. Vile, S.C. Neubauer, and D.J. Velinsky. 2011. Accelerated microbial organic matter mineralization following salt-water intrusion into tidal freshwater marsh soils. Biogeochemistry 102:135–151. doi:10.1007/s10533-010-9427-4
Wetzel, R.G. 2001. Limnology: Lake and river ecosystems. Academic Press, San Diego.
Williams, K., K.C. Ewel, R.P. Stumpf, F.E. Putz, and T.W. Workman. 1999. Sea-level rise and coastal forest retreat on the west coast of Florida, USA. Ecology 80:2045–2063. doi:10.1890/0012-9658(1999)080[2045:SLRACF]2.0.CO;2
Wong, V.N.L., R.C. Dalal, and R.S.B. Greene. 2008. Salinity and sodicity eff ects on respiration and microbial biomass of soil. Biol. Fertil. Soils 44:943–953. doi:10.1007/s00374-008-0279-1
Related Documents