U.S. Energy Information Administration / Short-Term Energy Outlook—January 2010 1 January 2010 Short-Term Energy Outlook January 12, 2010 Release Highlights This edition of the Short-Term Energy Outlook is the first to include monthly forecasts through December 2011. EIA expects that the price of West Texas Intermediate (WTI) crude oil, which averaged $62 per barrel in 2009, will average about $80 and $84 per barrel in 2010 and 2011, respectively. EIA’s forecast assumes that U.S. real gross domestic product (GDP) grows by 2.0 percent in 2010 and by 2.7 percent in 2011, while world oil-consumption-weighted real GDP grows by 2.5 percent and 3.7 percent in 2010 and 2011, respectively. Escalating crude oil prices drive the annual average regular-grade gasoline retail price from $2.35 per gallon in 2009 to $2.84 in 2010 and $2.96 in 2011. Pump prices are likely to pass $3 per gallon at some point during the upcoming spring and summer. Projected annual average diesel fuel retail prices are $2.98 and $3.14 per gallon, respectively, in 2010 and 2011. EIA expects the annual average natural gas Henry Hub spot price for 2010 to be $5.36 per thousand cubic feet (Mcf), a $1.30-per-Mcf increase over the 2009 average of $4.06 per Mcf. The price will continue to increase in 2011, averaging $6.12 per Mcf for the year. The annual average residential electricity price changes slightly over the forecast period, falling from 11.6 cents per kilowatthour (kWh) in 2009 to 11.5 cents in 2010, and then rising to 11.7 cents per kWh in 2011. Projected carbon dioxide (CO2) emissions from fossil fuels, which declined by 6.1 percent in 2009, increase by 1.5 percent and 1.7 percent in 2010 and 2011, respectively, as economic recovery contributes to an increase in energy consumption.

Welcome message from author
This document is posted to help you gain knowledge. Please leave a comment to let me know what you think about it! Share it to your friends and learn new things together.
Transcript
U.S. Energy Information Administration / Short-Term Energy Outlook—January 2010
1
January 2010
Short-Term Energy Outlook January 12, 2010 Release
Highlights
� This edition of the Short-Term Energy Outlook is the first to include monthly
forecasts through December 2011.
� EIA expects that the price of West Texas Intermediate (WTI) crude oil, which
averaged $62 per barrel in 2009, will average about $80 and $84 per barrel in
2010 and 2011, respectively. EIA’s forecast assumes that U.S. real gross
domestic product (GDP) grows by 2.0 percent in 2010 and by 2.7 percent in
2011, while world oil-consumption-weighted real GDP grows by 2.5 percent
and 3.7 percent in 2010 and 2011, respectively.
� Escalating crude oil prices drive the annual average regular-grade gasoline
retail price from $2.35 per gallon in 2009 to $2.84 in 2010 and $2.96 in 2011.
Pump prices are likely to pass $3 per gallon at some point during the upcoming
spring and summer. Projected annual average diesel fuel retail prices are $2.98
and $3.14 per gallon, respectively, in 2010 and 2011.
� EIA expects the annual average natural gas Henry Hub spot price for 2010 to be
$5.36 per thousand cubic feet (Mcf), a $1.30-per-Mcf increase over the 2009
average of $4.06 per Mcf. The price will continue to increase in 2011, averaging
$6.12 per Mcf for the year.
� The annual average residential electricity price changes slightly over the
forecast period, falling from 11.6 cents per kilowatthour (kWh) in 2009 to 11.5
cents in 2010, and then rising to 11.7 cents per kWh in 2011.
� Projected carbon dioxide (CO2) emissions from fossil fuels, which declined by
6.1 percent in 2009, increase by 1.5 percent and 1.7 percent in 2010 and 2011,
respectively, as economic recovery contributes to an increase in energy
consumption.
U.S. Energy Information Administration / Short-Term Energy Outlook—January 2010
2
Global Crude Oil and Liquid Fuels
Global Crude Oil and Liquid Fuels Overview. The world oil market should gradually
tighten in 2010 and 2011, provided the global economic recovery continues as
projected. While countries outside of the Organization for Economic Cooperation and
Development (OECD) will lead 2010 demand recovery, OECD countries should begin
to show significant oil demand growth in 2011 in response to improving economic
conditions. Projected economic growth in the OECD more than doubles from 1.2
percent in 2010 to 2.7 percent in 2011.
Although compliance with cuts announced by the Organization of the Petroleum
Exporting Countries (OPEC) has weakened and global oil inventories and spare
production capacity remain very high by historical standards, expectations of a
continued global economic turnaround have continued to buttress oil markets. EIA
expects that WTI prices, which have been trending upward since February 2009, will
continue to increase in 2010 and 2011.
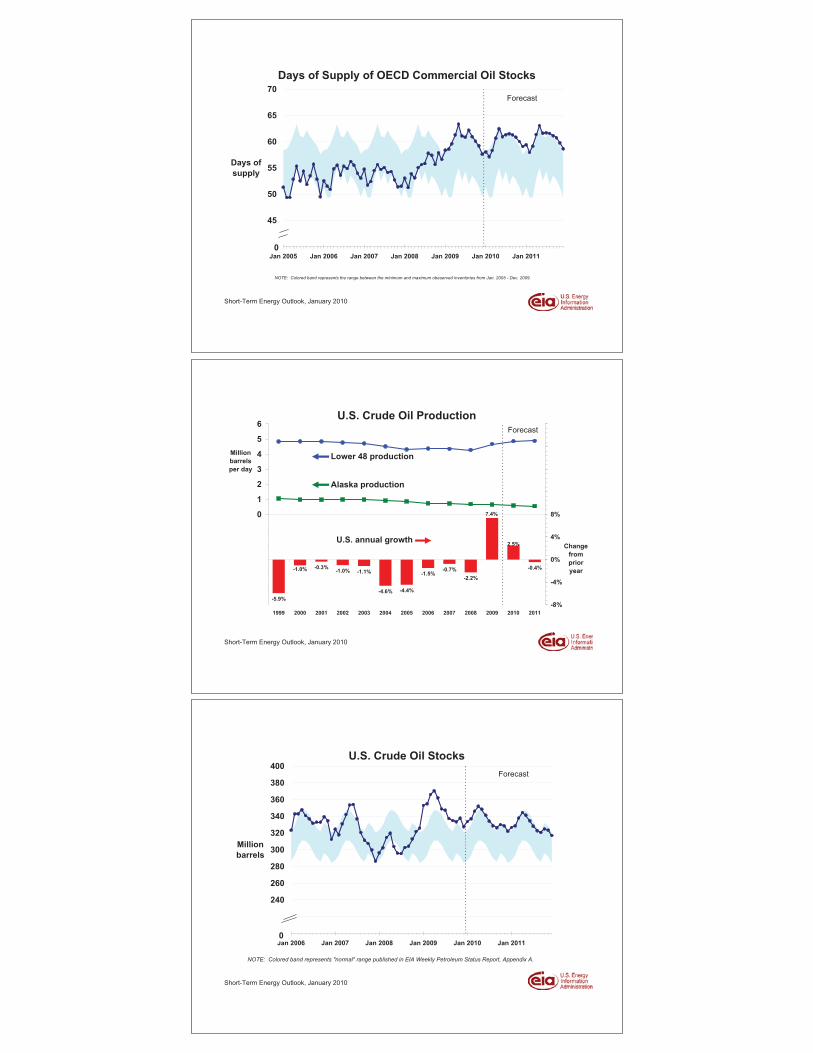
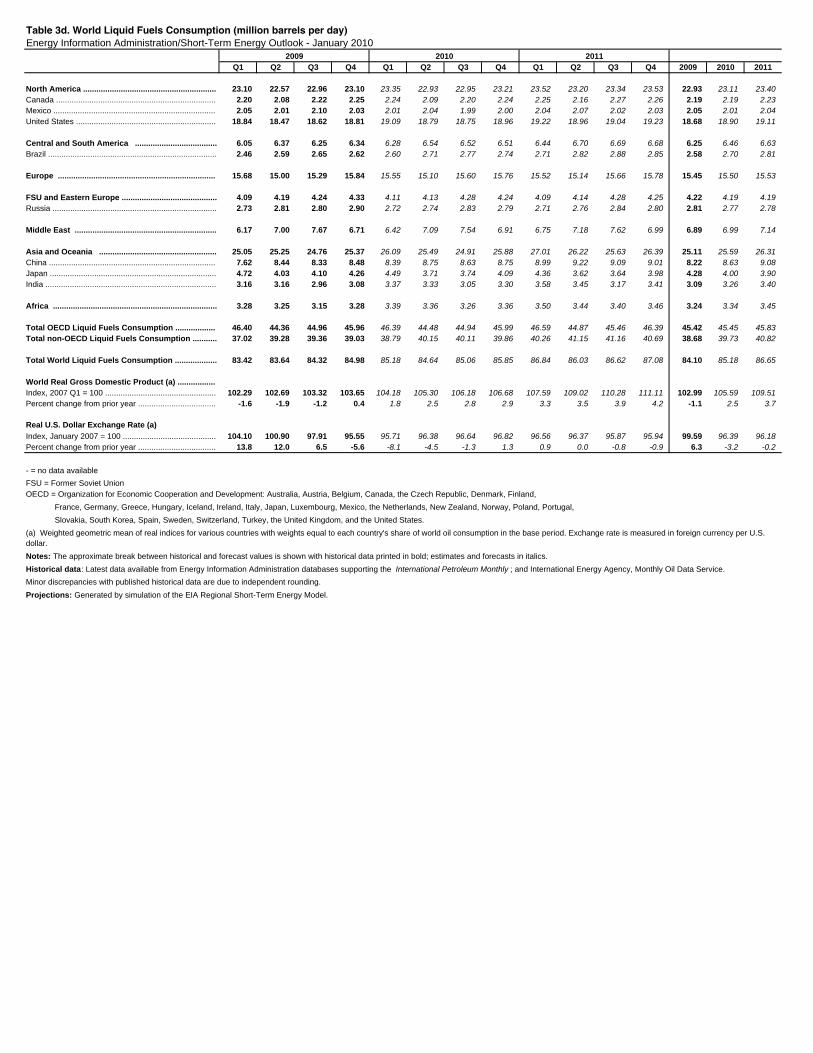
Global Crude Oil and Liquid Fuels Consumption. Global oil demand declined in 2009
for the second consecutive year, the first time since 1983 that this had occurred. The
decline bottomed out in the middle of 2009, as the world economy began to recover in
the last half of the year (World Liquid Fuels Consumption Chart). EIA expects this
recovery to continue in 2010 and 2011, contributing to global oil demand growth of 1.1
million barrels per day (bbl/d) in 2010 and 1.5 million bbl/d in 2011. Non-OECD
countries are likely to account for most of this growth in 2010, although projected
demand in the United States increase slightly by 0.2 million bbl/d after a very weak
2009. China continues to lead world consumption growth with projected increases of
more than 0.4 million bbl/d in both 2010 and 2011.
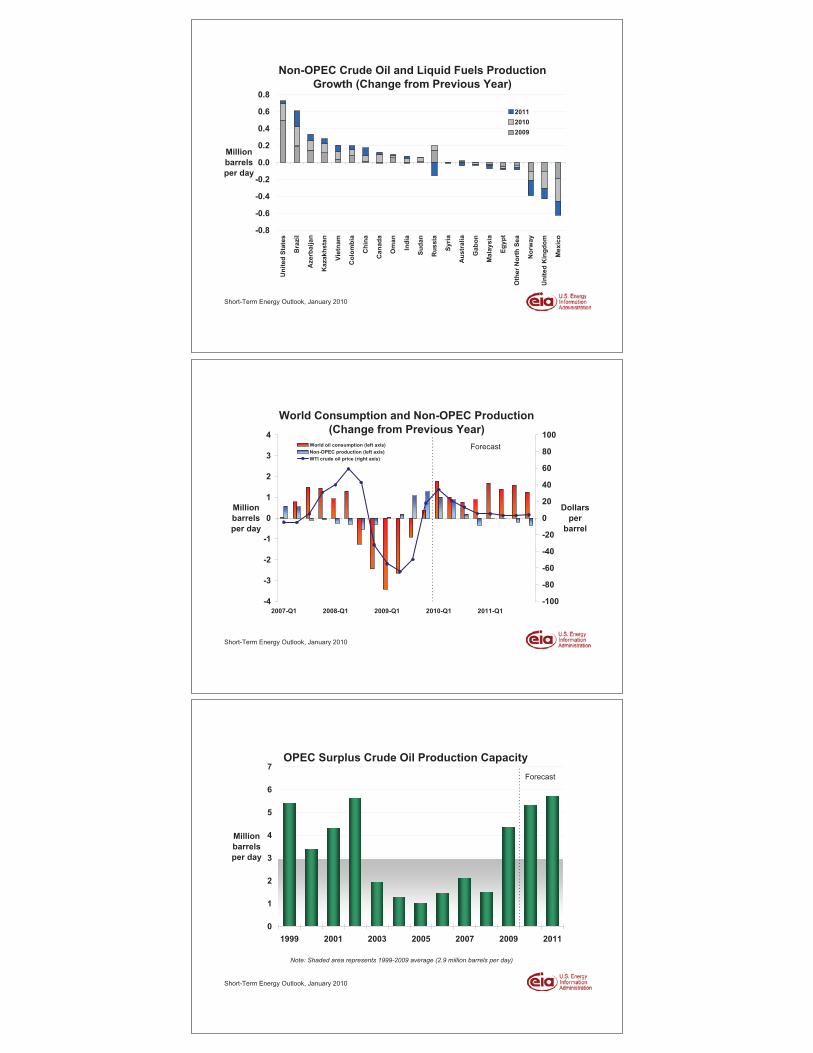
Non-OPEC Supply. Non-OPEC oil supply increased by more than 0.6 million bbl/d in
2009, the largest annual increase since 2004. Higher production in the United States,
Brazil, and the Former Soviet Union (FSU) were the largest contributors to this
growth. However, very little net increase in non-OPEC supply is expected over the
forecast period. Projected non-OPEC supply increases by 0.4 million bbl/d in 2010 but
then falls slightly by more than 0.1 million bbl/d in 2011. The largest source of growth
over this period is Brazil (0.4 million bbl/d), the result of rising offshore and biofuels
production. The United States and the FSU each contribute an additional 0.2 million
bbl/d of growth. However, large declines in production from the North Sea (0.7
million bbl/d) and Mexico (0.4 million bbl/d) are responsible for offsetting these
sources of growth, underlying the low overall growth during the forecast period (see
STEO Supplement: Outlook for non-OPEC Oil Supply in 2010-2011).

U.S. Energy Information Administration / Short-Term Energy Outlook—January 2010
3
OPEC Supply. As many market observers had expected, at its 155th meeting in
December 2009 OPEC decided for the time being to keep its current oil production
levels unchanged. Although OPEC faces a global oil market that has firmed in
response to its production cuts since last January, the strength and durability of the
global economic recovery is still uncertain. EIA expects that annual average OPEC
crude oil production, which declined by almost 2.2 million bbl/d on average in 2009,
will increase by an average of about 0.5 million bbl/d per year through 2011 as global
oil demand recovers. In addition, EIA expects OPEC non-crude petroleum liquids,
which are not subject to OPEC production targets, to grow by 0.6 million bbl/d in 2010
and by 0.7 million bbl/d in 2011.
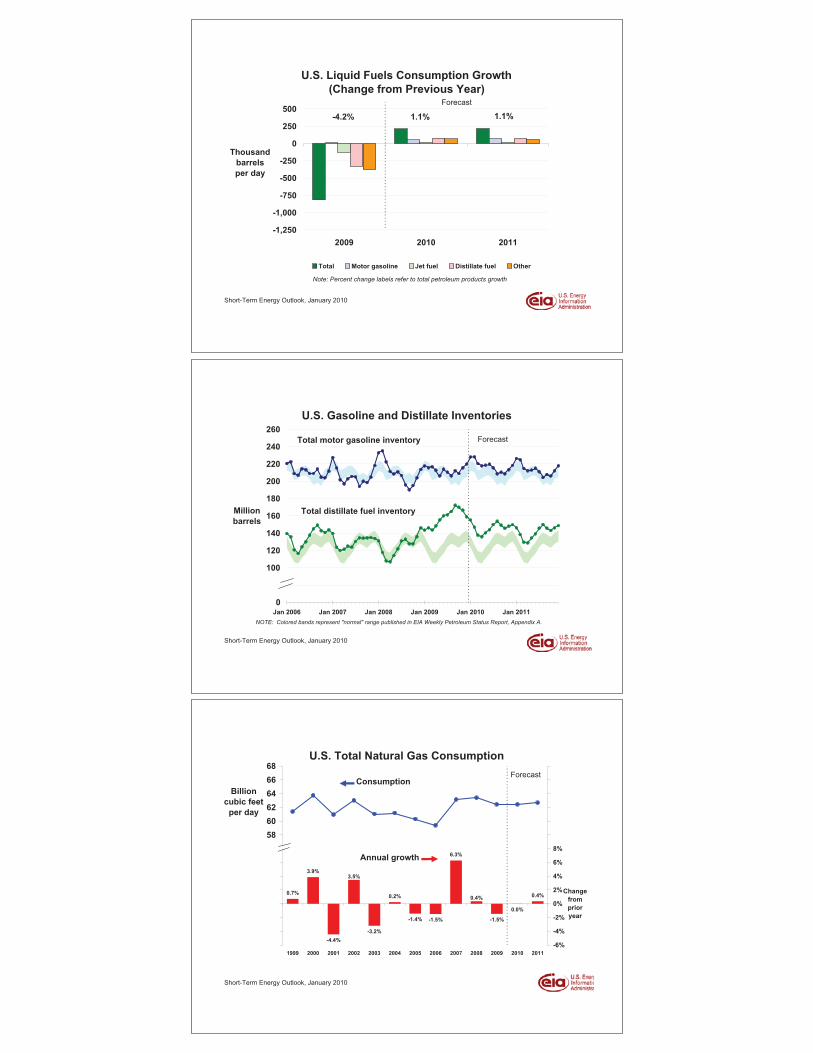
OPEC surplus crude oil production capacity, which averaged 2.8 million bbl/d during
the 1998-2008 period (OPEC Surplus Crude Oil Production Capacity Chart), will
continue to remain high, with surplus capacity reaching almost 6 million bbl/d by the
end of the forecast period. As a result of the low growth in non-OPEC supply, OPEC
market share could increase to 42 percent in 2011, from 40 percent in 2009. The
combination of higher market share and the relatively high level of surplus
production capacity would give the group greater influence over the world oil market
in the coming years. OPEC is scheduled to meet in Vienna on March 16, 2010, to
reassess the market.
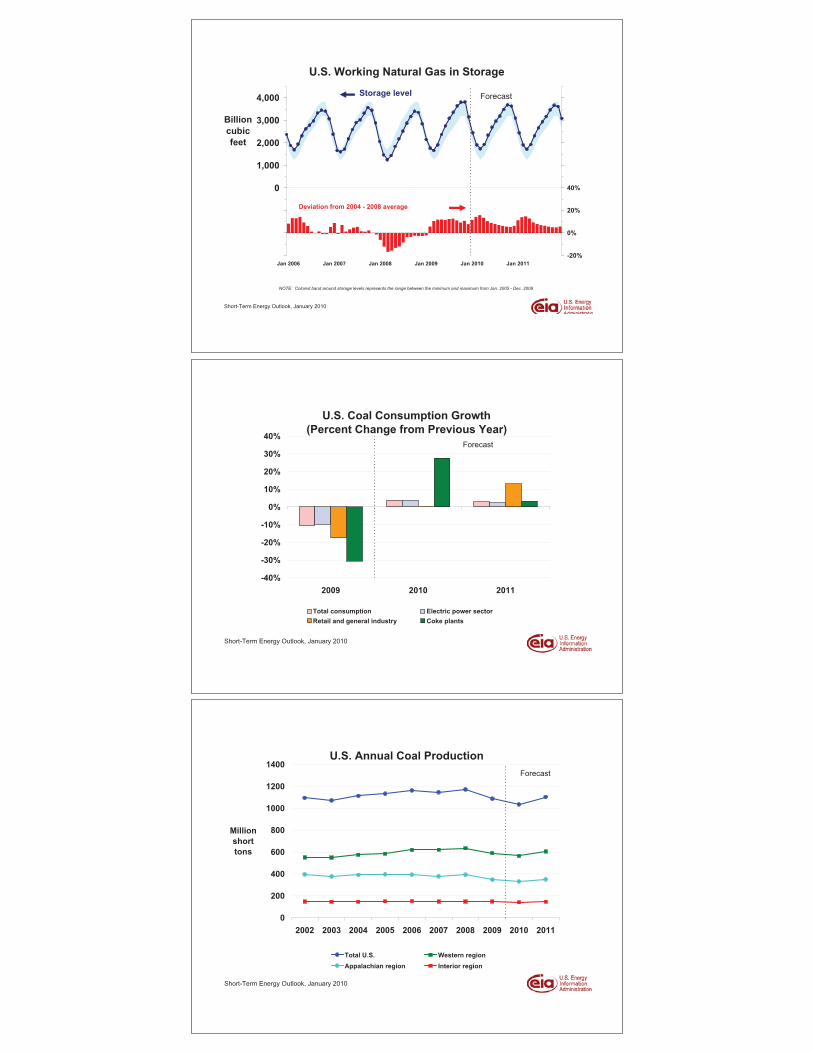
OECD Petroleum Inventories. EIA estimates OECD commercial oil inventories were
2.69 billion barrels at the end of 2009, equivalent to about 58 days of forward cover,
and about 80 million barrels more than the 5-year average for the corresponding time
of year (Days of Supply of OECD Commercial Stocks Chart). Projected OECD oil
inventories remain at the upper end of the historical range over the forecast period.
Crude Oil Prices. WTI crude oil spot prices averaged $74.50 per barrel in December
2009, about $3.50 per barrel lower than the prior month’s average. This decline
reflected price weakness during the first 2 weeks of December as the WTI spot price
fell from $78 to $70. However, colder-than-normal weather and U.S. crude oil and
product inventory draws that exceeded the December 5-year averages helped push
the WTI spot price back up to $79 per barrel by the end of the month. EIA forecasts
that WTI spot prices will weaken over the next few months, averaging $76 per barrel
in March, before rising to about $82 per barrel in the late spring and to $85 by late next
year (West Texas Intermediate Crude Oil Price Chart).
Expected WTI price volatility continued to edge lower going into the new year.
Crude oil futures market participants were pricing March 2010 options at an implied
volatility slightly below 40 percent per annum at the beginning of December 2009, and
the level dropped to an average of 34 percent over the 5 days ending on January 7,
U.S. Energy Information Administration / Short-Term Energy Outlook—January 2010
4
2010. March 2010 WTI futures averaged $82 per barrel over that same 5-day window.
Thus, the lower and upper limits of the 95-percent confidence interval for the March
2010 futures price were $66 per barrel and $102 per barrel, respectively (see Energy
Price Volatility and Forecast Uncertainty).
During the same period last year, market participants were pricing March-delivered
WTI into Cushing, Oklahoma, at $50 per barrel. However, the implied volatility of 87
percent was more than twice the current level, resulting in lower and upper limits of
$29 and $87 per barrel, respectively, for the 95-percent confidence interval. Global oil
markets still were adjusting to highly uncertain conditions following a price collapse
from all-time highs for WTI futures in mid-2008.
U.S. Crude Oil and Liquid Fuels
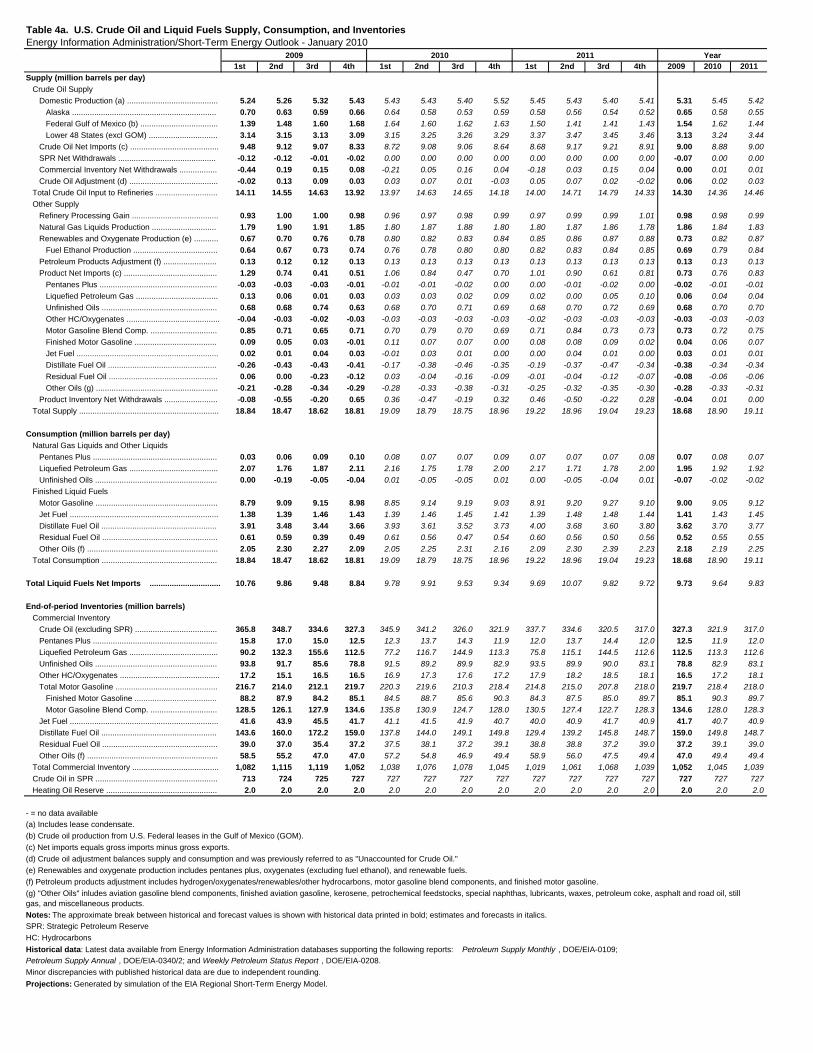
U.S. Liquid Fuels Consumption. Liquid fuels consumption declined by 810,000 bbl/d,
or 4.2 percent, in 2009, the second consecutive annual decline (U.S. Liquid Fuels
Consumption Growth Chart). Motor gasoline was the only major petroleum product
whose consumption did not decline, having increased by a scant 0.1 percent. Despite
the cold weather that gripped much of the Nation in late December, average annual
distillate fuel consumption declined by 330,000 bbl/d, or 8.3 percent, in 2009, led by a
precipitous decline in transportation usage. EIA projects total petroleum products
consumption will rise by 210,000 bbl/d in 2010, or 1.1 percent, due to a moderate
economic recovery that began late in 2009. All major products contribute to that
increase. Consumption of motor gasoline rises by 50,000 bbl/d, or 0.6 percent, and
distillate fuel consumption increases by 80,000 bbl/d, or 2.1 percent. The projected
continuing economic recovery in 2011 boosts total petroleum products consumption
by 220,000 bbl/d. Both motor gasoline and distillate consumption rise by about 70,000
bbl/d in 2011.
U.S. Crude Oil and Liquid Fuels Supply. Domestic crude oil production averaged 5.31
million bbl/d in 2009, up 360,000 bbl/d from 2008 (U.S. Crude Oil Production Chart).
The forecast growth in domestic output slows in 2010 with an increase of 130,000
bbl/d and then declines slightly by 20,000 bbl/d in 2011. Ethanol production continues
to grow to meet the volume requirements of the Renewable Fuel Standard. Projected
ethanol production, which averaged 690,000 bbl/d in 2009, increases to an average of
790,000 bbl/d in 2010 and 840,000 bbl/d in 2011.
U.S. Petroleum Product Prices. Monthly average regular-grade gasoline prices
increased from $1.79 per gallon in January 2009 to $2.61 per gallon in December 2009.
EIA expects these prices to average $2.84 per gallon in 2010 and $2.96 per gallon in
2011. Pump prices are likely to pass $3 per gallon at some point during the upcoming
U.S. Energy Information Administration / Short-Term Energy Outlook—January 2010
5
spring and summer. Because of growth in motor gasoline consumption, the
difference between the average gasoline retail price and the average cost of crude oil
widens in 2010 before starting to level out in 2011.
On-highway diesel fuel retail prices, which averaged $2.46 per gallon in 2009, average
$2.98 per gallon in 2010 and $3.14 in 2011. As with motor gasoline, the expected
recovery in the consumption of diesel fuel in the United States, as well as growth in
distillate fuel usage outside the United States, strengthens refining margins for
distillate throughout the forecast period.
Natural Gas
U.S. Natural Gas Consumption. EIA estimates that total natural gas consumption fell
by 1.5 percent in 2009, primarily because of the economic downturn (Total U.S.
Natural Gas Consumption Growth Chart). Despite low natural gas prices throughout
most of 2009, which contributed to a significant increase in natural gas-fired electric
power generation, declines in industrial, residential, and commercial sector
consumption drove the year-over-year decline in total consumption.
Total annual natural gas consumption is forecast to remain relatively unchanged in
2010. Higher natural gas prices in 2010 are expected to cause a 2.8-percent decline in
natural gas consumption in the electric power sector in 2010, which will offset growth
in the residential, commercial, and industrial sectors. Forecast total natural gas
consumption increases by 0.4 percent in 2011, led by a 2.5 percent increase in
consumption in the industrial sector.
U.S. Natural Gas Production and Imports. EIA estimates that total marketed natural
gas production increased by 3.7 percent in 2009, despite a 59-percent decline in the
working natural gas rig count from September 2008 to July 2009. Working natural gas
rigs have since turned around from the mid-July 2009 low of 665, increasing to 759 as
of December 31, 2009. While production growth in 2009 was supported by the
enhanced productivity of new wells being drilled, steep declines from initial
production at these newly drilled wells and the lagged effect of reduced drilling
activity are expected to contribute to a 3-percent decline in 2010 production. EIA
expects marketed production to increase by 1.3 percent in 2011 with growth in
production from lower-48 non-Gulf of Mexico (GOM) fields offsetting a decline in
GOM production.
U.S. pipeline imports declined by almost 0.9 billion cubic feet per day (Bcf/d) in 2009,
or 8.8 percent, as Canadian drilling activity and production fell because of lower
prices. EIA expects continued low Canadian production to cause U.S. pipeline
U.S. Energy Information Administration / Short-Term Energy Outlook—January 2010
6
imports to fall this year as well, by more than 1 Bcf/d. Meanwhile, EIA forecasts that
recent additions to global liquefied natural gas (LNG) supply in Russia, Yemen, Qatar,
and Indonesia will cause U.S. LNG imports to increase by almost 0.5 Bcf/d in 2010 to
1.76 Bcf/d. EIA expects U.S. LNG imports to increase slightly in 2011, as growing
global demand for LNG absorbs the new supply growth.
U.S. Natural Gas Inventories. On January 1, 2010, working natural gas in storage was
3,123 Bcf (U.S. Working Natural Gas in Storage Chart), 316 Bcf above the previous 5-
year average (2005–2009) and 286 Bcf above the level during the corresponding week
last year. Colder-than-normal temperatures in December 2009 contributed to an
estimated storage withdrawal of 665 billion cubic feet, 32 percent above the previous
5-year average December drawdown. The weekly withdrawal of 207 Bcf during the
week ending December 11, 2009, was the largest weekly December drawdown since
the week ending December 29, 2000, when 208 Bcf was withdrawn. Despite the large
December draw and a projected first-quarter 2010 inventory withdrawal about 6
percent greater than the previous 5-year average, the expected end-of-March 2010
storage level of 1,734 Bcf will be about 16 percent (237 Bcf) greater than the previous 5-
year average for that period.
U.S. Natural Gas Prices. The Henry Hub spot price averaged $5.50 per Mcf in
December 2009, $1.73 per Mcf higher than the average spot price in November (Henry
Hub Natural Gas Price Chart). Prices were affected by the colder-than-normal
weather in December, which contributed to an increase of 2.2 Bcf/d in total
consumption during December compared with the forecast in last month’s Outlook.
The Henry Hub spot price averaged $4.06 per Mcf in 2009, and the forecast price
averages $5.36 per Mcf in 2010 and $6.12 per Mcf in 2011. Continued high storage
levels combined with enhanced domestic production capabilities and slow
consumption growth are expected to keep prices from rising dramatically through the
forecast.
While natural gas inventories remain ample, implied volatility for the futures market
in natural gas options moved slightly higher at the start of the new year. Natural gas
for delivery in March 2010 at Henry Hub, Louisiana, was priced at $5.73 per million
Btu (MMBtu) ($5.90 per Mcf) during the 5 days ending January 7, 2010. Implied
volatility for options settling against March 2010 natural gas futures averaged just
below 57 percent. Futures market participants, therefore, were pricing a 95-percent
confidence interval with a lower limit of $3.88 and an upper limit of $8.47 per MMBtu
for the March 2010 contract (see Energy Price Volatility and Forecast Uncertainty).
Last year at this time the picture looked very similar. Futures contracts on natural gas
delivered to the Henry Hub during March 2009 traded at $5.90 per MMBtu. Implied
U.S. Energy Information Administration / Short-Term Energy Outlook—January 2010
7
volatility on the March 2009 natural gas options was at 59 percent; thus the lower and
upper limits of the 95-percent confidence interval for natural gas prices were $3.94
and $8.84 per MMBtu, respectively.
Electricity
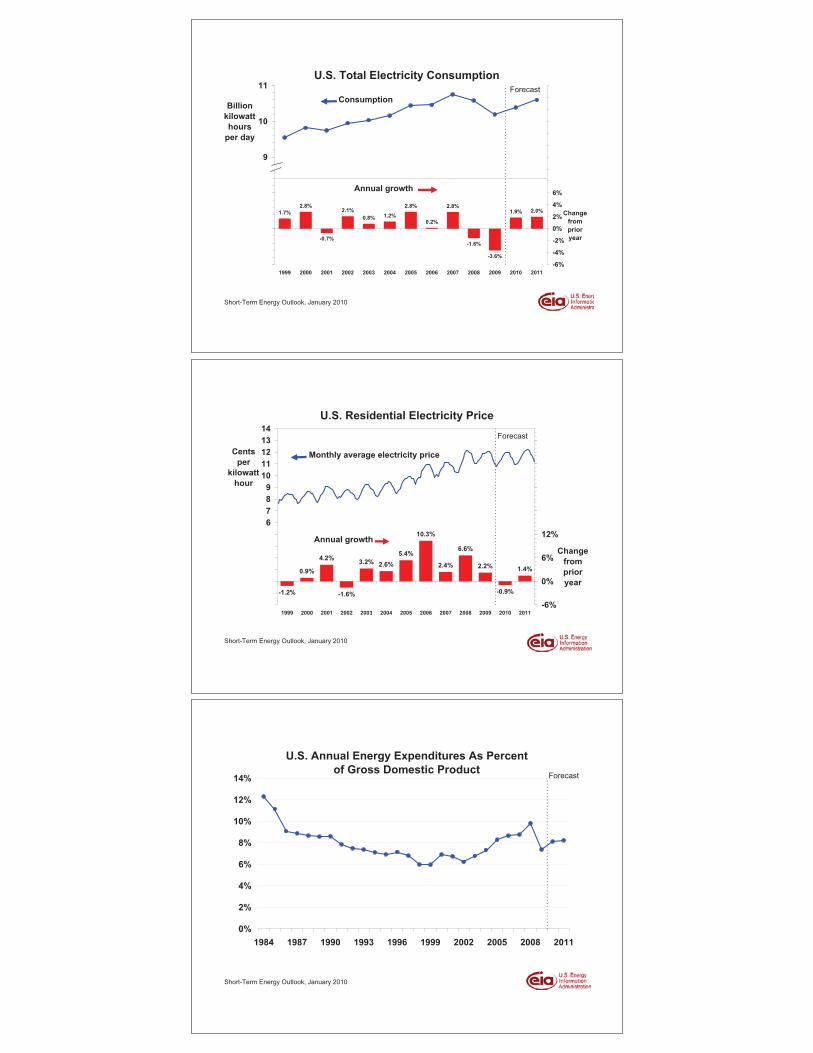
U.S. Electricity Consumption. EIA expects total electricity consumption to grow by
1.9 percent in 2010 (U.S. Total Electricity Consumption Chart). This growth is driven
by projected increase in residential and commercial sector electricity sales as assumed
summer air conditioning use this year returns to normal after the mild summer in
2009. Improving economic conditions will help drive growth in electricity sales to the
industrial sector over the next two years, with projected consumption of electricity in
this sector growing by 0.9 percent in 2010 and 2.0 percent 2011.
U.S. Electricity Generation. Total expected electricity generation in 2010 reaches an
average of about 11 billion kWh per day, 0.22 billion kWh more than the average level
of generation in 2009, and increases to 11.2 in 2011. This growth will be primarily
supplied by increases from wind, nuclear, and coal-fired generation sources.
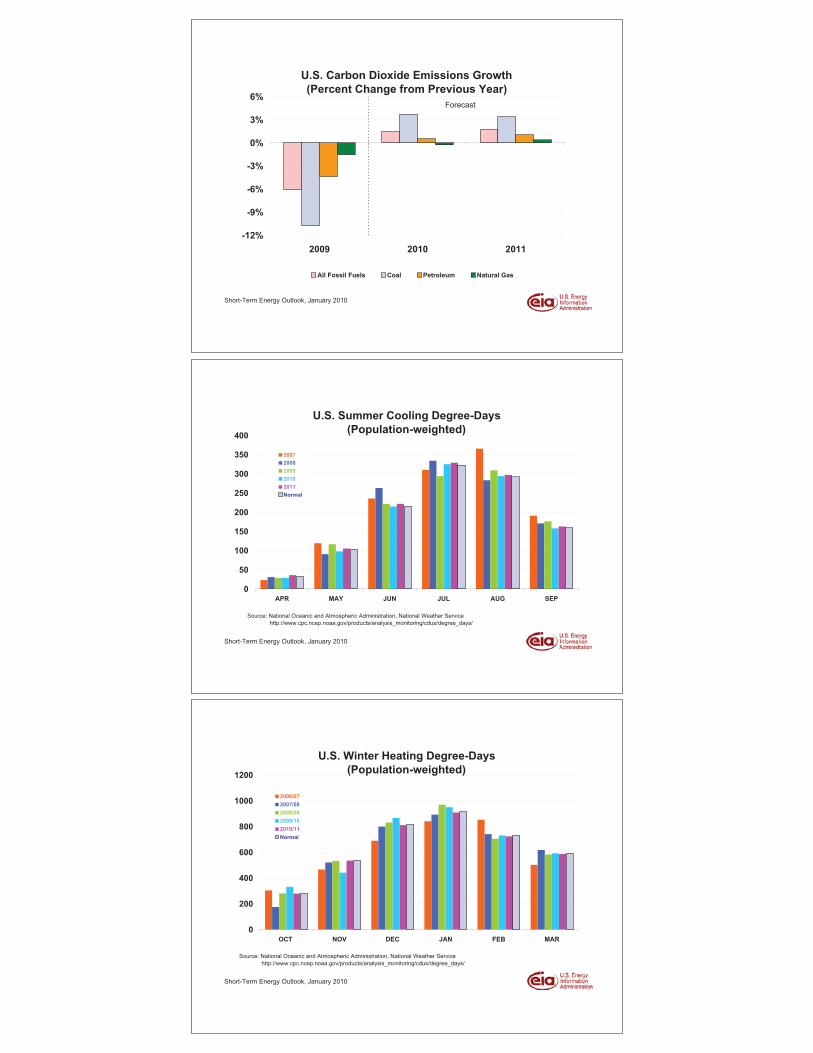
U.S. Electricity Retail Prices. Many utilities have made downward fuel cost
adjustments recently as a result of lower fuel costs in 2009. These adjustments have
been offset somewhat by the need to increase revenues to cover the capital costs of
expanding renewable energy generation (U.S. Residential Electricity Prices Chart).
Overall, forecast residential electricity prices fall by 0.9 percent in 2010 and increase
by 1.4 percent in 2011.
Coal
U.S. Coal Consumption. Estimated coal consumption by the electric power sector fell
by nearly 10 percent in 2009. Lower total electricity generation combined with
increases in generation from natural gas (5 percent) and hydropower (5 percent) were
the major factors leading to the decline in coal consumption. Anticipated increases in
electricity demand and higher natural gas prices will contribute to growth in coal-
fired generation in 2010 and 2011. Forecast coal consumption in the electric power
sector increases by almost 4 percent in 2010 but remains below 1 billion short tons for
the second consecutive year. A projected 2.5-percent increase in electric-power-sector
coal consumption puts it at the 1-billion-short-ton level in 2011. Estimated coal
consumption for coke production declined by 30 percent in 2009. Consumption of
coal at coke plants rises over the forecast period as economic conditions improve, with
an increase of 4 million short tons (28 percent) in 2010 and an additional 3-percent
increase in 2011. EIA projects growth in 2010 and 2011 for coal consumption in the
U.S. Energy Information Administration / Short-Term Energy Outlook—January 2010
8
retail and general industry sectors, following a 17-percent decline in 2009 (U.S. Coal
Consumption Growth Chart).
U.S. Coal Supply. EIA estimates that 2009 coal production fell more 7 percent in
response to lower U.S. coal consumption, fewer exports, and higher coal inventories.
Production declines by an additional 4.6 percent in the 2010 forecast despite increases
in domestic consumption and exports. The balance between supply and demand is
maintained through a reduction in coal inventories and slightly higher imports.
Continued growth in coal consumption and exports in 2011 will lead to a projected
6.5-percent increase in coal production (U.S. Annual Coal Production Chart).
U.S. Coal Prices. EIA estimates that the delivered electric-power-sector coal price
averaged $2.22 per MMBtu in 2009, a 7-percent increase compared with the 2008
average price, despite decreases in spot coal prices, lower prices for other fossil fuels,
and declines in demand for coal for electricity generation. This higher cost of
delivered coal is due to the significant portion of longer-term power-sector coal
contracts that were initiated during a period of high prices for all fuels. The projected
electric-power-sector delivered coal price falls by 7 percent to average $2.06 per
MMBtu in 2010, and declines by an additional 2 percent in 2011.
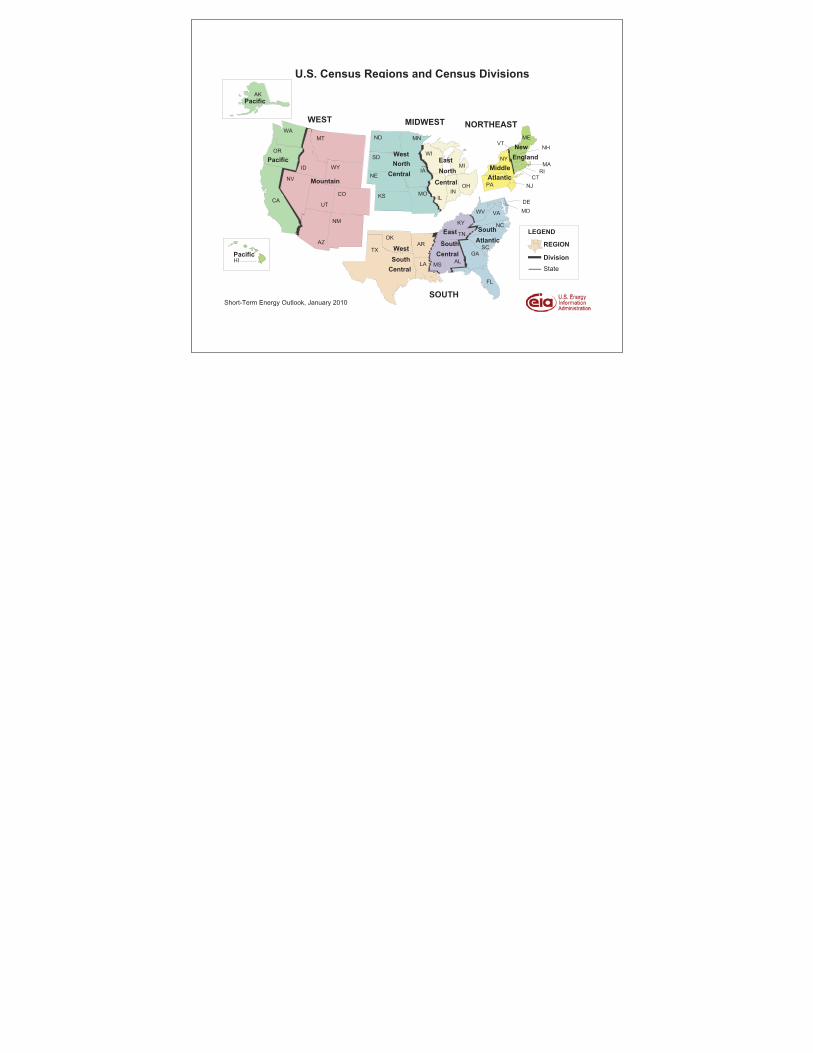
U.S. Carbon Dioxide Emissions
CO2 emissions from fossil fuels fell by an estimated 6.1 percent in 2009. Emissions
from coal led the drop in 2009 CO2 emissions, falling by nearly 11 percent. Declines in
energy consumption in the industrial sector, a result of the weak economy, and
changes in electricity generation sources are the primary reasons for the decline in
CO2 emissions (U.S. Carbon Dioxide Emissions Growth Chart). Looking forward,
projected improvements in the economy contribute to an expected 1.5-percent
increase in CO2 emissions in 2010. Increased use of coal in the electric-power sector
and continued economic growth, along with the expansion of travel-related
petroleum consumption, lead to a 1.7-percent increase in CO2 emissions in 2011.
However, even with increases in 2010 and 2011, projected CO2 emissions in 2011 are
still expected to be lower than annual emissions from 1999 through 2008.
03-04 04-05 05-06 06-07 07-08 Avg.03-08 08-09 09-10 % Change
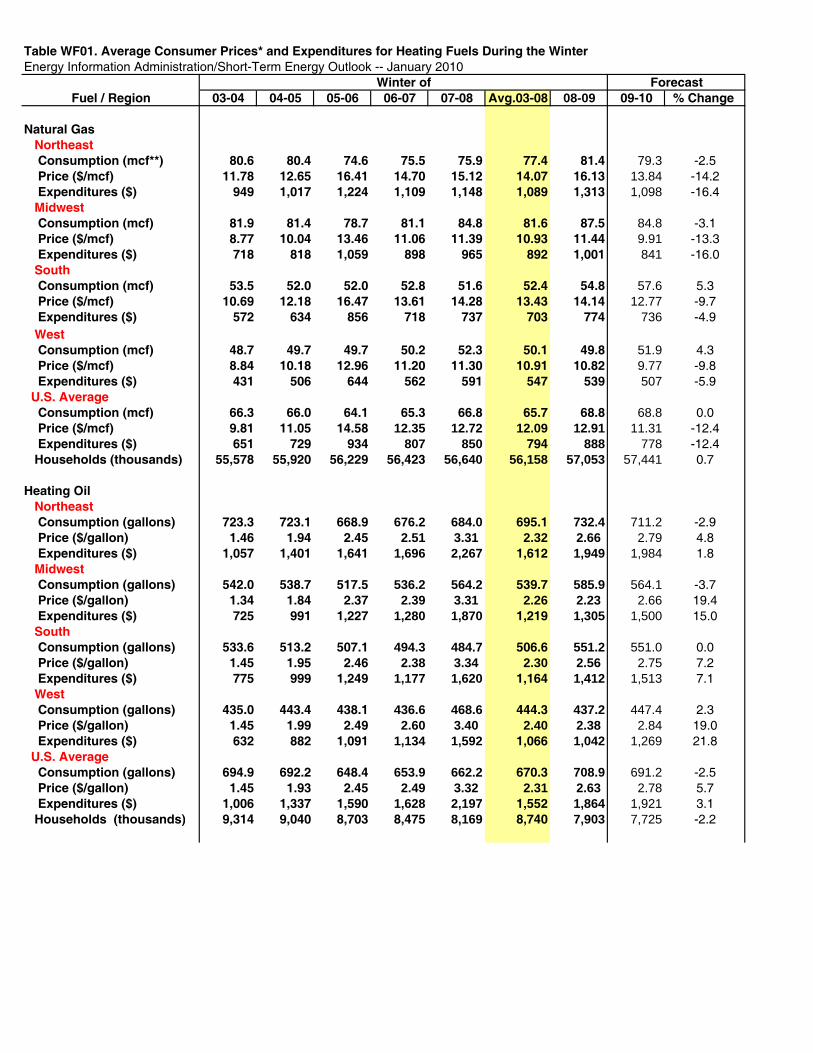
Natural Gas Northeast Consumption (mcf**) 80.6 80.4 74.6 75.5 75.9 77.4 81.4 79.3 -2.5 Price ($/mcf) 11.78 12.65 16.41 14.70 15.12 14.07 16.13 13.84 -14.2 Expenditures ($) 949 1,017 1,224 1,109 1,148 1,089 1,313 1,098 -16.4 Midwest Consumption (mcf) 81.9 81.4 78.7 81.1 84.8 81.6 87.5 84.8 -3.1 Price ($/mcf) 8.77 10.04 13.46 11.06 11.39 10.93 11.44 9.91 -13.3 Expenditures ($) 718 818 1,059 898 965 892 1,001 841 -16.0 South Consumption (mcf) 53.5 52.0 52.0 52.8 51.6 52.4 54.8 57.6 5.3 Price ($/mcf) 10.69 12.18 16.47 13.61 14.28 13.43 14.14 12.77 -9.7 Expenditures ($) 572 634 856 718 737 703 774 736 -4.9 West Consumption (mcf) 48.7 49.7 49.7 50.2 52.3 50.1 49.8 51.9 4.3 Price ($/mcf) 8.84 10.18 12.96 11.20 11.30 10.91 10.82 9.77 -9.8 Expenditures ($) 431 506 644 562 591 547 539 507 -5.9 U.S. Average Consumption (mcf) 66.3 66.0 64.1 65.3 66.8 65.7 68.8 68.8 0.0 Price ($/mcf) 9.81 11.05 14.58 12.35 12.72 12.09 12.91 11.31 -12.4 Expenditures ($) 651 729 934 807 850 794 888 778 -12.4 Households (thousands) 55,578 55,920 56,229 56,423 56,640 56,158 57,053 57,441 0.7
Heating Oil Northeast Consumption (gallons) 723.3 723.1 668.9 676.2 684.0 695.1 732.4 711.2 -2.9 Price ($/gallon) 1.46 1.94 2.45 2.51 3.31 2.32 2.66 2.79 4.8 Expenditures ($) 1,057 1,401 1,641 1,696 2,267 1,612 1,949 1,984 1.8 Midwest Consumption (gallons) 542.0 538.7 517.5 536.2 564.2 539.7 585.9 564.1 -3.7 Price ($/gallon) 1.34 1.84 2.37 2.39 3.31 2.26 2.23 2.66 19.4 Expenditures ($) 725 991 1,227 1,280 1,870 1,219 1,305 1,500 15.0 South Consumption (gallons) 533.6 513.2 507.1 494.3 484.7 506.6 551.2 551.0 0.0 Price ($/gallon) 1.45 1.95 2.46 2.38 3.34 2.30 2.56 2.75 7.2 Expenditures ($) 775 999 1,249 1,177 1,620 1,164 1,412 1,513 7.1 West Consumption (gallons) 435.0 443.4 438.1 436.6 468.6 444.3 437.2 447.4 2.3 Price ($/gallon) 1.45 1.99 2.49 2.60 3.40 2.40 2.38 2.84 19.0 Expenditures ($) 632 882 1,091 1,134 1,592 1,066 1,042 1,269 21.8 U.S. Average Consumption (gallons) 694.9 692.2 648.4 653.9 662.2 670.3 708.9 691.2 -2.5 Price ($/gallon) 1.45 1.93 2.45 2.49 3.32 2.31 2.63 2.78 5.7 Expenditures ($) 1,006 1,337 1,590 1,628 2,197 1,552 1,864 1,921 3.1 Households (thousands) 9,314 9,040 8,703 8,475 8,169 8,740 7,903 7,725 -2.2
Energy Information Administration/Short-Term Energy Outlook -- January 2010Table WF01. Average Consumer Prices* and Expenditures for Heating Fuels During the Winter
Fuel / RegionWinter of Forecast
03-04 04-05 05-06 06-07 07-08 Avg.03-08 08-09 09-10 % Change
Energy Information Administration/Short-Term Energy Outlook -- January 2010Table WF01. Average Consumer Prices* and Expenditures for Heating Fuels During the Winter
Fuel / RegionWinter of Forecast
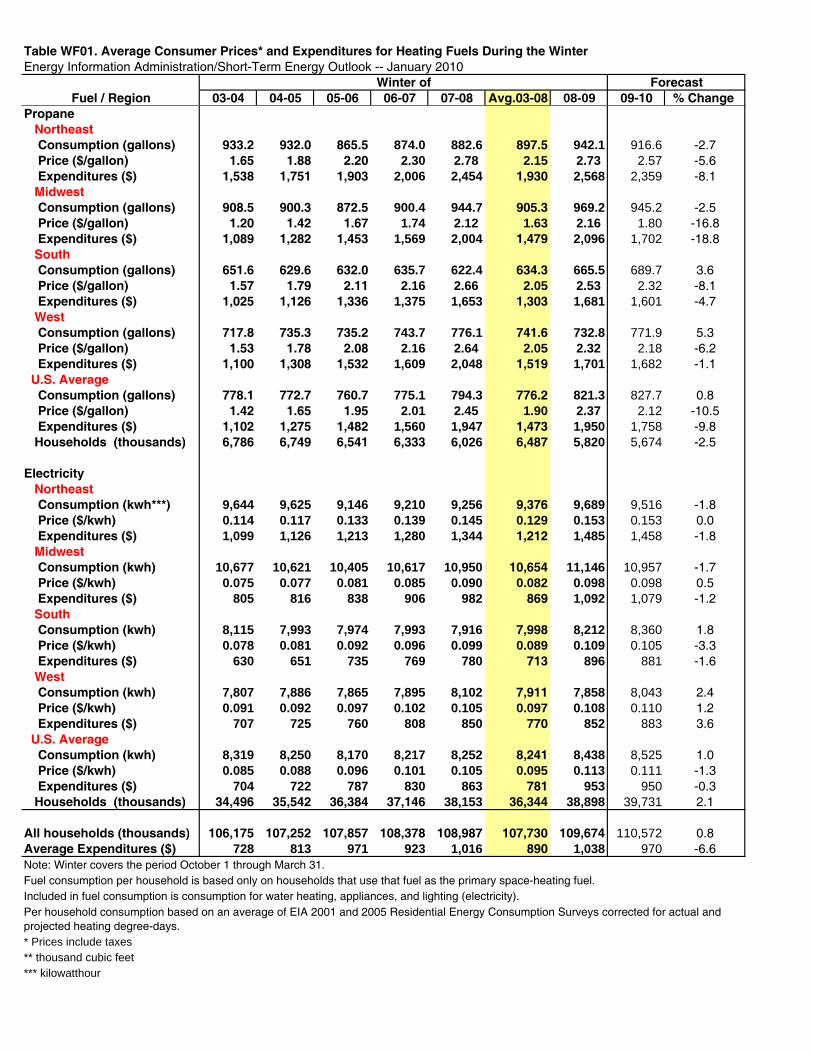
Propane Northeast Consumption (gallons) 933.2 932.0 865.5 874.0 882.6 897.5 942.1 916.6 -2.7 Price ($/gallon) 1.65 1.88 2.20 2.30 2.78 2.15 2.73 2.57 -5.6 Expenditures ($) 1,538 1,751 1,903 2,006 2,454 1,930 2,568 2,359 -8.1 Midwest Consumption (gallons) 908.5 900.3 872.5 900.4 944.7 905.3 969.2 945.2 -2.5 Price ($/gallon) 1.20 1.42 1.67 1.74 2.12 1.63 2.16 1.80 -16.8 Expenditures ($) 1,089 1,282 1,453 1,569 2,004 1,479 2,096 1,702 -18.8 South Consumption (gallons) 651.6 629.6 632.0 635.7 622.4 634.3 665.5 689.7 3.6 Price ($/gallon) 1.57 1.79 2.11 2.16 2.66 2.05 2.53 2.32 -8.1 Expenditures ($) 1,025 1,126 1,336 1,375 1,653 1,303 1,681 1,601 -4.7 West Consumption (gallons) 717.8 735.3 735.2 743.7 776.1 741.6 732.8 771.9 5.3 Price ($/gallon) 1.53 1.78 2.08 2.16 2.64 2.05 2.32 2.18 -6.2 Expenditures ($) 1,100 1,308 1,532 1,609 2,048 1,519 1,701 1,682 -1.1 U.S. Average Consumption (gallons) 778.1 772.7 760.7 775.1 794.3 776.2 821.3 827.7 0.8 Price ($/gallon) 1.42 1.65 1.95 2.01 2.45 1.90 2.37 2.12 -10.5 Expenditures ($) 1,102 1,275 1,482 1,560 1,947 1,473 1,950 1,758 -9.8 Households (thousands) 6,786 6,749 6,541 6,333 6,026 6,487 5,820 5,674 -2.5
Electricity Northeast Consumption (kwh***) 9,644 9,625 9,146 9,210 9,256 9,376 9,689 9,516 -1.8 Price ($/kwh) 0.114 0.117 0.133 0.139 0.145 0.129 0.153 0.153 0.0 Expenditures ($) 1,099 1,126 1,213 1,280 1,344 1,212 1,485 1,458 -1.8 Midwest Consumption (kwh) 10,677 10,621 10,405 10,617 10,950 10,654 11,146 10,957 -1.7 Price ($/kwh) 0.075 0.077 0.081 0.085 0.090 0.082 0.098 0.098 0.5 Expenditures ($) 805 816 838 906 982 869 1,092 1,079 -1.2 South Consumption (kwh) 8,115 7,993 7,974 7,993 7,916 7,998 8,212 8,360 1.8 Price ($/kwh) 0.078 0.081 0.092 0.096 0.099 0.089 0.109 0.105 -3.3 Expenditures ($) 630 651 735 769 780 713 896 881 -1.6 West Consumption (kwh) 7,807 7,886 7,865 7,895 8,102 7,911 7,858 8,043 2.4 Price ($/kwh) 0.091 0.092 0.097 0.102 0.105 0.097 0.108 0.110 1.2 Expenditures ($) 707 725 760 808 850 770 852 883 3.6 U.S. Average Consumption (kwh) 8,319 8,250 8,170 8,217 8,252 8,241 8,438 8,525 1.0 Price ($/kwh) 0.085 0.088 0.096 0.101 0.105 0.095 0.113 0.111 -1.3 Expenditures ($) 704 722 787 830 863 781 953 950 -0.3 Households (thousands) 34,496 35,542 36,384 37,146 38,153 36,344 38,898 39,731 2.1
All households (thousands) 106,175 107,252 107,857 108,378 108,987 107,730 109,674 110,572 0.8Average Expenditures ($) 728 813 971 923 1,016 890 1,038 970 -6.6
Included in fuel consumption is consumption for water heating, appliances, and lighting (electricity).
** thousand cubic feet*** kilowatthour
Per household consumption based on an average of EIA 2001 and 2005 Residential Energy Consumption Surveys corrected for actual and projected heating degree-days.
Note: Winter covers the period October 1 through March 31.Fuel consumption per household is based only on households that use that fuel as the primary space-heating fuel.
* Prices include taxes
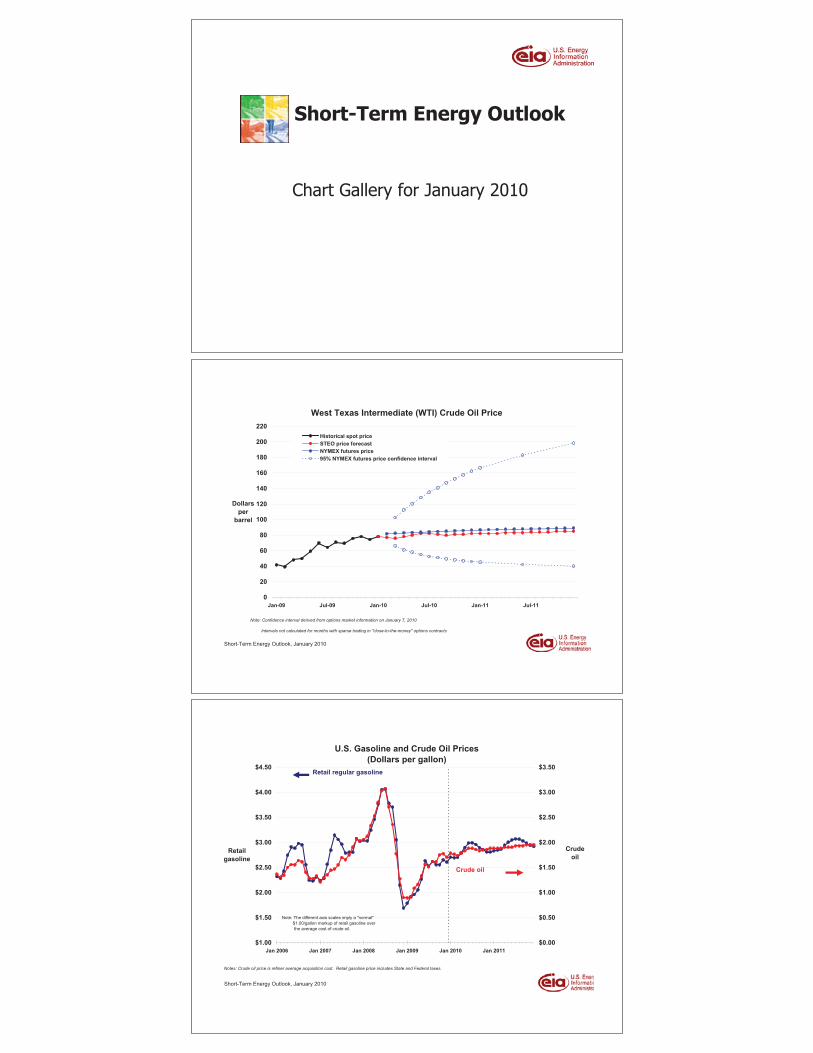
Chart Gallery for January 2010
Short-Term Energy Outlook
West Texas Intermediate (WTI) Crude Oil Price
0
20
40
60
80
100
120
140
160
180
200
220
Jan-09 Jul-09 Jan-10 Jul-10 Jan-11 Jul-11
Dollarsper
barrel
Historical spot priceSTEO price forecastNYMEX futures price95% NYMEX futures price confidence interval
Short-Term Energy Outlook, January 2010
Note: Confidence interval derived from options market information on January 7, 2010
Intervals not calculated for months with sparse trading in "close-to-the-money" options contracts
U.S. Gasoline and Crude Oil Prices(Dollars per gallon)
$1.00
$1.50
$2.00
$2.50
$3.00
$3.50
$4.00
$4.50
Jan 2006 Jan 2007 Jan 2008 Jan 2009 Jan 2010 Jan 2011
Retailgasoline
$0.00
$0.50
$1.00
$1.50
$2.00
$2.50
$3.00
$3.50
Crudeoil
Short-Term Energy Outlook, January 2010
Notes: Crude oil price is refiner average acquisition cost. Retail gasoline price includes State and Federal taxes.
Retail regular gasoline
Crude oil
Note: The different axis scales imply a "normal" $1.00/gallon markup of retail gasoline over the average cost of crude oil.
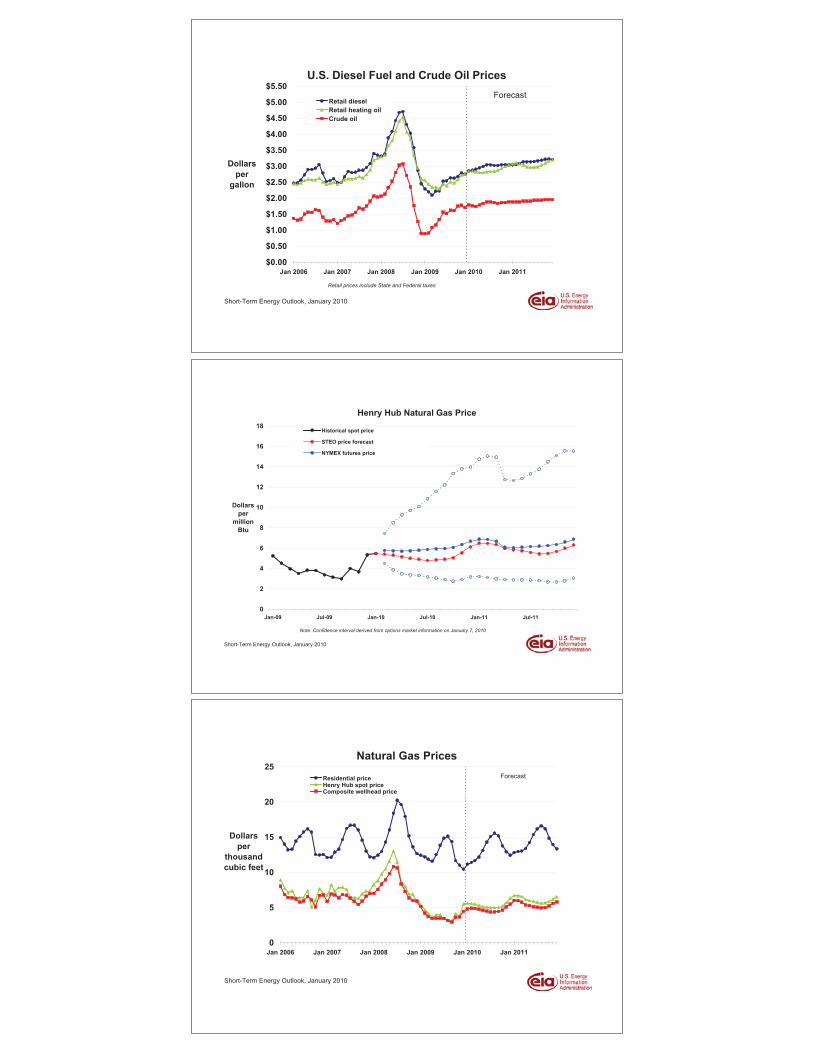
U.S. Diesel Fuel and Crude Oil PricesForecast
$0.00
$0.50
$1.00
$1.50
$2.00
$2.50
$3.00
$3.50
$4.00
$4.50
$5.00
$5.50
Jan 2006 Jan 2007 Jan 2008 Jan 2009 Jan 2010 Jan 2011
Dollarsper
gallon
Retail dieselRetail heating oilCrude oil
Short-Term Energy Outlook, January 2010
Retail prices include State and Federal taxes
Henry Hub Natural Gas Price
0
2
4
6
8
10
12
14
16
18
Jan-09 Jul-09 Jan-10 Jul-10 Jan-11 Jul-11
Dollarsper
millionBtu
Historical spot price
STEO price forecast
NYMEX futures price
Short-Term Energy Outlook, January 2010
Note: Confidence interval derived from options market information on January 7, 2010
Natural Gas PricesForecast
0
5
10
15
20
25
Jan 2006 Jan 2007 Jan 2008 Jan 2009 Jan 2010 Jan 2011
Dollarsper
thousandcubic feet
Residential priceHenry Hub spot priceComposite wellhead price
Short-Term Energy Outlook, January 2010
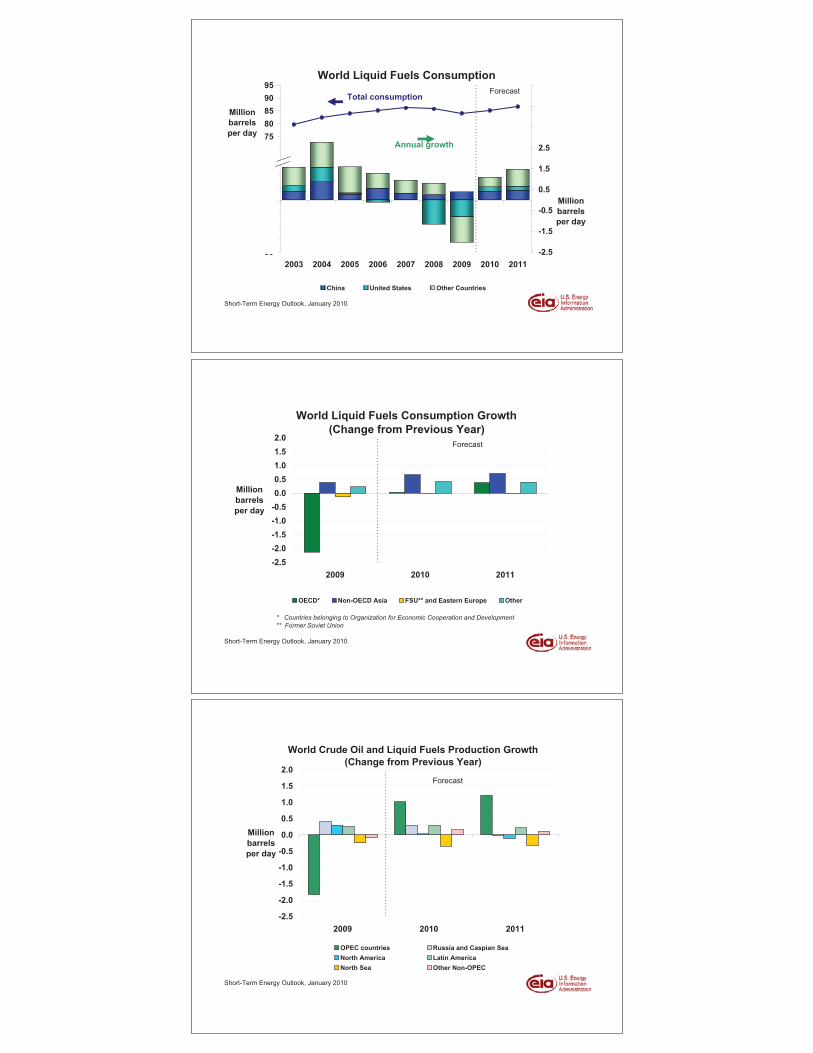
World Liquid Fuels Consumption
3035404550556065707580859095
2003 2004 2005 2006 2007 2008 2009 2010 2011
Millionbarrelsper day
-2.5
-1.5
-0.5
0.5
1.5
2.5
3.5
4.5
5.5
Millionbarrelsper day
China United States Other Countries
Total consumption
Annual growth
Short-Term Energy Outlook, January 2010
Forecast
World Liquid Fuels Consumption Growth(Change from Previous Year)
-2.5-2.0-1.5-1.0-0.50.00.51.01.52.0
2009 2010 2011
Millionbarrelsper day
OECD* Non-OECD Asia FSU** and Eastern Europe Other
Short-Term Energy Outlook, January 2010
* Countries belonging to Organization for Economic Cooperation and Development** Former Soviet Union
Forecast
World Crude Oil and Liquid Fuels Production Growth(Change from Previous Year)
-2.5
-2.0
-1.5
-1.0
-0.5
0.0
0.5
1.0
1.5
2.0
2009 2010 2011
Millionbarrelsper day
OPEC countries Russia and Caspian SeaNorth America Latin AmericaNorth Sea Other Non-OPEC
Short-Term Energy Outlook, January 2010
Forecast
Non-OPEC Crude Oil and Liquid Fuels Production Growth (Change from Previous Year)
-0.8
-0.6
-0.4
-0.2
0.0
0.2
0.4
0.6
0.8
Uni
ted
Stat
es
Bra
zil
Aze
rbai
jan
Kaz
akhs
tan
Viet
nam
Col
ombi
a
Chi
na
Can
ada
Om
an
Indi
a
Suda
n
Rus
sia
Syria
Aus
tral
ia
Gab
on
Mal
aysi
a
Egyp
t
Oth
er N
orth
Sea
Nor
way
Uni
ted
Kin
gdom
Mex
ico
Millionbarrelsper day
201120102009
Short-Term Energy Outlook, January 2010
World Consumption and Non-OPEC Production(Change from Previous Year)
Forecast
-4
-3
-2
-1
0
1
2
3
4
2007-Q1 2008-Q1 2009-Q1 2010-Q1 2011-Q1
Millionbarrelsper day
-100
-80
-60
-40
-20
0
20
40
60
80
100
Dollarsper
barrel
World oil consumption (left axis)Non-OPEC production (left axis)WTI crude oil price (right axis)
Short-Term Energy Outlook, January 2010
OPEC Surplus Crude Oil Production Capacity
0
1
2
3
4
5
6
7
1999 2001 2003 2005 2007 2009 2011
Millionbarrelsper day
Forecast
Note: Shaded area represents 1999-2009 average (2.9 million barrels per day)
Short-Term Energy Outlook, January 2010
Days of Supply of OECD Commercial Oil Stocks
Forecast
40
45
50
55
60
65
70
Jan 2005 Jan 2006 Jan 2007 Jan 2008 Jan 2009 Jan 2010 Jan 2011
Days ofsupply
Short-Term Energy Outlook, January 2010
0
NOTE: Colored band represents the range between the minimum and maximum obeserved inventories from Jan. 2005 - Dec. 2009.
U.S. Crude Oil Production
-5.9%
-0.3% -1.0% -1.1%
-4.6% -4.4%
-1.5%-0.7%
-2.2%
-0.4%
7.4%
-1.0%
2.5%
-6
-5
-4
-3
-2
-1
0
1
2
3
4
5
6
Millionbarrelsper day
-8%
-4%
0%
4%
8%
12%
16%
20%
24%
1999 2000 2001 2002 2003 2004 2005 2006 2007 2008 2009 2010 2011
Changefromprioryear
Lower 48 production
Alaska production
U.S. annual growth
Short-Term Energy Outlook, January 2010
Forecast
U.S. Crude Oil StocksForecast
200
220
240
260
280
300
320
340
360
380
400
Jan 2006 Jan 2007 Jan 2008 Jan 2009 Jan 2010 Jan 2011
Millionbarrels
Short-Term Energy Outlook, January 2010
NOTE: Colored band represents "normal" range published in EIA Weekly Petroleum Status Report, Appendix A.
0
U.S. Liquid Fuels Consumption Growth(Change from Previous Year)
-1,250
-1,000
-750
-500
-250
0
250
500
2009 2010 2011
Thousandbarrelsper day
Total Motor gasoline Jet fuel Distillate fuel Other
Short-Term Energy Outlook, January 2010
Note: Percent change labels refer to total petroleum products growth
-4.2% 1.1% 1.1%Forecast
U.S. Gasoline and Distillate Inventories
Forecast
60
80
100
120
140
160
180
200
220
240
260
Jan 2006 Jan 2007 Jan 2008 Jan 2009 Jan 2010 Jan 2011
Millionbarrels
NOTE: Colored bands represent "normal" range published in EIA Weekly Petroleum Status Report, Appendix A.
Total motor gasoline inventory
Total distillate fuel inventory
Short-Term Energy Outlook, January 2010
0
U.S. Total Natural Gas Consumption
0.7%
3.9%
-4.4%-3.2%
0.2%
-1.4% -1.5%
6.3%
-1.5%
0.0%
0.4%
3.5%
0.4%
4244464850525456586062646668
Billioncubic feet
per day
-6%
-4%
-2%
0%
2%
4%
6%
8%
10%
12%
14%
16%
18%
20%
1999 2000 2001 2002 2003 2004 2005 2006 2007 2008 2009 2010 2011
Changefromprioryear
Short-Term Energy Outlook, January 2010
Consumption
Annual growth
Forecast
U.S. Working Natural Gas in Storage
Forecast
-3,000
-2,000
-1,000
0
1,000
2,000
3,000
4,000
Billioncubicfeet
-20%
0%
20%
40%
60%
80%
100%
120%
Jan 2006 Jan 2007 Jan 2008 Jan 2009 Jan 2010 Jan 2011
Deviation from 2004 - 2008 average
Storage level
NOTE: Colored band around storage levels represents the range between the minimum and maximum from Jan. 2005 - Dec. 2009
Short-Term Energy Outlook, January 2010
U.S. Coal Consumption Growth(Percent Change from Previous Year)
-40%
-30%
-20%
-10%
0%
10%
20%
30%
40%
2009 2010 2011
Total consumption Electric power sectorRetail and general industry Coke plants
Forecast
Short-Term Energy Outlook, January 2010
U.S. Annual Coal Production
0
200
400
600
800
1000
1200
1400
2002 2003 2004 2005 2006 2007 2008 2009 2010 2011
Millionshorttons
Total U.S. Western regionAppalachian region Interior region
Short-Term Energy Outlook, January 2010
Forecast
U.S. Total Electricity Consumption
1.7%2.8%
-0.7%
2.1%0.8% 1.2%
2.8%
0.2%
2.8%
-1.6%
-3.6%
1.9% 2.0%
6
7
8
9
10
11
Billionkilowatthours
per day
-6%
-4%
-2%
0%
2%
4%
6%
8%
10%
12%
14%
16%
18%
20%
22%
24%
1999 2000 2001 2002 2003 2004 2005 2006 2007 2008 2009 2010 2011
Changefromprioryear
Annual growth
Consumption
Short-Term Energy Outlook, January 2010
Forecast
U.S. Residential Electricity Price
-1.2%
0.9%
4.2%
-1.6%
3.2% 2.6%5.4%
10.3%
2.4%
6.6%
2.2%
-0.9%
1.4%
-10123456789
1011121314
Centsper
kilowatthour
-6%
0%
6%
12%
18%
24%
30%
36%
1999 2000 2001 2002 2003 2004 2005 2006 2007 2008 2009 2010 2011
Changefromprioryear
Short-Term Energy Outlook, January 2010
Annual growth
Monthly average electricity price
Forecast
U.S. Annual Energy Expenditures As Percent of Gross Domestic Product
0%
2%
4%
6%
8%
10%
12%
14%
1984 1987 1990 1993 1996 1999 2002 2005 2008 2011
Short-Term Energy Outlook, January 2010
Forecast
U.S. Carbon Dioxide Emissions Growth(Percent Change from Previous Year)
-12%
-9%
-6%
-3%
0%
3%
6%
2009 2010 2011
All Fossil Fuels Coal Petroleum Natural Gas
Forecast
Short-Term Energy Outlook, January 2010
U.S. Summer Cooling Degree-Days (Population-weighted)
0
50
100
150
200
250
300
350
400
APR MAY JUN JUL AUG SEP
20072008200920102011Normal
Short-Term Energy Outlook, January 2010
Source: National Oceanic and Atmospheric Administration, National Weather Service http://www.cpc.ncep.noaa.gov/products/analysis_monitoring/cdus/degree_days/
U.S. Winter Heating Degree-Days(Population-weighted)
0
200
400
600
800
1000
1200
OCT NOV DEC JAN FEB MAR
2006/072007/082008/092009/102010/11Normal
Short-Term Energy Outlook, January 2010
Source: National Oceanic and Atmospheric Administration, National Weather Service http://www.cpc.ncep.noaa.gov/products/analysis_monitoring/cdus/degree_days/
Short-Term Energy Outlook, January 2010
Pacific
East
SouthCentral
SouthAtlantic
MiddleAtlantic
NewEngland
WestSouth
Central
WestNorth
Central
EastNorth
CentralMountain
WAMT
WYID
NV
UT
CO
AZ
NM
TX
OK
IA
KS MOIL
IN
KY
TN
MS AL
FL
GASC
NC
WV
PA
NY
VTME
NJ
MDDE
CTRI
MA
NH
VA
WI
MI
OH
NE
SD
MNND
AR
LA
OR
CA
AKPacific
HIPacific
WEST MIDWEST NORTHEAST
SOUTH
REGION
Division
LEGEND
State
U.S. Census Regions and Census Divisions
1st 2nd 3rd 4th 1st 2nd 3rd 4th 1st 2nd 3rd 4th 2009 2010 2011
Energy Supply
Crude Oil Production (a)
(million barrels per day) .............................. 5.24 5.26 5.32 5.43 5.43 5.43 5.40 5.52 5.45 5.43 5.40 5.41 5.31 5.45 5.42
Dry Natural Gas Production
(billion cubic feet per day) ........................... 58.26 57.92 57.24 57.20 56.00 55.59 55.69 55.89 56.25 56.60 56.61 56.65 57.65 55.79 56.53
Coal Production
(million short tons) ....................................... 281 263 269 273 252 245 261 277 277 264 276 286 1,086 1,035 1,103
Energy Consumption
Liquid Fuels
(million barrels per day) .............................. 18.84 18.47 18.62 18.81 19.09 18.79 18.75 18.96 19.22 18.96 19.04 19.23 18.68 18.90 19.11
Natural Gas
(billion cubic feet per day) ........................... 79.72 52.41 53.80 64.11 79.90 52.66 54.18 63.29 78.52 53.25 54.86 64.29 62.45 62.44 62.67
Coal (b)
(million short tons) ....................................... 255 232 260 255 259 238 281 264 268 245 289 271 1,003 1,042 1,072
Electricity
(billion kilowatt hours per day) .................... 10.25 9.61 11.16 9.76 10.29 9.77 11.57 9.92 10.37 9.99 11.83 10.18 10.20 10.39 10.60
Renewables (c)
(quadrillion Btu) ........................................... 1.69 1.92 1.71 1.70 1.85 2.00 1.84 1.81 1.95 2.11 1.94 1.90 7.02 7.50 7.90
Total Energy Consumption (d)
(quadrillion Btu) ........................................... 25.31 22.39 23.30 24.34 25.61 22.86 23.99 24.39 25.86 23.30 24.49 24.88 95.34 96.86 98.53
Nominal Energy Prices
Crude Oil (e)
(dollars per barrel) ....................................... 40.45 56.91 66.42 73.15 74.00 77.03 78.03 78.34 79.00 80.00 81.00 82.00 59.33 76.88 80.52
Natural Gas Wellhead
(dollars per thousand cubic feet) ................. 4.36 3.44 3.17 3.89 4.84 4.60 4.39 5.05 5.90 5.24 4.97 5.53 3.71 4.72 5.41
Coal
(dollars per million Btu) ............................... 2.27 2.24 2.22 2.15 2.10 2.07 2.04 2.01 2.01 2.02 2.01 1.99 2.22 2.06 2.01
Macroeconomic
Real Gross Domestic Product
(billion chained 2005 dollars - SAAR) ......... 12,925 12,902 12,990 13,073 13,129 13,193 13,260 13,328 13,408 13,512 13,644 13,778 12,972 13,228 13,585
Percent change from prior year ................... -3.3 -3.8 -2.5 -0.5 1.6 2.3 2.1 2.0 2.1 2.4 2.9 3.4 -2.6 2.0 2.7
GDP Implicit Price Deflator
(Index, 2005=100) ........................................ 109.7 109.7 109.8 109.8 110.6 110.8 111.1 111.8 112.5 112.7 113.0 113.4 109.7 111.1 112.9
Percent change from prior year ................... 1.9 1.5 0.6 0.6 0.9 1.0 1.2 1.8 1.7 1.7 1.6 1.4 1.2 1.2 1.6
Real Disposable Personal Income
(billion chained 2005 dollars - SAAR) ......... 9,926 10,078 10,041 10,049 10,005 10,098 10,169 10,172 10,109 10,193 10,274 10,342 10,023 10,111 10,229
Percent change from prior year ................... 1.0 0.2 2.1 1.3 0.8 0.2 1.3 1.2 1.0 0.9 1.0 1.7 1.1 0.9 1.2
Manufacturing Production Index
(Index, 2002=100) ........................................ 98.3 96.2 98.2 99.7 100.6 101.5 102.6 103.7 104.7 106.1 108.1 110.2 98.1 102.1 107.3
Percent change from prior year ................... -13.9 -14.6 -10.7 -4.6 2.4 5.4 4.5 4.0 4.1 4.6 5.4 6.3 -11.1 4.1 5.1
Weather
U.S. Heating Degree-Days .......................... 2,257 502 78 1,640 2,273 539 97 1,626 2,220 530 98 1,619 4,478 4,535 4,467
U.S. Cooling Degree-Days .......................... 31 367 779 68 32 342 777 77 36 363 790 83 1,245 1,228 1,272
(a) Includes lease condensate.
Table 1. U.S. Energy Markets Summary Energy Information Administration/Short-Term Energy Outlook - January 2010
2009 2010 2011 Year
- = no data available
Consequently, the historical data may not precisely match those published in the MER or the Annual Energy Review (AER).
Electric Power Monthly, DOE/EIA-0226; Quarterly Coal Report, DOE/EIA-0121; and International Petroleum Monthly, DOE/EIA-0520.
Projections: Generated by simulation of the EIA Regional Short-Term Energy Model. Macroeconomic projections are based on Global Insight Model of the U.S. Economy.
(e) Refers to the refiner average acquisition cost (RAC) of crude oil.
Notes: The approximate break between historical and forecast values is shown with historical data printed in bold; estimates and forecasts in italics.
Weather projections from National Oceanic and Atmospheric Administration.
Petroleum Supply Annual, DOE/EIA-0340/2; Weekly Petroleum Status Report, DOE/EIA-0208; Petroleum Marketing Monthly, DOE/EIA-0380; Natural Gas Monthly, DOE/EIA-0130;
Historical data: Latest data available from Energy Information Administration databases supporting the following reports: Petroleum Supply Monthly, DOE/EIA-0109;
(b) Total consumption includes Independent Power Producer (IPP) consumption.
Minor discrepancies with published historical data are due to independent rounding.
EIA does not estimate or project end-use consumption of non-marketed renewable energy.
(d) The conversion from physical units to Btu is calculated using a subset of conversion factors used in the calculations of gross energy consumption in EIA’s Monthly Energy Review (MER).
(c) Renewable energy includes minor components of non-marketed renewable energy that is neither bought nor sold, either directly or indirectly, as inputs to marketed energy.
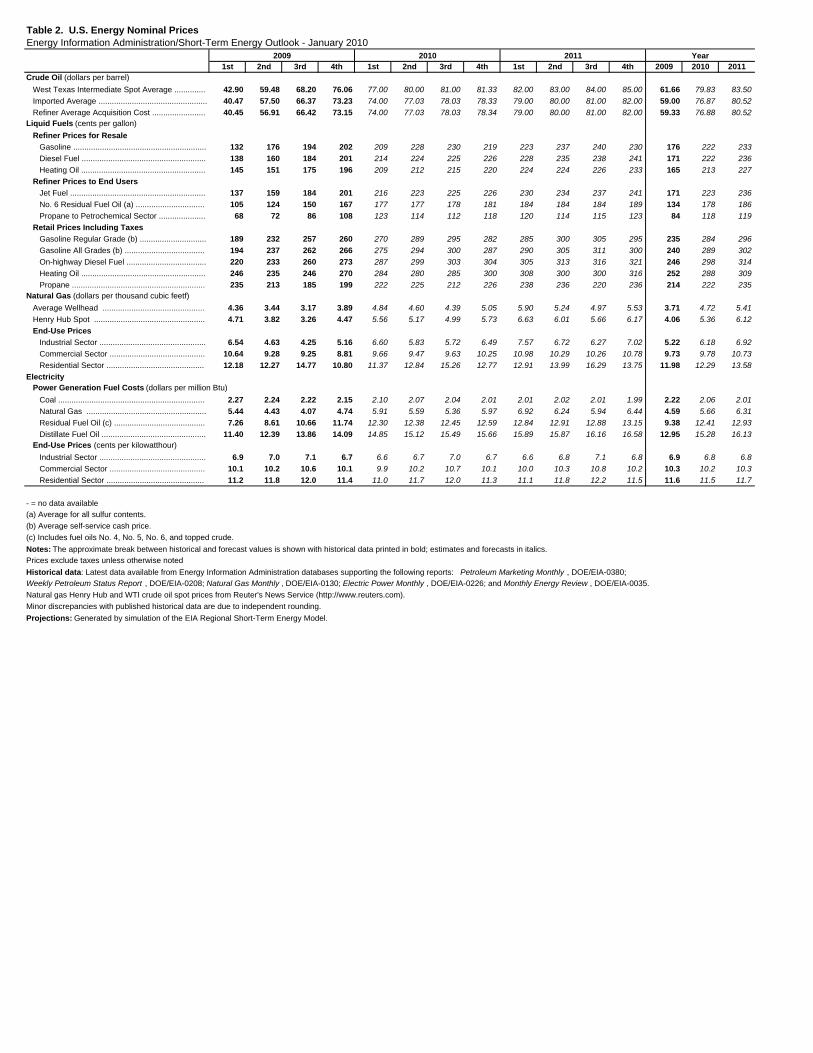
1st 2nd 3rd 4th 1st 2nd 3rd 4th 1st 2nd 3rd 4th 2009 2010 2011Crude Oil (dollars per barrel)
West Texas Intermediate Spot Average .............. 42.90 59.48 68.20 76.06 77.00 80.00 81.00 81.33 82.00 83.00 84.00 85.00 61.66 79.83 83.50
Imported Average ................................................. 40.47 57.50 66.37 73.23 74.00 77.03 78.03 78.33 79.00 80.00 81.00 82.00 59.00 76.87 80.52
Refiner Average Acquisition Cost ........................ 40.45 56.91 66.42 73.15 74.00 77.03 78.03 78.34 79.00 80.00 81.00 82.00 59.33 76.88 80.52Liquid Fuels (cents per gallon)
Refiner Prices for Resale
Gasoline ............................................................ 132 176 194 202 209 228 230 219 223 237 240 230 176 222 233
Diesel Fuel ........................................................ 138 160 184 201 214 224 225 226 228 235 238 241 171 222 236
Heating Oil ........................................................ 145 151 175 196 209 212 215 220 224 224 226 233 165 213 227
Refiner Prices to End Users
Jet Fuel ............................................................. 137 159 184 201 216 223 225 226 230 234 237 241 171 223 236
No. 6 Residual Fuel Oil (a) ............................... 105 124 150 167 177 177 178 181 184 184 184 189 134 178 186
Propane to Petrochemical Sector ..................... 68 72 86 108 123 114 112 118 120 114 115 123 84 118 119
Retail Prices Including Taxes
Gasoline Regular Grade (b) .............................. 189 232 257 260 270 289 295 282 285 300 305 295 235 284 296
Gasoline All Grades (b) .................................... 194 237 262 266 275 294 300 287 290 305 311 300 240 289 302
On-highway Diesel Fuel .................................... 220 233 260 273 287 299 303 304 305 313 316 321 246 298 314
Heating Oil ........................................................ 246 235 246 270 284 280 285 300 308 300 300 316 252 288 309
Propane ............................................................ 235 213 185 199 222 225 212 226 238 236 220 236 214 222 235Natural Gas (dollars per thousand cubic feetf)
Average Wellhead .............................................. 4.36 3.44 3.17 3.89 4.84 4.60 4.39 5.05 5.90 5.24 4.97 5.53 3.71 4.72 5.41
Henry Hub Spot .................................................. 4.71 3.82 3.26 4.47 5.56 5.17 4.99 5.73 6.63 6.01 5.66 6.17 4.06 5.36 6.12
End-Use Prices
Industrial Sector ................................................ 6.54 4.63 4.25 5.16 6.60 5.83 5.72 6.49 7.57 6.72 6.27 7.02 5.22 6.18 6.92
Commercial Sector ........................................... 10.64 9.28 9.25 8.81 9.66 9.47 9.63 10.25 10.98 10.29 10.26 10.78 9.73 9.78 10.73
Residential Sector ............................................ 12.18 12.27 14.77 10.80 11.37 12.84 15.26 12.77 12.91 13.99 16.29 13.75 11.98 12.29 13.58
Electricity Power Generation Fuel Costs (dollars per million Btu)
Coal .................................................................. 2.27 2.24 2.22 2.15 2.10 2.07 2.04 2.01 2.01 2.02 2.01 1.99 2.22 2.06 2.01
Natural Gas ...................................................... 5.44 4.43 4.07 4.74 5.91 5.59 5.36 5.97 6.92 6.24 5.94 6.44 4.59 5.66 6.31
Residual Fuel Oil (c) ......................................... 7.26 8.61 10.66 11.74 12.30 12.38 12.45 12.59 12.84 12.91 12.88 13.15 9.38 12.41 12.93
Distillate Fuel Oil ............................................... 11.40 12.39 13.86 14.09 14.85 15.12 15.49 15.66 15.89 15.87 16.16 16.58 12.95 15.28 16.13 End-Use Prices (cents per kilowatthour)
Industrial Sector ................................................ 6.9 7.0 7.1 6.7 6.6 6.7 7.0 6.7 6.6 6.8 7.1 6.8 6.9 6.8 6.8
Commercial Sector ........................................... 10.1 10.2 10.6 10.1 9.9 10.2 10.7 10.1 10.0 10.3 10.8 10.2 10.3 10.2 10.3
Residential Sector ............................................ 11.2 11.8 12.0 11.4 11.0 11.7 12.0 11.3 11.1 11.8 12.2 11.5 11.6 11.5 11.7
- = no data available
Natural gas Henry Hub and WTI crude oil spot prices from Reuter's News Service (http://www.reuters.com).
Prices exclude taxes unless otherwise noted
Weekly Petroleum Status Report , DOE/EIA-0208; Natural Gas Monthly , DOE/EIA-0130; Electric Power Monthly , DOE/EIA-0226; and Monthly Energy Review , DOE/EIA-0035.
(b) Average self-service cash price.
(c) Includes fuel oils No. 4, No. 5, No. 6, and topped crude.
Notes: The approximate break between historical and forecast values is shown with historical data printed in bold; estimates and forecasts in italics.
Historical data: Latest data available from Energy Information Administration databases supporting the following reports: Petroleum Marketing Monthly , DOE/EIA-0380;
Minor discrepancies with published historical data are due to independent rounding.
Projections: Generated by simulation of the EIA Regional Short-Term Energy Model.
Table 2. U.S. Energy Nominal PricesEnergy Information Administration/Short-Term Energy Outlook - January 2010
2009 2010 2011 Year
(a) Average for all sulfur contents.
1st 2nd 3rd 4th 1st 2nd 3rd 4th 1st 2nd 3rd 4th 2009 2010 2011
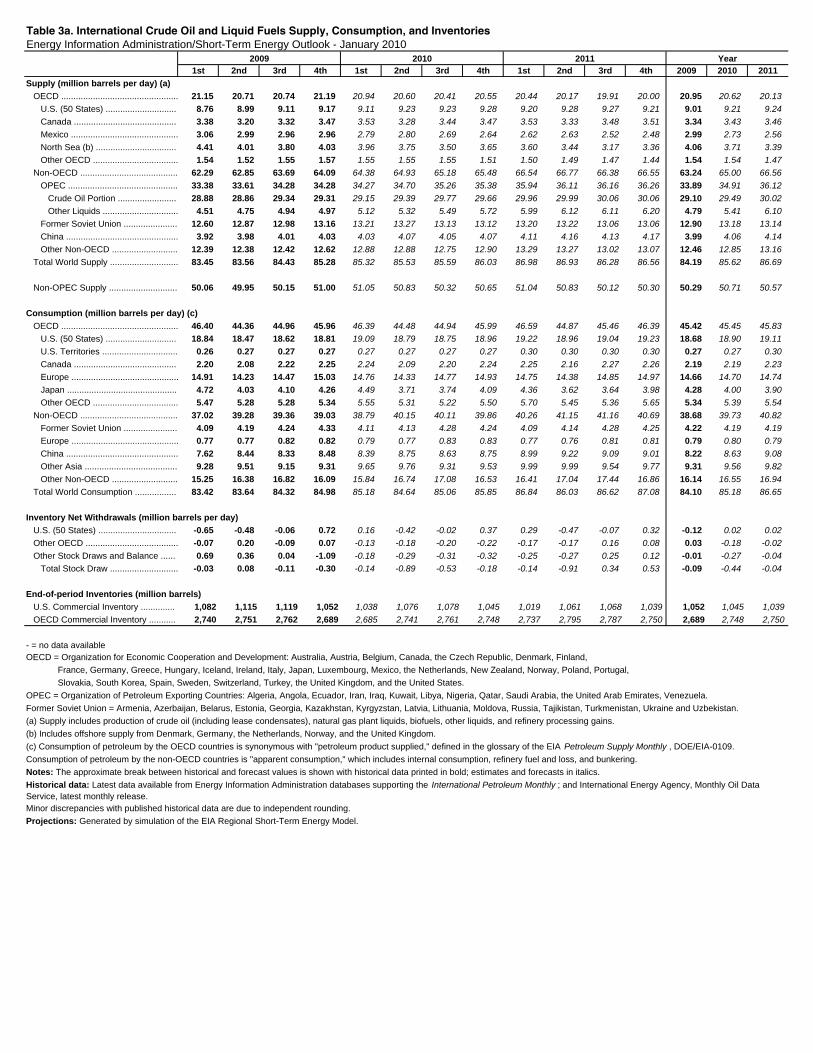
Supply (million barrels per day) (a)
OECD ................................................ 21.15 20.71 20.74 21.19 20.94 20.60 20.41 20.55 20.44 20.17 19.91 20.00 20.95 20.62 20.13
U.S. (50 States) ............................. 8.76 8.99 9.11 9.17 9.11 9.23 9.23 9.28 9.20 9.28 9.27 9.21 9.01 9.21 9.24
Canada .......................................... 3.38 3.20 3.32 3.47 3.53 3.28 3.44 3.47 3.53 3.33 3.48 3.51 3.34 3.43 3.46
Mexico ............................................ 3.06 2.99 2.96 2.96 2.79 2.80 2.69 2.64 2.62 2.63 2.52 2.48 2.99 2.73 2.56
North Sea (b) ................................. 4.41 4.01 3.80 4.03 3.96 3.75 3.50 3.65 3.60 3.44 3.17 3.36 4.06 3.71 3.39
Other OECD ................................... 1.54 1.52 1.55 1.57 1.55 1.55 1.55 1.51 1.50 1.49 1.47 1.44 1.54 1.54 1.47
Non-OECD ........................................ 62.29 62.85 63.69 64.09 64.38 64.93 65.18 65.48 66.54 66.77 66.38 66.55 63.24 65.00 66.56
OPEC ............................................. 33.38 33.61 34.28 34.28 34.27 34.70 35.26 35.38 35.94 36.11 36.16 36.26 33.89 34.91 36.12
Crude Oil Portion ........................ 28.88 28.86 29.34 29.31 29.15 29.39 29.77 29.66 29.96 29.99 30.06 30.06 29.10 29.49 30.02
Other Liquids ............................... 4.51 4.75 4.94 4.97 5.12 5.32 5.49 5.72 5.99 6.12 6.11 6.20 4.79 5.41 6.10
Former Soviet Union ...................... 12.60 12.87 12.98 13.16 13.21 13.27 13.13 13.12 13.20 13.22 13.06 13.06 12.90 13.18 13.14
China .............................................. 3.92 3.98 4.01 4.03 4.03 4.07 4.05 4.07 4.11 4.16 4.13 4.17 3.99 4.06 4.14
Other Non-OECD ........................... 12.39 12.38 12.42 12.62 12.88 12.88 12.75 12.90 13.29 13.27 13.02 13.07 12.46 12.85 13.16
Total World Supply ............................ 83.45 83.56 84.43 85.28 85.32 85.53 85.59 86.03 86.98 86.93 86.28 86.56 84.19 85.62 86.69
Non-OPEC Supply ............................ 50.06 49.95 50.15 51.00 51.05 50.83 50.32 50.65 51.04 50.83 50.12 50.30 50.29 50.71 50.57
Consumption (million barrels per day) (c)
OECD ................................................ 46.40 44.36 44.96 45.96 46.39 44.48 44.94 45.99 46.59 44.87 45.46 46.39 45.42 45.45 45.83
U.S. (50 States) ............................. 18.84 18.47 18.62 18.81 19.09 18.79 18.75 18.96 19.22 18.96 19.04 19.23 18.68 18.90 19.11
U.S. Territories ............................... 0.26 0.27 0.27 0.27 0.27 0.27 0.27 0.27 0.30 0.30 0.30 0.30 0.27 0.27 0.30
Canada .......................................... 2.20 2.08 2.22 2.25 2.24 2.09 2.20 2.24 2.25 2.16 2.27 2.26 2.19 2.19 2.23
Europe ............................................ 14.91 14.23 14.47 15.03 14.76 14.33 14.77 14.93 14.75 14.38 14.85 14.97 14.66 14.70 14.74
Japan ............................................. 4.72 4.03 4.10 4.26 4.49 3.71 3.74 4.09 4.36 3.62 3.64 3.98 4.28 4.00 3.90
Other OECD ................................... 5.47 5.28 5.28 5.34 5.55 5.31 5.22 5.50 5.70 5.45 5.36 5.65 5.34 5.39 5.54
Non-OECD ........................................ 37.02 39.28 39.36 39.03 38.79 40.15 40.11 39.86 40.26 41.15 41.16 40.69 38.68 39.73 40.82
Former Soviet Union ...................... 4.09 4.19 4.24 4.33 4.11 4.13 4.28 4.24 4.09 4.14 4.28 4.25 4.22 4.19 4.19
Europe ............................................ 0.77 0.77 0.82 0.82 0.79 0.77 0.83 0.83 0.77 0.76 0.81 0.81 0.79 0.80 0.79
China .............................................. 7.62 8.44 8.33 8.48 8.39 8.75 8.63 8.75 8.99 9.22 9.09 9.01 8.22 8.63 9.08
Other Asia ...................................... 9.28 9.51 9.15 9.31 9.65 9.76 9.31 9.53 9.99 9.99 9.54 9.77 9.31 9.56 9.82
Other Non-OECD ........................... 15.25 16.38 16.82 16.09 15.84 16.74 17.08 16.53 16.41 17.04 17.44 16.86 16.14 16.55 16.94
Total World Consumption ................. 83.42 83.64 84.32 84.98 85.18 84.64 85.06 85.85 86.84 86.03 86.62 87.08 84.10 85.18 86.65
Inventory Net Withdrawals (million barrels per day)
U.S. (50 States) ................................ -0.65 -0.48 -0.06 0.72 0.16 -0.42 -0.02 0.37 0.29 -0.47 -0.07 0.32 -0.12 0.02 0.02
Other OECD ...................................... -0.07 0.20 -0.09 0.07 -0.13 -0.18 -0.20 -0.22 -0.17 -0.17 0.16 0.08 0.03 -0.18 -0.02
Other Stock Draws and Balance ...... 0.69 0.36 0.04 -1.09 -0.18 -0.29 -0.31 -0.32 -0.25 -0.27 0.25 0.12 -0.01 -0.27 -0.04
Total Stock Draw ............................ -0.03 0.08 -0.11 -0.30 -0.14 -0.89 -0.53 -0.18 -0.14 -0.91 0.34 0.53 -0.09 -0.44 -0.04
End-of-period Inventories (million barrels)
U.S. Commercial Inventory .............. 1,082 1,115 1,119 1,052 1,038 1,076 1,078 1,045 1,019 1,061 1,068 1,039 1,052 1,045 1,039
OECD Commercial Inventory ........... 2,740 2,751 2,762 2,689 2,685 2,741 2,761 2,748 2,737 2,795 2,787 2,750 2,689 2,748 2,750
Slovakia, South Korea, Spain, Sweden, Switzerland, Turkey, the United Kingdom, and the United States.
Former Soviet Union = Armenia, Azerbaijan, Belarus, Estonia, Georgia, Kazakhstan, Kyrgyzstan, Latvia, Lithuania, Moldova, Russia, Tajikistan, Turkmenistan, Ukraine and Uzbekistan.
Notes: The approximate break between historical and forecast values is shown with historical data printed in bold; estimates and forecasts in italics.
Projections: Generated by simulation of the EIA Regional Short-Term Energy Model.
Historical data: Latest data available from Energy Information Administration databases supporting the International Petroleum Monthly ; and International Energy Agency, Monthly Oil Data Service, latest monthly release.
OPEC = Organization of Petroleum Exporting Countries: Algeria, Angola, Ecuador, Iran, Iraq, Kuwait, Libya, Nigeria, Qatar, Saudi Arabia, the United Arab Emirates, Venezuela.
(b) Includes offshore supply from Denmark, Germany, the Netherlands, Norway, and the United Kingdom.
Minor discrepancies with published historical data are due to independent rounding.
Consumption of petroleum by the non-OECD countries is "apparent consumption," which includes internal consumption, refinery fuel and loss, and bunkering.
(c) Consumption of petroleum by the OECD countries is synonymous with "petroleum product supplied," defined in the glossary of the EIA Petroleum Supply Monthly , DOE/EIA-0109.
Table 3a. International Crude Oil and Liquid Fuels Supply, Consumption, and Inventories
OECD = Organization for Economic Cooperation and Development: Australia, Austria, Belgium, Canada, the Czech Republic, Denmark, Finland,
(a) Supply includes production of crude oil (including lease condensates), natural gas plant liquids, biofuels, other liquids, and refinery processing gains.
Energy Information Administration/Short-Term Energy Outlook - January 20102009 2010 2011 Year
- = no data available
France, Germany, Greece, Hungary, Iceland, Ireland, Italy, Japan, Luxembourg, Mexico, the Netherlands, New Zealand, Norway, Poland, Portugal,
1st 2nd 3rd 4th 1st 2nd 3rd 4th 1st 2nd 3rd 4th 2009 2010 2011
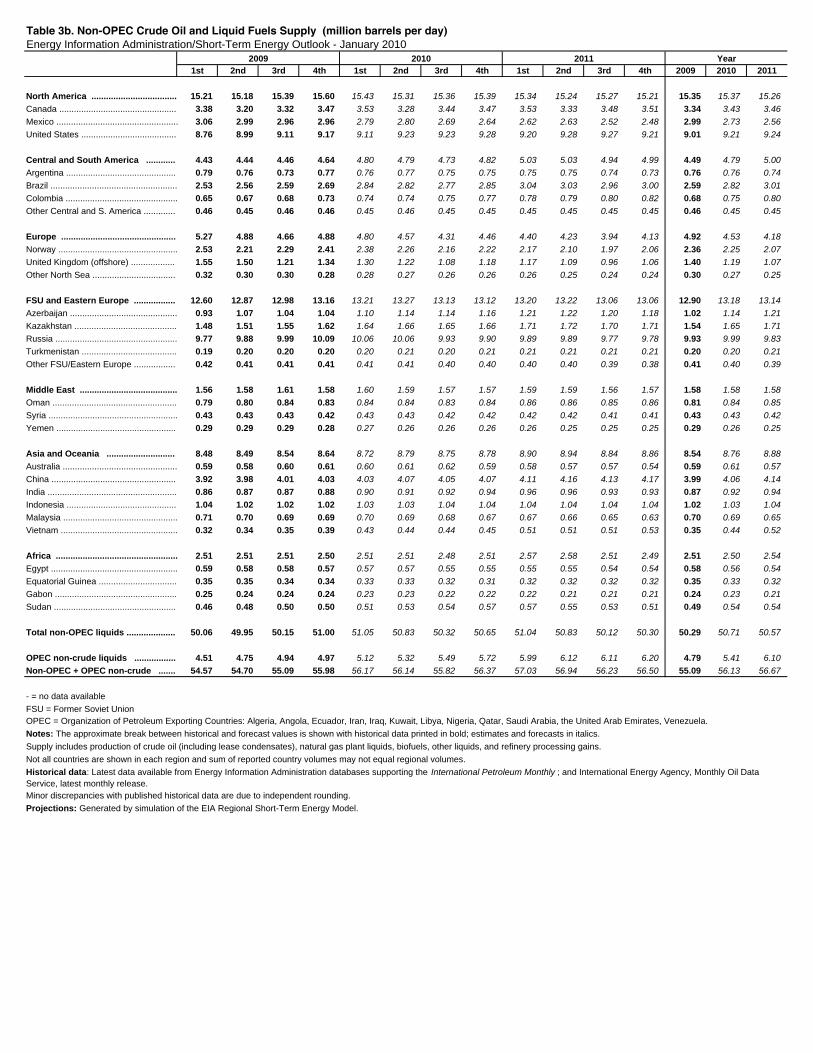
North America ................................... 15.21 15.18 15.39 15.60 15.43 15.31 15.36 15.39 15.34 15.24 15.27 15.21 15.35 15.37 15.26
Canada ................................................ 3.38 3.20 3.32 3.47 3.53 3.28 3.44 3.47 3.53 3.33 3.48 3.51 3.34 3.43 3.46
Mexico .................................................. 3.06 2.99 2.96 2.96 2.79 2.80 2.69 2.64 2.62 2.63 2.52 2.48 2.99 2.73 2.56
United States ....................................... 8.76 8.99 9.11 9.17 9.11 9.23 9.23 9.28 9.20 9.28 9.27 9.21 9.01 9.21 9.24
Central and South America ............ 4.43 4.44 4.46 4.64 4.80 4.79 4.73 4.82 5.03 5.03 4.94 4.99 4.49 4.79 5.00
Argentina ............................................. 0.79 0.76 0.73 0.77 0.76 0.77 0.75 0.75 0.75 0.75 0.74 0.73 0.76 0.76 0.74
Brazil .................................................... 2.53 2.56 2.59 2.69 2.84 2.82 2.77 2.85 3.04 3.03 2.96 3.00 2.59 2.82 3.01
Colombia .............................................. 0.65 0.67 0.68 0.73 0.74 0.74 0.75 0.77 0.78 0.79 0.80 0.82 0.68 0.75 0.80
Other Central and S. America ............. 0.46 0.45 0.46 0.46 0.45 0.46 0.45 0.45 0.45 0.45 0.45 0.45 0.46 0.45 0.45
Europe ............................................... 5.27 4.88 4.66 4.88 4.80 4.57 4.31 4.46 4.40 4.23 3.94 4.13 4.92 4.53 4.18
Norway ................................................. 2.53 2.21 2.29 2.41 2.38 2.26 2.16 2.22 2.17 2.10 1.97 2.06 2.36 2.25 2.07
United Kingdom (offshore) .................. 1.55 1.50 1.21 1.34 1.30 1.22 1.08 1.18 1.17 1.09 0.96 1.06 1.40 1.19 1.07
Other North Sea .................................. 0.32 0.30 0.30 0.28 0.28 0.27 0.26 0.26 0.26 0.25 0.24 0.24 0.30 0.27 0.25
FSU and Eastern Europe ................. 12.60 12.87 12.98 13.16 13.21 13.27 13.13 13.12 13.20 13.22 13.06 13.06 12.90 13.18 13.14
Azerbaijan ............................................ 0.93 1.07 1.04 1.04 1.10 1.14 1.14 1.16 1.21 1.22 1.20 1.18 1.02 1.14 1.21
Kazakhstan .......................................... 1.48 1.51 1.55 1.62 1.64 1.66 1.65 1.66 1.71 1.72 1.70 1.71 1.54 1.65 1.71
Russia .................................................. 9.77 9.88 9.99 10.09 10.06 10.06 9.93 9.90 9.89 9.89 9.77 9.78 9.93 9.99 9.83
Turkmenistan ....................................... 0.19 0.20 0.20 0.20 0.20 0.21 0.20 0.21 0.21 0.21 0.21 0.21 0.20 0.20 0.21
Other FSU/Eastern Europe ................. 0.42 0.41 0.41 0.41 0.41 0.41 0.40 0.40 0.40 0.40 0.39 0.38 0.41 0.40 0.39
Middle East ........................................ 1.56 1.58 1.61 1.58 1.60 1.59 1.57 1.57 1.59 1.59 1.56 1.57 1.58 1.58 1.58
Oman ................................................... 0.79 0.80 0.84 0.83 0.84 0.84 0.83 0.84 0.86 0.86 0.85 0.86 0.81 0.84 0.85
Syria ..................................................... 0.43 0.43 0.43 0.42 0.43 0.43 0.42 0.42 0.42 0.42 0.41 0.41 0.43 0.43 0.42
Yemen ................................................. 0.29 0.29 0.29 0.28 0.27 0.26 0.26 0.26 0.26 0.25 0.25 0.25 0.29 0.26 0.25
Asia and Oceania ............................ 8.48 8.49 8.54 8.64 8.72 8.79 8.75 8.78 8.90 8.94 8.84 8.86 8.54 8.76 8.88
Australia ............................................... 0.59 0.58 0.60 0.61 0.60 0.61 0.62 0.59 0.58 0.57 0.57 0.54 0.59 0.61 0.57
China ................................................... 3.92 3.98 4.01 4.03 4.03 4.07 4.05 4.07 4.11 4.16 4.13 4.17 3.99 4.06 4.14
India ..................................................... 0.86 0.87 0.87 0.88 0.90 0.91 0.92 0.94 0.96 0.96 0.93 0.93 0.87 0.92 0.94
Indonesia ............................................. 1.04 1.02 1.02 1.02 1.03 1.03 1.04 1.04 1.04 1.04 1.04 1.04 1.02 1.03 1.04
Malaysia ............................................... 0.71 0.70 0.69 0.69 0.70 0.69 0.68 0.67 0.67 0.66 0.65 0.63 0.70 0.69 0.65
Vietnam ................................................ 0.32 0.34 0.35 0.39 0.43 0.44 0.44 0.45 0.51 0.51 0.51 0.53 0.35 0.44 0.52
Africa .................................................. 2.51 2.51 2.51 2.50 2.51 2.51 2.48 2.51 2.57 2.58 2.51 2.49 2.51 2.50 2.54
Egypt .................................................... 0.59 0.58 0.58 0.57 0.57 0.57 0.55 0.55 0.55 0.55 0.54 0.54 0.58 0.56 0.54
Equatorial Guinea ................................ 0.35 0.35 0.34 0.34 0.33 0.33 0.32 0.31 0.32 0.32 0.32 0.32 0.35 0.33 0.32
Gabon .................................................. 0.25 0.24 0.24 0.24 0.23 0.23 0.22 0.22 0.22 0.21 0.21 0.21 0.24 0.23 0.21
Sudan .................................................. 0.46 0.48 0.50 0.50 0.51 0.53 0.54 0.57 0.57 0.55 0.53 0.51 0.49 0.54 0.54
Total non-OPEC liquids .................... 50.06 49.95 50.15 51.00 51.05 50.83 50.32 50.65 51.04 50.83 50.12 50.30 50.29 50.71 50.57
OPEC non-crude liquids ................. 4.51 4.75 4.94 4.97 5.12 5.32 5.49 5.72 5.99 6.12 6.11 6.20 4.79 5.41 6.10
Non-OPEC + OPEC non-crude ....... 54.57 54.70 55.09 55.98 56.17 56.14 55.82 56.37 57.03 56.94 56.23 56.50 55.09 56.13 56.67
Table 3b. Non-OPEC Crude Oil and Liquid Fuels Supply (million barrels per day)
OPEC = Organization of Petroleum Exporting Countries: Algeria, Angola, Ecuador, Iran, Iraq, Kuwait, Libya, Nigeria, Qatar, Saudi Arabia, the United Arab Emirates, Venezuela.
Notes: The approximate break between historical and forecast values is shown with historical data printed in bold; estimates and forecasts in italics.
FSU = Former Soviet Union
- = no data available
Energy Information Administration/Short-Term Energy Outlook - January 20102009 2010 2011 Year
Projections: Generated by simulation of the EIA Regional Short-Term Energy Model.
Historical data: Latest data available from Energy Information Administration databases supporting the International Petroleum Monthly ; and International Energy Agency, Monthly Oil Data Service, latest monthly release.
Supply includes production of crude oil (including lease condensates), natural gas plant liquids, biofuels, other liquids, and refinery processing gains.
Not all countries are shown in each region and sum of reported country volumes may not equal regional volumes.
Minor discrepancies with published historical data are due to independent rounding.
1st 2nd 3rd 4th 1st 2nd 3rd 4th 1st 2nd 3rd 4th 2009 2010 2011
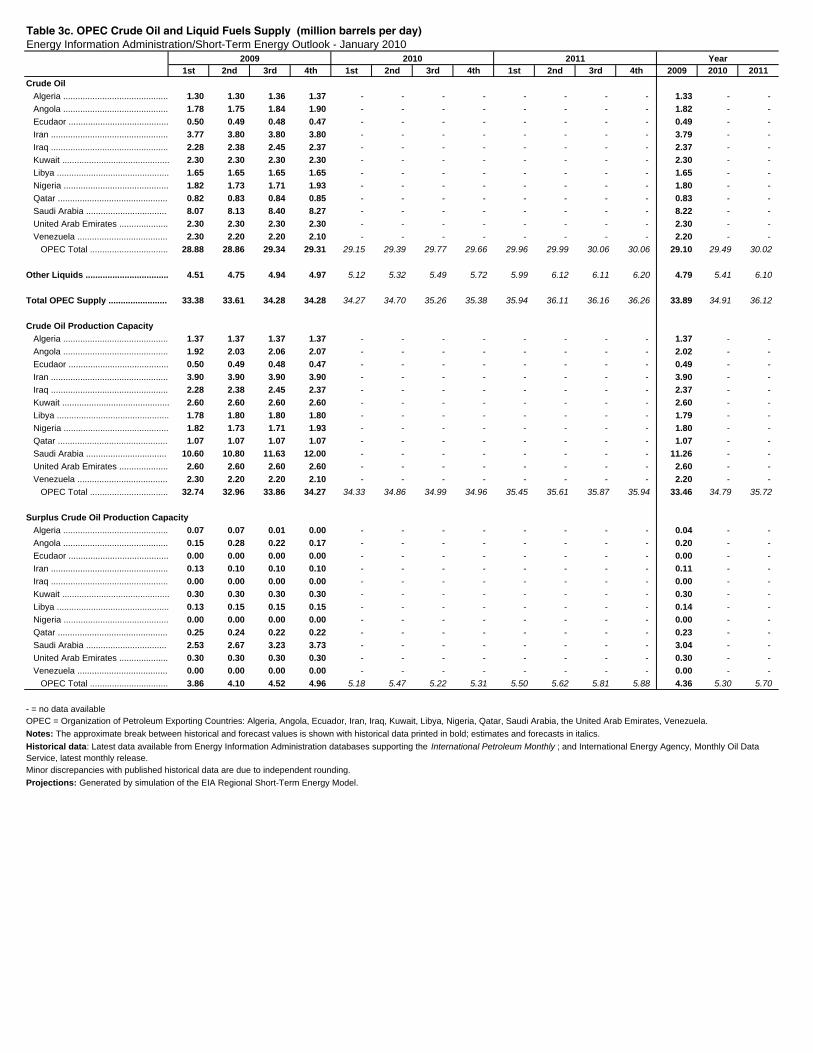
Crude Oil
Algeria ........................................... 1.30 1.30 1.36 1.37 - - - - - - - - 1.33 - -
Angola ........................................... 1.78 1.75 1.84 1.90 - - - - - - - - 1.82 - -
Ecudaor ......................................... 0.50 0.49 0.48 0.47 - - - - - - - - 0.49 - -
Iran ................................................ 3.77 3.80 3.80 3.80 - - - - - - - - 3.79 - -
Iraq ................................................ 2.28 2.38 2.45 2.37 - - - - - - - - 2.37 - -
Kuwait ............................................ 2.30 2.30 2.30 2.30 - - - - - - - - 2.30 - -
Libya .............................................. 1.65 1.65 1.65 1.65 - - - - - - - - 1.65 - -
Nigeria ........................................... 1.82 1.73 1.71 1.93 - - - - - - - - 1.80 - -
Qatar ............................................. 0.82 0.83 0.84 0.85 - - - - - - - - 0.83 - -
Saudi Arabia ................................. 8.07 8.13 8.40 8.27 - - - - - - - - 8.22 - -
United Arab Emirates .................... 2.30 2.30 2.30 2.30 - - - - - - - - 2.30 - -
Venezuela ..................................... 2.30 2.20 2.20 2.10 - - - - - - - - 2.20 - -
OPEC Total ................................ 28.88 28.86 29.34 29.31 29.15 29.39 29.77 29.66 29.96 29.99 30.06 30.06 29.10 29.49 30.02
Other Liquids .................................. 4.51 4.75 4.94 4.97 5.12 5.32 5.49 5.72 5.99 6.12 6.11 6.20 4.79 5.41 6.10
Total OPEC Supply ........................ 33.38 33.61 34.28 34.28 34.27 34.70 35.26 35.38 35.94 36.11 36.16 36.26 33.89 34.91 36.12
Crude Oil Production Capacity
Algeria ........................................... 1.37 1.37 1.37 1.37 - - - - - - - - 1.37 - -
Angola ........................................... 1.92 2.03 2.06 2.07 - - - - - - - - 2.02 - -
Ecudaor ......................................... 0.50 0.49 0.48 0.47 - - - - - - - - 0.49 - -
Iran ................................................ 3.90 3.90 3.90 3.90 - - - - - - - - 3.90 - -
Iraq ................................................ 2.28 2.38 2.45 2.37 - - - - - - - - 2.37 - -
Kuwait ............................................ 2.60 2.60 2.60 2.60 - - - - - - - - 2.60 - -
Libya .............................................. 1.78 1.80 1.80 1.80 - - - - - - - - 1.79 - -
Nigeria ........................................... 1.82 1.73 1.71 1.93 - - - - - - - - 1.80 - -
Qatar ............................................. 1.07 1.07 1.07 1.07 - - - - - - - - 1.07 - -
Saudi Arabia ................................. 10.60 10.80 11.63 12.00 - - - - - - - - 11.26 - -
United Arab Emirates .................... 2.60 2.60 2.60 2.60 - - - - - - - - 2.60 - -
Venezuela ..................................... 2.30 2.20 2.20 2.10 - - - - - - - - 2.20 - -
OPEC Total ................................ 32.74 32.96 33.86 34.27 34.33 34.86 34.99 34.96 35.45 35.61 35.87 35.94 33.46 34.79 35.72
Surplus Crude Oil Production Capacity
Algeria ........................................... 0.07 0.07 0.01 0.00 - - - - - - - - 0.04 - -
Angola ........................................... 0.15 0.28 0.22 0.17 - - - - - - - - 0.20 - -
Ecudaor ......................................... 0.00 0.00 0.00 0.00 - - - - - - - - 0.00 - -
Iran ................................................ 0.13 0.10 0.10 0.10 - - - - - - - - 0.11 - -
Iraq ................................................ 0.00 0.00 0.00 0.00 - - - - - - - - 0.00 - -
Kuwait ............................................ 0.30 0.30 0.30 0.30 - - - - - - - - 0.30 - -
Libya .............................................. 0.13 0.15 0.15 0.15 - - - - - - - - 0.14 - -
Nigeria ........................................... 0.00 0.00 0.00 0.00 - - - - - - - - 0.00 - -
Qatar ............................................. 0.25 0.24 0.22 0.22 - - - - - - - - 0.23 - -
Saudi Arabia ................................. 2.53 2.67 3.23 3.73 - - - - - - - - 3.04 - -
United Arab Emirates .................... 0.30 0.30 0.30 0.30 - - - - - - - - 0.30 - -
Venezuela ..................................... 0.00 0.00 0.00 0.00 - - - - - - - - 0.00 - -
OPEC Total ................................ 3.86 4.10 4.52 4.96 5.18 5.47 5.22 5.31 5.50 5.62 5.81 5.88 4.36 5.30 5.70
- = no data available
Table 3c. OPEC Crude Oil and Liquid Fuels Supply (million barrels per day)Energy Information Administration/Short-Term Energy Outlook - January 2010
2009 2010 2011 Year
OPEC = Organization of Petroleum Exporting Countries: Algeria, Angola, Ecuador, Iran, Iraq, Kuwait, Libya, Nigeria, Qatar, Saudi Arabia, the United Arab Emirates, Venezuela.
Notes: The approximate break between historical and forecast values is shown with historical data printed in bold; estimates and forecasts in italics.
Minor discrepancies with published historical data are due to independent rounding.
Projections: Generated by simulation of the EIA Regional Short-Term Energy Model.
Historical data: Latest data available from Energy Information Administration databases supporting the International Petroleum Monthly ; and International Energy Agency, Monthly Oil Data Service, latest monthly release.
Q1 Q2 Q3 Q4 Q1 Q2 Q3 Q4 Q1 Q2 Q3 Q4 2009 2010 2011
North America ............................................................ 23.10 22.57 22.96 23.10 23.35 22.93 22.95 23.21 23.52 23.20 23.34 23.53 22.93 23.11 23.40Canada ........................................................................ 2.20 2.08 2.22 2.25 2.24 2.09 2.20 2.24 2.25 2.16 2.27 2.26 2.19 2.19 2.23Mexico ......................................................................... 2.05 2.01 2.10 2.03 2.01 2.04 1.99 2.00 2.04 2.07 2.02 2.03 2.05 2.01 2.04United States ............................................................... 18.84 18.47 18.62 18.81 19.09 18.79 18.75 18.96 19.22 18.96 19.04 19.23 18.68 18.90 19.11
Central and South America ..................................... 6.05 6.37 6.25 6.34 6.28 6.54 6.52 6.51 6.44 6.70 6.69 6.68 6.25 6.46 6.63Brazil ............................................................................ 2.46 2.59 2.65 2.62 2.60 2.71 2.77 2.74 2.71 2.82 2.88 2.85 2.58 2.70 2.81
Europe ....................................................................... 15.68 15.00 15.29 15.84 15.55 15.10 15.60 15.76 15.52 15.14 15.66 15.78 15.45 15.50 15.53
FSU and Eastern Europe ........................................... 4.09 4.19 4.24 4.33 4.11 4.13 4.28 4.24 4.09 4.14 4.28 4.25 4.22 4.19 4.19Russia .......................................................................... 2.73 2.81 2.80 2.90 2.72 2.74 2.83 2.79 2.71 2.76 2.84 2.80 2.81 2.77 2.78
Middle East ................................................................ 6.17 7.00 7.67 6.71 6.42 7.09 7.54 6.91 6.75 7.18 7.62 6.99 6.89 6.99 7.14
Asia and Oceania ..................................................... 25.05 25.25 24.76 25.37 26.09 25.49 24.91 25.88 27.01 26.22 25.63 26.39 25.11 25.59 26.31China ........................................................................... 7.62 8.44 8.33 8.48 8.39 8.75 8.63 8.75 8.99 9.22 9.09 9.01 8.22 8.63 9.08Japan ........................................................................... 4.72 4.03 4.10 4.26 4.49 3.71 3.74 4.09 4.36 3.62 3.64 3.98 4.28 4.00 3.90India ............................................................................. 3.16 3.16 2.96 3.08 3.37 3.33 3.05 3.30 3.58 3.45 3.17 3.41 3.09 3.26 3.40
Africa .......................................................................... 3.28 3.25 3.15 3.28 3.39 3.36 3.26 3.36 3.50 3.44 3.40 3.46 3.24 3.34 3.45
Total OECD Liquid Fuels Consumption .................. 46.40 44.36 44.96 45.96 46.39 44.48 44.94 45.99 46.59 44.87 45.46 46.39 45.42 45.45 45.83Total non-OECD Liquid Fuels Consumption ........... 37.02 39.28 39.36 39.03 38.79 40.15 40.11 39.86 40.26 41.15 41.16 40.69 38.68 39.73 40.82
Total World Liquid Fuels Consumption ................... 83.42 83.64 84.32 84.98 85.18 84.64 85.06 85.85 86.84 86.03 86.62 87.08 84.10 85.18 86.65
World Real Gross Domestic Product (a) .................Index, 2007 Q1 = 100 .................................................. 102.29 102.69 103.32 103.65 104.18 105.30 106.18 106.68 107.59 109.02 110.28 111.11 102.99 105.59 109.51Percent change from prior year ................................... -1.6 -1.9 -1.2 0.4 1.8 2.5 2.8 2.9 3.3 3.5 3.9 4.2 -1.1 2.5 3.7
Real U.S. Dollar Exchange Rate (a)
Index, January 2007 = 100 .......................................... 104.10 100.90 97.91 95.55 95.71 96.38 96.64 96.82 96.56 96.37 95.87 95.94 99.59 96.39 96.18Percent change from prior year ................................... 13.8 12.0 6.5 -5.6 -8.1 -4.5 -1.3 1.3 0.9 0.0 -0.8 -0.9 6.3 -3.2 -0.2
Table 3d. World Liquid Fuels Consumption (million barrels per day)Energy Information Administration/Short-Term Energy Outlook - January 2010
2009 2010 2011
- = no data available
Notes: The approximate break between historical and forecast values is shown with historical data printed in bold; estimates and forecasts in italics.
Historical data: Latest data available from Energy Information Administration databases supporting the International Petroleum Monthly ; and International Energy Agency, Monthly Oil Data Service.
Minor discrepancies with published historical data are due to independent rounding.
FSU = Former Soviet Union
(a) Weighted geometric mean of real indices for various countries with weights equal to each country's share of world oil consumption in the base period. Exchange rate is measured in foreign currency per U.S. dollar.
Projections: Generated by simulation of the EIA Regional Short-Term Energy Model.
OECD = Organization for Economic Cooperation and Development: Australia, Austria, Belgium, Canada, the Czech Republic, Denmark, Finland,
France, Germany, Greece, Hungary, Iceland, Ireland, Italy, Japan, Luxembourg, Mexico, the Netherlands, New Zealand, Norway, Poland, Portugal,
Slovakia, South Korea, Spain, Sweden, Switzerland, Turkey, the United Kingdom, and the United States.
1st 2nd 3rd 4th 1st 2nd 3rd 4th 1st 2nd 3rd 4th 2009 2010 2011
Supply (million barrels per day)
Crude Oil Supply
Domestic Production (a) ......................................... 5.24 5.26 5.32 5.43 5.43 5.43 5.40 5.52 5.45 5.43 5.40 5.41 5.31 5.45 5.42
Alaska ................................................................. 0.70 0.63 0.59 0.66 0.64 0.58 0.53 0.59 0.58 0.56 0.54 0.52 0.65 0.58 0.55
Federal Gulf of Mexico (b) ................................... 1.39 1.48 1.60 1.68 1.64 1.60 1.62 1.63 1.50 1.41 1.41 1.43 1.54 1.62 1.44
Lower 48 States (excl GOM) ............................... 3.14 3.15 3.13 3.09 3.15 3.25 3.26 3.29 3.37 3.47 3.45 3.46 3.13 3.24 3.44
Crude Oil Net Imports (c) ........................................ 9.48 9.12 9.07 8.33 8.72 9.08 9.06 8.64 8.68 9.17 9.21 8.91 9.00 8.88 9.00
SPR Net Withdrawals ............................................ -0.12 -0.12 -0.01 -0.02 0.00 0.00 0.00 0.00 0.00 0.00 0.00 0.00 -0.07 0.00 0.00
Commercial Inventory Net Withdrawals ................. -0.44 0.19 0.15 0.08 -0.21 0.05 0.16 0.04 -0.18 0.03 0.15 0.04 0.00 0.01 0.01
Crude Oil Adjustment (d) ........................................ -0.02 0.13 0.09 0.03 0.03 0.07 0.01 -0.03 0.05 0.07 0.02 -0.02 0.06 0.02 0.03
Total Crude Oil Input to Refineries ............................ 14.11 14.55 14.63 13.92 13.97 14.63 14.65 14.18 14.00 14.71 14.79 14.33 14.30 14.36 14.46
Other Supply
Refinery Processing Gain ....................................... 0.93 1.00 1.00 0.98 0.96 0.97 0.98 0.99 0.97 0.99 0.99 1.01 0.98 0.98 0.99
Natural Gas Liquids Production ............................. 1.79 1.90 1.91 1.85 1.80 1.87 1.88 1.80 1.80 1.87 1.86 1.78 1.86 1.84 1.83
Renewables and Oxygenate Production (e) ........... 0.67 0.70 0.76 0.78 0.80 0.82 0.83 0.84 0.85 0.86 0.87 0.88 0.73 0.82 0.87
Fuel Ethanol Production ...................................... 0.64 0.67 0.73 0.74 0.76 0.78 0.80 0.80 0.82 0.83 0.84 0.85 0.69 0.79 0.84
Petroleum Products Adjustment (f) ........................ 0.13 0.12 0.12 0.13 0.13 0.13 0.13 0.13 0.13 0.13 0.13 0.13 0.13 0.13 0.13
Product Net Imports (c) .......................................... 1.29 0.74 0.41 0.51 1.06 0.84 0.47 0.70 1.01 0.90 0.61 0.81 0.73 0.76 0.83
Pentanes Plus ..................................................... -0.03 -0.03 -0.03 -0.01 -0.01 -0.01 -0.02 0.00 0.00 -0.01 -0.02 0.00 -0.02 -0.01 -0.01
Liquefied Petroleum Gas ..................................... 0.13 0.06 0.01 0.03 0.03 0.03 0.02 0.09 0.02 0.00 0.05 0.10 0.06 0.04 0.04
Unfinished Oils .................................................... 0.68 0.68 0.74 0.63 0.68 0.70 0.71 0.69 0.68 0.70 0.72 0.69 0.68 0.70 0.70
Other HC/Oxygenates .......................................... -0.04 -0.03 -0.02 -0.03 -0.03 -0.03 -0.03 -0.03 -0.02 -0.03 -0.03 -0.03 -0.03 -0.03 -0.03
Motor Gasoline Blend Comp. .............................. 0.85 0.71 0.65 0.71 0.70 0.79 0.70 0.69 0.71 0.84 0.73 0.73 0.73 0.72 0.75
Finished Motor Gasoline ..................................... 0.09 0.05 0.03 -0.01 0.11 0.07 0.07 0.00 0.08 0.08 0.09 0.02 0.04 0.06 0.07
Jet Fuel ................................................................ 0.02 0.01 0.04 0.03 -0.01 0.03 0.01 0.00 0.00 0.04 0.01 0.00 0.03 0.01 0.01
Distillate Fuel Oil ................................................. -0.26 -0.43 -0.43 -0.41 -0.17 -0.38 -0.46 -0.35 -0.19 -0.37 -0.47 -0.34 -0.38 -0.34 -0.34
Residual Fuel Oil ................................................. 0.06 0.00 -0.23 -0.12 0.03 -0.04 -0.16 -0.09 -0.01 -0.04 -0.12 -0.07 -0.08 -0.06 -0.06
Other Oils (g) ....................................................... -0.21 -0.28 -0.34 -0.29 -0.28 -0.33 -0.38 -0.31 -0.25 -0.32 -0.35 -0.30 -0.28 -0.33 -0.31
Product Inventory Net Withdrawals ........................ -0.08 -0.55 -0.20 0.65 0.36 -0.47 -0.19 0.32 0.46 -0.50 -0.22 0.28 -0.04 0.01 0.00
Total Supply ............................................................... 18.84 18.47 18.62 18.81 19.09 18.79 18.75 18.96 19.22 18.96 19.04 19.23 18.68 18.90 19.11
Consumption (million barrels per day)
Natural Gas Liquids and Other Liquids
Pentanes Plus ........................................................ 0.03 0.06 0.09 0.10 0.08 0.07 0.07 0.09 0.07 0.07 0.07 0.08 0.07 0.08 0.07
Liquefied Petroleum Gas ........................................ 2.07 1.76 1.87 2.11 2.16 1.75 1.78 2.00 2.17 1.71 1.78 2.00 1.95 1.92 1.92
Unfinished Oils ....................................................... 0.00 -0.19 -0.05 -0.04 0.01 -0.05 -0.05 0.01 0.00 -0.05 -0.04 0.01 -0.07 -0.02 -0.02
Finished Liquid Fuels
Motor Gasoline ....................................................... 8.79 9.09 9.15 8.98 8.85 9.14 9.19 9.03 8.91 9.20 9.27 9.10 9.00 9.05 9.12
Jet Fuel ................................................................... 1.38 1.39 1.46 1.43 1.39 1.46 1.45 1.41 1.39 1.48 1.48 1.44 1.41 1.43 1.45
Distillate Fuel Oil .................................................... 3.91 3.48 3.44 3.66 3.93 3.61 3.52 3.73 4.00 3.68 3.60 3.80 3.62 3.70 3.77
Residual Fuel Oil .................................................... 0.61 0.59 0.39 0.49 0.61 0.56 0.47 0.54 0.60 0.56 0.50 0.56 0.52 0.55 0.55
Other Oils (f) ........................................................... 2.05 2.30 2.27 2.09 2.05 2.25 2.31 2.16 2.09 2.30 2.39 2.23 2.18 2.19 2.25
Total Consumption .................................................... 18.84 18.47 18.62 18.81 19.09 18.79 18.75 18.96 19.22 18.96 19.04 19.23 18.68 18.90 19.11
Total Liquid Fuels Net Imports ................................ 10.76 9.86 9.48 8.84 9.78 9.91 9.53 9.34 9.69 10.07 9.82 9.72 9.73 9.64 9.83
End-of-period Inventories (million barrels)
Commercial Inventory
Crude Oil (excluding SPR) ..................................... 365.8 348.7 334.6 327.3 345.9 341.2 326.0 321.9 337.7 334.6 320.5 317.0 327.3 321.9 317.0
Pentanes Plus ........................................................ 15.8 17.0 15.0 12.5 12.3 13.7 14.3 11.9 12.0 13.7 14.4 12.0 12.5 11.9 12.0
Liquefied Petroleum Gas ........................................ 90.2 132.3 155.6 112.5 77.2 116.7 144.9 113.3 75.8 115.1 144.5 112.6 112.5 113.3 112.6
Unfinished Oils ....................................................... 93.8 91.7 85.6 78.8 91.5 89.2 89.9 82.9 93.5 89.9 90.0 83.1 78.8 82.9 83.1
Other HC/Oxygenates ............................................. 17.2 15.1 16.5 16.5 16.9 17.3 17.6 17.2 17.9 18.2 18.5 18.1 16.5 17.2 18.1
Total Motor Gasoline .............................................. 216.7 214.0 212.1 219.7 220.3 219.6 210.3 218.4 214.8 215.0 207.8 218.0 219.7 218.4 218.0
Finished Motor Gasoline ..................................... 88.2 87.9 84.2 85.1 84.5 88.7 85.6 90.3 84.3 87.5 85.0 89.7 85.1 90.3 89.7
Motor Gasoline Blend Comp. .............................. 128.5 126.1 127.9 134.6 135.8 130.9 124.7 128.0 130.5 127.4 122.7 128.3 134.6 128.0 128.3
Jet Fuel ................................................................... 41.6 43.9 45.5 41.7 41.1 41.5 41.9 40.7 40.0 40.9 41.7 40.9 41.7 40.7 40.9
Distillate Fuel Oil .................................................... 143.6 160.0 172.2 159.0 137.8 144.0 149.1 149.8 129.4 139.2 145.8 148.7 159.0 149.8 148.7
Residual Fuel Oil .................................................... 39.0 37.0 35.4 37.2 37.5 38.1 37.2 39.1 38.8 38.8 37.2 39.0 37.2 39.1 39.0
Other Oils (f) ........................................................... 58.5 55.2 47.0 47.0 57.2 54.8 46.9 49.4 58.9 56.0 47.5 49.4 47.0 49.4 49.4
Total Commercial Inventory ....................................... 1,082 1,115 1,119 1,052 1,038 1,076 1,078 1,045 1,019 1,061 1,068 1,039 1,052 1,045 1,039
Crude Oil in SPR ....................................................... 713 724 725 727 727 727 727 727 727 727 727 727 727 727 727
Heating Oil Reserve .................................................. 2.0 2.0 2.0 2.0 2.0 2.0 2.0 2.0 2.0 2.0 2.0 2.0 2.0 2.0 2.0
(a) Includes lease condensate.
HC: Hydrocarbons
SPR: Strategic Petroleum Reserve
(g) "Other Oils" inludes aviation gasoline blend components, finished aviation gasoline, kerosene, petrochemical feedstocks, special naphthas, lubricants, waxes, petroleum coke, asphalt and road oil, still gas, and miscellaneous products.
(f) Petroleum products adjustment includes hydrogen/oxygenates/renewables/other hydrocarbons, motor gasoline blend components, and finished motor gasoline.
Notes: The approximate break between historical and forecast values is shown with historical data printed in bold; estimates and forecasts in italics.
(e) Renewables and oxygenate production includes pentanes plus, oxygenates (excluding fuel ethanol), and renewable fuels.
Petroleum Supply Annual , DOE/EIA-0340/2; and Weekly Petroleum Status Report , DOE/EIA-0208.
Historical data: Latest data available from Energy Information Administration databases supporting the following reports: Petroleum Supply Monthly , DOE/EIA-0109;
Minor discrepancies with published historical data are due to independent rounding.
Projections: Generated by simulation of the EIA Regional Short-Term Energy Model.
- = no data available
(d) Crude oil adjustment balances supply and consumption and was previously referred to as "Unaccounted for Crude Oil."
(c) Net imports equals gross imports minus gross exports.
Table 4a. U.S. Crude Oil and Liquid Fuels Supply, Consumption, and InventoriesEnergy Information Administration/Short-Term Energy Outlook - January 2010
2009 2010 2011 Year
(b) Crude oil production from U.S. Federal leases in the Gulf of Mexico (GOM).
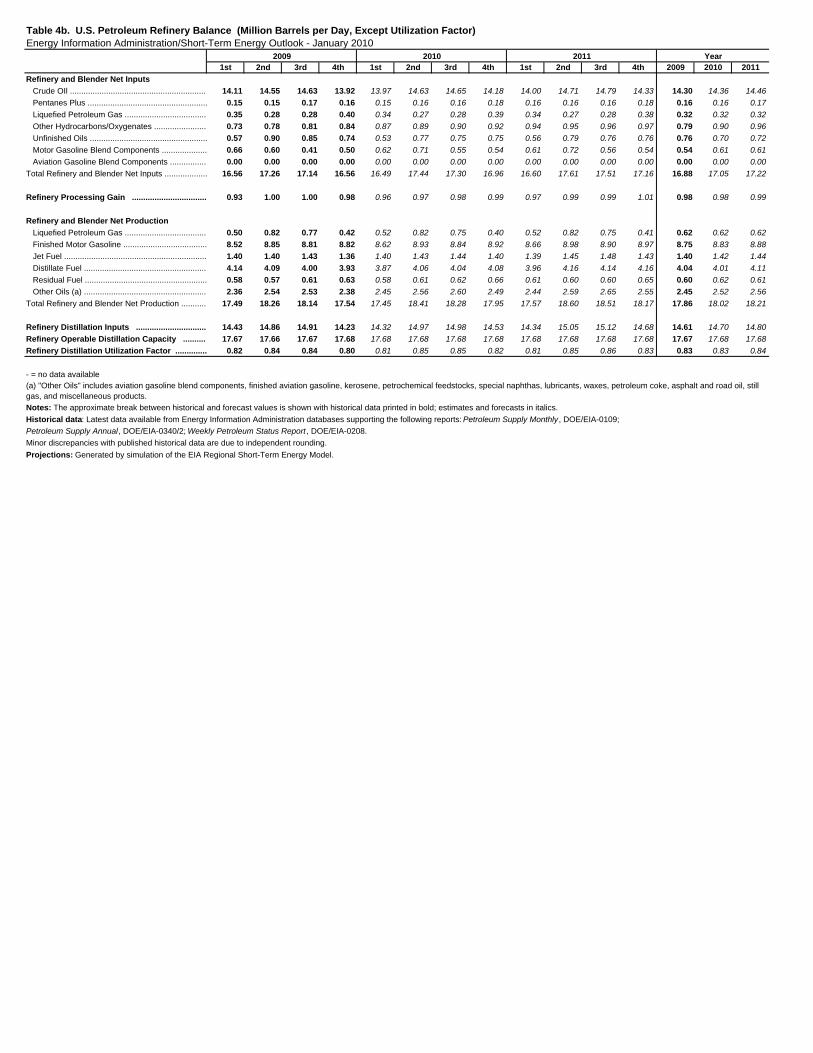
1st 2nd 3rd 4th 1st 2nd 3rd 4th 1st 2nd 3rd 4th 2009 2010 2011
Refinery and Blender Net Inputs
Crude OIl ............................................................ 14.11 14.55 14.63 13.92 13.97 14.63 14.65 14.18 14.00 14.71 14.79 14.33 14.30 14.36 14.46
Pentanes Plus ..................................................... 0.15 0.15 0.17 0.16 0.15 0.16 0.16 0.18 0.16 0.16 0.16 0.18 0.16 0.16 0.17
Liquefied Petroleum Gas .................................... 0.35 0.28 0.28 0.40 0.34 0.27 0.28 0.39 0.34 0.27 0.28 0.38 0.32 0.32 0.32
Other Hydrocarbons/Oxygenates ....................... 0.73 0.78 0.81 0.84 0.87 0.89 0.90 0.92 0.94 0.95 0.96 0.97 0.79 0.90 0.96
Unfinished Oils .................................................... 0.57 0.90 0.85 0.74 0.53 0.77 0.75 0.75 0.56 0.79 0.76 0.76 0.76 0.70 0.72
Motor Gasoline Blend Components .................... 0.66 0.60 0.41 0.50 0.62 0.71 0.55 0.54 0.61 0.72 0.56 0.54 0.54 0.61 0.61
Aviation Gasoline Blend Components ................ 0.00 0.00 0.00 0.00 0.00 0.00 0.00 0.00 0.00 0.00 0.00 0.00 0.00 0.00 0.00
Total Refinery and Blender Net Inputs ................... 16.56 17.26 17.14 16.56 16.49 17.44 17.30 16.96 16.60 17.61 17.51 17.16 16.88 17.05 17.22
Refinery Processing Gain ................................. 0.93 1.00 1.00 0.98 0.96 0.97 0.98 0.99 0.97 0.99 0.99 1.01 0.98 0.98 0.99
Refinery and Blender Net Production
Liquefied Petroleum Gas .................................... 0.50 0.82 0.77 0.42 0.52 0.82 0.75 0.40 0.52 0.82 0.75 0.41 0.62 0.62 0.62
Finished Motor Gasoline ..................................... 8.52 8.85 8.81 8.82 8.62 8.93 8.84 8.92 8.66 8.98 8.90 8.97 8.75 8.83 8.88
Jet Fuel ............................................................... 1.40 1.40 1.43 1.36 1.40 1.43 1.44 1.40 1.39 1.45 1.48 1.43 1.40 1.42 1.44
Distillate Fuel ...................................................... 4.14 4.09 4.00 3.93 3.87 4.06 4.04 4.08 3.96 4.16 4.14 4.16 4.04 4.01 4.11
Residual Fuel ...................................................... 0.58 0.57 0.61 0.63 0.58 0.61 0.62 0.66 0.61 0.60 0.60 0.65 0.60 0.62 0.61
Other Oils (a) ...................................................... 2.36 2.54 2.53 2.38 2.45 2.56 2.60 2.49 2.44 2.59 2.65 2.55 2.45 2.52 2.56
Total Refinery and Blender Net Production ........... 17.49 18.26 18.14 17.54 17.45 18.41 18.28 17.95 17.57 18.60 18.51 18.17 17.86 18.02 18.21
Refinery Distillation Inputs ............................... 14.43 14.86 14.91 14.23 14.32 14.97 14.98 14.53 14.34 15.05 15.12 14.68 14.61 14.70 14.80
Refinery Operable Distillation Capacity .......... 17.67 17.66 17.67 17.68 17.68 17.68 17.68 17.68 17.68 17.68 17.68 17.68 17.67 17.68 17.68
Refinery Distillation Utilization Factor .............. 0.82 0.84 0.84 0.80 0.81 0.85 0.85 0.82 0.81 0.85 0.86 0.83 0.83 0.83 0.84
- = no data available
Table 4b. U.S. Petroleum Refinery Balance (Million Barrels per Day, Except Utilization Factor)Energy Information Administration/Short-Term Energy Outlook - January 2010
2009 2010 2011 Year
Notes: The approximate break between historical and forecast values is shown with historical data printed in bold; estimates and forecasts in italics.
(a) "Other Oils" includes aviation gasoline blend components, finished aviation gasoline, kerosene, petrochemical feedstocks, special naphthas, lubricants, waxes, petroleum coke, asphalt and road oil, still gas, and miscellaneous products.
Minor discrepancies with published historical data are due to independent rounding.
Projections: Generated by simulation of the EIA Regional Short-Term Energy Model.
Petroleum Supply Annual, DOE/EIA-0340/2; Weekly Petroleum Status Report , DOE/EIA-0208.
Historical data: Latest data available from Energy Information Administration databases supporting the following reports: Petroleum Supply Monthly , DOE/EIA-0109;
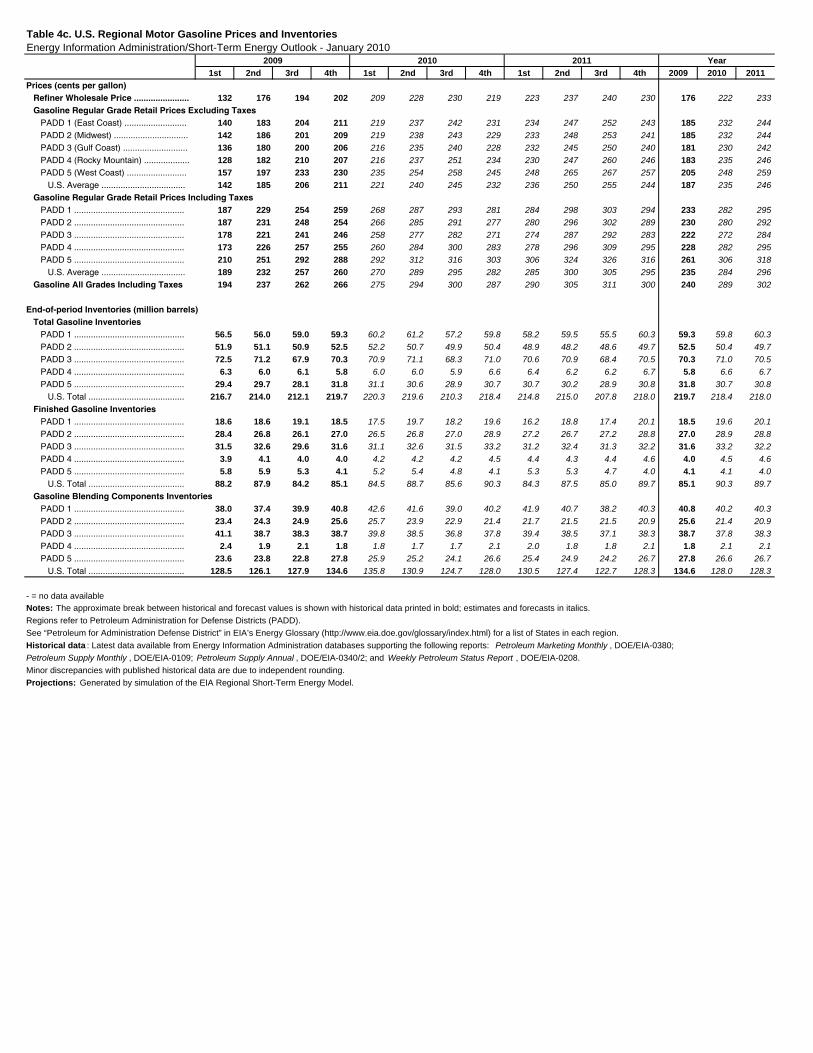
1st 2nd 3rd 4th 1st 2nd 3rd 4th 1st 2nd 3rd 4th 2009 2010 2011
Prices (cents per gallon) Refiner Wholesale Price ....................... 132 176 194 202 209 228 230 219 223 237 240 230 176 222 233
Gasoline Regular Grade Retail Prices Excluding Taxes PADD 1 (East Coast) .......................... 140 183 204 211 219 237 242 231 234 247 252 243 185 232 244
PADD 2 (Midwest) ............................... 142 186 201 209 219 238 243 229 233 248 253 241 185 232 244
PADD 3 (Gulf Coast) ........................... 136 180 200 206 216 235 240 228 232 245 250 240 181 230 242
PADD 4 (Rocky Mountain) ................... 128 182 210 207 216 237 251 234 230 247 260 246 183 235 246
PADD 5 (West Coast) ......................... 157 197 233 230 235 254 258 245 248 265 267 257 205 248 259
U.S. Average ................................... 142 185 206 211 221 240 245 232 236 250 255 244 187 235 246
Gasoline Regular Grade Retail Prices Including Taxes PADD 1 .............................................. 187 229 254 259 268 287 293 281 284 298 303 294 233 282 295
PADD 2 .............................................. 187 231 248 254 266 285 291 277 280 296 302 289 230 280 292
PADD 3 .............................................. 178 221 241 246 258 277 282 271 274 287 292 283 222 272 284
PADD 4 .............................................. 173 226 257 255 260 284 300 283 278 296 309 295 228 282 295
PADD 5 .............................................. 210 251 292 288 292 312 316 303 306 324 326 316 261 306 318
U.S. Average ................................... 189 232 257 260 270 289 295 282 285 300 305 295 235 284 296
Gasoline All Grades Including Taxes 194 237 262 266 275 294 300 287 290 305 311 300 240 289 302
End-of-period Inventories (million barrels) Total Gasoline Inventories PADD 1 .............................................. 56.5 56.0 59.0 59.3 60.2 61.2 57.2 59.8 58.2 59.5 55.5 60.3 59.3 59.8 60.3
PADD 2 .............................................. 51.9 51.1 50.9 52.5 52.2 50.7 49.9 50.4 48.9 48.2 48.6 49.7 52.5 50.4 49.7
PADD 3 .............................................. 72.5 71.2 67.9 70.3 70.9 71.1 68.3 71.0 70.6 70.9 68.4 70.5 70.3 71.0 70.5
PADD 4 .............................................. 6.3 6.0 6.1 5.8 6.0 6.0 5.9 6.6 6.4 6.2 6.2 6.7 5.8 6.6 6.7
PADD 5 .............................................. 29.4 29.7 28.1 31.8 31.1 30.6 28.9 30.7 30.7 30.2 28.9 30.8 31.8 30.7 30.8
U.S. Total ........................................ 216.7 214.0 212.1 219.7 220.3 219.6 210.3 218.4 214.8 215.0 207.8 218.0 219.7 218.4 218.0
Finished Gasoline Inventories PADD 1 .............................................. 18.6 18.6 19.1 18.5 17.5 19.7 18.2 19.6 16.2 18.8 17.4 20.1 18.5 19.6 20.1
PADD 2 .............................................. 28.4 26.8 26.1 27.0 26.5 26.8 27.0 28.9 27.2 26.7 27.2 28.8 27.0 28.9 28.8
PADD 3 .............................................. 31.5 32.6 29.6 31.6 31.1 32.6 31.5 33.2 31.2 32.4 31.3 32.2 31.6 33.2 32.2
PADD 4 .............................................. 3.9 4.1 4.0 4.0 4.2 4.2 4.2 4.5 4.4 4.3 4.4 4.6 4.0 4.5 4.6
PADD 5 .............................................. 5.8 5.9 5.3 4.1 5.2 5.4 4.8 4.1 5.3 5.3 4.7 4.0 4.1 4.1 4.0
U.S. Total ........................................ 88.2 87.9 84.2 85.1 84.5 88.7 85.6 90.3 84.3 87.5 85.0 89.7 85.1 90.3 89.7
Gasoline Blending Components Inventories PADD 1 .............................................. 38.0 37.4 39.9 40.8 42.6 41.6 39.0 40.2 41.9 40.7 38.2 40.3 40.8 40.2 40.3
PADD 2 .............................................. 23.4 24.3 24.9 25.6 25.7 23.9 22.9 21.4 21.7 21.5 21.5 20.9 25.6 21.4 20.9
PADD 3 .............................................. 41.1 38.7 38.3 38.7 39.8 38.5 36.8 37.8 39.4 38.5 37.1 38.3 38.7 37.8 38.3
PADD 4 .............................................. 2.4 1.9 2.1 1.8 1.8 1.7 1.7 2.1 2.0 1.8 1.8 2.1 1.8 2.1 2.1
PADD 5 .............................................. 23.6 23.8 22.8 27.8 25.9 25.2 24.1 26.6 25.4 24.9 24.2 26.7 27.8 26.6 26.7
U.S. Total ........................................ 128.5 126.1 127.9 134.6 135.8 130.9 124.7 128.0 130.5 127.4 122.7 128.3 134.6 128.0 128.3
Minor discrepancies with published historical data are due to independent rounding.
Projections: Generated by simulation of the EIA Regional Short-Term Energy Model.
Regions refer to Petroleum Administration for Defense Districts (PADD).
See “Petroleum for Administration Defense District” in EIA’s Energy Glossary (http://www.eia.doe.gov/glossary/index.html) for a list of States in each region.
Historical data : Latest data available from Energy Information Administration databases supporting the following reports: Petroleum Marketing Monthly , DOE/EIA-0380;
Petroleum Supply Monthly , DOE/EIA-0109; Petroleum Supply Annual , DOE/EIA-0340/2; and Weekly Petroleum Status Report , DOE/EIA-0208.
Notes: The approximate break between historical and forecast values is shown with historical data printed in bold; estimates and forecasts in italics.
2011 Year
Table 4c. U.S. Regional Motor Gasoline Prices and InventoriesEnergy Information Administration/Short-Term Energy Outlook - January 2010
2009 2010
- = no data available
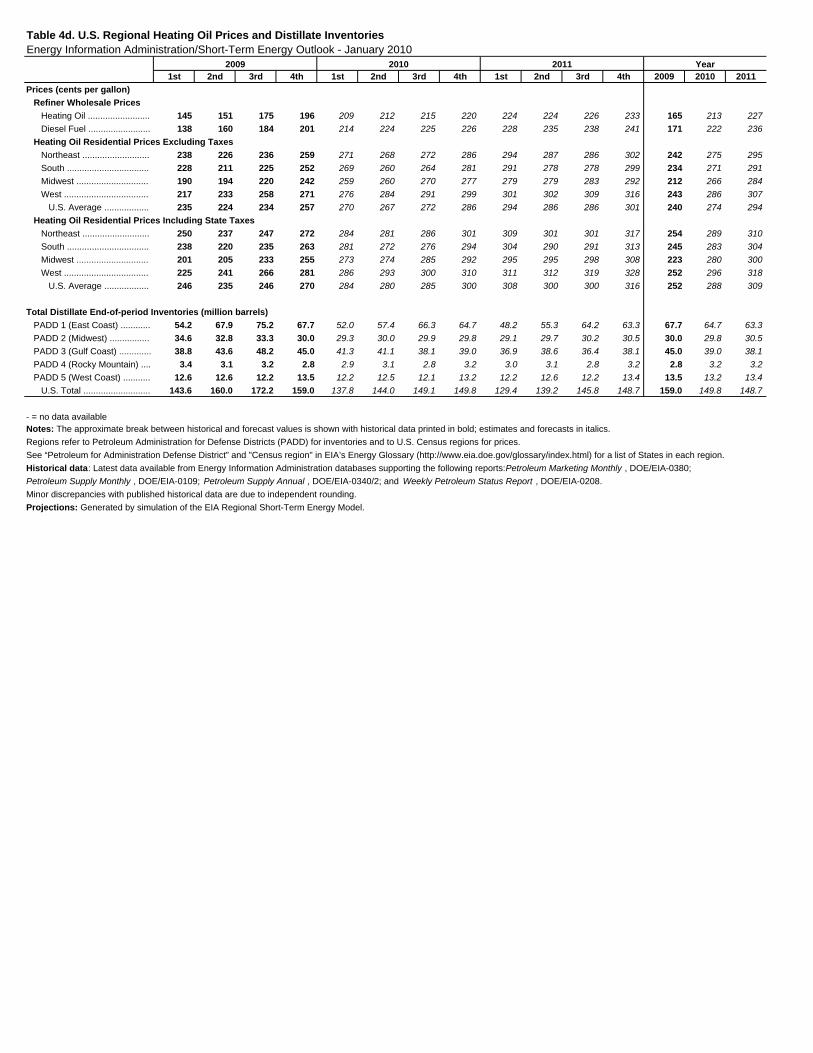
1st 2nd 3rd 4th 1st 2nd 3rd 4th 1st 2nd 3rd 4th 2009 2010 2011
Prices (cents per gallon)
Refiner Wholesale Prices
Heating Oil ......................... 145 151 175 196 209 212 215 220 224 224 226 233 165 213 227
Diesel Fuel ......................... 138 160 184 201 214 224 225 226 228 235 238 241 171 222 236
Heating Oil Residential Prices Excluding Taxes
Northeast ........................... 238 226 236 259 271 268 272 286 294 287 286 302 242 275 295
South ................................. 228 211 225 252 269 260 264 281 291 278 278 299 234 271 291
Midwest ............................. 190 194 220 242 259 260 270 277 279 279 283 292 212 266 284
West .................................. 217 233 258 271 276 284 291 299 301 302 309 316 243 286 307
U.S. Average .................. 235 224 234 257 270 267 272 286 294 286 286 301 240 274 294
Heating Oil Residential Prices Including State Taxes
Northeast ........................... 250 237 247 272 284 281 286 301 309 301 301 317 254 289 310
South ................................. 238 220 235 263 281 272 276 294 304 290 291 313 245 283 304
Midwest ............................. 201 205 233 255 273 274 285 292 295 295 298 308 223 280 300
West .................................. 225 241 266 281 286 293 300 310 311 312 319 328 252 296 318
U.S. Average .................. 246 235 246 270 284 280 285 300 308 300 300 316 252 288 309
Total Distillate End-of-period Inventories (million barrels)
PADD 1 (East Coast) ............ 54.2 67.9 75.2 67.7 52.0 57.4 66.3 64.7 48.2 55.3 64.2 63.3 67.7 64.7 63.3
PADD 2 (Midwest) ................ 34.6 32.8 33.3 30.0 29.3 30.0 29.9 29.8 29.1 29.7 30.2 30.5 30.0 29.8 30.5
PADD 3 (Gulf Coast) ............. 38.8 43.6 48.2 45.0 41.3 41.1 38.1 39.0 36.9 38.6 36.4 38.1 45.0 39.0 38.1
PADD 4 (Rocky Mountain) .... 3.4 3.1 3.2 2.8 2.9 3.1 2.8 3.2 3.0 3.1 2.8 3.2 2.8 3.2 3.2
PADD 5 (West Coast) ........... 12.6 12.6 12.2 13.5 12.2 12.5 12.1 13.2 12.2 12.6 12.2 13.4 13.5 13.2 13.4
U.S. Total ........................... 143.6 160.0 172.2 159.0 137.8 144.0 149.1 149.8 129.4 139.2 145.8 148.7 159.0 149.8 148.7
Notes: The approximate break between historical and forecast values is shown with historical data printed in bold; estimates and forecasts in italics.
See “Petroleum for Administration Defense District” and "Census region" in EIA’s Energy Glossary (http://www.eia.doe.gov/glossary/index.html) for a list of States in each region.
Historical data: Latest data available from Energy Information Administration databases supporting the following reports: Petroleum Marketing Monthly , DOE/EIA-0380;
Table 4d. U.S. Regional Heating Oil Prices and Distillate InventoriesEnergy Information Administration/Short-Term Energy Outlook - January 2010
2009 2010 2011 Year
- = no data available
Petroleum Supply Monthly , DOE/EIA-0109; Petroleum Supply Annual , DOE/EIA-0340/2; and Weekly Petroleum Status Report , DOE/EIA-0208.
Minor discrepancies with published historical data are due to independent rounding.
Projections: Generated by simulation of the EIA Regional Short-Term Energy Model.
Regions refer to Petroleum Administration for Defense Districts (PADD) for inventories and to U.S. Census regions for prices.
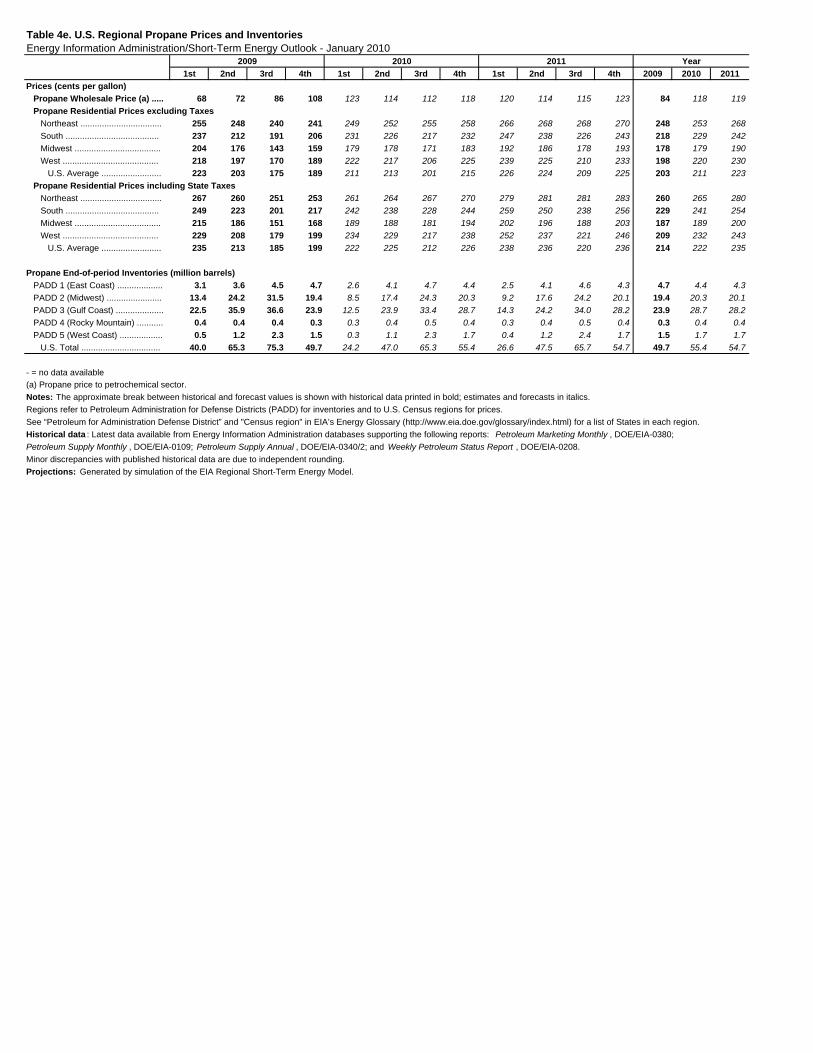
1st 2nd 3rd 4th 1st 2nd 3rd 4th 1st 2nd 3rd 4th 2009 2010 2011
Prices (cents per gallon)
Propane Wholesale Price (a) ..... 68 72 86 108 123 114 112 118 120 114 115 123 84 118 119
Propane Residential Prices excluding Taxes
Northeast .................................. 255 248 240 241 249 252 255 258 266 268 268 270 248 253 268
South ....................................... 237 212 191 206 231 226 217 232 247 238 226 243 218 229 242
Midwest .................................... 204 176 143 159 179 178 171 183 192 186 178 193 178 179 190
West ........................................ 218 197 170 189 222 217 206 225 239 225 210 233 198 220 230
U.S. Average ......................... 223 203 175 189 211 213 201 215 226 224 209 225 203 211 223
Propane Residential Prices including State Taxes
Northeast .................................. 267 260 251 253 261 264 267 270 279 281 281 283 260 265 280
South ....................................... 249 223 201 217 242 238 228 244 259 250 238 256 229 241 254
Midwest .................................... 215 186 151 168 189 188 181 194 202 196 188 203 187 189 200
West ........................................ 229 208 179 199 234 229 217 238 252 237 221 246 209 232 243
U.S. Average ......................... 235 213 185 199 222 225 212 226 238 236 220 236 214 222 235
Propane End-of-period Inventories (million barrels)
PADD 1 (East Coast) ................... 3.1 3.6 4.5 4.7 2.6 4.1 4.7 4.4 2.5 4.1 4.6 4.3 4.7 4.4 4.3
PADD 2 (Midwest) ....................... 13.4 24.2 31.5 19.4 8.5 17.4 24.3 20.3 9.2 17.6 24.2 20.1 19.4 20.3 20.1
PADD 3 (Gulf Coast) .................... 22.5 35.9 36.6 23.9 12.5 23.9 33.4 28.7 14.3 24.2 34.0 28.2 23.9 28.7 28.2
PADD 4 (Rocky Mountain) ........... 0.4 0.4 0.4 0.3 0.3 0.4 0.5 0.4 0.3 0.4 0.5 0.4 0.3 0.4 0.4
PADD 5 (West Coast) .................. 0.5 1.2 2.3 1.5 0.3 1.1 2.3 1.7 0.4 1.2 2.4 1.7 1.5 1.7 1.7
U.S. Total ................................. 40.0 65.3 75.3 49.7 24.2 47.0 65.3 55.4 26.6 47.5 65.7 54.7 49.7 55.4 54.7
(a) Propane price to petrochemical sector.
Table 4e. U.S. Regional Propane Prices and InventoriesEnergy Information Administration/Short-Term Energy Outlook - January 2010
2009 2010 2011 Year
- = no data available
Projections: Generated by simulation of the EIA Regional Short-Term Energy Model.
Regions refer to Petroleum Administration for Defense Districts (PADD) for inventories and to U.S. Census regions for prices.
Notes: The approximate break between historical and forecast values is shown with historical data printed in bold; estimates and forecasts in italics.
See “Petroleum for Administration Defense District” and "Census region" in EIA’s Energy Glossary (http://www.eia.doe.gov/glossary/index.html) for a list of States in each region.
Minor discrepancies with published historical data are due to independent rounding.
Petroleum Supply Monthly , DOE/EIA-0109; Petroleum Supply Annual , DOE/EIA-0340/2; and Weekly Petroleum Status Report , DOE/EIA-0208.
Historical data : Latest data available from Energy Information Administration databases supporting the following reports: Petroleum Marketing Monthly , DOE/EIA-0380;
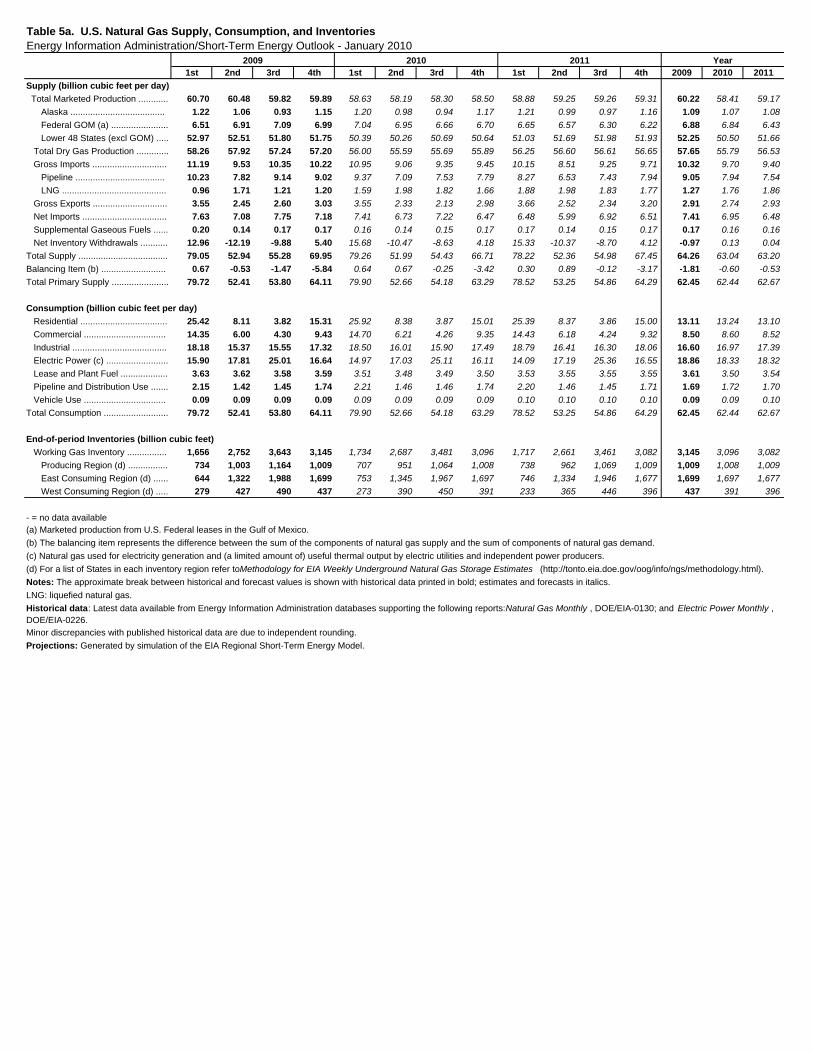
1st 2nd 3rd 4th 1st 2nd 3rd 4th 1st 2nd 3rd 4th 2009 2010 2011
Supply (billion cubic feet per day)
Total Marketed Production ............ 60.70 60.48 59.82 59.89 58.63 58.19 58.30 58.50 58.88 59.25 59.26 59.31 60.22 58.41 59.17
Alaska ...................................... 1.22 1.06 0.93 1.15 1.20 0.98 0.94 1.17 1.21 0.99 0.97 1.16 1.09 1.07 1.08
Federal GOM (a) ....................... 6.51 6.91 7.09 6.99 7.04 6.95 6.66 6.70 6.65 6.57 6.30 6.22 6.88 6.84 6.43
Lower 48 States (excl GOM) ..... 52.97 52.51 51.80 51.75 50.39 50.26 50.69 50.64 51.03 51.69 51.98 51.93 52.25 50.50 51.66
Total Dry Gas Production ............. 58.26 57.92 57.24 57.20 56.00 55.59 55.69 55.89 56.25 56.60 56.61 56.65 57.65 55.79 56.53
Gross Imports .............................. 11.19 9.53 10.35 10.22 10.95 9.06 9.35 9.45 10.15 8.51 9.25 9.71 10.32 9.70 9.40
Pipeline .................................... 10.23 7.82 9.14 9.02 9.37 7.09 7.53 7.79 8.27 6.53 7.43 7.94 9.05 7.94 7.54
LNG .......................................... 0.96 1.71 1.21 1.20 1.59 1.98 1.82 1.66 1.88 1.98 1.83 1.77 1.27 1.76 1.86
Gross Exports .............................. 3.55 2.45 2.60 3.03 3.55 2.33 2.13 2.98 3.66 2.52 2.34 3.20 2.91 2.74 2.93
Net Imports .................................. 7.63 7.08 7.75 7.18 7.41 6.73 7.22 6.47 6.48 5.99 6.92 6.51 7.41 6.95 6.48
Supplemental Gaseous Fuels ...... 0.20 0.14 0.17 0.17 0.16 0.14 0.15 0.17 0.17 0.14 0.15 0.17 0.17 0.16 0.16
Net Inventory Withdrawals ........... 12.96 -12.19 -9.88 5.40 15.68 -10.47 -8.63 4.18 15.33 -10.37 -8.70 4.12 -0.97 0.13 0.04
Total Supply .................................... 79.05 52.94 55.28 69.95 79.26 51.99 54.43 66.71 78.22 52.36 54.98 67.45 64.26 63.04 63.20
Balancing Item (b) .......................... 0.67 -0.53 -1.47 -5.84 0.64 0.67 -0.25 -3.42 0.30 0.89 -0.12 -3.17 -1.81 -0.60 -0.53
Total Primary Supply ....................... 79.72 52.41 53.80 64.11 79.90 52.66 54.18 63.29 78.52 53.25 54.86 64.29 62.45 62.44 62.67
Consumption (billion cubic feet per day)
Residential ................................... 25.42 8.11 3.82 15.31 25.92 8.38 3.87 15.01 25.39 8.37 3.86 15.00 13.11 13.24 13.10
Commercial ................................. 14.35 6.00 4.30 9.43 14.70 6.21 4.26 9.35 14.43 6.18 4.24 9.32 8.50 8.60 8.52
Industrial ...................................... 18.18 15.37 15.55 17.32 18.50 16.01 15.90 17.49 18.79 16.41 16.30 18.06 16.60 16.97 17.39
Electric Power (c) ......................... 15.90 17.81 25.01 16.64 14.97 17.03 25.11 16.11 14.09 17.19 25.36 16.55 18.86 18.33 18.32
Lease and Plant Fuel ................... 3.63 3.62 3.58 3.59 3.51 3.48 3.49 3.50 3.53 3.55 3.55 3.55 3.61 3.50 3.54
Pipeline and Distribution Use ....... 2.15 1.42 1.45 1.74 2.21 1.46 1.46 1.74 2.20 1.46 1.45 1.71 1.69 1.72 1.70
Vehicle Use ................................. 0.09 0.09 0.09 0.09 0.09 0.09 0.09 0.09 0.10 0.10 0.10 0.10 0.09 0.09 0.10
Total Consumption .......................... 79.72 52.41 53.80 64.11 79.90 52.66 54.18 63.29 78.52 53.25 54.86 64.29 62.45 62.44 62.67
End-of-period Inventories (billion cubic feet)
Working Gas Inventory ................ 1,656 2,752 3,643 3,145 1,734 2,687 3,481 3,096 1,717 2,661 3,461 3,082 3,145 3,096 3,082
Producing Region (d) ................ 734 1,003 1,164 1,009 707 951 1,064 1,008 738 962 1,069 1,009 1,009 1,008 1,009
East Consuming Region (d) ...... 644 1,322 1,988 1,699 753 1,345 1,967 1,697 746 1,334 1,946 1,677 1,699 1,697 1,677
West Consuming Region (d) ..... 279 427 490 437 273 390 450 391 233 365 446 396 437 391 396
- = no data available
(d) For a list of States in each inventory region refer to Methodology for EIA Weekly Underground Natural Gas Storage Estimates (http://tonto.eia.doe.gov/oog/info/ngs/methodology.html).
(c) Natural gas used for electricity generation and (a limited amount of) useful thermal output by electric utilities and independent power producers.
(b) The balancing item represents the difference between the sum of the components of natural gas supply and the sum of components of natural gas demand.
(a) Marketed production from U.S. Federal leases in the Gulf of Mexico.
Table 5a. U.S. Natural Gas Supply, Consumption, and InventoriesEnergy Information Administration/Short-Term Energy Outlook - January 2010
2009 2010 2011 Year
Projections: Generated by simulation of the EIA Regional Short-Term Energy Model.
Notes: The approximate break between historical and forecast values is shown with historical data printed in bold; estimates and forecasts in italics.
Minor discrepancies with published historical data are due to independent rounding.
Historical data: Latest data available from Energy Information Administration databases supporting the following reports: Natural Gas Monthly , DOE/EIA-0130; and Electric Power Monthly , DOE/EIA-0226.
LNG: liquefied natural gas.
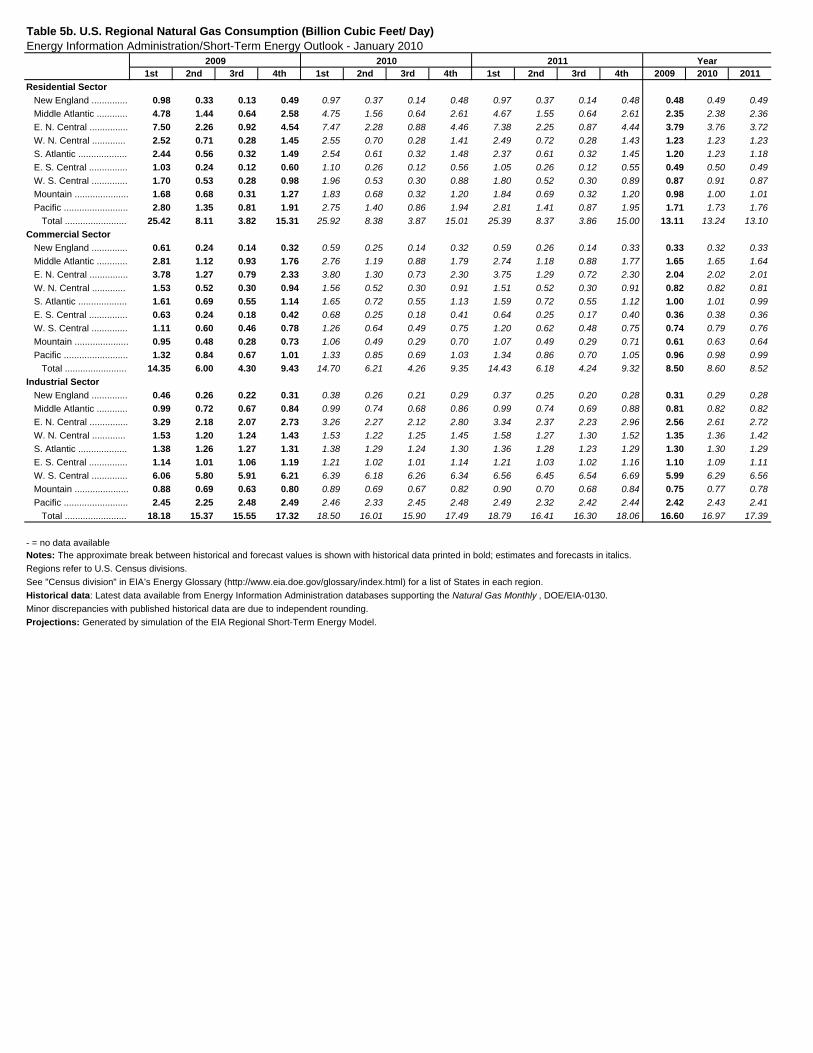
1st 2nd 3rd 4th 1st 2nd 3rd 4th 1st 2nd 3rd 4th 2009 2010 2011
Residential Sector
New England .............. 0.98 0.33 0.13 0.49 0.97 0.37 0.14 0.48 0.97 0.37 0.14 0.48 0.48 0.49 0.49
Middle Atlantic ............ 4.78 1.44 0.64 2.58 4.75 1.56 0.64 2.61 4.67 1.55 0.64 2.61 2.35 2.38 2.36
E. N. Central ............... 7.50 2.26 0.92 4.54 7.47 2.28 0.88 4.46 7.38 2.25 0.87 4.44 3.79 3.76 3.72
W. N. Central ............. 2.52 0.71 0.28 1.45 2.55 0.70 0.28 1.41 2.49 0.72 0.28 1.43 1.23 1.23 1.23
S. Atlantic ................... 2.44 0.56 0.32 1.49 2.54 0.61 0.32 1.48 2.37 0.61 0.32 1.45 1.20 1.23 1.18
E. S. Central ............... 1.03 0.24 0.12 0.60 1.10 0.26 0.12 0.56 1.05 0.26 0.12 0.55 0.49 0.50 0.49
W. S. Central .............. 1.70 0.53 0.28 0.98 1.96 0.53 0.30 0.88 1.80 0.52 0.30 0.89 0.87 0.91 0.87
Mountain ..................... 1.68 0.68 0.31 1.27 1.83 0.68 0.32 1.20 1.84 0.69 0.32 1.20 0.98 1.00 1.01
Pacific ......................... 2.80 1.35 0.81 1.91 2.75 1.40 0.86 1.94 2.81 1.41 0.87 1.95 1.71 1.73 1.76
Total ........................ 25.42 8.11 3.82 15.31 25.92 8.38 3.87 15.01 25.39 8.37 3.86 15.00 13.11 13.24 13.10
Commercial Sector
New England .............. 0.61 0.24 0.14 0.32 0.59 0.25 0.14 0.32 0.59 0.26 0.14 0.33 0.33 0.32 0.33
Middle Atlantic ............ 2.81 1.12 0.93 1.76 2.76 1.19 0.88 1.79 2.74 1.18 0.88 1.77 1.65 1.65 1.64
E. N. Central ............... 3.78 1.27 0.79 2.33 3.80 1.30 0.73 2.30 3.75 1.29 0.72 2.30 2.04 2.02 2.01
W. N. Central ............. 1.53 0.52 0.30 0.94 1.56 0.52 0.30 0.91 1.51 0.52 0.30 0.91 0.82 0.82 0.81
S. Atlantic ................... 1.61 0.69 0.55 1.14 1.65 0.72 0.55 1.13 1.59 0.72 0.55 1.12 1.00 1.01 0.99
E. S. Central ............... 0.63 0.24 0.18 0.42 0.68 0.25 0.18 0.41 0.64 0.25 0.17 0.40 0.36 0.38 0.36
W. S. Central .............. 1.11 0.60 0.46 0.78 1.26 0.64 0.49 0.75 1.20 0.62 0.48 0.75 0.74 0.79 0.76
Mountain ..................... 0.95 0.48 0.28 0.73 1.06 0.49 0.29 0.70 1.07 0.49 0.29 0.71 0.61 0.63 0.64
Pacific ......................... 1.32 0.84 0.67 1.01 1.33 0.85 0.69 1.03 1.34 0.86 0.70 1.05 0.96 0.98 0.99
Total ........................ 14.35 6.00 4.30 9.43 14.70 6.21 4.26 9.35 14.43 6.18 4.24 9.32 8.50 8.60 8.52
Industrial Sector
New England .............. 0.46 0.26 0.22 0.31 0.38 0.26 0.21 0.29 0.37 0.25 0.20 0.28 0.31 0.29 0.28
Middle Atlantic ............ 0.99 0.72 0.67 0.84 0.99 0.74 0.68 0.86 0.99 0.74 0.69 0.88 0.81 0.82 0.82
E. N. Central ............... 3.29 2.18 2.07 2.73 3.26 2.27 2.12 2.80 3.34 2.37 2.23 2.96 2.56 2.61 2.72
W. N. Central ............. 1.53 1.20 1.24 1.43 1.53 1.22 1.25 1.45 1.58 1.27 1.30 1.52 1.35 1.36 1.42
S. Atlantic ................... 1.38 1.26 1.27 1.31 1.38 1.29 1.24 1.30 1.36 1.28 1.23 1.29 1.30 1.30 1.29
E. S. Central ............... 1.14 1.01 1.06 1.19 1.21 1.02 1.01 1.14 1.21 1.03 1.02 1.16 1.10 1.09 1.11
W. S. Central .............. 6.06 5.80 5.91 6.21 6.39 6.18 6.26 6.34 6.56 6.45 6.54 6.69 5.99 6.29 6.56
Mountain ..................... 0.88 0.69 0.63 0.80 0.89 0.69 0.67 0.82 0.90 0.70 0.68 0.84 0.75 0.77 0.78
Pacific ......................... 2.45 2.25 2.48 2.49 2.46 2.33 2.45 2.48 2.49 2.32 2.42 2.44 2.42 2.43 2.41
Total ........................ 18.18 15.37 15.55 17.32 18.50 16.01 15.90 17.49 18.79 16.41 16.30 18.06 16.60 16.97 17.39
Minor discrepancies with published historical data are due to independent rounding.
Projections: Generated by simulation of the EIA Regional Short-Term Energy Model.
Historical data: Latest data available from Energy Information Administration databases supporting the Natural Gas Monthly , DOE/EIA-0130.
Regions refer to U.S. Census divisions.
Notes: The approximate break between historical and forecast values is shown with historical data printed in bold; estimates and forecasts in italics.
See "Census division" in EIA’s Energy Glossary (http://www.eia.doe.gov/glossary/index.html) for a list of States in each region.
2011 Year
- = no data available
Table 5b. U.S. Regional Natural Gas Consumption (Billion Cubic Feet/ Day)Energy Information Administration/Short-Term Energy Outlook - January 2010
2009 2010
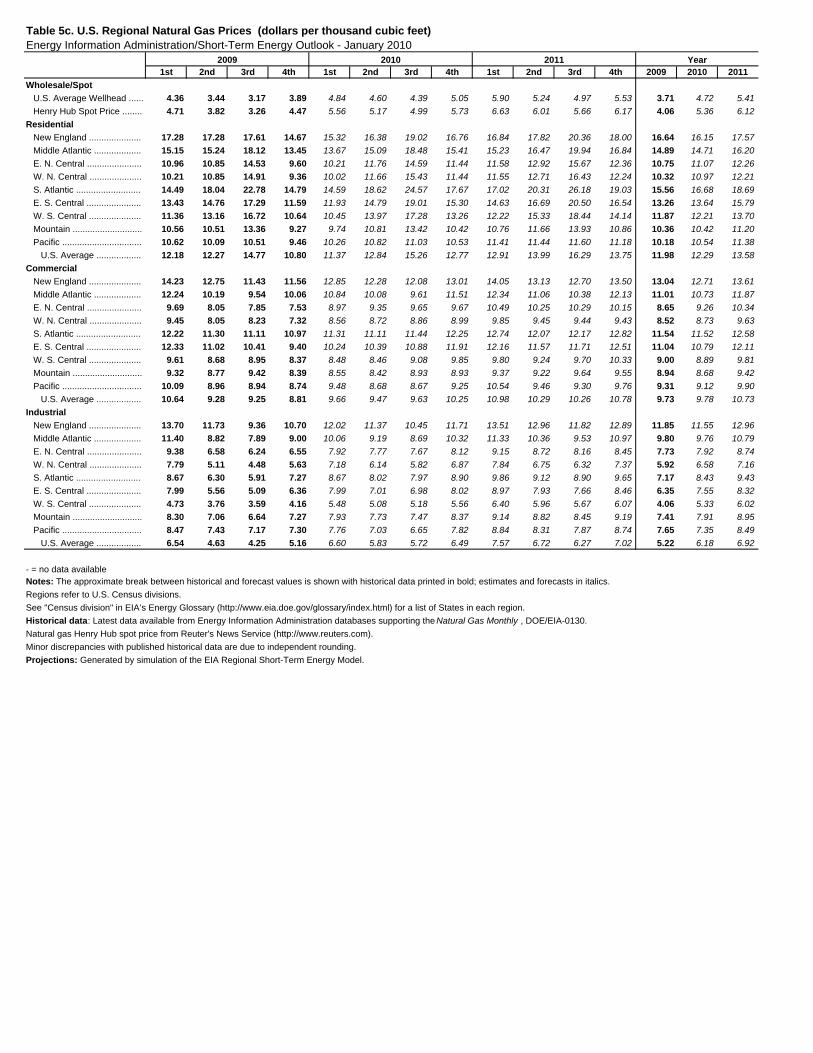
1st 2nd 3rd 4th 1st 2nd 3rd 4th 1st 2nd 3rd 4th 2009 2010 2011
Wholesale/Spot
U.S. Average Wellhead ...... 4.36 3.44 3.17 3.89 4.84 4.60 4.39 5.05 5.90 5.24 4.97 5.53 3.71 4.72 5.41
Henry Hub Spot Price ........ 4.71 3.82 3.26 4.47 5.56 5.17 4.99 5.73 6.63 6.01 5.66 6.17 4.06 5.36 6.12
Residential
New England ..................... 17.28 17.28 17.61 14.67 15.32 16.38 19.02 16.76 16.84 17.82 20.36 18.00 16.64 16.15 17.57
Middle Atlantic ................... 15.15 15.24 18.12 13.45 13.67 15.09 18.48 15.41 15.23 16.47 19.94 16.84 14.89 14.71 16.20
E. N. Central ...................... 10.96 10.85 14.53 9.60 10.21 11.76 14.59 11.44 11.58 12.92 15.67 12.36 10.75 11.07 12.26
W. N. Central ..................... 10.21 10.85 14.91 9.36 10.02 11.66 15.43 11.44 11.55 12.71 16.43 12.24 10.32 10.97 12.21
S. Atlantic .......................... 14.49 18.04 22.78 14.79 14.59 18.62 24.57 17.67 17.02 20.31 26.18 19.03 15.56 16.68 18.69
E. S. Central ...................... 13.43 14.76 17.29 11.59 11.93 14.79 19.01 15.30 14.63 16.69 20.50 16.54 13.26 13.64 15.79
W. S. Central ..................... 11.36 13.16 16.72 10.64 10.45 13.97 17.28 13.26 12.22 15.33 18.44 14.14 11.87 12.21 13.70
Mountain ............................ 10.56 10.51 13.36 9.27 9.74 10.81 13.42 10.42 10.76 11.66 13.93 10.86 10.36 10.42 11.20
Pacific ................................ 10.62 10.09 10.51 9.46 10.26 10.82 11.03 10.53 11.41 11.44 11.60 11.18 10.18 10.54 11.38
U.S. Average .................. 12.18 12.27 14.77 10.80 11.37 12.84 15.26 12.77 12.91 13.99 16.29 13.75 11.98 12.29 13.58
Commercial
New England ..................... 14.23 12.75 11.43 11.56 12.85 12.28 12.08 13.01 14.05 13.13 12.70 13.50 13.04 12.71 13.61
Middle Atlantic ................... 12.24 10.19 9.54 10.06 10.84 10.08 9.61 11.51 12.34 11.06 10.38 12.13 11.01 10.73 11.87
E. N. Central ...................... 9.69 8.05 7.85 7.53 8.97 9.35 9.65 9.67 10.49 10.25 10.29 10.15 8.65 9.26 10.34
W. N. Central ..................... 9.45 8.05 8.23 7.32 8.56 8.72 8.86 8.99 9.85 9.45 9.44 9.43 8.52 8.73 9.63
S. Atlantic .......................... 12.22 11.30 11.11 10.97 11.31 11.11 11.44 12.25 12.74 12.07 12.17 12.82 11.54 11.52 12.58
E. S. Central ...................... 12.33 11.02 10.41 9.40 10.24 10.39 10.88 11.91 12.16 11.57 11.71 12.51 11.04 10.79 12.11
W. S. Central ..................... 9.61 8.68 8.95 8.37 8.48 8.46 9.08 9.85 9.80 9.24 9.70 10.33 9.00 8.89 9.81
Mountain ............................ 9.32 8.77 9.42 8.39 8.55 8.42 8.93 8.93 9.37 9.22 9.64 9.55 8.94 8.68 9.42
Pacific ................................ 10.09 8.96 8.94 8.74 9.48 8.68 8.67 9.25 10.54 9.46 9.30 9.76 9.31 9.12 9.90
U.S. Average .................. 10.64 9.28 9.25 8.81 9.66 9.47 9.63 10.25 10.98 10.29 10.26 10.78 9.73 9.78 10.73
Industrial
New England ..................... 13.70 11.73 9.36 10.70 12.02 11.37 10.45 11.71 13.51 12.96 11.82 12.89 11.85 11.55 12.96
Middle Atlantic ................... 11.40 8.82 7.89 9.00 10.06 9.19 8.69 10.32 11.33 10.36 9.53 10.97 9.80 9.76 10.79
E. N. Central ...................... 9.38 6.58 6.24 6.55 7.92 7.77 7.67 8.12 9.15 8.72 8.16 8.45 7.73 7.92 8.74
W. N. Central ..................... 7.79 5.11 4.48 5.63 7.18 6.14 5.82 6.87 7.84 6.75 6.32 7.37 5.92 6.58 7.16
S. Atlantic .......................... 8.67 6.30 5.91 7.27 8.67 8.02 7.97 8.90 9.86 9.12 8.90 9.65 7.17 8.43 9.43
E. S. Central ...................... 7.99 5.56 5.09 6.36 7.99 7.01 6.98 8.02 8.97 7.93 7.66 8.46 6.35 7.55 8.32
W. S. Central ..................... 4.73 3.76 3.59 4.16 5.48 5.08 5.18 5.56 6.40 5.96 5.67 6.07 4.06 5.33 6.02
Mountain ............................ 8.30 7.06 6.64 7.27 7.93 7.73 7.47 8.37 9.14 8.82 8.45 9.19 7.41 7.91 8.95
Pacific ................................ 8.47 7.43 7.17 7.30 7.76 7.03 6.65 7.82 8.84 8.31 7.87 8.74 7.65 7.35 8.49
U.S. Average .................. 6.54 4.63 4.25 5.16 6.60 5.83 5.72 6.49 7.57 6.72 6.27 7.02 5.22 6.18 6.92
Minor discrepancies with published historical data are due to independent rounding.
Projections: Generated by simulation of the EIA Regional Short-Term Energy Model.
Historical data: Latest data available from Energy Information Administration databases supporting the Natural Gas Monthly , DOE/EIA-0130.
Regions refer to U.S. Census divisions.
Natural gas Henry Hub spot price from Reuter's News Service (http://www.reuters.com).
Notes: The approximate break between historical and forecast values is shown with historical data printed in bold; estimates and forecasts in italics.
See "Census division" in EIA’s Energy Glossary (http://www.eia.doe.gov/glossary/index.html) for a list of States in each region.
2011 Year
- = no data available
Table 5c. U.S. Regional Natural Gas Prices (dollars per thousand cubic feet)Energy Information Administration/Short-Term Energy Outlook - January 2010
2009 2010
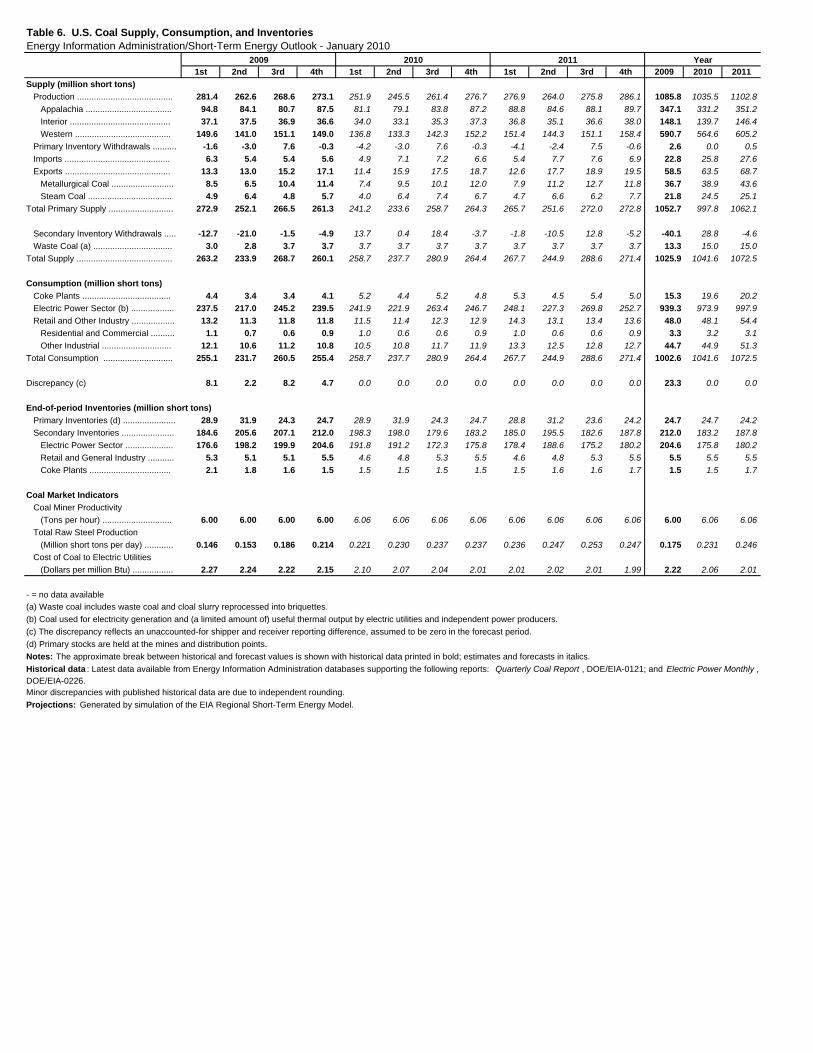
1st 2nd 3rd 4th 1st 2nd 3rd 4th 1st 2nd 3rd 4th 2009 2010 2011
Supply (million short tons)
Production ........................................ 281.4 262.6 268.6 273.1 251.9 245.5 261.4 276.7 276.9 264.0 275.8 286.1 1085.8 1035.5 1102.8
Appalachia .................................... 94.8 84.1 80.7 87.5 81.1 79.1 83.8 87.2 88.8 84.6 88.1 89.7 347.1 331.2 351.2
Interior .......................................... 37.1 37.5 36.9 36.6 34.0 33.1 35.3 37.3 36.8 35.1 36.6 38.0 148.1 139.7 146.4
Western ........................................ 149.6 141.0 151.1 149.0 136.8 133.3 142.3 152.2 151.4 144.3 151.1 158.4 590.7 564.6 605.2
Primary Inventory Withdrawals .......... -1.6 -3.0 7.6 -0.3 -4.2 -3.0 7.6 -0.3 -4.1 -2.4 7.5 -0.6 2.6 0.0 0.5
Imports ............................................ 6.3 5.4 5.4 5.6 4.9 7.1 7.2 6.6 5.4 7.7 7.6 6.9 22.8 25.8 27.6
Exports ............................................ 13.3 13.0 15.2 17.1 11.4 15.9 17.5 18.7 12.6 17.7 18.9 19.5 58.5 63.5 68.7
Metallurgical Coal .......................... 8.5 6.5 10.4 11.4 7.4 9.5 10.1 12.0 7.9 11.2 12.7 11.8 36.7 38.9 43.6
Steam Coal ................................... 4.9 6.4 4.8 5.7 4.0 6.4 7.4 6.7 4.7 6.6 6.2 7.7 21.8 24.5 25.1
Total Primary Supply ........................... 272.9 252.1 266.5 261.3 241.2 233.6 258.7 264.3 265.7 251.6 272.0 272.8 1052.7 997.8 1062.1
Secondary Inventory Withdrawals ..... -12.7 -21.0 -1.5 -4.9 13.7 0.4 18.4 -3.7 -1.8 -10.5 12.8 -5.2 -40.1 28.8 -4.6
Waste Coal (a) ................................. 3.0 2.8 3.7 3.7 3.7 3.7 3.7 3.7 3.7 3.7 3.7 3.7 13.3 15.0 15.0
Total Supply ........................................ 263.2 233.9 268.7 260.1 258.7 237.7 280.9 264.4 267.7 244.9 288.6 271.4 1025.9 1041.6 1072.5
Consumption (million short tons)
Coke Plants ..................................... 4.4 3.4 3.4 4.1 5.2 4.4 5.2 4.8 5.3 4.5 5.4 5.0 15.3 19.6 20.2
Electric Power Sector (b) .................. 237.5 217.0 245.2 239.5 241.9 221.9 263.4 246.7 248.1 227.3 269.8 252.7 939.3 973.9 997.9
Retail and Other Industry .................. 13.2 11.3 11.8 11.8 11.5 11.4 12.3 12.9 14.3 13.1 13.4 13.6 48.0 48.1 54.4
Residential and Commercial .......... 1.1 0.7 0.6 0.9 1.0 0.6 0.6 0.9 1.0 0.6 0.6 0.9 3.3 3.2 3.1
Other Industrial ............................. 12.1 10.6 11.2 10.8 10.5 10.8 11.7 11.9 13.3 12.5 12.8 12.7 44.7 44.9 51.3
Total Consumption ............................. 255.1 231.7 260.5 255.4 258.7 237.7 280.9 264.4 267.7 244.9 288.6 271.4 1002.6 1041.6 1072.5
Discrepancy (c) 8.1 2.2 8.2 4.7 0.0 0.0 0.0 0.0 0.0 0.0 0.0 0.0 23.3 0.0 0.0
End-of-period Inventories (million short tons)
Primary Inventories (d) ...................... 28.9 31.9 24.3 24.7 28.9 31.9 24.3 24.7 28.8 31.2 23.6 24.2 24.7 24.7 24.2
Secondary Inventories ...................... 184.6 205.6 207.1 212.0 198.3 198.0 179.6 183.2 185.0 195.5 182.6 187.8 212.0 183.2 187.8
Electric Power Sector .................... 176.6 198.2 199.9 204.6 191.8 191.2 172.3 175.8 178.4 188.6 175.2 180.2 204.6 175.8 180.2
Retail and General Industry ........... 5.3 5.1 5.1 5.5 4.6 4.8 5.3 5.5 4.6 4.8 5.3 5.5 5.5 5.5 5.5
Coke Plants .................................. 2.1 1.8 1.6 1.5 1.5 1.5 1.5 1.5 1.5 1.6 1.6 1.7 1.5 1.5 1.7
Coal Market Indicators
Coal Miner Productivity
(Tons per hour) ............................. 6.00 6.00 6.00 6.00 6.06 6.06 6.06 6.06 6.06 6.06 6.06 6.06 6.00 6.06 6.06
Total Raw Steel Production
(Million short tons per day) ............ 0.146 0.153 0.186 0.214 0.221 0.230 0.237 0.237 0.236 0.247 0.253 0.247 0.175 0.231 0.246
Cost of Coal to Electric Utilities
(Dollars per million Btu) ................. 2.27 2.24 2.22 2.15 2.10 2.07 2.04 2.01 2.01 2.02 2.01 1.99 2.22 2.06 2.01
(a) Waste coal includes waste coal and cloal slurry reprocessed into briquettes.
(b) Coal used for electricity generation and (a limited amount of) useful thermal output by electric utilities and independent power producers.
Table 6. U.S. Coal Supply, Consumption, and InventoriesEnergy Information Administration/Short-Term Energy Outlook - January 2010
2009 2010 2011 Year
- = no data available
(c) The discrepancy reflects an unaccounted-for shipper and receiver reporting difference, assumed to be zero in the forecast period.
Notes: The approximate break between historical and forecast values is shown with historical data printed in bold; estimates and forecasts in italics.
Minor discrepancies with published historical data are due to independent rounding.
Projections: Generated by simulation of the EIA Regional Short-Term Energy Model.
Historical data : Latest data available from Energy Information Administration databases supporting the following reports: Quarterly Coal Report , DOE/EIA-0121; and Electric Power Monthly , DOE/EIA-0226.
(d) Primary stocks are held at the mines and distribution points.
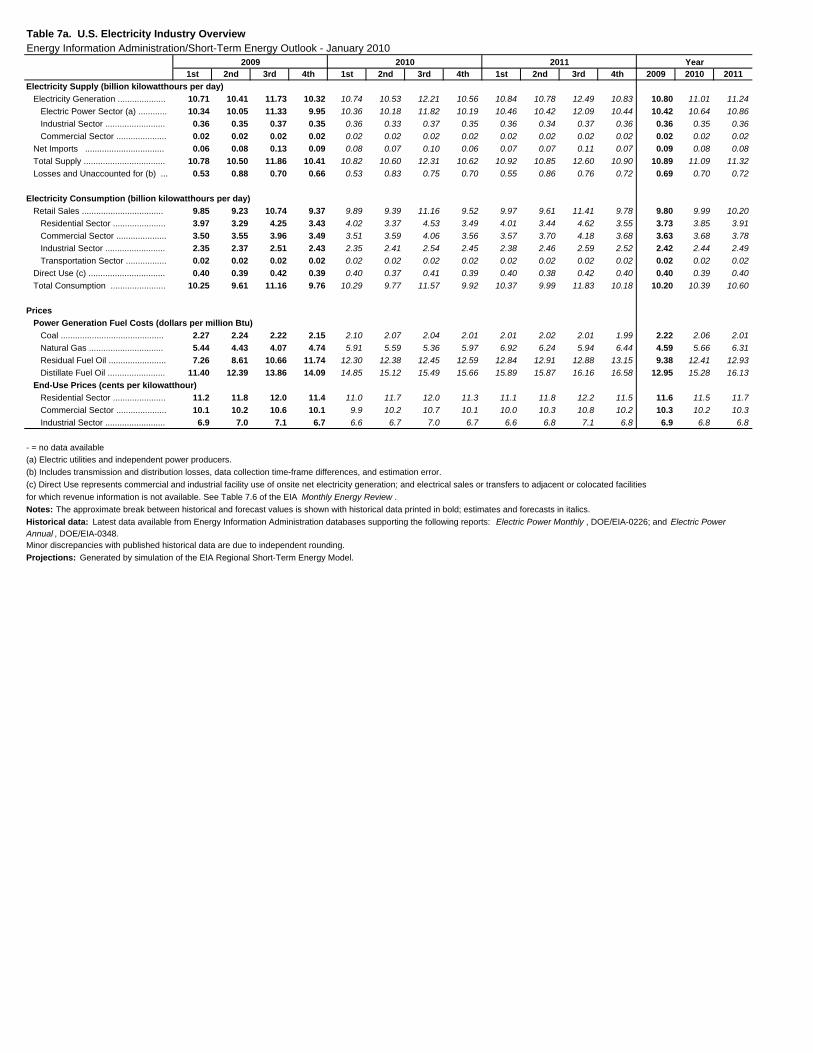
1st 2nd 3rd 4th 1st 2nd 3rd 4th 1st 2nd 3rd 4th 2009 2010 2011
Electricity Supply (billion kilowatthours per day)
Electricity Generation .................... 10.71 10.41 11.73 10.32 10.74 10.53 12.21 10.56 10.84 10.78 12.49 10.83 10.80 11.01 11.24
Electric Power Sector (a) ............ 10.34 10.05 11.33 9.95 10.36 10.18 11.82 10.19 10.46 10.42 12.09 10.44 10.42 10.64 10.86
Industrial Sector ......................... 0.36 0.35 0.37 0.35 0.36 0.33 0.37 0.35 0.36 0.34 0.37 0.36 0.36 0.35 0.36
Commercial Sector ..................... 0.02 0.02 0.02 0.02 0.02 0.02 0.02 0.02 0.02 0.02 0.02 0.02 0.02 0.02 0.02
Net Imports ................................. 0.06 0.08 0.13 0.09 0.08 0.07 0.10 0.06 0.07 0.07 0.11 0.07 0.09 0.08 0.08
Total Supply .................................. 10.78 10.50 11.86 10.41 10.82 10.60 12.31 10.62 10.92 10.85 12.60 10.90 10.89 11.09 11.32
Losses and Unaccounted for (b) ... 0.53 0.88 0.70 0.66 0.53 0.83 0.75 0.70 0.55 0.86 0.76 0.72 0.69 0.70 0.72
Electricity Consumption (billion kilowatthours per day)
Retail Sales .................................. 9.85 9.23 10.74 9.37 9.89 9.39 11.16 9.52 9.97 9.61 11.41 9.78 9.80 9.99 10.20
Residential Sector ...................... 3.97 3.29 4.25 3.43 4.02 3.37 4.53 3.49 4.01 3.44 4.62 3.55 3.73 3.85 3.91
Commercial Sector ..................... 3.50 3.55 3.96 3.49 3.51 3.59 4.06 3.56 3.57 3.70 4.18 3.68 3.63 3.68 3.78
Industrial Sector ......................... 2.35 2.37 2.51 2.43 2.35 2.41 2.54 2.45 2.38 2.46 2.59 2.52 2.42 2.44 2.49
Transportation Sector ................. 0.02 0.02 0.02 0.02 0.02 0.02 0.02 0.02 0.02 0.02 0.02 0.02 0.02 0.02 0.02
Direct Use (c) ................................ 0.40 0.39 0.42 0.39 0.40 0.37 0.41 0.39 0.40 0.38 0.42 0.40 0.40 0.39 0.40
Total Consumption ....................... 10.25 9.61 11.16 9.76 10.29 9.77 11.57 9.92 10.37 9.99 11.83 10.18 10.20 10.39 10.60
Prices
Power Generation Fuel Costs (dollars per million Btu)
Coal ........................................... 2.27 2.24 2.22 2.15 2.10 2.07 2.04 2.01 2.01 2.02 2.01 1.99 2.22 2.06 2.01
Natural Gas ............................... 5.44 4.43 4.07 4.74 5.91 5.59 5.36 5.97 6.92 6.24 5.94 6.44 4.59 5.66 6.31
Residual Fuel Oil ........................ 7.26 8.61 10.66 11.74 12.30 12.38 12.45 12.59 12.84 12.91 12.88 13.15 9.38 12.41 12.93
Distillate Fuel Oil ........................ 11.40 12.39 13.86 14.09 14.85 15.12 15.49 15.66 15.89 15.87 16.16 16.58 12.95 15.28 16.13
End-Use Prices (cents per kilowatthour)
Residential Sector ...................... 11.2 11.8 12.0 11.4 11.0 11.7 12.0 11.3 11.1 11.8 12.2 11.5 11.6 11.5 11.7
Commercial Sector ..................... 10.1 10.2 10.6 10.1 9.9 10.2 10.7 10.1 10.0 10.3 10.8 10.2 10.3 10.2 10.3
Industrial Sector ......................... 6.9 7.0 7.1 6.7 6.6 6.7 7.0 6.7 6.6 6.8 7.1 6.8 6.9 6.8 6.8
Minor discrepancies with published historical data are due to independent rounding.
Projections: Generated by simulation of the EIA Regional Short-Term Energy Model.
Historical data: Latest data available from Energy Information Administration databases supporting the following reports: Electric Power Monthly , DOE/EIA-0226; and Electric Power Annual , DOE/EIA-0348.
(c) Direct Use represents commercial and industrial facility use of onsite net electricity generation; and electrical sales or transfers to adjacent or colocated facilities
Notes: The approximate break between historical and forecast values is shown with historical data printed in bold; estimates and forecasts in italics.
for which revenue information is not available. See Table 7.6 of the EIA Monthly Energy Review .
Table 7a. U.S. Electricity Industry OverviewEnergy Information Administration/Short-Term Energy Outlook - January 2010
2009
(b) Includes transmission and distribution losses, data collection time-frame differences, and estimation error.
(a) Electric utilities and independent power producers.
2010 2011 Year
- = no data available
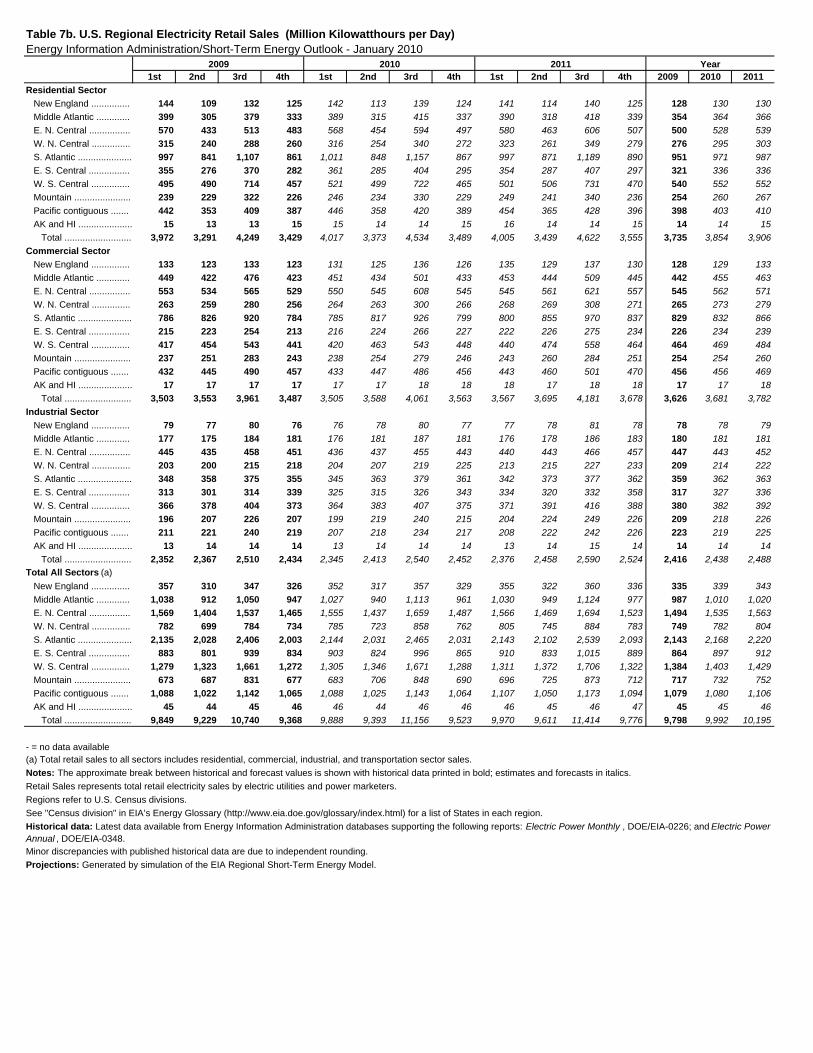
1st 2nd 3rd 4th 1st 2nd 3rd 4th 1st 2nd 3rd 4th 2009 2010 2011
Residential Sector
New England ............... 144 109 132 125 142 113 139 124 141 114 140 125 128 130 130
Middle Atlantic ............. 399 305 379 333 389 315 415 337 390 318 418 339 354 364 366
E. N. Central ................ 570 433 513 483 568 454 594 497 580 463 606 507 500 528 539
W. N. Central ............... 315 240 288 260 316 254 340 272 323 261 349 279 276 295 303
S. Atlantic ..................... 997 841 1,107 861 1,011 848 1,157 867 997 871 1,189 890 951 971 987
E. S. Central ................ 355 276 370 282 361 285 404 295 354 287 407 297 321 336 336
W. S. Central ............... 495 490 714 457 521 499 722 465 501 506 731 470 540 552 552
Mountain ...................... 239 229 322 226 246 234 330 229 249 241 340 236 254 260 267
Pacific contiguous ....... 442 353 409 387 446 358 420 389 454 365 428 396 398 403 410
AK and HI ..................... 15 13 13 15 15 14 14 15 16 14 14 15 14 14 15
Total .......................... 3,972 3,291 4,249 3,429 4,017 3,373 4,534 3,489 4,005 3,439 4,622 3,555 3,735 3,854 3,906
Commercial Sector
New England ............... 133 123 133 123 131 125 136 126 135 129 137 130 128 129 133
Middle Atlantic ............. 449 422 476 423 451 434 501 433 453 444 509 445 442 455 463
E. N. Central ................ 553 534 565 529 550 545 608 545 545 561 621 557 545 562 571
W. N. Central ............... 263 259 280 256 264 263 300 266 268 269 308 271 265 273 279
S. Atlantic ..................... 786 826 920 784 785 817 926 799 800 855 970 837 829 832 866
E. S. Central ................ 215 223 254 213 216 224 266 227 222 226 275 234 226 234 239
W. S. Central ............... 417 454 543 441 420 463 543 448 440 474 558 464 464 469 484
Mountain ...................... 237 251 283 243 238 254 279 246 243 260 284 251 254 254 260
Pacific contiguous ....... 432 445 490 457 433 447 486 456 443 460 501 470 456 456 469
AK and HI ..................... 17 17 17 17 17 17 18 18 18 17 18 18 17 17 18
Total .......................... 3,503 3,553 3,961 3,487 3,505 3,588 4,061 3,563 3,567 3,695 4,181 3,678 3,626 3,681 3,782
Industrial Sector
New England ............... 79 77 80 76 76 78 80 77 77 78 81 78 78 78 79
Middle Atlantic ............. 177 175 184 181 176 181 187 181 176 178 186 183 180 181 181
E. N. Central ................ 445 435 458 451 436 437 455 443 440 443 466 457 447 443 452
W. N. Central ............... 203 200 215 218 204 207 219 225 213 215 227 233 209 214 222
S. Atlantic ..................... 348 358 375 355 345 363 379 361 342 373 377 362 359 362 363
E. S. Central ................ 313 301 314 339 325 315 326 343 334 320 332 358 317 327 336
W. S. Central ............... 366 378 404 373 364 383 407 375 371 391 416 388 380 382 392
Mountain ...................... 196 207 226 207 199 219 240 215 204 224 249 226 209 218 226
Pacific contiguous ....... 211 221 240 219 207 218 234 217 208 222 242 226 223 219 225
AK and HI ..................... 13 14 14 14 13 14 14 14 13 14 15 14 14 14 14
Total .......................... 2,352 2,367 2,510 2,434 2,345 2,413 2,540 2,452 2,376 2,458 2,590 2,524 2,416 2,438 2,488
Total All Sectors (a)
New England ............... 357 310 347 326 352 317 357 329 355 322 360 336 335 339 343
Middle Atlantic ............. 1,038 912 1,050 947 1,027 940 1,113 961 1,030 949 1,124 977 987 1,010 1,020
E. N. Central ................ 1,569 1,404 1,537 1,465 1,555 1,437 1,659 1,487 1,566 1,469 1,694 1,523 1,494 1,535 1,563
W. N. Central ............... 782 699 784 734 785 723 858 762 805 745 884 783 749 782 804
S. Atlantic ..................... 2,135 2,028 2,406 2,003 2,144 2,031 2,465 2,031 2,143 2,102 2,539 2,093 2,143 2,168 2,220
E. S. Central ................ 883 801 939 834 903 824 996 865 910 833 1,015 889 864 897 912
W. S. Central ............... 1,279 1,323 1,661 1,272 1,305 1,346 1,671 1,288 1,311 1,372 1,706 1,322 1,384 1,403 1,429
Mountain ...................... 673 687 831 677 683 706 848 690 696 725 873 712 717 732 752
Pacific contiguous ....... 1,088 1,022 1,142 1,065 1,088 1,025 1,143 1,064 1,107 1,050 1,173 1,094 1,079 1,080 1,106
AK and HI ..................... 45 44 45 46 46 44 46 46 46 45 46 47 45 45 46
Total .......................... 9,849 9,229 10,740 9,368 9,888 9,393 11,156 9,523 9,970 9,611 11,414 9,776 9,798 9,992 10,195
- = no data available
Table 7b. U.S. Regional Electricity Retail Sales (Million Kilowatthours per Day)Energy Information Administration/Short-Term Energy Outlook - January 2010
2009 2010 2011 Year
Projections: Generated by simulation of the EIA Regional Short-Term Energy Model.
Notes: The approximate break between historical and forecast values is shown with historical data printed in bold; estimates and forecasts in italics.
See "Census division" in EIA’s Energy Glossary (http://www.eia.doe.gov/glossary/index.html) for a list of States in each region.
(a) Total retail sales to all sectors includes residential, commercial, industrial, and transportation sector sales.
Retail Sales represents total retail electricity sales by electric utilities and power marketers.
Regions refer to U.S. Census divisions.
Historical data: Latest data available from Energy Information Administration databases supporting the following reports: Electric Power Monthly , DOE/EIA-0226; and Electric Power Annual , DOE/EIA-0348. Minor discrepancies with published historical data are due to independent rounding.
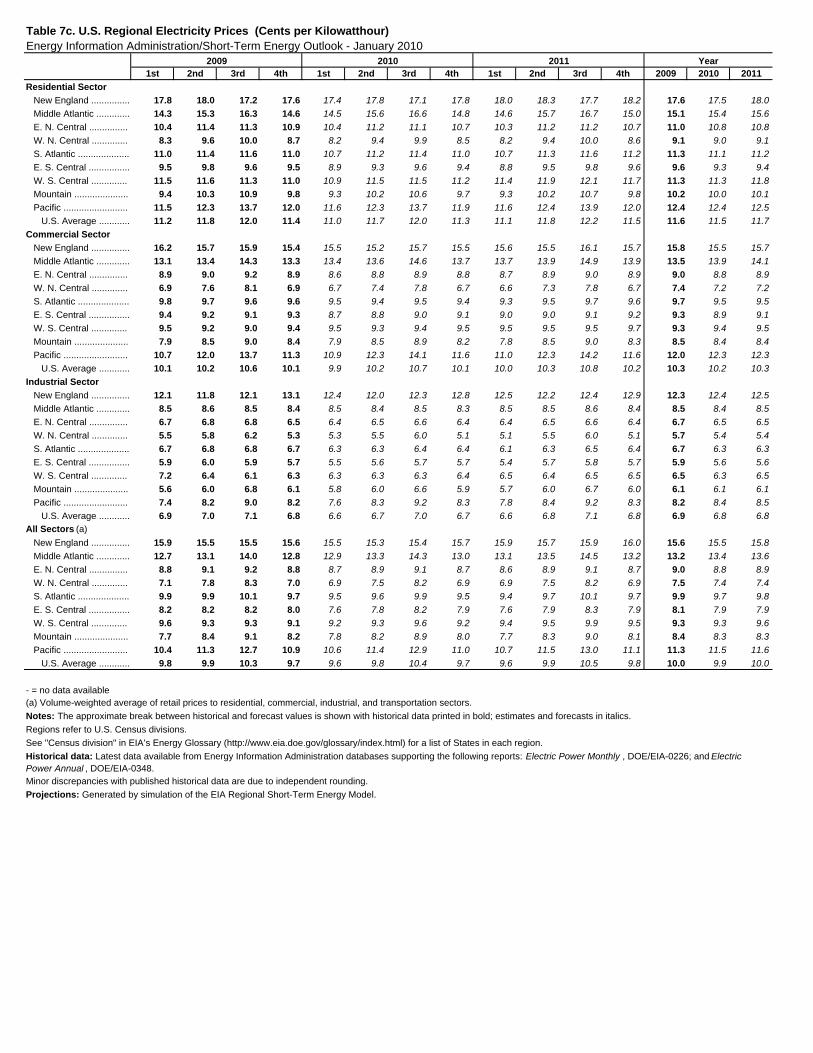
1st 2nd 3rd 4th 1st 2nd 3rd 4th 1st 2nd 3rd 4th 2009 2010 2011
Residential Sector
New England ............... 17.8 18.0 17.2 17.6 17.4 17.8 17.1 17.8 18.0 18.3 17.7 18.2 17.6 17.5 18.0
Middle Atlantic ............. 14.3 15.3 16.3 14.6 14.5 15.6 16.6 14.8 14.6 15.7 16.7 15.0 15.1 15.4 15.6
E. N. Central ............... 10.4 11.4 11.3 10.9 10.4 11.2 11.1 10.7 10.3 11.2 11.2 10.7 11.0 10.8 10.8
W. N. Central .............. 8.3 9.6 10.0 8.7 8.2 9.4 9.9 8.5 8.2 9.4 10.0 8.6 9.1 9.0 9.1
S. Atlantic .................... 11.0 11.4 11.6 11.0 10.7 11.2 11.4 11.0 10.7 11.3 11.6 11.2 11.3 11.1 11.2
E. S. Central ................ 9.5 9.8 9.6 9.5 8.9 9.3 9.6 9.4 8.8 9.5 9.8 9.6 9.6 9.3 9.4
W. S. Central .............. 11.5 11.6 11.3 11.0 10.9 11.5 11.5 11.2 11.4 11.9 12.1 11.7 11.3 11.3 11.8
Mountain ..................... 9.4 10.3 10.9 9.8 9.3 10.2 10.6 9.7 9.3 10.2 10.7 9.8 10.2 10.0 10.1
Pacific ......................... 11.5 12.3 13.7 12.0 11.6 12.3 13.7 11.9 11.6 12.4 13.9 12.0 12.4 12.4 12.5
U.S. Average ............ 11.2 11.8 12.0 11.4 11.0 11.7 12.0 11.3 11.1 11.8 12.2 11.5 11.6 11.5 11.7
Commercial Sector
New England ............... 16.2 15.7 15.9 15.4 15.5 15.2 15.7 15.5 15.6 15.5 16.1 15.7 15.8 15.5 15.7
Middle Atlantic ............. 13.1 13.4 14.3 13.3 13.4 13.6 14.6 13.7 13.7 13.9 14.9 13.9 13.5 13.9 14.1
E. N. Central ............... 8.9 9.0 9.2 8.9 8.6 8.8 8.9 8.8 8.7 8.9 9.0 8.9 9.0 8.8 8.9
W. N. Central .............. 6.9 7.6 8.1 6.9 6.7 7.4 7.8 6.7 6.6 7.3 7.8 6.7 7.4 7.2 7.2
S. Atlantic .................... 9.8 9.7 9.6 9.6 9.5 9.4 9.5 9.4 9.3 9.5 9.7 9.6 9.7 9.5 9.5
E. S. Central ................ 9.4 9.2 9.1 9.3 8.7 8.8 9.0 9.1 9.0 9.0 9.1 9.2 9.3 8.9 9.1
W. S. Central .............. 9.5 9.2 9.0 9.4 9.5 9.3 9.4 9.5 9.5 9.5 9.5 9.7 9.3 9.4 9.5
Mountain ..................... 7.9 8.5 9.0 8.4 7.9 8.5 8.9 8.2 7.8 8.5 9.0 8.3 8.5 8.4 8.4
Pacific ......................... 10.7 12.0 13.7 11.3 10.9 12.3 14.1 11.6 11.0 12.3 14.2 11.6 12.0 12.3 12.3
U.S. Average ............ 10.1 10.2 10.6 10.1 9.9 10.2 10.7 10.1 10.0 10.3 10.8 10.2 10.3 10.2 10.3
Industrial Sector
New England ............... 12.1 11.8 12.1 13.1 12.4 12.0 12.3 12.8 12.5 12.2 12.4 12.9 12.3 12.4 12.5
Middle Atlantic ............. 8.5 8.6 8.5 8.4 8.5 8.4 8.5 8.3 8.5 8.5 8.6 8.4 8.5 8.4 8.5
E. N. Central ............... 6.7 6.8 6.8 6.5 6.4 6.5 6.6 6.4 6.4 6.5 6.6 6.4 6.7 6.5 6.5
W. N. Central .............. 5.5 5.8 6.2 5.3 5.3 5.5 6.0 5.1 5.1 5.5 6.0 5.1 5.7 5.4 5.4
S. Atlantic .................... 6.7 6.8 6.8 6.7 6.3 6.3 6.4 6.4 6.1 6.3 6.5 6.4 6.7 6.3 6.3
E. S. Central ................ 5.9 6.0 5.9 5.7 5.5 5.6 5.7 5.7 5.4 5.7 5.8 5.7 5.9 5.6 5.6
W. S. Central .............. 7.2 6.4 6.1 6.3 6.3 6.3 6.3 6.4 6.5 6.4 6.5 6.5 6.5 6.3 6.5
Mountain ..................... 5.6 6.0 6.8 6.1 5.8 6.0 6.6 5.9 5.7 6.0 6.7 6.0 6.1 6.1 6.1
Pacific ......................... 7.4 8.2 9.0 8.2 7.6 8.3 9.2 8.3 7.8 8.4 9.2 8.3 8.2 8.4 8.5
U.S. Average ............ 6.9 7.0 7.1 6.8 6.6 6.7 7.0 6.7 6.6 6.8 7.1 6.8 6.9 6.8 6.8
All Sectors (a)
New England ............... 15.9 15.5 15.5 15.6 15.5 15.3 15.4 15.7 15.9 15.7 15.9 16.0 15.6 15.5 15.8
Middle Atlantic ............. 12.7 13.1 14.0 12.8 12.9 13.3 14.3 13.0 13.1 13.5 14.5 13.2 13.2 13.4 13.6
E. N. Central ............... 8.8 9.1 9.2 8.8 8.7 8.9 9.1 8.7 8.6 8.9 9.1 8.7 9.0 8.8 8.9
W. N. Central .............. 7.1 7.8 8.3 7.0 6.9 7.5 8.2 6.9 6.9 7.5 8.2 6.9 7.5 7.4 7.4
S. Atlantic .................... 9.9 9.9 10.1 9.7 9.5 9.6 9.9 9.5 9.4 9.7 10.1 9.7 9.9 9.7 9.8
E. S. Central ................ 8.2 8.2 8.2 8.0 7.6 7.8 8.2 7.9 7.6 7.9 8.3 7.9 8.1 7.9 7.9
W. S. Central .............. 9.6 9.3 9.3 9.1 9.2 9.3 9.6 9.2 9.4 9.5 9.9 9.5 9.3 9.3 9.6
Mountain ..................... 7.7 8.4 9.1 8.2 7.8 8.2 8.9 8.0 7.7 8.3 9.0 8.1 8.4 8.3 8.3
Pacific ......................... 10.4 11.3 12.7 10.9 10.6 11.4 12.9 11.0 10.7 11.5 13.0 11.1 11.3 11.5 11.6
U.S. Average ............ 9.8 9.9 10.3 9.7 9.6 9.8 10.4 9.7 9.6 9.9 10.5 9.8 10.0 9.9 10.0
(a) Volume-weighted average of retail prices to residential, commercial, industrial, and transportation sectors.
Regions refer to U.S. Census divisions.
Historical data: Latest data available from Energy Information Administration databases supporting the following reports: Electric Power Monthly , DOE/EIA-0226; and Electric Power Annual , DOE/EIA-0348.
Table 7c. U.S. Regional Electricity Prices (Cents per Kilowatthour)Energy Information Administration/Short-Term Energy Outlook - January 2010
2009 2010 2011 Year
- = no data available
Projections: Generated by simulation of the EIA Regional Short-Term Energy Model.
Notes: The approximate break between historical and forecast values is shown with historical data printed in bold; estimates and forecasts in italics.
See "Census division" in EIA’s Energy Glossary (http://www.eia.doe.gov/glossary/index.html) for a list of States in each region.
Minor discrepancies with published historical data are due to independent rounding.
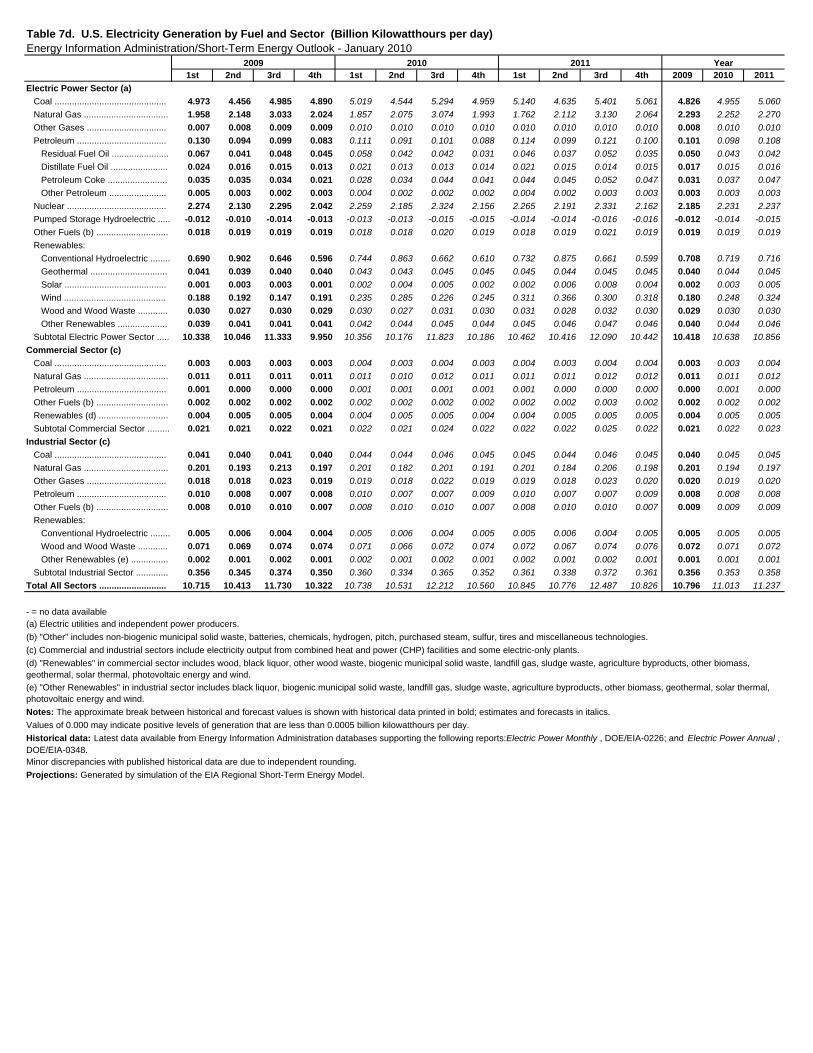
1st 2nd 3rd 4th 1st 2nd 3rd 4th 1st 2nd 3rd 4th 2009 2010 2011
Electric Power Sector (a)
Coal ............................................. 4.973 4.456 4.985 4.890 5.019 4.544 5.294 4.959 5.140 4.635 5.401 5.061 4.826 4.955 5.060
Natural Gas .................................. 1.958 2.148 3.033 2.024 1.857 2.075 3.074 1.993 1.762 2.112 3.130 2.064 2.293 2.252 2.270
Other Gases ................................ 0.007 0.008 0.009 0.009 0.010 0.010 0.010 0.010 0.010 0.010 0.010 0.010 0.008 0.010 0.010
Petroleum .................................... 0.130 0.094 0.099 0.083 0.111 0.091 0.101 0.088 0.114 0.099 0.121 0.100 0.101 0.098 0.108
Residual Fuel Oil ....................... 0.067 0.041 0.048 0.045 0.058 0.042 0.042 0.031 0.046 0.037 0.052 0.035 0.050 0.043 0.042
Distillate Fuel Oil ....................... 0.024 0.016 0.015 0.013 0.021 0.013 0.013 0.014 0.021 0.015 0.014 0.015 0.017 0.015 0.016
Petroleum Coke ........................ 0.035 0.035 0.034 0.021 0.028 0.034 0.044 0.041 0.044 0.045 0.052 0.047 0.031 0.037 0.047
Other Petroleum ....................... 0.005 0.003 0.002 0.003 0.004 0.002 0.002 0.002 0.004 0.002 0.003 0.003 0.003 0.003 0.003
Nuclear ........................................ 2.274 2.130 2.295 2.042 2.259 2.185 2.324 2.156 2.265 2.191 2.331 2.162 2.185 2.231 2.237
Pumped Storage Hydroelectric ..... -0.012 -0.010 -0.014 -0.013 -0.013 -0.013 -0.015 -0.015 -0.014 -0.014 -0.016 -0.016 -0.012 -0.014 -0.015
Other Fuels (b) ............................. 0.018 0.019 0.019 0.019 0.018 0.018 0.020 0.019 0.018 0.019 0.021 0.019 0.019 0.019 0.019
Renewables:
Conventional Hydroelectric ........ 0.690 0.902 0.646 0.596 0.744 0.863 0.662 0.610 0.732 0.875 0.661 0.599 0.708 0.719 0.716
Geothermal ............................... 0.041 0.039 0.040 0.040 0.043 0.043 0.045 0.045 0.045 0.044 0.045 0.045 0.040 0.044 0.045
Solar ......................................... 0.001 0.003 0.003 0.001 0.002 0.004 0.005 0.002 0.002 0.006 0.008 0.004 0.002 0.003 0.005
Wind ......................................... 0.188 0.192 0.147 0.191 0.235 0.285 0.226 0.245 0.311 0.366 0.300 0.318 0.180 0.248 0.324
Wood and Wood Waste ............ 0.030 0.027 0.030 0.029 0.030 0.027 0.031 0.030 0.031 0.028 0.032 0.030 0.029 0.030 0.030
Other Renewables .................... 0.039 0.041 0.041 0.041 0.042 0.044 0.045 0.044 0.045 0.046 0.047 0.046 0.040 0.044 0.046
Subtotal Electric Power Sector ..... 10.338 10.046 11.333 9.950 10.356 10.176 11.823 10.186 10.462 10.416 12.090 10.442 10.418 10.638 10.856
Commercial Sector (c)
Coal ............................................. 0.003 0.003 0.003 0.003 0.004 0.003 0.004 0.003 0.004 0.003 0.004 0.004 0.003 0.003 0.004
Natural Gas .................................. 0.011 0.011 0.011 0.011 0.011 0.010 0.012 0.011 0.011 0.011 0.012 0.012 0.011 0.011 0.012
Petroleum .................................... 0.001 0.000 0.000 0.000 0.001 0.001 0.001 0.001 0.001 0.000 0.000 0.000 0.000 0.001 0.000
Other Fuels (b) ............................. 0.002 0.002 0.002 0.002 0.002 0.002 0.002 0.002 0.002 0.002 0.003 0.002 0.002 0.002 0.002
Renewables (d) ............................ 0.004 0.005 0.005 0.004 0.004 0.005 0.005 0.004 0.004 0.005 0.005 0.005 0.004 0.005 0.005
Subtotal Commercial Sector ......... 0.021 0.021 0.022 0.021 0.022 0.021 0.024 0.022 0.022 0.022 0.025 0.022 0.021 0.022 0.023
Industrial Sector (c)
Coal ............................................. 0.041 0.040 0.041 0.040 0.044 0.044 0.046 0.045 0.045 0.044 0.046 0.045 0.040 0.045 0.045
Natural Gas .................................. 0.201 0.193 0.213 0.197 0.201 0.182 0.201 0.191 0.201 0.184 0.206 0.198 0.201 0.194 0.197
Other Gases ................................ 0.018 0.018 0.023 0.019 0.019 0.018 0.022 0.019 0.019 0.018 0.023 0.020 0.020 0.019 0.020
Petroleum .................................... 0.010 0.008 0.007 0.008 0.010 0.007 0.007 0.009 0.010 0.007 0.007 0.009 0.008 0.008 0.008
Other Fuels (b) ............................. 0.008 0.010 0.010 0.007 0.008 0.010 0.010 0.007 0.008 0.010 0.010 0.007 0.009 0.009 0.009
Renewables:
Conventional Hydroelectric ........ 0.005 0.006 0.004 0.004 0.005 0.006 0.004 0.005 0.005 0.006 0.004 0.005 0.005 0.005 0.005
Wood and Wood Waste ............ 0.071 0.069 0.074 0.074 0.071 0.066 0.072 0.074 0.072 0.067 0.074 0.076 0.072 0.071 0.072
Other Renewables (e) ............... 0.002 0.001 0.002 0.001 0.002 0.001 0.002 0.001 0.002 0.001 0.002 0.001 0.001 0.001 0.001
Subtotal Industrial Sector ............. 0.356 0.345 0.374 0.350 0.360 0.334 0.365 0.352 0.361 0.338 0.372 0.361 0.356 0.353 0.358
Total All Sectors ........................... 10.715 10.413 11.730 10.322 10.738 10.531 12.212 10.560 10.845 10.776 12.487 10.826 10.796 11.013 11.237
- = no data available
Values of 0.000 may indicate positive levels of generation that are less than 0.0005 billion kilowatthours per day.
(a) Electric utilities and independent power producers.
(e) "Other Renewables" in industrial sector includes black liquor, biogenic municipal solid waste, landfill gas, sludge waste, agriculture byproducts, other biomass, geothermal, solar thermal, photovoltaic energy and wind.
(d) "Renewables" in commercial sector includes wood, black liquor, other wood waste, biogenic municipal solid waste, landfill gas, sludge waste, agriculture byproducts, other biomass, geothermal, solar thermal, photovoltaic energy and wind.
(c) Commercial and industrial sectors include electricity output from combined heat and power (CHP) facilities and some electric-only plants.
(b) "Other" includes non-biogenic municipal solid waste, batteries, chemicals, hydrogen, pitch, purchased steam, sulfur, tires and miscellaneous technologies.
Minor discrepancies with published historical data are due to independent rounding.
Projections: Generated by simulation of the EIA Regional Short-Term Energy Model.
Table 7d. U.S. Electricity Generation by Fuel and Sector (Billion Kilowatthours per day) Energy Information Administration/Short-Term Energy Outlook - January 2010
Year2009 2010
Notes: The approximate break between historical and forecast values is shown with historical data printed in bold; estimates and forecasts in italics.
2011
Historical data: Latest data available from Energy Information Administration databases supporting the following reports: Electric Power Monthly , DOE/EIA-0226; and Electric Power Annual , DOE/EIA-0348.
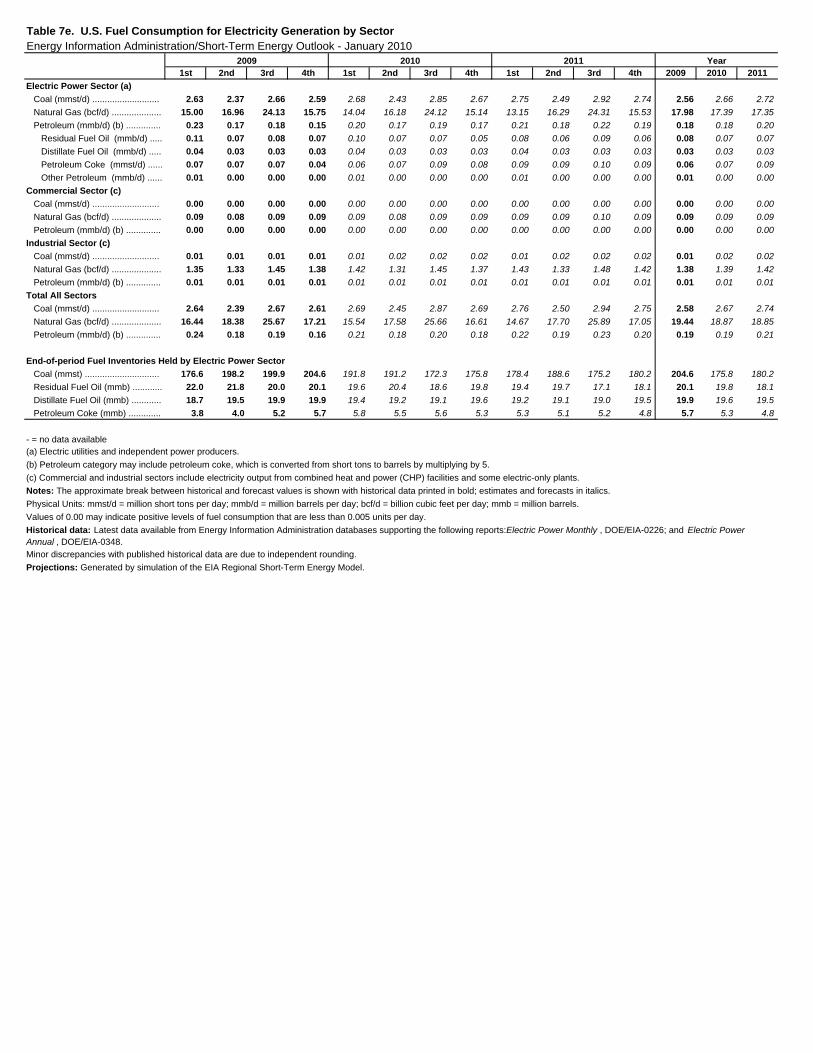
1st 2nd 3rd 4th 1st 2nd 3rd 4th 1st 2nd 3rd 4th 2009 2010 2011
Electric Power Sector (a)
Coal (mmst/d) ........................... 2.63 2.37 2.66 2.59 2.68 2.43 2.85 2.67 2.75 2.49 2.92 2.74 2.56 2.66 2.72
Natural Gas (bcf/d) .................... 15.00 16.96 24.13 15.75 14.04 16.18 24.12 15.14 13.15 16.29 24.31 15.53 17.98 17.39 17.35
Petroleum (mmb/d) (b) .............. 0.23 0.17 0.18 0.15 0.20 0.17 0.19 0.17 0.21 0.18 0.22 0.19 0.18 0.18 0.20
Residual Fuel Oil (mmb/d) ..... 0.11 0.07 0.08 0.07 0.10 0.07 0.07 0.05 0.08 0.06 0.09 0.06 0.08 0.07 0.07
Distillate Fuel Oil (mmb/d) ..... 0.04 0.03 0.03 0.03 0.04 0.03 0.03 0.03 0.04 0.03 0.03 0.03 0.03 0.03 0.03
Petroleum Coke (mmst/d) ...... 0.07 0.07 0.07 0.04 0.06 0.07 0.09 0.08 0.09 0.09 0.10 0.09 0.06 0.07 0.09
Other Petroleum (mmb/d) ...... 0.01 0.00 0.00 0.00 0.01 0.00 0.00 0.00 0.01 0.00 0.00 0.00 0.01 0.00 0.00
Commercial Sector (c)
Coal (mmst/d) ........................... 0.00 0.00 0.00 0.00 0.00 0.00 0.00 0.00 0.00 0.00 0.00 0.00 0.00 0.00 0.00
Natural Gas (bcf/d) .................... 0.09 0.08 0.09 0.09 0.09 0.08 0.09 0.09 0.09 0.09 0.10 0.09 0.09 0.09 0.09
Petroleum (mmb/d) (b) .............. 0.00 0.00 0.00 0.00 0.00 0.00 0.00 0.00 0.00 0.00 0.00 0.00 0.00 0.00 0.00
Industrial Sector (c)
Coal (mmst/d) ........................... 0.01 0.01 0.01 0.01 0.01 0.02 0.02 0.02 0.01 0.02 0.02 0.02 0.01 0.02 0.02
Natural Gas (bcf/d) .................... 1.35 1.33 1.45 1.38 1.42 1.31 1.45 1.37 1.43 1.33 1.48 1.42 1.38 1.39 1.42
Petroleum (mmb/d) (b) .............. 0.01 0.01 0.01 0.01 0.01 0.01 0.01 0.01 0.01 0.01 0.01 0.01 0.01 0.01 0.01
Total All Sectors
Coal (mmst/d) ........................... 2.64 2.39 2.67 2.61 2.69 2.45 2.87 2.69 2.76 2.50 2.94 2.75 2.58 2.67 2.74
Natural Gas (bcf/d) .................... 16.44 18.38 25.67 17.21 15.54 17.58 25.66 16.61 14.67 17.70 25.89 17.05 19.44 18.87 18.85
Petroleum (mmb/d) (b) .............. 0.24 0.18 0.19 0.16 0.21 0.18 0.20 0.18 0.22 0.19 0.23 0.20 0.19 0.19 0.21
End-of-period Fuel Inventories Held by Electric Power Sector
Coal (mmst) .............................. 176.6 198.2 199.9 204.6 191.8 191.2 172.3 175.8 178.4 188.6 175.2 180.2 204.6 175.8 180.2
Residual Fuel Oil (mmb) ............ 22.0 21.8 20.0 20.1 19.6 20.4 18.6 19.8 19.4 19.7 17.1 18.1 20.1 19.8 18.1
Distillate Fuel Oil (mmb) ............ 18.7 19.5 19.9 19.9 19.4 19.2 19.1 19.6 19.2 19.1 19.0 19.5 19.9 19.6 19.5
Petroleum Coke (mmb) ............. 3.8 4.0 5.2 5.7 5.8 5.5 5.6 5.3 5.3 5.1 5.2 4.8 5.7 5.3 4.8
Minor discrepancies with published historical data are due to independent rounding.
Projections: Generated by simulation of the EIA Regional Short-Term Energy Model.
Historical data: Latest data available from Energy Information Administration databases supporting the following reports: Electric Power Monthly , DOE/EIA-0226; and Electric Power Annual , DOE/EIA-0348.
Physical Units: mmst/d = million short tons per day; mmb/d = million barrels per day; bcf/d = billion cubic feet per day; mmb = million barrels.
Values of 0.00 may indicate positive levels of fuel consumption that are less than 0.005 units per day.
Notes: The approximate break between historical and forecast values is shown with historical data printed in bold; estimates and forecasts in italics.
(c) Commercial and industrial sectors include electricity output from combined heat and power (CHP) facilities and some electric-only plants.
(b) Petroleum category may include petroleum coke, which is converted from short tons to barrels by multiplying by 5.
2011 Year
(a) Electric utilities and independent power producers.- = no data available
Table 7e. U.S. Fuel Consumption for Electricity Generation by SectorEnergy Information Administration/Short-Term Energy Outlook - January 2010
2009 2010
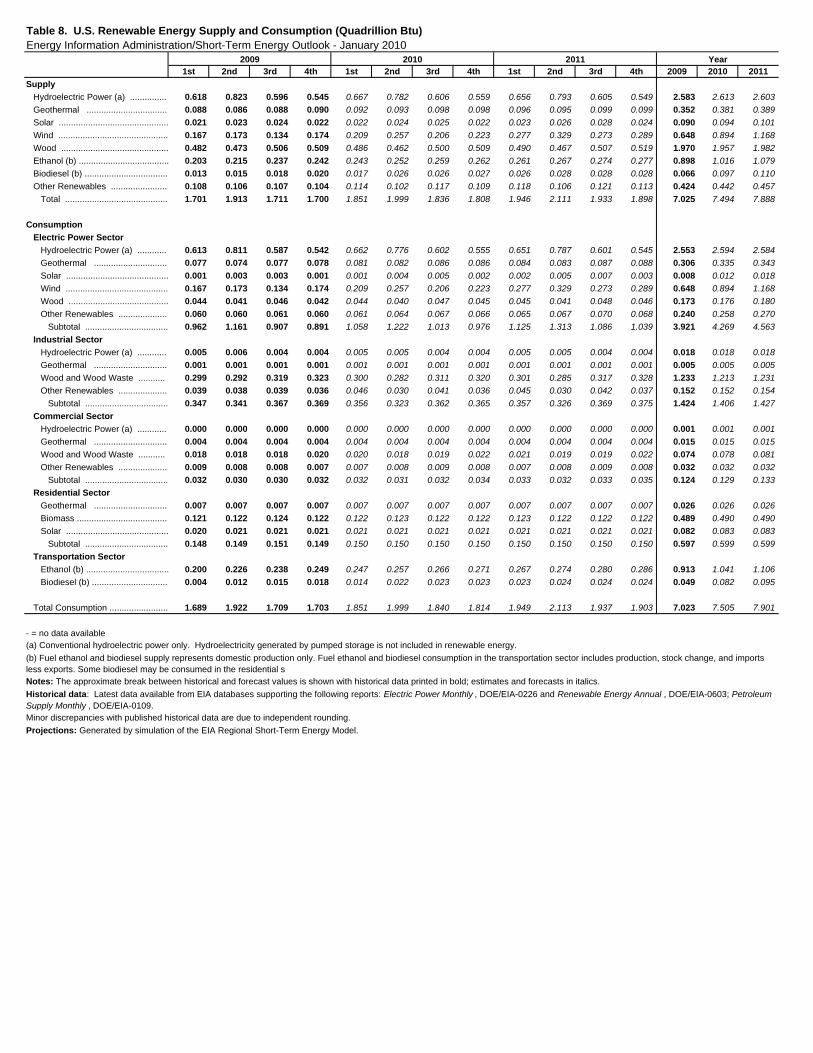
1st 2nd 3rd 4th 1st 2nd 3rd 4th 1st 2nd 3rd 4th 2009 2010 2011
Supply
Hydroelectric Power (a) ............... 0.618 0.823 0.596 0.545 0.667 0.782 0.606 0.559 0.656 0.793 0.605 0.549 2.583 2.613 2.603
Geothermal ................................. 0.088 0.086 0.088 0.090 0.092 0.093 0.098 0.098 0.096 0.095 0.099 0.099 0.352 0.381 0.389
Solar ............................................. 0.021 0.023 0.024 0.022 0.022 0.024 0.025 0.022 0.023 0.026 0.028 0.024 0.090 0.094 0.101
Wind ............................................. 0.167 0.173 0.134 0.174 0.209 0.257 0.206 0.223 0.277 0.329 0.273 0.289 0.648 0.894 1.168
Wood ............................................ 0.482 0.473 0.506 0.509 0.486 0.462 0.500 0.509 0.490 0.467 0.507 0.519 1.970 1.957 1.982
Ethanol (b) ..................................... 0.203 0.215 0.237 0.242 0.243 0.252 0.259 0.262 0.261 0.267 0.274 0.277 0.898 1.016 1.079
Biodiesel (b) .................................. 0.013 0.015 0.018 0.020 0.017 0.026 0.026 0.027 0.026 0.028 0.028 0.028 0.066 0.097 0.110
Other Renewables ....................... 0.108 0.106 0.107 0.104 0.114 0.102 0.117 0.109 0.118 0.106 0.121 0.113 0.424 0.442 0.457
Total .......................................... 1.701 1.913 1.711 1.700 1.851 1.999 1.836 1.808 1.946 2.111 1.933 1.898 7.025 7.494 7.888
Consumption
Electric Power Sector
Hydroelectric Power (a) ............ 0.613 0.811 0.587 0.542 0.662 0.776 0.602 0.555 0.651 0.787 0.601 0.545 2.553 2.594 2.584
Geothermal .............................. 0.077 0.074 0.077 0.078 0.081 0.082 0.086 0.086 0.084 0.083 0.087 0.088 0.306 0.335 0.343
Solar .......................................... 0.001 0.003 0.003 0.001 0.001 0.004 0.005 0.002 0.002 0.005 0.007 0.003 0.008 0.012 0.018
Wind .......................................... 0.167 0.173 0.134 0.174 0.209 0.257 0.206 0.223 0.277 0.329 0.273 0.289 0.648 0.894 1.168
Wood ......................................... 0.044 0.041 0.046 0.042 0.044 0.040 0.047 0.045 0.045 0.041 0.048 0.046 0.173 0.176 0.180
Other Renewables .................... 0.060 0.060 0.061 0.060 0.061 0.064 0.067 0.066 0.065 0.067 0.070 0.068 0.240 0.258 0.270
Subtotal .................................. 0.962 1.161 0.907 0.891 1.058 1.222 1.013 0.976 1.125 1.313 1.086 1.039 3.921 4.269 4.563
Industrial Sector
Hydroelectric Power (a) ............ 0.005 0.006 0.004 0.004 0.005 0.005 0.004 0.004 0.005 0.005 0.004 0.004 0.018 0.018 0.018
Geothermal .............................. 0.001 0.001 0.001 0.001 0.001 0.001 0.001 0.001 0.001 0.001 0.001 0.001 0.005 0.005 0.005
Wood and Wood Waste ........... 0.299 0.292 0.319 0.323 0.300 0.282 0.311 0.320 0.301 0.285 0.317 0.328 1.233 1.213 1.231
Other Renewables .................... 0.039 0.038 0.039 0.036 0.046 0.030 0.041 0.036 0.045 0.030 0.042 0.037 0.152 0.152 0.154
Subtotal .................................. 0.347 0.341 0.367 0.369 0.356 0.323 0.362 0.365 0.357 0.326 0.369 0.375 1.424 1.406 1.427
Commercial Sector
Hydroelectric Power (a) ............ 0.000 0.000 0.000 0.000 0.000 0.000 0.000 0.000 0.000 0.000 0.000 0.000 0.001 0.001 0.001
Geothermal .............................. 0.004 0.004 0.004 0.004 0.004 0.004 0.004 0.004 0.004 0.004 0.004 0.004 0.015 0.015 0.015
Wood and Wood Waste ........... 0.018 0.018 0.018 0.020 0.020 0.018 0.019 0.022 0.021 0.019 0.019 0.022 0.074 0.078 0.081
Other Renewables .................... 0.009 0.008 0.008 0.007 0.007 0.008 0.009 0.008 0.007 0.008 0.009 0.008 0.032 0.032 0.032
Subtotal .................................. 0.032 0.030 0.030 0.032 0.032 0.031 0.032 0.034 0.033 0.032 0.033 0.035 0.124 0.129 0.133
Residential Sector
Geothermal .............................. 0.007 0.007 0.007 0.007 0.007 0.007 0.007 0.007 0.007 0.007 0.007 0.007 0.026 0.026 0.026
Biomass ..................................... 0.121 0.122 0.124 0.122 0.122 0.123 0.122 0.122 0.123 0.122 0.122 0.122 0.489 0.490 0.490
Solar .......................................... 0.020 0.021 0.021 0.021 0.021 0.021 0.021 0.021 0.021 0.021 0.021 0.021 0.082 0.083 0.083
Subtotal .................................. 0.148 0.149 0.151 0.149 0.150 0.150 0.150 0.150 0.150 0.150 0.150 0.150 0.597 0.599 0.599
Transportation Sector
Ethanol (b) .................................. 0.200 0.226 0.238 0.249 0.247 0.257 0.266 0.271 0.267 0.274 0.280 0.286 0.913 1.041 1.106
Biodiesel (b) ............................... 0.004 0.012 0.015 0.018 0.014 0.022 0.023 0.023 0.023 0.024 0.024 0.024 0.049 0.082 0.095
Total Consumption ........................ 1.689 1.922 1.709 1.703 1.851 1.999 1.840 1.814 1.949 2.113 1.937 1.903 7.023 7.505 7.901
(a) Conventional hydroelectric power only. Hydroelectricity generated by pumped storage is not included in renewable energy.
(b) Fuel ethanol and biodiesel supply represents domestic production only. Fuel ethanol and biodiesel consumption in the transportation sector includes production, stock change, and imports less exports. Some biodiesel may be consumed in the residential s
Table 8. U.S. Renewable Energy Supply and Consumption (Quadrillion Btu)Energy Information Administration/Short-Term Energy Outlook - January 2010
2009 2010 2011 Year
- = no data available
Notes: The approximate break between historical and forecast values is shown with historical data printed in bold; estimates and forecasts in italics.
Historical data: Latest data available from EIA databases supporting the following reports: Electric Power Monthly , DOE/EIA-0226 and Renewable Energy Annual , DOE/EIA-0603; Petroleum Supply Monthly , DOE/EIA-0109. Minor discrepancies with published historical data are due to independent rounding.
Projections: Generated by simulation of the EIA Regional Short-Term Energy Model.
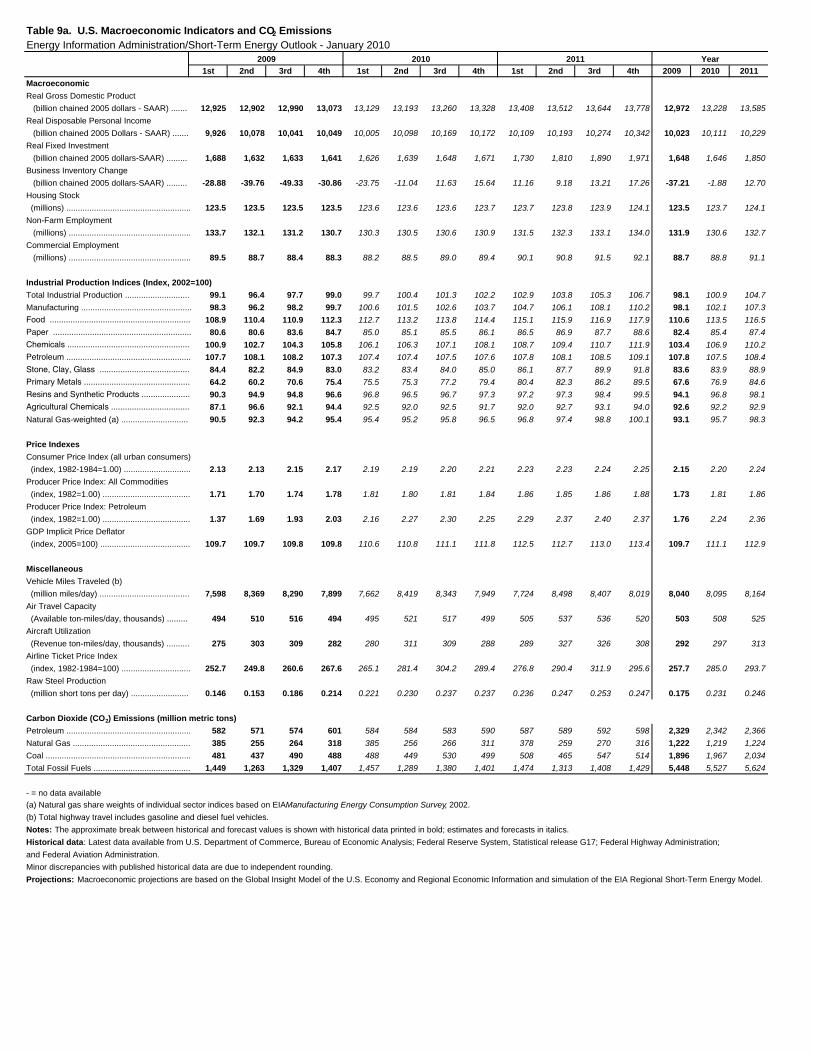
1st 2nd 3rd 4th 1st 2nd 3rd 4th 1st 2nd 3rd 4th 2009 2010 2011
Macroeconomic
Real Gross Domestic Product
(billion chained 2005 dollars - SAAR) ....... 12,925 12,902 12,990 13,073 13,129 13,193 13,260 13,328 13,408 13,512 13,644 13,778 12,972 13,228 13,585
Real Disposable Personal Income
(billion chained 2005 Dollars - SAAR) ....... 9,926 10,078 10,041 10,049 10,005 10,098 10,169 10,172 10,109 10,193 10,274 10,342 10,023 10,111 10,229
Real Fixed Investment
(billion chained 2005 dollars-SAAR) ......... 1,688 1,632 1,633 1,641 1,626 1,639 1,648 1,671 1,730 1,810 1,890 1,971 1,648 1,646 1,850
Business Inventory Change
(billion chained 2005 dollars-SAAR) ......... -28.88 -39.76 -49.33 -30.86 -23.75 -11.04 11.63 15.64 11.16 9.18 13.21 17.26 -37.21 -1.88 12.70
Housing Stock
(millions) ...................................................... 123.5 123.5 123.5 123.5 123.6 123.6 123.6 123.7 123.7 123.8 123.9 124.1 123.5 123.7 124.1
Non-Farm Employment
(millions) ..................................................... 133.7 132.1 131.2 130.7 130.3 130.5 130.6 130.9 131.5 132.3 133.1 134.0 131.9 130.6 132.7
Commercial Employment
(millions) ..................................................... 89.5 88.7 88.4 88.3 88.2 88.5 89.0 89.4 90.1 90.8 91.5 92.1 88.7 88.8 91.1
Industrial Production Indices (Index, 2002=100)
Total Industrial Production ............................ 99.1 96.4 97.7 99.0 99.7 100.4 101.3 102.2 102.9 103.8 105.3 106.7 98.1 100.9 104.7
Manufacturing ................................................ 98.3 96.2 98.2 99.7 100.6 101.5 102.6 103.7 104.7 106.1 108.1 110.2 98.1 102.1 107.3
Food ............................................................. 108.9 110.4 110.9 112.3 112.7 113.2 113.8 114.4 115.1 115.9 116.9 117.9 110.6 113.5 116.5
Paper ............................................................ 80.6 80.6 83.6 84.7 85.0 85.1 85.5 86.1 86.5 86.9 87.7 88.6 82.4 85.4 87.4
Chemicals ..................................................... 100.9 102.7 104.3 105.8 106.1 106.3 107.1 108.1 108.7 109.4 110.7 111.9 103.4 106.9 110.2
Petroleum ...................................................... 107.7 108.1 108.2 107.3 107.4 107.4 107.5 107.6 107.8 108.1 108.5 109.1 107.8 107.5 108.4
Stone, Clay, Glass ....................................... 84.4 82.2 84.9 83.0 83.2 83.4 84.0 85.0 86.1 87.7 89.9 91.8 83.6 83.9 88.9
Primary Metals .............................................. 64.2 60.2 70.6 75.4 75.5 75.3 77.2 79.4 80.4 82.3 86.2 89.5 67.6 76.9 84.6
Resins and Synthetic Products ..................... 90.3 94.9 94.8 96.6 96.8 96.5 96.7 97.3 97.2 97.3 98.4 99.5 94.1 96.8 98.1
Agricultural Chemicals .................................. 87.1 96.6 92.1 94.4 92.5 92.0 92.5 91.7 92.0 92.7 93.1 94.0 92.6 92.2 92.9
Natural Gas-weighted (a) ............................. 90.5 92.3 94.2 95.4 95.4 95.2 95.8 96.5 96.8 97.4 98.8 100.1 93.1 95.7 98.3
Price Indexes
Consumer Price Index (all urban consumers)
(index, 1982-1984=1.00) ............................. 2.13 2.13 2.15 2.17 2.19 2.19 2.20 2.21 2.23 2.23 2.24 2.25 2.15 2.20 2.24
Producer Price Index: All Commodities
(index, 1982=1.00) ...................................... 1.71 1.70 1.74 1.78 1.81 1.80 1.81 1.84 1.86 1.85 1.86 1.88 1.73 1.81 1.86
Producer Price Index: Petroleum
(index, 1982=1.00) ...................................... 1.37 1.69 1.93 2.03 2.16 2.27 2.30 2.25 2.29 2.37 2.40 2.37 1.76 2.24 2.36
GDP Implicit Price Deflator
(index, 2005=100) ....................................... 109.7 109.7 109.8 109.8 110.6 110.8 111.1 111.8 112.5 112.7 113.0 113.4 109.7 111.1 112.9
Miscellaneous
Vehicle Miles Traveled (b)
(million miles/day) ....................................... 7,598 8,369 8,290 7,899 7,662 8,419 8,343 7,949 7,724 8,498 8,407 8,019 8,040 8,095 8,164
Air Travel Capacity
(Available ton-miles/day, thousands) ......... 494 510 516 494 495 521 517 499 505 537 536 520 503 508 525
Aircraft Utilization
(Revenue ton-miles/day, thousands) .......... 275 303 309 282 280 311 309 288 289 327 326 308 292 297 313
Airline Ticket Price Index
(index, 1982-1984=100) .............................. 252.7 249.8 260.6 267.6 265.1 281.4 304.2 289.4 276.8 290.4 311.9 295.6 257.7 285.0 293.7
Raw Steel Production
(million short tons per day) ......................... 0.146 0.153 0.186 0.214 0.221 0.230 0.237 0.237 0.236 0.247 0.253 0.247 0.175 0.231 0.246
Carbon Dioxide (CO2) Emissions (million metric tons)
Petroleum ...................................................... 582 571 574 601 584 584 583 590 587 589 592 598 2,329 2,342 2,366
Natural Gas ................................................... 385 255 264 318 385 256 266 311 378 259 270 316 1,222 1,219 1,224
Coal ............................................................... 481 437 490 488 488 449 530 499 508 465 547 514 1,896 1,967 2,034
Total Fossil Fuels .......................................... 1,449 1,263 1,329 1,407 1,457 1,289 1,380 1,401 1,474 1,313 1,408 1,429 5,448 5,527 5,624
- = no data available
(a) Natural gas share weights of individual sector indices based on EIA Manufacturing Energy Consumption Survey, 2002.
(b) Total highway travel includes gasoline and diesel fuel vehicles.
Minor discrepancies with published historical data are due to independent rounding.
Projections: Macroeconomic projections are based on the Global Insight Model of the U.S. Economy and Regional Economic Information and simulation of the EIA Regional Short-Term Energy Model.
and Federal Aviation Administration.
Notes: The approximate break between historical and forecast values is shown with historical data printed in bold; estimates and forecasts in italics.
Historical data: Latest data available from U.S. Department of Commerce, Bureau of Economic Analysis; Federal Reserve System, Statistical release G17; Federal Highway Administration;
Table 9a. U.S. Macroeconomic Indicators and CO2 EmissionsEnergy Information Administration/Short-Term Energy Outlook - January 2010
2009 2010 2011 Year
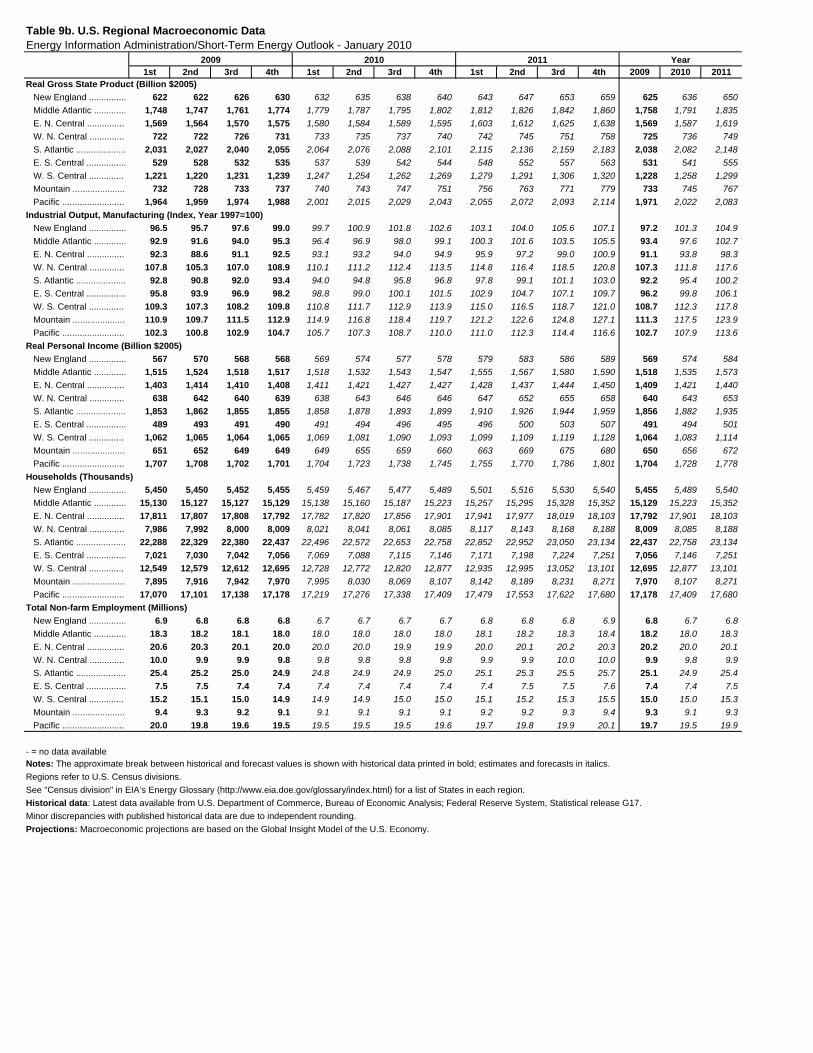
1st 2nd 3rd 4th 1st 2nd 3rd 4th 1st 2nd 3rd 4th 2009 2010 2011Real Gross State Product (Billion $2005)
New England ............... 622 622 626 630 632 635 638 640 643 647 653 659 625 636 650
Middle Atlantic ............. 1,748 1,747 1,761 1,774 1,779 1,787 1,795 1,802 1,812 1,826 1,842 1,860 1,758 1,791 1,835
E. N. Central ............... 1,569 1,564 1,570 1,575 1,580 1,584 1,589 1,595 1,603 1,612 1,625 1,638 1,569 1,587 1,619
W. N. Central .............. 722 722 726 731 733 735 737 740 742 745 751 758 725 736 749
S. Atlantic .................... 2,031 2,027 2,040 2,055 2,064 2,076 2,088 2,101 2,115 2,136 2,159 2,183 2,038 2,082 2,148
E. S. Central ................ 529 528 532 535 537 539 542 544 548 552 557 563 531 541 555
W. S. Central .............. 1,221 1,220 1,231 1,239 1,247 1,254 1,262 1,269 1,279 1,291 1,306 1,320 1,228 1,258 1,299
Mountain ..................... 732 728 733 737 740 743 747 751 756 763 771 779 733 745 767
Pacific ......................... 1,964 1,959 1,974 1,988 2,001 2,015 2,029 2,043 2,055 2,072 2,093 2,114 1,971 2,022 2,083
Industrial Output, Manufacturing (Index, Year 1997=100)
New England ............... 96.5 95.7 97.6 99.0 99.7 100.9 101.8 102.6 103.1 104.0 105.6 107.1 97.2 101.3 104.9
Middle Atlantic ............. 92.9 91.6 94.0 95.3 96.4 96.9 98.0 99.1 100.3 101.6 103.5 105.5 93.4 97.6 102.7
E. N. Central ............... 92.3 88.6 91.1 92.5 93.1 93.2 94.0 94.9 95.9 97.2 99.0 100.9 91.1 93.8 98.3
W. N. Central .............. 107.8 105.3 107.0 108.9 110.1 111.2 112.4 113.5 114.8 116.4 118.5 120.8 107.3 111.8 117.6
S. Atlantic .................... 92.8 90.8 92.0 93.4 94.0 94.8 95.8 96.8 97.8 99.1 101.1 103.0 92.2 95.4 100.2
E. S. Central ................ 95.8 93.9 96.9 98.2 98.8 99.0 100.1 101.5 102.9 104.7 107.1 109.7 96.2 99.8 106.1
W. S. Central .............. 109.3 107.3 108.2 109.8 110.8 111.7 112.9 113.9 115.0 116.5 118.7 121.0 108.7 112.3 117.8
Mountain ..................... 110.9 109.7 111.5 112.9 114.9 116.8 118.4 119.7 121.2 122.6 124.8 127.1 111.3 117.5 123.9
Pacific ......................... 102.3 100.8 102.9 104.7 105.7 107.3 108.7 110.0 111.0 112.3 114.4 116.6 102.7 107.9 113.6
Real Personal Income (Billion $2005)
New England ............... 567 570 568 568 569 574 577 578 579 583 586 589 569 574 584
Middle Atlantic ............. 1,515 1,524 1,518 1,517 1,518 1,532 1,543 1,547 1,555 1,567 1,580 1,590 1,518 1,535 1,573
E. N. Central ............... 1,403 1,414 1,410 1,408 1,411 1,421 1,427 1,427 1,428 1,437 1,444 1,450 1,409 1,421 1,440
W. N. Central .............. 638 642 640 639 638 643 646 646 647 652 655 658 640 643 653
S. Atlantic .................... 1,853 1,862 1,855 1,855 1,858 1,878 1,893 1,899 1,910 1,926 1,944 1,959 1,856 1,882 1,935
E. S. Central ................ 489 493 491 490 491 494 496 495 496 500 503 507 491 494 501
W. S. Central .............. 1,062 1,065 1,064 1,065 1,069 1,081 1,090 1,093 1,099 1,109 1,119 1,128 1,064 1,083 1,114
Mountain ..................... 651 652 649 649 649 655 659 660 663 669 675 680 650 656 672
Pacific ......................... 1,707 1,708 1,702 1,701 1,704 1,723 1,738 1,745 1,755 1,770 1,786 1,801 1,704 1,728 1,778
Households (Thousands)
New England ............... 5,450 5,450 5,452 5,455 5,459 5,467 5,477 5,489 5,501 5,516 5,530 5,540 5,455 5,489 5,540
Middle Atlantic ............. 15,130 15,127 15,127 15,129 15,138 15,160 15,187 15,223 15,257 15,295 15,328 15,352 15,129 15,223 15,352
E. N. Central ............... 17,811 17,807 17,808 17,792 17,782 17,820 17,856 17,901 17,941 17,977 18,019 18,103 17,792 17,901 18,103
W. N. Central .............. 7,986 7,992 8,000 8,009 8,021 8,041 8,061 8,085 8,117 8,143 8,168 8,188 8,009 8,085 8,188
S. Atlantic .................... 22,288 22,329 22,380 22,437 22,496 22,572 22,653 22,758 22,852 22,952 23,050 23,134 22,437 22,758 23,134
E. S. Central ................ 7,021 7,030 7,042 7,056 7,069 7,088 7,115 7,146 7,171 7,198 7,224 7,251 7,056 7,146 7,251
W. S. Central .............. 12,549 12,579 12,612 12,695 12,728 12,772 12,820 12,877 12,935 12,995 13,052 13,101 12,695 12,877 13,101
Mountain ..................... 7,895 7,916 7,942 7,970 7,995 8,030 8,069 8,107 8,142 8,189 8,231 8,271 7,970 8,107 8,271
Pacific ......................... 17,070 17,101 17,138 17,178 17,219 17,276 17,338 17,409 17,479 17,553 17,622 17,680 17,178 17,409 17,680
Total Non-farm Employment (Millions)
New England ............... 6.9 6.8 6.8 6.8 6.7 6.7 6.7 6.7 6.8 6.8 6.8 6.9 6.8 6.7 6.8
Middle Atlantic ............. 18.3 18.2 18.1 18.0 18.0 18.0 18.0 18.0 18.1 18.2 18.3 18.4 18.2 18.0 18.3
E. N. Central ............... 20.6 20.3 20.1 20.0 20.0 20.0 19.9 19.9 20.0 20.1 20.2 20.3 20.2 20.0 20.1
W. N. Central .............. 10.0 9.9 9.9 9.8 9.8 9.8 9.8 9.8 9.9 9.9 10.0 10.0 9.9 9.8 9.9
S. Atlantic .................... 25.4 25.2 25.0 24.9 24.8 24.9 24.9 25.0 25.1 25.3 25.5 25.7 25.1 24.9 25.4
E. S. Central ................ 7.5 7.5 7.4 7.4 7.4 7.4 7.4 7.4 7.4 7.5 7.5 7.6 7.4 7.4 7.5
W. S. Central .............. 15.2 15.1 15.0 14.9 14.9 14.9 15.0 15.0 15.1 15.2 15.3 15.5 15.0 15.0 15.3
Mountain ..................... 9.4 9.3 9.2 9.1 9.1 9.1 9.1 9.1 9.2 9.2 9.3 9.4 9.3 9.1 9.3
Pacific ......................... 20.0 19.8 19.6 19.5 19.5 19.5 19.5 19.6 19.7 19.8 19.9 20.1 19.7 19.5 19.9
Projections: Macroeconomic projections are based on the Global Insight Model of the U.S. Economy.
Regions refer to U.S. Census divisions.
Historical data: Latest data available from U.S. Department of Commerce, Bureau of Economic Analysis; Federal Reserve System, Statistical release G17.
2011 Year
- = no data availableNotes: The approximate break between historical and forecast values is shown with historical data printed in bold; estimates and forecasts in italics.
See "Census division" in EIA’s Energy Glossary (http://www.eia.doe.gov/glossary/index.html) for a list of States in each region.
Minor discrepancies with published historical data are due to independent rounding.
Table 9b. U.S. Regional Macroeconomic DataEnergy Information Administration/Short-Term Energy Outlook - January 2010
2009 2010
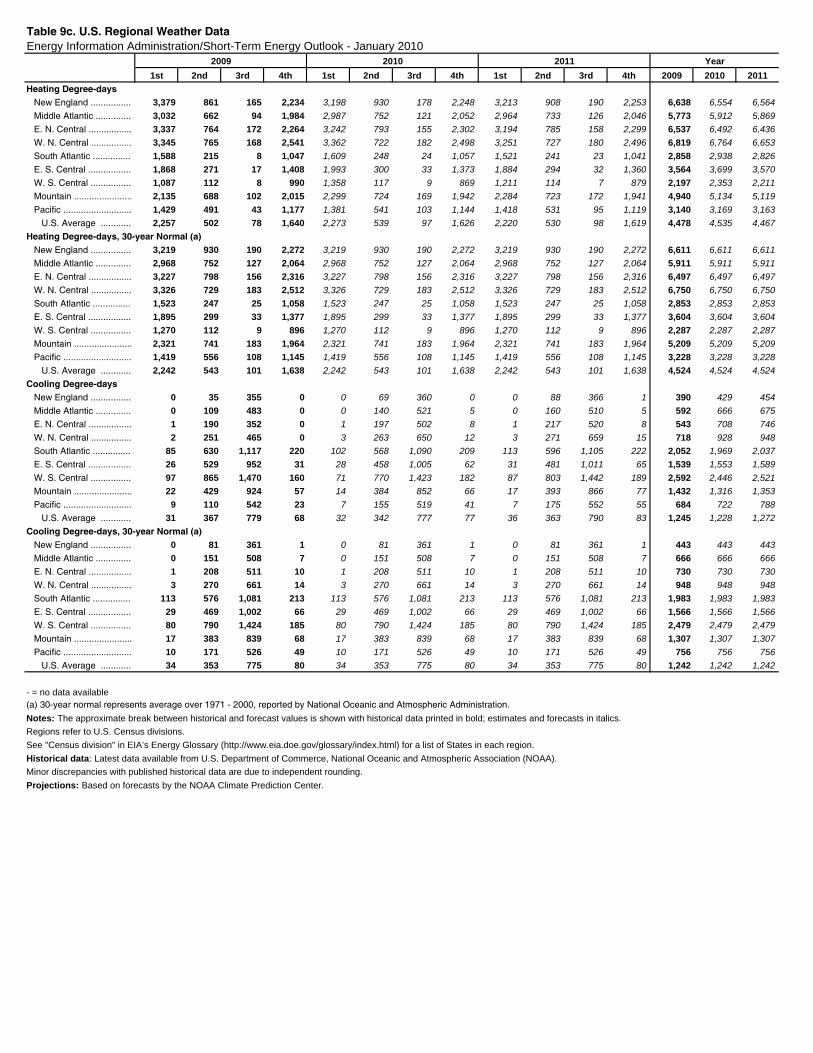
1st 2nd 3rd 4th 1st 2nd 3rd 4th 1st 2nd 3rd 4th 2009 2010 2011
Heating Degree-days New England ................ 3,379 861 165 2,234 3,198 930 178 2,248 3,213 908 190 2,253 6,638 6,554 6,564
Middle Atlantic .............. 3,032 662 94 1,984 2,987 752 121 2,052 2,964 733 126 2,046 5,773 5,912 5,869
E. N. Central ................. 3,337 764 172 2,264 3,242 793 155 2,302 3,194 785 158 2,299 6,537 6,492 6,436
W. N. Central ................ 3,345 765 168 2,541 3,362 722 182 2,498 3,251 727 180 2,496 6,819 6,764 6,653
South Atlantic ............... 1,588 215 8 1,047 1,609 248 24 1,057 1,521 241 23 1,041 2,858 2,938 2,826
E. S. Central ................. 1,868 271 17 1,408 1,993 300 33 1,373 1,884 294 32 1,360 3,564 3,699 3,570
W. S. Central ................ 1,087 112 8 990 1,358 117 9 869 1,211 114 7 879 2,197 2,353 2,211
Mountain ....................... 2,135 688 102 2,015 2,299 724 169 1,942 2,284 723 172 1,941 4,940 5,134 5,119
Pacific ........................... 1,429 491 43 1,177 1,381 541 103 1,144 1,418 531 95 1,119 3,140 3,169 3,163
U.S. Average ............ 2,257 502 78 1,640 2,273 539 97 1,626 2,220 530 98 1,619 4,478 4,535 4,467
Heating Degree-days, 30-year Normal (a) New England ................ 3,219 930 190 2,272 3,219 930 190 2,272 3,219 930 190 2,272 6,611 6,611 6,611
Middle Atlantic .............. 2,968 752 127 2,064 2,968 752 127 2,064 2,968 752 127 2,064 5,911 5,911 5,911
E. N. Central ................. 3,227 798 156 2,316 3,227 798 156 2,316 3,227 798 156 2,316 6,497 6,497 6,497
W. N. Central ................ 3,326 729 183 2,512 3,326 729 183 2,512 3,326 729 183 2,512 6,750 6,750 6,750
South Atlantic ............... 1,523 247 25 1,058 1,523 247 25 1,058 1,523 247 25 1,058 2,853 2,853 2,853
E. S. Central ................. 1,895 299 33 1,377 1,895 299 33 1,377 1,895 299 33 1,377 3,604 3,604 3,604
W. S. Central ................ 1,270 112 9 896 1,270 112 9 896 1,270 112 9 896 2,287 2,287 2,287
Mountain ....................... 2,321 741 183 1,964 2,321 741 183 1,964 2,321 741 183 1,964 5,209 5,209 5,209
Pacific ........................... 1,419 556 108 1,145 1,419 556 108 1,145 1,419 556 108 1,145 3,228 3,228 3,228
U.S. Average ............ 2,242 543 101 1,638 2,242 543 101 1,638 2,242 543 101 1,638 4,524 4,524 4,524
Cooling Degree-days New England ................ 0 35 355 0 0 69 360 0 0 88 366 1 390 429 454
Middle Atlantic .............. 0 109 483 0 0 140 521 5 0 160 510 5 592 666 675
E. N. Central ................. 1 190 352 0 1 197 502 8 1 217 520 8 543 708 746
W. N. Central ................ 2 251 465 0 3 263 650 12 3 271 659 15 718 928 948
South Atlantic ............... 85 630 1,117 220 102 568 1,090 209 113 596 1,105 222 2,052 1,969 2,037
E. S. Central ................. 26 529 952 31 28 458 1,005 62 31 481 1,011 65 1,539 1,553 1,589
W. S. Central ................ 97 865 1,470 160 71 770 1,423 182 87 803 1,442 189 2,592 2,446 2,521
Mountain ....................... 22 429 924 57 14 384 852 66 17 393 866 77 1,432 1,316 1,353
Pacific ........................... 9 110 542 23 7 155 519 41 7 175 552 55 684 722 788
U.S. Average ............ 31 367 779 68 32 342 777 77 36 363 790 83 1,245 1,228 1,272
Cooling Degree-days, 30-year Normal (a) New England ................ 0 81 361 1 0 81 361 1 0 81 361 1 443 443 443
Middle Atlantic .............. 0 151 508 7 0 151 508 7 0 151 508 7 666 666 666
E. N. Central ................. 1 208 511 10 1 208 511 10 1 208 511 10 730 730 730
W. N. Central ................ 3 270 661 14 3 270 661 14 3 270 661 14 948 948 948
South Atlantic ............... 113 576 1,081 213 113 576 1,081 213 113 576 1,081 213 1,983 1,983 1,983
E. S. Central ................. 29 469 1,002 66 29 469 1,002 66 29 469 1,002 66 1,566 1,566 1,566
W. S. Central ................ 80 790 1,424 185 80 790 1,424 185 80 790 1,424 185 2,479 2,479 2,479
Mountain ....................... 17 383 839 68 17 383 839 68 17 383 839 68 1,307 1,307 1,307
Pacific ........................... 10 171 526 49 10 171 526 49 10 171 526 49 756 756 756
U.S. Average ............ 34 353 775 80 34 353 775 80 34 353 775 80 1,242 1,242 1,242
Historical data: Latest data available from U.S. Department of Commerce, National Oceanic and Atmospheric Association (NOAA).
Minor discrepancies with published historical data are due to independent rounding.
Projections: Based on forecasts by the NOAA Climate Prediction Center.
Notes: The approximate break between historical and forecast values is shown with historical data printed in bold; estimates and forecasts in italics.
(a) 30-year normal represents average over 1971 - 2000, reported by National Oceanic and Atmospheric Administration.
Regions refer to U.S. Census divisions.
See "Census division" in EIA’s Energy Glossary (http://www.eia.doe.gov/glossary/index.html) for a list of States in each region.
2010 2011
- = no data available
Table 9c. U.S. Regional Weather DataEnergy Information Administration/Short-Term Energy Outlook - January 2010
Year2009
Related Documents