U.S. Energy Information Administration | Short-Term Energy Outlook June 2019 1 June 2019 Short-Term Energy Outlook (STEO) Forecast highlights Global liquid fuels • Brent crude oil spot prices averaged $71 per barrel (b) in May, largely unchanged from April 2019 and almost $6/b lower than the price in May of last year. However, Brent prices fell sharply in recent weeks, reaching $62/b on June 5. EIA forecasts Brent spot prices will average $67/b in 2019, $3/b lower than the forecast in last month’s STEO, and remain at $67/b in 2020. EIA’s lower 2019 Brent price path reflects rising uncertainty about global oil demand growth. • EIA forecasts global oil inventories will decline by 0.3 million barrels per day (b/d) in 2019 and then increase by 0.3 million b/d in 2020. Although global liquid fuels demand outpaces supply in 2019 in EIA’s forecast, global liquid fuels supply is forecast to rise by 2.0 million b/d in 2020, with 1.4 million of that growth coming from the United States. Global oil demand rises by 1.4 million b/d in 2020 in the forecast, up from expected growth of 1.2 million b/d in 2019. • Annual U.S. crude oil production reached a record 11.0 million b/d in 2018. EIA forecasts that U.S. production will increase by 1.4 million b/d in 2019 and by 0.9 million b/d in 2020, with 2020 production averaging 13.3 million b/d. Despite EIA’s expectation for slowing growth, the 2019 forecast would be the second-largest annual growth on record (following 1.6 million b/d in 2018), and the 2020 forecast would be the fifth-largest growth on record. • For the 2019 summer driving season, which runs from April through September, EIA forecasts that U.S. regular gasoline retail prices will average $2.76 per gallon (gal), down from an average of $2.85/gal last summer. The lower forecast gasoline prices primarily reflect EIA’s expectation of lower crude oil prices this summer. Natural gas • The Henry Hub natural gas spot price averaged $2.64/million British thermal units (MMBtu) in May, almost unchanged from April. EIA expects strong growth in U.S. natural gas production to put downward pressure on prices in 2019. EIA expects Henry Hub natural gas spot prices will average $2.77/MMBtu in 2019, down 38 cents/MMBtu from 2018. EIA expects natural gas prices in 2020 will again average $2.77/MMBtu.

Welcome message from author
This document is posted to help you gain knowledge. Please leave a comment to let me know what you think about it! Share it to your friends and learn new things together.
Transcript

U.S. Energy Information Administration | Short-Term Energy Outlook June 2019 1
June 2019
Short-Term Energy Outlook (STEO)
Forecast highlights
Global liquid fuels
• Brent crude oil spot prices averaged $71 per barrel (b) in May, largely unchanged from April 2019 and almost $6/b lower than the price in May of last year. However, Brent prices fell sharply in recent weeks, reaching $62/b on June 5. EIA forecasts Brent spot prices will average $67/b in 2019, $3/b lower than the forecast in last month’s STEO, and remain at $67/b in 2020. EIA’s lower 2019 Brent price path reflects rising uncertainty about global oil demand growth.
• EIA forecasts global oil inventories will decline by 0.3 million barrels per day (b/d) in 2019 and then increase by 0.3 million b/d in 2020. Although global liquid fuels demand outpaces supply in 2019 in EIA’s forecast, global liquid fuels supply is forecast to rise by 2.0 million b/d in 2020, with 1.4 million of that growth coming from the United States. Global oil demand rises by 1.4 million b/d in 2020 in the forecast, up from expected growth of 1.2 million b/d in 2019.
• Annual U.S. crude oil production reached a record 11.0 million b/d in 2018. EIA forecasts that U.S. production will increase by 1.4 million b/d in 2019 and by 0.9 million b/d in 2020, with 2020 production averaging 13.3 million b/d. Despite EIA’s expectation for slowing growth, the 2019 forecast would be the second-largest annual growth on record (following 1.6 million b/d in 2018), and the 2020 forecast would be the fifth-largest growth on record.
• For the 2019 summer driving season, which runs from April through September, EIA forecasts that U.S. regular gasoline retail prices will average $2.76 per gallon (gal), down from an average of $2.85/gal last summer. The lower forecast gasoline prices primarily reflect EIA’s expectation of lower crude oil prices this summer.
Natural gas
• The Henry Hub natural gas spot price averaged $2.64/million British thermal units (MMBtu) in May, almost unchanged from April. EIA expects strong growth in U.S. natural gas production to put downward pressure on prices in 2019. EIA expects Henry Hub natural gas spot prices will average $2.77/MMBtu in 2019, down 38 cents/MMBtu from 2018. EIA expects natural gas prices in 2020 will again average $2.77/MMBtu.

U.S. Energy Information Administration | Short-Term Energy Outlook June 2019 2
• EIA forecasts that U.S. dry natural gas production will average 90.6 billion cubic feet per day (Bcf/d) in 2019, up 7.2 Bcf/d from 2018. EIA expects natural gas production will continue to grow in 2020, albeit at a slower rate, averaging 91.8 Bcf/d next year.
• U.S. natural gas exports averaged 9.9 Bcf/d in 2018, and EIA forecasts that they will rise by 2.5 Bcf/d in 2019 and by 2.9 Bcf/d in 2020. Rising exports reflect increases in liquefied natural gas exports as new facilities come online. Rising natural gas exports are also the result of an expected increase in pipeline exports to Mexico.
• EIA estimates that natural gas inventories ended March at 1.2 trillion cubic feet (Tcf), 15% lower than levels from a year earlier and 28% lower than the five-year (2014–18) average. EIA forecasts that natural gas storage injections will outpace the previous five-year average during the 2019 April-through-October injection season and that inventories will reach almost 3.8 Tcf at the end of October, which would be 17% higher than October 2018 levels and about equal to the five-year average.
Electricity, coal, renewables, and emissions
• EIA expects the share of U.S. total utility-scale electricity generation from natural gas-fired power plants to rise from 35% in 2018 to 37% in 2019 and to 38% in 2020. EIA forecasts that the share of generation from coal will average 24% in 2019 and 23% in 2020, down from 27% in 2018. The forecast nuclear share of generation falls from 20% in 2019 to 19% in 2020, reflecting the retirement of some nuclear reactors. Hydropower averages a 7% share of total generation in the forecast for 2019 and 2020, similar to 2018. Wind, solar, and other nonhydropower renewables together provided 10% of U.S. generation in 2018. EIA expects they will provide 11% in 2019 and 13% in 2020.
• EIA forecasts that renewable fuels, including wind, solar, and hydropower, will collectively produce 18% of U.S. electricity in 2019 and almost 20% in 2020. EIA expects that annual generation from wind will surpass hydropower generation for the first time in 2019 to become the leading source of renewable electricity generation and maintain that position in 2020.
• EIA forecasts that U.S. coal consumption, which reached a 39-year low of 687 million short tons (MMst) in 2018, will fall to 602 MMst in 2019 and to 567 MMst in 2020. The falling consumption reflects lower demand for coal in the electric power sector.
• After rising by 2.7% in 2018, EIA forecasts that U.S. energy-related carbon dioxide (CO2) emissions will decline by 2.0% in 2019 and by 0.9% in 2020. EIA expects U.S. CO2 emissions will fall in 2019 and in 2020 because its forecast assumes that temperatures will return to near normal, and because the forecast share of electricity generated from natural gas and renewables increases while the forecast share generated from coal, which produces more CO2 emissions, decreases. Energy-related CO2 emissions are sensitive to weather, economic growth, energy prices, and fuel mix.

U.S. Energy Information Administration | Short-Term Energy Outlook June 2019 3
Petroleum and natural gas markets review Crude oil
Prices: The front-month futures price for Brent crude oil settled at $61.67 per barrel (b) on June 6, 2019, a decrease of $10.51/b from May 1. The front-month futures price for West Texas Intermediate (WTI) crude oil for delivery at Cushing, Oklahoma, decreased by $11.01/b during the same period, settling at $52.59/b on June 6 (Figure 1).
Crude oil price volatility increased in May after declining for four consecutive months and stayed at elevated levels into the first week of June. Demand-side concerns became the most salient issue during the past month and contributed to volatility and price declines for risk assets such as commodities and equities. Both China and the United States issued tariffs on each other, with the United States also announcing potential tariffs on Mexico near the end of May. In addition, expected industrial activity, as measured by the manufacturing Purchasing Managers’ Index (PMI), declined across several countries in May, and the U.S. manufacturing PMI fell to its lowest level since 2009. These developments are contributing to concerns that economic growth could be lower than market participants’ expectations, which would cause oil demand growth to also be lower than expected.
Declining crude oil production in Venezuela and Iran, as well as Saudi Arabian over-compliance with December 2018 Vienna agreement production cuts, pushed crude oil production among members of the Organization of the Petroleum Exporting Countries (OPEC) to 29.9 million barrels per day (b/d) in May, the lowest for any month since July 2014. In addition, production shut-ins in Russia related to contamination of the Druzhba crude oil pipeline have emerged, and the market effect of these reductions has been compounded by planned maintenance on crude oil production platforms in the North Sea, where crude oil grades are in many cases substitutable for the disrupted Russian barrels.
U.S. Energy Information Administration | Short-Term Energy Outlook June 2019 4
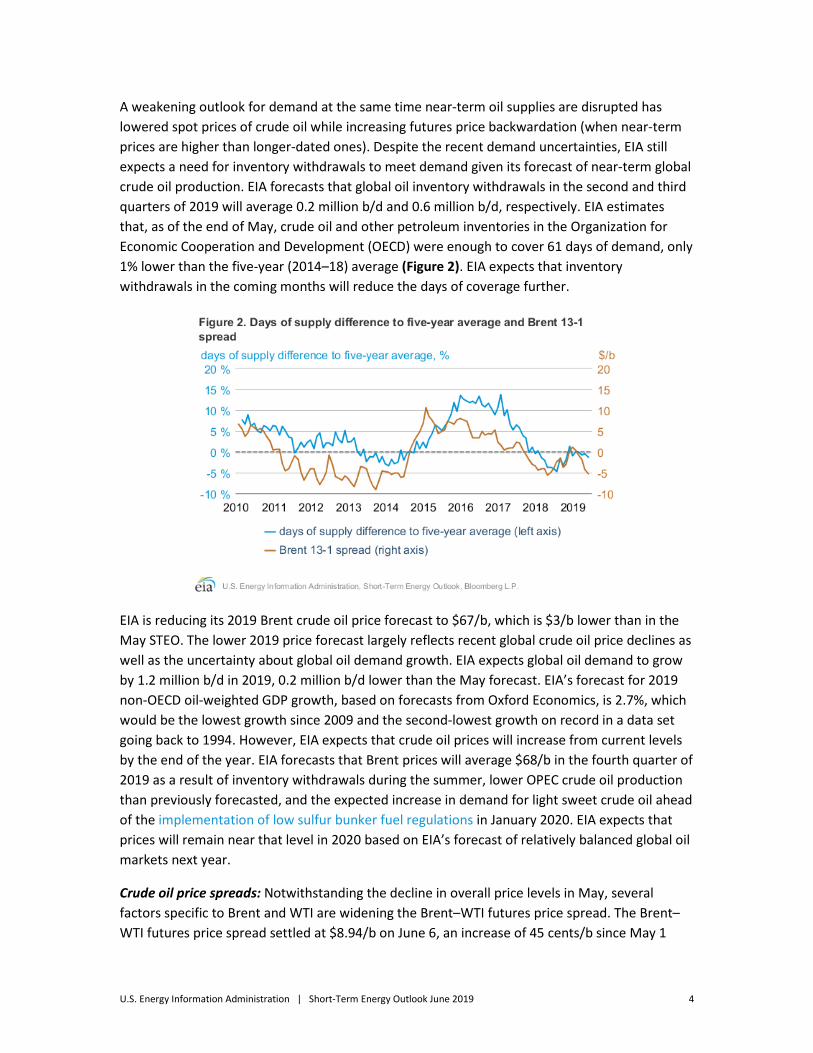
A weakening outlook for demand at the same time near-term oil supplies are disrupted has lowered spot prices of crude oil while increasing futures price backwardation (when near-term prices are higher than longer-dated ones). Despite the recent demand uncertainties, EIA still expects a need for inventory withdrawals to meet demand given its forecast of near-term global crude oil production. EIA forecasts that global oil inventory withdrawals in the second and third quarters of 2019 will average 0.2 million b/d and 0.6 million b/d, respectively. EIA estimates that, as of the end of May, crude oil and other petroleum inventories in the Organization for Economic Cooperation and Development (OECD) were enough to cover 61 days of demand, only 1% lower than the five-year (2014–18) average (Figure 2). EIA expects that inventory withdrawals in the coming months will reduce the days of coverage further.
EIA is reducing its 2019 Brent crude oil price forecast to $67/b, which is $3/b lower than in the May STEO. The lower 2019 price forecast largely reflects recent global crude oil price declines as well as the uncertainty about global oil demand growth. EIA expects global oil demand to grow by 1.2 million b/d in 2019, 0.2 million b/d lower than the May forecast. EIA’s forecast for 2019 non-OECD oil-weighted GDP growth, based on forecasts from Oxford Economics, is 2.7%, which would be the lowest growth since 2009 and the second-lowest growth on record in a data set going back to 1994. However, EIA expects that crude oil prices will increase from current levels by the end of the year. EIA forecasts that Brent prices will average $68/b in the fourth quarter of 2019 as a result of inventory withdrawals during the summer, lower OPEC crude oil production than previously forecasted, and the expected increase in demand for light sweet crude oil ahead of the implementation of low sulfur bunker fuel regulations in January 2020. EIA expects that prices will remain near that level in 2020 based on EIA’s forecast of relatively balanced global oil markets next year.
Crude oil price spreads: Notwithstanding the decline in overall price levels in May, several factors specific to Brent and WTI are widening the Brent–WTI futures price spread. The Brent–WTI futures price spread settled at $8.94/b on June 6, an increase of 45 cents/b since May 1

U.S. Energy Information Administration | Short-Term Energy Outlook June 2019 5
(Figure 3). In late April, flows on parts of the Druzhba pipeline, which supplies Russian Urals crude oil to Europe, were suspended because of contamination of the crude oil. This disruption limited availability of Urals for several refiners in Europe that are regular purchasers of the crude oil grade. By early June, some Druzhba pipeline flows had been restored, but other refineries were still waiting for the contaminated crude oil to be removed from the pipeline so that flows of uncontaminated crude oil could resume. The contaminated crude oil will have to be stored for several months and gradually blended with clean crude oil to dilute the contaminants so the oil can be refined. Certain North Sea crude oil streams can substitute for Urals, which likely contributed to some relative upward price pressure for Brent in May. In addition, planned maintenance at some North Sea fields is expected to reduce available deliveries for June, which may have also put upward price pressure on Brent prices relative to other crude oils.
In contrast, Cushing WTI prices declined more than Brent prices in May because of logistical problems in the U.S. Midwest. Floods in the Midwest contributed to the temporary closure of several pipelines out of Cushing that provide feedstock to certain refiners. This disruption likely contributed to crude oil stocks in Cushing building by 4.8 million barrels from the first week in May to the last week in May, a month in which Cushing stocks typically draw by 2.1 million barrels, based on the five-year average stock change. Outside of the logistical issues in Cushing, U.S. commercial crude oil inventories increased in May. Total U.S. crude oil inventories increased by 15.7 million barrels in May, according to STEO estimates for the month, compared with a five-year average draw of 2.1 million barrels. If confirmed in monthly data, this year’s stock build would be the largest for the month of May since 1991.
Emerging market currencies: Some of the demand-side concerns affecting crude oil markets could also be reducing the value of emerging market currencies compared with the U.S. dollar. The Morgan Stanley Capital International (MSCI) Emerging Market Currency Index tracks a basket of emerging market currencies that declined 1% from May 1 through June 6 (Figure 4). A lower value of the index indicates emerging market currencies are depreciating against the U.S.

U.S. Energy Information Administration | Short-Term Energy Outlook June 2019 6
dollar. The recent decline in the MSCI Emerging Market Currency index could indicate a reduction in economic activity in countries such as China or South Korea, countries with relatively high weightings in the index. The Chinese manufacturing PMI for May declined to 49.4. Any reading lower than 50 indicates a contraction in manufacturing activity. In addition, total South Korean exports of all goods declined 9.4% from May 2018 to May 2019, the sixth consecutive month of year-over-year declines.
Petroleum products
Gasoline prices: The front-month futures price of reformulated blendstock for oxygenate blending (RBOB, the petroleum component of gasoline used in many parts of the country) settled at $1.71 per gallon (gal) on June 6, down 36 cents/gal since May 1 (Figure 5). The RBOB–Brent crack spread (the difference between the price of RBOB and the price of Brent crude oil) declined by 11 cents/gal to settle at 24 cents/gal during the same period.
After increasing in April, the gasoline crack spread again dropped lower than the five-year (2014–18) range in May, averaging 4 cents below the previous five-year low of 35 cents for that month in 2018. Factors contributing to the smaller crack spread could include gasoline stock builds and gasoline consumption that were lower than year-ago levels. EIA estimates that U.S. gasoline consumption averaged 9.39 million barrels per day (b/d) in May, a decrease of 0.16 million b/d from the same period last year. Gasoline stocks increased during the month, ending close to the five-year average after ending April 6% lower than year-ago levels.
Flooding in the Midwest reduced refinery operations in Oklahoma and limited crude oil and product deliveries to the region’s refineries, preventing crude and product movement from the Gulf Coast to the Midwest and contributing to regional disparities in U.S. gasoline stock levels. In addition, refinery issues on the West Coast normalized mid-month, contributing to a stock build in that area. EIA estimates gasoline stocks ended May 4% higher than the five-year average on

U.S. Energy Information Administration | Short-Term Energy Outlook June 2019 7
the Gulf Coast and 6% higher than the five-year average on the West Coast, while gasoline stocks in the Midwest were 7% lower than the five-year average.
Gasoline spot price differentials: In contrast to the United States, gasoline prices increased in Northwest Europe in May (Figure 6). Refinery shutdowns in the region, combined with the contamination of crude oil import pipelines from Russia, contributed to reduced refinery runs and gasoline production in Europe. Northwest Europe’s gasoline–Brent spot crack spread rose higher than the five-year low for the first time in 6 months and higher than the five-year average for the first time in 17 months. On May 20, these factors contributed to the lowest Gulf Coast gasoline spot price relative to Northwest Europe since November 2015. On May 31, they contributed to the lowest New York Harbor gasoline spot price relative to Northwest Europe since August 2011.

U.S. Energy Information Administration | Short-Term Energy Outlook June 2019 8
Ultra-low sulfur diesel prices: The ultra-low sulfur diesel (ULSD) front-month futures price decreased 31 cents/gal from May 1 to settle at $1.79/gal on June 6. The ULSD–Brent crack spread (the difference between the price of ULSD and the price of Brent crude oil) declined 6 cents/gal to settle at 32 cents/gal during the same period (Figure 7).
EIA estimates that U.S. distillate consumption in May was 3.9 million b/d, 380,000 b/d lower than in May 2018 and 40,000 b/d lower than the five-year average. However, some of the available transportation data are mixed. The truck tonnage data from the American Trucking Association for April (most recent available) show a 7.7% year-over-year increase, whereas the April 2019 Cass Freight Index report—reflecting the volume of freight shipments via all modes of domestic freight transportation, including rail, truck, and air—shows a 3.2% contraction for the month. Despite these and other economic indicators reflecting a potential slowdown in growth, EIA estimates distillate consumption will return to year-over-year growth through the third quarter of 2019. EIA’s forecast is based on the expectation of a 2.7% growth in U.S. GDP in 2019, indicating future growth in overall diesel demand.
U.S. Gulf Coast refinery margins: The recent increase in medium and heavy crude oil prices that peaked in November 2018 reversed somewhat in March, April, and the first half of May 2019, before increasing again in late May. Reductions in crude oil production from Venezuela are likely increasing the price of medium and heavy crude oils compared with light crude oils. The 5:3:2 crack spread—refining three barrels of gasoline and two barrels of distillate from five barrels of Mars crude oil, which exemplifies a complex U.S. Gulf Coast refinery margin—averaged $13.94 per barrel (b) in May, after reaching a 2019 high of $16.95/b (40 cents/gal) on April 10 (Figure 8). Comparatively stable distillate crack spreads have supported total refinery margins. Although U.S. Gulf Coast gasoline crack spreads have remained positive since February, weaker crack spreads in May put downward pressure on margins from the April highs.

U.S. Energy Information Administration | Short-Term Energy Outlook June 2019 9
Natural Gas
Prices: The front-month natural gas futures contract for delivery at the Henry Hub settled at $2.32/million British thermal units (MMBtu) on June 6, a decrease of 30 cents/MMBtu from May 1 (Figure 9). EIA estimates that U.S. natural gas production reached another record high in May. This persistent production growth contributed to injections of more than 100 billion cubic feet (Bcf) for five of the past six weeks, bringing U.S. working gas in underground storage levels closer to the five-year (2014–18) average, 9% higher than year-ago levels. Combined net injections into storage during April and May, in 2019, are estimated to be the largest on record for that two-month period at 831 Bcf (Figure 10), which helped to reduce futures prices even though inventories remain lower than the five-year average.

U.S. Energy Information Administration | Short-Term Energy Outlook June 2019 10
Money manager positions: The number of futures short positions money managers reported holding for NYMEX natural gas contracts rose above long positions on May 21, 2019, for the first time since December 26, 2017 (Figure 11). The money manager category of the Commitments of Traders report, published weekly by the Commodity Futures Trading Commission, include fund managers that conduct organized futures trading on behalf of clients, and they are not involved in physical oil trading as their business activity. A short position indicates expectations of lower prices while a long position indicates the opposite. On November 13, 2018, money managers’ net long positions reached a record high. Natural gas prices increased sharply in mid-November after colder-than-normal weather reduced natural gas inventories to about 700 Bcf lower than the five-year average. In April and May 2019, however, ongoing increases in natural gas production contributed to record injections into natural gas storage, which, combined with forecasts of below-normal temperatures for June, have lowered price expectations. The natural gas front-month futures price on June 6 of $2.32/MMBtu was the lowest since May 2016.
U.S. Energy Information Administration | Short-Term Energy Outlook June 2019 11
Notable forecast changes
• EIA forecasts Brent crude oil prices will average $67 per barrel (b) in 2019, down about $3/b from last month’s STEO forecast. The lower 2019 price forecast largely reflects recent price declines in global crude oil prices, which lowered the starting point for EIA’s forecast, and uncertainty about global oil demand growth. Forecast global liquid fuels supply and consumption were both lowered by about 0.2-0.3 million barrels per day (b/d) for 2019 and for 2020. The lower global supply growth forecast is mostly the result of lower crude oil production growth in the United States because of lower expected oil prices and an expectation of increasing crude oil production declines in Venezuela. The reduction in global demand growth reflects both a revision to historical data that carries through to the forecast and lower oil consumption growth in 2019 because of reduction in forecast 2019 oil-weighted GDP growth among countries not part of the Organization for Economic Cooperation and Development (OECD).
• For more information, see the detailed table of STEO forecast changes
• For ore information, see the detailed STEO table of forecast changes.
This report was prepared by the U.S. Energy Information Administration (EIA), the statistical and analytical agency within the U.S. Department of Energy. By law, EIA's data, analyses, and forecasts are independent of approval by any other officer or employee of the United States Government. The views in this report therefore should not be construed as representing those of the U.S. Department of Energy or other federal agencies.

Chart Gallery y for June e 2019
Shortr -rt-Term Energy Outlook
U.S. Energy Information Administration Independent Statistics & Analysis
0
20
40
60
80
100
120
2014 2015 2016 2017 2018 2019 2020
Sources: Short-Term Energy Outlook, June 2019, and CME Group
Note: Confidence interval derived from options market information for the five trading days ending Jun 6, 2019. Intervals not calculated for months with sparse trading in near -the-money options contracts.
West TexasIntermediate (WTI) spot price
95% NYMEX futures priceconfidence intervalupper bound
STEO forecastNYMEX futures price
95% NYMEX futures priceconfidence interval
West Texas Intermediate (WTI) crude oil price and NYMEX confidence intervalsdollars per barrel
0.27
0.31
-0.09
0.11
-0.50-0.40-0.30-0.20-0.100.000.100.200.300.400.50
2017 2018 2019 2020
Components of annual gasoline price changesdollars per gallon
Brent crude oil pricewholesale margin over crude
retail margin over wholesale
forecast
0.000.501.001.502.002.503.003.504.004.505.00
2016 2017 2018 2019 2020
monthly retail regular gasolineannual average gasolinemonthly Brent crude oilannual average Brent
U.S. gasoline and crude oil prices
dollars per gallon
forecast
Source: Short-Term Energy Outlook, June 2019
0.27
0.31
-0.09
0.11
-0.50
-0.40
-0.30
-0.20
-0.10
0.00
0.10
0.20
0.30
0.40
0.50
2017 2018 2019 2020
Components of annual gasoline price changesdollars per gallon
Brent crude oil pricewholesale margin over crude
retail margin over wholesale
net change
forecast
0.00
0.50
1.00
1.50
2.00
2.50
3.00
3.50
4.00
4.50
5.00
2016 2017 2018 2019 2020
monthly retail regular gasolineannual average gasolinemonthly Brent crude oilannual average Brent
U.S. gasoline and crude oil prices
dollars per gallon
forecast
Source: Short-Term Energy Outlook, June 2019
20

0.34
0.53
-0.08
0.18
-0.60
-0.40
-0.20
0.00
0.20
0.40
0.60
2017 2018 2019 2020
Components of annual dieselprices changesdollars per gallon
Brent crude oil pricewholesale marginover crude
retail marginover wholesale
net change
forecast
0.00
1.00
2.00
3.00
4.00
5.00
6.00
2016 2017 2018 2019 2020
monthly retail dieselannual average dieselmonthly Brent crude oilBrent annual average
U.S. diesel and crude oil prices
forecast
Source: Short-Term Energy Outlook, June 2019
0.34
0.53
-0.08
0.18
-0.60
-0.40
-0.20
0.00
0.20
0.40
0.60
2017 2018 2019 2020
Components of annual dieselprices changesdollars per gallon
Brent crude oil pricewholesale marginover crude
retail marginover wholesale
net change
forecast
0.00
1.00
2.00
3.00
4.00
5.00
6.00
2016 2017 2018 2019 2020
monthly retail dieselannual average dieselmonthly Brent crude oilBrent annual average
U.S. diesel and crude oil prices
dollars per gallon
forecast
Source: Short-Term Energy Outlook, June 2019
0123456789
2014 2015 2016 2017 2018 2019 2020
Henry Hub natural gas price and NYMEX confidence intervalsdollars per million Btu
Sources: Short-Term Energy Outlook, June 2019, and CME Group
Note: Confidence interval derived from options market information for the five trading days ending Jun 6, 2019. Intervals not calculated for months with sparse trading in near-the-money options contracts.
95% NYMEX futures priceconfidence intervalupper bound
STEO forecastNYMEX futures price
95% NYMEX futures priceconfidence intervallower bound
Henry Hub spot price
0
2
4
6
8
10
12
14
16
18
20
2015 2016 2017 2018 2019 2020
monthly residential priceannual average residentialmonthly Henry Hub spot priceHenry Hub annual average
U.S. natural gas pricesdollars per thousand cubic feet
forecast
Sources: Short-Term Energy Outlook, June 2019, and Refinitiv

-74
222
-173
39
-300
-200
-100
0
100
200
300
400
500
600
2017 2018 2019 2020
Components of annual changemillion kilowatthours per day
residential salesindustrial salescommercial and transportation salesdirect usenet change
forecast
0
2,000
4,000
6,000
8,000
10,000
12,000
14,000
2016 2017 2018 2019 2020
monthly history
monthly forecast
annual average
U.S. electricity consumptionmillion kilowatthours per day
Source: Short-Term Energy Outlook, June 2019
0.85
0.40 0.26
0.66
forecast
-0.20
0.00
0.20
0.40
0.60
0.80
1.00
1.20
2017 2018 2019 2020
Components of annual changequadrillion British thermal units
net changesolar windhydropowerliquid biofuelsgeothermalwood biomasswaste biomass
forecast
0
2
4
6
8
10
12
14
2016 2017 2018 2019 2020
U.S. renewable energy supplyquadrillion British thermal units
Note: Hydropower excludes pumped storage generation. Liquid biofuels include ethanol and biodiesel. Other biomass includes municipal waste from biogenic sources, landfill gas, and other
Source: Short-Term Energy Outlook, June 2019
0.85
0.40 0.26
0.66
forecast
-0.20
0.00
0.20
0.40
0.60
0.80
1.00
1.20
2017 2018 2019 2020
Components of annual changequadrillion British thermal units
net changesolar windhydropowerliquid biofuelsgeothermalwood biomasswaste biomass
forecast
0
2
4
6
8
10
12
14
2016 2017 2018 2019 2020
U.S. renewable energy supplyquadrillion British thermal units
Note: Hydropower excludes pumped storage generation. Liquid biofuels include ethanol and biodiesel. Other biomass includes municipal waste from biogenic sources, landfill gas, and other non-wood waste.Source: Short-Term Energy Outlook, June 2019
-42
137
-104
-47
forecast
-200
-150
-100
-50
0
50
100
150
200
2017 2018 2019 2020
Components of annual changemillion metric tons
natural gaspetroleumcoalnet change
forecast
0
1,000
2,000
3,000
4,000
5,000
6,000
7,000
8,000
2016 2017 2018 2019 2020
total energy
petroleum
natural gas
U.S. annual carbon emissions by sourcemillion metric tons
Source: Short-Term Energy Outlook, June 2019
-42
137
-104
-47
forecast
-200
-150
-100
-50
0
50
100
150
200
2017 2018 2019 2020
Components of annual changemillion metric tons
natural gaspetroleumcoalnet change
forecast
0
1,000
2,000
3,000
4,000
5,000
6,000
7,000
8,000
2016 2017 2018 2019 2020
total energy
petroleum
natural gas
coal
U.S. annual carbon emissions by sourcemillion metric tons
Source: Short-Term Energy Outlook, June 2019

forecast
86889092949698
100102104106
Q1 Q2 Q3 Q4 Q1 Q2 Q3 Q4 Q1 Q2 Q3 Q4 Q1 Q2 Q3 Q4 Q1 Q2 Q3 Q4 Q1 Q2 Q3 Q4 Q1 Q2 Q3 Q4
2014 2015 2016 2017 2018 2019 2020
World liquid fuels production and consumption balancemillion barrels per day
world production
world consumption
//0
-2-1012
Source: Short-Term Energy Outlook, June 2019
implied stock build
implied stock draw
0.0
0.5
1.0
1.5
2.0
2.5
3.0
3.5
Jan 2017 Jan 2018 Jan 2019
Estimated unplanned liquid fuels production outages million barrels per day
Source: Short-Term Energy Outlook, June 2019
non-OPECotherUnited StatesCanada
OPECVenezuelaSaudi ArabiaIranKuwaitIraqNigeriaLibya
1.61.4
1.21.4
0.0
0.5
1.0
1.5
2.0
2.5
3.0
2017 2018 2019 2020
Components of annual changemillion barrels per day
world changeOrganization of Economic Cooperation and Development (OECD)non-OECD
forecast
80
85
90
95
100
105
110
2017 2018 2019 2020
monthly historymonthly forecastannual average
World liquid fuels consumption million barrels per day
//0
Source: Short-Term Energy Outlook, June 2019

1.6 1.4
1.21.4
-0.5
0.0
0.5
1.0
1.5
2.0
2017 2018 2019 2020
Annual change in world liquid fuels consumption million barrels per day
Source: Short-Term Energy Outlook, June 2019
forecast
worldother non-OECDMiddle EastIndiaChinaother OECDUnited States
0.6
2.5
0.2
2.0
-3.0
-2.0
-1.0
0.0
1.0
2.0
3.0
4.0
5.0
6.0
2017 2018 2019 2020
Components of annual change million barrels per day
forecastOPEC countriesnon-OPEC
EurasiaNorth AmericaLatin Americaother non-OPEC
net change
60
70
80
90
100
110
120
130
140
2017 2018 2019 2020
monthly history
monthly forecast
annual average
World crude oil and liquid fuels production million barrels per day
//0
Source: Short-Term Energy Outlook, June 2019
0
20
40
60
80
100
120
2017 2018 2019 2020
World liquid fuels consumption million barrels per day
non-OECD
Organization for Economic Cooperation
forecast
0
20
40
60
80
100
120
2017 2018 2019 2020
World liquid fuels production million barrels per day
non-OPEC
Organization of the Petroleum Exporting
forecast
Source: Short-Term Energy Outlook, June 2019
forecast
0
20
40
60
80
100
120
2017 2018 2019 2020
World liquid fuels consumption million barrels per day
non-OECD
Organization for Economic Cooperationand Development (OECD)
forecast
0
20
40
60
80
100
120
2017 2018 2019 2020
World liquid fuels production million barrels per day
non-OPEC
Organization of the Petroleum ExportingCountries (OPEC)
forecast
Source: Short-Term Energy Outlook, June 2019
forecast

0.00.51.01.52.02.53.03.54.04.55.0
2009 2010 2011 2012 2013 2014 2015 2016 2017 2018 2019 2020
Source: Short-Term Energy Outlook, June 2019
Note: Black line represents 2009-2018 average (2.3 million barrels per day).
forecast
2009-2018 average
Organization of the Petroleum Exporting Countries (OPEC) surplus crude oil production capacitymillion barrels per day
forecast
40
45
50
55
60
65
70
75
80
Jan 2014 Jan 2015 Jan 2016 Jan 2017 Jan 2018 Jan 2019 Jan 2020
Source: Short-Term Energy Outlook, June 2019
Organization for Economic Cooperation and Development (OECD)commercial inventories of crude oil and other liquidsdays of supply
monthly range from January 2014 - December 2018//
0
0.52
1.611.36
0.94
-1.0
-0.5
0.0
0.5
1.0
1.5
2.0
2.5
3.0
2017 2018 2019 2020
Components of annual changemillion barrels per day
Federal Gulf of Mexico (GOM)
Lower 48 excluding GOMAlaska
forecast
0
2
4
6
8
10
12
14
16
2017 2018 2019 2020
monthly history
monthly forecast
annual average
U.S. crude oil production million barrels per day
Source: Short-Term Energy Outlook, June 2019
0.52
1.611.36
0.94
-1.0
-0.5
0.0
0.5
1.0
1.5
2.0
2.5
3.0
2017 2018 2019 2020
Components of annual changemillion barrels per day
Federal Gulf of Mexico (GOM)
Lower 48 excluding GOMAlaskanet change
forecast
0
2
4
6
8
10
12
14
16
2017 2018 2019 2020
monthly history
monthly forecast
annual average
U.S. crude oil production million barrels per day
Source: Short-Term Energy Outlook, June 2019
20

forecast
275300325350375400425450475500525550575600
Jan 2014 Jan 2015 Jan 2016 Jan 2017 Jan 2018 Jan 2019 Jan 2020
Source: Short-Term Energy Outlook, June 2019
U.S. commercial crude oil inventoriesmillion barrels
//
monthly range from January 2014 - December 2018
0.8
2.22.0
1.3
0.0
1.0
2.0
3.0
4.0
5.0
2017 2018 2019 2020
Components of annual changemillion barrels per day
ethanol and biodieselnatural gas plant liquidscrude oilnet change
forecast
0
5
10
15
20
25
2017 2018 2019 2020
total monthly production
forecast
annual average
U.S. crude oil and liquid fuels productionmillion barrels per day
Source: Short-Term Energy Outlook, June 2019
0.3
0.5
0.2 0.2
-0.25
0.00
0.25
0.50
0.75
1.00
2017 2018 2019 2020
Components of annual change
motor gasolinedistillate fueljet fuelhydrocarbon gas liquidsother fuelsnet change
forecast
0
5
10
15
20
25
2017 2018 2019 2020
monthly history
monthly forecast
annual average
U.S. liquid fuels product supplied(consumption) million barrels per day
Source: Short-Term Energy Outlook, June 2019
0.3
0.5
0.2 0.2
-0.25
0.00
0.25
0.50
0.75
1.00
2017 2018 2019 2020
Components of annual change
million barrels per day
motor gasolinedistillate fueljet fuelhydrocarbon gas liquidsother fuelsnet change
forecast
0
5
10
15
20
25
2017 2018 2019 2020
monthly history
monthly forecast
annual average
U.S. liquid fuels product supplied(consumption) million barrels per day
Source: Short-Term Energy Outlook, June 2019
020

forecast
6080
100120140160180200220240260280
Jan 2014 Jan 2015 Jan 2016 Jan 2017 Jan 2018 Jan 2019 Jan 2020
U.S. gasoline and distillate inventoriesmillion barrels
Source: Short-Term Energy Outlook, June 2019
monthly range from January 2014 - December 2018
total motor gasoline inventory
total distillate fuel inventory
forecast
-8
-6
-4
-2
0
2
4
6
8
10
Jan 2013 Jan 2014 Jan 2015 Jan 2016 Jan 2017 Jan 2018 Jan 2019 Jan 2020
Note: Liquids fuels include: gasoline, distillate fuels, hydrocarbon gas liquids, jet fuel, residual fuel oil, unfinished oils, other hydrocarbons/oxygenates, and other oils.Source: Short-Term Energy Outlook, June 2019
U.S. net imports of crude oil and liquid fuelsmillion barrels per day
crude oil net imports
totalnet imports
liquid fuelsnet imports
0.3
0.60.6
0.4
0.0
0.1
0.2
0.3
0.4
0.5
0.6
0.7
2017 2018 2019 2020
Components of annual changemillion barrels per day
net changenatural gasolinebutanespropaneethane
forecast
0.0
1.0
2.0
3.0
4.0
5.0
6.0
7.0
2017 2018 2019 2020
monthly production
monthly forecast
annual average
U.S. natural gas plant liquids productionmillion barrels per day
Source: Short-Term Energy Outlook, June 2019
0.3
0.60.6
0.4
0.0
0.1
0.2
0.3
0.4
0.5
0.6
0.7
2017 2018 2019 2020
Components of annual changemillion barrels per day
net changenatural gasolinebutanespropaneethane
forecast
0.0
1.0
2.0
3.0
4.0
5.0
6.0
7.0
2017 2018 2019 2020
monthly production
monthly forecast
annual average
U.S. natural gas plant liquids productionmillion barrels per day
Source: Short-Term Energy Outlook, June 2019
20

0.11
0.340.23
0.14
-0.25
0.00
0.25
0.50
2017 2018 2019 2020
Components of annual change
million barrels per day
net changenatural gasolineethanepropanebutanes
forecast
0
1
2
3
4
5
2017 2018 2019 2020
monthly history
monthly forecast
annual average
U.S. hydrocarbon gas liquids product supplied (consumption)million barrels per day
Source: Short-Term Energy Outlook, June 2019
-2.5
-2.0
-1.5
-1.0
-0.5
0.0
0.5
2000 2002 2004 2006 2008 2010 2012 2014 2016 2018
U.S. net trade of hydrocarbon gas liquids (HGL) million barrels per day
net tradepropaneethanenatural gasolinebutanes
forecast
Source: Short-Term Energy Outlook, June 2019
net importsnet exports
forecast
0
25
50
75
100
125
Jan 2014 Jan 2015 Jan 2016 Jan 2017 Jan 2018 Jan 2019 Jan 2020
monthly range from January 2014 - December 2018
Source: Short-Term Energy Outlook, June 2019
U.S. commercial propane inventoriesmillion barrels

2.4
9.7
7.9
1.5
-4
0
4
8
12
16
2017 2018 2019 2020
Components of annual changebillion cubic feet per day
U.S. non-Gulf of Mexico U.S. Gulf of Mexiconet change
forecast
0
25
50
75
100
125
2017 2018 2019 2020
monthly history
monthly forecast
annual average
U.S. marketed natural gas production billion cubic feet per day
Source: Short-Term Energy Outlook, June 2019
-0.7
7.8
2.10.2
-9.0
-7.0
-5.0
-3.0
-1.0
1.0
3.0
5.0
7.0
9.0
2017 2018 2019 2020
Components of annual changebillion cubic feet per day
net changeindustrialelectric powerresidential and commercialother
forecast
0
20
40
60
80
100
120
140
160
180
2017 2018 2019 2020
monthly historymonthly forecastannual average
U.S. natural gas consumption billion cubic feet per day
Source: Short-Term Energy Outlook, June 2019
20
forecast
-50
-25
0
25
50 net storage builds
Source: Short-Term Energy Outlook, June 2019
forecast
-25
0
25
50
75
100
125
Q1 Q2 Q3 Q4 Q1 Q2 Q3 Q4 Q1 Q2 Q3 Q4 Q1 Q2 Q3 Q4 Q1 Q2 Q3 Q4 Q1 Q2 Q3 Q4 Q1 Q2 Q3 Q4
2014 2015 2016 2017 2018 2019 2020
U.S. natural gas production, consumption, and net importsbillion cubic feet per day
consumption
production
net trade (imports minus exports)
forecast
-50
-25
0
25
50 net storage builds
net storage withdrawals
Source: Short-Term Energy Outlook, June 2019
forecast
-25
0
25
50
75
100
125
Q1 Q2 Q3 Q4 Q1 Q2 Q3 Q4 Q1 Q2 Q3 Q4 Q1 Q2 Q3 Q4 Q1 Q2 Q3 Q4 Q1 Q2 Q3 Q4 Q1 Q2 Q3 Q4
2014 2015 2016 2017 2018 2019 2020
U.S. natural gas production, consumption, and net importsbillion cubic feet per day
consumption
production
net trade (imports minus exports)

1.8
-0.3 -1.9
-4.7-7.6
-20
-15
-10
-5
0
5
10
2016 2017 2018 2019 2020
Annual natural gas tradebillion cubic feet per day
gross importsas liquefiednatural gasby pipeline
net trade
gross exportsby pipelineas liquefied natural gas
forecast
Source: Short-Term Energy Outlook, June 2019
forecast
-50%-25%
0%25%50%
Source: Short-Term Energy Outlook, June 2019
Percent deviation from 2014 - 2018 average
0
1,000
2,000
3,000
4,000
5,000
Jan 2014 Jan 2015 Jan 2016 Jan 2017 Jan 2018 Jan 2019 Jan 2020
U.S. working natural gas in storagebillion cubic feet
storage level forecast
monthly range from January 2014 - December 2018
2.1%
3.2%
1.1%
-0.8%
2.7%
0.0%
1.3% 1.2%
-2%
0%
2%
4%
6%
2013 2014 2015 2016 2017 2018 2019 2020
Annual growth in residential electricity pricespercent
forecast
0
5
10
15
20
2013 2014 2015 2016 2017 2018 2019 2020
U.S. monthly residential electricity pricecents per kilowatthour
historyforecast
Source: Short-Term Energy Outlook, June 2019

0%
20%
40%
60%
80%
100%
2013 2014 2015 2016 2017 2018 2019 2020
percent share
forecast
28% 28% 33% 34% 32% 35% 37% 38%
39% 39% 33% 30% 30%27% 24% 23%
0.0
2.5
5.0
7.5
10.0
12.5
20132014201520162017201820192020
U.S. electricity generation by fuel, all sectorsmillion megawatthours per day
forecast
coal
natural gas
nuclearnon-hydro renewableshydropowerother
Note: Labels show percentage share of total generation provided by coal and natural gas.Source: Short-Term Energy Outlook, June 2019
0%
20%
40%
60%
80%
100%percent share
forecast
28% 28% 33% 34% 32% 35% 37% 38%
39% 39% 33% 30% 30%27% 24% 23%
0.0
2.5
5.0
7.5
10.0
12.5
U.S. electricity generation by fuel, all sectorsmillion megawatthours per day
forecast
coal
natural gas
nuclearnon-hydro renewableshydropowerother
Note: Labels show percentage share of total generation provided by coal and natural gas.Source: Short-Term Energy Outlook, June 2019
46
-19
-56 -54
-80
-60
-40
-20
0
20
40
60
2017 2018 2019 2020
Components of annual changemillion short tons
Western region
Appalachian region
Interior regionnet change
forecast
0
15
30
45
60
75
90
2016 2017 2018 2019 2020
monthly history
monthly forecast
annual average
U.S. coal production million short tons
Source: Short-Term Energy Outlook, June 2019
-14
-30
-86
-35
-100
-80
-60
-40
-20
0
20
2017 2018 2019 2020
Components of annual changemillion short tons
electric powerretail and other industrycoke plantsnet change
forecast
0
20
40
60
80
100
120
2016 2017 2018 2019 2020
monthly historymonthly forecastannual average
U.S. coal consumption million short tons
Source: Short-Term Energy Outlook, June 2019

forecast
0255075
100125150175200225250
Jan 2014 Jan 2015 Jan 2016 Jan 2017 Jan 2018 Jan 2019 Jan 2020
Source: Short-Term Energy Outlook, February 2019
U.S. electric power coal inventoriesmillion short tons
monthly range from January 2014 - December 2018
0%
2%
4%
6%
8%
10%
12%
2000 2002 2004 2006 2008 2010 2012 2014 2016 2018 2020
U.S. annual energy expendituresshare of gross domestic product
Source: Short-Term Energy Outlook, June 2019
forecast
0
200
400
600
800
1,000
1,200
1,400
1,600
total summer0
50
100
150
200
250
300
350
400
April May June July August September
U.S. summer cooling degree dayspopulation-weighted
20172018201920202009-2018 average
warmer
cooler
Note: EIA calculations based on National Oceanic and Atmospheric Administration (NOAA) data. Projections reflect NOAA's 14-16 month outlook.Source: Short-Term Energy Outlook, June 2019
0
200
400
600
800
1,000
1,200
1,400
1,600
totalsummer
0
50
100
150
200
250
300
350
400
April May June July August September
U.S. summer cooling degree dayspopulation-weighted
20172018201920202009-2018 average
warmer
cooler
Note: EIA calculations based on National Oceanic and Atmospheric Administration (NOAA) data. Projections reflect NOAA's 14-16 month outlook.Source: Short-Term Energy Outlook, June 2019

0
1,000
2,000
3,000
4,000
total winter0
250
500
750
1,000
October November December January February March
2016/172017/182018/192019/202008-2018 average
U.S. winter heating degree dayspopulation-weighted
cooler
warmer
Note: EIA calculations based on National Oceanic and Atmospheric Administration (NOAA)
Source: Short-Term Energy Outlook, June 2019
0
1,000
2,000
3,000
4,000
total winter0
250
500
750
1,000
October November December January February March
2016/172017/182018/192019/202008-2018 average
U.S. winter heating degree dayspopulation-weighted
cooler
warmer
Note: EIA calculations based on National Oceanic and Atmospheric Administration (NOAA) data. Projections reflect NOAA's 14-16 month outlook.
Source: Short-Term Energy Outlook, June 2019
CA
NV
OR
WA
AZ
OK
KS
NE
SD
MN
IA
MO
IL
WI
MI
OHIN
KY
TN
ND
UT
ID
CO
WY
MT
NM
AR
AL
LA
MS
TX
FL
GA
SC
NC
VAWV
PA NJ
DEMD
NY
NH
ME
VT
MACT RI
AK
HI
NortheastWest
South
Midwest
East SouthCentraldivision
West SouthCentraldivision
PacificContiguous
division
Mountaindivision
West North Centraldivision
East North Centraldivision
SouthAtlanticdivision
PacificNoncontiguous
division
MiddleAtlanticdivision
NewEnglanddivision
U.S. Census regions and divisions
Source: U.S. Energy Information Administration, Short-Term Energy Outlook
Q1 Q2 Q3 Q4 Q1 Q2 Q3 Q4 Q1 Q2 Q3 Q4 2018 2019 2020
Energy Supply
Crude Oil Production (a)(million barrels per day) ......................... 10.23 10.54 11.24 11.81 11.81 12.20 12.44 12.83 13.05 13.24 13.32 13.44 10.96 12.32 13.26
Dry Natural Gas Production(billion cubic feet per day) ..................... 79.13 81.17 84.96 88.22 89.14 90.14 91.17 91.93 91.80 91.84 91.97 91.54 83.40 90.60 91.79
Coal Production(million short tons) ................................ 188 181 195 192 170 171 183 176 172 138 169 167 756 700 645
Energy Consumption
Liquid Fuels(million barrels per day) ......................... 20.24 20.33 20.63 20.60 20.29 20.33 21.02 20.92 20.53 20.75 21.25 21.01 20.45 20.64 20.89
Natural Gas(billion cubic feet per day) ..................... 97.61 70.71 74.09 86.12 102.74 72.07 74.91 87.22 100.83 73.10 76.42 82.08 84.17 84.38
Coal (b)(million short tons) ................................ 168 157 194 169 157 129 170 146 148 123 159 137 687 602 567
Electricity(billion kilowatt hours per day) ............... 10.62 10.33 12.14 10.14 10.54 10.14 11.83 10.03 10.58 10.14 11.91 10.06 10.81 10.64 10.68
Renewables (c)
(quadrillion Btu) .................................... 2.92 3.10 2.72 2.74 2.86 3.19 2.80 2.94 3.03 3.29 3.00 3.10 11.48 11.80 12.41
Total Energy Consumption (d)
(quadrillion Btu) .................................... 26.42 24.05 25.16 25.61 26.58 23.47 24.68 25.27 26.38 23.55 24.84 25.26 101.24 100.01 100.03
Energy Prices
Crude Oil West Texas Intermediate Spot
(dollars per barrel) ................................ 62.90 68.07 69.69 59.59 54.82 59.58 58.88 63.67 63.00 63.00 63.00 63.00 65.06 59.29 63.00
Natural Gas Henry Hub Spot
(dollars per million Btu) ......................... 3.02 2.85 2.93 3.80 2.92 2.60 2.65 2.94 3.00 2.56 2.63 2.89 3.15 2.77 2.77
Coal
(dollars per million Btu) ......................... 2.06 2.06 2.06 2.08 2.09 2.13 2.10 2.11 2.13 2.14 2.12 2.12 2.06 2.11 2.13
Macroeconomic
Real Gross Domestic Product
(billion chained 2012 dollars - SAAR) ..... 18,324 18,512 18,665 18,765 18,912 19,011 19,125 19,237 19,345 19,455 19,547 19,636 18,566 19,071 19,496
Percent change from prior year ............. 2.6 2.9 3.0 3.0 3.2 2.7 2.5 2.5 2.3 2.3 2.2 2.1 2.9 2.7 2.2
GDP Implicit Price Deflator
(Index, 2012=100) ................................. 109.3 110.2 110.7 111.1 111.4 111.9 112.5 113.1 113.8 114.4 115.1 115.9 110.3 112.2 114.8
Percent change from prior year ............. 2.0 2.4 2.3 2.1 1.9 1.5 1.6 1.7 2.2 2.3 2.3 2.5 2.2 1.7 2.3
Real Disposable Personal Income
(billion chained 2012 dollars - SAAR) ..... 14,220 14,282 14,375 14,527 14,612 14,631 14,698 14,797 14,917 15,043 15,147 15,236 14,351 14,685 15,086
Percent change from prior year ............. 2.8 2.7 2.8 3.3 2.8 2.4 2.3 1.9 2.1 2.8 3.0 3.0 2.9 2.3 2.7
Manufacturing Production Index
(Index, 2012=100) ................................. 104.8 105.5 106.6 107.0 106.7 107.2 107.7 108.3 108.7 108.9 109.2 109.4 106.0 107.5 109.1
Percent change from prior year ............. 2.4 2.2 3.6 2.6 1.8 1.6 1.1 1.2 1.8 1.6 1.4 1.1 2.7 1.4 1.5
Weather
U.S. Heating Degree-Days .................... 2,129 522 48 1,577 2,211 471 76 1,514 2,096 478 75 1,512 4,276 4,271 4,161
U.S. Cooling Degree-Days .................... 52 478 959 99 46 406 838 90 43 399 847 90 1,587 1,380 1,380
EIA does not estimate or project end-use consumption of non-marketed renewable energy.
Table 1. U.S. Energy Markets Summary U.S. Energy Information Administration | Short-Term Energy Outlook - June 2019
2018 2019 2020 Year
- = no data available
Prices are not adjusted for inflation.
(a) Includes lease condensate.
(b) Total consumption includes Independent Power Producer (IPP) consumption.
(c) Renewable energy includes minor components of non-marketed renewable energy that is neither bought nor sold, either directly or indirectly, as inputs to marketed energy.
Minor discrepancies with published historical data are due to independent rounding.
Projections: EIA Regional Short-Term Energy Model. U.S. macroeconomic projections are based on the IHS Markit model of the U.S. Economy.
Weather projections from National Oceanic and Atmospheric Administration.
(d) The conversion from physical units to Btu is calculated using a subset of conversion factors used in the calculations of gross energy consumption in EIA’s Monthly Energy Review
Consequently, the historical data may not precisely match those published in the MER or the Annual Energy Review (AER).
Notes: The approximate break between historical and forecast values is shown with historical data printed in bold; estimates and forecasts in italics.
Historical data: Latest data available from Energy Information Administration databases supporting the following reports: Petroleum Supply Monthly , DOE/EIA-0109;
Petroleum Supply Annual , DOE/EIA-0340/2; Weekly Petroleum Status Report , DOE/EIA-0208; Petroleum Marketing Monthly , DOE/EIA-0380; Natural Gas Monthly , DOE/EIA-0130;
Electric Power Monthly , DOE/EIA-0226; Quarterly Coal Report , DOE/EIA-0121; and International Petroleum Monthly , DOE/EIA-0520.

Q1 Q2 Q3 Q4 Q1 Q2 Q3 Q4 Q1 Q2 Q3 Q4 2018 2019 2020Crude Oil (dollars per barrel)
West Texas Intermediate Spot Average .............................. 62.90 68.07 69.69 59.59 54.82 59.58 58.88 63.67 63.00 63.00 63.00 63.00 65.06 59.29 63.00
Brent Spot Average ............................................................. 66.84 74.53 75.02 68.29 63.14 68.84 66.94 67.67 67.00 67.00 67.00 67.00 71.19 66.69 67.00
U.S. Imported Average ........................................................ 58.08 64.67 66.20 55.33 54.25 59.19 56.89 59.37 57.56 57.56 57.56 57.56 61.35 57.44 57.56
U.S. Refiner Average Acquisition Cost ............................... 61.89 67.29 69.03 59.39 55.71 57.83 57.29 61.48 60.36 60.36 60.36 60.36 64.45 58.12 60.36U.S. Liquid Fuels (cents per gallon)
Refiner Prices for Resale
Gasoline ........................................................................... 186 213 213 178 167 203 197 185 194 206 202 187 198 188 197
Diesel Fuel ....................................................................... 199 219 222 212 192 204 210 218 221 228 227 227 213 206 226
Heating Oil ....................................................................... 193 205 214 201 189 194 201 210 217 217 218 219 200 199 217
Refiner Prices to End Users
Jet Fuel ............................................................................ 197 217 220 212 193 201 207 215 219 224 223 222 212 204 222
No. 6 Residual Fuel Oil (a) ............................................... 149 162 176 175 153 146 139 138 113 116 118 117 166 143 116
Retail Prices Including Taxes
Gasoline Regular Grade (b) ............................................. 258 285 284 262 236 280 273 264 267 283 281 267 273 264 275
Gasoline All Grades (b) .................................................... 270 294 292 271 245 288 284 276 279 295 294 279 282 274 287
On-highway Diesel Fuel ................................................... 302 320 324 327 302 310 309 321 323 329 329 331 318 311 328
Heating Oil ....................................................................... 287 298 325 316 300 305 294 305 315 307 307 315 301 302 313Natural Gas
Henry Hub Spot (dollars per thousand cubic feet) .............. 3.13 2.96 3.04 3.94 3.02 2.69 2.74 3.05 3.11 2.66 2.72 3.00 3.27 2.88 2.87
Henry Hub Spot (dollars per million Btu) ............................ 3.02 2.85 2.93 3.80 2.92 2.60 2.65 2.94 3.00 2.56 2.63 2.89 3.15 2.77 2.77 U.S. Retail Prices (dollars per thousand cubic feet)
Industrial Sector ............................................................... 4.44 3.83 3.73 4.71 4.68 3.74 3.61 4.15 4.54 3.66 3.60 4.10 4.20 4.06 4.00
Commercial Sector .......................................................... 7.64 8.08 8.77 7.61 7.62 8.00 8.35 7.68 7.68 8.09 8.42 7.68 7.82 7.78 7.83
Residential Sector ............................................................ 9.37 11.93 17.93 9.97 9.46 11.80 16.39 10.61 9.82 12.24 16.71 10.70 10.49 10.60 10.92
U.S. Electricity Power Generation Fuel Costs (dollars per million Btu)
Coal .................................................................................. 2.06 2.06 2.06 2.08 2.09 2.13 2.10 2.11 2.13 2.14 2.12 2.12 2.06 2.11 2.13
Natural Gas ..................................................................... 3.96 3.09 3.23 4.05 3.70 2.77 2.71 3.28 3.48 2.71 2.66 3.21 3.54 3.07 2.98
Residual Fuel Oil (c) ......................................................... 11.47 13.02 14.02 14.49 11.93 13.79 12.91 12.73 12.98 13.72 13.02 12.79 12.95 12.82 13.10
Distillate Fuel Oil .............................................................. 15.77 16.61 16.82 16.01 14.92 15.87 16.05 16.88 17.13 17.58 17.49 17.57 16.13 15.94 17.42 Retail Prices (cents per kilowatthour)
Industrial Sector ............................................................... 6.81 6.87 7.22 6.82 6.66 6.88 7.20 6.78 6.70 6.93 7.26 6.83 6.93 6.89 6.94
Commercial Sector .......................................................... 10.54 10.60 10.89 10.55 10.41 10.71 10.97 10.59 10.42 10.74 11.02 10.67 10.66 10.68 10.73
Residential Sector ............................................................ 12.59 13.03 13.15 12.75 12.66 13.29 13.35 12.93 12.75 13.49 13.50 13.12 12.89 13.06 13.22
(c) Includes fuel oils No. 4, No. 5, No. 6, and topped crude.
Table 2. Energy PricesU.S. Energy Information Administration | Short-Term Energy Outlook - June 2019
2018 2019 2020 Year
- = no data available
Prices are not adjusted for inflation.
(a) Average for all sulfur contents.
(b) Average self-service cash price.
Projections: EIA Regional Short-Term Energy Model.
Notes: The approximate break between historical and forecast values is shown with historical data printed in bold; estimates and forecasts in italics.
Prices exclude taxes unless otherwise noted.
Historical data: Latest data available from Energy Information Administration databases supporting the following reports: Petroleum Marketing Monthly , DOE/EIA-0380;
Weekly Petroleum Status Report , DOE/EIA-0208; Natural Gas Monthly , DOE/EIA-0130; Electric Power Monthly , DOE/EIA-0226; and Monthly Energy Review , DOE/EIA-0035.
WTI and Brent crude oils, and Henry Hub natural gas spot prices from Reuter's News Service (http://www.reuters.com).
Minor discrepancies with published historical data are due to independent rounding.

Q1 Q2 Q3 Q4 Q1 Q2 Q3 Q4 Q1 Q2 Q3 Q4 2018 2019 2020
Supply (million barrels per day) (a)
OECD ................................................. 29.13 29.31 30.46 31.20 30.61 31.21 31.85 32.75 33.13 33.49 33.66 34.18 30.03 31.61 33.62
U.S. (50 States) .............................. 16.77 17.39 18.40 18.96 18.91 19.63 20.06 20.70 20.87 21.22 21.40 21.61 17.89 19.83 21.28
Canada ........................................... 5.32 5.10 5.33 5.42 5.01 4.86 5.17 5.21 5.36 5.36 5.40 5.46 5.30 5.06 5.40
Mexico ............................................. 2.17 2.13 2.09 1.95 1.92 2.08 2.06 2.03 2.01 1.99 1.97 1.95 2.08 2.02 1.98
Other OECD ................................... 4.88 4.68 4.64 4.86 4.77 4.64 4.57 4.80 4.89 4.92 4.88 5.17 4.76 4.69 4.96
Non-OECD ......................................... 70.14 70.47 70.96 70.95 69.20 69.05 69.45 69.27 68.29 69.43 69.82 69.28 70.63 69.24 69.21
OPEC .............................................. 37.46 37.07 37.34 37.29 35.86 35.17 35.19 35.10 34.66 34.74 34.89 34.65 37.29 35.33 34.73
Crude Oil Portion ......................... 32.10 31.78 32.02 31.94 30.47 29.89 30.19 30.08 29.66 29.72 29.87 29.60 31.96 30.15 29.71
Other Liquids (b) .......................... 5.36 5.29 5.33 5.36 5.39 5.28 5.00 5.02 5.01 5.01 5.02 5.05 5.33 5.17 5.02
Eurasia ............................................ 14.44 14.44 14.63 14.89 14.83 14.48 14.67 14.87 14.95 15.02 15.04 15.11 14.60 14.72 15.03
China ............................................... 4.79 4.84 4.78 4.86 4.92 4.89 4.87 4.91 4.89 4.92 4.92 4.97 4.82 4.90 4.93
Other Non-OECD ........................... 13.45 14.12 14.20 13.90 13.59 14.51 14.72 14.38 13.80 14.75 14.97 14.55 13.92 14.30 14.52
Total World Supply ............................ 99.27 99.78 101.42 102.14 99.81 100.26 101.30 102.01 101.42 102.92 103.47 103.46 100.66 100.85 102.82
Non-OPEC Supply ............................. 61.81 62.71 64.08 64.85 63.95 65.09 66.11 66.91 66.76 68.18 68.59 68.81 63.37 65.53 68.09
Consumption (million barrels per day) (c)
OECD ................................................. 47.62 46.99 47.93 47.52 47.39 46.69 48.09 48.17 47.56 47.07 48.30 48.23 47.52 47.59 47.79
U.S. (50 States) .............................. 20.24 20.33 20.63 20.60 20.29 20.33 21.02 20.92 20.53 20.75 21.25 21.01 20.45 20.64 20.89
U.S. Territories ................................ 0.10 0.08 0.09 0.11 0.12 0.11 0.12 0.13 0.12 0.11 0.12 0.13 0.10 0.12 0.12
Canada ........................................... 2.32 2.34 2.56 2.49 2.33 2.37 2.48 2.45 2.41 2.35 2.45 2.43 2.43 2.41 2.41
Europe ............................................. 14.09 14.23 14.69 14.12 14.02 14.14 14.64 14.34 13.99 14.19 14.70 14.40 14.28 14.28 14.32
Japan .............................................. 4.27 3.43 3.53 3.89 4.11 3.37 3.44 3.76 3.98 3.26 3.34 3.67 3.78 3.67 3.56
Other OECD ................................... 6.60 6.57 6.42 6.32 6.53 6.38 6.41 6.56 6.54 6.41 6.44 6.59 6.48 6.47 6.50
Non-OECD ......................................... 51.54 52.59 52.56 52.89 52.78 53.78 53.79 53.84 53.91 54.96 54.98 55.19 52.40 53.55 54.76
Eurasia ............................................ 4.78 4.83 5.11 4.98 4.80 4.87 5.24 5.09 4.90 4.99 5.37 5.27 4.93 5.00 5.13
Europe ............................................. 0.75 0.74 0.76 0.76 0.75 0.75 0.77 0.77 0.76 0.76 0.78 0.78 0.75 0.76 0.77
China ............................................... 13.80 14.00 13.73 13.95 14.28 14.47 14.20 14.41 14.76 14.95 14.67 14.90 13.87 14.34 14.82
Other Asia ....................................... 13.77 14.02 13.60 14.00 14.16 14.30 13.93 14.28 14.46 14.62 14.19 14.55 13.85 14.17 14.46
Other Non-OECD ........................... 18.44 19.00 19.36 19.20 18.78 19.38 19.66 19.29 19.04 19.63 19.97 19.70 19.00 19.28 19.58
Total World Consumption .................. 99.16 99.58 100.49 100.42 100.17 100.47 101.89 102.01 101.48 102.03 103.28 103.43 99.92 101.14 102.56
Total Crude Oil and Other Liquids Inventory Net Withdrawals (million barrels per day)
U.S. (50 States) ................................. 0.36 -0.06 -0.70 0.22 0.15 -0.63 -0.16 0.27 0.05 -0.37 -0.10 0.32 -0.05 -0.09 -0.03
Other OECD ...................................... -0.01 0.12 0.18 -0.08 -0.14 0.28 0.25 -0.09 0.00 -0.17 -0.03 -0.12 0.05 0.07 -0.08
Other Stock Draws and Balance ....... -0.46 -0.25 -0.41 -1.87 0.35 0.57 0.49 -0.18 0.00 -0.35 -0.06 -0.24 -0.75 0.31 -0.16
Total Stock Draw ............................ -0.11 -0.19 -0.93 -1.73 0.36 0.21 0.58 -0.01 0.05 -0.89 -0.19 -0.04 -0.74 0.29 -0.27
End-of-period Commercial Crude Oil and Other Liquids Inventories (million barrels)
U.S. Commercial Inventory ............... 1,196 1,207 1,272 1,262 1,249 1,310 1,325 1,304 1,303 1,340 1,351 1,324 1,262 1,304 1,324
OECD Commercial Inventory ............ 2,804 2,804 2,857 2,861 2,856 2,892 2,884 2,871 2,870 2,922 2,936 2,920 2,861 2,871 2,920
the United Arab Emirates, Venezuela.
Table 3a. International Petroleum and Other Liquids Production, Consumption, and InventoriesU.S. Energy Information Administration | Short-Term Energy Outlook - June 2019
2018 2019 2020 Year
- = no data availableOECD = Organization for Economic Cooperation and Development: Australia, Austria, Belgium, Canada, Chile, the Czech Republic, Denmark, Estonia, Finland,
France, Germany, Greece, Hungary, Iceland, Ireland, Israel, Italy, Japan, Latvia, Luxembourg, Mexico, the Netherlands, New Zealand, Norway, Poland, Portugal,
Slovakia, Slovenia, South Korea, Spain, Sweden, Switzerland, Turkey, the United Kingdom, the United States.
OPEC = Organization of the Petroleum Exporting Countries: Algeria, Angola, Congo (Brazzaville), Ecuador, Equatorial Guinea, Gabon, Iran, Iraq, Kuwait, Libya, Nigeria, Saudi Arabia,
Minor discrepancies with published historical data are due to independent rounding.
Projections: EIA Regional Short-Term Energy Model.
(a) Supply includes production of crude oil (including lease condensates), natural gas plant liquids, biofuels, other liquids, and refinery processing gains.
(b) Includes lease condensate, natural gas plant liquids, other liquids, and refinery processing gain. Includes other unaccounted-for liquids.
(c) Consumption of petroleum by the OECD countries is synonymous with "petroleum product supplied," defined in the glossary of the EIA Petroleum Supply Monthly ,
DOE/EIA-0109. Consumption of petroleum by the non-OECD countries is "apparent consumption," which includes internal consumption, refinery fuel and loss, and bunkering.
Notes: The approximate break between historical and forecast values is shown with historical data printed in bold; estimates and forecasts in italics.
Historical data: Latest data available from Energy Information Administration international energy statistics.

Q1 Q2 Q3 Q4 Q1 Q2 Q3 Q4 Q1 Q2 Q3 Q4 2018 2019 2020
North America ........................................................... 24.25 24.63 25.82 26.33 25.84 26.57 27.28 27.95 28.24 28.57 28.78 29.02 25.27 26.92 28.65
Canada ........................................................................ 5.32 5.10 5.33 5.42 5.01 4.86 5.17 5.21 5.36 5.36 5.40 5.46 5.30 5.06 5.40
Mexico .......................................................................... 2.17 2.13 2.09 1.95 1.92 2.08 2.06 2.03 2.01 1.99 1.97 1.95 2.08 2.02 1.98
United States ............................................................... 16.77 17.39 18.40 18.96 18.91 19.63 20.06 20.70 20.87 21.22 21.40 21.61 17.89 19.83 21.28
Central and South America .................................... 4.90 5.65 5.72 5.37 5.00 5.88 6.14 5.75 5.18 6.16 6.40 6.00 5.41 5.70 5.94
Argentina ...................................................................... 0.67 0.69 0.68 0.68 0.68 0.68 0.67 0.67 0.69 0.69 0.69 0.69 0.68 0.68 0.69
Brazil ............................................................................ 2.95 3.64 3.75 3.36 2.99 3.91 4.19 3.77 3.18 4.18 4.44 4.01 3.43 3.72 3.96
Colombia ...................................................................... 0.86 0.89 0.89 0.91 0.92 0.89 0.89 0.90 0.91 0.88 0.88 0.90 0.89 0.90 0.89
Other Central and S. America ..................................... 0.42 0.43 0.40 0.41 0.42 0.41 0.39 0.40 0.40 0.40 0.39 0.40 0.41 0.40 0.40
Europe ........................................................................ 4.37 4.20 4.12 4.32 4.26 4.16 4.06 4.27 4.33 4.35 4.30 4.59 4.25 4.18 4.39
Norway ......................................................................... 1.97 1.80 1.81 1.87 1.79 1.68 1.70 1.74 1.80 1.83 1.89 2.07 1.86 1.73 1.90
United Kingdom ........................................................... 1.16 1.17 1.10 1.22 1.25 1.28 1.17 1.29 1.31 1.31 1.20 1.29 1.16 1.25 1.28
Eurasia ........................................................................ 14.44 14.44 14.63 14.89 14.83 14.48 14.67 14.87 14.95 15.02 15.04 15.11 14.60 14.72 15.03
Azerbaijan .................................................................... 0.81 0.81 0.80 0.81 0.82 0.79 0.76 0.78 0.76 0.76 0.75 0.75 0.81 0.79 0.76
Kazakhstan .................................................................. 1.98 1.96 1.90 2.00 2.04 1.88 1.99 2.13 2.15 2.08 2.08 2.13 1.96 2.01 2.11
Russia .......................................................................... 11.20 11.24 11.50 11.66 11.57 11.40 11.50 11.55 11.64 11.79 11.82 11.85 11.40 11.51 11.78
Turkmenistan ............................................................... 0.30 0.28 0.28 0.27 0.25 0.26 0.26 0.26 0.24 0.24 0.24 0.24 0.28 0.26 0.24
Other Eurasia ............................................................... 0.15 0.15 0.15 0.15 0.16 0.16 0.16 0.16 0.15 0.15 0.15 0.15 0.15 0.16 0.15
Middle East ................................................................ 3.02 3.03 3.04 3.05 3.09 3.11 3.11 3.11 3.17 3.18 3.18 3.18 3.04 3.10 3.18
Oman ........................................................................... 0.98 0.98 0.99 1.01 0.98 0.99 1.00 1.00 1.00 1.01 1.01 1.01 0.99 0.99 1.01
Qatar ............................................................................ 1.94 1.94 1.95 1.94 1.99 2.00 2.00 2.00 2.06 2.06 2.06 2.06 1.94 2.00 2.06
Asia and Oceania ..................................................... 9.31 9.25 9.19 9.33 9.38 9.34 9.30 9.41 9.38 9.40 9.39 9.41 9.27 9.36 9.40
Australia ....................................................................... 0.36 0.33 0.37 0.39 0.39 0.43 0.46 0.48 0.50 0.52 0.53 0.53 0.36 0.44 0.52
China ............................................................................ 4.79 4.84 4.78 4.86 4.92 4.89 4.87 4.91 4.89 4.92 4.92 4.97 4.82 4.90 4.93
India .............................................................................. 1.03 1.02 1.01 1.00 0.99 0.97 0.97 0.97 0.97 0.98 0.98 0.98 1.01 0.97 0.98
Indonesia ...................................................................... 0.90 0.90 0.88 0.89 0.88 0.87 0.86 0.85 0.83 0.82 0.81 0.79 0.89 0.86 0.81
Malaysia ....................................................................... 0.77 0.75 0.73 0.75 0.75 0.72 0.70 0.74 0.72 0.71 0.70 0.69 0.75 0.73 0.71
Vietnam ........................................................................ 0.27 0.25 0.25 0.25 0.25 0.24 0.24 0.25 0.24 0.24 0.24 0.24 0.25 0.24 0.24
Africa .......................................................................... 1.52 1.51 1.55 1.56 1.55 1.54 1.54 1.55 1.51 1.51 1.51 1.51 1.53 1.55 1.51
Egypt ............................................................................ 0.67 0.66 0.67 0.67 0.63 0.62 0.62 0.62 0.59 0.59 0.59 0.59 0.67 0.62 0.59
South Sudan ................................................................ 0.12 0.12 0.12 0.14 0.17 0.18 0.18 0.18 0.18 0.18 0.18 0.18 0.13 0.18 0.18
Total non-OPEC liquids ............................................. 61.81 62.71 64.08 64.85 63.95 65.09 66.11 66.91 66.76 68.18 68.59 68.81 63.37 65.53 68.09
OPEC non-crude liquids ......................................... 5.36 5.29 5.33 5.36 5.39 5.28 5.00 5.02 5.01 5.01 5.02 5.05 5.33 5.17 5.02
Non-OPEC + OPEC non-crude ............................... 67.17 67.99 69.40 70.20 69.34 70.37 71.12 71.93 71.77 73.20 73.61 73.87 68.70 70.70 73.11
Unplanned non-OPEC Production Outages ........... 0.40 0.27 0.17 0.31 0.35 n/a n/a n/a n/a n/a n/a n/a 0.29 n/a n/a
Table 3b. Non-OPEC Petroleum and Other Liquids Supply (million barrels per day)U.S. Energy Information Administration | Short-Term Energy Outlook - June 2019
2018 2019 2020 Year
Historical data: Latest data available from Energy Information Administration international energy statistics.
Minor discrepancies with published historical data are due to independent rounding.
Projections: EIA Regional Short-Term Energy Model.
- = no data available
OPEC = Organization of the Petroleum Exporting Countries: Algeria, Angola, Congo (Brazzaville), Ecuador, Equatorial Guinea, Gabon, Iran, Iraq, Kuwait, Libya, Nigeria, Saudi Arabia,
the United Arab Emirates, Venezuela.
Notes: The approximate break between historical and forecast values is shown with historical data printed in bold; estimates and forecasts in italics.
Supply includes production of crude oil (including lease condensates), natural gas plant liquids, biofuels, other liquids, and refinery processing gains.
Not all countries are shown in each region and sum of reported country volumes may not equal regional volumes.

Table 3c. OPEC Crude Oil (excluding condensates) Supply (million barrels per day)
Q1 Q2 Q3 Q4 Q1 Q2 Q3 Q4 Q1 Q2 Q3 Q4 2018 2019 2020Crude Oil
Algeria .............................................................. 1.02 1.02 1.03 1.00 1.01 - - - - - - - 1.02 - -
Angola .............................................................. 1.59 1.56 1.56 1.57 1.50 - - - - - - - 1.57 - -
Congo (Brazzaville) ......................................... 0.34 0.35 0.33 0.31 0.33 - - - - - - - 0.33 - -
Ecuador ........................................................... 0.51 0.52 0.52 0.52 0.53 - - - - - - - 0.52 - -
Equatorial Guinea ............................................ 0.14 0.13 0.14 0.12 0.11 - - - - - - - 0.13 - -
Gabon .............................................................. 0.20 0.20 0.19 0.19 0.20 - - - - - - - 0.20 - -
Iran ................................................................... 3.83 3.80 3.55 2.90 2.63 - - - - - - - 3.52 - -
Iraq ................................................................... 4.46 4.50 4.66 4.77 4.75 - - - - - - - 4.60 - -
Kuwait .............................................................. 2.71 2.71 2.80 2.80 2.74 - - - - - - - 2.76 - -
Libya ................................................................ 1.00 0.92 0.91 1.03 0.93 - - - - - - - 0.96 - -
Nigeria ............................................................. 1.72 1.53 1.55 1.61 1.58 - - - - - - - 1.60 - -
Saudi Arabia .................................................... 10.10 10.20 10.47 10.74 10.00 - - - - - - - 10.38 - -
United Arab Emirates ...................................... 2.88 2.86 2.94 3.11 3.12 - - - - - - - 2.95 - -
Venezuela ........................................................ 1.60 1.49 1.36 1.27 1.05 - - - - - - - 1.43 - -
OPEC Total .................................................. 32.10 31.78 32.02 31.94 30.47 29.89 30.19 30.08 29.66 29.72 29.87 29.60 31.96 30.15 29.71
Other Liquids (a) ............................................... 5.36 5.29 5.33 5.36 5.39 5.28 5.00 5.02 5.01 5.01 5.02 5.05 5.33 5.17 5.02
Total OPEC Supply ........................................... 37.46 37.07 37.34 37.29 35.86 35.17 35.19 35.10 34.66 34.74 34.89 34.65 37.29 35.33 34.73
Crude Oil Production Capacity
Africa ............................................................... 6.00 5.70 5.71 5.84 5.66 5.80 5.76 5.81 5.87 5.89 5.91 5.91 5.81 5.76 5.89
Middle East ...................................................... 25.84 25.85 25.76 25.29 25.28 24.93 24.70 24.70 24.72 24.76 24.77 24.78 25.68 24.90 24.76
South America ................................................. 2.11 2.01 1.89 1.79 1.58 1.28 1.12 1.03 0.96 0.90 0.85 0.80 1.95 1.25 0.87
OPEC Total .................................................. 33.95 33.56 33.36 32.91 32.52 32.02 31.57 31.54 31.54 31.54 31.52 31.48 33.44 31.91 31.52
Surplus Crude Oil Production Capacity
Africa ............................................................... 0.00 0.00 0.00 0.00 0.00 0.00 0.00 0.00 0.00 0.00 0.00 0.00 0.00 0.00 0.00
Middle East ...................................................... 1.86 1.78 1.34 0.97 2.05 2.13 1.39 1.45 1.89 1.82 1.65 1.89 1.48 1.75 1.81
South America ................................................. 0.00 0.00 0.00 0.00 0.00 0.00 0.00 0.00 0.00 0.00 0.00 0.00 0.00 0.00 0.00
OPEC Total .................................................. 1.86 1.78 1.34 0.97 2.05 2.13 1.39 1.45 1.89 1.82 1.65 1.89 1.48 1.75 1.81
Unplanned OPEC Production Outages .......... 1.21 1.43 1.59 2.01 2.51 n/a n/a n/a n/a n/a n/a n/a 1.56 n/a n/a
Projections: EIA Regional Short-Term Energy Model.
U.S. Energy Information Administration | Short-Term Energy Outlook - June 20192018 2019 2020 Year
- = no data availableOPEC = Organization of the Petroleum Exporting Countries: Algeria, Angola, Congo (Brazzaville), Equatorial Guinea, Gabon, Libya, and Nigeria (Africa); Ecuador and Venezuela (South America); Iran, Iraq, Kuwait, Saudi Arabia, and the United Arab Emirates (Middle East).
(a) Includes lease condensate, natural gas plant liquids, other liquids, and refinery processing gain. Includes other unaccounted-for liquids.
Notes: The approximate break between historical and forecast values is shown with historical data printed in bold; estimates and forecasts in italics.
Historical data: Latest data available from Energy Information Administration international energy statistics.
Minor discrepancies with published historical data are due to independent rounding.
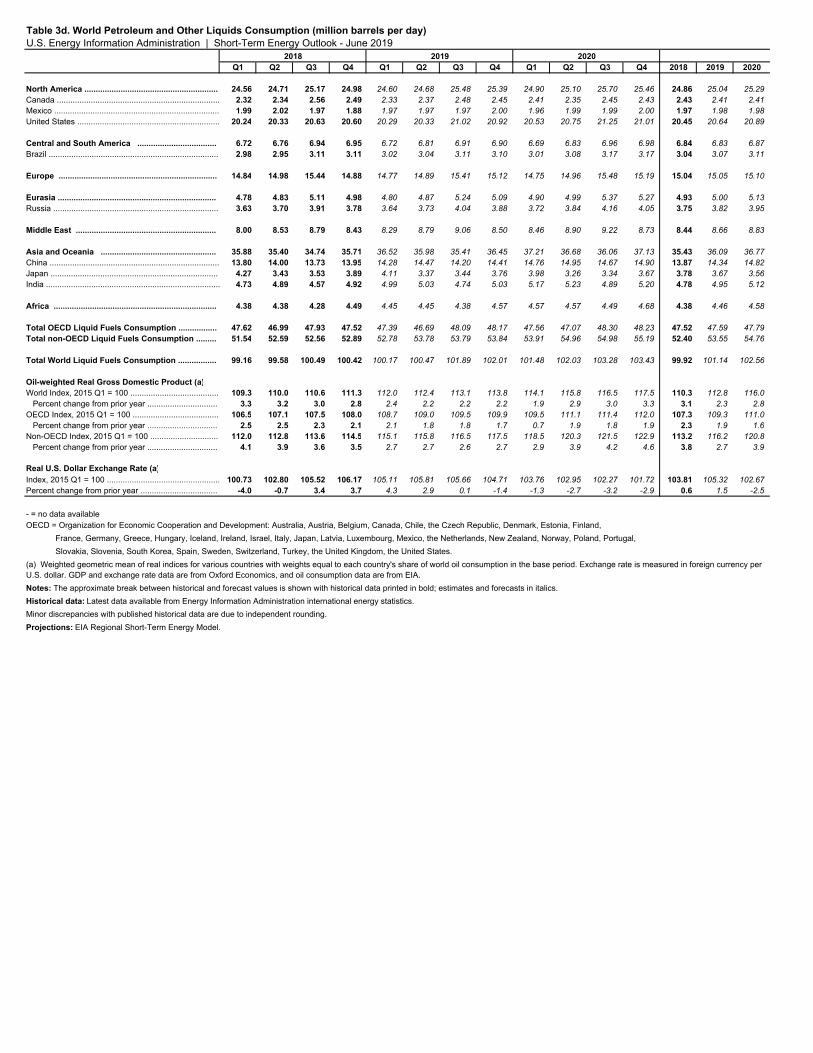
Q1 Q2 Q3 Q4 Q1 Q2 Q3 Q4 Q1 Q2 Q3 Q4 2018 2019 2020
North America ........................................................... 24.56 24.71 25.17 24.98 24.60 24.68 25.48 25.39 24.90 25.10 25.70 25.46 24.86 25.04 25.29Canada ........................................................................ 2.32 2.34 2.56 2.49 2.33 2.37 2.48 2.45 2.41 2.35 2.45 2.43 2.43 2.41 2.41Mexico ......................................................................... 1.99 2.02 1.97 1.88 1.97 1.97 1.97 2.00 1.96 1.99 1.99 2.00 1.97 1.98 1.98United States ............................................................... 20.24 20.33 20.63 20.60 20.29 20.33 21.02 20.92 20.53 20.75 21.25 21.01 20.45 20.64 20.89
Central and South America ................................... 6.72 6.76 6.94 6.95 6.72 6.81 6.91 6.90 6.69 6.83 6.96 6.98 6.84 6.83 6.87Brazil ........................................................................... 2.98 2.95 3.11 3.11 3.02 3.04 3.11 3.10 3.01 3.08 3.17 3.17 3.04 3.07 3.11
Europe ...................................................................... 14.84 14.98 15.44 14.88 14.77 14.89 15.41 15.12 14.75 14.96 15.48 15.19 15.04 15.05 15.10
Eurasia ...................................................................... 4.78 4.83 5.11 4.98 4.80 4.87 5.24 5.09 4.90 4.99 5.37 5.27 4.93 5.00 5.13Russia ......................................................................... 3.63 3.70 3.91 3.78 3.64 3.73 4.04 3.88 3.72 3.84 4.16 4.05 3.75 3.82 3.95
Middle East .............................................................. 8.00 8.53 8.79 8.43 8.29 8.79 9.06 8.50 8.46 8.90 9.22 8.73 8.44 8.66 8.83
Asia and Oceania ................................................... 35.88 35.40 34.74 35.71 36.52 35.98 35.41 36.45 37.21 36.68 36.06 37.13 35.43 36.09 36.77China ........................................................................... 13.80 14.00 13.73 13.95 14.28 14.47 14.20 14.41 14.76 14.95 14.67 14.90 13.87 14.34 14.82Japan .......................................................................... 4.27 3.43 3.53 3.89 4.11 3.37 3.44 3.76 3.98 3.26 3.34 3.67 3.78 3.67 3.56India ............................................................................. 4.73 4.89 4.57 4.92 4.99 5.03 4.74 5.03 5.17 5.23 4.89 5.20 4.78 4.95 5.12
Africa ........................................................................ 4.38 4.38 4.28 4.49 4.45 4.45 4.38 4.57 4.57 4.57 4.49 4.68 4.38 4.46 4.58
Total OECD Liquid Fuels Consumption ................. 47.62 46.99 47.93 47.52 47.39 46.69 48.09 48.17 47.56 47.07 48.30 48.23 47.52 47.59 47.79Total non-OECD Liquid Fuels Consumption ......... 51.54 52.59 52.56 52.89 52.78 53.78 53.79 53.84 53.91 54.96 54.98 55.19 52.40 53.55 54.76
Total World Liquid Fuels Consumption ................. 99.16 99.58 100.49 100.42 100.17 100.47 101.89 102.01 101.48 102.03 103.28 103.43 99.92 101.14 102.56
Oil-weighted Real Gross Domestic Product (a)World Index, 2015 Q1 = 100 ....................................... 109.3 110.0 110.6 111.3 112.0 112.4 113.1 113.8 114.1 115.8 116.5 117.5 110.3 112.8 116.0 Percent change from prior year ............................... 3.3 3.2 3.0 2.8 2.4 2.2 2.2 2.2 1.9 2.9 3.0 3.3 3.1 2.3 2.8OECD Index, 2015 Q1 = 100 ...................................... 106.5 107.1 107.5 108.0 108.7 109.0 109.5 109.9 109.5 111.1 111.4 112.0 107.3 109.3 111.0 Percent change from prior year ............................... 2.5 2.5 2.3 2.1 2.1 1.8 1.8 1.7 0.7 1.9 1.8 1.9 2.3 1.9 1.6Non-OECD Index, 2015 Q1 = 100 .............................. 112.0 112.8 113.6 114.5 115.1 115.8 116.5 117.5 118.5 120.3 121.5 122.9 113.2 116.2 120.8 Percent change from prior year ............................... 4.1 3.9 3.6 3.5 2.7 2.7 2.6 2.7 2.9 3.9 4.2 4.6 3.8 2.7 3.9
Real U.S. Dollar Exchange Rate (a)Index, 2015 Q1 = 100 .................................................. 100.73 102.80 105.52 106.17 105.11 105.81 105.66 104.71 103.76 102.95 102.27 101.72 103.81 105.32 102.67Percent change from prior year .................................. -4.0 -0.7 3.4 3.7 4.3 2.9 0.1 -1.4 -1.3 -2.7 -3.2 -2.9 0.6 1.5 -2.5
Table 3d. World Petroleum and Other Liquids Consumption (million barrels per day)U.S. Energy Information Administration | Short-Term Energy Outlook - June 2019
2018 2019 2020
Historical data: Latest data available from Energy Information Administration international energy statistics.
Minor discrepancies with published historical data are due to independent rounding.
Projections: EIA Regional Short-Term Energy Model.
- = no data availableOECD = Organization for Economic Cooperation and Development: Australia, Austria, Belgium, Canada, Chile, the Czech Republic, Denmark, Estonia, Finland,
France, Germany, Greece, Hungary, Iceland, Ireland, Israel, Italy, Japan, Latvia, Luxembourg, Mexico, the Netherlands, New Zealand, Norway, Poland, Portugal,
Slovakia, Slovenia, South Korea, Spain, Sweden, Switzerland, Turkey, the United Kingdom, the United States.
(a) Weighted geometric mean of real indices for various countries with weights equal to each country's share of world oil consumption in the base period. Exchange rate is measured in foreign currency per U.S. dollar. GDP and exchange rate data are from Oxford Economics, and oil consumption data are from EIA.
Notes: The approximate break between historical and forecast values is shown with historical data printed in bold; estimates and forecasts in italics.

Q1 Q2 Q3 Q4 Q1 Q2 Q3 Q4 Q1 Q2 Q3 Q4 2018 2019 2020
Supply (million barrels per day)
Crude Oil Supply
Domestic Production (a) ................................................. 10.23 10.54 11.24 11.81 11.81 12.20 12.44 12.83 13.05 13.24 13.32 13.44 10.96 12.32 13.26
Alaska .......................................................................... 0.51 0.48 0.43 0.49 0.49 0.49 0.45 0.49 0.51 0.50 0.46 0.49 0.48 0.48 0.49
Federal Gulf of Mexico (b) ............................................ 1.67 1.58 1.85 1.86 1.85 1.94 1.91 2.02 2.11 2.10 2.03 2.03 1.74 1.93 2.06
Lower 48 States (excl GOM) ........................................ 8.05 8.47 8.96 9.46 9.48 9.76 10.07 10.31 10.43 10.64 10.83 10.92 8.74 9.91 10.71
Crude Oil Net Imports (c) ................................................ 6.18 6.19 5.84 4.82 4.25 4.39 4.82 4.26 4.21 4.64 4.54 4.21 5.75 4.43 4.40
SPR Net Withdrawals ..................................................... -0.03 0.06 0.00 0.12 0.00 0.05 0.00 0.04 0.04 0.04 0.01 0.03 0.04 0.02 0.03
Commercial Inventory Net Withdrawals ......................... -0.02 0.09 -0.01 -0.28 -0.19 -0.15 0.09 -0.09 -0.32 0.09 0.15 -0.08 -0.06 -0.09 -0.04
Crude Oil Adjustment (d) ................................................ 0.05 0.26 0.25 0.52 0.33 0.43 0.21 0.15 0.19 0.19 0.21 0.15 0.27 0.28 0.19
Total Crude Oil Input to Refineries ..................................... 16.41 17.14 17.32 16.99 16.20 16.91 17.56 17.19 17.17 18.20 18.23 17.76 16.97 16.97 17.84
Other Supply
Refinery Processing Gain ............................................... 1.11 1.12 1.17 1.16 1.06 1.13 1.14 1.19 1.20 1.25 1.27 1.28 1.14 1.13 1.25
Natural Gas Plant Liquids Production ............................. 4.01 4.30 4.54 4.54 4.66 4.86 5.05 5.25 5.20 5.25 5.35 5.42 4.35 4.96 5.31
Renewables and Oxygenate Production (e) ................... 1.21 1.22 1.25 1.22 1.18 1.23 1.20 1.21 1.19 1.24 1.23 1.23 1.23 1.20 1.22
Fuel Ethanol Production .............................................. 1.05 1.04 1.06 1.04 1.01 1.05 1.04 1.04 1.04 1.06 1.05 1.05 1.05 1.04 1.05
Petroleum Products Adjustment (f) ................................. 0.21 0.21 0.21 0.22 0.20 0.22 0.22 0.23 0.22 0.24 0.24 0.24 0.21 0.22 0.23
Product Net Imports (c) ................................................... -3.13 -3.44 -3.17 -3.91 -3.35 -3.50 -3.91 -4.46 -4.79 -4.93 -4.80 -5.28 -3.41 -3.81 -4.95
Hydrocarbon Gas Liquids ............................................ -1.22 -1.53 -1.49 -1.38 -1.33 -1.77 -1.81 -1.93 -1.93 -1.98 -1.98 -2.07 -1.41 -1.71 -1.99
Unfinished Oils ............................................................. 0.39 0.32 0.35 0.28 0.21 0.36 0.38 0.35 0.50 0.62 0.61 0.51 0.33 0.33 0.56
Other HC/Oxygenates .................................................. -0.18 -0.15 -0.13 -0.15 -0.13 -0.12 -0.12 -0.10 -0.13 -0.12 -0.12 -0.12 -0.15 -0.12 -0.12
Motor Gasoline Blend Comp. ....................................... 0.50 0.78 0.66 0.37 0.43 0.69 0.45 0.45 0.44 0.65 0.49 0.45 0.58 0.50 0.51
Finished Motor Gasoline .............................................. -0.94 -0.71 -0.72 -1.00 -0.82 -0.59 -0.67 -1.02 -1.15 -1.03 -0.89 -1.29 -0.84 -0.78 -1.09
Jet Fuel ........................................................................ -0.10 -0.10 -0.06 -0.13 -0.08 -0.02 -0.04 -0.03 -0.03 -0.08 -0.09 -0.08 -0.10 -0.04 -0.07
Distillate Fuel Oil .......................................................... -0.87 -1.30 -1.14 -1.19 -0.91 -1.38 -1.35 -1.31 -1.51 -1.92 -1.87 -1.63 -1.13 -1.24 -1.73
Residual Fuel Oil ......................................................... -0.10 -0.14 -0.10 -0.09 -0.08 -0.07 -0.02 -0.03 -0.03 -0.13 -0.03 -0.06 -0.11 -0.05 -0.06
Other Oils (g) ................................................................ -0.62 -0.61 -0.53 -0.61 -0.64 -0.59 -0.74 -0.84 -0.95 -0.94 -0.92 -0.99 -0.59 -0.70 -0.95
Product Inventory Net Withdrawals ................................. 0.41 -0.21 -0.69 0.38 0.34 -0.52 -0.25 0.33 0.33 -0.50 -0.27 0.36 -0.03 -0.03 -0.02
Total Supply ....................................................................... 20.23 20.33 20.63 20.60 20.29 20.33 21.02 20.92 20.53 20.75 21.25 21.01 20.45 20.64 20.89
Consumption (million barrels per day)
Hydrocarbon Gas Liquids ............................................... 3.22 2.67 2.85 3.22 3.48 2.86 3.08 3.46 3.60 3.10 3.23 3.52 2.99 3.22 3.36
Unfinished Oils ................................................................ 0.13 -0.04 -0.10 0.00 -0.03 -0.01 0.00 0.00 0.00 0.00 0.00 0.00 0.00 -0.01 0.00
Motor Gasoline ................................................................ 9.01 9.51 9.51 9.25 8.96 9.54 9.53 9.25 9.00 9.56 9.59 9.24 9.32 9.32 9.35
Fuel Ethanol blended into Motor Gasoline ................... 0.91 0.94 0.96 0.94 0.91 0.98 0.96 0.95 0.91 0.98 0.98 0.95 0.94 0.95 0.95
Jet Fuel ........................................................................... 1.64 1.73 1.78 1.70 1.65 1.79 1.84 1.81 1.74 1.81 1.86 1.83 1.71 1.77 1.81
Distillate Fuel Oil ............................................................. 4.18 4.13 4.05 4.18 4.28 3.92 4.11 4.22 4.22 4.11 4.19 4.27 4.13 4.13 4.20
Residual Fuel Oil ............................................................ 0.28 0.32 0.34 0.34 0.27 0.28 0.35 0.31 0.28 0.23 0.31 0.27 0.32 0.30 0.27
Other Oils (g) ................................................................... 1.78 2.01 2.22 1.91 1.68 1.95 2.11 1.88 1.69 1.94 2.07 1.87 1.98 1.90 1.89
Total Consumption ............................................................. 20.24 20.33 20.63 20.60 20.29 20.33 21.02 20.92 20.53 20.75 21.25 21.01 20.45 20.64 20.89
Total Petroleum and Other Liquids Net Imports ............ 3.05 2.75 2.67 0.91 0.89 0.89 0.91 -0.20 -0.58 -0.28 -0.26 -1.07 2.34 0.62 -0.55
End-of-period Inventories (million barrels)
Commercial Inventory
Crude Oil (excluding SPR) .............................................. 423.4 414.8 416.1 441.8 459.3 473.4 465.2 473.9 502.9 494.7 480.8 487.8 441.8 473.9 487.8
Hydrocarbon Gas Liquids ............................................... 139.3 180.8 224.8 188.5 163.0 215.8 252.2 208.7 168.4 217.4 252.6 207.9 188.5 208.7 207.9
Unfinished Oils ................................................................ 98.3 92.6 92.0 85.9 92.0 95.4 89.4 81.9 92.5 92.5 89.2 82.3 85.9 81.9 82.3
Other HC/Oxygenates ..................................................... 30.5 28.8 30.5 31.4 32.8 31.8 31.0 31.7 33.4 32.4 31.7 32.3 31.4 31.7 32.3
Total Motor Gasoline ....................................................... 239.6 240.3 239.7 246.3 236.1 232.3 222.3 235.5 234.5 229.5 224.1 236.9 246.3 235.5 236.9
Finished Motor Gasoline .............................................. 23.1 24.7 24.8 25.7 21.7 23.3 23.6 24.3 23.9 22.7 23.6 23.9 25.7 24.3 23.9
Motor Gasoline Blend Comp. ....................................... 216.5 215.6 214.9 220.5 214.4 209.0 198.6 211.2 210.6 206.8 200.5 213.0 220.5 211.2 213.0
Jet Fuel ........................................................................... 40.4 40.8 46.9 41.6 41.6 38.8 41.2 39.8 40.2 41.9 43.4 41.6 41.6 39.8 41.6
Distillate Fuel Oil ............................................................. 130.4 120.4 137.1 140.0 132.4 131.2 136.3 141.0 131.3 133.7 138.8 143.8 140.0 141.0 143.8
Residual Fuel Oil ............................................................ 35.0 30.0 28.6 28.3 28.7 30.4 32.3 34.3 37.0 37.1 35.3 35.1 28.3 34.3 35.1
Other Oils (g) ................................................................... 59.3 58.8 56.1 58.7 63.2 61.4 55.1 57.0 62.3 60.7 54.7 56.7 58.7 57.0 56.7
Total Commercial Inventory ............................................... 1,196 1,207 1,272 1,262 1,249 1,310 1,325 1,304 1,303 1,340 1,351 1,324 1,262 1,304 1,324
Crude Oil in SPR ................................................................ 665 660 660 649 649 645 645 641 638 634 633 630 649 641 630
(e) Renewables and oxygenate production includes pentanes plus, oxygenates (excluding fuel ethanol), and renewable fuels.
Table 4a. U.S. Petroleum and Other Liquids Supply, Consumption, and InventoriesU.S. Energy Information Administration | Short-Term Energy Outlook - June 2019
2018 2019 2020 Year
- = no data available
(a) Includes lease condensate.
(b) Crude oil production from U.S. Federal leases in the Gulf of Mexico (GOM).
(c) Net imports equals gross imports minus gross exports.
(d) Crude oil adjustment balances supply and consumption and was previously referred to as "Unaccounted for Crude Oil."
Petroleum Supply Annual , DOE/EIA-0340/2; and Weekly Petroleum Status Report , DOE/EIA-0208.
Minor discrepancies with published historical data are due to independent rounding.
Projections: EIA Regional Short-Term Energy Model.
(f) Petroleum products adjustment includes hydrogen/oxygenates/renewables/other hydrocarbons, motor gasoline blend components, and finished motor gasoline.
(g) "Other Oils" inludes aviation gasoline blend components, finished aviation gasoline, kerosene, petrochemical feedstocks, special naphthas, lubricants, waxes, petroleum coke, asphalt and road oil, still gas, and miscellaneous products.
Notes: The approximate break between historical and forecast values is shown with historical data printed in bold; estimates and forecasts in italics.
SPR: Strategic Petroleum Reserve
HC: Hydrocarbons
Historical data: Latest data available from Energy Information Administration databases supporting the following reports: Petroleum Supply Monthly , DOE/EIA-0109;
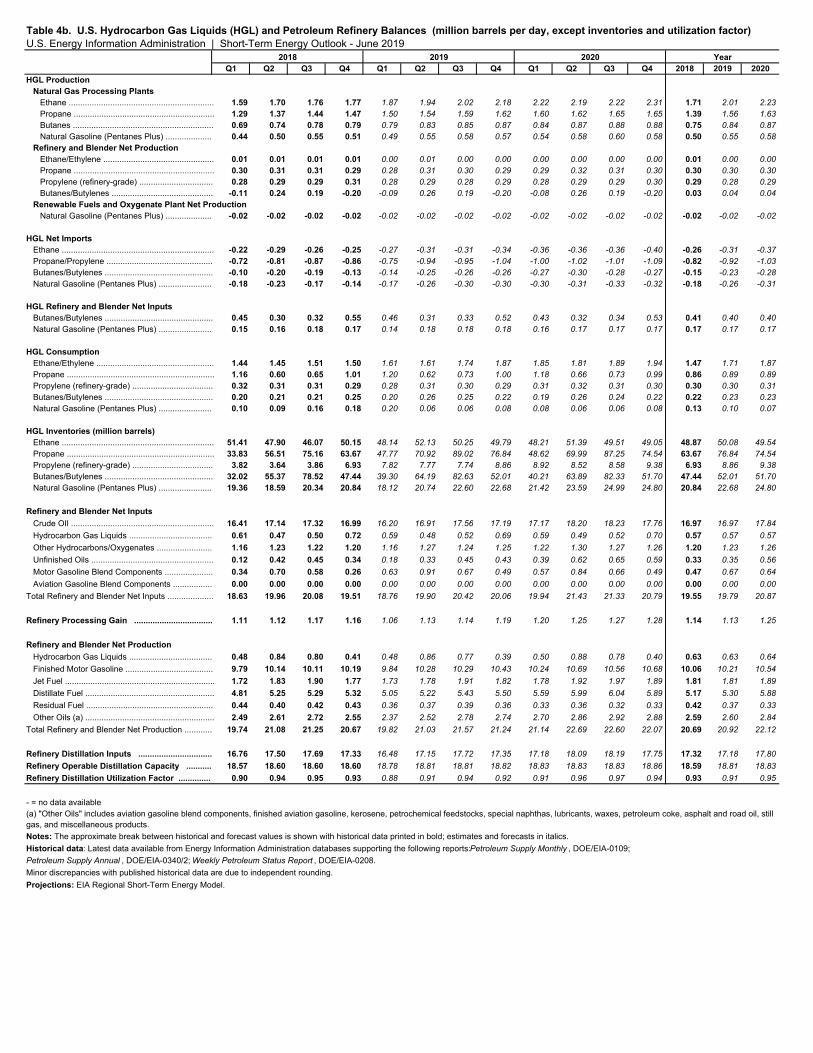
Q1 Q2 Q3 Q4 Q1 Q2 Q3 Q4 Q1 Q2 Q3 Q4 2018 2019 2020HGL Production Natural Gas Processing Plants Ethane ............................................................... 1.59 1.70 1.76 1.77 1.87 1.94 2.02 2.18 2.22 2.19 2.22 2.31 1.71 2.01 2.23 Propane ............................................................. 1.29 1.37 1.44 1.47 1.50 1.54 1.59 1.62 1.60 1.62 1.65 1.65 1.39 1.56 1.63 Butanes ............................................................. 0.69 0.74 0.78 0.79 0.79 0.83 0.85 0.87 0.84 0.87 0.88 0.88 0.75 0.84 0.87 Natural Gasoline (Pentanes Plus) .................... 0.44 0.50 0.55 0.51 0.49 0.55 0.58 0.57 0.54 0.58 0.60 0.58 0.50 0.55 0.58 Refinery and Blender Net Production Ethane/Ethylene ................................................ 0.01 0.01 0.01 0.01 0.00 0.01 0.00 0.00 0.00 0.00 0.00 0.00 0.01 0.00 0.00 Propane ............................................................. 0.30 0.31 0.31 0.29 0.28 0.31 0.30 0.29 0.29 0.32 0.31 0.30 0.30 0.30 0.30 Propylene (refinery-grade) ................................ 0.28 0.29 0.29 0.31 0.28 0.29 0.28 0.29 0.28 0.29 0.29 0.30 0.29 0.28 0.29 Butanes/Butylenes ............................................ -0.11 0.24 0.19 -0.20 -0.09 0.26 0.19 -0.20 -0.08 0.26 0.19 -0.20 0.03 0.04 0.04 Renewable Fuels and Oxygenate Plant Net Production Natural Gasoline (Pentanes Plus) .................... -0.02 -0.02 -0.02 -0.02 -0.02 -0.02 -0.02 -0.02 -0.02 -0.02 -0.02 -0.02 -0.02 -0.02 -0.02
HGL Net Imports Ethane .................................................................. -0.22 -0.29 -0.26 -0.25 -0.27 -0.31 -0.31 -0.34 -0.36 -0.36 -0.36 -0.40 -0.26 -0.31 -0.37 Propane/Propylene .............................................. -0.72 -0.81 -0.87 -0.86 -0.75 -0.94 -0.95 -1.04 -1.00 -1.02 -1.01 -1.09 -0.82 -0.92 -1.03 Butanes/Butylenes ............................................... -0.10 -0.20 -0.19 -0.13 -0.14 -0.25 -0.26 -0.26 -0.27 -0.30 -0.28 -0.27 -0.15 -0.23 -0.28 Natural Gasoline (Pentanes Plus) ....................... -0.18 -0.23 -0.17 -0.14 -0.17 -0.26 -0.30 -0.30 -0.30 -0.31 -0.33 -0.32 -0.18 -0.26 -0.31
HGL Refinery and Blender Net Inputs Butanes/Butylenes ............................................... 0.45 0.30 0.32 0.55 0.46 0.31 0.33 0.52 0.43 0.32 0.34 0.53 0.41 0.40 0.40 Natural Gasoline (Pentanes Plus) ....................... 0.15 0.16 0.18 0.17 0.14 0.18 0.18 0.18 0.16 0.17 0.17 0.17 0.17 0.17 0.17
HGL Consumption Ethane/Ethylene ................................................... 1.44 1.45 1.51 1.50 1.61 1.61 1.74 1.87 1.85 1.81 1.89 1.94 1.47 1.71 1.87 Propane ................................................................ 1.16 0.60 0.65 1.01 1.20 0.62 0.73 1.00 1.18 0.66 0.73 0.99 0.86 0.89 0.89 Propylene (refinery-grade) ................................... 0.32 0.31 0.31 0.29 0.28 0.31 0.30 0.29 0.31 0.32 0.31 0.30 0.30 0.30 0.31 Butanes/Butylenes ............................................... 0.20 0.21 0.21 0.25 0.20 0.26 0.25 0.22 0.19 0.26 0.24 0.22 0.22 0.23 0.23 Natural Gasoline (Pentanes Plus) ....................... 0.10 0.09 0.16 0.18 0.20 0.06 0.06 0.08 0.08 0.06 0.06 0.08 0.13 0.10 0.07
HGL Inventories (million barrels) Ethane .................................................................. 51.41 47.90 46.07 50.15 48.14 52.13 50.25 49.79 48.21 51.39 49.51 49.05 48.87 50.08 49.54 Propane ................................................................ 33.83 56.51 75.16 63.67 47.77 70.92 89.02 76.84 48.62 69.99 87.25 74.54 63.67 76.84 74.54 Propylene (refinery-grade) ................................... 3.82 3.64 3.86 6.93 7.82 7.77 7.74 8.86 8.92 8.52 8.58 9.38 6.93 8.86 9.38 Butanes/Butylenes ............................................... 32.02 55.37 78.52 47.44 39.30 64.19 82.63 52.01 40.21 63.89 82.33 51.70 47.44 52.01 51.70 Natural Gasoline (Pentanes Plus) ....................... 19.36 18.59 20.34 20.84 18.12 20.74 22.60 22.68 21.42 23.59 24.99 24.80 20.84 22.68 24.80
Refinery and Blender Net Inputs
Crude OIl .............................................................. 16.41 17.14 17.32 16.99 16.20 16.91 17.56 17.19 17.17 18.20 18.23 17.76 16.97 16.97 17.84
Hydrocarbon Gas Liquids .................................... 0.61 0.47 0.50 0.72 0.59 0.48 0.52 0.69 0.59 0.49 0.52 0.70 0.57 0.57 0.57
Other Hydrocarbons/Oxygenates ........................ 1.16 1.23 1.22 1.20 1.16 1.27 1.24 1.25 1.22 1.30 1.27 1.26 1.20 1.23 1.26
Unfinished Oils ..................................................... 0.12 0.42 0.45 0.34 0.18 0.33 0.45 0.43 0.39 0.62 0.65 0.59 0.33 0.35 0.56
Motor Gasoline Blend Components ..................... 0.34 0.70 0.58 0.26 0.63 0.91 0.67 0.49 0.57 0.84 0.66 0.49 0.47 0.67 0.64
Aviation Gasoline Blend Components ................. 0.00 0.00 0.00 0.00 0.00 0.00 0.00 0.00 0.00 0.00 0.00 0.00 0.00 0.00 0.00
Total Refinery and Blender Net Inputs .................... 18.63 19.96 20.08 19.51 18.76 19.90 20.42 20.06 19.94 21.43 21.33 20.79 19.55 19.79 20.87
Refinery Processing Gain .................................. 1.11 1.12 1.17 1.16 1.06 1.13 1.14 1.19 1.20 1.25 1.27 1.28 1.14 1.13 1.25
Refinery and Blender Net Production
Hydrocarbon Gas Liquids .................................... 0.48 0.84 0.80 0.41 0.48 0.86 0.77 0.39 0.50 0.88 0.78 0.40 0.63 0.63 0.64
Finished Motor Gasoline ...................................... 9.79 10.14 10.11 10.19 9.84 10.28 10.29 10.43 10.24 10.69 10.56 10.68 10.06 10.21 10.54
Jet Fuel ................................................................. 1.72 1.83 1.90 1.77 1.73 1.78 1.91 1.82 1.78 1.92 1.97 1.89 1.81 1.81 1.89
Distillate Fuel ........................................................ 4.81 5.25 5.29 5.32 5.05 5.22 5.43 5.50 5.59 5.99 6.04 5.89 5.17 5.30 5.88
Residual Fuel ....................................................... 0.44 0.40 0.42 0.43 0.36 0.37 0.39 0.36 0.33 0.36 0.32 0.33 0.42 0.37 0.33
Other Oils (a) ........................................................ 2.49 2.61 2.72 2.55 2.37 2.52 2.78 2.74 2.70 2.86 2.92 2.88 2.59 2.60 2.84
Total Refinery and Blender Net Production ............ 19.74 21.08 21.25 20.67 19.82 21.03 21.57 21.24 21.14 22.69 22.60 22.07 20.69 20.92 22.12
Refinery Distillation Inputs ................................ 16.76 17.50 17.69 17.33 16.48 17.15 17.72 17.35 17.18 18.09 18.19 17.75 17.32 17.18 17.80
Refinery Operable Distillation Capacity ........... 18.57 18.60 18.60 18.60 18.78 18.81 18.81 18.82 18.83 18.83 18.83 18.86 18.59 18.81 18.83
Refinery Distillation Utilization Factor .............. 0.90 0.94 0.95 0.93 0.88 0.91 0.94 0.92 0.91 0.96 0.97 0.94 0.93 0.91 0.95
Table 4b. U.S. Hydrocarbon Gas Liquids (HGL) and Petroleum Refinery Balances (million barrels per day, except inventories and utilization factor)U.S. Energy Information Administration | Short-Term Energy Outlook - June 2019
2018 2019 2020 Year
Projections: EIA Regional Short-Term Energy Model.
- = no data available(a) "Other Oils" includes aviation gasoline blend components, finished aviation gasoline, kerosene, petrochemical feedstocks, special naphthas, lubricants, waxes, petroleum coke, asphalt and road oil, still gas, and miscellaneous products.
Notes: The approximate break between historical and forecast values is shown with historical data printed in bold; estimates and forecasts in italics.
Historical data: Latest data available from Energy Information Administration databases supporting the following reports: Petroleum Supply Monthly , DOE/EIA-0109;
Petroleum Supply Annual , DOE/EIA-0340/2; Weekly Petroleum Status Report , DOE/EIA-0208.
Minor discrepancies with published historical data are due to independent rounding.

Q1 Q2 Q3 Q4 Q1 Q2 Q3 Q4 Q1 Q2 Q3 Q4 2018 2019 2020
Prices (cents per gallon)
Refiner Wholesale Price ............................ 186 213 213 178 167 203 197 185 194 206 202 187 198 188 197
Gasoline Regular Grade Retail Prices Including Taxes
PADD 1 ...................................................... 255 279 278 257 233 270 269 267 267 278 277 268 268 260 273
PADD 2 ...................................................... 246 274 276 245 223 270 268 257 261 275 273 259 261 255 267
PADD 3 ...................................................... 230 261 258 231 206 248 245 236 242 256 251 237 245 235 247
PADD 4 ...................................................... 247 288 297 281 226 279 274 262 251 275 282 264 279 261 268
PADD 5 ...................................................... 312 342 335 333 297 349 318 301 305 335 331 306 330 317 319
U.S. Average .......................................... 258 285 284 262 236 280 273 264 267 283 281 267 273 264 275
Gasoline All Grades Including Taxes 270 294 292 271 245 288 284 276 279 295 294 279 282 274 287
End-of-period Inventories (million barrels)
Total Gasoline Inventories
PADD 1 ...................................................... 58.4 66.5 70.2 62.9 62.4 63.6 57.2 61.0 60.3 61.0 58.5 62.0 62.9 61.0 62.0
PADD 2 ...................................................... 57.3 53.5 53.1 56.1 53.9 48.6 48.0 50.3 53.0 50.0 48.8 50.9 56.1 50.3 50.9
PADD 3 ...................................................... 84.2 82.3 80.5 90.6 82.5 82.3 80.8 84.7 83.5 82.4 81.0 84.8 90.6 84.7 84.8
PADD 4 ...................................................... 7.7 7.3 7.0 7.3 6.9 7.5 7.0 7.5 7.3 7.3 6.8 7.2 7.3 7.5 7.2
PADD 5 ...................................................... 32.0 30.7 28.8 29.4 30.4 30.4 29.3 32.0 30.4 28.8 29.1 32.0 29.4 32.0 32.0
U.S. Total ................................................ 239.6 240.3 239.7 246.3 236.1 232.3 222.3 235.5 234.5 229.5 224.1 236.9 246.3 235.5 236.9
Finished Gasoline Inventories
U.S. Total ................................................ 23.1 24.7 24.8 25.7 21.7 23.3 23.6 24.3 23.9 22.7 23.6 23.9 25.7 24.3 23.9
Gasoline Blending Components Inventories
U.S. Total ................................................ 216.5 215.6 214.9 220.5 214.4 209.0 198.6 211.2 210.6 206.8 200.5 213.0 220.5 211.2 213.0
Table 4c. U.S. Regional Motor Gasoline Prices and InventoriesU.S. Energy Information Administration | Short-Term Energy Outlook - June 2019
2018 2019 2020 Year
Petroleum Supply Monthly, DOE/EIA-0109; Petroleum Supply Annual, DOE/EIA-0340/2; and Weekly Petroleum Status Report, DOE/EIA-0208.
Minor discrepancies with published historical data are due to independent rounding.
Projections: EIA Regional Short-Term Energy Model.
- = no data available
Prices are not adjusted for inflation.
Notes: The approximate break between historical and forecast values is shown with historical data printed in bold; estimates and forecasts in italics.
Regions refer to Petroleum Administration for Defense Districts (PADD).
See “Petroleum for Administration Defense District” in EIA’s Energy Glossary (http://www.eia.doe.gov/glossary/index.html) for a list of States in each region.
Historical data: Latest data available from Energy Information Administration databases supporting the following reports: Petroleum Marketing Monthly, DOE/EIA-0380;
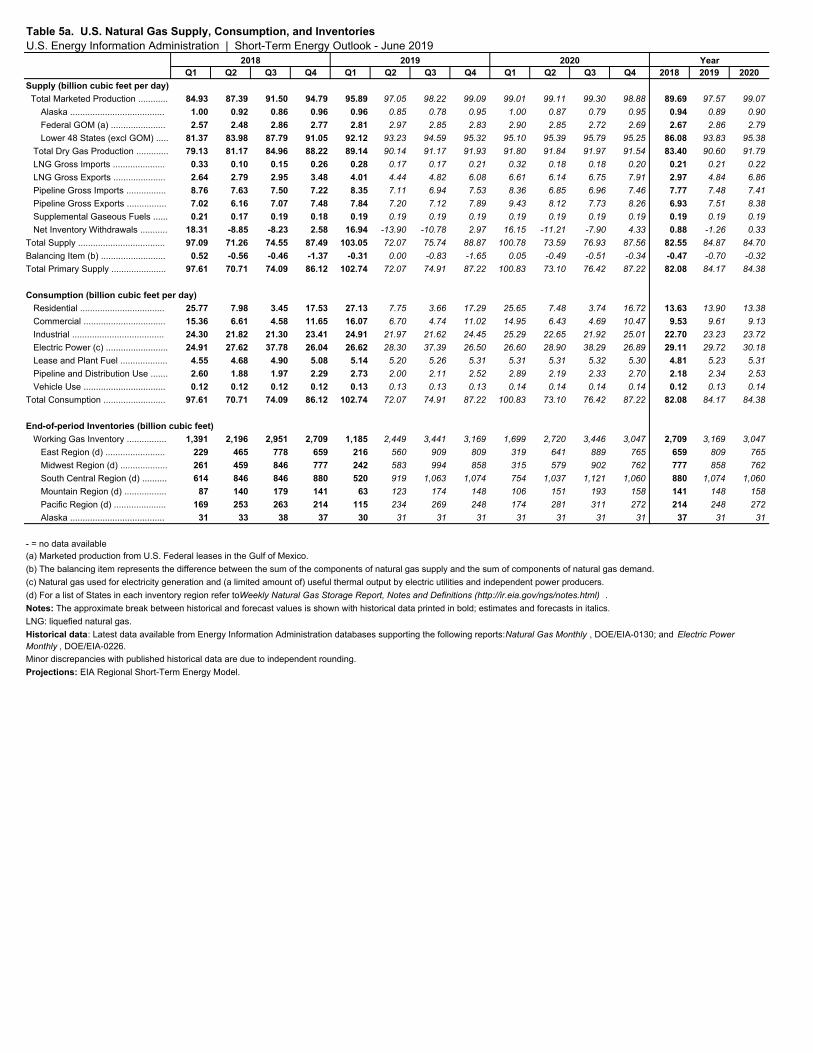
Q1 Q2 Q3 Q4 Q1 Q2 Q3 Q4 Q1 Q2 Q3 Q4 2018 2019 2020
Supply (billion cubic feet per day)
Total Marketed Production ............ 84.93 87.39 91.50 94.79 95.89 97.05 98.22 99.09 99.01 99.11 99.30 98.88 89.69 97.57 99.07
Alaska ...................................... 1.00 0.92 0.86 0.96 0.96 0.85 0.78 0.95 1.00 0.87 0.79 0.95 0.94 0.89 0.90
Federal GOM (a) ...................... 2.57 2.48 2.86 2.77 2.81 2.97 2.85 2.83 2.90 2.85 2.72 2.69 2.67 2.86 2.79
Lower 48 States (excl GOM) ..... 81.37 83.98 87.79 91.05 92.12 93.23 94.59 95.32 95.10 95.39 95.79 95.25 86.08 93.83 95.38
Total Dry Gas Production ............. 79.13 81.17 84.96 88.22 89.14 90.14 91.17 91.93 91.80 91.84 91.97 91.54 83.40 90.60 91.79
LNG Gross Imports ..................... 0.33 0.10 0.15 0.26 0.28 0.17 0.17 0.21 0.32 0.18 0.18 0.20 0.21 0.21 0.22
LNG Gross Exports ..................... 2.64 2.79 2.95 3.48 4.01 4.44 4.82 6.08 6.61 6.14 6.75 7.91 2.97 4.84 6.86
Pipeline Gross Imports ................ 8.76 7.63 7.50 7.22 8.35 7.11 6.94 7.53 8.36 6.85 6.96 7.46 7.77 7.48 7.41
Pipeline Gross Exports ................ 7.02 6.16 7.07 7.48 7.84 7.20 7.12 7.89 9.43 8.12 7.73 8.26 6.93 7.51 8.38
Supplemental Gaseous Fuels ...... 0.21 0.17 0.19 0.18 0.19 0.19 0.19 0.19 0.19 0.19 0.19 0.19 0.19 0.19 0.19
Net Inventory Withdrawals ........... 18.31 -8.85 -8.23 2.58 16.94 -13.90 -10.78 2.97 16.15 -11.21 -7.90 4.33 0.88 -1.26 0.33
Total Supply ................................... 97.09 71.26 74.55 87.49 103.05 72.07 75.74 88.87 100.78 73.59 76.93 87.56 82.55 84.87 84.70
Balancing Item (b) .......................... 0.52 -0.56 -0.46 -1.37 -0.31 0.00 -0.83 -1.65 0.05 -0.49 -0.51 -0.34 -0.47 -0.70 -0.32
Total Primary Supply ...................... 97.61 70.71 74.09 86.12 102.74 72.07 74.91 87.22 100.83 73.10 76.42 87.22 82.08 84.17 84.38
Consumption (billion cubic feet per day)
Residential .................................. 25.77 7.98 3.45 17.53 27.13 7.75 3.66 17.29 25.65 7.48 3.74 16.72 13.63 13.90 13.38
Commercial ................................. 15.36 6.61 4.58 11.65 16.07 6.70 4.74 11.02 14.95 6.43 4.69 10.47 9.53 9.61 9.13
Industrial ..................................... 24.30 21.82 21.30 23.41 24.91 21.97 21.62 24.45 25.29 22.65 21.92 25.01 22.70 23.23 23.72
Electric Power (c) ......................... 24.91 27.62 37.78 26.04 26.62 28.30 37.39 26.50 26.60 28.90 38.29 26.89 29.11 29.72 30.18
Lease and Plant Fuel ................... 4.55 4.68 4.90 5.08 5.14 5.20 5.26 5.31 5.31 5.31 5.32 5.30 4.81 5.23 5.31
Pipeline and Distribution Use ....... 2.60 1.88 1.97 2.29 2.73 2.00 2.11 2.52 2.89 2.19 2.33 2.70 2.18 2.34 2.53
Vehicle Use ................................. 0.12 0.12 0.12 0.12 0.13 0.13 0.13 0.13 0.14 0.14 0.14 0.14 0.12 0.13 0.14
Total Consumption ......................... 97.61 70.71 74.09 86.12 102.74 72.07 74.91 87.22 100.83 73.10 76.42 87.22 82.08 84.17 84.38
End-of-period Inventories (billion cubic feet)
Working Gas Inventory ................ 1,391 2,196 2,951 2,709 1,185 2,449 3,441 3,169 1,699 2,720 3,446 3,047 2,709 3,169 3,047
East Region (d) ........................ 229 465 778 659 216 560 909 809 319 641 889 765 659 809 765
Midwest Region (d) ................... 261 459 846 777 242 583 994 858 315 579 902 762 777 858 762
South Central Region (d) .......... 614 846 846 880 520 919 1,063 1,074 754 1,037 1,121 1,060 880 1,074 1,060
Mountain Region (d) ................. 87 140 179 141 63 123 174 148 106 151 193 158 141 148 158
Pacific Region (d) ..................... 169 253 263 214 115 234 269 248 174 281 311 272 214 248 272
Alaska ...................................... 31 33 38 37 30 31 31 31 31 31 31 31 37 31 31
Table 5a. U.S. Natural Gas Supply, Consumption, and InventoriesU.S. Energy Information Administration | Short-Term Energy Outlook - June 2019
2018 2019 2020 Year
LNG: liquefied natural gas.
Historical data: Latest data available from Energy Information Administration databases supporting the following reports: Natural Gas Monthly , DOE/EIA-0130; and Electric Power Monthly , DOE/EIA-0226.
Minor discrepancies with published historical data are due to independent rounding.
Projections: EIA Regional Short-Term Energy Model.
- = no data available(a) Marketed production from U.S. Federal leases in the Gulf of Mexico.
(b) The balancing item represents the difference between the sum of the components of natural gas supply and the sum of components of natural gas demand.
(c) Natural gas used for electricity generation and (a limited amount of) useful thermal output by electric utilities and independent power producers.
(d) For a list of States in each inventory region refer to Weekly Natural Gas Storage Report, Notes and Definitions (http://ir.eia.gov/ngs/notes.html) .
Notes: The approximate break between historical and forecast values is shown with historical data printed in bold; estimates and forecasts in italics.

Q1 Q2 Q3 Q4 Q1 Q2 Q3 Q4 Q1 Q2 Q3 Q4 2018 2019 2020
Wholesale/Spot
Henry Hub Spot Price ........ 3.13 2.96 3.04 3.94 3.02 2.69 2.74 3.05 3.11 2.66 2.72 3.00 3.27 2.88 2.87
Residential Retail
New England ..................... 14.38 16.60 19.08 14.42 14.43 14.36 16.95 13.50 13.09 13.89 16.97 13.42 15.00 14.32 13.56
Middle Atlantic ................... 10.17 11.92 18.30 11.39 10.77 11.98 16.39 11.38 10.56 12.34 16.72 11.21 11.30 11.42 11.45
E. N. Central ...................... 7.20 9.77 18.40 8.02 7.27 10.29 16.24 8.75 7.95 10.71 16.35 8.68 8.42 8.55 9.10
W. N. Central ..................... 8.15 10.48 18.55 9.06 7.92 10.40 16.78 9.02 8.25 11.04 16.87 9.28 9.29 9.00 9.47
S. Atlantic .......................... 11.07 15.63 24.88 12.47 11.60 16.36 22.30 13.15 11.74 16.54 22.55 13.02 12.98 13.43 13.57
E. S. Central ...................... 9.61 12.70 21.52 10.58 9.58 13.81 20.24 12.94 10.74 15.31 21.40 13.59 10.90 11.49 12.80
W. S. Central ..................... 9.27 14.25 22.03 10.19 8.26 13.30 19.89 12.05 9.04 14.53 20.60 12.24 10.98 11.06 11.65
Mountain ........................... 8.22 10.38 14.03 7.69 7.72 9.34 13.15 8.71 8.63 9.97 13.59 8.97 8.74 8.60 9.35
Pacific ................................ 11.62 12.02 12.88 11.75 12.43 12.48 12.47 11.35 12.50 12.70 12.95 11.85 11.87 12.13 12.38
U.S. Average .................. 9.37 11.93 17.93 9.97 9.46 11.80 16.39 10.61 9.82 12.24 16.71 10.70 10.49 10.60 10.92
Commercial Retail
New England ..................... 11.05 11.73 10.85 10.56 11.07 10.77 9.98 9.48 9.52 9.41 9.25 9.29 10.99 10.43 9.41
Middle Atlantic ................... 8.13 7.67 7.47 7.86 8.46 7.63 6.91 7.54 7.77 7.60 6.98 7.53 7.89 7.87 7.57
E. N. Central ...................... 6.19 6.95 9.01 6.55 6.27 7.32 8.71 6.82 6.62 7.53 8.77 6.77 6.62 6.75 6.96
W. N. Central ..................... 6.96 7.30 8.91 7.11 6.80 7.22 8.52 7.07 7.33 7.60 8.59 7.09 7.20 7.06 7.40
S. Atlantic .......................... 8.29 9.35 9.73 8.70 8.82 9.24 9.65 9.03 9.05 9.80 10.04 9.01 8.75 9.05 9.28
E. S. Central ...................... 8.62 9.32 10.51 8.84 8.52 9.31 9.78 8.73 8.37 9.28 9.67 8.61 8.98 8.83 8.72
W. S. Central ..................... 7.21 7.90 8.55 6.99 6.41 7.28 7.93 7.39 7.11 7.44 7.90 7.32 7.44 7.03 7.35
Mountain ........................... 6.99 7.48 7.92 6.24 6.38 6.79 7.72 6.85 7.15 7.42 8.12 7.06 6.91 6.72 7.27
Pacific ................................ 8.90 8.58 9.11 8.68 9.06 8.93 8.80 8.41 8.67 8.68 8.85 8.52 8.80 8.81 8.65
U.S. Average .................. 7.64 8.08 8.77 7.61 7.62 8.00 8.35 7.68 7.68 8.09 8.42 7.68 7.82 7.78 7.83
Industrial Retail
New England ..................... 8.95 8.62 6.49 7.91 9.03 7.87 6.92 8.08 8.69 7.85 7.12 8.02 8.17 8.13 8.05
Middle Atlantic ................... 8.33 8.07 7.73 7.89 8.75 7.36 7.15 7.41 7.85 7.16 7.09 7.35 8.11 7.90 7.52
E. N. Central ...................... 5.69 5.02 5.20 5.74 5.69 5.64 5.59 5.58 6.19 5.70 5.49 5.55 5.53 5.64 5.83
W. N. Central ..................... 5.05 4.23 4.21 5.05 5.09 4.27 4.17 4.86 5.38 4.38 4.14 4.90 4.69 4.67 4.77
S. Atlantic .......................... 5.34 4.67 4.68 5.42 5.48 4.60 4.53 5.10 5.47 4.66 4.58 5.02 5.06 4.97 4.96
E. S. Central ...................... 4.93 4.21 4.14 4.90 4.92 4.14 4.09 4.73 4.98 4.30 4.21 4.73 4.59 4.50 4.58
W. S. Central ..................... 3.32 3.09 3.12 4.02 3.48 2.97 2.97 3.23 3.34 2.82 2.93 3.16 3.38 3.15 3.06
Mountain ........................... 5.43 5.36 4.72 4.79 5.33 5.21 5.63 5.79 5.97 5.54 5.65 5.67 5.09 5.49 5.73
Pacific ................................ 6.97 6.03 6.72 6.65 7.61 6.65 6.32 6.36 6.91 6.29 6.32 6.42 6.61 6.73 6.51
U.S. Average .................. 4.44 3.83 3.73 4.71 4.68 3.74 3.61 4.15 4.54 3.66 3.60 4.10 4.20 4.06 4.00
Table 5b. U.S. Regional Natural Gas Prices (dollars per thousand cubic feet)U.S. Energy Information Administration | Short-Term Energy Outlook - June 2019
2018 2019 2020 Year
Natural gas Henry Hub spot price from Reuter's News Service (http://www.reuters.com).
Minor discrepancies with published historical data are due to independent rounding.
Projections: EIA Regional Short-Term Energy Model.
- = no data available
Prices are not adjusted for inflation.Notes: The approximate break between historical and forecast values is shown with historical data printed in bold; estimates and forecasts in italics.
Regions refer to U.S. Census divisions.
See "Census division" in EIA’s Energy Glossary (http://www.eia.doe.gov/glossary/index.html) for a list of States in each region.
Historical data: Latest data available from Energy Information Administration databases supporting the Natural Gas Monthly , DOE/EIA-0130.

Q1 Q2 Q3 Q4 Q1 Q2 Q3 Q4 Q1 Q2 Q3 Q4 2018 2019 2020
Supply (million short tons)
Production ........................................... 187.6 180.8 194.7 192.4 170.3 170.8 183.0 175.7 171.8 138.3 168.6 166.8 755.5 699.8 645.5
Appalachia ....................................... 50.0 51.6 49.0 49.5 47.4 46.5 48.7 46.9 43.6 39.0 41.7 40.8 200.1 189.6 165.1
Interior .............................................. 34.0 34.6 34.7 33.9 31.0 32.1 33.5 32.7 32.9 25.9 32.4 33.5 137.1 129.2 124.7
Western ........................................... 103.7 94.6 111.0 109.0 91.9 92.2 100.8 96.1 95.3 73.4 94.5 92.5 418.3 381.1 355.6
Primary Inventory Withdrawals ............ -2.8 2.3 1.1 -0.6 0.8 0.3 0.7 -2.0 -0.1 0.9 2.3 -2.9 0.0 -0.2 0.2
Imports ................................................ 1.4 1.5 1.4 1.6 1.7 1.8 1.7 1.5 1.2 1.3 1.5 1.4 6.0 6.8 5.5
Exports ................................................ 27.2 30.9 29.1 28.5 25.2 25.8 24.0 23.7 26.0 22.7 22.4 22.2 115.6 98.7 93.2
Metallurgical Coal ............................. 14.9 16.9 14.5 15.2 13.9 14.0 12.3 12.2 13.9 12.5 12.9 12.7 61.5 52.4 51.9
Steam Coal ...................................... 12.3 13.9 14.5 13.3 11.3 11.9 11.7 11.4 12.1 10.1 9.5 9.5 54.1 46.3 41.3
Total Primary Supply .............................. 159.0 153.7 168.1 165.0 147.6 147.0 161.5 151.6 147.0 117.8 150.0 143.2 645.9 607.7 558.0
Secondary Inventory Withdrawals ........ 11.8 4.9 20.4 -2.3 5.8 -6.1 5.9 -7.9 -1.2 2.7 6.6 -8.1 34.8 -2.2 -0.1
Waste Coal (a) .................................... 2.8 2.3 2.6 2.5 2.3 2.3 2.3 2.3 2.3 2.3 2.3 2.3 10.1 9.3 9.2
Total Supply ........................................... 173.5 160.9 191.2 165.2 155.8 143.3 169.7 146.0 148.0 122.7 158.9 137.3 690.8 614.8 567.0
Consumption (million short tons)
Coke Plants ......................................... 4.2 4.6 4.7 4.7 4.2 5.0 5.6 6.2 5.2 5.1 5.1 6.3 18.3 21.0 21.6
Electric Power Sector (b) ..................... 154.8 144.2 181.6 155.9 145.0 116.4 157.0 132.6 135.4 110.6 146.9 124.0 636.5 551.1 517.0
Retail and Other Industry .................... 8.5 7.9 7.7 8.4 8.1 7.3 7.1 7.2 7.4 7.0 6.9 7.1 32.5 29.7 28.4
Residential and Commercial ............. 0.4 0.2 0.2 0.2 0.2 0.2 0.2 0.2 0.2 0.1 0.2 0.2 1.0 0.7 0.7
Other Industrial ................................ 8.2 7.7 7.5 8.2 7.9 7.2 6.9 7.0 7.3 6.9 6.7 6.9 31.6 29.0 27.7
Total Consumption ................................ 167.6 156.6 194.1 169.1 157.3 128.7 169.7 146.0 148.0 122.7 158.9 137.3 687.3 601.8 567.0
Discrepancy (c) 5.9 4.3 -2.9 -3.8 -1.6 14.6 0.0 0.0 0.0 0.0 0.0 0.0 3.5 13.0 0.0
End-of-period Inventories (million short tons)
Primary Inventories (d) ........................ 26.8 24.5 23.4 24.0 23.2 22.9 22.2 24.2 24.3 23.4 21.1 24.0 24.0 24.2 24.0
Secondary Inventories ......................... 131.2 126.3 105.9 108.1 102.3 108.3 102.4 110.3 111.6 108.9 102.3 110.5 108.1 110.3 110.5
Electric Power Sector ....................... 126.5 121.5 100.8 102.8 97.1 102.8 96.7 104.7 106.0 103.0 96.3 104.6 102.8 104.7 104.6
Retail and General Industry .............. 2.9 2.9 3.0 3.3 3.6 3.5 3.6 3.4 3.7 3.6 3.7 3.5 3.3 3.4 3.5
Coke Plants ...................................... 1.5 1.6 1.8 1.8 1.4 1.8 2.0 2.1 1.6 2.0 2.2 2.2 1.8 2.1 2.2
Coal Market Indicators
Coal Miner Productivity
(Tons per hour) ................................ 6.10 6.10 6.10 6.10 6.02 6.02 6.02 6.02 6.01 6.01 6.01 6.01 6.10 6.02 6.01
Total Raw Steel Production
(Million short tons per day) ............... 0.251 0.253 0.263 0.270 0.273 0.270 0.260 0.259 0.263 0.265 0.259 0.261 0.259 0.265 0.262
Cost of Coal to Electric Utilities
(Dollars per million Btu) .................... 2.06 2.06 2.06 2.08 2.09 2.13 2.10 2.11 2.13 2.14 2.12 2.12 2.06 2.11 2.13
Table 6. U.S. Coal Supply, Consumption, and InventoriesU.S. Energy Information Administration | Short-Term Energy Outlook - June 2019
2018 2019 2020 Year
Historical data: Latest data available from Energy Information Administration databases supporting the following reports: Quarterly Coal Report , DOE/EIA-0121; and Electric Power Monthly , DOE/EIA-0226.
Minor discrepancies with published historical data are due to independent rounding.
Projections: EIA Regional Short-Term Energy Model.
- = no data available(a) Waste coal includes waste coal and cloal slurry reprocessed into briquettes.
(b) Coal used for electricity generation and (a limited amount of) useful thermal output by electric utilities and independent power producers.
(c) The discrepancy reflects an unaccounted-for shipper and receiver reporting difference, assumed to be zero in the forecast period.
(d) Primary stocks are held at the mines and distribution points.
Notes: The approximate break between historical and forecast values is shown with historical data printed in bold; estimates and forecasts in italics.

Q1 Q2 Q3 Q4 Q1 Q2 Q3 Q4 Q1 Q2 Q3 Q4 2018 2019 2020
Electricity Supply (billion kilowatthours per day)
Electricity Generation ......................... 11.13 11.14 12.80 10.71 11.05 10.80 12.39 10.58 11.02 10.82 12.47 10.60 11.45 11.21 11.23
Electric Power Sector (a) ................ 10.69 10.71 12.35 10.27 10.61 10.37 11.95 10.15 10.58 10.38 12.02 10.17 11.01 10.77 10.79
Comm. and Indus. Sectors (b) ....... 0.43 0.43 0.45 0.44 0.44 0.43 0.44 0.43 0.44 0.44 0.45 0.44 0.44 0.44 0.44
Net Imports ....................................... 0.13 0.12 0.14 0.09 0.14 0.14 0.17 0.13 0.15 0.15 0.17 0.13 0.12 0.14 0.15
Total Supply ....................................... 11.26 11.26 12.93 10.80 11.18 10.94 12.56 10.70 11.16 10.97 12.64 10.74 11.57 11.35 11.38
Losses and Unaccounted for (c) ...... 0.64 0.93 0.80 0.66 0.64 0.80 0.73 0.67 0.58 0.82 0.73 0.67 0.76 0.71 0.70
Electricity Consumption (billion kilowatthours per day unless noted)
Retail Sales ........................................ 10.23 9.95 11.73 9.75 10.14 9.76 11.43 9.65 10.19 9.75 11.51 9.67 10.42 10.24 10.28
Residential Sector ........................... 4.10 3.60 4.72 3.62 4.02 3.46 4.51 3.54 4.06 3.45 4.57 3.57 4.01 3.88 3.91
Commercial Sector ......................... 3.61 3.70 4.21 3.57 3.57 3.66 4.13 3.56 3.58 3.67 4.15 3.57 3.77 3.73 3.74
Industrial Sector .............................. 2.50 2.62 2.78 2.55 2.53 2.62 2.77 2.53 2.52 2.61 2.76 2.52 2.61 2.61 2.60
Transportation Sector ..................... 0.02 0.02 0.02 0.02 0.02 0.02 0.02 0.02 0.02 0.02 0.02 0.02 0.02 0.02 0.02
Direct Use (d) ..................................... 0.39 0.38 0.41 0.39 0.40 0.39 0.40 0.39 0.39 0.39 0.40 0.39 0.39 0.39 0.40
Total Consumption ............................ 10.62 10.33 12.14 10.14 10.54 10.14 11.83 10.03 10.58 10.14 11.91 10.06 10.81 10.64 10.68
Average residential electricity usage per customer (kWh) ................ 2,754 2,446 3,240 2,481 2,668 2,319 3,060 2,404 2,696 2,292 3,067 2,393 10,920 10,450 10,448
Prices
Power Generation Fuel Costs (dollars per million Btu)
Coal ................................................. 2.06 2.06 2.06 2.08 2.09 2.13 2.10 2.11 2.13 2.14 2.12 2.12 2.06 2.11 2.13
Natural Gas ..................................... 3.96 3.09 3.23 4.05 3.70 2.77 2.71 3.28 3.48 2.71 2.66 3.21 3.54 3.07 2.98
Residual Fuel Oil ............................. 11.47 13.02 14.02 14.49 11.93 13.79 12.91 12.73 12.98 13.72 13.02 12.79 12.95 12.82 13.10
Distillate Fuel Oil .............................. 15.77 16.61 16.82 16.01 14.92 15.87 16.05 16.88 17.13 17.58 17.49 17.57 16.13 15.94 17.42
Retail Prices (cents per kilowatthour)
Residential Sector ........................... 12.59 13.03 13.15 12.75 12.66 13.29 13.35 12.93 12.75 13.49 13.50 13.12 12.89 13.06 13.22
Commercial Sector ......................... 10.54 10.60 10.89 10.55 10.41 10.71 10.97 10.59 10.42 10.74 11.02 10.67 10.66 10.68 10.73
Industrial Sector .............................. 6.81 6.87 7.22 6.82 6.66 6.88 7.20 6.78 6.70 6.93 7.26 6.83 6.93 6.89 6.94
(d) Direct Use represents commercial and industrial facility use of onsite net electricity generation; and electrical sales or transfers to adjacent or colocated facilities
Table 7a. U.S. Electricity Industry OverviewU.S. Energy Information Administration | Short-Term Energy Outlook - June 2019
2018 2019 2020 Year
- = no data available. kWh = kilowatthours. Btu = British thermal units.
Prices are not adjusted for inflation.(a) Generation supplied by electricity-only and combined-heat-and-power (CHP) plants operated by electric utilities and independent power producers.
(b) Generation supplied by CHP and electricity-only plants operated by businesses in the commercial and industrial sectors, primarily for onsite use.
(c) Includes transmission and distribution losses, data collection time-frame differences, and estimation error.
for which revenue information is not available. See Table 7.6 of the EIA Monthly Energy Review .
Notes: The approximate break between historical and forecast values is shown with historical data printed in bold; estimates and forecasts in italics.
Historical data: Latest data available from Energy Information Administration databases supporting the following reports: Electric Power Monthly , DOE/EIA-0226; and Electric Power Annual , DOE/EIA-0348.Minor discrepancies with published historical data are due to independent rounding.
Projections: EIA Regional Short-Term Energy Model.

Q1 Q2 Q3 Q4 Q1 Q2 Q3 Q4 Q1 Q2 Q3 Q4 2018 2019 2020
Residential Sector
New England ............... 140 111 153 120 139 113 140 118 139 113 141 119 131 128 128
Middle Atlantic ............. 394 323 453 338 392 312 418 330 392 313 419 331 377 363 364
E. N. Central ................ 552 480 603 482 556 442 571 474 548 446 575 474 530 511 511
W. N. Central ............... 327 274 318 272 333 243 313 270 324 244 317 270 297 289 289
S. Atlantic .................... 1,040 920 1,184 939 981 911 1,145 901 1,019 883 1,160 908 1,021 985 993
E. S. Central ................ 368 301 396 307 339 289 379 292 360 282 384 293 343 325 329
W. S. Central ............... 608 582 803 534 576 548 767 527 588 557 792 536 632 605 618
Mountain ...................... 239 263 360 235 257 252 351 237 255 263 357 240 274 275 279
Pacific contiguous ....... 422 339 439 376 433 335 413 381 424 340 414 383 394 390 390
AK and HI .................... 14 12 13 13 13 12 12 13 13 12 12 13 13 13 13
Total ......................... 4,103 3,604 4,722 3,616 4,019 3,456 4,509 3,543 4,062 3,453 4,571 3,566 4,012 3,882 3,914
Commercial Sector
New England ............... 141 136 159 136 142 136 152 134 139 133 149 130 143 141 138
Middle Atlantic ............. 431 412 479 410 429 404 460 404 425 401 458 402 433 424 421
E. N. Central ................ 499 501 556 484 495 488 545 483 492 490 546 483 510 503 503
W. N. Central ............... 282 282 307 272 284 268 306 273 283 271 309 274 286 283 285
S. Atlantic .................... 811 862 975 819 801 867 957 808 800 852 960 809 867 858 856
E. S. Central ................ 242 253 296 240 234 254 292 238 237 253 294 238 258 254 255
W. S. Central ............... 501 549 637 517 500 542 635 525 513 555 651 535 551 551 564
Mountain ...................... 248 269 309 252 252 264 306 254 254 271 309 257 270 269 273
Pacific contiguous ....... 434 424 472 423 423 423 462 423 423 426 463 424 439 433 434
AK and HI .................... 16 15 16 16 15 15 16 15 15 15 16 15 16 15 15
Total ......................... 3,606 3,704 4,206 3,567 3,575 3,662 4,130 3,556 3,581 3,667 4,155 3,568 3,772 3,732 3,744
Industrial Sector
New England ............... 42 43 47 44 42 44 46 43 42 43 46 43 44 44 43
Middle Atlantic ............. 196 194 214 195 197 192 212 194 196 192 212 193 200 199 198
E. N. Central ................ 499 517 530 493 498 516 525 486 495 511 520 480 510 506 501
W. N. Central ............... 232 242 257 239 235 241 258 240 238 244 261 243 242 243 246
S. Atlantic .................... 366 388 404 370 367 380 393 359 358 371 384 350 382 375 366
E. S. Central ................ 257 261 286 261 260 263 283 256 256 258 278 251 266 266 261
W. S. Central ............... 467 500 520 486 492 507 525 488 498 514 533 494 493 503 510
Mountain ...................... 209 229 251 219 214 231 255 222 216 233 257 223 227 230 232
Pacific contiguous ....... 216 231 258 226 211 232 257 225 210 232 258 226 233 231 232
AK and HI .................... 13 13 14 14 12 13 14 14 12 13 14 14 13 13 13
Total ......................... 2,498 2,618 2,781 2,545 2,527 2,618 2,768 2,527 2,521 2,612 2,760 2,517 2,611 2,610 2,603
Total All Sectors (a)
New England ............... 325 292 361 301 324 295 340 296 322 290 337 293 320 314 311
Middle Atlantic ............. 1,033 939 1,157 954 1,029 918 1,100 938 1,023 915 1,099 935 1,021 996 993
E. N. Central ................ 1,552 1,500 1,691 1,461 1,551 1,447 1,642 1,443 1,537 1,449 1,642 1,439 1,551 1,521 1,517
W. N. Central ............... 841 798 882 782 852 752 877 782 845 760 887 787 826 816 820
S. Atlantic .................... 2,220 2,173 2,567 2,131 2,152 2,161 2,498 2,071 2,181 2,111 2,507 2,071 2,273 2,221 2,218
E. S. Central ................ 867 815 979 808 834 805 954 786 853 792 955 782 867 845 846
W. S. Central ............... 1,577 1,632 1,961 1,537 1,568 1,597 1,927 1,540 1,599 1,626 1,976 1,565 1,677 1,659 1,692
Mountain ...................... 697 762 920 706 723 747 911 714 726 768 923 721 772 774 785
Pacific contiguous ....... 1,075 996 1,172 1,028 1,069 993 1,134 1,031 1,060 1,001 1,137 1,035 1,068 1,057 1,058
AK and HI .................... 42 41 42 42 41 40 42 42 40 40 42 42 42 41 41
Total ......................... 10,229 9,947 11,731 9,749 10,143 9,755 11,427 9,646 10,186 9,752 11,506 9,670 10,416 10,245 10,280
Table 7b. U.S. Regional Electricity Retail Sales (Million Kilowatthours per Day)U.S. Energy Information Administration | Short-Term Energy Outlook - June 2019
2018 2019 2020 Year
Historical data: Latest data available from Energy Information Administration databases supporting the following reports: Electric Power Monthly , DOE/EIA-0226; and Electric Power Annual , DOE/EIA-0348. Minor discrepancies with published historical data are due to independent rounding.
Projections: EIA Regional Short-Term Energy Model.
- = no data available(a) Total retail sales to all sectors includes residential, commercial, industrial, and transportation sector sales.
Notes: The approximate break between historical and forecast values is shown with historical data printed in bold; estimates and forecasts in italics.
Retail Sales represents total retail electricity sales by electric utilities and power marketers.
Regions refer to U.S. Census divisions.
See "Census division" in EIA’s Energy Glossary (http://www.eia.doe.gov/glossary/index.html) for a list of States in each region.

Q1 Q2 Q3 Q4 Q1 Q2 Q3 Q4 Q1 Q2 Q3 Q4 2018 2019 2020
Residential Sector
New England .............. 20.56 20.57 20.39 20.64 21.05 21.09 21.24 21.31 21.56 21.45 21.53 21.67 20.53 21.17 21.55
Middle Atlantic ............ 15.62 16.21 16.34 15.80 15.20 16.17 16.32 15.62 15.07 16.15 16.42 15.80 16.00 15.83 15.86
E. N. Central ............... 12.94 13.48 13.09 13.19 12.93 13.81 13.48 13.52 13.26 14.16 13.84 13.89 13.16 13.41 13.77
W. N. Central ............. 10.90 12.63 13.10 11.39 10.71 13.07 13.52 11.73 11.10 13.51 13.96 12.13 12.00 12.21 12.64
S. Atlantic ................... 11.66 11.90 11.82 11.62 11.70 12.02 11.96 11.73 11.66 12.07 11.97 11.78 11.75 11.86 11.87
E. S. Central ............... 10.86 11.40 11.16 11.17 11.11 11.68 11.50 11.51 11.21 11.91 11.66 11.73 11.14 11.44 11.61
W. S. Central .............. 10.52 11.01 10.97 10.83 10.79 11.20 11.08 10.79 10.66 11.09 11.01 10.80 10.85 10.98 10.90
Mountain ..................... 11.58 12.24 12.26 11.76 11.51 12.33 12.43 11.95 11.72 12.58 12.70 12.22 12.00 12.09 12.34
Pacific ......................... 14.88 15.27 17.07 14.77 14.85 15.83 17.42 15.05 15.25 16.56 17.95 15.37 15.55 15.79 16.28
U.S. Average ........... 12.59 13.03 13.15 12.75 12.66 13.29 13.35 12.93 12.75 13.49 13.50 13.12 12.89 13.06 13.22
Commercial Sector
New England .............. 16.59 15.92 16.19 16.44 16.72 16.34 16.63 16.77 16.95 16.51 16.80 16.99 16.28 16.61 16.81
Middle Atlantic ............ 12.10 12.22 13.17 12.08 11.56 12.15 12.92 11.76 11.28 11.94 12.80 11.71 12.42 12.12 11.96
E. N. Central ............... 10.10 10.15 10.08 10.10 10.14 10.33 10.21 10.17 10.20 10.42 10.33 10.31 10.11 10.21 10.31
W. N. Central ............. 9.18 10.03 10.38 9.23 8.97 10.19 10.58 9.42 9.22 10.50 10.93 9.75 9.73 9.81 10.12
S. Atlantic ................... 9.61 9.30 9.18 9.41 9.45 9.36 9.24 9.41 9.39 9.30 9.19 9.39 9.36 9.36 9.31
E. S. Central ............... 10.51 10.48 10.34 10.54 10.71 10.70 10.63 10.81 10.89 10.89 10.79 11.02 10.46 10.71 10.89
W. S. Central .............. 8.37 8.17 8.12 7.94 8.15 8.10 8.01 7.76 7.96 7.98 7.92 7.71 8.15 8.00 7.89
Mountain ..................... 9.27 9.88 10.01 9.36 9.20 9.90 10.06 9.40 9.26 9.99 10.19 9.54 9.66 9.67 9.77
Pacific ......................... 12.91 14.02 15.81 14.10 12.99 14.40 16.29 14.53 13.31 14.70 16.62 14.86 14.25 14.60 14.92
U.S. Average ........... 10.54 10.60 10.89 10.55 10.41 10.71 10.97 10.59 10.42 10.74 11.02 10.67 10.66 10.68 10.73
Industrial Sector
New England .............. 13.46 12.60 12.83 12.98 13.32 12.43 12.64 12.80 13.27 12.43 12.65 12.82 12.96 12.79 12.78
Middle Atlantic ............ 7.26 6.82 6.86 6.79 6.73 6.67 6.64 6.54 6.60 6.57 6.54 6.44 6.93 6.64 6.54
E. N. Central ............... 7.10 6.96 6.99 7.01 7.02 7.02 7.00 7.01 7.08 7.09 7.07 7.07 7.01 7.01 7.08
W. N. Central ............. 7.04 7.38 7.99 6.93 7.13 7.62 8.23 7.12 7.34 7.84 8.47 7.33 7.35 7.54 7.76
S. Atlantic ................... 6.54 6.40 6.60 6.39 6.22 6.33 6.49 6.28 6.17 6.30 6.46 6.25 6.48 6.33 6.30
E. S. Central ............... 5.74 5.92 5.87 5.88 5.71 5.90 5.82 5.82 5.71 5.91 5.84 5.84 5.86 5.82 5.82
W. S. Central .............. 5.42 5.41 5.65 5.27 5.25 5.39 5.56 5.17 5.25 5.37 5.55 5.14 5.44 5.35 5.33
Mountain ..................... 6.10 6.48 6.93 6.05 6.14 6.52 6.94 6.04 6.17 6.56 6.97 6.07 6.41 6.43 6.47
Pacific ......................... 8.63 9.52 11.17 9.89 8.69 9.56 11.31 10.06 8.92 9.81 11.62 10.33 9.87 9.98 10.24
U.S. Average ........... 6.81 6.87 7.22 6.82 6.66 6.88 7.20 6.78 6.70 6.93 7.26 6.83 6.93 6.89 6.94
All Sectors (a)
New England .............. 17.86 17.16 17.49 17.58 18.11 17.53 17.95 17.96 18.43 17.78 18.18 18.24 17.53 17.90 18.17
Middle Atlantic ............ 12.50 12.47 13.23 12.30 12.02 12.36 12.99 12.04 11.83 12.25 12.97 12.07 12.65 12.37 12.30
E. N. Central ............... 10.14 10.11 10.18 10.07 10.13 10.21 10.32 10.20 10.29 10.39 10.52 10.40 10.13 10.22 10.40
W. N. Central ............. 9.26 10.12 10.66 9.27 9.14 10.30 10.93 9.51 9.41 10.61 11.29 9.82 9.85 9.98 10.30
S. Atlantic ................... 10.06 9.88 9.99 9.86 9.92 9.95 10.05 9.87 9.92 9.93 10.05 9.91 9.95 9.95 9.96
E. S. Central ............... 9.25 9.36 9.36 9.27 9.31 9.48 9.55 9.44 9.47 9.63 9.70 9.62 9.31 9.45 9.61
W. S. Central .............. 8.33 8.34 8.63 8.10 8.21 8.30 8.56 7.97 8.11 8.22 8.52 7.96 8.37 8.28 8.22
Mountain ..................... 9.12 9.68 10.05 9.13 9.12 9.67 10.10 9.20 9.21 9.84 10.26 9.35 9.54 9.56 9.71
Pacific ......................... 12.81 13.39 15.25 13.40 12.89 13.75 15.56 13.73 13.20 14.18 15.96 14.05 13.76 14.02 14.38
U.S. Average ........... 10.45 10.50 10.93 10.39 10.36 10.59 10.99 10.45 10.43 10.69 11.10 10.57 10.58 10.62 10.71
Table 7c. U.S. Regional Retail Electricity Prices (Cents per KilowatthourU.S. Energy Information Administration | Short-Term Energy Outlook - June 2019
2018 2019 2020 Year
Historical data: Latest data available from Energy Information Administration databases supporting the following reports: Electric Power Monthly , DOE/EIA-0226; and Electric Power Annual , DOE/EIA-0348.Minor discrepancies with published historical data are due to independent rounding.
Projections: EIA Regional Short-Term Energy Model.
- = no data available
Prices are not adjusted for inflation.(a) Volume-weighted average of retail prices to residential, commercial, industrial, and transportation sectors.
Notes: The approximate break between historical and forecast values is shown with historical data printed in bold; estimates and forecasts in italics.
Regions refer to U.S. Census divisions.
See "Census division" in EIA’s Energy Glossary (http://www.eia.doe.gov/glossary/index.html) for a list of States in each region.

Q1 Q2 Q3 Q4 Q1 Q2 Q3 Q4 Q1 Q2 Q3 Q4 2018 2019 2020
United States
Coal .............................................. 3,127 2,859 3,559 3,014 2,883 2,301 3,065 2,574 2,691 2,189 2,863 2,398 3,141 2,706 2,536
Natural Gas ................................... 3,455 3,806 5,135 3,677 3,799 3,943 5,122 3,764 3,786 4,037 5,258 3,832 4,022 4,160 4,230
Petroleum (a) ................................ 102 53 62 53 57 52 61 54 66 54 61 54 67 56 59
Other Gases ................................. 34 32 36 31 35 33 37 31 35 33 37 31 33 34 34
Nuclear ......................................... 2,294 2,155 2,277 2,120 2,261 2,122 2,254 2,108 2,229 2,070 2,203 2,076 2,211 2,186 2,144
Renewable Energy Sources: 2,093 2,212 1,718 1,794 1,989 2,324 1,833 2,023 2,187 2,410 2,029 2,190 1,953 2,042 2,204
Conventional Hydropower .......... 856 944 697 703 800 953 692 687 764 863 742 689 799 782 764
Wind .......................................... 869 822 582 744 825 914 676 949 1,027 1,040 765 1,072 753 841 976
Wood Biomass .......................... 119 112 115 108 110 110 119 113 112 113 120 114 113 113 115
Waste Biomass .......................... 61 58 57 58 56 56 57 57 56 57 57 57 59 57 57
Geothermal ................................ 46 44 46 47 47 44 44 44 44 43 44 46 46 45 44
Solar .......................................... 141 232 222 134 151 246 246 174 184 295 303 214 182 204 249
Pumped Storage Hydropower ....... -15 -13 -22 -15 -12 -12 -18 -14 -14 -12 -18 -14 -16 -14 -15
Other Nonrenewable Fuels (b) ...... 36 35 32 36 34 35 36 36 35 36 36 36 35 35 36
Total Generation ........................... 11,127 11,141 12,796 10,710 11,046 10,799 12,391 10,576 11,015 10,817 12,468 10,604 11,446 11,205 11,228
Northeast Census Region
Coal .............................................. 149 120 132 115 141 99 86 99 148 53 57 77 129 106 84
Natural Gas ................................... 500 527 783 562 592 576 775 604 617 657 825 629 594 637 682
Petroleum (a) ................................ 32 3 3 2 6 2 4 4 9 2 4 5 10 4 5
Other Gases ................................. 2 1 2 2 2 1 2 2 2 1 2 2 2 2 2
Nuclear ......................................... 552 507 525 497 534 474 502 456 483 438 463 437 520 492 455
Hydropower (c) ............................. 108 114 106 121 119 119 107 106 103 106 102 103 112 113 103
Other Renewables (d) ................... 80 76 71 72 74 76 71 84 87 80 72 87 75 76 82
Other Nonrenewable Fuels (b) ...... 11 10 11 11 11 11 12 12 11 11 12 12 11 11 11
Total Generation ........................... 1,435 1,359 1,634 1,381 1,480 1,359 1,558 1,366 1,460 1,349 1,537 1,350 1,452 1,441 1,424
South Census Region
Coal .............................................. 1,262 1,260 1,529 1,213 1,051 1,004 1,299 1,016 1,009 923 1,210 927 1,316 1,093 1,018
Natural Gas ................................... 2,049 2,345 2,932 2,081 2,133 2,417 2,931 2,118 2,127 2,417 3,014 2,167 2,353 2,401 2,432
Petroleum (a) ................................ 39 21 26 20 21 23 27 22 28 24 27 21 26 23 25
Other Gases ................................. 13 12 14 12 14 14 14 12 13 13 14 12 13 13 13
Nuclear ......................................... 1,008 952 1,010 936 997 969 1,026 967 1,023 960 1,031 971 976 990 996
Hydropower (c) ............................. 114 127 112 165 168 133 113 143 144 118 107 139 130 139 127
Other Renewables (d) ................... 451 494 375 402 444 519 431 493 543 610 512 566 430 472 558
Other Nonrenewable Fuels (b) ...... 16 16 11 15 15 15 14 15 15 15 14 15 15 15 15
Total Generation ........................... 4,952 5,227 6,008 4,844 4,844 5,093 5,856 4,786 4,902 5,079 5,928 4,818 5,260 5,146 5,183
Midwest Census Region
Coal .............................................. 1,303 1,140 1,386 1,188 1,221 908 1,213 1,015 1,096 892 1,176 966 1,255 1,089 1,033
Natural Gas ................................... 403 441 549 389 460 465 590 401 441 450 611 403 446 479 477
Petroleum (a) ................................ 10 7 9 8 9 8 10 8 9 9 10 7 8 9 9
Other Gases ................................. 13 12 14 12 14 12 14 12 15 12 15 12 13 13 14
Nuclear ......................................... 571 539 569 535 564 521 558 526 556 515 540 509 553 542 530
Hydropower (c) ............................. 57 58 36 40 46 62 38 35 39 55 36 34 48 45 41
Other Renewables (d) ................... 367 303 234 320 357 374 274 442 466 436 319 511 306 362 433
Other Nonrenewable Fuels (b) ...... 4 3 4 4 3 3 4 4 4 4 4 4 4 4 4
Total Generation ........................... 2,727 2,505 2,802 2,495 2,674 2,353 2,700 2,443 2,626 2,374 2,711 2,447 2,632 2,542 2,540
West Census Region
Coal .............................................. 413 339 512 497 470 291 468 444 438 321 420 428 441 418 402
Natural Gas ................................... 503 493 870 644 614 486 826 641 600 513 809 633 629 642 639
Petroleum (a) ................................ 21 21 24 24 21 19 21 21 20 19 20 20 23 20 20
Other Gases ................................. 7 7 7 6 5 6 6 6 5 6 6 6 6 6 6
Nuclear ......................................... 164 158 173 152 166 158 168 158 167 157 169 159 162 162 163
Hydropower (c) ............................. 562 632 420 363 455 628 416 389 465 571 478 399 493 471 478
Other Renewables (d) ................... 338 395 340 297 314 402 366 317 326 422 385 338 343 350 368
Other Nonrenewable Fuels (b) ...... 6 6 6 6 5 6 6 6 5 6 6 6 6 6 6
Total Generation ........................... 2,013 2,050 2,352 1,990 2,050 1,995 2,278 1,981 2,028 2,015 2,292 1,989 2,102 2,076 2,081
Table 7d. U.S. Regional Electricity Generation, All Sectors (Thousand megawatthours per day) U.S. Energy Information Administration | Short-Term Energy Outlook - June 2019
2018 2019 2020 Year
Historical data: Latest data available from U.S. Energy Information Administration Electric Power Monthly and Electric Power Annual.Projections: EIA Regional Short-Term Energy Model.
(a) Residual fuel oil, distillate fuel oil, petroleum coke, and other petroleum liquids.
(b) Batteries, chemicals, hydrogen, pitch, purchased steam, sulfur, nonrenewable waste, and miscellaneous technologies.
(c) Conventional hydroelectric and pumped storage generation.
(d) Wind, biomass, geothermal, and solar generation.
Notes: Data reflect generation supplied by electricity-only and combined-heat-and-power (CHP) plants operated by electric utilities, independent power producers, and
the commercial and industrial sectors. The approximate break between historical and forecast values is shown with historical data printed in bold; estimates and forecasts in italics.
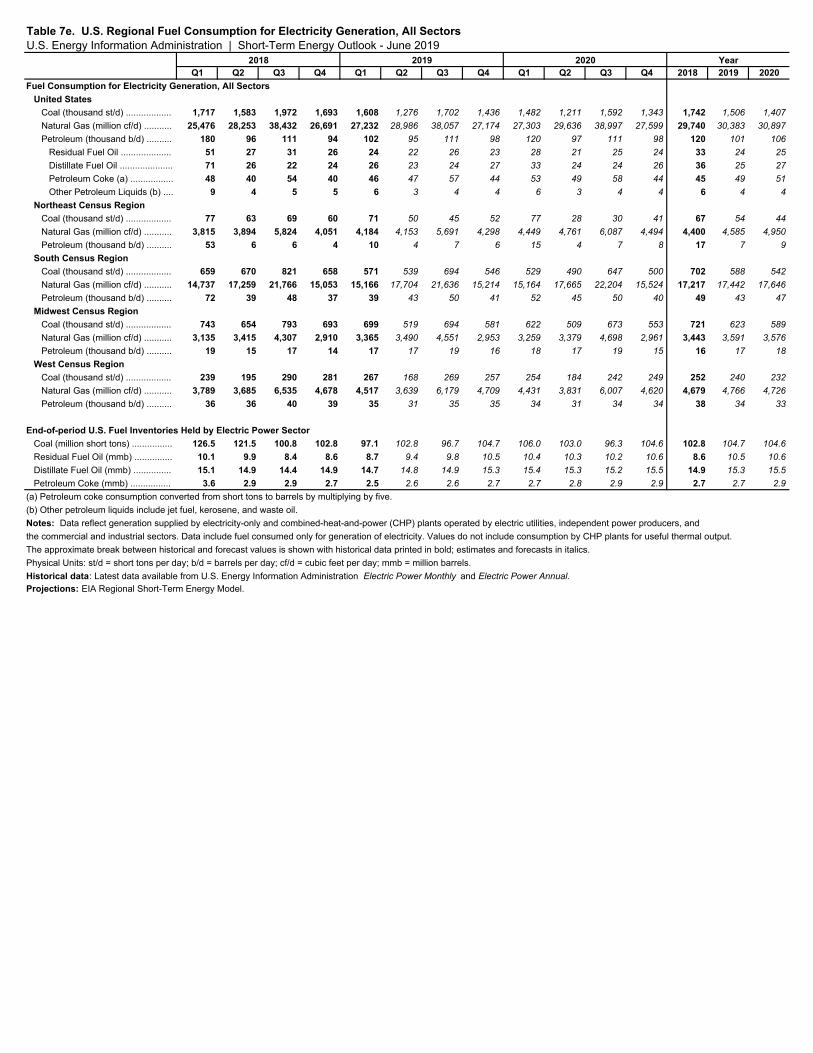
Q1 Q2 Q3 Q4 Q1 Q2 Q3 Q4 Q1 Q2 Q3 Q4 2018 2019 2020
Fuel Consumption for Electricity Generation, All Sectors
United States
Coal (thousand st/d) .................. 1,717 1,583 1,972 1,693 1,608 1,276 1,702 1,436 1,482 1,211 1,592 1,343 1,742 1,506 1,407
Natural Gas (million cf/d) ........... 25,476 28,253 38,432 26,691 27,232 28,986 38,057 27,174 27,303 29,636 38,997 27,599 29,740 30,383 30,897
Petroleum (thousand b/d) .......... 180 96 111 94 102 95 111 98 120 97 111 98 120 101 106
Residual Fuel Oil .................... 51 27 31 26 24 22 26 23 28 21 25 24 33 24 25
Distillate Fuel Oil ..................... 71 26 22 24 26 23 24 27 33 24 24 26 36 25 27
Petroleum Coke (a) ................. 48 40 54 40 46 47 57 44 53 49 58 44 45 49 51
Other Petroleum Liquids (b) .... 9 4 5 5 6 3 4 4 6 3 4 4 6 4 4
Northeast Census Region
Coal (thousand st/d) .................. 77 63 69 60 71 50 45 52 77 28 30 41 67 54 44
Natural Gas (million cf/d) ........... 3,815 3,894 5,824 4,051 4,184 4,153 5,691 4,298 4,449 4,761 6,087 4,494 4,400 4,585 4,950
Petroleum (thousand b/d) .......... 53 6 6 4 10 4 7 6 15 4 7 8 17 7 9
South Census Region
Coal (thousand st/d) .................. 659 670 821 658 571 539 694 546 529 490 647 500 702 588 542
Natural Gas (million cf/d) ........... 14,737 17,259 21,766 15,053 15,166 17,704 21,636 15,214 15,164 17,665 22,204 15,524 17,217 17,442 17,646
Petroleum (thousand b/d) .......... 72 39 48 37 39 43 50 41 52 45 50 40 49 43 47
Midwest Census Region
Coal (thousand st/d) .................. 743 654 793 693 699 519 694 581 622 509 673 553 721 623 589
Natural Gas (million cf/d) ........... 3,135 3,415 4,307 2,910 3,365 3,490 4,551 2,953 3,259 3,379 4,698 2,961 3,443 3,591 3,576
Petroleum (thousand b/d) .......... 19 15 17 14 17 17 19 16 18 17 19 15 16 17 18
West Census Region
Coal (thousand st/d) .................. 239 195 290 281 267 168 269 257 254 184 242 249 252 240 232
Natural Gas (million cf/d) ........... 3,789 3,685 6,535 4,678 4,517 3,639 6,179 4,709 4,431 3,831 6,007 4,620 4,679 4,766 4,726
Petroleum (thousand b/d) .......... 36 36 40 39 35 31 35 35 34 31 34 34 38 34 33
End-of-period U.S. Fuel Inventories Held by Electric Power Sector
Coal (million short tons) ................ 126.5 121.5 100.8 102.8 97.1 102.8 96.7 104.7 106.0 103.0 96.3 104.6 102.8 104.7 104.6
Residual Fuel Oil (mmb) ............... 10.1 9.9 8.4 8.6 8.7 9.4 9.8 10.5 10.4 10.3 10.2 10.6 8.6 10.5 10.6
Distillate Fuel Oil (mmb) ............... 15.1 14.9 14.4 14.9 14.7 14.8 14.9 15.3 15.4 15.3 15.2 15.5 14.9 15.3 15.5
Petroleum Coke (mmb) ................ 3.6 2.9 2.9 2.7 2.5 2.6 2.6 2.7 2.7 2.8 2.9 2.9 2.7 2.7 2.9
Table 7e. U.S. Regional Fuel Consumption for Electricity Generation, All SectorsU.S. Energy Information Administration | Short-Term Energy Outlook - June 2019
2018 2019 2020 Year
Historical data: Latest data available from U.S. Energy Information Administration Electric Power Monthly and Electric Power Annual.Projections: EIA Regional Short-Term Energy Model.
(a) Petroleum coke consumption converted from short tons to barrels by multiplying by five.
(b) Other petroleum liquids include jet fuel, kerosene, and waste oil.
Notes: Data reflect generation supplied by electricity-only and combined-heat-and-power (CHP) plants operated by electric utilities, independent power producers, and
the commercial and industrial sectors. Data include fuel consumed only for generation of electricity. Values do not include consumption by CHP plants for useful thermal output.
The approximate break between historical and forecast values is shown with historical data printed in bold; estimates and forecasts in italics.
Physical Units: st/d = short tons per day; b/d = barrels per day; cf/d = cubic feet per day; mmb = million barrels.

Q1 Q2 Q3 Q4 Q1 Q2 Q3 Q4 Q1 Q2 Q3 Q4 2018 2019 2020
Electric Power Sector
Geothermal ........................................... 0.038 0.037 0.039 0.039 0.038 0.037 0.037 0.037 0.037 0.036 0.037 0.039 0.154 0.150 0.149
Hydroelectric Power (a) ......................... 0.706 0.787 0.587 0.592 0.661 0.797 0.584 0.579 0.639 0.721 0.626 0.581 2.673 2.621 2.567
Solar (b) ................................................ 0.116 0.193 0.186 0.113 0.124 0.205 0.207 0.145 0.152 0.245 0.254 0.179 0.608 0.681 0.830
Waste Biomass (c) ................................. 0.073 0.070 0.067 0.069 0.066 0.067 0.069 0.068 0.067 0.067 0.068 0.067 0.280 0.269 0.270
Wood Biomass ...................................... 0.057 0.052 0.055 0.051 0.054 0.048 0.063 0.057 0.057 0.053 0.064 0.058 0.215 0.221 0.232
Wind ...................................................... 0.722 0.689 0.494 0.631 0.685 0.767 0.574 0.805 0.862 0.873 0.649 0.909 2.536 2.831 3.293
Subtotal .............................................. 1.712 1.830 1.428 1.495 1.627 1.921 1.532 1.692 1.813 1.995 1.699 1.834 6.465 6.773 7.341
Industrial Sector
Biofuel Losses and Co-products (d) ........ 0.202 0.204 0.211 0.206 0.197 0.206 0.205 0.206 0.203 0.206 0.208 0.207 0.823 0.814 0.824
Geothermal ........................................... 0.001 0.001 0.001 0.001 0.001 0.001 0.001 0.001 0.001 0.001 0.001 0.001 0.004 0.004 0.004
Hydroelectric Power (a) ......................... 0.003 0.003 0.003 0.003 0.003 0.003 0.003 0.003 0.003 0.003 0.003 0.003 0.013 0.013 0.012
Solar (b) ............................................... 0.005 0.007 0.008 0.005 0.006 0.008 0.009 0.006 0.007 0.010 0.010 0.007 0.025 0.029 0.033
Waste Biomass (c) ................................. 0.044 0.041 0.039 0.044 0.043 0.041 0.041 0.043 0.043 0.042 0.041 0.043 0.168 0.169 0.169
Wood Biomass ...................................... 0.382 0.382 0.389 0.388 0.371 0.352 0.358 0.358 0.347 0.343 0.355 0.357 1.540 1.439 1.401
Subtotal .............................................. 0.637 0.635 0.648 0.648 0.619 0.609 0.613 0.617 0.600 0.601 0.612 0.616 2.567 2.458 2.429
Commercial Sector
Geothermal ........................................... 0.005 0.005 0.005 0.005 0.006 0.005 0.005 0.005 0.005 0.005 0.005 0.005 0.020 0.022 0.022
Solar (b) ............................................... 0.019 0.029 0.029 0.020 0.022 0.033 0.034 0.025 0.028 0.041 0.041 0.030 0.096 0.114 0.140
Waste Biomass (c) ................................. 0.011 0.011 0.010 0.011 0.011 0.011 0.011 0.011 0.011 0.011 0.011 0.011 0.044 0.044 0.044
Wood Biomass ...................................... 0.021 0.021 0.021 0.021 0.021 0.021 0.022 0.021 0.021 0.021 0.022 0.021 0.084 0.084 0.084
Subtotal .............................................. 0.063 0.072 0.072 0.064 0.066 0.077 0.079 0.069 0.072 0.085 0.086 0.074 0.271 0.292 0.318
Residential Sector
Geothermal ........................................... 0.010 0.010 0.010 0.010 0.009 0.009 0.009 0.009 0.009 0.009 0.009 0.009 0.040 0.037 0.036
Solar (e) ................................................. 0.044 0.067 0.067 0.046 0.050 0.079 0.080 0.056 0.061 0.095 0.097 0.068 0.224 0.266 0.321
Wood Biomass ...................................... 0.128 0.129 0.130 0.130 0.126 0.122 0.122 0.122 0.122 0.122 0.122 0.122 0.517 0.492 0.488
Subtotal .............................................. 0.181 0.206 0.207 0.186 0.186 0.210 0.212 0.187 0.193 0.226 0.228 0.199 0.780 0.795 0.845
Transportation Sector
Biomass-based Diesel (f) ........................ 0.054 0.068 0.071 0.063 0.058 0.075 0.072 0.085 0.072 0.085 0.078 0.082 0.256 0.290 0.317
Ethanol (f) ............................................... 0.273 0.287 0.294 0.289 0.275 0.298 0.296 0.291 0.277 0.297 0.300 0.291 1.142 1.160 1.165
Subtotal .............................................. 0.327 0.355 0.365 0.351 0.334 0.373 0.368 0.376 0.349 0.382 0.377 0.374 1.398 1.451 1.482
All Sectors Total
Biomass-based Diesel (f) ........................ 0.054 0.068 0.071 0.063 0.058 0.075 0.072 0.085 0.072 0.085 0.078 0.082 0.256 0.290 0.317
Biofuel Losses and Co-products (d) ........ 0.202 0.204 0.211 0.206 0.197 0.206 0.205 0.206 0.203 0.206 0.208 0.207 0.823 0.814 0.824
Ethanol (f) ............................................... 0.283 0.297 0.305 0.300 0.285 0.308 0.307 0.302 0.287 0.308 0.311 0.302 1.185 1.202 1.209
Geothermal ........................................... 0.054 0.053 0.055 0.055 0.054 0.053 0.052 0.053 0.052 0.052 0.052 0.054 0.218 0.212 0.211
Hydroelectric Power (a) ......................... 0.710 0.791 0.590 0.596 0.664 0.801 0.587 0.583 0.642 0.725 0.630 0.585 2.688 2.635 2.582
Solar (b)(e) ............................................ 0.184 0.295 0.289 0.184 0.202 0.325 0.330 0.232 0.249 0.390 0.403 0.284 0.951 1.089 1.325
Waste Biomass (c) ................................. 0.128 0.122 0.117 0.125 0.120 0.119 0.121 0.123 0.120 0.120 0.121 0.122 0.492 0.482 0.482
Wood Biomass ...................................... 0.587 0.584 0.596 0.590 0.573 0.543 0.564 0.558 0.547 0.539 0.562 0.557 2.357 2.238 2.205
Wind ...................................................... 0.722 0.689 0.494 0.631 0.685 0.767 0.574 0.805 0.862 0.873 0.649 0.909 2.536 2.831 3.293
Total Consumption .................................. 2.920 3.097 2.721 2.745 2.864 3.190 2.804 2.941 3.027 3.288 3.003 3.097 11.482 11.799 12.415
(e) Solar consumption in the residential sector includes energy from small-scale (<1 MW) solar photovoltaic systems. Also includes solar heating consumption in all sectors.
Table 8a. U.S. Renewable Energy Consumption (Quadrillion Btu)U.S. Energy Information Administration | Short-Term Energy Outlook - June 2019
2018 2019 2020 Year
Notes: The approximate break between historical and forecast values is shown with historical data printed in bold; estimates and forecasts in italics.
Historical data: Latest data available from EIA databases supporting the following reports: Electric Power Monthly, DOE/EIA-0226 and Renewable Energy Annual, DOE/EIA-0603; Petroleum Supply Monthly, DOE/EIA-0109.
Minor discrepancies with published historical data are due to independent rounding.
Projections: EIA Regional Short-Term Energy Model.
- = no data available(a) Conventional hydroelectric power only. Hydroelectricity generated by pumped storage is not included in renewable energy.
(b) Solar consumption in the electric power, commercial, and industrial sectors includes energy produced from large scale (>1 MW) solar thermal and photovoltaic generators and small-scale (<1 MW) distributed solar photovoltaic systems.
(c) Municipal solid waste from biogenic sources, landfill gas, sludge waste, agricultural byproducts, and other biomass.
(d) Losses and co-products from the production of fuel ethanol and biomass-based diesel
(f) Fuel ethanol and biomass-based diesel consumption in the transportation sector includes production, stock change, and imports less exports. Some biomass-based diesel may be consumed in the residential sector in heating oil.

Q1 Q2 Q3 Q4 Q1 Q2 Q3 Q4 Q1 Q2 Q3 Q4 2018 2019 2020
Renewable Energy Electric Generating Capacity (megawatts, end of period)
Electric Power Sector (a)
Biomass .............................................. 7,244 7,217 7,210 7,151 6,986 7,133 7,044 7,071 7,071 7,009 7,009 7,052 7,151 7,071 7,052
Waste .............................................. 4,198 4,170 4,163 4,160 4,125 4,114 4,114 4,141 4,141 4,078 4,078 4,080 4,160 4,141 4,080
Wood ............................................... 3,046 3,046 3,046 2,991 2,861 3,020 2,930 2,930 2,930 2,930 2,930 2,972 2,991 2,930 2,972
Conventional Hydroelectric ................. 79,507 79,468 79,476 79,595 79,618 79,637 79,540 79,559 79,642 79,660 79,782 79,834 79,595 79,559 79,834
Geothermal ......................................... 2,396 2,396 2,396 2,398 2,395 2,403 2,403 2,403 2,403 2,403 2,493 2,518 2,398 2,403 2,518
Large-Scale Solar (b) .......................... 28,024 28,876 29,390 31,489 32,493 33,443 34,112 36,966 38,178 41,671 42,201 45,316 31,489 36,966 45,316
Wind ................................................... 88,661 88,793 89,702 93,683 95,928 97,567 99,832 106,151 107,558 108,807 110,041 117,021 93,683 106,151 117,021
Other Sectors (c)
Biomass .............................................. 6,657 6,635 6,622 6,622 6,622 6,635 6,635 6,657 6,657 6,657 6,657 6,649 6,622 6,657 6,649
Waste .............................................. 855 854 850 850 850 850 850 866 866 866 866 866 850 866 866
Wood ............................................... 5,802 5,781 5,772 5,772 5,772 5,785 5,785 5,791 5,791 5,791 5,791 5,784 5,772 5,791 5,784
Conventional Hydroelectric ................. 284 284 284 284 290 290 290 290 290 289 289 289 284 290 289
Large-Scale Solar (b) .......................... 354 360 368 373 375 381 381 383 383 385 385 385 373 383 385
Small-Scale Solar (d) .......................... 17,048 17,887 18,712 19,521 20,585 21,677 22,856 24,102 25,427 26,840 28,357 29,977 19,521 24,102 29,977
Residential Sector ............................ 10,155 10,660 11,179 11,664 12,440 13,151 13,932 14,761 15,650 16,606 17,645 18,764 11,664 14,761 18,764
Commercial Sector .......................... 5,501 5,778 6,026 6,286 6,533 6,853 7,189 7,542 7,913 8,303 8,712 9,141 6,286 7,542 9,141
Industrial Sector ............................... 1,391 1,449 1,507 1,571 1,612 1,673 1,735 1,799 1,864 1,931 2,000 2,071 1,571 1,799 2,071
Wind ................................................... 113 110 116 116 116 116 116 116 116 116 116 116 116 116 116
Renewable Electricity Generation (thousand megawatthours per day)
Electric Power Sector (a)
Biomass .............................................. 92 85 86 82 83 80 90 86 86 83 91 86 86 85 86
Waste .............................................. 52 49 48 49 47 48 49 48 47 48 48 48 50 48 48
Wood ............................................... 40 35 37 33 36 32 41 38 38 35 42 39 37 37 39
Conventional Hydroelectric ................. 852 939 692 698 796 948 688 682 761 858 738 684 795 778 760
Geothermal ....................................... 46 44 46 46 46 44 44 44 44 43 44 46 46 45 44
Large-Scale Solar (b) .......................... 140 230 219 133 149 244 243 171 181 292 299 211 180 202 246
Wind .................................................. 868 821 581 743 824 913 675 948 1,026 1,039 764 1,071 752 840 975
Other Sectors (c)
Biomass .............................................. 87 86 86 84 83 86 86 84 83 86 86 84 86 85 85
Waste .............................................. 78 77 77 75 74 77 77 75 74 77 77 75 77 76 76
Wood ............................................... 9 9 8 9 9 9 8 9 9 9 8 9 9 9 9
Conventional Hydroelectric ................. 5 5 4 5 4 5 4 5 4 5 4 5 5 4 4
Large-Scale Solar (b) .......................... 1 3 3 1 2 2 3 3 3 3 3 3 2 2 3
Small-Scale Solar (d) .......................... 64 97 96 66 78 117 119 84 96 145 147 104 81 99 123
Residential Sector ........................... 37 57 56 38 46 70 71 50 57 88 90 64 47 59 75
Commercial Sector ......................... 22 32 32 22 25 37 38 26 31 45 46 32 27 32 39
Industrial Sector .............................. 6 8 9 6 7 10 10 7 8 11 11 8 7 8 10
Wind .................................................. 1 1 1 1 1 1 1 1 1 1 1 1 1 1 1
Table 8b. U.S. Renewable Electricity Generation and CapacityU.S. Energy Information Administration | Short-Term Energy Outlook - June 2019
2018 2019 2020 Year
(d) Solar photovoltaic systems smaller than one megawatt, as measured in alternating current.Historical data: Latest data available from EIA databases supporting the Electric Power Monthly, DOE/EIA-0226.
Minor discrepancies with published historical data are due to independent rounding. Projections: EIA-860M database, EIA-826 Solar PV database, and EIA Regional Short-Term Energy Model.
-- = no data availableNotes: The approximate break between historical and forecast values is shown with historical data printed in bold; estimates and forecasts in italics.
(a) Power plants larger than or equal to one megawatt in size that are operated by electric utilities or independent power producers.
(b) Solar thermal and photovoltaic generating units at power plants larger than or equal to one megawatt.
(c) Businesses or individual households not primarily engaged in electric power production for sale to the public, whose generating capacity is at least
one megawatt (except for small-scale solar photovoltaic data, which consists of systems smaller than one megawatt).

Q1 Q2 Q3 Q4 Q1 Q2 Q3 Q4 Q1 Q2 Q3 Q4 2018 2019 2020
Macroeconomic
Real Gross Domestic Product
(billion chained 2012 dollars - SAAR) ........ 18,324 18,512 18,665 18,765 18,912 19,011 19,125 19,237 19,345 19,455 19,547 19,636 18,566 19,071 19,496
Real Personal Consumption Expend.
(billion chained 2012 dollars - SAAR) ........ 12,723 12,842 12,953 13,032 13,071 13,172 13,256 13,350 13,446 13,544 13,648 13,748 12,888 13,212 13,597
Real Private Fixed Investment
(billion chained 2012 dollars - SAAR) ........ 3,271 3,322 3,332 3,357 3,370 3,376 3,403 3,439 3,470 3,495 3,521 3,543 3,321 3,397 3,507
Business Inventory Change
(billion chained 2012 dollars - SAAR) ........ 36 -10 93 107 129 100 88 83 82 81 75 71 57 100 77
Real Government Expenditures
(billion chained 2012 dollars - SAAR) ........ 3,152 3,172 3,192 3,189 3,208 3,233 3,245 3,256 3,267 3,287 3,286 3,288 3,176 3,235 3,282
Real Exports of Goods & Services
(billion chained 2012 dollars - SAAR) ........ 2,518 2,574 2,542 2,553 2,577 2,590 2,626 2,662 2,698 2,729 2,757 2,781 2,547 2,614 2,741
Real Imports of Goods & Services
(billion chained 2012 dollars - SAAR) ........ 3,420 3,415 3,492 3,509 3,476 3,498 3,532 3,597 3,669 3,739 3,807 3,869 3,459 3,526 3,771
Real Disposable Personal Income
(billion chained 2012 dollars - SAAR) ........ 14,220 14,282 14,375 14,527 14,612 14,631 14,698 14,797 14,917 15,043 15,147 15,236 14,351 14,685 15,086
Non-Farm Employment
(millions) .................................................. 148.0 148.7 149.4 150.1 150.7 151.2 151.8 152.2 152.7 153.4 153.6 153.8 149.1 151.5 153.4
Civilian Unemployment Rate
(percent) .................................................. 4.1 3.9 3.8 3.8 3.9 3.6 3.5 3.4 3.4 3.4 3.4 3.4 3.9 3.6 3.4
Housing Starts
(millions - SAAR) ....................................... 1.32 1.26 1.23 1.19 1.19 1.19 1.20 1.23 1.26 1.28 1.29 1.30 1.25 1.20 1.29
Industrial Production Indices (Index, 2012=100)
Total Industrial Production ........................... 106.7 107.9 109.3 110.3 110.3 110.4 110.9 111.4 111.7 111.9 112.1 112.4 108.6 110.7 112.0
Manufacturing .......................................... 104.8 105.5 106.6 107.0 106.7 107.2 107.7 108.3 108.7 108.9 109.2 109.4 106.0 107.5 109.1
Food .................................................... 113.3 114.3 114.9 113.1 115.1 115.7 116.2 116.7 117.2 117.7 118.2 118.8 113.9 115.9 118.0
Paper ................................................... 96.0 95.9 96.0 96.0 94.8 94.2 94.0 93.9 93.6 93.3 93.2 93.1 96.0 94.3 93.3
Petroleum and Coal Products ................ 106.7 106.8 107.5 106.8 106.8 106.0 105.9 106.2 106.5 106.7 106.9 107.0 106.9 106.2 106.8
Chemicals ............................................. 98.4 100.2 101.3 101.8 101.0 101.2 101.8 102.6 103.2 103.8 104.5 105.2 100.4 101.6 104.2
Nonmetallic Mineral Products ............... 119.1 120.4 119.0 120.0 120.8 119.6 119.3 119.5 119.8 120.1 120.5 120.8 119.6 119.8 120.3
Primary Metals ...................................... 95.8 96.2 97.5 100.8 98.9 99.0 99.4 99.5 99.0 98.1 97.4 96.4 97.6 99.2 97.7
Coal-weighted Manufacturing (a) .............. 103.6 104.7 105.3 106.1 105.5 105.1 105.4 105.7 105.7 105.7 105.7 105.7 104.9 105.4 105.7
Distillate-weighted Manufacturing (a) ........ 111.3 111.8 112.2 112.0 111.9 111.3 111.5 111.8 112.0 112.2 112.4 112.6 111.8 111.6 112.3
Electricity-weighted Manufacturing (a) ....... 104.5 105.4 106.5 107.1 106.6 106.4 106.8 107.3 107.5 107.6 107.8 108.0 105.9 106.8 107.7
Natural Gas-weighted Manufacturing (a) ... 104.3 105.8 106.8 107.0 106.2 106.0 106.4 107.0 107.2 107.5 107.8 108.1 106.0 106.4 107.7
Price Indexes
Consumer Price Index (all urban consumers)
(index, 1982-1984=1.00) ............................ 2.49 2.51 2.52 2.53 2.53 2.56 2.57 2.59 2.60 2.61 2.62 2.64 2.51 2.56 2.62
Producer Price Index: All Commodities
(index, 1982=1.00) .................................... 2.00 2.01 2.03 2.04 2.00 2.02 2.03 2.03 2.03 2.03 2.03 2.04 2.02 2.02 2.03
Producer Price Index: Petroleum
(index, 1982=1.00) .................................... 1.98 2.22 2.26 2.10 1.84 2.06 2.02 1.99 1.97 2.05 2.04 1.97 2.14 1.98 2.00
GDP Implicit Price Deflator
(index, 2012=100) ..................................... 109.3 110.2 110.7 111.1 111.4 111.9 112.5 113.1 113.8 114.4 115.1 115.9 110.3 112.2 114.8
Miscellaneous
Vehicle Miles Traveled (b)
(million miles/day) ..................................... 8,198 9,192 9,114 8,810 8,239 9,326 9,247 8,934 8,414 9,428 9,337 9,023 8,831 8,939 9,051
Air Travel Capacity
(Available ton-miles/day, thousands) .......... 603 664 667 661 631 660 671 646 625 658 667 645 649 652 649
Aircraft Utilization
(Revenue ton-miles/day, thousands) .......... 368 414 418 394 377 423 429 406 386 421 427 406 398 409 410
Airline Ticket Price Index
(index, 1982-1984=100) ............................. 262.8 277.9 259.7 259.3 255.7 286.7 292.9 319.9 336.7 354.8 327.8 342.6 264.9 288.8 340.5
Raw Steel Production
(million short tons per day) ........................ 0.251 0.253 0.263 0.270 0.273 0.270 0.260 0.259 0.263 0.265 0.259 0.261 0.259 0.265 0.262
Carbon Dioxide (CO2) Emissions (million metric tons)
Petroleum ................................................... 578 591 601 599 574 590 605 599 579 588 608 600 2,369 2,367 2,376
Natural Gas ................................................ 478 349 370 431 506 356 374 437 500 361 382 437 1,629 1,673 1,680
Coal ............................................................ 307 287 355 310 290 238 314 271 275 228 293 256 1,259 1,113 1,051
Total Energy (c) .......................................... 1,366 1,231 1,329 1,342 1,373 1,187 1,295 1,309 1,357 1,180 1,286 1,295 5,268 5,164 5,118
SAAR = Seasonally-adjusted annual rate
Table 9a. U.S. Macroeconomic Indicators and CO2 EmissionsU.S. Energy Information Administration | Short-Term Energy Outlook - June 2019
2018 2019 2020 Year
and Federal Aviation Administration. Minor discrepancies with published historical data are due to independent rounding.
Projections: EIA Regional Short-Term Energy Model. U.S. macroeconomic projections are based on the IHS Markit model of the U.S. Economy.
- = no data available
(a) Fuel share weights of individual sector indices based on EIA Manufacturing Energy Consumption Survey .
(b) Total highway travel includes gasoline and diesel fuel vehicles.
(c) Includes electric power sector use of geothermal energy and non-biomass waste.
Notes: The approximate break between historical and forecast values is shown with historical data printed in bold; estimates and forecasts in italics.
Historical data : Latest data available from U.S. Department of Commerce, Bureau of Economic Analysis; Federal Reserve System, Statistical release G17; Federal Highway Administration;

Q1 Q2 Q3 Q4 Q1 Q2 Q3 Q4 Q1 Q2 Q3 Q4 2018 2019 2020Real Gross State Product (Billion $2009)
New England ................ 971 973 981 985 993 998 1,002 1,008 1,013 1,019 1,023 1,027 978 1,000 1,020
Middle Atlantic .............. 2,720 2,748 2,768 2,776 2,797 2,809 2,822 2,836 2,849 2,864 2,874 2,884 2,753 2,816 2,868
E. N. Central ................. 2,483 2,494 2,519 2,528 2,544 2,552 2,562 2,575 2,587 2,595 2,601 2,608 2,506 2,558 2,598
W. N. Central ................ 1,150 1,168 1,173 1,177 1,184 1,189 1,195 1,200 1,205 1,211 1,216 1,221 1,167 1,192 1,213
S. Atlantic ..................... 3,259 3,286 3,325 3,339 3,367 3,386 3,408 3,429 3,451 3,474 3,493 3,513 3,302 3,397 3,483
E. S. Central ................. 812 821 827 831 836 840 844 848 853 857 860 863 823 842 858
W. S. Central ................ 2,225 2,248 2,263 2,294 2,313 2,327 2,343 2,359 2,375 2,393 2,409 2,423 2,258 2,336 2,400
Mountain ....................... 1,197 1,210 1,224 1,234 1,245 1,254 1,263 1,271 1,279 1,289 1,297 1,305 1,216 1,258 1,293
Pacific ........................... 3,540 3,597 3,616 3,636 3,668 3,691 3,720 3,744 3,767 3,790 3,809 3,827 3,597 3,706 3,798
Industrial Output, Manufacturing (Index, Year 2012=100)
New England ................ 98.8 99.2 99.7 99.6 98.6 99.0 99.4 99.7 99.9 100.0 100.2 100.3 99.3 99.2 100.1
Middle Atlantic .............. 98.6 99.0 99.6 99.8 98.8 99.1 99.5 99.9 100.2 100.3 100.5 100.6 99.3 99.3 100.4
E. N. Central ................. 107.6 108.2 109.2 109.3 108.6 108.8 109.3 110.0 110.4 110.2 110.3 110.4 108.6 109.2 110.3
W. N. Central ................ 104.2 104.9 106.2 106.7 106.4 106.8 107.3 107.9 108.4 108.7 109.0 109.3 105.5 107.1 108.8
S. Atlantic ..................... 108.8 109.7 110.7 110.9 111.1 111.6 112.1 112.7 113.0 113.2 113.5 113.6 110.0 111.9 113.3
E. S. Central ................. 109.8 110.2 111.2 111.8 111.4 111.8 112.4 113.0 113.5 113.6 113.8 114.0 110.7 112.2 113.7
W. S. Central ................ 98.7 99.7 100.9 101.6 102.2 102.8 103.5 104.1 104.6 105.1 105.4 105.7 100.2 103.1 105.2
Mountain ....................... 112.2 113.5 115.3 116.4 116.4 116.9 117.7 118.4 119.0 119.5 120.0 120.3 114.3 117.3 119.7
Pacific ........................... 104.5 105.1 105.7 106.5 106.6 107.1 107.6 108.1 108.5 108.8 109.2 109.5 105.4 107.4 109.0
Real Personal Income (Billion $2009)
New England ................ 858 856 861 868 874 876 879 884 891 898 903 907 861 878 900
Middle Atlantic .............. 2,216 2,226 2,239 2,252 2,266 2,270 2,279 2,291 2,306 2,322 2,335 2,345 2,233 2,276 2,327
E. N. Central ................. 2,342 2,341 2,358 2,380 2,398 2,401 2,410 2,425 2,442 2,459 2,472 2,482 2,355 2,408 2,464
W. N. Central ................ 1,084 1,092 1,094 1,111 1,114 1,113 1,117 1,125 1,134 1,145 1,153 1,161 1,095 1,117 1,149
S. Atlantic ..................... 3,079 3,086 3,118 3,146 3,172 3,180 3,199 3,224 3,254 3,286 3,312 3,336 3,107 3,194 3,297
E. S. Central ................. 861 865 870 877 883 884 888 893 900 906 912 916 868 887 908
W. S. Central ................ 1,876 1,886 1,897 1,919 1,933 1,937 1,948 1,962 1,981 2,000 2,015 2,028 1,894 1,945 2,006
Mountain ....................... 1,102 1,105 1,117 1,129 1,139 1,142 1,149 1,158 1,169 1,182 1,192 1,201 1,113 1,147 1,186
Pacific ........................... 2,671 2,690 2,704 2,728 2,741 2,748 2,762 2,782 2,805 2,831 2,852 2,869 2,698 2,758 2,839
Households (Thousands)
New England ................ 5,914 5,926 5,944 5,955 5,965 5,971 5,982 5,992 6,003 6,016 6,023 6,032 5,955 5,992 6,032
Middle Atlantic .............. 16,210 16,249 16,300 16,331 16,355 16,369 16,396 16,424 16,452 16,484 16,504 16,525 16,331 16,424 16,525
E. N. Central ................. 19,003 19,037 19,090 19,121 19,149 19,168 19,200 19,234 19,268 19,314 19,347 19,380 19,121 19,234 19,380
W. N. Central ................ 8,604 8,627 8,658 8,680 8,701 8,718 8,740 8,763 8,786 8,811 8,832 8,852 8,680 8,763 8,852
S. Atlantic ..................... 25,469 25,561 25,679 25,771 25,861 25,943 26,036 26,131 26,227 26,332 26,420 26,507 25,771 26,131 26,507
E. S. Central ................. 7,626 7,641 7,665 7,682 7,699 7,714 7,733 7,753 7,772 7,793 7,811 7,828 7,682 7,753 7,828
W. S. Central ................ 14,686 14,731 14,793 14,843 14,891 14,936 14,989 15,044 15,101 15,162 15,214 15,267 14,843 15,044 15,267
Mountain ....................... 9,244 9,292 9,349 9,394 9,437 9,475 9,518 9,559 9,602 9,647 9,687 9,726 9,394 9,559 9,726
Pacific ........................... 18,859 18,903 18,966 19,010 19,055 19,094 19,148 19,203 19,260 19,321 19,371 19,422 19,010 19,203 19,422
Total Non-farm Employment (Millions)
New England ................ 7.4 7.4 7.5 7.5 7.5 7.5 7.5 7.6 7.6 7.6 7.6 7.6 7.5 7.5 7.6
Middle Atlantic .............. 19.7 19.8 19.9 19.9 20.0 20.1 20.1 20.2 20.2 20.3 20.3 20.3 19.8 20.1 20.3
E. N. Central ................. 22.1 22.2 22.2 22.3 22.4 22.5 22.5 22.6 22.6 22.7 22.6 22.7 22.2 22.5 22.6
W. N. Central ................ 10.7 10.7 10.8 10.8 10.8 10.8 10.8 10.9 10.9 10.9 10.9 10.9 10.7 10.8 10.9
S. Atlantic ..................... 28.5 28.6 28.7 28.9 29.1 29.2 29.3 29.4 29.5 29.7 29.8 29.8 28.7 29.2 29.7
E. S. Central ................. 8.1 8.2 8.2 8.2 8.3 8.3 8.3 8.4 8.4 8.4 8.4 8.4 8.2 8.3 8.4
W. S. Central ................ 17.3 17.4 17.5 17.6 17.6 17.7 17.8 17.9 18.0 18.1 18.1 18.2 17.4 17.8 18.1
Mountain ....................... 10.7 10.8 10.9 10.9 11.0 11.1 11.1 11.2 11.2 11.3 11.3 11.4 10.8 11.1 11.3
Pacific ........................... 23.3 23.4 23.5 23.6 23.7 23.8 23.9 24.0 24.1 24.2 24.2 24.3 23.5 23.9 24.2
Table 9b. U.S. Regional Macroeconomic DataU.S. Energy Information Administration | Short-Term Energy Outlook - June 2019
2018 2019 2020 Year
Projections: Macroeconomic projections are based on the IHS Markit model of the U.S. Economy.
- = no data availableNotes: The approximate break between historical and forecast values is shown with historical data printed in bold; estimates and forecasts in italics.
Regions refer to U.S. Census divisions.
See "Census division" in EIA’s Energy Glossary (http://www.eia.doe.gov/glossary/index.html) for a list of States in each region.
Historical data: Latest data available from U.S. Department of Commerce, Bureau of Economic Analysis; Federal Reserve System, Statistical release G17.
Minor discrepancies with published historical data are due to independent rounding.
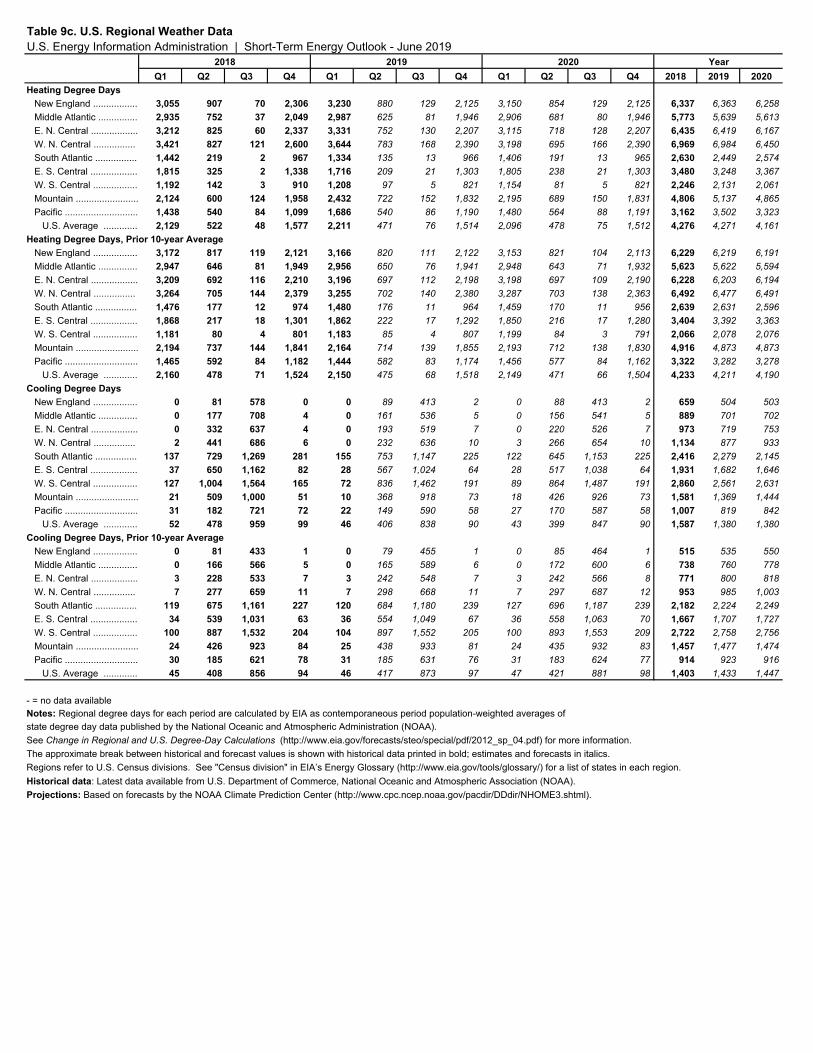
Q1 Q2 Q3 Q4 Q1 Q2 Q3 Q4 Q1 Q2 Q3 Q4 2018 2019 2020
Heating Degree Days
New England ................. 3,055 907 70 2,306 3,230 880 129 2,125 3,150 854 129 2,125 6,337 6,363 6,258
Middle Atlantic ............... 2,935 752 37 2,049 2,987 625 81 1,946 2,906 681 80 1,946 5,773 5,639 5,613
E. N. Central .................. 3,212 825 60 2,337 3,331 752 130 2,207 3,115 718 128 2,207 6,435 6,419 6,167
W. N. Central ................ 3,421 827 121 2,600 3,644 783 168 2,390 3,198 695 166 2,390 6,969 6,984 6,450
South Atlantic ................ 1,442 219 2 967 1,334 135 13 966 1,406 191 13 965 2,630 2,449 2,574
E. S. Central .................. 1,815 325 2 1,338 1,716 209 21 1,303 1,805 238 21 1,303 3,480 3,248 3,367
W. S. Central ................. 1,192 142 3 910 1,208 97 5 821 1,154 81 5 821 2,246 2,131 2,061
Mountain ........................ 2,124 600 124 1,958 2,432 722 152 1,832 2,195 689 150 1,831 4,806 5,137 4,865
Pacific ............................ 1,438 540 84 1,099 1,686 540 86 1,190 1,480 564 88 1,191 3,162 3,502 3,323
U.S. Average ............. 2,129 522 48 1,577 2,211 471 76 1,514 2,096 478 75 1,512 4,276 4,271 4,161
Heating Degree Days, Prior 10-year Average
New England ................. 3,172 817 119 2,121 3,166 820 111 2,122 3,153 821 104 2,113 6,229 6,219 6,191
Middle Atlantic ............... 2,947 646 81 1,949 2,956 650 76 1,941 2,948 643 71 1,932 5,623 5,622 5,594
E. N. Central .................. 3,209 692 116 2,210 3,196 697 112 2,198 3,198 697 109 2,190 6,228 6,203 6,194
W. N. Central ................ 3,264 705 144 2,379 3,255 702 140 2,380 3,287 703 138 2,363 6,492 6,477 6,491
South Atlantic ................ 1,476 177 12 974 1,480 176 11 964 1,459 170 11 956 2,639 2,631 2,596
E. S. Central .................. 1,868 217 18 1,301 1,862 222 17 1,292 1,850 216 17 1,280 3,404 3,392 3,363
W. S. Central ................. 1,181 80 4 801 1,183 85 4 807 1,199 84 3 791 2,066 2,078 2,076
Mountain ........................ 2,194 737 144 1,841 2,164 714 139 1,855 2,193 712 138 1,830 4,916 4,873 4,873
Pacific ............................ 1,465 592 84 1,182 1,444 582 83 1,174 1,456 577 84 1,162 3,322 3,282 3,278
U.S. Average ............. 2,160 478 71 1,524 2,150 475 68 1,518 2,149 471 66 1,504 4,233 4,211 4,190
Cooling Degree Days
New England ................. 0 81 578 0 0 89 413 2 0 88 413 2 659 504 503
Middle Atlantic ............... 0 177 708 4 0 161 536 5 0 156 541 5 889 701 702
E. N. Central .................. 0 332 637 4 0 193 519 7 0 220 526 7 973 719 753
W. N. Central ................ 2 441 686 6 0 232 636 10 3 266 654 10 1,134 877 933
South Atlantic ................ 137 729 1,269 281 155 753 1,147 225 122 645 1,153 225 2,416 2,279 2,145
E. S. Central .................. 37 650 1,162 82 28 567 1,024 64 28 517 1,038 64 1,931 1,682 1,646
W. S. Central ................. 127 1,004 1,564 165 72 836 1,462 191 89 864 1,487 191 2,860 2,561 2,631
Mountain ........................ 21 509 1,000 51 10 368 918 73 18 426 926 73 1,581 1,369 1,444
Pacific ............................ 31 182 721 72 22 149 590 58 27 170 587 58 1,007 819 842
U.S. Average ............. 52 478 959 99 46 406 838 90 43 399 847 90 1,587 1,380 1,380
Cooling Degree Days, Prior 10-year Average
New England ................. 0 81 433 1 0 79 455 1 0 85 464 1 515 535 550
Middle Atlantic ............... 0 166 566 5 0 165 589 6 0 172 600 6 738 760 778
E. N. Central .................. 3 228 533 7 3 242 548 7 3 242 566 8 771 800 818
W. N. Central ................ 7 277 659 11 7 298 668 11 7 297 687 12 953 985 1,003
South Atlantic ................ 119 675 1,161 227 120 684 1,180 239 127 696 1,187 239 2,182 2,224 2,249
E. S. Central .................. 34 539 1,031 63 36 554 1,049 67 36 558 1,063 70 1,667 1,707 1,727
W. S. Central ................. 100 887 1,532 204 104 897 1,552 205 100 893 1,553 209 2,722 2,758 2,756
Mountain ........................ 24 426 923 84 25 438 933 81 24 435 932 83 1,457 1,477 1,474
Pacific ............................ 30 185 621 78 31 185 631 76 31 183 624 77 914 923 916
U.S. Average ............. 45 408 856 94 46 417 873 97 47 421 881 98 1,403 1,433 1,447
Table 9c. U.S. Regional Weather DataU.S. Energy Information Administration | Short-Term Energy Outlook - June 2019
2018 2019 2020 Year
Historical data: Latest data available from U.S. Department of Commerce, National Oceanic and Atmospheric Association (NOAA).
Projections: Based on forecasts by the NOAA Climate Prediction Center (http://www.cpc.ncep.noaa.gov/pacdir/DDdir/NHOME3.shtml).
- = no data availableNotes: Regional degree days for each period are calculated by EIA as contemporaneous period population-weighted averages of
state degree day data published by the National Oceanic and Atmospheric Administration (NOAA).
See Change in Regional and U.S. Degree-Day Calculations (http://www.eia.gov/forecasts/steo/special/pdf/2012_sp_04.pdf) for more information.
The approximate break between historical and forecast values is shown with historical data printed in bold; estimates and forecasts in italics.
Regions refer to U.S. Census divisions. See "Census division" in EIA’s Energy Glossary (http://www.eia.gov/tools/glossary/) for a list of states in each region.

Appendix to the June 2019 Short-Term Energy Outlook
Table a1. Summary of Estimated Petroleum and Other Liquids Quantities April 2019 May 2019 April 2019 –
May 2019 Average
April 2018 – May 2018 Average
2016 – 2018 Average
Global Petroleum and Other Liquids (million barrels per day)
Global Petroleum and Other Liquids Production (a) 100.1 100.2 100.1 99.5 98.8 Global Petroleum and Other Liquids Consumption (b) 99.9 99.7 99.8 99.0 98.4 Biofuels Production (c) 2.5 2.8 2.7 2.7 2.5 Biofuels Consumption (c) 2.4 2.4 2.4 2.3 2.3 Iran Liquid Fuels Production 3.3 3.0 3.1 4.7 4.5 Iran Liquid Fuels Consumption 1.9 2.0 2.0 1.7 1.8 Petroleum and Petroleum Products Produced and Consumed in Countries Other Than Iran (million barrels per day)
Production (d) 94.3 94.3 94.3 92.1 91.8 Consumption (d) 95.6 95.3 95.5 94.9 94.4 Production minus Consumption -1.4 -1.0 -1.2 -2.8 -2.6 World Inventory Net Withdrawals Including Iran -0.1 -0.4 -0.3 -0.5 -0.3 Estimated OECD Inventory Level (e) (million barrels) 2,864 2,902 2,883 2,813 2,960 Surplus Production Capacity (million barrels per day)
OPEC Surplus Crude Oil Production Capacity (f) 2.2 2.2 2.2 1.9 1.6
Note: The term “petroleum and other liquids” encompasses crude oil, lease condensate, natural gas liquids, biofuels, coal-to-liquids, gas-to-liquids, and refinery processing gains, which are important to consider in concert due to the inter-related supply, demand, and price dynamics of petroleum, petroleum products, and related fuels. (a) Production includes crude oil (including lease condensates), natural gas liquids, other liquids, and refinery processing gains. (b) Consumption of petroleum by the OECD countries is synonymous with “products supplied," defined in the glossary of the EIA Petroleum Supply Monthly, DOE/EIA-0109. Consumption of petroleum by the non-OECD countries is "apparent consumption," which includes internal consumption, refinery fuel, and loss, and bunkering. (c) Biofuels production and consumption are based on EIA estimates as published in the International Energy Statistics. Biofuels production in the third quarter tends to be at its highest level in the year as ethanol production in Brazil reaches its seasonal peak and is typically lowest in the first quarter as seasonal production falls in the South/South-Central region of Brazil.
This appendix is prepared in fulfillment of section 1245(d)(4)(A) of the National Defense Authorization Act (NDAA) for Fiscal
Year 2012, as amended. The law requires the U.S. Energy Information Administration (EIA), the statistical and analytical
agency within the U.S. Department of Energy, to submit to Congress a report on the availability and price of petroleum and
petroleum products produced in countries other than Iran in the two-month period preceding the submission of the
report. By law, EIA’s data, analyses, and forecasts are independent of approval by any other officer or employee of the U.S.
Government. The data in this appendix, therefore, should not be construed as representing those of the U.S. Department
of Energy or other federal agencies.
EIA consulted with the U.S. Department of the Treasury, the U.S. Department of State, and the intelligence community in
the process of developing the NDAA report, which was previously published as a stand-alone report. Detailed background
and contextual information not repeated here can be found in early editions of the NDAA report.
This appendix is published in the Short-Term Energy Outlook in even numbered months.

(d) Global production of petroleum and petroleum products outside of Iran is derived by subtracting biofuels production and Iran liquid fuels production from global liquid fuels production. The same method is used to calculate global consumption outside of Iran. (e) Estimated inventory level is for OECD countries only. (f) EIA defines surplus oil production capacity as potential oil production that could be brought online within 30 days and sustained for at least 90 days, consistent with sound business practices. This does not include oil production increases that could not be sustained without degrading the future production capacity of a field. Source: U.S. Energy Information Administration.
Table a2. Crude Oil and Petroleum Product Price Data Item April 2019 May 2019 April 2019 –
May 2019 Average
April 2018 – May 2018 Average
2016 – 2018 Average
Brent Front Month Futures Price ($ per barrel) 71.63 70.30 70.95 74.45 57.19 WTI Front Month Futures Price ($ per barrel) 63.87 60.87 62.34 68.20 53.07 Dubai Front Month Futures Price ($ per barrel) 71.20 69.85 70.51 71.62 55.04 Brent 1st - 13th Month Futures Spread ($ per barrel) 4.15 5.28 4.73 5.23 -0.56 WTI 1st - 13th Month Futures Spread ($ per barrel) 2.80 2.24 2.51 5.44 -0.92 RBOB Front Month Futures Price ($ per gallon) 2.04 1.98 2.01 2.12 1.65 Heating Oil Front Month Futures Price ($ per gallon) 2.06 2.03 2.05 2.15 1.71 RBOB - Brent Futures Crack Spread ($ per gallon) 0.33 0.30 0.32 0.34 0.29 Heating Oil - Brent Futures Crack Spread ($ per gallon) 0.36 0.36 0.36 0.37 0.35
(a) Brent refers to Brent crude oil traded on the Intercontinental Exchange (ICE). (b) WTI refers to West Texas Intermediate crude oil traded on the New York Mercantile Exchange (NYMEX), owned by Chicago Mercantile Exchange (CME) Group. (c) RBOB refers to reformulated blendstock for oxygenate blending traded on the NYMEX. Source: U.S. Energy Information Administration, based on Chicago Mercantile Exchange (CME), Intercontinental Exchange (ICE), and Dubai Mercantile Exchange (DME).
Related Documents