SHOPPING CENTRES – THE CHANGING FACE KNIGHT FRANK RETAIL APRIL 2022

Welcome message from author
This document is posted to help you gain knowledge. Please leave a comment to let me know what you think about it! Share it to your friends and learn new things together.
Transcript
SHOPPING CENTRES – THE CHANGING FACE
KNIGHT FRANK RETAIL
APRIL 2022
1
TABLE OF CONTENTS
1. KEY FINDINGS 2
2. INTRODUCTION AND METHODOLOGY 3
3. INCOME PERFORMANCE BY CATEGORY 3
4. COVID VS PRE-COVID 5
5. CHANGING INCOME PROFILES – REGIONAL VS LOCAL 6
6. VACANCY RATES 9
7. CONCLUSIONS 10
Knight Frank’s Commercial Research Team specialises in the collation, analysis and presentation of empirical datasets. Any information, datasets and/or visualisations prepared by Knight Frank Commercial Research under this project will be provided to the Client as general information only and is not to be relied upon in any way. Although high standards will be used in the preparation of the information, analysis, views and emprojections presented as part of this project’s output, no responsibility or liability whatsoever can be accepted by Knight Frank LLP for any loss or damage resultant from any use of, reliance on or reference to the contents of this project. As general information, material produced as part of this project will not necessarily represent the view of Knight Frank LLP in relation to particular properties or projects. Reproduction of this project’s output in whole or in part will not be allowed without prior written approval of Knight Frank LLP to the form and content within which it appears. Knight Frank LLP is a limited liability partnership registered in England with registered number OC305934. Our registered office is 55 Baker Street, London, W1U 8AN, where you may look at a list of members’ names.
2
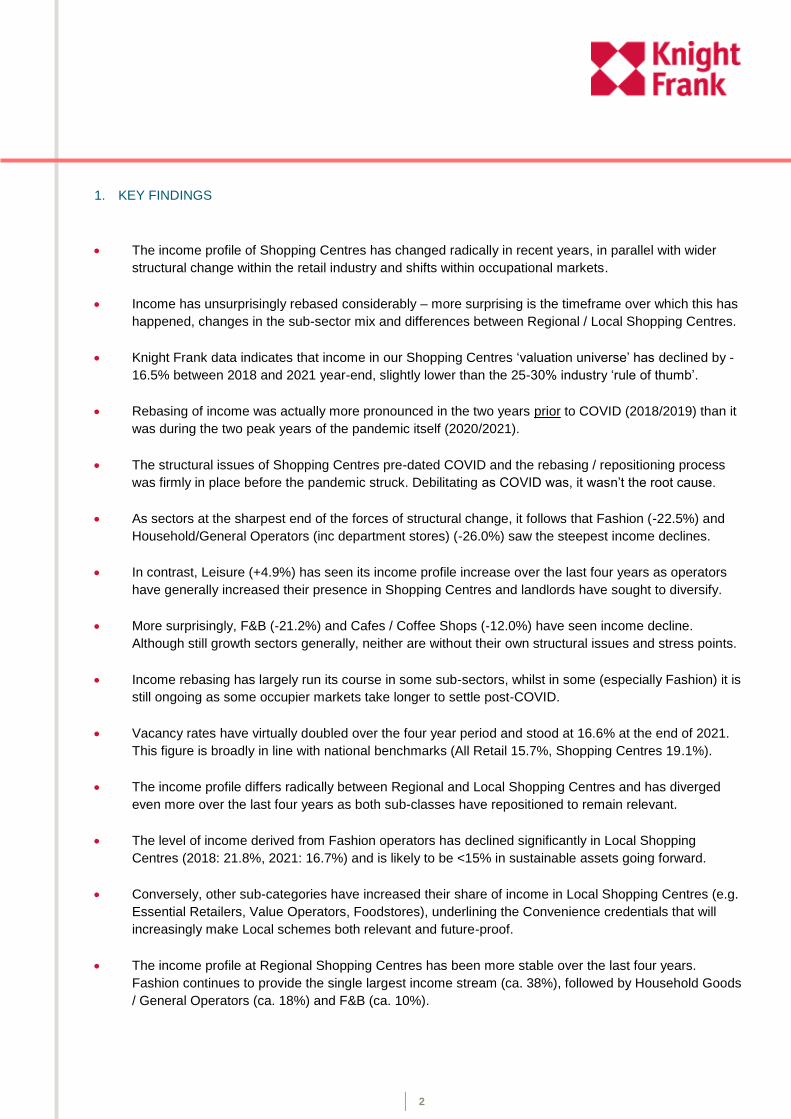
1. KEY FINDINGS
The income profile of Shopping Centres has changed radically in recent years, in parallel with wider
structural change within the retail industry and shifts within occupational markets.
Income has unsurprisingly rebased considerably – more surprising is the timeframe over which this has
happened, changes in the sub-sector mix and differences between Regional / Local Shopping Centres.
Knight Frank data indicates that income in our Shopping Centres ‘valuation universe’ has declined by -
16.5% between 2018 and 2021 year-end, slightly lower than the 25-30% industry ‘rule of thumb’.
Rebasing of income was actually more pronounced in the two years prior to COVID (2018/2019) than it
was during the two peak years of the pandemic itself (2020/2021).
The structural issues of Shopping Centres pre-dated COVID and the rebasing / repositioning process
was firmly in place before the pandemic struck. Debilitating as COVID was, it wasn’t the root cause.
As sectors at the sharpest end of the forces of structural change, it follows that Fashion (-22.5%) and
Household/General Operators (inc department stores) (-26.0%) saw the steepest income declines.
In contrast, Leisure (+4.9%) has seen its income profile increase over the last four years as operators
have generally increased their presence in Shopping Centres and landlords have sought to diversify.
More surprisingly, F&B (-21.2%) and Cafes / Coffee Shops (-12.0%) have seen income decline.
Although still growth sectors generally, neither are without their own structural issues and stress points.
Income rebasing has largely run its course in some sub-sectors, whilst in some (especially Fashion) it is
still ongoing as some occupier markets take longer to settle post-COVID.
Vacancy rates have virtually doubled over the four year period and stood at 16.6% at the end of 2021.
This figure is broadly in line with national benchmarks (All Retail 15.7%, Shopping Centres 19.1%).
The income profile differs radically between Regional and Local Shopping Centres and has diverged
even more over the last four years as both sub-classes have repositioned to remain relevant.
The level of income derived from Fashion operators has declined significantly in Local Shopping
Centres (2018: 21.8%, 2021: 16.7%) and is likely to be <15% in sustainable assets going forward.
Conversely, other sub-categories have increased their share of income in Local Shopping Centres (e.g.
Essential Retailers, Value Operators, Foodstores), underlining the Convenience credentials that will
increasingly make Local schemes both relevant and future-proof.
The income profile at Regional Shopping Centres has been more stable over the last four years.
Fashion continues to provide the single largest income stream (ca. 38%), followed by Household Goods
/ General Operators (ca. 18%) and F&B (ca. 10%).
3
Leisure is increasing its share of income at both Regional and Local Shopping Centres as landlords
across the board look to diversify and evolve their proposition.
Those Shopping Centres caught between the stools of being Local Convenience and Regional
Destinations arguably face the most challenges in (re-)establishing a sense of purpose and relevance.
There is no ‘one size fits all’ blueprint for Shopping Centres – an enduring and successful scheme will
always be one that reflects the needs and aspirations of the town and catchment audience it serves,
and this is unique to every location.
2. INTRODUCTION AND METHODOLOGY
This analysis has been conducted using anonymised Shopping Centre data from Knight Frank’s Retail Valuation Practice.
Knight Frank is one of the UK’s leading Shopping Centre Valuers. We have around 150 dedicated valuation specialists across all sectors .As a major contributor to MSCI indices (ca.35% of Monthly and ca. 25% of Quarterly Indices) we value retail assets worth in excess of £76 billion across the country, reporting to Institutions, Funds, REITs, Private Equity and Lenders.
We have collated all the Shopping Centre occupational data we hold into a single workspace (which we refer to as the ‘KF Valuation Universe’). This ‘Universe’ encompasses ca. 25 individual landlords and ca. 3,800 units, across ca. 60 assets. These range from small local schemes (<10 units) though to major regional shopping malls (>350 units).
From the workspace, we have aggregated the following:
- Income by sub-sector / category
- Spread over a four year time horizon (2018 – 2021 inclusive)
- Broken down by Local and Regional Shopping Centres
- Vacancy rates.
Using this core anonymised dataset, we have been able to analyse:
- Changes in overall Shopping Centre income over the last four years
- Changes in income by sub-sector / category
- The income profile of Local vs Regional Shopping Centres
- Shifts in income profile over the last four years
- Projections for future income profiles at both classes of Shopping Centre
- Changes in vacancy rates.
3. INCOME PERFORMANCE BY CATEGORY
In terms of overall income performance, the findings are both blindingly obvious and highly surprising in almost equal measure. On the overwhelmingly obvious side, overall Shopping Centre income has rebased significantly over the total timeframe covered (FYs 2018 – 2021). Across all categories, income has declined by -16.5%, perhaps slightly lower than the unsubstantiated ‘rule of thumb’ of between -25% and -30%.
Shifts in income over time are largely a reflection of two fundamental moving parts – rebasing of rent and changes in tenant mix. Some sectors have retrenched / downsized their presence in Shopping Centres over
4
the last four years and there is also strong correlation with these sectors and level of rental correction. Conversely, other sectors may have increased their profile – such is the evolution of Shopping Centres.
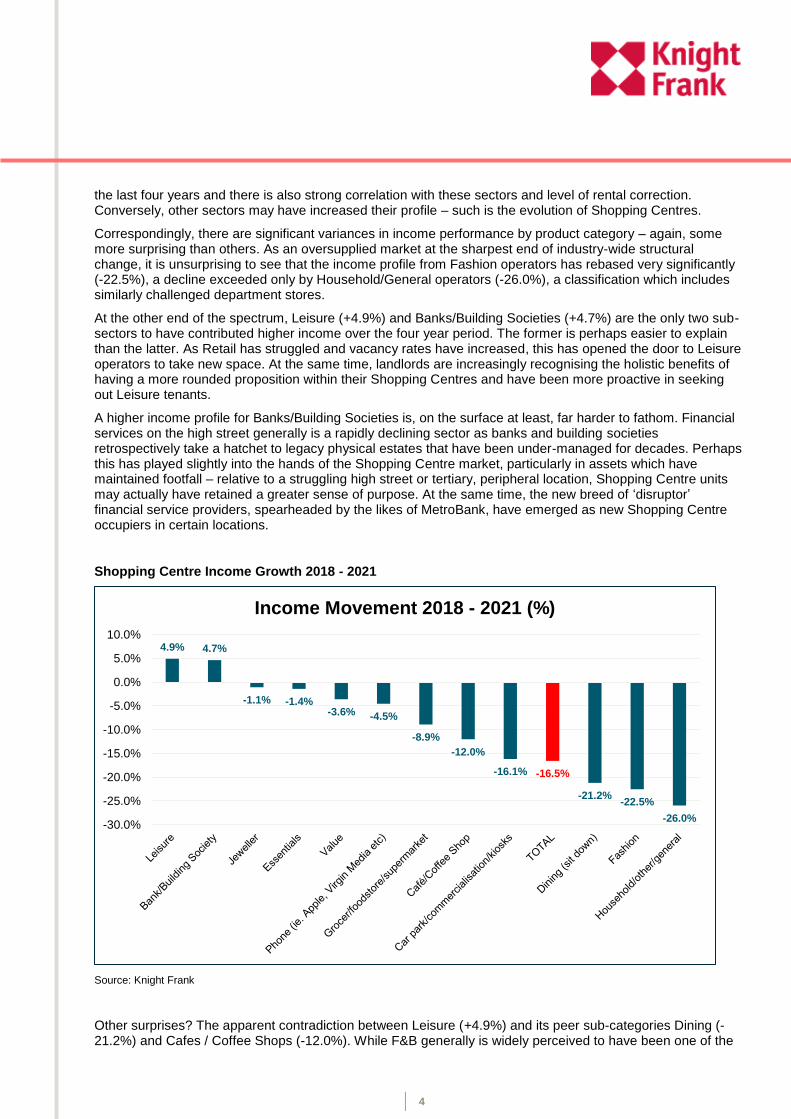
Correspondingly, there are significant variances in income performance by product category – again, some more surprising than others. As an oversupplied market at the sharpest end of industry-wide structural change, it is unsurprising to see that the income profile from Fashion operators has rebased very significantly (-22.5%), a decline exceeded only by Household/General operators (-26.0%), a classification which includes similarly challenged department stores.
At the other end of the spectrum, Leisure (+4.9%) and Banks/Building Societies (+4.7%) are the only two sub-sectors to have contributed higher income over the four year period. The former is perhaps easier to explain than the latter. As Retail has struggled and vacancy rates have increased, this has opened the door to Leisure operators to take new space. At the same time, landlords are increasingly recognising the holistic benefits of having a more rounded proposition within their Shopping Centres and have been more proactive in seeking out Leisure tenants.
A higher income profile for Banks/Building Societies is, on the surface at least, far harder to fathom. Financial services on the high street generally is a rapidly declining sector as banks and building societies retrospectively take a hatchet to legacy physical estates that have been under-managed for decades. Perhaps this has played slightly into the hands of the Shopping Centre market, particularly in assets which have maintained footfall – relative to a struggling high street or tertiary, peripheral location, Shopping Centre units may actually have retained a greater sense of purpose. At the same time, the new breed of ‘disruptor’ financial service providers, spearheaded by the likes of MetroBank, have emerged as new Shopping Centre occupiers in certain locations.
Shopping Centre Income Growth 2018 - 2021
Source: Knight Frank
Other surprises? The apparent contradiction between Leisure (+4.9%) and its peer sub-categories Dining (-21.2%) and Cafes / Coffee Shops (-12.0%). While F&B generally is widely perceived to have been one of the
4.9% 4.7%
-1.1% -1.4%-3.6% -4.5%
-8.9%
-12.0%
-16.1% -16.5%
-21.2%-22.5%
-26.0%-30.0%
-25.0%
-20.0%
-15.0%
-10.0%
-5.0%
0.0%
5.0%
10.0%
Income Movement 2018 - 2021 (%)

5
key beneficiaries of shifts in tenant mix within Shopping Centres in recent years, this does not totally override wider challenges. While the focus has tended to be on retailers, F&B operators have had more than their fair share of distress in recent years. Lest we forget, household names such as Pizza Express, Prezzo, Jamie’s Italian, Yo! Sushi, Carluccio’s, Caffe Nero, Azzuri Group, Byron Burgers, Le Pain Quotidienne, Casual Dining Group, Chiquittos, Pizza Hut, Wahaca, Wasabi, Leon, Itsu, Gourmet Burger Kitchen have all launched CVAs in recent years.
If anything, our income data highlights the ongoing duality of the F&B market: still a high growth opportunity in many locations, but a sector not without residual structural challenges.
4. COVID VS PRE-COVID
“COVID-19 merely accelerated pre-existing trends and brought about 5 years of change in as many months”. Not according to our data. Comparing the two years of data prior to COVID (2018 – 2019) with the two of COVID itself (2020 – 2021) challenges one of the oft-repeated, if slightly lazy, soundbites of COVID.
In fairness, the soundbite is partially true in the context of Shopping Centre income in that it was already falling before COVID struck and continued to do so during the pandemic itself. COVID did not prompt something that was not already happening.
Shopping Centre Income Growth 2018/2019 vs 2020/2021
Source: Knight Frank
As a collective whole, Shopping Centre income declines were more severe prior to COVID (-11.1%) than during the two years of COVID itself (-8.5%). In effect, therefore, the rate of decline actually decelerated during COVID. Whilst it may be easy to blame COVID for much of the malaise in retail and in Shopping Centres specifically, it is easy to forget or under-estimate the scale of the structural challenges the sector faced long before COVID made its unwelcome presence felt. Fundamental rebasing was already in place and much of the ‘heavy lifting’ in the restructuring of retail had already been completed before COVID struck.
-6.1%
1.6%
-4.8%
-11.5%
-3.0%
-16.9%
-0.2%
-3.4%
-5.9%
3.4%
-3.8%
-12.8%
-8.5%
-3.0%
-10.9%
-6.9%
-12.2%
-9.2%
-11.5%
-1.4%
-19.8%
-3.6%
6.1%
-7.0%
-4.5%
-11.1%
-25.0% -20.0% -15.0% -10.0% -5.0% 0.0% 5.0% 10.0%
Bank/Building Society
Café/Coffee Shop
Car park/commercialisation/kiosks
Dining (sit down)
Essentials
Fashion
Grocer/foodstore/supermarket
Household/other/general
Jeweller
Leisure
Phone (ie. Apple, Virgin Media etc)
Value
TOTAL
Income Movement - Pre- and COVID
Pre-COVID Movement (2019 -2018) % COVID Movement (2021 - 2020) %
6
Of course, there are marked variances amongst the sub-sectors and not all adhere to this general decelerating trend. Those that do include Household Goods (2018-19: -19.8%, 2020-21: -3.4%), Essential Goods Retailers (-9.2%, -3.0%), Phone Shops (-10.9%, -1.3%) and Dining (-12.2%, -11.5%). Some sub-sectors even bottomed out so much pre-pandemic that their income profile returned to growth during the pandemic, Cafes / Coffee Shops (-10.9%, +1.6%) being the key example. But again, it is worth stressing that these increases be as much a function of new space as rental growth.
The key exception to this general ‘deceleration’ trend is Fashion (2018-19: -11.5%, 2020-21: -16.9%) suggesting a more protracted period of re-basing and right-sizing that, for all intents and purposes, is still ongoing.
5. CHANGING INCOME PROFILES – REGIONAL VS LOCAL
Generalisations are always dangerous and not all trends illustrated in our data have necessarily played out across all Shopping Centres under review. But there is a clear divide between Regional and Local Shopping Centres. What are the respective income profiles of both and how have they moved / diverged / converged over the last four years?
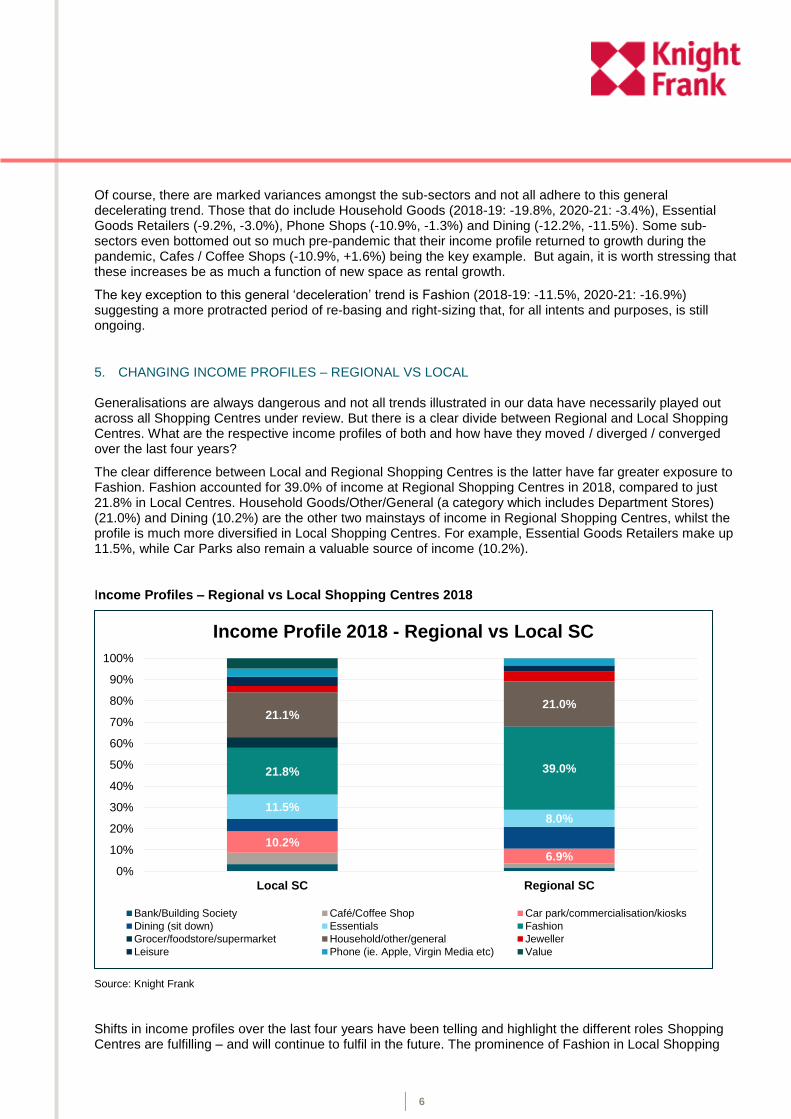
The clear difference between Local and Regional Shopping Centres is the latter have far greater exposure to Fashion. Fashion accounted for 39.0% of income at Regional Shopping Centres in 2018, compared to just 21.8% in Local Centres. Household Goods/Other/General (a category which includes Department Stores) (21.0%) and Dining (10.2%) are the other two mainstays of income in Regional Shopping Centres, whilst the profile is much more diversified in Local Shopping Centres. For example, Essential Goods Retailers make up 11.5%, while Car Parks also remain a valuable source of income (10.2%).
Income Profiles – Regional vs Local Shopping Centres 2018
Source: Knight Frank
Shifts in income profiles over the last four years have been telling and highlight the different roles Shopping Centres are fulfilling – and will continue to fulfil in the future. The prominence of Fashion in Local Shopping
10.2%
6.9%
11.5%8.0%
21.8% 39.0%
21.1%21.0%
0%
10%
20%
30%
40%
50%
60%
70%
80%
90%
100%
Local SC Regional SC
Income Profile 2018 - Regional vs Local SC
Bank/Building Society Café/Coffee Shop Car park/commercialisation/kiosks
Dining (sit down) Essentials Fashion
Grocer/foodstore/supermarket Household/other/general Jeweller
Leisure Phone (ie. Apple, Virgin Media etc) Value
7
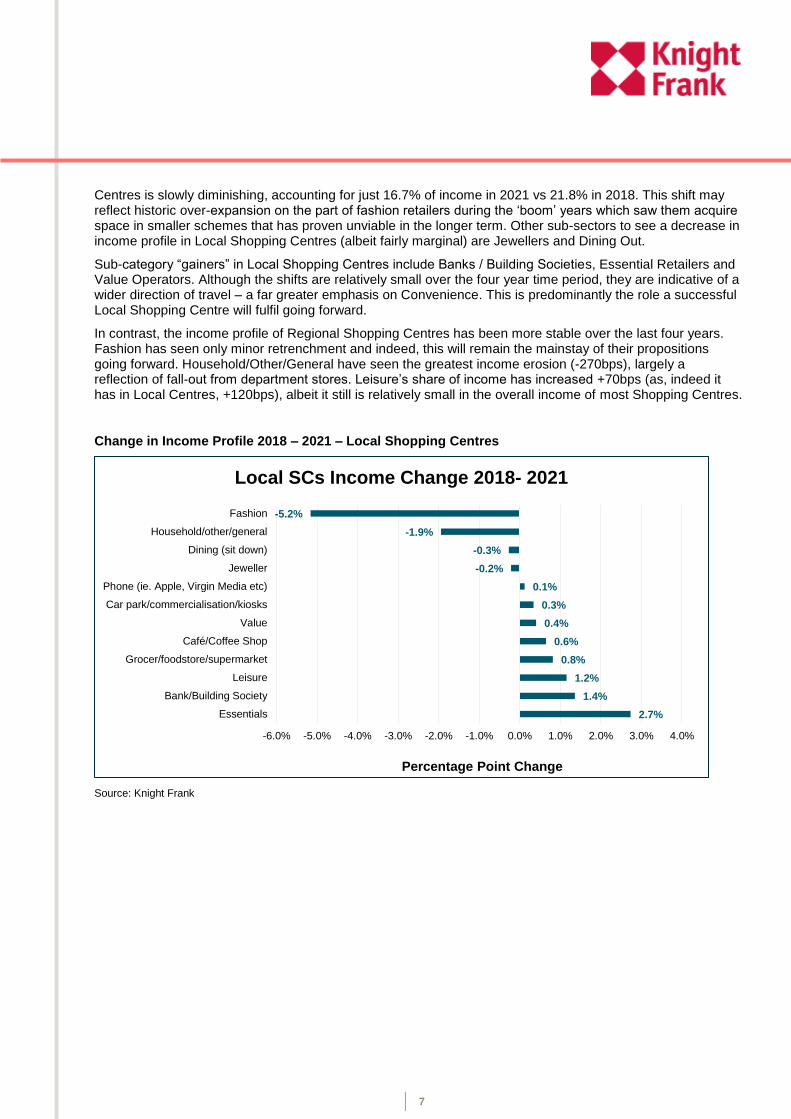
Centres is slowly diminishing, accounting for just 16.7% of income in 2021 vs 21.8% in 2018. This shift may reflect historic over-expansion on the part of fashion retailers during the ‘boom’ years which saw them acquire space in smaller schemes that has proven unviable in the longer term. Other sub-sectors to see a decrease in income profile in Local Shopping Centres (albeit fairly marginal) are Jewellers and Dining Out.
Sub-category “gainers” in Local Shopping Centres include Banks / Building Societies, Essential Retailers and Value Operators. Although the shifts are relatively small over the four year time period, they are indicative of a wider direction of travel – a far greater emphasis on Convenience. This is predominantly the role a successful Local Shopping Centre will fulfil going forward.
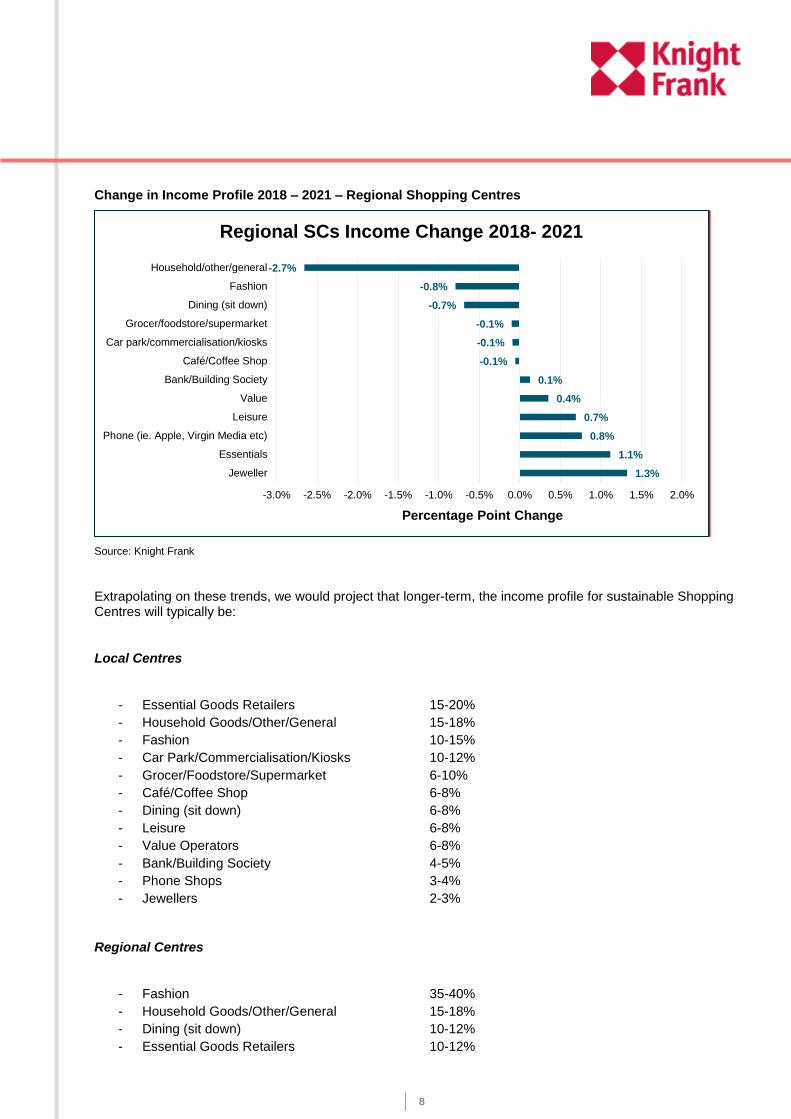
In contrast, the income profile of Regional Shopping Centres has been more stable over the last four years. Fashion has seen only minor retrenchment and indeed, this will remain the mainstay of their propositions going forward. Household/Other/General have seen the greatest income erosion (-270bps), largely a reflection of fall-out from department stores. Leisure’s share of income has increased +70bps (as, indeed it has in Local Centres, +120bps), albeit it still is relatively small in the overall income of most Shopping Centres.
Change in Income Profile 2018 – 2021 – Local Shopping Centres
Source: Knight Frank
2.7%
1.4%
1.2%
0.8%
0.6%
0.4%
0.3%
0.1%
-0.2%
-0.3%
-1.9%
-5.2%
-6.0% -5.0% -4.0% -3.0% -2.0% -1.0% 0.0% 1.0% 2.0% 3.0% 4.0%
Essentials
Bank/Building Society
Leisure
Grocer/foodstore/supermarket
Café/Coffee Shop
Value
Car park/commercialisation/kiosks
Phone (ie. Apple, Virgin Media etc)
Jeweller
Dining (sit down)
Household/other/general
Fashion
Percentage Point Change
Local SCs Income Change 2018- 2021
8
Change in Income Profile 2018 – 2021 – Regional Shopping Centres
Source: Knight Frank
Extrapolating on these trends, we would project that longer-term, the income profile for sustainable Shopping Centres will typically be:
Local Centres
- Essential Goods Retailers 15-20%
- Household Goods/Other/General 15-18%
- Fashion 10-15%
- Car Park/Commercialisation/Kiosks 10-12%
- Grocer/Foodstore/Supermarket 6-10%
- Café/Coffee Shop 6-8%
- Dining (sit down) 6-8%
- Leisure 6-8%
- Value Operators 6-8%
- Bank/Building Society 4-5%
- Phone Shops 3-4%
- Jewellers 2-3%
Regional Centres
- Fashion 35-40%
- Household Goods/Other/General 15-18%
- Dining (sit down) 10-12%
- Essential Goods Retailers 10-12%
1.3%
1.1%
0.8%
0.7%
0.4%
0.1%
-0.1%
-0.1%
-0.1%
-0.7%
-0.8%
-2.7%
-3.0% -2.5% -2.0% -1.5% -1.0% -0.5% 0.0% 0.5% 1.0% 1.5% 2.0%
Jeweller
Essentials
Phone (ie. Apple, Virgin Media etc)
Leisure
Value
Bank/Building Society
Café/Coffee Shop
Car park/commercialisation/kiosks
Grocer/foodstore/supermarket
Dining (sit down)
Fashion
Household/other/general
Percentage Point Change
Regional SCs Income Change 2018- 2021
9
- Car Park/Commercialisation/Kiosks 6-7%
- Jewellers 6-7%
- Leisure 4-5%
- Phone Shops 3-4%
- Café/Coffee Shop 2-3%
- Bank/Building Society 1-2%
- Grocer/Foodstore/Supermarket <1%
- Value Operators <1%
6. VACANCY RATES
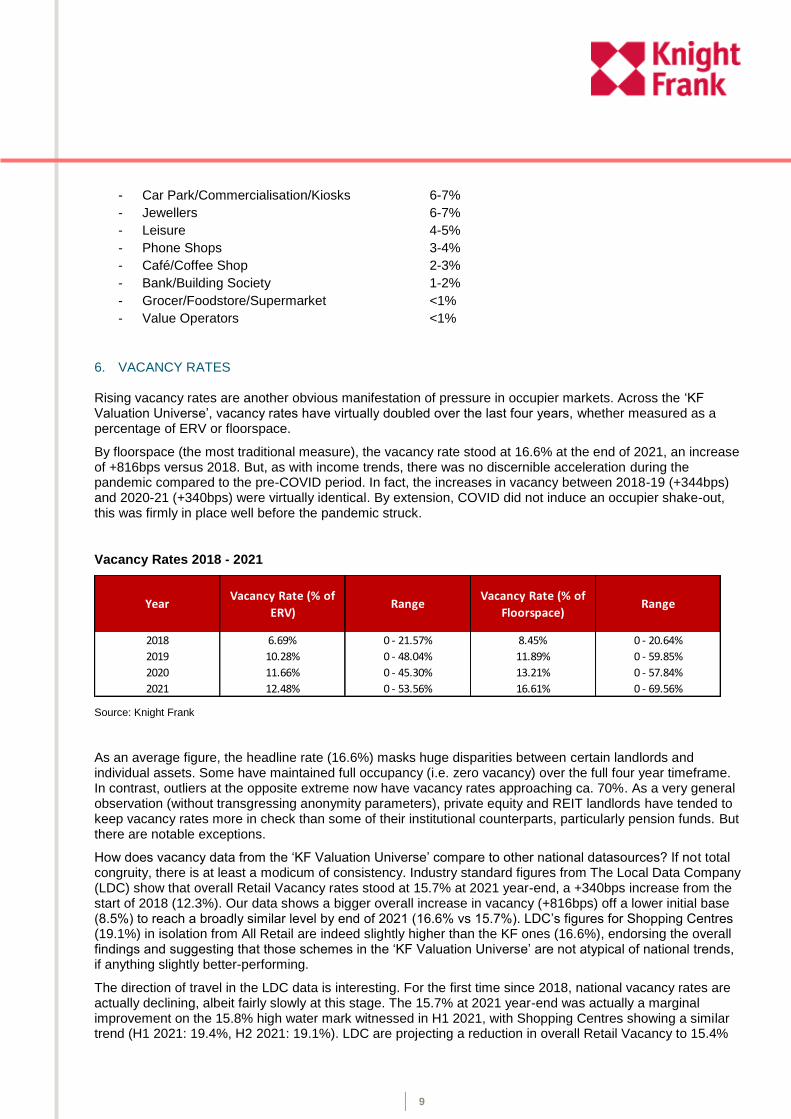
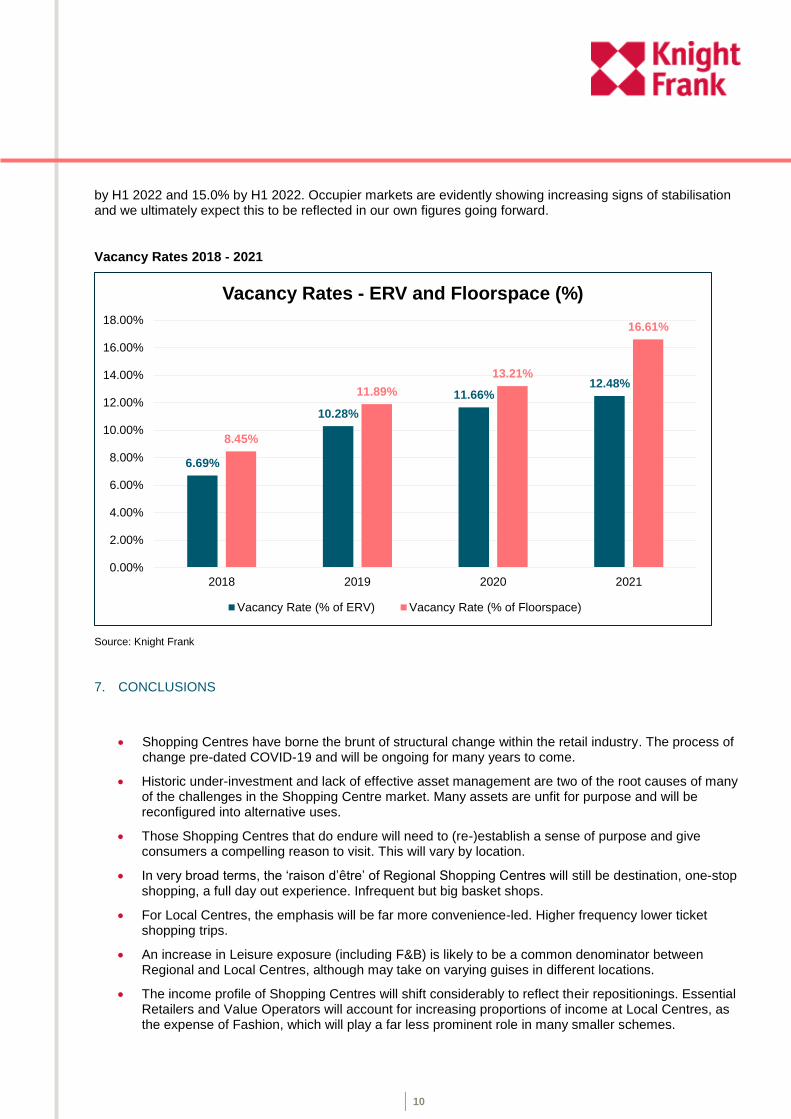
Rising vacancy rates are another obvious manifestation of pressure in occupier markets. Across the ‘KF Valuation Universe’, vacancy rates have virtually doubled over the last four years, whether measured as a percentage of ERV or floorspace.
By floorspace (the most traditional measure), the vacancy rate stood at 16.6% at the end of 2021, an increase of +816bps versus 2018. But, as with income trends, there was no discernible acceleration during the pandemic compared to the pre-COVID period. In fact, the increases in vacancy between 2018-19 (+344bps) and 2020-21 (+340bps) were virtually identical. By extension, COVID did not induce an occupier shake-out, this was firmly in place well before the pandemic struck.
Vacancy Rates 2018 - 2021
YearVacancy Rate (% of
ERV)Range
Vacancy Rate (% of
Floorspace)Range
2018 6.69% 0 - 21.57% 8.45% 0 - 20.64%
2019 10.28% 0 - 48.04% 11.89% 0 - 59.85%
2020 11.66% 0 - 45.30% 13.21% 0 - 57.84%
2021 12.48% 0 - 53.56% 16.61% 0 - 69.56%
Source: Knight Frank
As an average figure, the headline rate (16.6%) masks huge disparities between certain landlords and individual assets. Some have maintained full occupancy (i.e. zero vacancy) over the full four year timeframe. In contrast, outliers at the opposite extreme now have vacancy rates approaching ca. 70%. As a very general observation (without transgressing anonymity parameters), private equity and REIT landlords have tended to keep vacancy rates more in check than some of their institutional counterparts, particularly pension funds. But there are notable exceptions.
How does vacancy data from the ‘KF Valuation Universe’ compare to other national datasources? If not total congruity, there is at least a modicum of consistency. Industry standard figures from The Local Data Company (LDC) show that overall Retail Vacancy rates stood at 15.7% at 2021 year-end, a +340bps increase from the start of 2018 (12.3%). Our data shows a bigger overall increase in vacancy (+816bps) off a lower initial base (8.5%) to reach a broadly similar level by end of 2021 (16.6% vs 15.7%). LDC’s figures for Shopping Centres (19.1%) in isolation from All Retail are indeed slightly higher than the KF ones (16.6%), endorsing the overall findings and suggesting that those schemes in the ‘KF Valuation Universe’ are not atypical of national trends, if anything slightly better-performing.
The direction of travel in the LDC data is interesting. For the first time since 2018, national vacancy rates are actually declining, albeit fairly slowly at this stage. The 15.7% at 2021 year-end was actually a marginal improvement on the 15.8% high water mark witnessed in H1 2021, with Shopping Centres showing a similar trend (H1 2021: 19.4%, H2 2021: 19.1%). LDC are projecting a reduction in overall Retail Vacancy to 15.4%
10
by H1 2022 and 15.0% by H1 2022. Occupier markets are evidently showing increasing signs of stabilisation and we ultimately expect this to be reflected in our own figures going forward.
Vacancy Rates 2018 - 2021
Source: Knight Frank
7. CONCLUSIONS
Shopping Centres have borne the brunt of structural change within the retail industry. The process of change pre-dated COVID-19 and will be ongoing for many years to come.
Historic under-investment and lack of effective asset management are two of the root causes of many of the challenges in the Shopping Centre market. Many assets are unfit for purpose and will be reconfigured into alternative uses.
Those Shopping Centres that do endure will need to (re-)establish a sense of purpose and give consumers a compelling reason to visit. This will vary by location.
In very broad terms, the ‘raison d’être’ of Regional Shopping Centres will still be destination, one-stop shopping, a full day out experience. Infrequent but big basket shops.
For Local Centres, the emphasis will be far more convenience-led. Higher frequency lower ticket shopping trips.
An increase in Leisure exposure (including F&B) is likely to be a common denominator between Regional and Local Centres, although may take on varying guises in different locations.
The income profile of Shopping Centres will shift considerably to reflect their repositionings. Essential Retailers and Value Operators will account for increasing proportions of income at Local Centres, as the expense of Fashion, which will play a far less prominent role in many smaller schemes.
6.69%
10.28%
11.66%12.48%
8.45%
11.89%
13.21%
16.61%
0.00%
2.00%
4.00%
6.00%
8.00%
10.00%
12.00%
14.00%
16.00%
18.00%
2018 2019 2020 2021
Vacancy Rates - ERV and Floorspace (%)
Vacancy Rate (% of ERV) Vacancy Rate (% of Floorspace)
11
Many of the most challenged Shopping Centres are those that fall between the two stools of Regional and Local Centres. Ascertaining a true sense of purpose for many of these schemes is challenging.
There is no ‘one size fits all’ blueprint for any Shopping Centre. Each is unique and serves a distinct catchment and local market. Ultimately, the most successful schemes will always be those most closely aligned to the needs and aspirations of those that they serve.

12
Any queries please contact:
Stephen Springham Partner – Head of Retail Research
Knight Frank 55 Baker Street London W1U 8AN United Kingdom
T +44 (0)20 7861 1236 M +44 (0) 7468 727 557 E [email protected]
Related Documents