Operation Manual ShockLine™ MS46122A/B Series Compact Vector Network Analyzer MS46122A/B-010, 1 MHz to 8 GHz, 2-Port MS46122A/B-020, 1 MHz to 20 GHz, 2-Port MS46122A/B-040, 1 MHz to 43.5 GHz, 2-Port MS46122B-043, 1 MHz to 43.5 GHz, 2-Port Anritsu Company 490 Jarvis Drive Morgan Hill, CA 95037-2809 USA http://www.anritsu.com Part Number: 10410-00340 Revision: T Published: March 2022 Copyright 2022 Anritsu Company, USA. All Rights Reserved.

Welcome message from author
This document is posted to help you gain knowledge. Please leave a comment to let me know what you think about it! Share it to your friends and learn new things together.
Transcript

Operation Manual
ShockLine™MS46122A/B Series Compact Vector Network Analyzer MS46122A/B-010, 1 MHz to 8 GHz, 2-PortMS46122A/B-020, 1 MHz to 20 GHz, 2-PortMS46122A/B-040, 1 MHz to 43.5 GHz, 2-PortMS46122B-043, 1 MHz to 43.5 GHz, 2-Port
Anritsu Company490 Jarvis DriveMorgan Hill, CA 95037-2809USAhttp://www.anritsu.com
Part Number: 10410-00340Revision: T
Published: March 2022Copyright 2022 Anritsu Company, USA. All Rights Reserved.

Front-2 PN: 10410-00340 Rev: T MS46122A/B OM
NOTICEAnritsu Company has prepared this manual for use by Anritsu Company personnel and customers as a guide for theproper installation, operation and maintenance of Anritsu Company equipment and computer programs. Thedrawings, specifications, and information contained herein are the property of Anritsu Company, and anyunauthorized use or disclosure of these drawings, specifications, and information is prohibited; they shall not bereproduced, copied, or used in whole or in part as the basis for manufacture or sale of the equipment or softwareprograms without the prior written consent of Anritsu Company.
UPDATESThe latest service and sales contact information, and updated documents can be downloaded from the AnritsuWebsite at: http://www.anritsu.com

MS46122A/B OM PN: 10410-00340 Rev: T Contents-1
Chapter DescriptionsChapter 1 — OverviewThis chapter provides an overview of the ShockLine™ MS46122A/B Series Vector Network Analyzer (VNA) and a description of its major functions and available documentation. A summary of available precision component kits including mechanical calibration kits and verification kits is included.
Chapter 2 — Front and Rear PanelsThe chapter provides an overview of the MS46122A/B Series VNA hardware user interface including front panel buttons and front panel connectors. Included are photographs of the front and rear panels. Each port and connector is described with its connector type, its function, input/output limits, and a cross-reference to a detailed connector pin-out diagram.
Chapter 3 — InstallationThis chapter provides information for the initial inspection and preparation for use of the ShockLine MS46122A/B Series VNA and includes information on instrument installation, loading ShockLine Software, required operating environment, power requirements, and initial inspection. After power up, the various power modes are described with general warm-up and calibration time intervals. The preventive maintenance section includes information on cleaning along with preparation for storage or shipment.
Chapter 4 — User Interface DisplayThe chapter describes the general display options of the ShockLine MS46122A/B Series VNA and provides a general description of the Menu bar, the Icon toolbar, and the right-side function menus. General descriptions and procedures are provided for trace graph setup, marker setup, and limit line setup.
Appendix A — Vector Network Analyzer PrimerThis chapter describes the basic functions of a Vector Network Analyzer (VNA) and how it measures magnitude and phase characteristics of networks, amplifiers, attenuators, and antennas. Scattering parameters (S-parameters) are defined.
Appendix B — Maintenance and SecurityAppendix C — Abbreviation GlossaryThis glossary defines the abbreviations and terms that appear on the connectors and buttons of the MS46122A/B Series VNA. In some cases, due to space limitations, multiple abbreviations are used for the same term or the same abbreviation is used with different punctuation.
Appendix D — TroubleshootingThis section provides troubleshooting tips when operating the MS46122A/B. Tips include:

Contents-2 PN: 10410-00340 Rev: T MS46122A/B OM
Chapter Descriptions (Continued)

MS46122A/B OM PN: 10410-00340 Rev: T Contents-3
Table of ContentsChapter 1 — Overview1-1 Introduction. . . . . . . . . . . . . . . . . . . . . . . . . . . . . . . . . . . . . . . . . . . . . . . . . . . . . . . . . . . . . . . . . . 1-11-2 ShockLine MS46122A/B Series VNA Description . . . . . . . . . . . . . . . . . . . . . . . . . . . . . . . . . . . . 1-1
ShockLine MS46122A/B Series VNA Models. . . . . . . . . . . . . . . . . . . . . . . . . . . . . . . . . . . . . . 1-1
1-3 ShockLine MS46122A/B VNA Instrument Control . . . . . . . . . . . . . . . . . . . . . . . . . . . . . . . . . . . . 1-2The MS46122A/B Series VNA is controlled via: . . . . . . . . . . . . . . . . . . . . . . . . . . . . . . . . . . . . 1-2Graphical User Interface. . . . . . . . . . . . . . . . . . . . . . . . . . . . . . . . . . . . . . . . . . . . . . . . . . . . . . 1-2
1-4 Accessories . . . . . . . . . . . . . . . . . . . . . . . . . . . . . . . . . . . . . . . . . . . . . . . . . . . . . . . . . . . . . . . . . 1-21-5 Calibration and Verification Kits . . . . . . . . . . . . . . . . . . . . . . . . . . . . . . . . . . . . . . . . . . . . . . . . . . 1-2
Precision Component and Calibration Kits . . . . . . . . . . . . . . . . . . . . . . . . . . . . . . . . . . . . . . . . 1-2Mechanical Calibration Kits . . . . . . . . . . . . . . . . . . . . . . . . . . . . . . . . . . . . . . . . . . . . . . . . . . . 1-2Verification Kits . . . . . . . . . . . . . . . . . . . . . . . . . . . . . . . . . . . . . . . . . . . . . . . . . . . . . . . . . . . . . 1-3
1-6 User Documentation. . . . . . . . . . . . . . . . . . . . . . . . . . . . . . . . . . . . . . . . . . . . . . . . . . . . . . . . . . . 1-3Product Information, Compliance, and Safety . . . . . . . . . . . . . . . . . . . . . . . . . . . . . . . . . . . . . 1-3ShockLine Vector Network Analyzers. . . . . . . . . . . . . . . . . . . . . . . . . . . . . . . . . . . . . . . . . . . . 1-3Documentation Conventions. . . . . . . . . . . . . . . . . . . . . . . . . . . . . . . . . . . . . . . . . . . . . . . . . . . 1-3
Chapter 2 — Front and Rear Panels2-1 Chapter Overview. . . . . . . . . . . . . . . . . . . . . . . . . . . . . . . . . . . . . . . . . . . . . . . . . . . . . . . . . . . . . 2-1
2-2 Front Panel Components . . . . . . . . . . . . . . . . . . . . . . . . . . . . . . . . . . . . . . . . . . . . . . . . . . . . . . . 2-12-3 Rear Panel Components . . . . . . . . . . . . . . . . . . . . . . . . . . . . . . . . . . . . . . . . . . . . . . . . . . . . . . . 2-2
Chapter 3 — Installation3-1 Introduction. . . . . . . . . . . . . . . . . . . . . . . . . . . . . . . . . . . . . . . . . . . . . . . . . . . . . . . . . . . . . . . . . . 3-13-2 Unpacking the Product . . . . . . . . . . . . . . . . . . . . . . . . . . . . . . . . . . . . . . . . . . . . . . . . . . . . . . . . . 3-1
Initial Inspection . . . . . . . . . . . . . . . . . . . . . . . . . . . . . . . . . . . . . . . . . . . . . . . . . . . . . . . . . . . . 3-1Preparation for Use. . . . . . . . . . . . . . . . . . . . . . . . . . . . . . . . . . . . . . . . . . . . . . . . . . . . . . . . . . 3-1
3-3 Operating Environment and Power Requirements . . . . . . . . . . . . . . . . . . . . . . . . . . . . . . . . . . . . 3-13-4 Power-On/Power-Off Procedures . . . . . . . . . . . . . . . . . . . . . . . . . . . . . . . . . . . . . . . . . . . . . . . . . 3-2
Procedure – Power-On to Standby Mode. . . . . . . . . . . . . . . . . . . . . . . . . . . . . . . . . . . . . . . . . 3-2Procedure – Standby Mode to Operate Mode . . . . . . . . . . . . . . . . . . . . . . . . . . . . . . . . . . . . . 3-3Procedure – Power-Off . . . . . . . . . . . . . . . . . . . . . . . . . . . . . . . . . . . . . . . . . . . . . . . . . . . . . . . 3-3
3-5 External Control of ShockLine VNA . . . . . . . . . . . . . . . . . . . . . . . . . . . . . . . . . . . . . . . . . . . . . . . 3-4Connecting the External Computer. . . . . . . . . . . . . . . . . . . . . . . . . . . . . . . . . . . . . . . . . . . . . . 3-4
3-6 Installing ShockLine Software. . . . . . . . . . . . . . . . . . . . . . . . . . . . . . . . . . . . . . . . . . . . . . . . . . . . 3-4Preparation for Software Installation. . . . . . . . . . . . . . . . . . . . . . . . . . . . . . . . . . . . . . . . . . . . . 3-4Software Installation Procedure . . . . . . . . . . . . . . . . . . . . . . . . . . . . . . . . . . . . . . . . . . . . . . . . 3-4
3-7 Running the ShockLine Software Application. . . . . . . . . . . . . . . . . . . . . . . . . . . . . . . . . . . . . . . . 3-5Launching the ShockLine Software . . . . . . . . . . . . . . . . . . . . . . . . . . . . . . . . . . . . . . . . . . . . . 3-5
3-8 Simulation Mode. . . . . . . . . . . . . . . . . . . . . . . . . . . . . . . . . . . . . . . . . . . . . . . . . . . . . . . . . . . . . . 3-6
Chapter 4 — User Interface Display4-1 Chapter Overview. . . . . . . . . . . . . . . . . . . . . . . . . . . . . . . . . . . . . . . . . . . . . . . . . . . . . . . . . . . . . 4-1

Contents-4 PN: 10410-00340 Rev: T MS46122A/B OM
Table of Contents (Continued)
4-2 User Interface Main Screen . . . . . . . . . . . . . . . . . . . . . . . . . . . . . . . . . . . . . . . . . . . . . . . . . . . . . 4-1User Interface Control and Display Areas. . . . . . . . . . . . . . . . . . . . . . . . . . . . . . . . . . . . . . . . . 4-2Function Access . . . . . . . . . . . . . . . . . . . . . . . . . . . . . . . . . . . . . . . . . . . . . . . . . . . . . . . . . . . . 4-3
4-3 Using the Menu Bar Interface . . . . . . . . . . . . . . . . . . . . . . . . . . . . . . . . . . . . . . . . . . . . . . . . . . . . 4-6Menu Bar Overview . . . . . . . . . . . . . . . . . . . . . . . . . . . . . . . . . . . . . . . . . . . . . . . . . . . . . . . . . 4-6Menu Bar General Operation . . . . . . . . . . . . . . . . . . . . . . . . . . . . . . . . . . . . . . . . . . . . . . . . . . 4-6Menu Bar Drop-down Menus and Commands . . . . . . . . . . . . . . . . . . . . . . . . . . . . . . . . . . . . . 4-7
4-4 Icon Toolbar . . . . . . . . . . . . . . . . . . . . . . . . . . . . . . . . . . . . . . . . . . . . . . . . . . . . . . . . . . . . . . . . 4-17Overview. . . . . . . . . . . . . . . . . . . . . . . . . . . . . . . . . . . . . . . . . . . . . . . . . . . . . . . . . . . . . . . . . 4-17Using the Icon Toolbar Interface. . . . . . . . . . . . . . . . . . . . . . . . . . . . . . . . . . . . . . . . . . . . . . . 4-17Available Icon Functions. . . . . . . . . . . . . . . . . . . . . . . . . . . . . . . . . . . . . . . . . . . . . . . . . . . . . 4-18
4-5 MAIN Menu and Application Menus . . . . . . . . . . . . . . . . . . . . . . . . . . . . . . . . . . . . . . . . . . . . . . 4-264-6 Using the Main Menu Interface. . . . . . . . . . . . . . . . . . . . . . . . . . . . . . . . . . . . . . . . . . . . . . . . . . 4-28
Types of Menus, Menu Buttons, and Menu Toolbars . . . . . . . . . . . . . . . . . . . . . . . . . . . . . . . 4-28Menu Title . . . . . . . . . . . . . . . . . . . . . . . . . . . . . . . . . . . . . . . . . . . . . . . . . . . . . . . . . . . . . . . . 4-29Menu Buttons . . . . . . . . . . . . . . . . . . . . . . . . . . . . . . . . . . . . . . . . . . . . . . . . . . . . . . . . . . . . . 4-29Menu Navigation Buttons . . . . . . . . . . . . . . . . . . . . . . . . . . . . . . . . . . . . . . . . . . . . . . . . . . . . 4-29Menu Buttons . . . . . . . . . . . . . . . . . . . . . . . . . . . . . . . . . . . . . . . . . . . . . . . . . . . . . . . . . . . . . 4-29Read-Only Buttons . . . . . . . . . . . . . . . . . . . . . . . . . . . . . . . . . . . . . . . . . . . . . . . . . . . . . . . . . 4-29Function Buttons. . . . . . . . . . . . . . . . . . . . . . . . . . . . . . . . . . . . . . . . . . . . . . . . . . . . . . . . . . . 4-30Toggle Buttons . . . . . . . . . . . . . . . . . . . . . . . . . . . . . . . . . . . . . . . . . . . . . . . . . . . . . . . . . . . . 4-30Field Selection Buttons . . . . . . . . . . . . . . . . . . . . . . . . . . . . . . . . . . . . . . . . . . . . . . . . . . . . . . 4-30Field Toolbars . . . . . . . . . . . . . . . . . . . . . . . . . . . . . . . . . . . . . . . . . . . . . . . . . . . . . . . . . . . . . 4-31Auto-Return Button Groups . . . . . . . . . . . . . . . . . . . . . . . . . . . . . . . . . . . . . . . . . . . . . . . . . . 4-32Button Selection Icon . . . . . . . . . . . . . . . . . . . . . . . . . . . . . . . . . . . . . . . . . . . . . . . . . . . . . . . 4-33Completion Checkmark Button . . . . . . . . . . . . . . . . . . . . . . . . . . . . . . . . . . . . . . . . . . . . . . . . 4-33
4-7 Using Dialog Boxes. . . . . . . . . . . . . . . . . . . . . . . . . . . . . . . . . . . . . . . . . . . . . . . . . . . . . . . . . . . 4-34Standard Dialog Box Buttons . . . . . . . . . . . . . . . . . . . . . . . . . . . . . . . . . . . . . . . . . . . . . . . . . 4-34
4-8 Instrument Status Display Area . . . . . . . . . . . . . . . . . . . . . . . . . . . . . . . . . . . . . . . . . . . . . . . . . 4-35Instrument Status Data . . . . . . . . . . . . . . . . . . . . . . . . . . . . . . . . . . . . . . . . . . . . . . . . . . . . . . 4-35
4-9 Channel Status Display Area . . . . . . . . . . . . . . . . . . . . . . . . . . . . . . . . . . . . . . . . . . . . . . . . . . . 4-364-10 Working with Channels . . . . . . . . . . . . . . . . . . . . . . . . . . . . . . . . . . . . . . . . . . . . . . . . . . . . . . . 4-37
Channel Menu. . . . . . . . . . . . . . . . . . . . . . . . . . . . . . . . . . . . . . . . . . . . . . . . . . . . . . . . . . . . . 4-37

Contents-5 PN: 10410-00340 Rev: T MS46122A/B OM
Table of Contents (Continued)
4-11 Working with Traces . . . . . . . . . . . . . . . . . . . . . . . . . . . . . . . . . . . . . . . . . . . . . . . . . . . . . . . . . 4-39Trace Menu. . . . . . . . . . . . . . . . . . . . . . . . . . . . . . . . . . . . . . . . . . . . . . . . . . . . . . . . . . . . . . . 4-39 Repeat the actions above to return the trace to its normal size. . . . . . . . . . . . . . . . . . . . . . . 4-40Types of Trace Displays . . . . . . . . . . . . . . . . . . . . . . . . . . . . . . . . . . . . . . . . . . . . . . . . . . . . . 4-40Trace Data Types . . . . . . . . . . . . . . . . . . . . . . . . . . . . . . . . . . . . . . . . . . . . . . . . . . . . . . . . . . 4-40Trace Display Graphs . . . . . . . . . . . . . . . . . . . . . . . . . . . . . . . . . . . . . . . . . . . . . . . . . . . . . . . 4-41Trace Labels . . . . . . . . . . . . . . . . . . . . . . . . . . . . . . . . . . . . . . . . . . . . . . . . . . . . . . . . . . . . . . 4-44Trace Label Abbreviations . . . . . . . . . . . . . . . . . . . . . . . . . . . . . . . . . . . . . . . . . . . . . . . . . . . 4-44Rectilinear Single Graph. . . . . . . . . . . . . . . . . . . . . . . . . . . . . . . . . . . . . . . . . . . . . . . . . . . . . 4-46Rectilinear Paired Graphs. . . . . . . . . . . . . . . . . . . . . . . . . . . . . . . . . . . . . . . . . . . . . . . . . . . . 4-46Smith Charts . . . . . . . . . . . . . . . . . . . . . . . . . . . . . . . . . . . . . . . . . . . . . . . . . . . . . . . . . . . . . . 4-47Smith Chart with Impedance (Circuit Resistance and Reactance) . . . . . . . . . . . . . . . . . . . . . 4-47Polar Graphs. . . . . . . . . . . . . . . . . . . . . . . . . . . . . . . . . . . . . . . . . . . . . . . . . . . . . . . . . . . . . . 4-48Group Delay Graphs . . . . . . . . . . . . . . . . . . . . . . . . . . . . . . . . . . . . . . . . . . . . . . . . . . . . . . . . 4-49
4-12 Working with Reference Lines and Reference Position . . . . . . . . . . . . . . . . . . . . . . . . . . . . . . 4-504-13 Working with Markers . . . . . . . . . . . . . . . . . . . . . . . . . . . . . . . . . . . . . . . . . . . . . . . . . . . . . . . . 4-514-14 Working with Limit Lines . . . . . . . . . . . . . . . . . . . . . . . . . . . . . . . . . . . . . . . . . . . . . . . . . . . . . . 4-53
4-15 Working with Ripple Limit Lines . . . . . . . . . . . . . . . . . . . . . . . . . . . . . . . . . . . . . . . . . . . . . . . . 4-54
Appendix A — Vector Network Analyzer PrimerA-1 Appendix Overview. . . . . . . . . . . . . . . . . . . . . . . . . . . . . . . . . . . . . . . . . . . . . . . . . . . . . . . . . . . . A-1
A-2 General Description . . . . . . . . . . . . . . . . . . . . . . . . . . . . . . . . . . . . . . . . . . . . . . . . . . . . . . . . . . . A-1A-3 Instrument Description . . . . . . . . . . . . . . . . . . . . . . . . . . . . . . . . . . . . . . . . . . . . . . . . . . . . . . . . . A-2
Source Module . . . . . . . . . . . . . . . . . . . . . . . . . . . . . . . . . . . . . . . . . . . . . . . . . . . . . . . . . . . . . A-2Test Set Module . . . . . . . . . . . . . . . . . . . . . . . . . . . . . . . . . . . . . . . . . . . . . . . . . . . . . . . . . . . . A-2Analyzer Module . . . . . . . . . . . . . . . . . . . . . . . . . . . . . . . . . . . . . . . . . . . . . . . . . . . . . . . . . . . . A-2
A-4 Network Analyzers . . . . . . . . . . . . . . . . . . . . . . . . . . . . . . . . . . . . . . . . . . . . . . . . . . . . . . . . . . . . A-3Scalar Analyzer Comparison . . . . . . . . . . . . . . . . . . . . . . . . . . . . . . . . . . . . . . . . . . . . . . . . . . A-3Vector Network Analyzer Basics. . . . . . . . . . . . . . . . . . . . . . . . . . . . . . . . . . . . . . . . . . . . . . . . A-4
A-5 Polar Display . . . . . . . . . . . . . . . . . . . . . . . . . . . . . . . . . . . . . . . . . . . . . . . . . . . . . . . . . . . . . . . A-12Resistive and Reactive Terms . . . . . . . . . . . . . . . . . . . . . . . . . . . . . . . . . . . . . . . . . . . . . . . . A-12
A-6 Smith Chart. . . . . . . . . . . . . . . . . . . . . . . . . . . . . . . . . . . . . . . . . . . . . . . . . . . . . . . . . . . . . . . . . A-13Measurement Error Correction . . . . . . . . . . . . . . . . . . . . . . . . . . . . . . . . . . . . . . . . . . . . . . . . A-13
Appendix B — Maintenance and SecurityB-1 Rack Ear Installation. . . . . . . . . . . . . . . . . . . . . . . . . . . . . . . . . . . . . . . . . . . . . . . . . . . . . . . . . . . B-1B-2 Security and Memory Overview . . . . . . . . . . . . . . . . . . . . . . . . . . . . . . . . . . . . . . . . . . . . . . . . . . B-2
B-3 Preparation for Storage or Shipment . . . . . . . . . . . . . . . . . . . . . . . . . . . . . . . . . . . . . . . . . . . . . . B-3Preparation for Storage. . . . . . . . . . . . . . . . . . . . . . . . . . . . . . . . . . . . . . . . . . . . . . . . . . . . . . . B-3Preparation for Shipment . . . . . . . . . . . . . . . . . . . . . . . . . . . . . . . . . . . . . . . . . . . . . . . . . . . . . B-3
Appendix C — Abbreviation GlossaryC-1 Appendix Overview . . . . . . . . . . . . . . . . . . . . . . . . . . . . . . . . . . . . . . . . . . . . . . . . . . . . . . . . . . . C-1C-2 Glossary . . . . . . . . . . . . . . . . . . . . . . . . . . . . . . . . . . . . . . . . . . . . . . . . . . . . . . . . . . . . . . . . . . . . C-1
Appendix D — TroubleshootingD-1 Introduction. . . . . . . . . . . . . . . . . . . . . . . . . . . . . . . . . . . . . . . . . . . . . . . . . . . . . . . . . . . . . . . . . . D-1

Contents-6 PN: 10410-00340 Rev: T MS46122A/B OM
Table of Contents (Continued)
D-2 No Hardware Detected. . . . . . . . . . . . . . . . . . . . . . . . . . . . . . . . . . . . . . . . . . . . . . . . . . . . . . . . . D-1D-3 Anritsu Hardware is Unavailable . . . . . . . . . . . . . . . . . . . . . . . . . . . . . . . . . . . . . . . . . . . . . . . . . D-3
Restart IVI Server . . . . . . . . . . . . . . . . . . . . . . . . . . . . . . . . . . . . . . . . . . . . . . . . . . . . . . . . . . . D-3Indicator Color Definitions. . . . . . . . . . . . . . . . . . . . . . . . . . . . . . . . . . . . . . . . . . . . . . . . . . . . . D-4
D-4 Driver Initialization Error . . . . . . . . . . . . . . . . . . . . . . . . . . . . . . . . . . . . . . . . . . . . . . . . . . . . . . . . D-4D-5 Application Launch Failure . . . . . . . . . . . . . . . . . . . . . . . . . . . . . . . . . . . . . . . . . . . . . . . . . . . . . . D-4
D-6 EEPROM Does Not Match (Firmware Update) . . . . . . . . . . . . . . . . . . . . . . . . . . . . . . . . . . . . . . D-5D-7 Updating EEPROM Unsuccessful (Firmware Update Failed) . . . . . . . . . . . . . . . . . . . . . . . . . . . D-6D-8 Updating Firmware Manually . . . . . . . . . . . . . . . . . . . . . . . . . . . . . . . . . . . . . . . . . . . . . . . . . . . . D-6
D-9 Traces Flat, No Sweeping . . . . . . . . . . . . . . . . . . . . . . . . . . . . . . . . . . . . . . . . . . . . . . . . . . . . . . D-7D-10 Text Size Too Large. . . . . . . . . . . . . . . . . . . . . . . . . . . . . . . . . . . . . . . . . . . . . . . . . . . . . . . . . . D-7
D-11 Printout Does Not Capture the Entire ShockLine Screen. . . . . . . . . . . . . . . . . . . . . . . . . . . . . D-11D-12 Running ShockLine as Non-administrator . . . . . . . . . . . . . . . . . . . . . . . . . . . . . . . . . . . . . . . . D-12
Subject Index
MS46122A/B OM PN: 10410-00340 Rev: T 1-1
Chapter 1 — Overview
1-1 IntroductionThis chapter provides an overview of the ShockLine™ MS46122A/B Series Vector Network Analyzer (VNA) and a description of its major functions and available documentation. A summary of available precision component kits including mechanical calibration kits and verification kits is included.
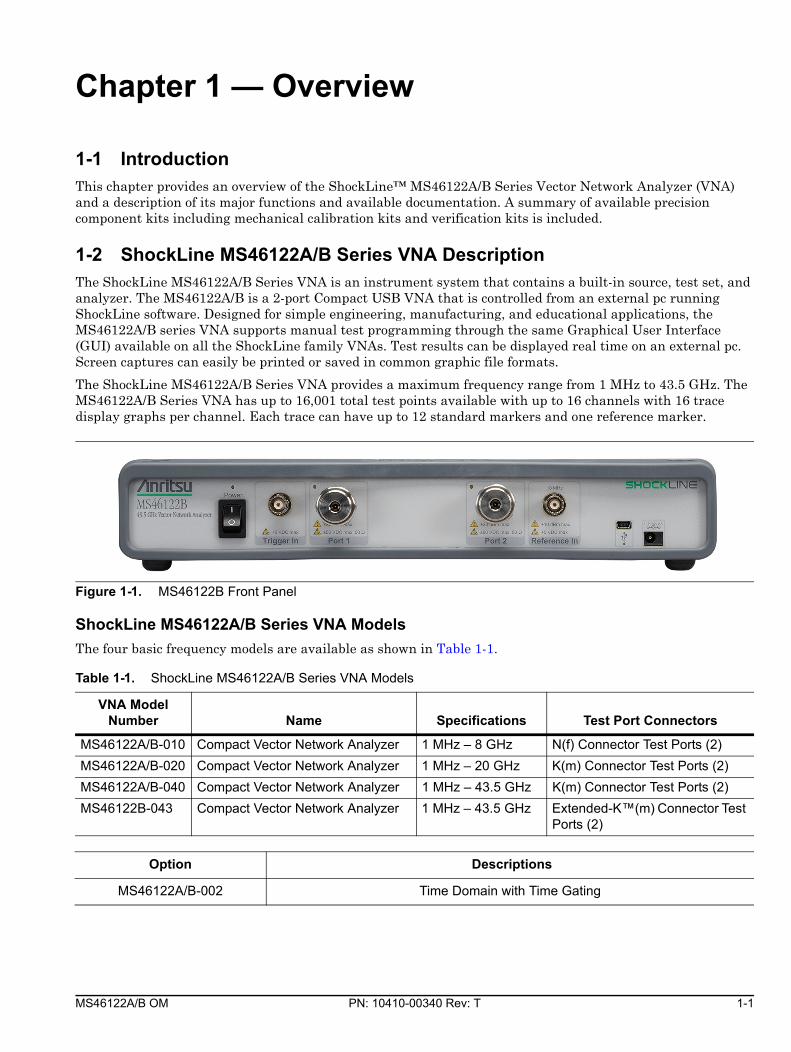
1-2 ShockLine MS46122A/B Series VNA DescriptionThe ShockLine MS46122A/B Series VNA is an instrument system that contains a built-in source, test set, and analyzer. The MS46122A/B is a 2-port Compact USB VNA that is controlled from an external pc running ShockLine software. Designed for simple engineering, manufacturing, and educational applications, the MS46122A/B series VNA supports manual test programming through the same Graphical User Interface (GUI) available on all the ShockLine family VNAs. Test results can be displayed real time on an external pc. Screen captures can easily be printed or saved in common graphic file formats.
The ShockLine MS46122A/B Series VNA provides a maximum frequency range from 1 MHz to 43.5 GHz. The MS46122A/B Series VNA has up to 16,001 total test points available with up to 16 channels with 16 trace display graphs per channel. Each trace can have up to 12 standard markers and one reference marker.
ShockLine MS46122A/B Series VNA ModelsThe four basic frequency models are available as shown in Table 1-1.
Figure 1-1. MS46122B Front Panel
Table 1-1. ShockLine MS46122A/B Series VNA Models
VNA ModelNumber Name Specifications Test Port Connectors
MS46122A/B-010 Compact Vector Network Analyzer 1 MHz – 8 GHz N(f) Connector Test Ports (2)MS46122A/B-020 Compact Vector Network Analyzer 1 MHz – 20 GHz K(m) Connector Test Ports (2)MS46122A/B-040 Compact Vector Network Analyzer 1 MHz – 43.5 GHz K(m) Connector Test Ports (2)MS46122B-043 Compact Vector Network Analyzer 1 MHz – 43.5 GHz Extended-K™(m) Connector Test
Ports (2)
Option Descriptions
MS46122A/B-002 Time Domain with Time Gating

1-3 ShockLine MS46122A/B VNA Instrument Control Overview
1-2 PN: 10410-00340 Rev: T MS46122A/B OM
1-3 ShockLine MS46122A/B VNA Instrument Control Other than test connectors, I/O connectors, and the standby power switch, there are no user controls on the front panel. The ShockLine MS46122A/B Series VNA is controlled and operated by an external PC controller loaded with ShockLine Software.
The MS46122A/B Series VNA is controlled via:• An external computer, monitor or touchscreen, keyboard and mouse
• ShockLine Software
• USB A to a Mini-B Connector
Graphical User InterfaceThe graphical user interface (GUI) provides a combination of a menu command bar, icon task bar, and right-side navigation menu for most system functions. All of the on-screen navigation elements can be accessed on the user supplied computer.
1-4 Accessories
1-5 Calibration and Verification Kits
Precision Component and Calibration KitsPrecision-component calibration and verification kits are available. Calibration kits contain components used to identify and separate error sources inherent in microwave test setups. Verification kits consist of components with characteristics traceable to the National Institute of Standards and Technology (NIST) and are used as the most dependable means of checking system accuracy. Each of these kits contains a USB memory device that provides coefficient, characterization, or measurement data for each component. Refer to the instrument data sheet for detailed specifications on automatic calibrators, mechanical calibration kits, and verification kits.
Precision-component calibration kits are available on the Anritsu Website located at: the Precision Calibration Kit page.
Mechanical Calibration KitsThe mechanical calibration kits provide 50 ohm calibrations for N or K devices. The mechanical calibration kits for ShockLine VNAs is available on the Anritsu Website located at the Mechanical Calibration Kit page.
NoteThe PC Controller is an External Computer which is not provided. Windows 7, Windows 8 or Windows10 is required to run the ShockLine software that controls the MS46122A/B series VNA. The ShockLine Software is provided on the Anritsu website at: http://www.anritsu.com
Accessory Part NumberExternal PC Controller with Windows 7, Windows 8, or Windows 10 Not Included Computer AC to DC 12V 5A Power Supply 40-187-RUSB cable with a USB A to Mini-B Connector 3-2000-1498Rack Ear Hardware 3-80790

Overview 1-6 User Documentation
MS46122A/B OM PN: 10410-00340 Rev: T 1-3
Verification KitsVerification kits can be used with the provided software and data to verify the calibration and resulting performance of the ShockLine MS46122A/B Series VNA. The applicable calibrations are Short-Open-Load-Thru (SOLT) using the Mechanical Cal kits.
1-6 User DocumentationThe following ShockLine MS46122A/B Series Vector Network Analyzers documentation and updates are available on the Anritsu web site at: http://www.anritsu.com
Product Information, Compliance, and Safety• ShockLine Product Information, Compliance, and Safety (PICS) – 10100-00067
ShockLine Vector Network Analyzers• MS46122A Series VNA Technical Data Sheet – 11410-00822
• MS46122B Series VNA Technical Data Sheet – 11410-00995
• MS46122A/B Series VNA Operation Manual – 10410-00340
• MS46122A/B Series VNA Measurement Guide – 10410-00336
• MS46121A/B, MS46122A/B, MS46131A, MS46322A/B Series VNA ShockLine User Interface Reference Manual – 10410-00337
• ShockLine Programming Manual – 10410-00746
• MS46122A/B Series VNA Maintenance Manual – 10410-00341
• MS46122A/B Series VNA User Documentation – 2300-559-R
Documentation ConventionsThe following conventions are used throughout the entire MS46122A/B Series VNA documentation set:
Instrument IdentificationThroughout this manual, the following term definitions are used:
• ShockLine VNA refers to any ShockLine VNA module or system.
• VNA refers to any ShockLine VNA module.
• MS46122A/B Series VNA refers to any of the VNAs in the MS46122A/B family.
• The specific model number, such as MS46122A/B-010 (refers to the 8.0 GHz model) when required to identify a specific VNA model.
Instrument ConnectorsPanel connectors are denoted with a bold Sans Serif font such as 10 MHZ IN.
User Interface, Menus, and Soft ButtonsThe ShockLine MS46122A/B Series VNA user interface consists of menus, button lists, sub-menus, toolbars, and dialog boxes. All of these elements are denoted with a special font. Generally, the top level menu items are denoted with a Sans Serif font and capitals, and the subordinate items are denoted with a regular Sans Serif font, such as Frequency menu button.
User Interface NavigationElements in navigation shortcuts or paths are separated with the pipe symbol (“|”). Menu and dialog box names are distinctive Sans Serif font in CAPITALS. Button names are in Title Case. For example, the path to the Manual Cal menu is:
• MAIN | Calibration | CALIBRATION | Calibrate | CALIBRATE | Manual Cal | MANUAL CAL

1-6 User Documentation Overview
1-4 PN: 10410-00340 Rev: T MS46122A/B OM
User InputUser input such as entering values or other information is denoted in a mono-spaced font such as:
This font denotes a string of user input.

MS46122A/B OM PN: 10410-00340 Rev: T 2-1
Chapter 2 — Front and Rear Panels
2-1 Chapter OverviewThe chapter provides an overview of the MS46122A/B Series VNA hardware user interface including front panel buttons and front panel connectors. Included are photographs of the front and rear panels. Each port and connector is described with its connector type, its function, input/output limits, and a cross-reference to a detailed connector pin-out diagram.
2-2 Front Panel ComponentsThe MS46122A/B Series VNA front panel and port connectors are identified below in Figure 2-1.
1. ID Plate – Instrument model number identification
2. Trigger In3. 10 MHz External Reference Input4. DC Power Supply Connector
5. Operate / Standby Power Switch
6. Test Port 1 – K(m) or N(f)7. Test Port 2 – K(m) or N(f)8. USB Port
Figure 2-1. MS46122A/B VNA Front Panel
1 3
65
2
8
4
7

2-3 Rear Panel Components Front and Rear Panels
2-2 PN: 10410-00340 Rev: T MS46122A/B OM
2-3 Rear Panel ComponentsThe MS46122A/B Series VNA rear panel is shown below Figure 2-2, “MS46122A/B Rear Panel”.
The label that is attached to the rear panel displays the:
• Anritsu Company logo
• Serial number
• Model number
• Revision (Rev) number
• Date of manufacture
• Options installed
• Compliance markings
• Identification barcode
1. Serial Number and Model Number Label 2. Air Flow Vent (one of three)Figure 2-2. MS46122A/B Rear Panel
1
2

MS46122A/B OM PN: 10410-00340 Rev: T 3-1
Chapter 3 — Installation
3-1 IntroductionThis chapter provides information for the initial inspection and preparation for use of the ShockLine MS46122A/B Series VNA and includes information on instrument installation, loading ShockLine Software, required operating environment, power requirements, and initial inspection. After power up, the various power modes are described with general warm-up and calibration time intervals. The preventive maintenance section includes information on cleaning along with preparation for storage or shipment.
3-2 Unpacking the Product
Initial InspectionInspect the shipping container for damage. If the container or cushioning material is damaged, retain until the contents of the shipment have been checked against the packing list and the instrument has been checked for mechanical and electrical operation. If the ShockLine MS46122A/B Series VNA is physically damaged, notify your local sales representative or Anritsu Customer Service. If either the shipping container is damaged or the cushioning material shows signs of stress, notify the carrier as well as Anritsu. Keep the shipping materials for the carrier’s inspection.
Preparation for UseThe ShockLine MS46122A/B Series VNA requires software installation. To interface with the instrument through direct manual control, a PC running Windows 7 or higher with keyboard, mouse, monitor or touchscreen, ShockLine software, and interfacing USB cable are required.
3-3 Operating Environment and Power RequirementsBefore installing the ShockLine MS46122A/B Series VNA in its operating environment, ensure airflow passages around the instrument are clear. Proper ventilation is of particular importance whenever the unit is being rack mounted. The ShockLine MS46122A/B Series VNA can be operated within the following environmental limits:
Table 3-1. Operational Environmental and Power Requirements
Parameter Specification
Environmental Requirements (per MIL-PRF-28800F; class 3)
Operating Temperature Range: 0 to +50 degrees Celsius Relative Humidity: 5 % to 95 % at +30 degrees Celsius, non-condensing
Power Requirements
Voltages: 90 to 264 VAC maximum (single phase)Frequency: 47 to 63 Hz (power factor controlled)Power: 550 VA maximumInstallation Category: The ShockLine MS46122A/B Series VNA is intended for
Installation Category (Over-voltage Category) II

3-4 Power-On/Power-Off Procedures Installation
3-2 PN: 10410-00340 Rev: T MS46122A/B OM
3-4 Power-On/Power-Off ProceduresThe power-on procedure involves connecting the instrument power supply to AC Mains, using the front panel standby power switch to turn the instrument to standby mode, and then using the instrument software to toggle the instrument into operate mode. The power-off procedure involves switching the front panel standby power switch to off and unplugging the power supply from the unit to turn the instrument off.
Procedure – Power-On to Standby ModeTo turn the instrument on:
1. Connect a power cord to the power supply. Connect the DC connector from the power supply to the power input connection on the front of the MS46122A/B. See Figure 3-1
2. Connect the AC power cord to local AC mains power.
3. Turn on the standby power switch. The MS46122A/B is now in standby mode.
Warning
When supplying power to this equipment, connect the accessory power supply to a 3-pin grounded power outlet connected in turn to local AC Mains. If a grounded 3-pin outlet is not available, use a conversion adapter and ground the green wire, or connect the equipment frame to a suitable ground. If power is supplied without grounding the equipment, there is a risk of receiving a severe or fatal electric shock.
Note
Unplugging the instrument, turning the standby power switch to off, or unplugging the usb cable when the unit is in operate mode will cause the ShockLine software interface to close. A popup dialog window will appear on the controller pc asking the user whether or not they would like to save their settings allowing the user to save their work. After the save is done the ShockLine software will close.
1. Standby Power Switch 2. Power Supply Input ConnectionFigure 3-1. Front Panel Power Connection to AC Mains Power
1 2

Installation 3-4 Power-On/Power-Off Procedures
MS46122A/B OM PN: 10410-00340 Rev: T 3-3
Procedure – Standby Mode to Operate ModeTo set the instrument to operate mode:
• Connect the MS46122A/B to the user provided PC via the USB cable included with the unit.
• Start the ShockLine software by double clicking the ShockLine icon on the desktop.
• When fully in operate mode, the computer controlling the ShockLine MS46122A/B Series VNA displays the main trace display with the application menus on the right side. See Figure 4-1, “User Interface - Four Traces - FREQUENCY Menu (simulated data)” for a typical full screen display.
Procedure – Power-OffTurn off the instrument by toggling the front panel standby power switch and unplugging the external power supply. Shutting down the ShockLine software on the external pc does not power down the MS46122A/B hardware. After turning off the instrument, you must wait at least 15 seconds before turning the instrument back on again. This delay is required to assure a reliable cold start. Switching off the standby power switch or unplugging the external power supply from the VNA will cause the ShockLine software on the external pc controlling the unit to shutdown.
NoteWhen placing the ShockLine MS46122A/B Series VNA in operation, allow at least 30 minutes of warm-up time in the operate mode before using the VNA to assure stable operation and the highest possible accuracy.
Figure 3-2. ShockLine Series VNA Startup Splash Screen

3-5 External Control of ShockLine VNA Installation
3-4 PN: 10410-00340 Rev: T MS46122A/B OM
3-5 External Control of ShockLine VNA
Connecting the External ComputerAfter unpacking, the ShockLine MS46122A/B Series VNA is ready for use. In order to enable the ShockLine VNA application to control the MS46122A/B, you must connect a USB A to Mini-B cable between the VNA and to an external computer loaded with the ShockLine software.
3-6 Installing ShockLine Software
Preparation for Software InstallationAll instrument functions are performed using:
• An external PC controller running ShockLine software with Windows 7 or higher
• USB 2.0 connection between the external PC controller and the MS46122 VNA
• Graphical User Interface (GUI) control or remote SCPI or IVI-C programming and interfacing
The MS46122A/B can be controlled:
1. Remotely, via USB controlled SCPI or IVI-C.
2. Directly through the GUI.
Software Installation Procedure1. Locate and connect the USB cable from the MS46122A/B VNA to the PC controller USB port.
2. Download and install the MS46122A/B ShockLine latest software onto the PC from the Anritsu Website: https://www.anritsu.com/search/en-US/default?q=mechanical+calibration+kit&sort=date:D:L:d1#q=MS46122B%20software
3. If the download is successful. a ShockLine icon will appear on your PC screen.
4. Run the ShockLine software installer as Administrator and follow the instructions displayed on the monitor to complete the installation of the software into the PC.
1. Mini USB PortFigure 3-3. ShockLine MS46122A/B Series VNA USB Connection
Note
By default the ShockLine application is designed to run in Admin mode. To change the default, right-click on the ShockLine application icon and then select Properties. In Properties select the Shortcut tab and the Advance button. In the Advanced Properties dialog, uncheck the Run as administrator box and then OK. Now users with standard access to the PC will be able to log into the PC and access the ShockLine application.
1

Installation 3-7 Running the ShockLine Software Application
MS46122A/B OM PN: 10410-00340 Rev: T 3-5
5. To use SCPI with TCP/IP protocol, SOCKETS should be used. The user will have to download a development tool to setup the socket and there are many open source development tools for this purpose. Sockets will run SCPI with or without NI VISA.
6. For IVI use, download the IVI-C driver from the ShockLine website:https://www.anritsu.com/search/default?q=mechanical+calibration+kit&sort=date:D:L:d1#q=MS46122B%20IVI
7. Double click the ShockLine desktop icon to launch the ShockLine software to use the MS46122A/B with the graphical user interface.
3-7 Running the ShockLine Software ApplicationIf you have not done so, refer to Section “Preparation for Software Installation” on page 3-4 to prepare the ShockLine software installation before continuing to this section.
Launching the ShockLine SoftwareThe following simple step-by-step procedure will setup the ShockLine VNA for use with ShockLine software.
1. Launching the ShockLine software without plugging in the USB cable from the VNA to the controller first will result in the software asking the user if they want to run in simulation mode. See Figure 3-4. If you want to run in Simulation mode, go to Section 3-8 “Simulation Mode” on page 3-6.
2. Open the ShockLine software. You should see a GUI interface screen as Figure 4-1 on page 4-1.
If no GUI interface is displayed, then un-plug and re-plug the VNA USB to the controller and then reopen the ShockLine software.
3. To validate the software connection, check if the VNA is sweeping.
• A sweep is indicated by a cursor moving along the bottom of the display(s).
4. If the VNA USB connection to the controller is removed, a warning message will appear stating that the Anritsu hardware can not be detected and ask the user if the setup should be saved before closing the application.
Figure 3-4. No Hardware Prompt
Note
By default the ShockLine application is designed to run in Admin mode. To change the default, one can right-click on the ShockLine application icon and then select Properties. In Properties select the Shortcut tab and the Advance button. In the Advanced Properties dialog, uncheck the Run as administrator box and then OK. Now users with standard access to the PC will be able to log into the PC and access the ShockLine application.

3-8 Simulation Mode Installation
3-6 PN: 10410-00340 Rev: T MS46122A/B OM
3-8 Simulation ModeWhen the ShockLine VNA software is being initiated, the program will provide the user a choice to select Simulation Mode when there is no hardware detected. The program will prompt “No hardware is detected” when the Micro USB is not connected from the ShockLine MS46122A/B to a PC or when the user is using the software on a standalone PC for simulation only.
Simulation Mode provides the same ShockLine VNA GUI as when hardware is detected. Simulation Mode provides the user testing scenarios with the benefits of real testing, except there are no real measurements resulting from a hardware test setup.
Benefits of Simulation Mode include:
• Import .SnP files to manipulate waveforms to be differential or time domain.
• Rework programming scenarios to check commands or setups
• Gain familiarity with the ShockLine GUI menus.
The following simple step-by-step procedure will setup the ShockLine VNA software in Simulation Mode.
Launch the ShockLine program from the icon on your PC, or download the program from the Anritsu ShockLine VNA Drive/Firmware/Software download library located at:https://www.anritsu.com/en-US/test-measurement/support/downloads?model=MS46122B
1. Download the ShockLine VNA software from the Download Library:
• Once the ShockLine software is loaded onto your PC, the initial startup screen will appear as shown in Figure 3-5.
Figure 3-5. ShockLine GUI Initialization Screen

Installation 3-8 Simulation Mode
MS46122A/B OM PN: 10410-00340 Rev: T 3-7
2. From the NO HARDWARE FOUND dialog box, Figure 3-6, select YES to run in Simulation Mode.
• No hardware will be detected if running the software on an independent computer for simulation or the USB micro cable is not connected or has been disconnected from the controller.
3. Once Simulation Mode is selected, the default menu screen appears, see Figure 3-7.
4. Select the menu/option configuration that you wish to simulate.
5. Once the ShockLine VNA model/configuration has been selected, press OK. The menus within the simulated program will provide the appropriate menu screens for the selected model/option configurations selected.
To learn more about the User Interface, see Chapter 4, “User Interface Display”.
Figure 3-6. ShockLine GUI Initialization Screen
Figure 3-7. Simulator Select Instrument

3-8 Simulation Mode Installation
3-8 PN: 10410-00340 Rev: T MS46122A/B OM
MS46122A/B OM PN: 10410-00340 Rev: T 4-1
Chapter 4 — User Interface Display
4-1 Chapter OverviewThe chapter describes the general display options of the ShockLine MS46122A/B Series VNA and provides a general description of the Menu bar, the Icon toolbar, and the right-side function menus. General descriptions and procedures are provided for trace graph setup, marker setup, and limit line setup.
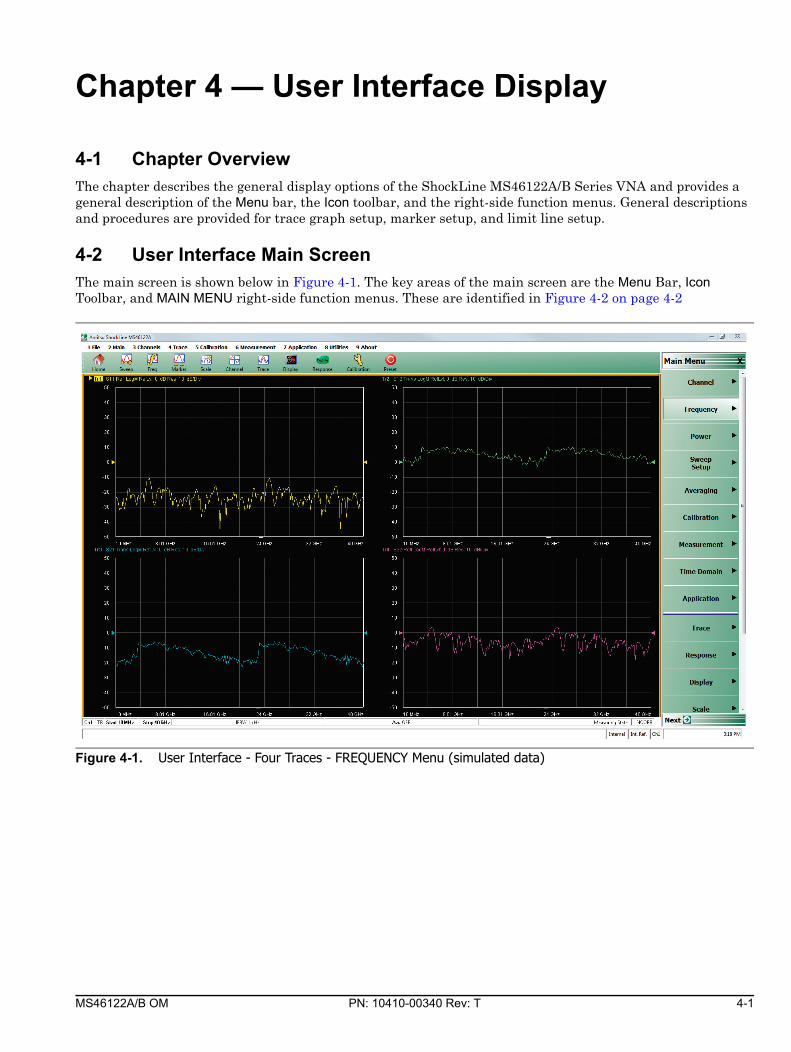
4-2 User Interface Main ScreenThe main screen is shown below in Figure 4-1. The key areas of the main screen are the Menu Bar, Icon Toolbar, and MAIN MENU right-side function menus. These are identified in Figure 4-2 on page 4-2
Figure 4-1. User Interface - Four Traces - FREQUENCY Menu (simulated data)

4-2 User Interface Main Screen User Interface Display
4-2 PN: 10410-00340 Rev: T MS46122A/B OM
User Interface Control and Display AreasThe instrument main display can be manipulated by clicking with an attached USB mouse, though the keyboard can also be used for some items.. Figure 4-2 shows the general display areas for a single channel displaying four graphical traces.
1. Menu Bar – Displays nine (9) drop down menus: FILE, MAIN, CHANNEL, TRACE, CALIBRATION, MEASUREMENT, APPLICATION, UTILITIES, and ABOUT.
2. Icon Toolbar – User-configured with up to 20 user-selected quick access icons.3. Field Toolbar – Appears only when field button is clicked for input. Display field for value, with one or more units
(such as dB, dBm, or Hz), an Enter button, and an X close button.
4. Display Area – Displays from one to 16 trace display graphs. Each trace display can optionally have from one to 12 markers, a reference marker, and an upper and lower limit line.
5. Menu Title – Displays the name of the displayed right-side menu. Menu titles are unique to each menu.6. Menu Buttons – The menu buttons allow the user to set parameters, make configuration selections, read result
values, start processes, toggle between two or more values, display sub-menus, and display dialog boxes.
7. Menu Navigation Buttons – The navigation buttons always appear at the bottom of the right-side menu and allow browser-like forward and backward navigation through the user’s history. Back returns to previous selected higher-level menu, Next returns to a previously selected lower-level menu, and Home returns to the MAIN MENU.
8. System Status Bar – Displays status messages, and configuration status that affects the entire instrument.9. Trace Status Bar – Provides status for active trace near the bottom of the screen.
10.Tableau Data Display/Input Area – The tableau area only appears when the appropriate menu button is selected. When selected, the display shrinks upwards and the tabular data area expands.
Figure 4-2. User Interface Display Areas
1 3
79 8
2 54 6
10
User Interface Display 4-2 User Interface Main Screen
MS46122A/B OM PN: 10410-00340 Rev: T 4-3
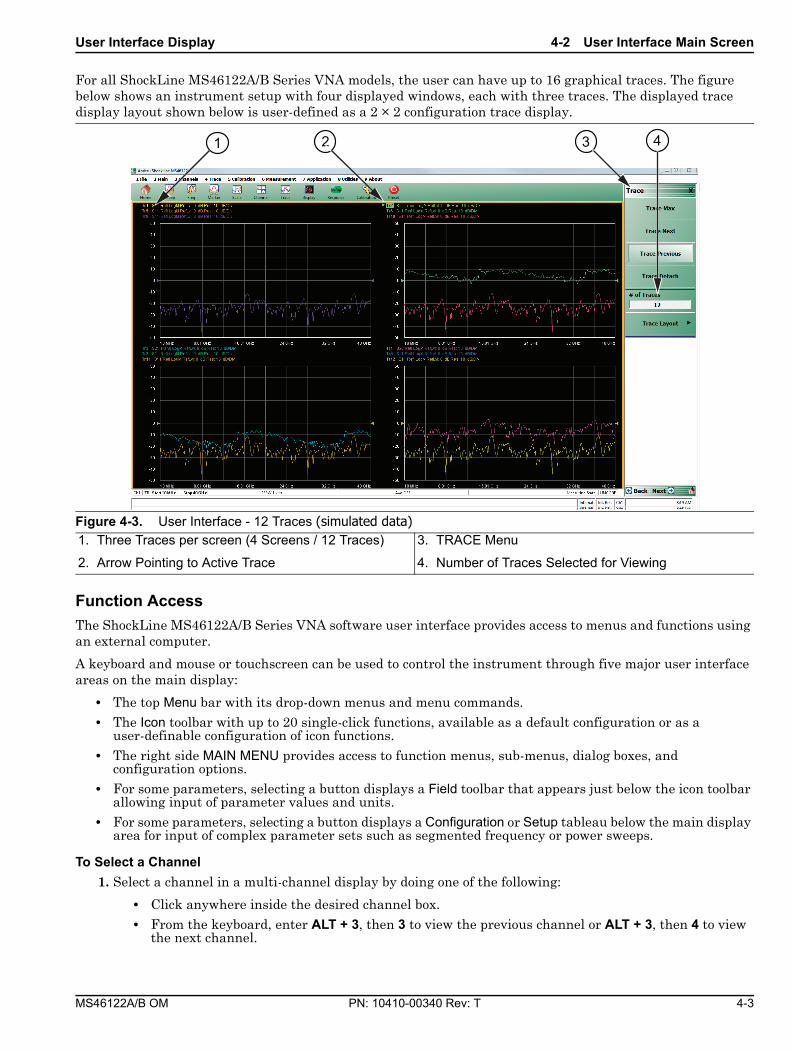
For all ShockLine MS46122A/B Series VNA models, the user can have up to 16 graphical traces. The figure below shows an instrument setup with four displayed windows, each with three traces. The displayed trace display layout shown below is user-defined as a 2 × 2 configuration trace display.
Function AccessThe ShockLine MS46122A/B Series VNA software user interface provides access to menus and functions using an external computer.
A keyboard and mouse or touchscreen can be used to control the instrument through five major user interface areas on the main display:
• The top Menu bar with its drop-down menus and menu commands.
• The Icon toolbar with up to 20 single-click functions, available as a default configuration or as a user-definable configuration of icon functions.
• The right side MAIN MENU provides access to function menus, sub-menus, dialog boxes, and configuration options.
• For some parameters, selecting a button displays a Field toolbar that appears just below the icon toolbar allowing input of parameter values and units.
• For some parameters, selecting a button displays a Configuration or Setup tableau below the main display area for input of complex parameter sets such as segmented frequency or power sweeps.
To Select a Channel1. Select a channel in a multi-channel display by doing one of the following:
• Click anywhere inside the desired channel box.
• From the keyboard, enter ALT + 3, then 3 to view the previous channel or ALT + 3, then 4 to view the next channel.
Figure 4-3. User Interface - 12 Traces (simulated data)1. Three Traces per screen (4 Screens / 12 Traces)
2. Arrow Pointing to Active Trace
3. TRACE Menu
4. Number of Traces Selected for Viewing
1 32 41 32 41 32 4

4-2 User Interface Main Screen User Interface Display
4-4 PN: 10410-00340 Rev: T MS46122A/B OM
• On the top menu bar, select Menu Bar | Channels | Channel Prev or Menu Bar | Channels | Channel Next.
• On the right side menu, select MAIN | Channel | CHANNEL | Chan Next or Chan Previous.
2. The selected channel border changes from gray to white. (Figure 4-3, “User Interface - 12 Traces (simulated data)” on page 4-3 shows Channel 2 (Ch2) selected.)
To Maximize a Channel Display1. Use one of the methods above to select the desired channel.
2. Do one of the following to maximize the selected channel:
• From the keyboard, enter CTRL + 1 or ALT + 3, then 2.
• On the main display, double-click the channel border box.
• On the top menu bar, select Menu Bar | Channels | Channel Max.• On the right side menu, select MAIN | Channel | CHANNEL | Chan. Max.
3. The selected channel now fills the display area.
• Maximize a channel display to review the channel status information at the bottom of its screen.
To Make the Display Area Larger1. The top Icon toolbar and the right side menus can be removed to make the display area larger.
2. Remove the Icon toolbar by doing one of the following:
• From the keyboard, select ALT + 8, then 2.• On the top menu bar, select Menu Bar | Utilities | Toolbar Off.
3. The Icon toolbar disappears. Repeat Step #2 to make the icon toolbar reappear.
4. Remove the right side menus by doing one of the following:
• From the keyboard, enter ALT + 8, then 7.
• On the top menu bar, select Menu Bar | Utilities | Clear.5. The right side menu disappears. Repeat Step #4 to make the menu reappear.
To Select Traces1. Use one of the methods above to maximize the channel display.
2. Select a trace in a multi-trace display by doing one of the following:
• With a mouse, single click the trace title.
• If you double-click either the trace title or anywhere within the trace, the trace is both selected and maximized.
• From the keyboard, enter ALT + 4, then 7 to view the previous trace or ALT + 4, then 8 to view the next trace.
• On the top menu bar, select Menu Bar | Trace | Trace Prev or Menu Bar | Trace | Trace Next.• On the right side menu, select MAIN | Trace | TRACE | Trace Previous or Trace Next.• The selected trace number is highlighted and a left arrow appears.
NoteThe Ch->Max, Ch->Next, and Ch-Prev icons are available for the icon toolbar. These icons provide one click access to channel maximum, channel next, and channel previous functions. They can be added to the icon toolbar for a custom configuration and saved as part of a preset configuration.
f
Trace 1 Selected Trace 1 Not SelectedFigure 4-4. Trace Selection Indicator

User Interface Display 4-2 User Interface Main Screen
MS46122A/B OM PN: 10410-00340 Rev: T 4-5
To Maximize a Trace Display1. Use one of the methods above to select the desired trace.
2. For a maximum display, make sure the trace’s channel is maximized.
3. Do one of the following to maximize the selected trace:
• From the keyboard, select ALT + 4, then 6.
• On the main display, double-click anywhere in the trace title.
• On the top menu bar, select Menu Bar | Trace | Trace Max.• On the right side menu, select MAIN | Trace | TRACE | Trace Max.
4. The selected trace now fills the display area.
• Maximize a trace display to review the trace status information at the bottom of trace screen.
5. Repeat the actions above to return the trace to its normal size.
NoteThe Tr->Max, Tr->Next, and Tr->Previous icons are available for the Icon toolbar. These icons provide one click access to trace maximum, trace next, and trace previous functions. They can be added to the icon toolbar for a custom configuration and saved as part of a preset configuration.

4-3 Using the Menu Bar Interface User Interface Display
4-6 PN: 10410-00340 Rev: T MS46122A/B OM
4-3 Using the Menu Bar Interface
Menu Bar OverviewThe Menu bar at the top of the screen provides drop-down menus for access to major ShockLine VNA functions and dialogs. The figure below shows all of the available Menu bar functions and command menus.
Menu Bar General OperationThe Menu bar drop-down menus and commands can be accessed by clicking on the Menu bar and required command.
The keyboard can be used to enter the menu and/or command short cut, most of which use the ALT (ALTERNATE) key. To access a menu from the keyboard, press and hold the ALT (ALTERNATE) key and the number in front of the menu name.
• For example, ALT + 1 opens the FILE menu.
• For example, ALT + 8 opens the UTILITY menu.
To access most commands listed on the drop-down menus, follow the ALT + sequence with the menu command number.
• For example, to access the Preset command on the UTILITIES menu, enter ALT + 8, then 5.
• For example, to access the right side SYSTEM menu, enter ALT + 8, then 1.
Some Menu bar commands can also be accessed by using the keyboard Control (CTRL) key. Press and hold the CTRL key and then the letter key.
• For example, to recall a previously saved setup, enter CTRL + O (letter O).
• For example, to print the current display screen, enter CTRL + P.
Figure 4-5. Menu Bar Major Functions, Drop-Down Menus, and Commands

User Interface Display 4-3 Using the Menu Bar Interface
MS46122A/B OM PN: 10410-00340 Rev: T 4-7
Menu Bar Drop-down Menus and CommandsThe Menu bar appears at the top of the instrument display and provides direct access to system menus and some button functions.
The table below summarizes all Menu bar drop down commands. The MS46121A/B, MS46122A/B, MS46131A, MS46322A/B User Interface Reference Manual describes the resultant menus or commands in greater detail.
Table 4-1. Menu Bar Drop-Down Menu Descriptions (1 of 10)
Menu and Command Name Menu and Command Descriptions
FILE Drop-Down Menu
• Keyboard: ALT + 1• Menu Bar | File• MAIN | File | FILE
Recall SetupCommand
Select displays the RECALL SETUP dialog box and allows the recall of previously saved setup and/or calibration files:– Active Channel Setup and Calibration (.chx) File– Active Channel Setup (.stx) File– All Channel Setup (.sta) File• Keyboard: CTRL + O (letter O)
• Menu Bar | File | Recall Setup• MAIN | File | FILE | Recall Setup | RECALL SETUP Dialog Box
Recall DataCommand
Select displays the RECALL DATA dialog box and allows the recall of a previously saved active channel and/or active trace data file of these types:– Active Channel S1P (.s1p), S2P (.s2p), S3P (.s3p), S4P (.s4p) Files– Formatted Data into Active Trace (.tdf) File– Unformatted Data into Active Trace (.tdu) File– Formatted Data into Active Trace Memory (.tdf) File– Unformatted Data into Active Trace Memory (.tdu) File• Keyboard: ALT + O (letter O)• Menu Bar | File | Recall Data
• MAIN | File | FILE | Recall Data | RECALL DATA Dialog Box
Save SetupCommand
Select displays the Save Setup dialog box and allows the user to save the currently applied system presets configuration file.
• Keyboard: CTRL + S• Menu Bar | File | Save Setup
• MAIN | File | FILE | Save Setup | SAVE SETUP Dialog Box

4-3 Using the Menu Bar Interface User Interface Display
4-8 PN: 10410-00340 Rev: T MS46122A/B OM
Save DataCommand
Select displays the SAVE DATA (Active Channel.txt) dialog box. Use this dialog to save the current channel data file.• Keyboard: ALT + S
• Menu Bar | File | Save Data• MAIN | File | FILE | Save Data | SAVE DATA Dialog Box
PrintCommand
Select displays the Windows PRINT dialog box to print the current main display.• Keyboard: CTRL + P• Menu Bar | File | Print
• MAIN | File | Print | PRINT Dialog BoxExitCommand
Select displays a confirmation dialog box. Click OK to exit the ShockLine application and return to the Windows desktop. Click Cancel to remain in the ShockLine application.• Menu Bar | File | Exit
Table 4-1. Menu Bar Drop-Down Menu Descriptions (2 of 10)
Menu and Command Name Menu and Command Descriptions

User Interface Display 4-3 Using the Menu Bar Interface
MS46122A/B OM PN: 10410-00340 Rev: T 4-9
MAIN Drop-Down Menu
• Keyboard: ALT + 2• Menu Bar | Main
FrequencyCommand
Select displays the right-side FREQUENCY menu. • Front Panel Key: Frequency• Keyboard: ALT + 2, then 1• Menu Bar | Channels | Frequency• MAIN | Frequency | FREQUENCY
PowerCommand
Select displays the right-side POWER menu. • Front Panel Key: Power• Keyboard: ALT + 2, then 2• Menu Bar | Channels | Power• MAIN | Power | POWER
SweepCommand
Select displays the right-side SWEEP SETUP menu. • Front Panel Key: Sweep• Keyboard: ALT + 2, then 3• Menu Bar | Channels | Sweep• MAIN | Sweep Setup | SWEEP SETUP
AveragingCommand
Select displays the right-side AVERAGING menu. • Front Panel Key: Avg (Average)
• Keyboard: ALT + 2, then 4• Menu Bar | Channels | Averaging• MAIN | Averaging | AVERAGING
Table 4-1. Menu Bar Drop-Down Menu Descriptions (3 of 10)
Menu and Command Name Menu and Command Descriptions

4-3 Using the Menu Bar Interface User Interface Display
4-10 PN: 10410-00340 Rev: T MS46122A/B OM
CHANNELS Drop-Down Menu
• Keyboard: ALT + 3
• Menu Bar | Channels• MAIN | Channel | CHANNEL
Channel MenuCommand
Select displays the right-side CHANNEL menu.• Keyboard: ALT + 3, then 1• Menu Bar | Channels | Channel Menu
• MAIN | Channel | CHANNEL
Channel MaxCommand
Select maximizes the display of the active channel. Select again returns to the previous multi-channel display.• Keyboard: ALT + 3, then 2• Keyboard: CTRL + 1
• Menu Bar | Channels | Channel Max• MAIN | Channel | CHANNEL | Chan. Max
Channel PreviousCommand
Selects the next lower channel number. If channel 1 was previously selected, selects the highest numbered channel.• Keyboard: ALT + 3, then 3• Menu Bar | Channels | Channel Prev.
• MAIN | Channel | CHANNEL | Chan. Previous
Channel NextCommand
Selects the next higher channel number. If the highest numbered channel was previously selected, selects channel 1.
• Keyboard: ALT + 3, then 4• Menu Bar | Channels | Channel Next• MAIN | Channel | CHANNEL | Chan. Next
Table 4-1. Menu Bar Drop-Down Menu Descriptions (4 of 10)
Menu and Command Name Menu and Command Descriptions

User Interface Display 4-3 Using the Menu Bar Interface
MS46122A/B OM PN: 10410-00340 Rev: T 4-11
TRACE Drop-Down Menu
• Keyboard: ALT + 4
• Menu Bar | Trace• MAIN | Trace | TRACE
ResponseCommand
Select displays the right-side RESPONSE menu.• Keyboard: ALT + 4, then 1• Menu Bar | Trace | Response
• MAIN | Response | RESPONSE
DisplayCommand
Select displays the right-side DISPLAY menu.
• Keyboard: ALT + 4, then 2• Menu Bar | Trace | Display• MAIN | Display | DISPLAY
ScaleCommand
Select displays the right-side SCALE menu. The name of the SCALE menu (and the buttons on it) depend on the display type selected such as: – Scale (Log Mag)– Scale (Lin Mag)– Scale (Phase)– Scale (Real)– Scale (Imag)– Scale (SWR)• Keyboard: ALT + 4, then 3
• Menu Bar | Trace | Scale• MAIN | Scale | SCALE
MarkerCommand
Select displays the right-side MARKERS [1] menu. • Keyboard: ALT + 4, then 4• Menu Bar | Trace | Marker
• MAIN | Marker | MARKER [1]
Trace MenuCommand
Select displays the right-side TRACE menu.
• Keyboard: ALT + 4, then 5• Menu Bar | Trace | Trace Menu
• MAIN | Trace | TRACE
Table 4-1. Menu Bar Drop-Down Menu Descriptions (5 of 10)
Menu and Command Name Menu and Command Descriptions

4-3 Using the Menu Bar Interface User Interface Display
4-12 PN: 10410-00340 Rev: T MS46122A/B OM
Trace MaxCommand
Select maximizes the active trace to full screen display. Selecting again, returns the trace to the standard multi-trace display.• Keyboard: ALT + 4, then 6
• Menu Bar | Trace | Trace Max• MAIN | Trace | TRACE | Trace Max
Trace PreviousCommand
Selects the next lower trace number on the active channel. If Trace 1 is currently selected, the highest numbered trace is selected. If the current trace is not maximized, the previous trace will not be maximized. If the current trace is maximized, the previous trace will be maximized.• Keyboard: ALT + 4, then 7
• Menu Bar | Trace | Trace Prev.• MAIN | Trace | TRACE | Trace Previous
Trace NextCommand
Selects the next higher trace number on the active channel. If the highest numbered trace is currently displayed, the Trace 1 is displayed. If the current trace is not maximized, the next trace will not be maximized. If the current trace is maximized, the next trace will be maximized.• Keyboard: ALT + 4, then 8• Menu Bar | Trace | Trace Next
• MAIN | Trace | TRACE | Trace Previous
CALIBRATION Drop-Down Menu
The CALIBRATION drop-down menu has one command that selects the right-side CALIBRATION menu• Keyboard: ALT + 5
• Menu Bar | Calibration• MAIN | Calibration | CALIBRATION
MEASUREMENT Drop-Down Menu
Select displays the right-side MEASUREMENT menu.• Keyboard: ALT + 6• Menu Bar | Measurement
• MAIN | Measurement | MEASUREMENT
APPLICATION Drop-Down Menu
The APPLICATION menu/command selects the right-side APPLICATION menu.• Keyboard: ALT + 7
• Menu Bar | Application• MAIN | Application | APPLICATION
Table 4-1. Menu Bar Drop-Down Menu Descriptions (6 of 10)
Menu and Command Name Menu and Command Descriptions

User Interface Display 4-3 Using the Menu Bar Interface
MS46122A/B OM PN: 10410-00340 Rev: T 4-13
UTILITIES Drop-Down Menu
f
• Keyboard: Alt + 8
• Menu Bar | Utilities
SystemCommand
Select displays the right-side SYSTEM menu.
• Keyboard: Alt + 8, then 1• Menu Bar | Utilities | System• MAIN | System | SYSTEM
Toolbar OffCommand
Toggles the ICON TOOLBAR, immediately below the Menu Bar, on and off.• Keyboard: Alt + 8, then 2
• Menu Bar | Utilities | Toolbar Off
Customize ToolbarCommand
Select displays the CUSTOMIZE TOOLBAR dialog box and allows the user to select which icons are to be displayed in the toolbar. Up to 20 icons can be displayed at one time. The Icon Toolbar configuration is saved when a Preset Save is completed.• Keyboard: Alt + 8, then 3• Menu Bar | Utilities | Customize Toolbar
Channel TitleCommand
Select displays the DISPLAY SETUP menu and allows a user-defined title to be applied to and displayed above the active channel. Each channel can have a different or the same title.• Keyboard: Alt + 8, then 4
• Menu Bar | Utilities | Channel Title• MAIN | Display | DISPLAY | Display Area Setup | DISPLAY SETUP | Edit Chan.
Title | EDIT CHANNEL TITLE Dialog Box
Table 4-1. Menu Bar Drop-Down Menu Descriptions (7 of 10)
Menu and Command Name Menu and Command Descriptions

4-3 Using the Menu Bar Interface User Interface Display
4-14 PN: 10410-00340 Rev: T MS46122A/B OM
PresetCommand
• Returns the instrument to its prior saved state which can be either the factory-default preset, or a user-defined setup. The PRESET SETUP menu selection defines which is used.
• Keyboard: Alt + 8, then 5
• Menu Bar | Utilities | Preset• No right-side menu available to preset the instrument:
– Use the Menu Bar Function above.
Preset SetupCommand
Select displays the PRESET SETUP menu and allows user-defined preset parameters to be applied during a preset command.• Keyboard: Alt + 8, then 6
• Menu Bar | Utilities | Preset Setup
ClearCommand
Select toggles the displayed right-side menu off and on. When toggled back on, the previously selected menu is displayed. For example, if the CALIBRATE function menu was displayed when the display was cleared, the CALIBRATE function menu is again displayed when Clear is selected a second time.
• Keyboard: Alt + 8, then 7• Menu Bar | Utilities | Clear Command
KeyPad OffCommand
Select toggles the display of the keypad dialog window off and on. The keypad allows for easier entry of input parameters.• Keyboard: Alt + 8, then 8• Menu Bar | Utilities | KeyPad Off Command
Table 4-1. Menu Bar Drop-Down Menu Descriptions (8 of 10)
Menu and Command Name Menu and Command Descriptions

User Interface Display 4-3 Using the Menu Bar Interface
MS46122A/B OM PN: 10410-00340 Rev: T 4-15
About Drop-Down Menu
• Keyboard: ALT + 9• Menu Bar | About
ShockLine InfoCommand
Select displays the SHOCKLINE INFO dialog box with typical information as shown below.
The dialog box provides instrument configuration information. Click OK to close the dialog box. The following information is provided:– Copyright Statement– Software Version– Firmware Version– Model Number– Serial Number– Options Installed
Keypad• Keyboard: ALT + 9, then 1• Menu Bar | About | ShockLine Info
Table 4-1. Menu Bar Drop-Down Menu Descriptions (9 of 10)
Menu and Command Name Menu and Command Descriptions
x.xx

4-3 Using the Menu Bar Interface User Interface Display
4-16 PN: 10410-00340 Rev: T MS46122A/B OM
Contact UsCommand
Select displays the CONTACT US dialog box with typical information as shown below.
Table 4-1. Menu Bar Drop-Down Menu Descriptions (10 of 10)
Menu and Command Name Menu and Command Descriptions

User Interface Display 4-4 Icon Toolbar
MS46122A/B OM PN: 10410-00340 Rev: T 4-17
4-4 Icon Toolbar
OverviewThe Icon Toolbar is located immediately below the Menu Bar and allows single-click access to many menus and functions. The icon toolbar is user-configurable and up to 20 icons can be displayed in any configuration.
Using the Icon Toolbar InterfaceThe default Icon Toolbar is shown below:
The definitions and functions of the default icons are (from left to right):
• Home Icon – Select displays the right side MAIN MENU. Does not reset or lose previously set values.
• Sweep Icon – Select displays the right-side Sweep menu.
• Freq Icon – Select displays the right-side FREQUENCY menu.
• Power Icon – Select displays the right-side POWER menu.
• Marker Icon – Select displays the right-side MARKERS [1] menu.
• Scale Icon – Select displays the right-side SCALE menu.
• Channel Icon – Select displays the right-side CHANNEL menu.
• Trace Icon – Select displays the right-side TRACE menu.
• Display Icon – Select displays the right-side DISPLAY menu.
• Response Icon – Select displays the right-side RESPONSE menu.
• Calibration Icon – Select displays the right-side CALIBRATION menu.
• Preset Icon – Select returns the system to its prior preset status at the time of the last preset save.All available icons are described in the in Table 4-2.
Figure 4-6. Icon Toolbar with Factory Default Function Icons

4-4 Icon Toolbar User Interface Display
4-18 PN: 10410-00340 Rev: T MS46122A/B OM
Available Icon FunctionsThe available icon functions that can be added to a user-defined icon toolbar are listed in Table 4-2. Once configured, a preset save allows the toolbar configuration to be recalled at any time.
The procedures for changing the icon toolbar are described following the icon table and uses the “CUSTOMIZE TOOLBAR Dialog Box” on page 4-24. When a user-defined toolbar is configured, the first selected icon goes to the left-most position on the toolbar. Subsequent selected icons are added to the right-most position on the toolbar.
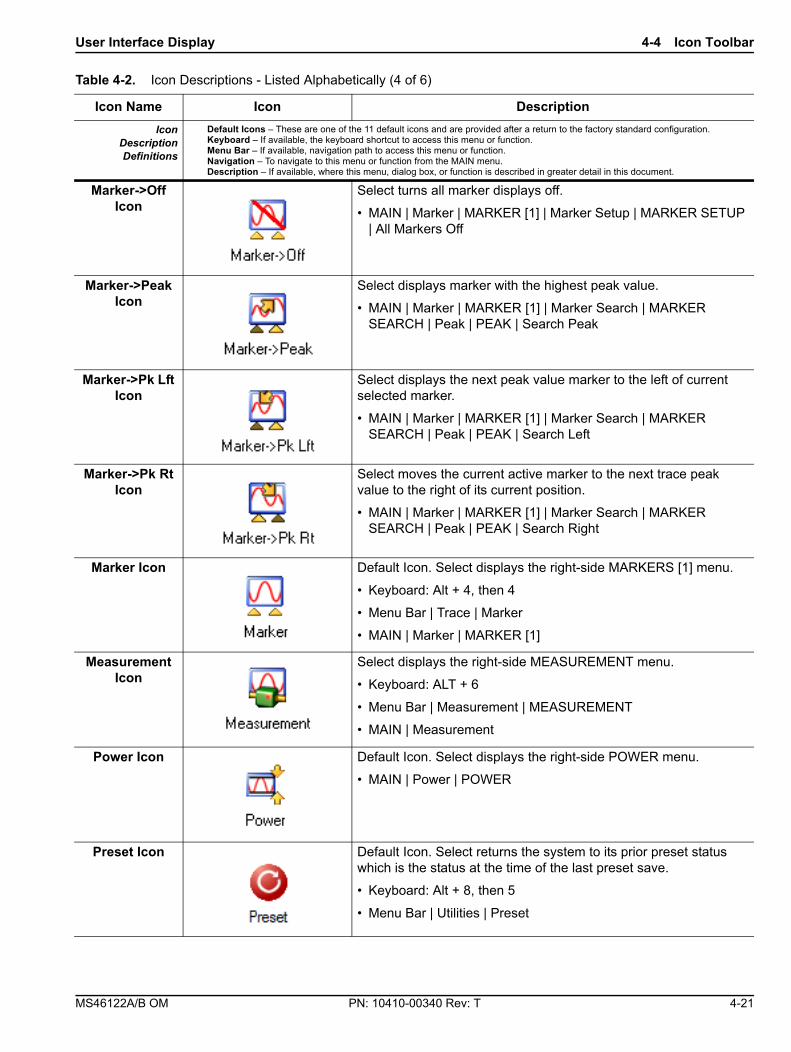
Table 4-2. Icon Descriptions - Listed Alphabetically (1 of 6)
Icon Name Icon DescriptionIcon
DescriptionDefinitions
Default Icons – These are one of the 11 default icons and are provided after a return to the factory standard configuration.Keyboard – If available, the keyboard shortcut to access this menu or function.Menu Bar – If available, navigation path to access this menu or function.Navigation – To navigate to this menu or function from the MAIN menu.Description – If available, where this menu, dialog box, or function is described in greater detail in this document.
Application Icon
Select displays the right-side APPLICATION menu. • Front Panel Key: Application• Keyboard: ALT + 6• Menu Bar: MENU BAR | 6 Application | 6 APPLICATION• MAIN | Application | APPLICATION
Average Icon Default Icon. Select displays the right-side AVERAGING menu.• Front Panel Key: Avg (Average)• Keyboard: ALT + 2, then 4• MENU BAR | Channel | Averaging• MAIN | Averaging | AVERAGING
Calibration Icon
Default Icon. Select displays the right-side CALIBRATION menu. • Keyboard: ALT + 5• Menu Bar | Calibration
• MAIN | Calibration | CALIBRATION
Continue Icon After a system pause or hold with the Hold icon, the Continue icon resumes operation with all prior settings in effect. • MAIN | Sweep Setup | SWEEP SETUP | Hold Functions | HOLD
FUNCTIONS | Continue
Channel Icon Default Icon. Select displays the right-side CHANNEL menu. • Front Panel Key: Channel• MAIN | Channel | Channel Menu
Ch->Max Icon When multiple channels are used, select activates and displays the channel with the maximum trace value.
• MAIN | Channel | CHANNEL | Channel Max

User Interface Display 4-4 Icon Toolbar
MS46122A/B OM PN: 10410-00340 Rev: T 4-19
Ch->Next Icon When multiple channels are used, select activates and displays the next higher channel number. If the highest channel number is currently active, channel 1 (one) is activated and displayed.• MAIN | Channel | CHANNEL | Channel Next
Ch->Prev Icon When multiple channels are used, select activates and displays the next lower channel number. If channel 1 (one) is currently active, the highest numbered channel is activated and displayed. • MAIN | Channel | CHANNEL | Channel Prev.
Custom Icon 1 Select performs the action defined for Custom Icon 1 using the right-side context menu. After definition, custom-action icons are displayed in the Icon Bar.The steps to define a Custom-action Icon are described in the MS46121A/B, MS46122A/B, MS46131A, MS46322A/B User Interface and Reference Manual (10410-00337).
Custom Icon 2 Select performs the action defined for Custom Icon 2 using the right-side context menu. After definition, custom-action icons are displayed in the Icon Bar.The steps to define a Custom-action Icon are described in the MS46121A/B, MS46122A/B, MS46131A, MS46322A/B User Interface and Reference Manual (10410-00337).
Custom Icon 3 Select performs the action defined for Custom Icon 3 using the right-side context menu. After definition, custom-action icons are displayed in the Icon Bar.The steps to define a Custom-action Icon are described in the MS46121A/B, MS46122A/B, MS46131A, MS46322A/B User Interface and Reference Manual (10410-00337).
Custom Icon 4 Select performs the action defined for Custom Icon 4 using the right-side context menu. After definition, custom-action icons are displayed in the Icon Bar.The steps to define a Custom-action Icon are described in the MS46121A/B, MS46122A/B, MS46131A, MS46322A/B User Interface and Reference Manual (10410-00337).
Custom Icon 5 Select performs the action defined for Custom Icon 5 using the right-side context menu. After definition, custom-action icons are displayed in the Icon Bar.The steps to define a Custom-action Icon are described in the MS46121A/B, MS46122A/B, MS46131A, MS46322A/B User Interface and Reference Manual (10410-00337).
Table 4-2. Icon Descriptions - Listed Alphabetically (2 of 6)
Icon Name Icon DescriptionIcon
DescriptionDefinitions
Default Icons – These are one of the 11 default icons and are provided after a return to the factory standard configuration.Keyboard – If available, the keyboard shortcut to access this menu or function.Menu Bar – If available, navigation path to access this menu or function.Navigation – To navigate to this menu or function from the MAIN menu.Description – If available, where this menu, dialog box, or function is described in greater detail in this document.

4-4 Icon Toolbar User Interface Display
4-20 PN: 10410-00340 Rev: T MS46122A/B OM
Display Icon Default Icon. Select displays the right-side DISPLAY menu. • Keyboard: Alt + 4, then 2
• Menu Bar | Trace | Display• MAIN | Trace | TRACE
Easy Test Icon Select displays the Easy Test dialog box used to load Easy Test scripts. A separate easyTest Tools PC application is used to generate the easyTest work instruction (ETT) files that are loaded by this icon. To get the easyTest tools PC application, download the installer from the Anritsu website.• Keyboard ALT + 8 then 9• Menu Bar | Utilities | EasyTest
File Icon Select displays the right-side FILE menu.
• Keyboard: ALT + 1• MAIN | File | FILE
Freq Icon Default Icon. Select displays the right-side FREQUENCY menu. • MAIN | Frequency | FREQUENCY
Hold Icon Select pauses the system operation, retaining all system presets and current configuration settings.
• MAIN | Sweep Setup | SWEEP SETUP | Hold Functions | HOLD FUNCTIONS | Hold
Home Icon Default Icon. Select displays the right-side main menu. Does not reset or lose previous set values.• MAIN
Marker->Max Icon
Displays marker with maximum value.• MAIN | Marker | MARKER [1] | Marker Search | MARKER
SEARCH | Max
Marker->Min Icon
Select displays the marker with minimum value.• MAIN | Marker | MARKER [1] | Marker Search | MARKER
SEARCH | Min
Table 4-2. Icon Descriptions - Listed Alphabetically (3 of 6)
Icon Name Icon DescriptionIcon
DescriptionDefinitions
Default Icons – These are one of the 11 default icons and are provided after a return to the factory standard configuration.Keyboard – If available, the keyboard shortcut to access this menu or function.Menu Bar – If available, navigation path to access this menu or function.Navigation – To navigate to this menu or function from the MAIN menu.Description – If available, where this menu, dialog box, or function is described in greater detail in this document.
User Interface Display 4-4 Icon Toolbar
MS46122A/B OM PN: 10410-00340 Rev: T 4-21
Marker->Off Icon
Select turns all marker displays off.• MAIN | Marker | MARKER [1] | Marker Setup | MARKER SETUP
| All Markers Off
Marker->Peak Icon
Select displays marker with the highest peak value.• MAIN | Marker | MARKER [1] | Marker Search | MARKER
SEARCH | Peak | PEAK | Search Peak
Marker->Pk Lft Icon
Select displays the next peak value marker to the left of current selected marker.
• MAIN | Marker | MARKER [1] | Marker Search | MARKER SEARCH | Peak | PEAK | Search Left
Marker->Pk Rt Icon
Select moves the current active marker to the next trace peak value to the right of its current position.• MAIN | Marker | MARKER [1] | Marker Search | MARKER
SEARCH | Peak | PEAK | Search Right
Marker Icon Default Icon. Select displays the right-side MARKERS [1] menu.
• Keyboard: Alt + 4, then 4• Menu Bar | Trace | Marker• MAIN | Marker | MARKER [1]
Measurement Icon
Select displays the right-side MEASUREMENT menu.• Keyboard: ALT + 6
• Menu Bar | Measurement | MEASUREMENT• MAIN | Measurement
Power Icon Default Icon. Select displays the right-side POWER menu. • MAIN | Power | POWER
Preset Icon Default Icon. Select returns the system to its prior preset status which is the status at the time of the last preset save. • Keyboard: Alt + 8, then 5
• Menu Bar | Utilities | Preset
Table 4-2. Icon Descriptions - Listed Alphabetically (4 of 6)
Icon Name Icon DescriptionIcon
DescriptionDefinitions
Default Icons – These are one of the 11 default icons and are provided after a return to the factory standard configuration.Keyboard – If available, the keyboard shortcut to access this menu or function.Menu Bar – If available, navigation path to access this menu or function.Navigation – To navigate to this menu or function from the MAIN menu.Description – If available, where this menu, dialog box, or function is described in greater detail in this document.

4-4 Icon Toolbar User Interface Display
4-22 PN: 10410-00340 Rev: T MS46122A/B OM
Print Icon Select displays the PRINT dialog box, usually to print a copy of the main display. Once the dialog box appears, click OK to print; click Cancel to abort.• Keyboard: ALT + 1, then P
• Menu Bar | File | Print• MAIN | File | FILE | Print | PRINT Dialog Box
Response Icon Default Icon. Select displays the right-side RESPONSE menu. • Keyboard: Alt + 4, then 1
• Menu Bar | Trace | Response• MAIN | Response | RESPONSE
Scale Icon Default Icon. Select displays the right-side SCALE menu.
• Keyboard: Alt + 4, then 3• Menu Bar | Trace | Scale
• Main | Scale | SCALE
Sweep Icon Select displays the right-side SWEEP SETUP menu.• MAIN | Sweep Setup | SWEEP SETUP
System Icon Select displays the right-side SYSTEM menu.• Keyboard: Alt + 8, then 1• Menu Bar | Utilities | System
• MAIN | System | SYSTEM
Time Domain Icon
Select displays the right-side Time Domain menu.
• MAIN | Time Domain
Trace Icon
Default Icon. Select displays the right-side TRACE menu. • Keyboard: Alt + 4, then 5• Menu Bar | Trace | Trace Menu
• MAIN | Trace | TRACE
Tr->Max Icon Select maximizes the display with the currently active trace.
• Keyboard: Alt + 4, then 6• Menu Bar | Trace | Trace Max• MAIN | Trace | TRACE | Trace Max
Table 4-2. Icon Descriptions - Listed Alphabetically (5 of 6)
Icon Name Icon DescriptionIcon
DescriptionDefinitions
Default Icons – These are one of the 11 default icons and are provided after a return to the factory standard configuration.Keyboard – If available, the keyboard shortcut to access this menu or function.Menu Bar – If available, navigation path to access this menu or function.Navigation – To navigate to this menu or function from the MAIN menu.Description – If available, where this menu, dialog box, or function is described in greater detail in this document.
User Interface Display 4-4 Icon Toolbar
MS46122A/B OM PN: 10410-00340 Rev: T 4-23
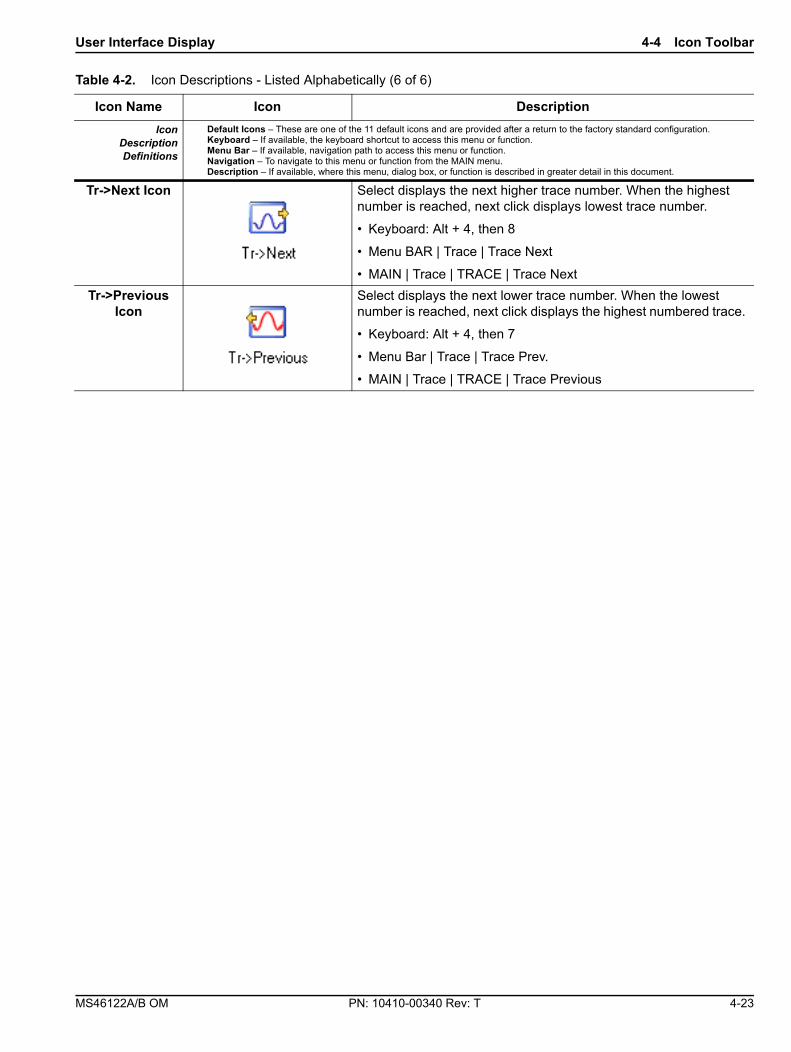
Tr->Next Icon Select displays the next higher trace number. When the highest number is reached, next click displays lowest trace number. • Keyboard: Alt + 4, then 8
• Menu BAR | Trace | Trace Next• MAIN | Trace | TRACE | Trace Next
Tr->Previous Icon
Select displays the next lower trace number. When the lowest number is reached, next click displays the highest numbered trace. • Keyboard: Alt + 4, then 7
• Menu Bar | Trace | Trace Prev.• MAIN | Trace | TRACE | Trace Previous
Table 4-2. Icon Descriptions - Listed Alphabetically (6 of 6)
Icon Name Icon DescriptionIcon
DescriptionDefinitions
Default Icons – These are one of the 11 default icons and are provided after a return to the factory standard configuration.Keyboard – If available, the keyboard shortcut to access this menu or function.Menu Bar – If available, navigation path to access this menu or function.Navigation – To navigate to this menu or function from the MAIN menu.Description – If available, where this menu, dialog box, or function is described in greater detail in this document.

4-4 Icon Toolbar User Interface Display
4-24 PN: 10410-00340 Rev: T MS46122A/B OM
CUSTOMIZE TOOLBAR Dialog BoxUse the CUSTOMIZE TOOLBAR dialog box to setup the Icon toolbar with the icons you need for quick access to commands and functions. Once configured, and after a Preset Configuration save, the Icon toolbar settings can be recalled with the other preset configuration parameters.
Previous• “UTILITIES Drop-Down Menu” on page 4-13
Keyboard• ALT + 8, then 3
Navigation• Menu Bar | Utilities | Customize Toolbar | CUSTOMIZE TOOLBAR Dialog Box
ProcedureWith the CUSTOMIZE TOOLBAR dialog box open, the left-side Available Toolbar Buttons area shows icons that are not in use on the current toolbar, while the right-side Current Toolbar Buttons area shows the current in-use icons.
Removing Icons1. To change the icons in the current icon toolbar, in the right side Current Toolbar Buttons area, select an
icon to remove. When selected, the Add-> and <-Remove buttons become available.
2. Remove unwanted icons as required by selecting the icon and then clicking the <-Remove button.
3. Removed icons appear at the bottom of the Available Toolbar Buttons list.
Adding Icons1. Scroll through the Available Toolbar Buttons list and select an icon to add, then click the Add-> button. The
selected icon appears in the right side Current Toolbar Buttons area.
2. Repeat the selection process until all required icons listed in the right side Current Toolbar Buttons area or you have reached the maximum of 20 icons.
3. In the Current Toolbar Buttons display, the icon displayed at the top of the list will appear on the extreme list of the toolbar. The last icon displayed at the bottom of the list will appear on the extreme right of the toolbar.
Figure 4-7. CUSTOMIZE TOOLBAR Dialog Box

User Interface Display 4-4 Icon Toolbar
MS46122A/B OM PN: 10410-00340 Rev: T 4-25
Moving IconsTo change the left to right sequence of the current icons, select an icon, and click the Move Up/Move Down buttons until the icons are correctly positioned left to right.
Saving the ConfigurationWhen the icons are in the correct sequence. Click the Close button to apply the icons to the icon toolbar. It is recommended that a Preset Save be performed to save the icon toolbar configuration. If the icon toolbar needs adjustment, re-open the Customize Toolbar dialog box and repeat the steps above.
Reset to Factory DefaultTo return the icon toolbar to its factory default state, click the Reset button.
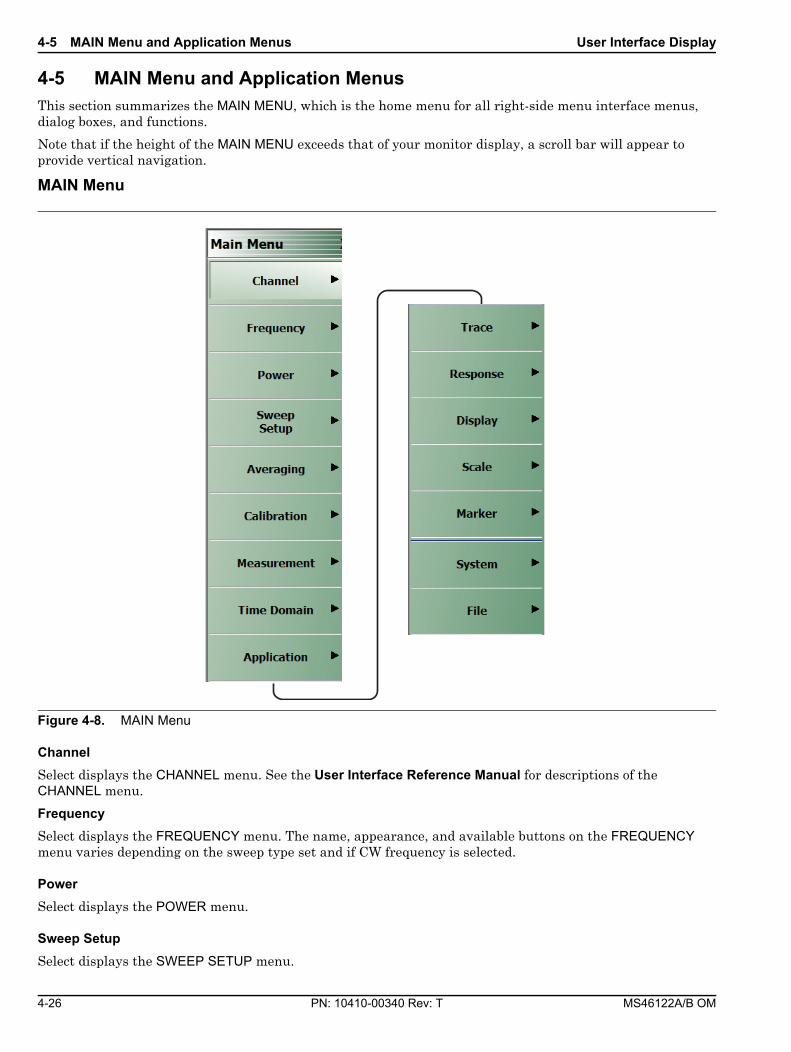
4-5 MAIN Menu and Application Menus User Interface Display
4-26 PN: 10410-00340 Rev: T MS46122A/B OM
4-5 MAIN Menu and Application MenusThis section summarizes the MAIN MENU, which is the home menu for all right-side menu interface menus, dialog boxes, and functions.
Note that if the height of the MAIN MENU exceeds that of your monitor display, a scroll bar will appear to provide vertical navigation.
MAIN Menu
ChannelSelect displays the CHANNEL menu. See the User Interface Reference Manual for descriptions of the CHANNEL menu.
FrequencySelect displays the FREQUENCY menu. The name, appearance, and available buttons on the FREQUENCY menu varies depending on the sweep type set and if CW frequency is selected.
PowerSelect displays the POWER menu.
Sweep SetupSelect displays the SWEEP SETUP menu.
Figure 4-8. MAIN Menu

User Interface Display 4-5 MAIN Menu and Application Menus
MS46122A/B OM PN: 10410-00340 Rev: T 4-27
AveragingSelect displays the AVERAGING menu.
CalibrationSelect displays the CALIBRATION menu.
MeasurementSelect displays the MEASUREMENT menu.
Time DomainSelect displays the TIME DOMAIN menu
ApplicationSelect displays the APPLICATION menu.
TraceSelect displays the TRACE menu.
ResponseSelect displays the RESPONSE menu.
DisplaySelect displays the DISPLAY menu.
ScaleSelect displays the SCALE menu which allows the user to change the scaling and other attributes of a trace display.
SCALE menu variants are dependent on selections made from TRACE FORMAT menu options.
MarkerSelect displays the MARKER [1] menu.
SystemSelect displays the SYSTEM menu.
FileSelect displays the FILE menu.

4-6 Using the Main Menu Interface User Interface Display
4-28 PN: 10410-00340 Rev: T MS46122A/B OM
4-6 Using the Main Menu Interface
Types of Menus, Menu Buttons, and Menu ToolbarsThe MAIN MENU (or MAIN) is the right-side navigation function for the instrument. The MAIN MENU has multiple types of menus, menu buttons, and menu toolbars that allow the user to configure and control the operation of the VNA. Each menu consists of the elements shown in the figure below.
1. Menu Title – Each menu title is unique.2. Field Buttons – The button shows the currently
selected value. Selecting the button displays a field toolbar.
3. Menu Buttons – Displays a menu or dialog box.4. Active Selection
Figure 4-9. Menu and Button Components
1
3
4
2

User Interface Display 4-6 Using the Main Menu Interface
MS46122A/B OM PN: 10410-00340 Rev: T 4-29
Menu TitleAt the top of the menu, a unique menu title, which is not repeated on any other menu. For space reasons, menu names are often abbreviated. For definitions, see Appendix C, “Abbreviation Glossary”.
Menu ButtonsOne or more menu buttons that either call a sub-menu, allow for a field value to be specified, toggle a function off or on, or allow a selection to be made from a group of choices. If the menu is longer than one screen, a scroll box and scroll arrows appear on the right side of the menu.
Menu Navigation ButtonsThe menu navigation area buttons appear at the bottom of each menu.
Back ButtonThe Back button returns the menu display to last selected higher-level menu.
Next ButtonThe Next button returns the menu display to the next deeper sub-menu that has already been selected. The availability of the Back and Next buttons (above) depends on the user’s navigation path. The Home button (below) always appears.
Home ButtonThe Home button returns the menu display to the MAIN menu.
Menu ButtonsMenu buttons call lower-level menus.
For example, the Averaging button on the MAIN menu calls the AVERAGING menu.
Read-Only ButtonsRead-only buttons display system values based on other settings and parameters.
For example, the Reset Avg Count button is in a read-only state because the Averaging button is set to OFF.

4-6 Using the Main Menu Interface User Interface Display
4-30 PN: 10410-00340 Rev: T MS46122A/B OM
Function ButtonsFunction buttons are used to start a process or to select an option. The buttons are highlighted to indicate selection. Selected options display a radio button icon.
Toggle ButtonsToggle buttons toggle through two or more values with each click of the button and display their current setting in the button field. For example, in the MAIN MENU | Response | RESPONSE | User Defined | USER DEFINED menu, the Driver Port button displays the default Port 1 setting.
Clicking the Driver Port button toggles to the Port 2 setting.
Clicking the Driver Port button a second time toggles back to the Port 1 setting.
Field Selection ButtonsField selection buttons display a user-defined parameter or value. Clicking a field selection button such as the Start button on the FREQUENCY menu displays a field toolbar (described below) that allows the user to specify parameter values and units.
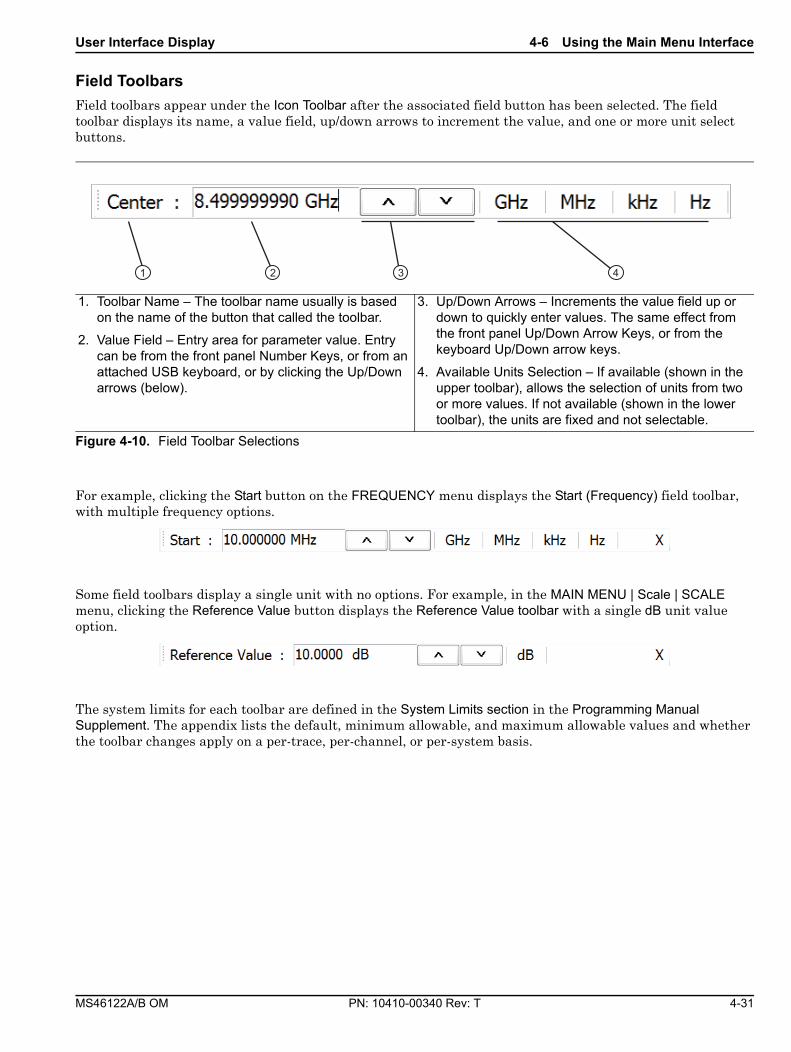
User Interface Display 4-6 Using the Main Menu Interface
MS46122A/B OM PN: 10410-00340 Rev: T 4-31
Field ToolbarsField toolbars appear under the Icon Toolbar after the associated field button has been selected. The field toolbar displays its name, a value field, up/down arrows to increment the value, and one or more unit select buttons.
For example, clicking the Start button on the FREQUENCY menu displays the Start (Frequency) field toolbar, with multiple frequency options.
Some field toolbars display a single unit with no options. For example, in the MAIN MENU | Scale | SCALE menu, clicking the Reference Value button displays the Reference Value toolbar with a single dB unit value option.
The system limits for each toolbar are defined in the System Limits section in the Programming Manual Supplement. The appendix lists the default, minimum allowable, and maximum allowable values and whether the toolbar changes apply on a per-trace, per-channel, or per-system basis.
1. Toolbar Name – The toolbar name usually is based on the name of the button that called the toolbar.
2. Value Field – Entry area for parameter value. Entry can be from the front panel Number Keys, or from an attached USB keyboard, or by clicking the Up/Down arrows (below).
3. Up/Down Arrows – Increments the value field up or down to quickly enter values. The same effect from the front panel Up/Down Arrow Keys, or from the keyboard Up/Down arrow keys.
4. Available Units Selection – If available (shown in the upper toolbar), allows the selection of units from two or more values. If not available (shown in the lower toolbar), the units are fixed and not selectable.
Figure 4-10. Field Toolbar Selections
1 2 3 4
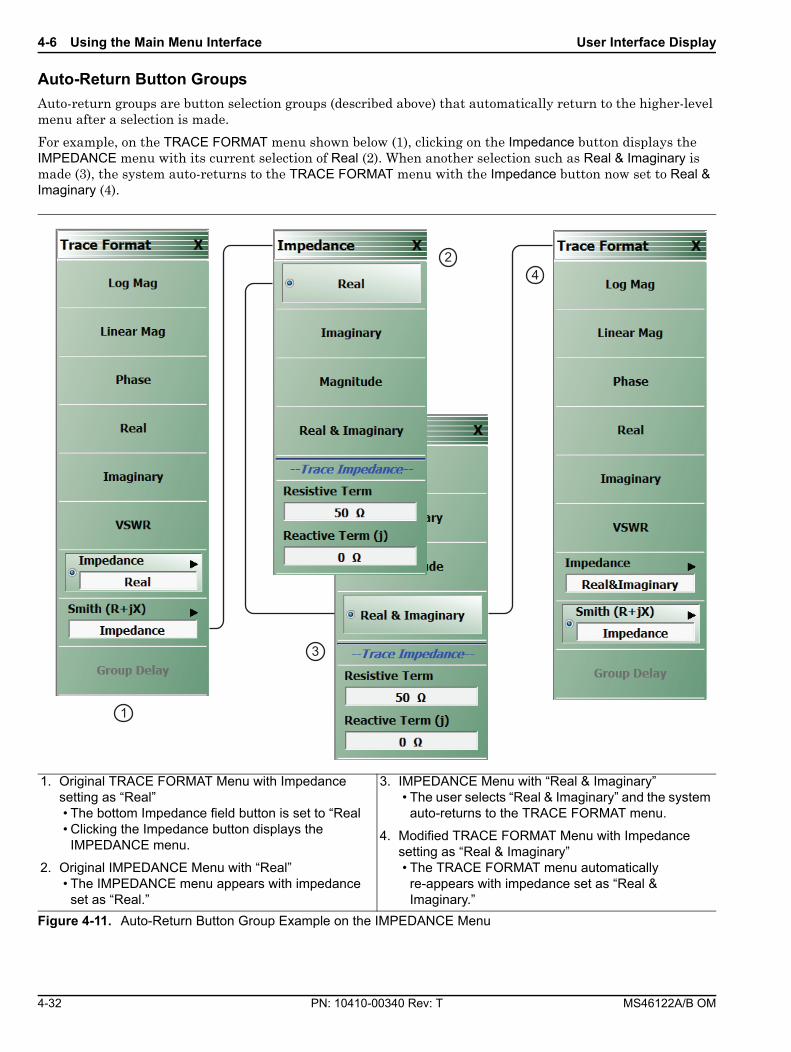
4-6 Using the Main Menu Interface User Interface Display
4-32 PN: 10410-00340 Rev: T MS46122A/B OM
Auto-Return Button GroupsAuto-return groups are button selection groups (described above) that automatically return to the higher-level menu after a selection is made.
For example, on the TRACE FORMAT menu shown below (1), clicking on the Impedance button displays the IMPEDANCE menu with its current selection of Real (2). When another selection such as Real & Imaginary is made (3), the system auto-returns to the TRACE FORMAT menu with the Impedance button now set to Real & Imaginary (4).
1. Original TRACE FORMAT Menu with Impedance setting as “Real”• The bottom Impedance field button is set to “Real• Clicking the Impedance button displays the
IMPEDANCE menu.2. Original IMPEDANCE Menu with “Real”
• The IMPEDANCE menu appears with impedance set as “Real.”
3. IMPEDANCE Menu with “Real & Imaginary”• The user selects “Real & Imaginary” and the system
auto-returns to the TRACE FORMAT menu.4. Modified TRACE FORMAT Menu with Impedance
setting as “Real & Imaginary”• The TRACE FORMAT menu automatically
re-appears with impedance set as “Real & Imaginary.”
Figure 4-11. Auto-Return Button Group Example on the IMPEDANCE Menu
1
3
42
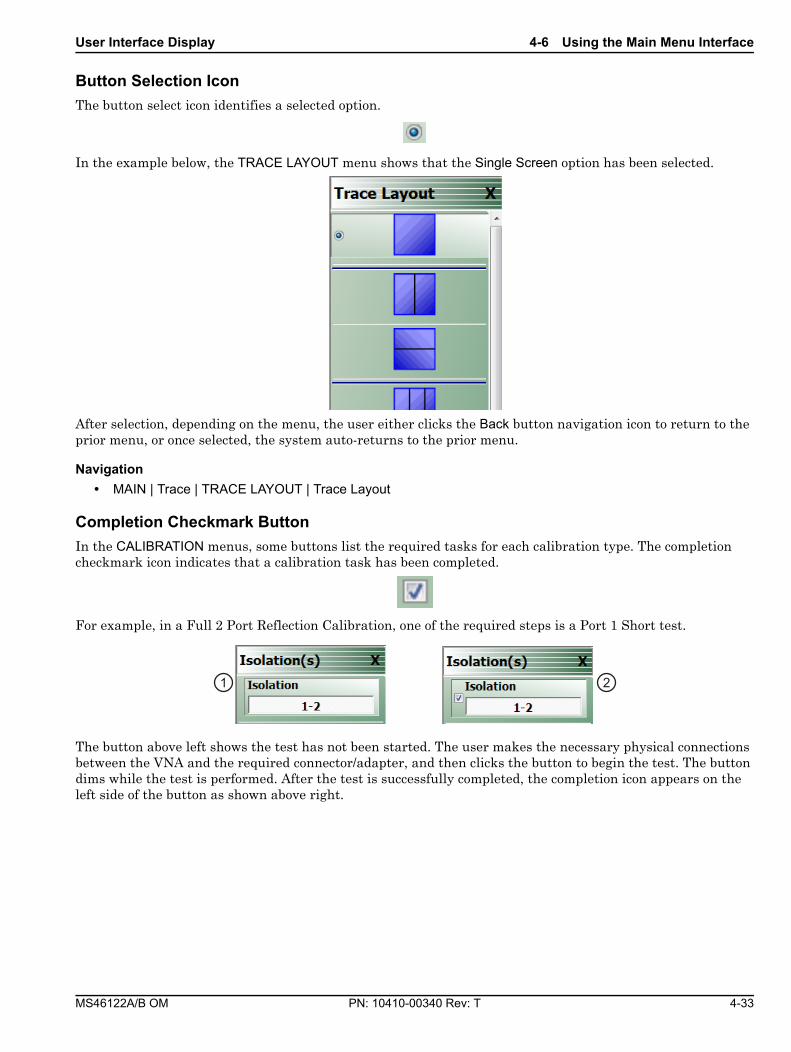
User Interface Display 4-6 Using the Main Menu Interface
MS46122A/B OM PN: 10410-00340 Rev: T 4-33
Button Selection IconThe button select icon identifies a selected option.
In the example below, the TRACE LAYOUT menu shows that the Single Screen option has been selected.
After selection, depending on the menu, the user either clicks the Back button navigation icon to return to the prior menu, or once selected, the system auto-returns to the prior menu.
Navigation• MAIN | Trace | TRACE LAYOUT | Trace Layout
Completion Checkmark ButtonIn the CALIBRATION menus, some buttons list the required tasks for each calibration type. The completion checkmark icon indicates that a calibration task has been completed.
For example, in a Full 2 Port Reflection Calibration, one of the required steps is a Port 1 Short test.
The button above left shows the test has not been started. The user makes the necessary physical connections between the VNA and the required connector/adapter, and then clicks the button to begin the test. The button dims while the test is performed. After the test is successfully completed, the completion icon appears on the left side of the button as shown above right.
1 2

4-7 Using Dialog Boxes User Interface Display
4-34 PN: 10410-00340 Rev: T MS46122A/B OM
4-7 Using Dialog BoxesMost dialog boxes are standard Microsoft dialog boxes and appear in the center of the display area.
Standard Dialog Box ButtonsMost dialog boxes also have some combination of standard buttons for OK, Cancel, and Save. Other buttons and types of buttons may be present. Within dialog boxes are dialog box areas that are usually named for the options that can be selected or the information that is displayed. Most dialog box areas are delimited by a line, box, or shadowbox that contains the information or settings for a series of common attributes. If the area is named in the dialog box, that name is used in any related procedures. If the area is not named, the area is named for the first data or input field. Some dialog boxes have links that call sub-dialog boxes.
Figure 4-12. CAL KIT INFO Dialog Box Example

User Interface Display 4-8 Instrument Status Display Area
MS46122A/B OM PN: 10410-00340 Rev: T 4-35
4-8 Instrument Status Display AreaAt the bottom of the instrument display is the status bar where instrument states and conditions are reported.
Instrument Status Data
Figure 4-13. Instrument Status Area
Table 4-3. Instrument Status Display Abbreviations
Status Display Description
1. Warning Messages Displays warning messages.2. Channel Status Display Area See “Channel Status Display Area”.3. Internal / External / Manual Displays status of system triggering.4. Int. Ref. / Ext. Ref. Indicates usage of internal or external reference.5. Ch 1-16 Displays the active channel.6. Port 1 / Port 2 / Port 3 / Port 4 Highlights the port being driven; 2-Port VNAs cycle between Port 1 and 2.7. Time Displays system time.
31 64
122
72 5

4-9 Channel Status Display Area User Interface Display
4-36 PN: 10410-00340 Rev: T MS46122A/B OM
4-9 Channel Status Display AreaAt the bottom of the display above the instrument status bar, is the Channel Status bar where the following information is reported. The displayed parameters are context and setting dependent. Not all parameters are displayed all the time. In a multi-channel display, the display may be truncated. To maximize the channel display, select any of the following:
• Keyboard: CTRL + 1• Keyboard: ALT + 3, then 2• MAIN | Channel | CHANNEL | Chan. Max
Figure 4-14. Channel Status Bar
Table 4-4. Channel Status Bar Abbreviations
Status Display Description
1 Ch# Displays the channel number. For example, Ch2 means that the display is for Channel 2.
2 TR Displays the measurement mode as transmission/reflection.
3
[Start]
Start # Units
In general, the left-side parameters define the starting position of distance, frequency, time, or power.From the FREQUENCY menu, if CW Mode is set to off, displays the current Start Frequency value with units of kHz, MHz, or GHz.
4 CW Frequency # Units
From the FREQUENCY menu, if CW Mode is set to on, displays the current CW Frequency value with units of kHz, MHz, or GHz.
5
[End]
Stop # Units
In general, the right-side parameters define the ending position of distance, frequency, time, or power.
From the FREQUENCY menu, if CW Mode is set to off, displays the current Stop Frequency value with units of kHz, MHz, or GHz.
6 IFBW # Units From the AVERAGING menu, reports the IF Bandwidth Frequency setting with units of Hz, kHz, or MHz.
7
Avg OFF
Avg #
# / #
From the AVERAGING menu, reports that Averaging is off, or if values are present, Averaging is on. If Averaging is on, and the Averaging Type is Per-Point, reports the Averaging factor.
If Averaging is on, and the Averaging Type is Per-Sweep, the left-side number reports the number of average sweeps; the right-side number displays the Averaging Factor.
8Measuring State
Calibrating State
Indicates whether the instrument is measuring or being calibrated.
9
UNCORR UNCORR indicates that a calibration is not being applied.
CORR CORR (with a green background) indicates that the calibration for the active channel is being applied (corrected).
EDE EDE (with green background) Indicates Embedding or De-embedding is being applied.E/O E/O, O/E, or O/O (with a green background) indicates an optical measurement state.
1 2 3 4 65 7 98
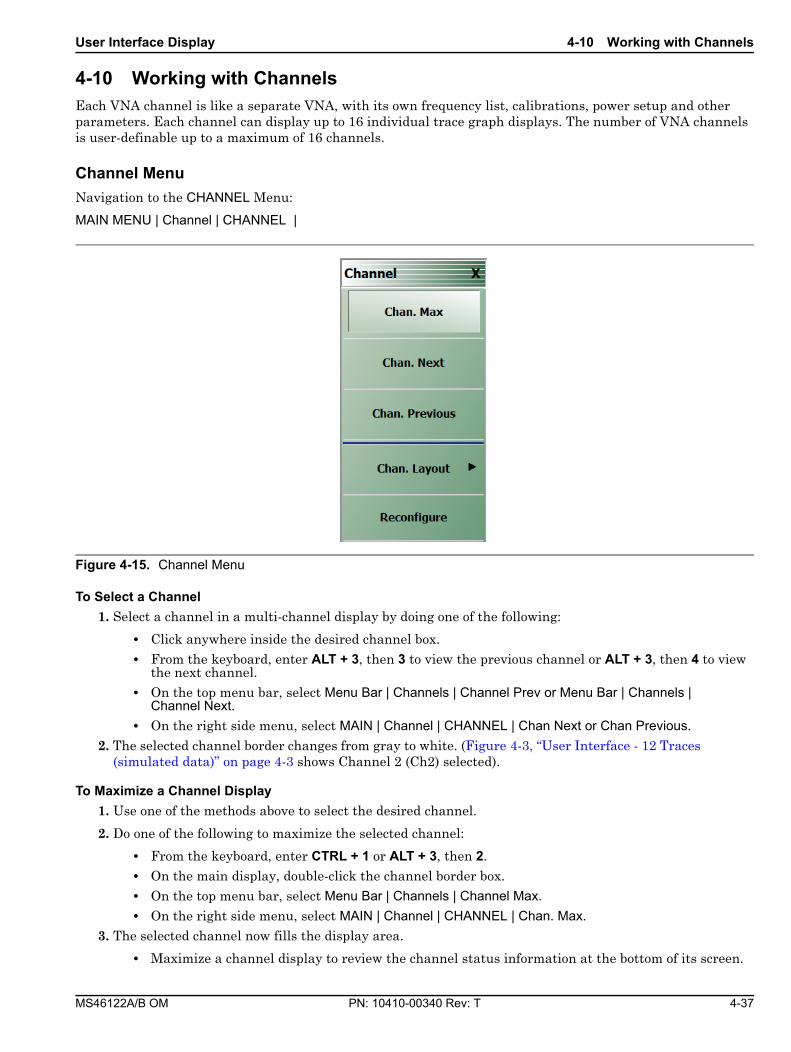
User Interface Display 4-10 Working with Channels
MS46122A/B OM PN: 10410-00340 Rev: T 4-37
4-10 Working with ChannelsEach VNA channel is like a separate VNA, with its own frequency list, calibrations, power setup and other parameters. Each channel can display up to 16 individual trace graph displays. The number of VNA channels is user-definable up to a maximum of 16 channels.
Channel MenuNavigation to the CHANNEL Menu:
MAIN MENU | Channel | CHANNEL |
To Select a Channel1. Select a channel in a multi-channel display by doing one of the following:
• Click anywhere inside the desired channel box.
• From the keyboard, enter ALT + 3, then 3 to view the previous channel or ALT + 3, then 4 to view the next channel.
• On the top menu bar, select Menu Bar | Channels | Channel Prev or Menu Bar | Channels | Channel Next.
• On the right side menu, select MAIN | Channel | CHANNEL | Chan Next or Chan Previous.
2. The selected channel border changes from gray to white. (Figure 4-3, “User Interface - 12 Traces (simulated data)” on page 4-3 shows Channel 2 (Ch2) selected).
To Maximize a Channel Display1. Use one of the methods above to select the desired channel.
2. Do one of the following to maximize the selected channel:
• From the keyboard, enter CTRL + 1 or ALT + 3, then 2.
• On the main display, double-click the channel border box.
• On the top menu bar, select Menu Bar | Channels | Channel Max.• On the right side menu, select MAIN | Channel | CHANNEL | Chan. Max.
3. The selected channel now fills the display area.
• Maximize a channel display to review the channel status information at the bottom of its screen.
Figure 4-15. Channel Menu

4-10 Working with Channels User Interface Display
4-38 PN: 10410-00340 Rev: T MS46122A/B OM
To Make the Display Area Larger1. The top icon toolbar and the right side menus can be removed to make the display area larger.
2. Remove the icon toolbar by doing one of the following:
• From the keyboard, select ALT + 8, then 2.• On the top menu bar, select Menu Bar | Utilities | Toolbar Off.
3. The icon toolbar disappears. Repeat Step #2 to make the icon toolbar reappear.
4. Remove the right side menus by doing one of the following:
• From the keyboard, enter ALT + 8, then 7.
• On the top menu bar, select Menu Bar | Utilities | Clear.5. The right side menu disappears. Repeat Step #4 to make the menu reappear.
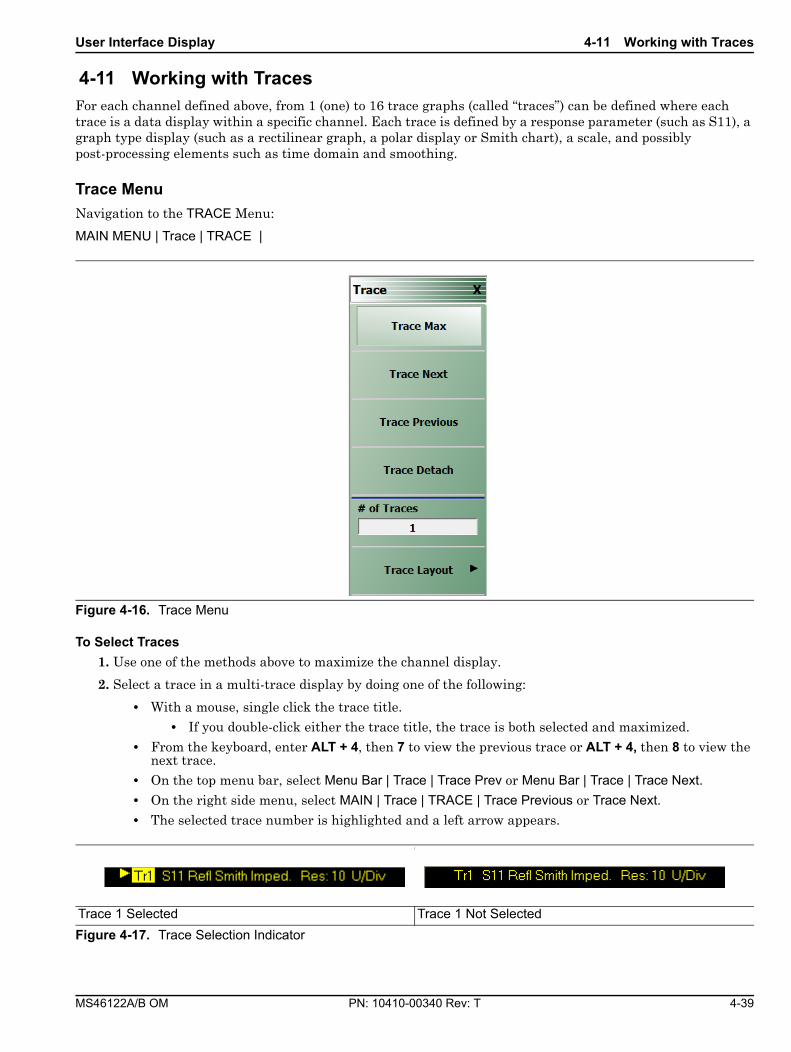
User Interface Display 4-11 Working with Traces
MS46122A/B OM PN: 10410-00340 Rev: T 4-39
4-11 Working with TracesFor each channel defined above, from 1 (one) to 16 trace graphs (called “traces”) can be defined where each trace is a data display within a specific channel. Each trace is defined by a response parameter (such as S11), a graph type display (such as a rectilinear graph, a polar display or Smith chart), a scale, and possibly post-processing elements such as time domain and smoothing.
Trace MenuNavigation to the TRACE Menu:
MAIN MENU | Trace | TRACE |
To Select Traces1. Use one of the methods above to maximize the channel display.
2. Select a trace in a multi-trace display by doing one of the following:
• With a mouse, single click the trace title.
• If you double-click either the trace title, the trace is both selected and maximized.
• From the keyboard, enter ALT + 4, then 7 to view the previous trace or ALT + 4, then 8 to view the next trace.
• On the top menu bar, select Menu Bar | Trace | Trace Prev or Menu Bar | Trace | Trace Next.• On the right side menu, select MAIN | Trace | TRACE | Trace Previous or Trace Next.• The selected trace number is highlighted and a left arrow appears.
Figure 4-16. Trace Menu
f
Trace 1 Selected Trace 1 Not SelectedFigure 4-17. Trace Selection Indicator
4-11 Working with Traces User Interface Display
4-40 PN: 10410-00340 Rev: T MS46122A/B OM
To Maximize a Trace Display1. Use one of the methods above to select the desired trace.
2. For a maximum display, make sure the trace’s channel is maximized.
3. Do one of the following to maximize the selected trace:
• From the keyboard, select ALT + 4, then 6.
• On the main display, double-click anywhere in the trace display.
• On the top menu bar, select Menu Bar | Trace | Trace Max.• On the right side menu, select MAIN | Trace | TRACE | Trace Max.
4. The selected trace now fills the display area.
• Maximize a trace display to review the trace status information at the bottom of trace screen.
Repeat the actions above to return the trace to its normal size.
Types of Trace DisplaysThere are four general graph types available and within each general type are multiple sub-types:
• Rectilinear single graph
• Rectilinear dual graph
• Smith chart
• Polar plot graph
Trace Data TypesThe data types generated by the VNA (real, imaginary, magnitude, phase) are used in the display graph to show the possible ways in which S-Parameter data can be represented. For example, complex data, that is data in which both phase and magnitude are graphed, may be displayed in any of the following ways:
• Complex ImpedanceDisplayed on a Smith chart graph as impedance or as admittance.
• Real and ImaginaryIf simultaneous displays are required, displayed on a real and imaginary rectilinear (a Cartesian plot) graph. If only one type is required, a single rectilinear real graph or single rectilinear imaginary graph.
• Phase and MagnitudeDisplayed on a single rectilinear graph, as paired rectilinear graphs, or as a polar graph.
• Group DelayDefined as the frequency span over which the phase change is computed at a given frequency point. The quantity group delay is displayed using a modified rectilinear-magnitude format. In this format, the vertical scale is in linear units of time (either ps, ns, µs, or ms). With one exception, the reference value and reference line functions operate the same as they do with a normal magnitude display.
NoteThe Tr->Max, Tr->Next, and Tr->Previous icons are available for the icon toolbar. These icons provide one click access to trace maximum, trace next, and trace previous functions. They can be added to the icon toolbar for a custom configuration and saved as part of a preset configuration.

User Interface Display 4-11 Working with Traces
MS46122A/B OM PN: 10410-00340 Rev: T 4-41
Trace Display GraphsA separate graph can be assigned to each active channel and display area. The following available display graph types are listed in Table 4-5 below.
Table 4-5. Available Trace Display Types (1 of 3)
Menu NameDefinition and
Display OptionsY-Axis
Dependent VariableX-Axis
Independent VariableMeasurement Applications
Rectilinear Single Graphs
Log Mag
Log magnitude rectilinear format graphMagnitude
Y = dB Return loss measurementInsertion loss measurement
Gain measurement
Linear MagLinear magnitude rectilinear format graph
Magnitude Linear units Reflection coefficient measurement
PhasePhase rectilinear format graph
Phase displayed in range from -180 to + 180 degrees
Degrees Linear phase deviation measurements
ImaginaryImaginary rectilinear format graph
Imaginary part of measured complex parameter
Linear units
Real Real rectilinear format graph
Real part of measured complex parameter
Linear units
SWR
Standing Wave Ratio rectilinear format graph
where ρ = Reflection Coefficient
Linear units Standing wave measurementsAntenna analysis
Impedance
Impedance rectilinear format graph
Four options are:• Real• Imaginary
• Magnitude• Real & Imaginary
• Inductance• Capacitance
Rectilinear Paired Graphs
Log Magnitude and Phase
Paired graphs with Log Magnitude on top and Phase on bottom
As above As above Same as having one trace with a Log Magnitude display and a second trace with a Phase rectilinear display.
SWR 1 ρ+1 ρ–-------------=
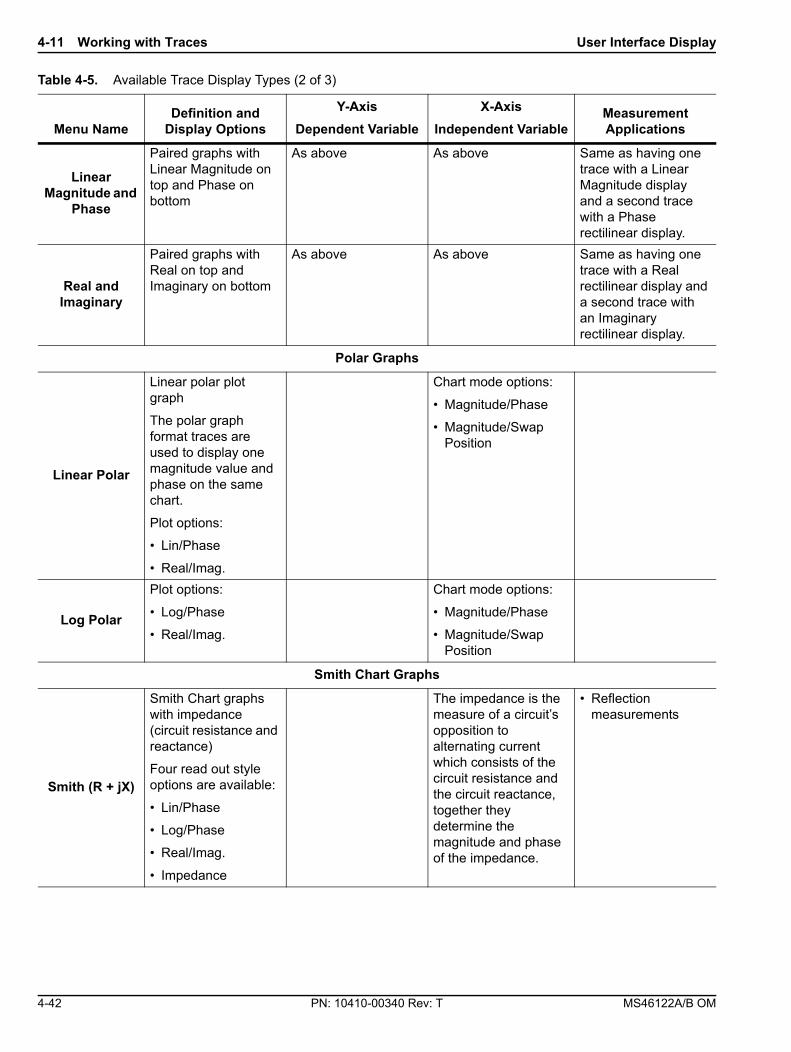
4-11 Working with Traces User Interface Display
4-42 PN: 10410-00340 Rev: T MS46122A/B OM
Linear Magnitude and
Phase
Paired graphs with Linear Magnitude on top and Phase on bottom
As above As above Same as having one trace with a Linear Magnitude display and a second trace with a Phase rectilinear display.
Real and Imaginary
Paired graphs with Real on top and Imaginary on bottom
As above As above Same as having one trace with a Real rectilinear display and a second trace with an Imaginary rectilinear display.
Polar Graphs
Linear Polar
Linear polar plot graph
The polar graph format traces are used to display one magnitude value and phase on the same chart. Plot options:• Lin/Phase
• Real/Imag.
Chart mode options:
• Magnitude/Phase• Magnitude/Swap
Position
Log Polar
Plot options:
• Log/Phase• Real/Imag.
Chart mode options:
• Magnitude/Phase• Magnitude/Swap
Position
Smith Chart Graphs
Smith (R + jX)
Smith Chart graphs with impedance (circuit resistance and reactance)Four read out style options are available:
• Lin/Phase• Log/Phase• Real/Imag.
• Impedance
The impedance is the measure of a circuit’s opposition to alternating current which consists of the circuit resistance and the circuit reactance, together they determine the magnitude and phase of the impedance.
• Reflection measurements
Table 4-5. Available Trace Display Types (2 of 3)
Menu NameDefinition and
Display OptionsY-Axis
Dependent VariableX-Axis
Independent VariableMeasurement Applications
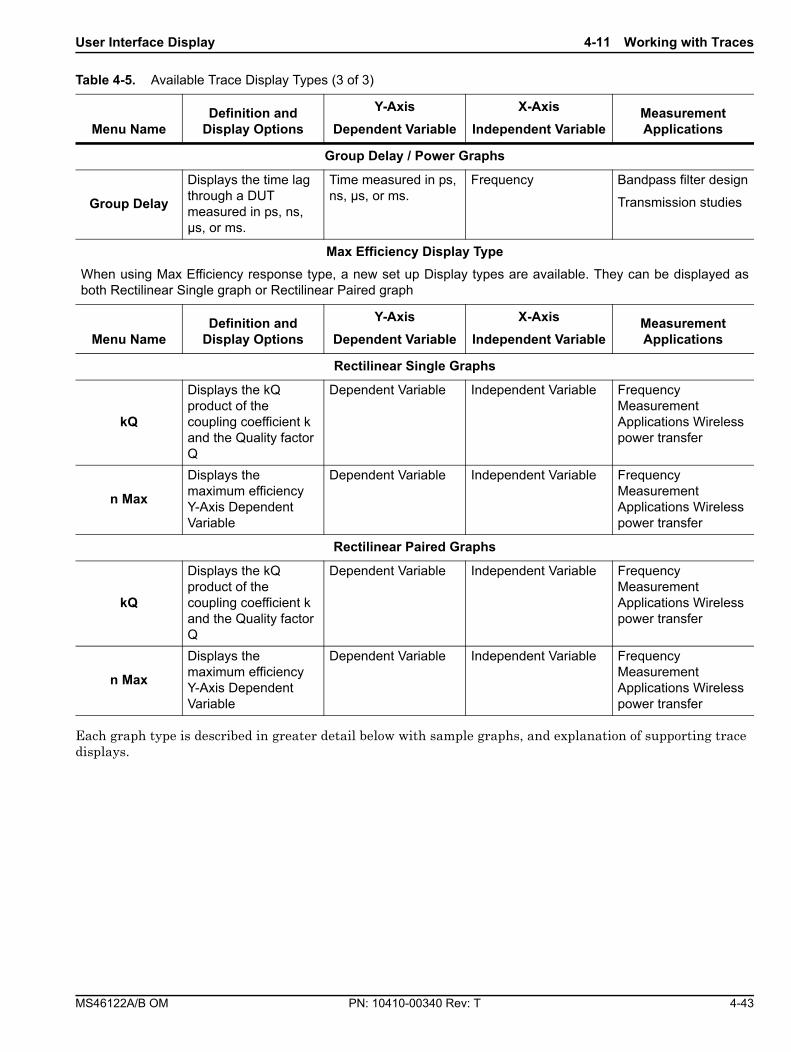
User Interface Display 4-11 Working with Traces
MS46122A/B OM PN: 10410-00340 Rev: T 4-43
Each graph type is described in greater detail below with sample graphs, and explanation of supporting trace displays.
Group Delay / Power Graphs
Group Delay
Displays the time lag through a DUT measured in ps, ns, µs, or ms.
Time measured in ps, ns, µs, or ms.
Frequency Bandpass filter designTransmission studies
Max Efficiency Display TypeWhen using Max Efficiency response type, a new set up Display types are available. They can be displayed asboth Rectilinear Single graph or Rectilinear Paired graph
Menu NameDefinition and
Display OptionsY-Axis
Dependent VariableX-Axis
Independent VariableMeasurement Applications
Rectilinear Single Graphs
kQ
Displays the kQ product of the coupling coefficient k and the Quality factor Q
Dependent Variable Independent Variable Frequency Measurement Applications Wireless power transfer
n Max
Displays the maximum efficiency Y-Axis Dependent Variable
Dependent Variable Independent Variable Frequency Measurement Applications Wireless power transfer
Rectilinear Paired Graphs
kQ
Displays the kQ product of the coupling coefficient k and the Quality factor Q
Dependent Variable Independent Variable Frequency Measurement Applications Wireless power transfer
n Max
Displays the maximum efficiency Y-Axis Dependent Variable
Dependent Variable Independent Variable Frequency Measurement Applications Wireless power transfer
Table 4-5. Available Trace Display Types (3 of 3)
Menu NameDefinition and
Display OptionsY-Axis
Dependent VariableX-Axis
Independent VariableMeasurement Applications

4-11 Working with Traces User Interface Display
4-44 PN: 10410-00340 Rev: T MS46122A/B OM
Trace LabelsEach trace (i.e. each graph display) is labeled with information such as its trace number, the graph type, scaling, reference delay, and S-parameter associated with that trace. Depending on the trace settings and the graph type, other information may be displayed. The Trace number field can be edited for a custom trace name.
The general format of trace label consists of the following parameters and their associated abbreviations appearing from left to right in the trace label. Some parameters may not appear depending on the instrument settings.
• Trace Number
• Measurement Type
• Time Domain
• Graph Type
• Reference Level
• Resolution Units
• Trace Memory Statistics
Trace Label AbbreviationsThe trace label abbreviations are described in the tables below:
• Table 4-6, "Trace Labels - Trace Number, Measurement Type"
• Table 4-7, "Trace Labels - Abbreviation, Type and Name, Reference Level Units, Resolution Units"
Table 4-6. Trace Labels - Trace Number, Measurement Type
Abbreviation Definition Description
Trace Number Abbreviation
Tr# Trace number Trace 1 through Trace 16.
Measurement Type Abbreviations
S11 Refl S11 Port 1 forward reflection S-parameters are selected on the RESPONSE menu.
S12 Trans S12 Port 1 reverse transmission
S21 Trans S21 Port 2 forward transmission
S22 Refl S22 Port 2 reverse reflection
NN / DD | Port #
NN is user-defined numerator value.
DD is user-defined denominator value.Port number
User-defined numerator, denominator, and driver port are selected on the RESPONSE | User-defined | USER-DEFINED menu.
Numerator and denominator options are A1, B1, A2, B2, or 1.Port number selection options are Port 1 or Port 2.
[EQN] Equation Editor If using Equation Editor, [EQN] notation will show.

User Interface Display 4-11 Working with Traces
MS46122A/B OM PN: 10410-00340 Rev: T 4-45
Table 4-7. Trace Labels - Abbreviation, Type and Name, Reference Level Units, Resolution Units
Graph Abbreviation Graph Name and Type
Reference Level(RefLvl)
Resolution Units(Res)
Rectilinear Single Graph
LogM Log Mag (Log Magnitude) rectilinear dB dB / Div
LinM Linear Mag (Linear Magnitude) rectilinear U U / Div
Phase Phase rectilinear with units in degrees (º) º º / Div
Real Real rectilinear U U / Div
Imag Imaginary rectilinear U U / Div
SWR SWR rectilinear U U / Div
Imped Real Impedance Real rectilinear with units in Ohms (Ω) Ω Ω / Div
Imped Imag Impedance Imaginary rectilinear Ω Ω / Div
Imped Mag Impedance Magnitude rectilinear Ω Ω / Div
Imped R + I Impedance Real and Imaginary rectilinear. A rectilinear paired graph.
Ω Ω / Div
Rectilinear Paired Graphs
LogM + P Log Magnitude and Phase rectilinear paired graphs. dB º Res: dB/Div, º/Div
LinM + P Linear Magnitude and Phase rectilinear paired graphs
dB º Res: dB/Div,º/Div
R + I Real and Imaginary rectilinear paired graphs U Res: U/Div, U/Div
Smith Charts with Impedance
Smith Imped
The display can be one of four possible Smith Chart with impedance displays:• Smith (R+jX) Linear/Phase Smith Chart• Smith (R+jX) Log/Phase Smith Chart
• Smith (R+jX) Real/Imaginary Smith Chart• Smith (R+jX) Impedance Smith Chart
— U / Div
Polar Graphs
Lin Pol Linear Polar, Linear/Phase polar U U/Div
Lin Pol, RI Linear Polar, Read/Imaginary polar U U/Div
Log Pol Log Polar, Log/Phase polar dB dB/Div
Log Pol, RI Log Polar, Real/Imaginary polar dB dB/Div
Group Delay and Power Rectilinear Graphs
Grp Dly Group Delay rectilinear with units of seconds s Res: s/Div

4-11 Working with Traces User Interface Display
4-46 PN: 10410-00340 Rev: T MS46122A/B OM
Rectilinear Single GraphA rectilinear graph is a display of a Cartesian coordinate system or plan consisting of an X-axis and a Y-axis. The X-axis displays the independent variable (such as frequency or time) and the Y-axis displays the dependent value.
Rectilinear Paired GraphsAs above, but paired with a phase rectilinear graph below. Useful to provide immediate comparison with a function value and its phase.
Figure 4-18. Trace Graph - Rectilinear Single - Log Magnitude (Log Mag) Trace Display Graph
Figure 4-19. Trace Graph - Rectilinear Paired - Trace Log Magnitude and Phase Trace Display

User Interface Display 4-11 Working with Traces
MS46122A/B OM PN: 10410-00340 Rev: T 4-47
Smith ChartsThe power reflected from a DUT has both magnitude and phase because the impedance of the device has both a resistive and a reactive term of the form r+jx. We refer to the r as the real or resistive term, while we call x the imaginary or reactive term. The j, which we sometimes denote as i, is an imaginary number. It is the square root of –1. If x is positive, the impedance is inductive, if x is negative the impedance is capacitive. The size and polarity of the reactive component x is important in impedance matching. The best match to a complex impedance is the complex conjugate which means an impedance with the same value of r and x, but with x of opposite polarity. This term is best analyzed using a Smith Chart, which is a plot of r and x.To display all the information on a single S-parameter requires one or two traces, depending upon the format we want. A very common requirement is to view forward reflection on a Smith Chart (one trace) while observing forward transmission.
Smith Chart with Impedance (Circuit Resistance and Reactance)The Smith Chart with impedance (Smith R + jX) has four display options:
• Lin/Phase
• Log/Phase
• Real/Imag.
• Impedance
The impedance is the measure of a circuit’s opposition to alternating current which consists of the circuit resistance and the circuit reactance, together they determine the magnitude and phase of the impedance.
Figure 4-20. Smith Chart with Impedance (R+jX)
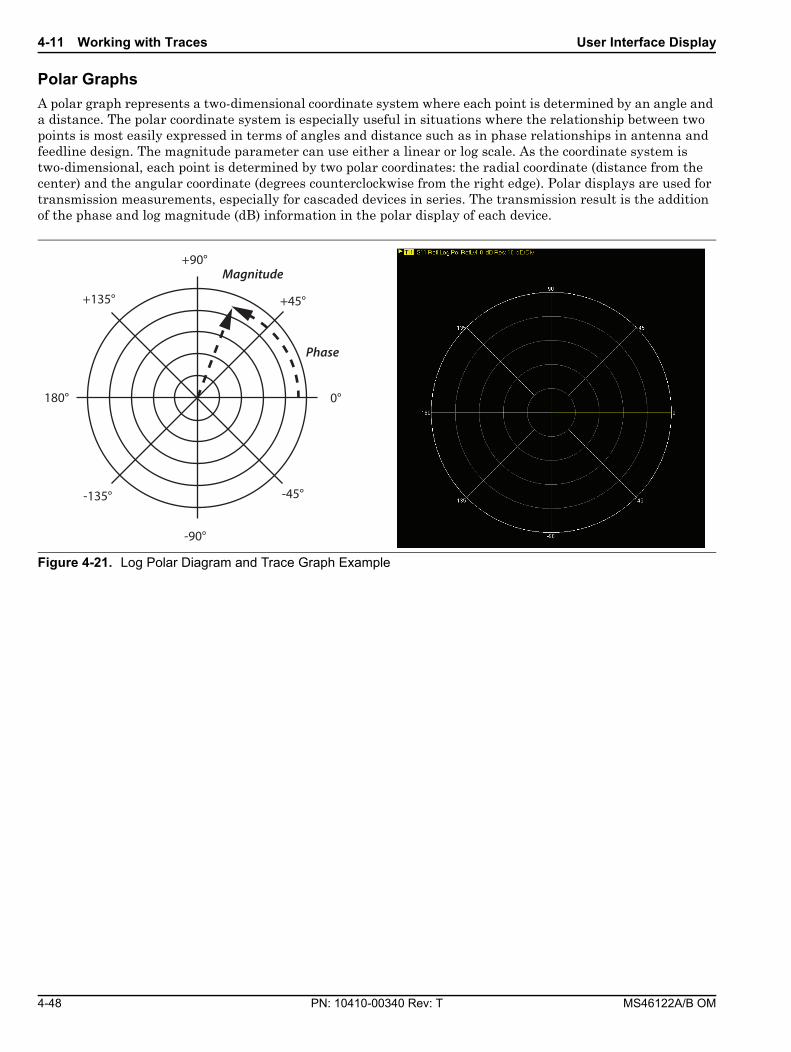
4-11 Working with Traces User Interface Display
4-48 PN: 10410-00340 Rev: T MS46122A/B OM
Polar GraphsA polar graph represents a two-dimensional coordinate system where each point is determined by an angle and a distance. The polar coordinate system is especially useful in situations where the relationship between two points is most easily expressed in terms of angles and distance such as in phase relationships in antenna and feedline design. The magnitude parameter can use either a linear or log scale. As the coordinate system is two-dimensional, each point is determined by two polar coordinates: the radial coordinate (distance from the center) and the angular coordinate (degrees counterclockwise from the right edge). Polar displays are used for transmission measurements, especially for cascaded devices in series. The transmission result is the addition of the phase and log magnitude (dB) information in the polar display of each device.
Figure 4-21. Log Polar Diagram and Trace Graph Example
0°
+45°
180°
+90°
+135°
-45°
-90°
-135°
Phase
Magnitude
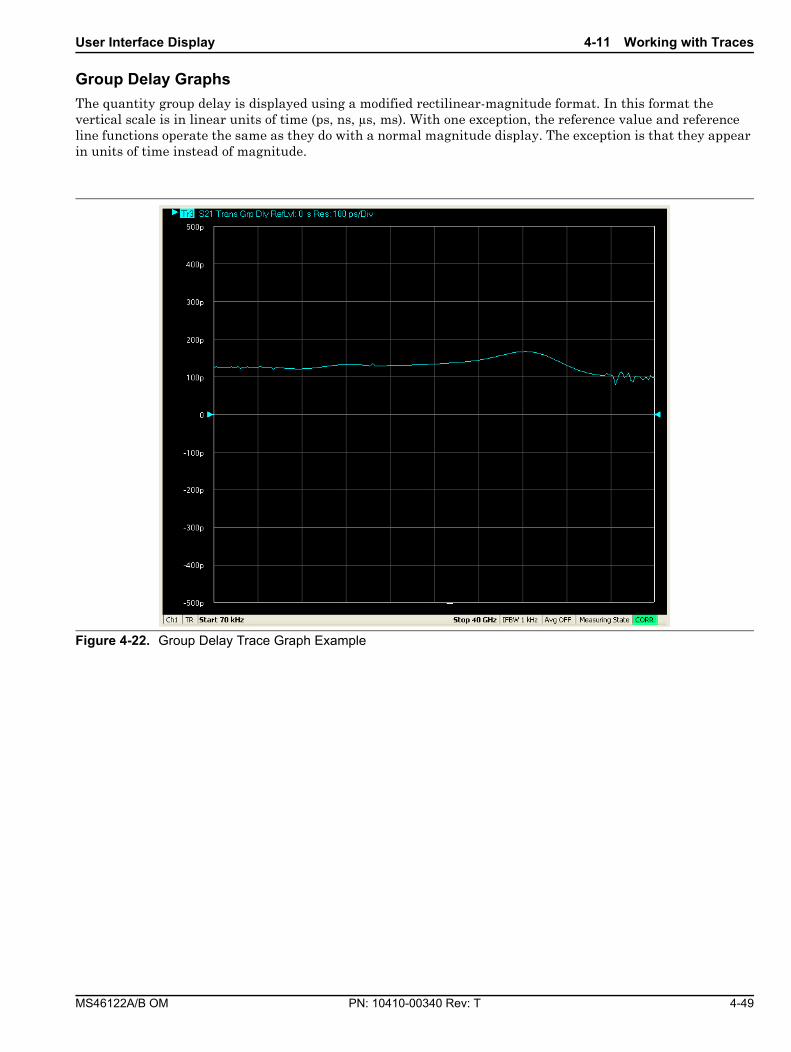
User Interface Display 4-11 Working with Traces
MS46122A/B OM PN: 10410-00340 Rev: T 4-49
Group Delay GraphsThe quantity group delay is displayed using a modified rectilinear-magnitude format. In this format the vertical scale is in linear units of time (ps, ns, µs, ms). With one exception, the reference value and reference line functions operate the same as they do with a normal magnitude display. The exception is that they appear in units of time instead of magnitude.
Figure 4-22. Group Delay Trace Graph Example

4-12 Working with Reference Lines and Reference Position User Interface Display
4-50 PN: 10410-00340 Rev: T MS46122A/B OM
4-12 Working with Reference Lines and Reference PositionYou can manipulate the display elements in a rectilinear trace graph from either the trace itself or from the right-side menus.
1. Trace Label – The trace label appears above the trace graph. The example above shows Trace 2 measuring S11, displayed on a Log Magnitude graph, with a Reference Level of -20 dB, and a graph resolution of 10 dB per vertical division.
2. Response Graph – A typical S11 response graph.
3. Resolution in Units per Division – The example shows 10 dB per division.
4. Reference Line Pointers – Reference lines are only available in rectilinear trace graphs and are indicated by the paired arrows on the trace graph display and show the position of the reference value on the Y-axis scale. The example Reference Value is set to -20 dB. Click-hold-and-drag the line pointers to change the reference line value.
5. Reference Position – The example Reference Position is set to 3. Click-hold-and-drag the reference position scale to change the position of the graph on the Y-axis up or down. The value of the Reference Line Points does not change.
6. Number of Vertical Divisions – The example number of vertical divisions is set to 10.
Figure 4-23. Trace Display Controls and Settings
� S11 Refl LogM RefLvl: -20 dB Res: 10 dB/DivTr2
� �� �
50
40
30
20
10
0
-10
-20
-30
-40
-50
1
2
3
4
6
5

User Interface Display 4-13 Working with Markers
MS46122A/B OM PN: 10410-00340 Rev: T 4-51
4-13 Working with MarkersThe ShockLine VNA GUI display provides up to thirteen markers per trace of which twelve are direct markers and one a reference marker. Each marker data array can be repositioned by a drag/drop anywhere within the signal response trace display. Each marker can be individually controlled on/off and positioned as required on the signal response display.
If the reference marker is off, each marker provides measurement data based on its display position. If the reference marker is on, each marker provides differential measurement data based on its position relative the reference. Figure 4-24, is an overview of the marker menu..
Markers • Can be set between Discrete and Continuous Modes
• Can be set to Statistics Display.
• Can be set to Coupled mode on or off.
• Can be set to be repositioned within the display.
• Can be set to search Bandwidth Loss field and Notch Loss field.
• Can set Tableau Display to view all active markers.
• Can set Marker Labels.
• Can search Target Markers.
• Can search range units depending on the Sweep Types selected.
Figure 4-24. Marker Menus

4-13 Working with Markers User Interface Display
4-52 PN: 10410-00340 Rev: T MS46122A/B OM
The example below Figure 4-25, depicts a two trace display. On the top trace display, the individual marker [9] is selected, and repositioned. In the bottom trace, the marker data display is repositioned. The marker(s) can be repositioned while using any parameter setup menu. Note that the marker data display placement area on the main display window may be limited if the detachable trace view windows in use are smaller in size than then the main display window.
1. Trace 1 marker data display with nine active markers2. Trace 1 marker with a single selected marker [9]
repositioned by click-drag-drop
3. Trace 2 marker data display with 11 active markers repositioned by click-drag-drop
4. Highlighted active trace.Figure 4-25. Marker Data Display Drag-Drop
122B
9
4
1
3
2
8756
1 2
43
1 23
4 5
987
6
10

User Interface Display 4-14 Working with Limit Lines
MS46122A/B OM PN: 10410-00340 Rev: T 4-53
4-14 Working with Limit LinesLimit lines are a powerful tool to help compare a set of measured DUT data against specifications or expectations. Figure 4-26 shows basic menu navigation to reposition markers through the Marker Display Menu. .
Limit lines• Can be configured as settable maximum and/or minimum indicators for the value of displayed data on a
per-trace basis.
• Can be rescaled automatically and maintains their correct value if the trace display is rescaled.
• Are settable in the basic units of each trace.
• Are limited to a total of 50 segments (upper and lower combined) per-trace.
• Are available only for ShockLine rectilinear and polar displays.
• Are not available for ShockLine Smith charts.
• For dual displays, such as the Log Mag And Phase display, the segment limit is 50 segments for the top display and 50 segments for the bottom display.
Figure 4-26. Display Trace Limit Lines Menu

4-15 Working with Ripple Limit Lines User Interface Display
4-54 PN: 10410-00340 Rev: T MS46122A/B OM
4-15 Working with Ripple Limit LinesLimit lines are a powerful tool to help evaluate the ripple of a DUT against specifications or expectations. Figure 4-27 shows basic menu navigation to reposition markers through the Marker Display Menu.
Ripple Limit lines• Are settable tolerance indicators for the specified ripple value based on Absolute Value or Margin of
displayed data on a per-trace basis.
• Are settable in the basic units of each trace.
• Are limited to a total of 50 segments (upper and lower combined) per-trace.
• Are available only for ShockLine rectilinear and polar displays.
• Are not available for ShockLine Smith charts.
• Can be used simultaneously with trace limit lines.
• Can be rescaled automatically and maintain their correct value if the trace display is rescaled.
• When used with trace limit lines and the Test Result sign functions, a logical OR is used as the result.
For dual displays, such as the Log Mag And Phase display, the segment limit is 50 segments for the top display and 50 segments for the bottom display.
Figure 4-27. Display Trace Ripple Lines Menu

MS46122A/B OM PN: 10410-00340 Rev: T A-1
Appendix A — Vector Network Analyzer PrimerA-1 Appendix OverviewThis chapter describes the basic functions of a Vector Network Analyzer (VNA) and how it measures magnitude and phase characteristics of networks, amplifiers, attenuators, and antennas. Scattering parameters (S-parameters) are defined.
This section provides front panel operating and measurement application information and data. It includes discussions on the following topics:
• System description
• General discussion about network analyzers
• Basic measurements and how to make them
• Error correction
• General discussion on test sets
A-2 General DescriptionThe ShockLine MS46122A/B Series Vector Network Analyzer (VNA) System measures the magnitude and phase characteristics of networks, amplifiers, attenuators, and antennas. It compares the incident signal that leaves the analyzer with either the signal that is transmitted through the test device or the signal that is reflected from its input. Figure A-1 and Figure A-2 illustrate the types of measurements that the MS46122A/B Series VNA can make.
Figure A-1. Transmission Measurements
Incident TransmittedTest Device
Gain (dB)Insertion Loss (dB)Insertion Phase (degrees)Transmission Coefficients (S12, S21)Separation of Transmission Components (Real and Imaginary)Electrical Length (m)Electrical Delay (s)Deviation from Linear Phase (degrees)Group Delay (s)
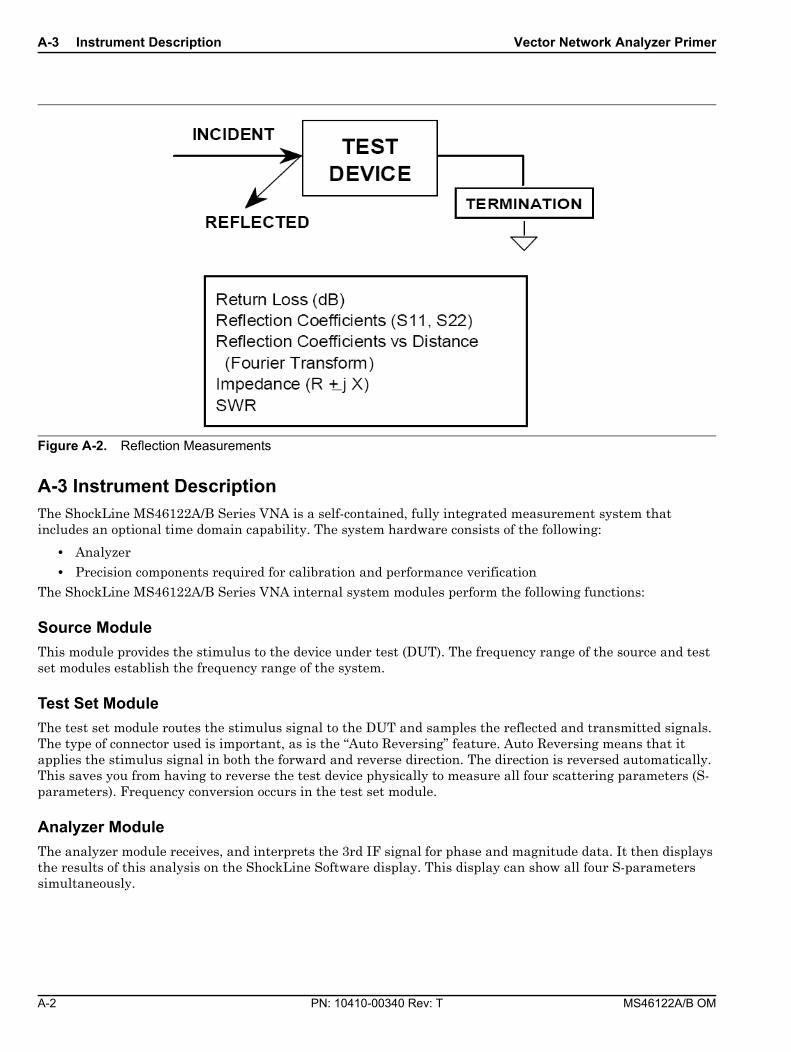
A-3 Instrument Description Vector Network Analyzer Primer
A-2 PN: 10410-00340 Rev: T MS46122A/B OM
A-3 Instrument DescriptionThe ShockLine MS46122A/B Series VNA is a self-contained, fully integrated measurement system that includes an optional time domain capability. The system hardware consists of the following:
• Analyzer
• Precision components required for calibration and performance verification
The ShockLine MS46122A/B Series VNA internal system modules perform the following functions:
Source Module This module provides the stimulus to the device under test (DUT). The frequency range of the source and test set modules establish the frequency range of the system.
Test Set ModuleThe test set module routes the stimulus signal to the DUT and samples the reflected and transmitted signals. The type of connector used is important, as is the “Auto Reversing” feature. Auto Reversing means that it applies the stimulus signal in both the forward and reverse direction. The direction is reversed automatically. This saves you from having to reverse the test device physically to measure all four scattering parameters (S-parameters). Frequency conversion occurs in the test set module.
Analyzer Module The analyzer module receives, and interprets the 3rd IF signal for phase and magnitude data. It then displays the results of this analysis on the ShockLine Software display. This display can show all four S-parameters simultaneously.
Figure A-2. Reflection Measurements
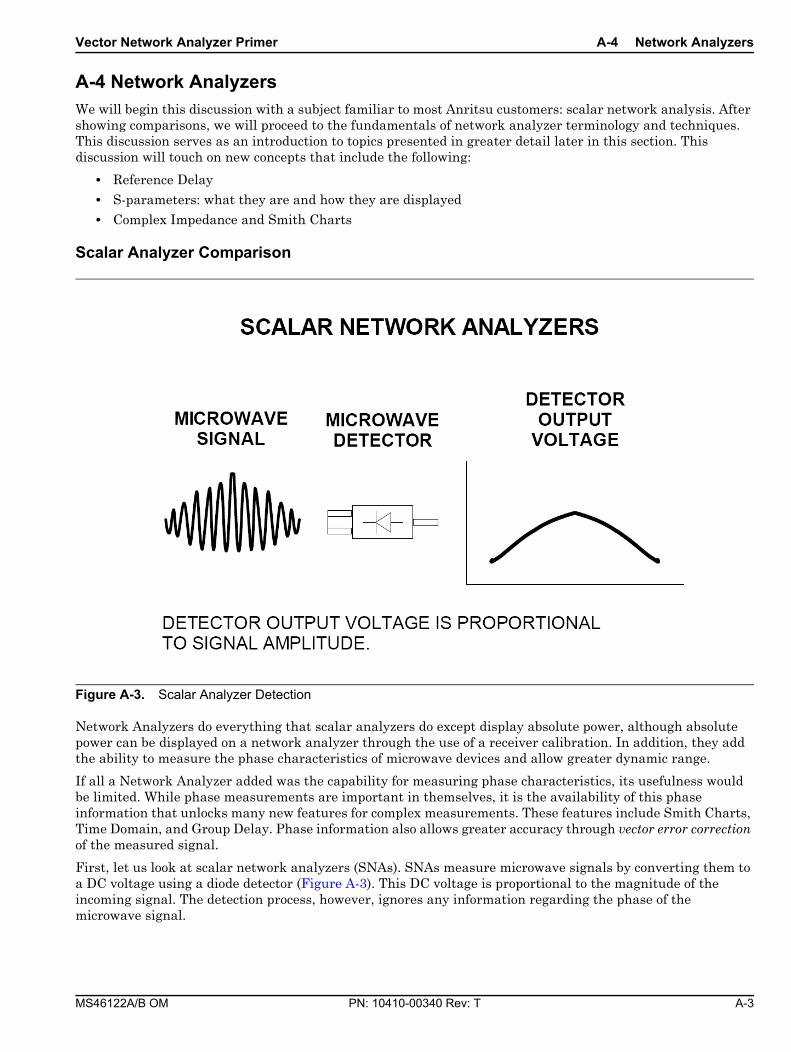
Vector Network Analyzer Primer A-4 Network Analyzers
MS46122A/B OM PN: 10410-00340 Rev: T A-3
A-4 Network AnalyzersWe will begin this discussion with a subject familiar to most Anritsu customers: scalar network analysis. After showing comparisons, we will proceed to the fundamentals of network analyzer terminology and techniques. This discussion serves as an introduction to topics presented in greater detail later in this section. This discussion will touch on new concepts that include the following:
• Reference Delay
• S-parameters: what they are and how they are displayed
• Complex Impedance and Smith Charts
Scalar Analyzer Comparison
Network Analyzers do everything that scalar analyzers do except display absolute power, although absolute power can be displayed on a network analyzer through the use of a receiver calibration. In addition, they add the ability to measure the phase characteristics of microwave devices and allow greater dynamic range.
If all a Network Analyzer added was the capability for measuring phase characteristics, its usefulness would be limited. While phase measurements are important in themselves, it is the availability of this phase information that unlocks many new features for complex measurements. These features include Smith Charts, Time Domain, and Group Delay. Phase information also allows greater accuracy through vector error correction of the measured signal.
First, let us look at scalar network analyzers (SNAs). SNAs measure microwave signals by converting them to a DC voltage using a diode detector (Figure A-3). This DC voltage is proportional to the magnitude of the incoming signal. The detection process, however, ignores any information regarding the phase of the microwave signal.
Figure A-3. Scalar Analyzer Detection

A-4 Network Analyzers Vector Network Analyzer Primer
A-4 PN: 10410-00340 Rev: T MS46122A/B OM
In a vector network analyzer, access is needed to both the magnitude and phase of a microwave signal. There are several different ways to perform the measurement. The method Anritsu employs (called Harmonic Sampling or Harmonic Mixing) is to down-convert the signal to a lower intermediate frequency (IF). This signal can then be measured directly by a tuned receiver. The tuned receiver approach gives the system greater dynamic range. The system is also much less sensitive to interfering signals, including harmonics.
Vector Network Analyzer BasicsThe vector network analyzer is a tuned receiver (Figure A-4). The microwave signal is down converted into the pass band of the IF. To measure the phase of this signal, we must have a reference to compare it with. If the phase of a signal is 90 degrees, it is 90 degrees different from the reference signal (Figure A-5). The network analyzer would read this as –90 degrees, since the test signal is delayed by 90 degrees with respect to the reference signal.
This phase reference can be obtained by splitting off some of the microwave signal before the measurement (Figure A-7).
Figure A-4. Network Analyzer as a Tuned Receiver
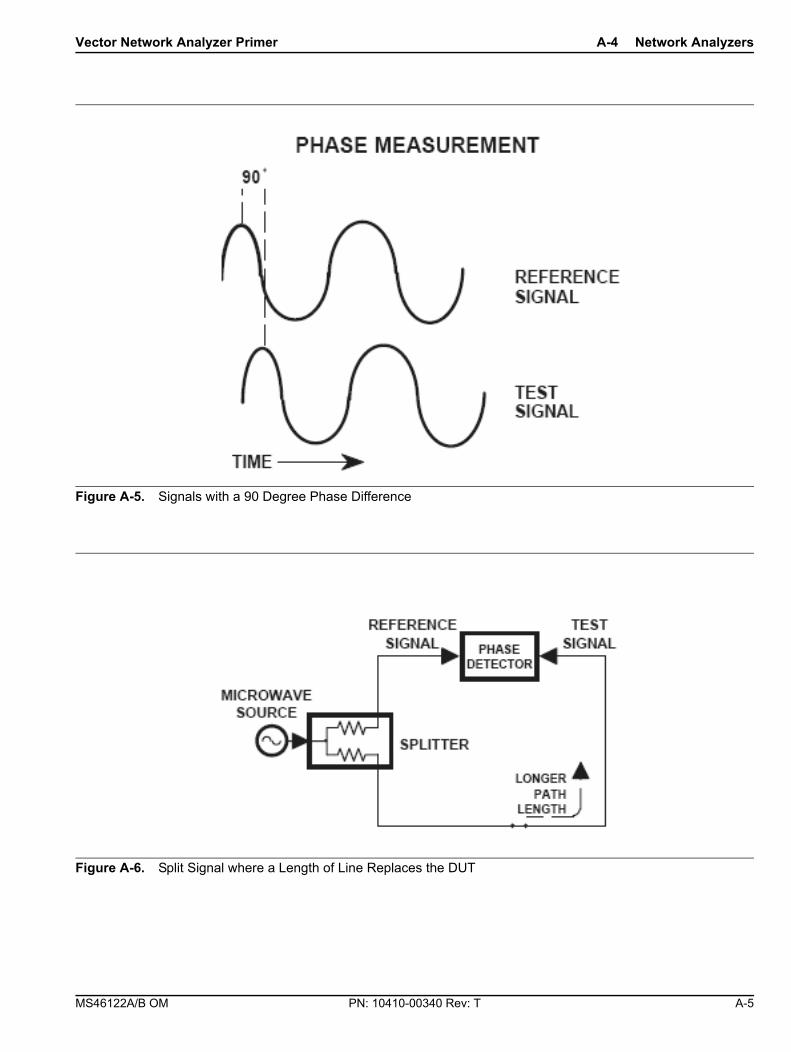
Vector Network Analyzer Primer A-4 Network Analyzers
MS46122A/B OM PN: 10410-00340 Rev: T A-5
Figure A-5. Signals with a 90 Degree Phase Difference
Figure A-6. Split Signal where a Length of Line Replaces the DUT

A-4 Network Analyzers Vector Network Analyzer Primer
A-6 PN: 10410-00340 Rev: T MS46122A/B OM
The phase of the microwave signal after it has passed through the device under test (DUT) is then compared with the reference signal. A network analyzer test set automatically samples the reference signal, so no external hardware is needed.
Let us consider for a moment that you remove the DUT and substitute a length of transmission line (Figure A-6). Note that the path length of the test signal is longer than that of the reference signal. Now let us see how this affects our measurement.
Assume that we are making a measurement at 1 GHz and that the difference in path-length between the two signals is exactly 1 wavelength. This means that test signal is lagging the reference signal by 360 degrees (Figure A-8).We cannot really tell the difference between one sine wave maxima and the next (they are all identical), so the network analyzer would measure a phase difference of 0 degrees.
Figure A-7. Splitting the Microwave Signal
Figure A-8. Split Signal where Path Length is Different by Exactly One Wavelength

Vector Network Analyzer Primer A-4 Network Analyzers
MS46122A/B OM PN: 10410-00340 Rev: T A-7
Now consider that we make this same measurement at 1.1 GHz. The frequency is higher by 10 percent so therefore the wavelength is shorter by 10 percent. The test signal path length is now 0.1 wavelength longer than that of the reference signal (Figure A-9). This test signal is:
1.1 X 360 = 396 degrees
This is 36 degrees different from the phase measurement at 1 GHz. The network analyzer will display this phase difference as –36 degrees. The test signal at 1.1 GHz is delayed by 36 degrees more than the test signal at 1 GHz.
You can see that if the measurement frequency is 1.2 GHz, we will get a reading of –72 degrees, –108 degrees for 1.3 GHz, etc. (Figure A-10). There is an electrical delay between the reference and test signals. For this delay we will use the common industry term of reference delay.
You also may hear it called phase delay. In older network analyzers you had to equalize the length of the reference arm with that of the test arm to make an appropriate measurement of phase vs. frequency.
To measure phase on a DUT, we want to remove this phase-change-vs.-frequency due to changes in the electrical length. This will allow us to view the actual phase characteristics. These characteristics may be much smaller than the phase change due to electrical length difference.
Figure A-9. Split Signal where Path Length is Longer than One Wavelength

A-4 Network Analyzers Vector Network Analyzer Primer
A-8 PN: 10410-00340 Rev: T MS46122A/B OM
There are two ways of accomplishing this. The most obvious way is to insert a length of line into the reference signal path to make both paths of equal length (Figure A-11).With perfect transmission lines and a perfect splitter, we would then measure a constant phase as we change the frequency. The problem using this approach is that we must change the line length with each measurement setup.
Figure A-10. Electrical Delay
Figure A-11. Split Signal where Paths are of Equal Length

Vector Network Analyzer Primer A-4 Network Analyzers
MS46122A/B OM PN: 10410-00340 Rev: T A-9
Another approach is to handle the path length difference in software. Figure A-12 displays the phase-vs.-frequency of a device. This device has different effects on the output phase at different frequencies. Because of these differences, we do not have a perfectly linear phase response. We can easily detect this phase deviation by compensating for the linear phase. The size of the phase difference increases linearly with frequency so we can modify the phase display to eliminate this delay.
The ShockLine MS46122A/B Series VNA offers automatic reference delay compensation. Figure A-13 shows the resultant measurement when we compensate path length. In a system application you can usually correct for length differences; however, the residual phase characteristics are critical.
Figure A-12. Phase Difference Increases Linearly with Frequency
Figure A-13. Resultant Phase with Path Length

A-4 Network Analyzers Vector Network Analyzer Primer
A-10 PN: 10410-00340 Rev: T MS46122A/B OM
Now let us consider measuring the DUT. Consider a two port device; that is, a device with a connector on each end. What measurements would be of interest?
First, we could measure the reflection characteristics at either end with the other end terminated into 50-ohms. If we designate one end as the normal place for the input that gives a reference, we can then define the reflection characteristics from the reference end as forward reflection, and those from the other end as reverse reflection (Figure A-14).
Second, we can measure the forward and reverse transmission characteristics. However, instead of saying “forward,” “reverse,” “reflection,” and “transmission” all the time, we use a shorthand. That is all that S-parameters are, a shorthand! The “S” stands for scattering. The second number is the device port that the signal is being injected into, while the first is the device port that the signal is leaving. S11, therefore, is the signal being injected into port 1 relative to the signal leaving port 1. The four scattering parameters (Figure A-15) are:
• S11: Forward Reflection
• S21: Forward Transmission
• S22: Reverse Reflection
• S12: Reverse Transmission
Figure A-14. Forward and Reverse Measurements

Vector Network Analyzer Primer A-4 Network Analyzers
MS46122A/B OM PN: 10410-00340 Rev: T A-11
S-parameters can be displayed in many ways. An S-parameter consists of a magnitude and a phase. We can display the magnitude in dB, just like a scalar network analyzer. We often call this term log magnitude. We can display phase as “linear phase” (Figure A-16). As discussed earlier, we cannot tell the difference between one cycle and the next. Therefore, after going through 360 degrees, we are back to where we began. We can display the measurement from –180 to +180 degrees. The –180 to +180 degree approach is more common. It keeps the display discontinuity removed from the important 0 degree area used as the phase reference.
There are several ways in which all the information can be displayed on one trace.
Figure A-15. S-Parameters
Figure A-16. Linear Phase with Frequency Waveform

A-5 Polar Display Vector Network Analyzer Primer
A-12 PN: 10410-00340 Rev: T MS46122A/B OM
A-5 Polar DisplayOne method is a polar display (Figure A-17). The radial parameter (distance from the center) is magnitude. The rotation around the circle is phase. We sometimes use polar displays to view transmission measurements, especially on cascaded devices (devices in series). The transmission result is the addition of the phase and log magnitude (dB) information of each device’s polar display.
Resistive and Reactive TermsAs we have discussed, the signal reflected from a DUT has both magnitude and phase. This is because the impedance of the device has both a resistive and a reactive term of the form r+jx. We refer to the r as the real or resistive term, while we call x the imaginary or reactive term. The j, which we sometimes denote as i, is an imaginary number.
It is the square root of –1. If x is positive, the impedance is inductive; if x is negative, the impedance is capacitive.
The size and polarity of the reactive component x is important in impedance matching. The best match to a complex impedance is the complex conjugate. This complex-sounding term simply means an impedance with the same value of r and x, but with x of opposite polarity.
Figure A-17. Polar Display

Vector Network Analyzer Primer A-6 Smith Chart
MS46122A/B OM PN: 10410-00340 Rev: T A-13
A-6 Smith ChartThe complex conjugate is best analyzed using a Smith Chart (Figure A-18), which is a plot of r and x. To display all the information on a single S-parameter requires one or two traces, depending upon the format we want. A very common requirement is to view forward reflection on a Smith Chart (one trace) while observing forward transmission in Log Magnitude and Phase (two traces). Let us see how to accomplish this in the ShockLine.
MS46122A/B Series VNA.
An important parameter we can measure when phase information is available is group delay. In linear devices, the phase change through the DUT is linear-with-frequency. Thus, doubling the frequency also doubles the phase change. An important measurement, especially for communications system users, is the rate of change-of-phase-vs.-frequency (group delay). If the rate of phase-change-vs.-frequency is not constant, the DUT is nonlinear. This nonlinearity can create distortion in communications systems.
Measurement Error CorrectionSince we can measure microwave signals in both magnitude and phase, it is possible to correct for six major error terms:
• Source Test Port Match
• Load Test Port Match
• Directivity
• Isolation
• Transmission Frequency Response
• Reflection Frequency Response
Figure A-18. Smith Chart
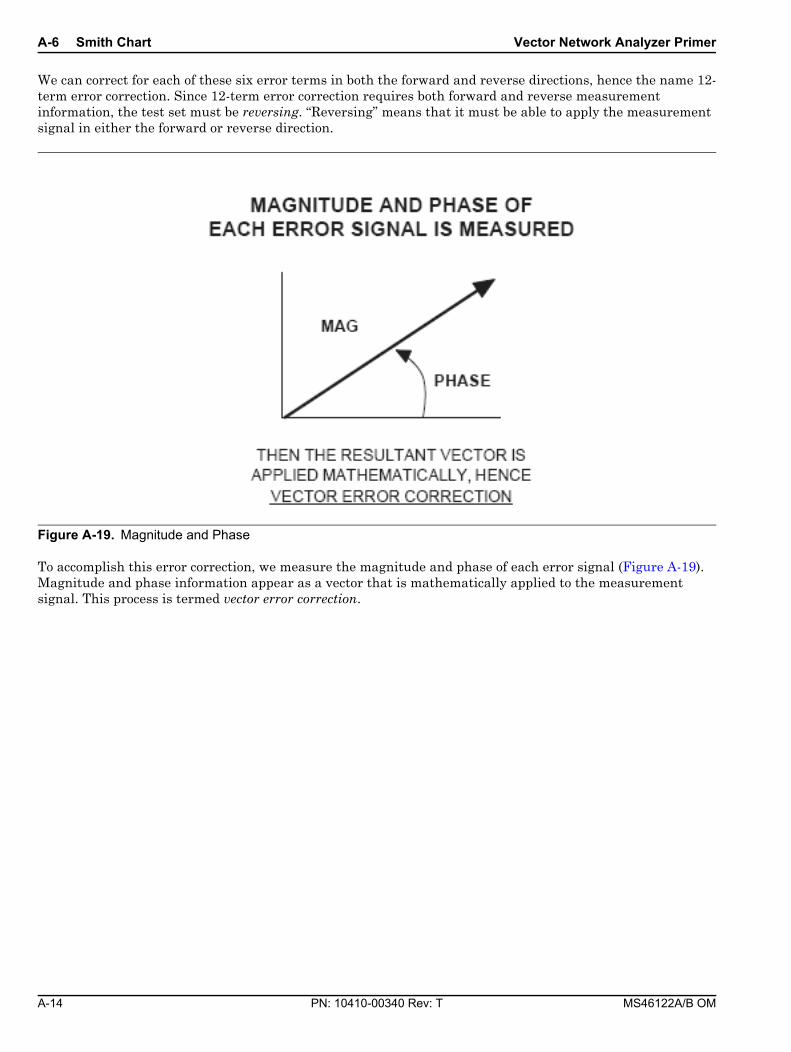
A-6 Smith Chart Vector Network Analyzer Primer
A-14 PN: 10410-00340 Rev: T MS46122A/B OM
We can correct for each of these six error terms in both the forward and reverse directions, hence the name 12-term error correction. Since 12-term error correction requires both forward and reverse measurement information, the test set must be reversing. “Reversing” means that it must be able to apply the measurement signal in either the forward or reverse direction.
To accomplish this error correction, we measure the magnitude and phase of each error signal (Figure A-19). Magnitude and phase information appear as a vector that is mathematically applied to the measurement signal. This process is termed vector error correction.
Figure A-19. Magnitude and Phase

MS46122A/B OM PN: 10410-00340 Rev: T B-1
Appendix B — Maintenance and SecurityB-1 Rack Ear Installation The rack ear hardware is shipped with the unit and can be installed whenever required by the user, The general procedure to install the rack ear kit is described below.
1. Disconnect the power supply and any other attachments from the instrument.
2. Carefully place the instrument on a secure and stable work surface.
3. Refer to Figure B-1. Using a type #1 Phillips screwdriver, remove the screws from the four feet (#1) on the bottom of the unit.
4. Pull off the front and rear shroud (#2) exposing the mounting strips.
5. Remove the four mounting strips (#3) from the top and bottom of the unit.
6. Remove the two flat head screws on the sides of the top cover.
1. Bottom Feet (one of four) 2. Mounting Strips (one of four)3. Shrouds (one of two)Figure B-1. Rack Ear Preparation
Note The rack ear kit (3-80790) is shipped with the MS46122A/B.
2
1
3

B-2 Security and Memory Overview Maintenance and Security
B-2 PN: 10410-00340 Rev: T MS46122A/B OM
7. Refer to Figure B-2. Install the rack ears in the orientation as shown using the four flat heads screws provided.
8. Re-install the three flat head screws into the top panel.
9. Install the four pan head M3 x 6 mm screws supplied with the rack ear bracket to the side panel.
B-2 Security and Memory OverviewThe ShockLine MS46122A/B Series VNA does not require memory purging after it has ben removed from a secure location, since there is no data memory in the unit.
1. Rack Ears (one of two)Figure B-2. Rack Ear Installation
1

Maintenance and Security B-3 Preparation for Storage or Shipment
MS46122A/B OM PN: 10410-00340 Rev: T B-3
B-3 Preparation for Storage or ShipmentUse the following information for preparing the ShockLine MS46122A/B Series VNA for storage or shipment.
Preparation for StoragePreparing the VNA for storage consists of cleaning the unit, packing it inside of the storage container with moisture-absorbing desiccant crystals, and storing the unit in a temperature-controlled environment that is maintained between –40 °C and +75 °C.
Preparation for ShipmentTo provide maximum protection against damage in transit, the VNA should be repackaged in the original shipping container. If this container is not available and the unit is being returned to Anritsu for repair, advise Anritsu Customer Service to inquire about obtaining a suitable container. In the event these options are not possible, instructions for packaging and shipment are given below:
Dimensions The instrument body dimensions are:
• Height: 61 mm• Width: 328 mm• Depth: 198 mm
1. Remove any user-supplied connectors or adapters. If installed, remove the rack mounting ears and related hardware.
2. Obtain a corrugated cardboard carton with at least 125 kg test strength. This carton should have inside dimensions of no less than 15 cm (6.0”) larger than the instrument unit dimensions to allow for cushioning.
3. Surround the unit with polyethylene sheeting to protect the finish. A sealed bag is recommended as a best practice.
4. Cushion the instrument on all sides by tightly packing dunnage or urethane foam between the carton and the unit. Provide at least 8 cm (3.0”) of dunnage on all sides; best practices recommend completely filling the space between the carton and instrument with dunnage.
5. Seal the carton by using either shipping tape or an industrial stapler.
6. If the instrument is being returned to Anritsu for service, mark the address of the appropriate Anritsu service center and your return address on the carton in one or more prominent locations.

B-3 Preparation for Storage or Shipment Maintenance and Security
B-4 PN: 10410-00340 Rev: T MS46122A/B OM

MS46122A/B OM PN: 10410-00340 Rev: T C-1
Appendix C — Abbreviation GlossaryC-1 Appendix OverviewThis glossary defines the abbreviations and terms that appear on the connectors and buttons of the MS46122A/B Series VNA. In some cases, due to space limitations, multiple abbreviations are used for the same term or the same abbreviation is used with different punctuation.
C-2 Glossary
Abbreviation or Term Meaning / Definition (1 of 14)
% Percentage
# Number
(1:2):3 One differential pair and one singleton. Trace and dialog labeling for Mixed-mode with one differential pair and one singleton. In this example, The DUT port differential is measured from 1 to 2 and 3 is the singleton.
(1:2):3:4 One differential pair and two singletons. Trace and dialog labeling for Mixed-mode with one differential pair and two singletons. In this example, the DUT port differential is measured from 1 to 2 while 3 and 4 are the singletons.
(4:1):(2:3) Two differential pairs. Trace and dialog labeling for Mixed-mode with two differential pairs. In this example, the first port pair is measured from 4 to 1 and the second port pair is measured from 2 to 3.
(4:2):1 One differential pair and one singletons. Trace and dialog labeling for Mixed-mode with one differential pair and one singleton. The DUT port differential is measured from 4 to 2 and 1 is the singleton.
(4:2):1:3 One differential pair and two singletons. Trace and dialog labeling for Mixed-mode with one differential pair and two singletons. In this example, the DUT port differential is measured from 4 to 2 while 1 and 3 are the singletons.
(1:2):(3:4) Two differential pairs. Trace and dialog labeling for Mixed-mode with two differential pairs. In this example, the first port pair is measured from 1 to 2 and the second port pair is measured from 3 to 4.
1P2PF Abbreviation for one-path two-port calibration forward direction.
Used in the SCPI command:SENSe{1-16}:CORRection:COLLect[:METHod]:1P2PF to simulate the calibration.
1P2PR Abbreviation for one path two port calibration reverse direction.
Used in the SCPI command:SENSe{1-16}:CORRection:COLLect[:METHod]:1P2PR to simulate the calibration.
A1a1
Reference 1 or Reference a
A2a2
Reference 2 or Reference b
Actv. Active
Addr. Address
ALC Automatic Level Control

C-2 Glossary Abbreviation Glossary
C-2 PN: 10410-00340 Rev: T MS46122A/B OM
ALRMA-LRM™
Calibration menu. Advanced-Line-Reflect-Match calibration algorithm and method. A-LRM is a trademark of Anritsu Company.
Auto-ReturnAuto-return
User interface. After a button selection, the instrument automatically returns to previous menu where the user selection is usually displayed on a field button. Auto-return buttons are usually a member of a button selection group (“a radio button” group) described below.
Avg. Average
B1b1
S-Parameter. Test 1 or Test a
B2b2
S-Parameter. Test 2 or Test b
Bal. Balance
BB Broadband
BeginningSwp Beginning sweep
Button Selection Group Popular name is “radio button” group. A group of two or more soft buttons where selection of one button de-selects all other button members of the group. Often combined with auto-return function (described above) where the interface automatically returns to previous menu after the button selection is made.
ButtonButtons
Individual elements of the right-side user interface menus. Button come in a variety of types such as toggle buttons, or menu buttons. See also “Soft buttons.”
C(P)C(S)C(S)-L(P)C(P)-L(S)
Abbreviation for LC circuit primitives. Capacitance (Parallel), Capacitance (S), Capacitance (Series)-Inductor (Parallel), and Capacitance (Parallel)-Inductor (Series).
CAL (.CAL) File File type extension.
Cal. Eff. Pwr Calculated effective power
CalCal.
CalibrateCalibration
CalsCals.
Calibrations
CCKTFour A four-node capacitance C circuit. Port assignments are defined in separate commands. Available if the instrument is in 4-Port VNA mode.
Charac. CharacterizeCharacterization
cm Distance units abbreviation. Centimeter.
Cnt Count
Coax Coaxial cable
Coef. Coefficient
Comm. Communication
Compress Compression
Config. ConfigureConfiguration
Abbreviation or Term Meaning / Definition (2 of 14)

Abbreviation Glossary C-2 Glossary
MS46122A/B OM PN: 10410-00340 Rev: T C-3
CPLS Parallel capacitance with series inductance. Available if the instrument is in 2-Port VNA mode.
CSLP Series capacitance with parallel inductance. For capacitance only, set L to zero. Available if the instrument is in 2-Port VNA mode.
CW Continuous Wave
D1S0 D One S Zero. In 4-Port VNAs, one differential pair and no singletons. Used in the MXP SETUP dialog box and the:CALCulate{1-16}:MXP SCPI commands.
• MAIN | System | SYSTEM | Setup | SETUP | Misc. Setup | MISC. SETUP | MnP Files Setup | MXP SETUP Dialog Box
D1S1 D One S One. In 4-Port VNAs, one differential pair and one singleton. Used in the MXP SETUP dialog box and the :CALCulate{1-16}:MXP SCPI commands.
• MAIN | System | SYSTEM | Setup | SETUP | Misc. Setup | MISC. SETUP | MnP Files Setup | MXP SETUP Dialog Box
D1S2 D One S Two. In 4-Port VNAs, one differential pair and two singletons. Used in the MXP SETUP dialog box and the :CALCulate{1-16}:MXP SCPI commands.
• MAIN | System | SYSTEM | Setup | SETUP | Misc. Setup | MISC. SETUP | MnP Files Setup | MXP SETUP Dialog Box
D2S0 D Two S Zero. In 4-Port VNAs, two differential pairs and no singletons. Used in the MXP SETUP dialog box and the :CALCulate{1-16}:MXP SCPI commands.
• MAIN | System | SYSTEM | Setup | SETUP | Misc. Setup | MISC. SETUP | MnP Files Setup | MXP SETUP Dialog Box
DAC Digital to Analog Converter
Data/Mem Data value divided by the memory value.
Data+Mem Data value plus the memory value.
DataMem Data value times the memory value.
Data-Mem Data value minus the memory value.
DataMemMath Data and memory mathematical equations.
dB Decibels
dB/Div SCALE menu toolbar function. Decibels per trace display division.
DDS Direct Digital Synthesis
De-embedDe-EmbedDeembed
De-embedding. Process where calibration parameters for a test fixture are removed from the calibrated instrument and connection cables.
DegDegs
DegreeDegrees
Degs/Div SCALE menu toolbar function. Degrees per trace display division. For circular Polar or Smith Chart displays only.
Diff. Differential
Div. Division
DTF Distance to fault
DUT Device under test
Abbreviation or Term Meaning / Definition (3 of 14)
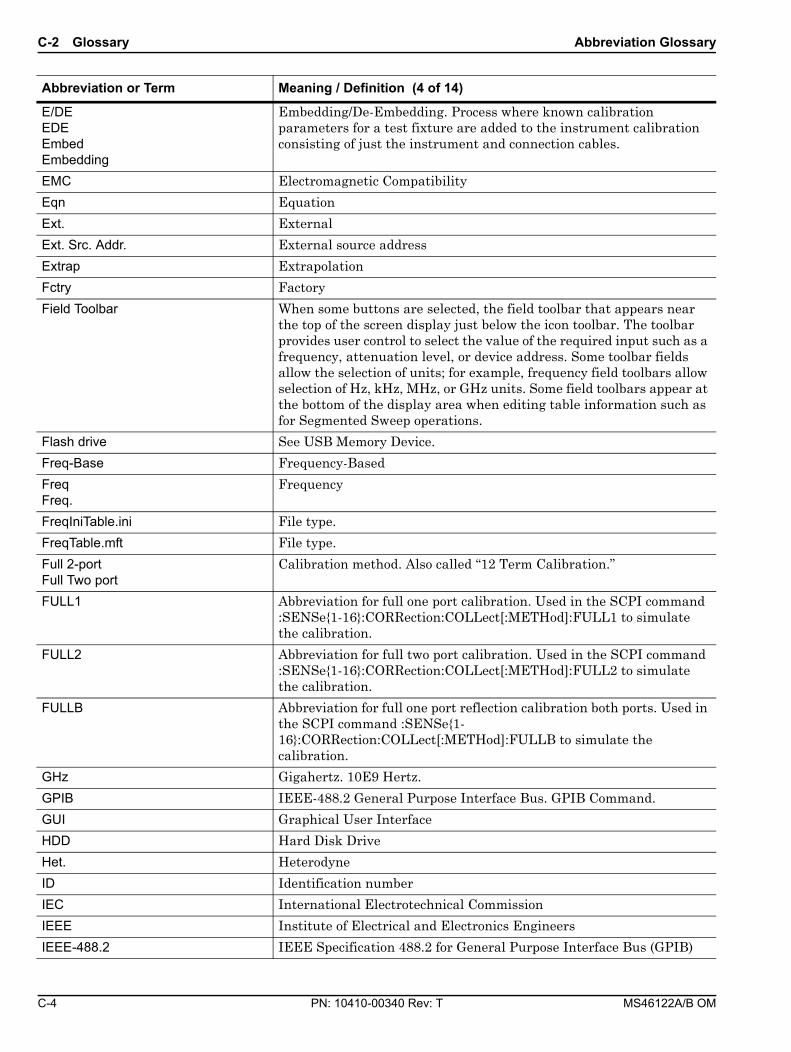
C-2 Glossary Abbreviation Glossary
C-4 PN: 10410-00340 Rev: T MS46122A/B OM
E/DEEDEEmbedEmbedding
Embedding/De-Embedding. Process where known calibration parameters for a test fixture are added to the instrument calibration consisting of just the instrument and connection cables.
EMC Electromagnetic Compatibility
Eqn Equation
Ext. External
Ext. Src. Addr. External source address
Extrap Extrapolation
Fctry Factory
Field Toolbar When some buttons are selected, the field toolbar that appears near the top of the screen display just below the icon toolbar. The toolbar provides user control to select the value of the required input such as a frequency, attenuation level, or device address. Some toolbar fields allow the selection of units; for example, frequency field toolbars allow selection of Hz, kHz, MHz, or GHz units. Some field toolbars appear at the bottom of the display area when editing table information such as for Segmented Sweep operations.
Flash drive See USB Memory Device.
Freq-Base Frequency-Based
FreqFreq.
Frequency
FreqIniTable.ini File type.
FreqTable.mft File type.
Full 2-portFull Two port
Calibration method. Also called “12 Term Calibration.”
FULL1 Abbreviation for full one port calibration. Used in the SCPI command :SENSe{1-16}:CORRection:COLLect[:METHod]:FULL1 to simulate the calibration.
FULL2 Abbreviation for full two port calibration. Used in the SCPI command :SENSe{1-16}:CORRection:COLLect[:METHod]:FULL2 to simulate the calibration.
FULLB Abbreviation for full one port reflection calibration both ports. Used in the SCPI command :SENSe{1-16}:CORRection:COLLect[:METHod]:FULLB to simulate the calibration.
GHz Gigahertz. 10E9 Hertz.
GPIB IEEE-488.2 General Purpose Interface Bus. GPIB Command.
GUI Graphical User Interface
HDD Hard Disk Drive
Het. Heterodyne
ID Identification number
IEC International Electrotechnical Commission
IEEE Institute of Electrical and Electronics Engineers
IEEE-488.2 IEEE Specification 488.2 for General Purpose Interface Bus (GPIB)
Abbreviation or Term Meaning / Definition (4 of 14)

Abbreviation Glossary C-2 Glossary
MS46122A/B OM PN: 10410-00340 Rev: T C-5
IF Intermediate Frequency
IFBW Intermediate Frequency Bandwidth
Imag. Imaginary
IMD Intermodulation distortion
Imped. Impedance
Imped. Transf. Impedance transformation
Indep. Independent
Inter. InterfaceInterference
IntraTrace Mathematical operations within the same trace display. As opposed to inter-trace operations.
IP Internet Protocol
j Imaginary number
jX Reactance term in Ohms
K Connector Connector type. Compatible with SMA, WSM and 3.5 mm connectors, it has a rated frequency range from DC to 40 GHz. K Connector is a trademark of Anritsu Company.
kHz Kilohertz. 10E3 Hertz.
km Distance units abbreviation. Kilometer.
L(P)L(S)L(P)-C(S)L(S)-C(P)
Abbreviation for LC circuit primitives. Inductor (Parallel), Inductor (Series), Inductor (Series)-Capacitance (Parallel), and Inductor (Parallel) and Capacitance (Series).
Lang. Language
LCD Liquid Crystal Display
LCKTFour A four-node inductance L circuit. Port assignments are defined in separate commands. Available if the instrument is in 4-Port VNA mode.
Lft Left
Lin Linear
LO Local Oscillator
Log Logarithmic
LogMag Logarithmic Magnitude
LRL/LRM Calibration method. Line-reflect-line calibration algorithm. Line-reflect-match calibration algorithm.
LSCP Series inductance with parallel capacitance. For inductance only, set C to zero. Available if the instrument is in 2-Port VNA mode.
LSCS Parallel inductance with series capacitance. Available if the instrument is in 2-Port VNA mode.
LVD Low Voltage Directive
m Distance unit abbreviation. Meter.
MagMag.
Magnitude
max Num Maximum Number
Abbreviation or Term Meaning / Definition (5 of 14)

C-2 Glossary Abbreviation Glossary
C-6 PN: 10410-00340 Rev: T MS46122A/B OM
Maxmax
Maximum
MB/s Megabytes per second
MbMbit
Megabit. 1 megabit equals 10E6 bits or 1,000,000 bits.
MBMbyte
Megabyte. In SI decimal units, 1 megabyte equals 1000E3 bytes or 1,000,000 bytes. In IEC binary units, a “mebibyte or MiB” equals 1024E3 bytes or 1,048,576 bytes, but is also commonly called a “megabyte.”
MemMem.
Memory
Memory stick See USB Memory Device.
menu Available menus in the top level menu-bar command interface.
Menu command Individual commands listed on a drop-down menu from the top menu bar. For example, on the File menu, the first command is Recall.
MFT (.mft) Files File type extension.
MG Anritsu Measurement Guide
MHz Megahertz. 10E6 Hertz. 1,000,000 Hertz
Micr. Microporous Teflon dielectric type
MinMin.
Minimum
Misc. Miscellaneous
Mkr # [OFF] Marker number with the Reference Marker function toggled off and the marker also toggled off; for example, Mkr 1 [OFF] for Marker 1.
Mkr # [ON] Marker number with the Reference Marker function toggled off and the marker toggled on; for example, Mkr 1 [ON] for Marker 1.
Mkr#-Ref [OFF] Marker number with the Reference Marker function toggled on and the marker toggled off; for example, Mkr1-Ref [OFF] for Marker 1.
Mkr#-Ref [ON] Marker number with the Reference Marker function toggled on and the marker also toggled on; for example, Mkr1-Ref [ON] for Marker 1.
MkrMkrs
Marker, Markers
mm Units abbreviation. Millimeter.
MM Anritsu Maintenance Manual
mmWavemm-Wave
Millimeter wavelength
Model# Model Number
ms Time units abbreviation. Millisecond.
MS46122A/B Series VNA The function or feature refers to any VNA model in the series: MS46122A/B.
Abbreviation or Term Meaning / Definition (6 of 14)

Abbreviation Glossary C-2 Glossary
MS46122A/B OM PN: 10410-00340 Rev: T C-7
Navigation paths Navigation to a menu or dialog box of interest is entered using navigation notation where the pipe (“ | ”) symbol is used to separate elements. The starting menu is usually the MAIN Menu. The general format is with menu and dialog boxes in ALL CAPS and buttons in Title Case; both use this distinctive Sans Serif Font in the general format:
MAIN | Button | MENU | ... | Button | DESTINATION MENU/DIALOG BOXFor example, the navigation path to the REFERENCE PLANE menu is:
MAIN | Measurement | MEASUREMENT | Reference Plane | REFERENCE PLANE
NIST National Institute of Standards and Technology.
ns Time units abbreviation. Nanosecond.
NtwkNtwk.
Network
Ohms/Div SCALE menu toolbar function. Ohms (Ω) per trace display division.
OM Anritsu Operations Manual
Op. OperandOperationOperations
Out. Output
P2P Pulse-to-Pulse
Param. ParameterParameters
PDF Proprietary Portable Document Format from Adobe Corporation.
PG Pulse Generator
PIP Point-in-Pulse
PM Anritsu Programming Manual
PrevPrev.
Previous
PRF Pulse Repetition Frequency
PRI Pulse Repetition Interval
Profile Pulse Profile
ps Time units abbreviation. Picosecond.
PwrPwr.
Power
R Resistance
R(P), R(S) Parallel Resistance, Series Resistance
R-Circuit Resistive element of an L-C circuit
RCKTFour A four-node resistive R circuit. Port assignments are defined in separate commands. Available if the instrument is in 4-Port VNA mode.
RcvrRcvr.
Receiver
Abbreviation or Term Meaning / Definition (7 of 14)

C-2 Glossary Abbreviation Glossary
C-8 PN: 10410-00340 Rev: T MS46122A/B OM
Rect. ReactanceRectangleRectangular
Ref.Mkr Reference Marker
RefRef.
Reference
RESP1 Abbreviation for one-port response calibration. Used in the SCPI command :SENSe{1-16}:CORRection:COLLect[:METHod]:RESP1 to simulate the calibration.
RESPB Abbreviation for one-port response calibration both ports. Used in the SCPI command :SENSe{1-16}:CORRection:COLLect[:METHod]:RESPB to simulate the calibration.
RF Radio Frequency
RP Resistive parallel network. Available if the instrument is in 2-Port VNA mode.
RS Resistive series network. Available if the instrument is in 2-Port VNA mode.
Rt Right
s Time units abbreviation. Second.
S11 S-Parameter. Used in text for S-parameter measurement of input reflection coefficient. In text written as “S11”. Mathematical version uses subscripts as S11. Available in 2-Port and 4-Port VNAs.
S12 S-Parameter. Used in text for S-parameter measurement of reverse transmission coefficient. Mathematical version uses subscripts as S12. Available in 2-Port and 4-Port VNAs.
S13 S-Parameter. Used in test for S-parameter measurement. Mathematical version used subscripts as S13. Available only in 4-Port VNAs.
S14 S-Parameter. Used in test for S-parameter measurement. Mathematical version used subscripts as S14. Available only in 4-Port VNAs.
S21 S-Parameter. Used in text for S-parameter measurement of forward transmission coefficient. Mathematical version uses subscripts as S21. Available in 2-Port and 4-Port VNAs.
S22 S-Parameter. Used in text for S- parameter measurement of output reflection coefficient. Mathematical version uses subscripts as S22. Available in 2-Port and 4-Port VNAs.
S23 S-Parameter. Used in test for S-parameter measurement. Mathematical version used subscripts as S23. Available only in 4-Port VNAs.
S24 S-Parameter. Used in test for S-parameter measurement. Mathematical version used subscripts as S23. Available only in 4-Port VNAs.
Abbreviation or Term Meaning / Definition (8 of 14)

Abbreviation Glossary C-2 Glossary
MS46122A/B OM PN: 10410-00340 Rev: T C-9
s2p File extension. Abbreviation for S-parameter 2-Port configuration file. The general type of file extension is referred to an “.snp” file where the “n” refers to the number of ports, such as “.s1p” for an S-parameter 1-Port configuration file.
S2Pfile Allows an S2P calibration file to be used. Available if the instrument is in 2-Port VNA mode.
S31 S-Parameter. Used in test for S-parameter measurement. Mathematical version used subscripts as S31. Available only in 4-Port VNAs.
S32 S-Parameter. Used in test for S-parameter measurement. Mathematical version used subscripts as S32. Available only in 4-Port VNAs.
S33 S-Parameter. Used in test for S-parameter measurement. Mathematical version used subscripts as S33. Available only in 4-Port VNAs.
S34 S-Parameter. Used in test for S-parameter measurement. Mathematical version used subscripts as S34. Available only in 4-Port VNAs.
S41 S-Parameter. Used in test for S-parameter measurement. Mathematical version used subscripts as S41. Available only in 4-Port VNAs.
S42 S-Parameter. Used in test for S-parameter measurement. Mathematical version used subscripts as S42. Available only in 4-Port VNAs.
S43 S-Parameter. Used in test for S-parameter measurement. Mathematical version used subscripts as S43. Available only in 4-Port VNAs.
S44 S-Parameter. Used in test for S-parameter measurement. Mathematical version used subscripts as S44. Available only in 4-Port VNAs.
S4Pfile Allows an S4P calibration file to be used. Available if the instrument is in 4-Port VNA mode.
SC1C1 Two differential pairs. Trace labeling for Mixed-mode with two differential pairs. S-parameter for common-mode reception at Pair 1 and common-mode drive at Pair 1.
SC1C2 Two differential pairs. Trace labeling for Mixed-mode with two differential pairs. S-parameter for common-mode reception at Pair 1 and common-mode drive at Pair 2.
SC1D1 Two differential pairs. Trace labeling for Mixed-mode with two differential pairs. S-parameter for common-mode reception at Pair 1 and differential drive at Pair 1.
SC1D2 Two differential pairs. Trace labeling for Mixed-mode with two differential pairs. S-parameter for common-mode reception at Pair 1 and differential drive at Pair 2.
SC2C1 Two differential pairs. Trace labeling for Mixed-mode with two differential pairs. S-parameter for common-mode reception at Pair 2 and common-mode drive at Pair 1.
Abbreviation or Term Meaning / Definition (9 of 14)

C-2 Glossary Abbreviation Glossary
C-10 PN: 10410-00340 Rev: T MS46122A/B OM
SC2C2 Two differential pairs. Trace labeling for Mixed-mode with two differential pairs. S-parameter for common-mode reception at Pair 2 and common-mode drive at Pair 2.
SC2D1 Two differential pairs. Trace labeling for Mixed-mode with two differential pairs. S-parameter for common-mode reception at Pair 2 and differential drive at Pair 1.
SC2D2 Two differential pairs. Trace labeling for Mixed-mode with two differential pairs. S-parameter for common-mode reception at Pair 2 and differential drive at Pair 2.
SCC One differential pair and one singleton. Trace labeling for Mixed-mode with common-mode reception at Pair 1 and common-mode drive at Pair 1. S-Parameter for common-mode reception at Pair 1 and common-mode drive at Pair 1.
One differential pair and two singletons. Trace labeling for Mixed-mode for Pair 1 common-mode reception and Pair 1 drive. S-Parameter for common-mode reception at Pair 1 and common-mode drive at Pair 1.
Trace labeling for Mixed-mode with common-mode reception at Pair 1 and common-mode drive at Pair 2. S-Parameter for common-mode reception at Pair 1 and common-mode drive at Pair 1.
SCD One differential pair and one singleton. Trace labeling for Mixed-mode for Pair 1 reception and Pair 1 drive. S-Parameter for common-mode reception at Pair 1 and differential drive at Pair 1.
One differential pair and two singletons. Trace labeling for Mixed-mode with common-mode reception at Pair 1 and differential drive at Pair 2. S-Parameter for common-mode reception at Pair 1 and differential drive at Pair 1.
SCX One differential pair and one singleton. Trace labeling for Mixed-mode with Pair 1 common-mode reception and singleton drive. S-Parameter for common-mode reception at Pair 1 and singleton drive.
One differential pair and two singletons. Trace labeling for Mixed-mode with common-mode reception at Pair 1 and drive at first singleton. S-Parameter for common-mode reception at Pair 1 and first singleton drive.
SCY One differential pair and two singletons. Trace labeling for Mixed-mode with common-mode at Pair 1 and drive at second singleton. S-Parameter for common-mode reception at Pair 1 and second singleton drive.
SD1C1 Two differential pairs. Trace labeling for Mixed-mode with two differential pairs. S-parameter for differential reception at Pair 1 and common-mode drive at Pair 2.
SD1C2 Two differential pairs. Trace labeling for Mixed-mode with two differential pairs. S-parameter for differential reception at Pair 1 and common-mode drive at Pair 2.
SD1D1 Two differential pairs. Trace labeling for Mixed-mode with two differential pairs. S-parameter for differential reception at Pair 1 and differential drive at Pair 2.
Abbreviation or Term Meaning / Definition (10 of 14)

Abbreviation Glossary C-2 Glossary
MS46122A/B OM PN: 10410-00340 Rev: T C-11
SD1D2 Two differential pairs. Trace labeling for Mixed-mode with two differential pairs. S-parameter for differential reception at Pair 1 and differential drive at Pair 2.
SD2C1 Two differential pairs. Trace labeling for Mixed-mode with two differential pairs. S-parameter for differential reception at Pair 2 and common-mode drive at Pair 1.
SD2C2 Two differential pairs. Trace labeling for Mixed-mode with two differential pairs. S-parameter for differential reception at Pair 2 and common-mode drive at Pair 2.
SD2D1 Two differential pairs. Trace labeling for Mixed-mode with two differential pairs. S-parameter for differential reception at Pair 2 and differential drive at Pair 1.
SD2D2 Two differential pairs. Trace labeling for Mixed-mode with two differential pairs. S-parameter for differential reception at Pair 2 and differential drive at Pair 2.
SDC One differential pair and one singleton. Trace labeling for Mixed-mode for Pair 1 reception and Pair 1 drive. S-Parameter for differential reception at Pair 1 and common-mode drive at the port pair.
One differential pair and two singletons. Trace labeling for Mixed-mode with differential reception at Pair 1 and common-mode drive at Pair 1. S-Parameter for differential reception and common-mode drive at Pair 1.
SDD One differential pair and one singleton. Trace labeling for Mixed-mode for Pair 1 reception and Pair 1 drive. S-Parameter for differential reception and differential drive.
One differential pair and two singletons. Trace labeling for Mixed-mode with differential reception at Pair 1 and differential drive at Pair 1. S-Parameter for differential reception and differential drive at Pair 1.
SDX One differential pair and one singleton. Trace labeling for Mixed-mode for Pair 1 reception and singleton drive. S-Parameter for differential reception at Pair 1 and singleton drive.
One differential pair and two singletons. Trace labeling for Mixed-mode with differential reception at Pair 1 and drive at first singleton. S-Parameter for differential reception at Pair 1 and first singleton drive.
SDY One differential pair and two singletons. Trace labeling for Mixed-mode with differential reception at Pair 1 and drive at second singleton. S-Parameter for differential reception at Pair 1 and second singleton drive.
Seg. SegmentSegmented
SerNum Serial Number
Set. Settings
SI International System of Units
Single Offset Calibration method
Abbreviation or Term Meaning / Definition (11 of 14)

C-2 Glossary Abbreviation Glossary
C-12 PN: 10410-00340 Rev: T MS46122A/B OM
Soft buttons Buttons that appear in the right side menu interface on the MS46122A/B Series VNA screen. In text, the name of the menu is formatted with a distinctive font in capitals, such as the FREQUENCY menu. Soft buttons on each menu, such as the Select Port toggle button are formatted in the same font with initial capitals.
SOLT/SOLR Calibration methods. Short-open-load-thru or short-open-load-reciprocal calibration algorithm.
Sparam S-Parameters or scattering parameters
S-Parameterss-parameters
Scattering parameters.
SrcSrc.
Source
SRPRPSRRSXRSRXSXX
General button format for mixed mode settings. In 4-port VNA mixed mode settings, this is the name format of the selectable button names. For buttons with five letters, “S” indicates a mixed mode S-Parameter, “R” is the selected response type of either “D” for differential or “C” for common mode, and “P” is the Port number between 1 and 4. For buttons with three letters, “S” indicates a mixed-mode S-Parameter, “R” is the selected response type of either “D” for differential or “C” for common mode, and “X” is the singleton drive.
SSD Solid State Drive
SSLT/SSLR Calibration methods. Short-short-load-thru or short-short-load-reciprocal calibration algorithm
SSST/SSSR Calibration methods. Short-short-short-thru or short-short-short-reciprocal calibration algorithm. Also called “Triple Offset Short”.
Swp Sweep
SWR Standing Wave Ratio
SXC One differential pair and one singleton. Trace labeling for Mixed-mode with first singleton reception and common-mode drive at Pair 1. S-Parameter for first singleton reception and common-mode drive at Pair 1.
One differential pair and two singletons. Trace labeling for Mixed-mode with singleton reception and differential drive. S-Parameter for singleton reception and common-mode drive at Pair 1.
SXD One differential pair and one singleton. Trace labeling for Mixed-mode with singleton reception and Pair 1 drive. S-Parameter for singleton reception and differential drive at Pair 1.
One differential pair and two singletons. Trace labeling for Mixed-mode with first singleton reception and differential drive at Pair 1. S-Parameter for first singleton reception and differential drive at Pair 1.
SXX One differential pair and one singleton. Trace labeling for Mixed-mode with singleton reception and singleton drive. S-Parameter for singleton reception and singleton drive.
One differential pair and two singletons. Trace labeling for Mixed-mode with first singleton reception and first singleton drive. S-Parameter for first singleton reception and first singleton drive.
Abbreviation or Term Meaning / Definition (12 of 14)
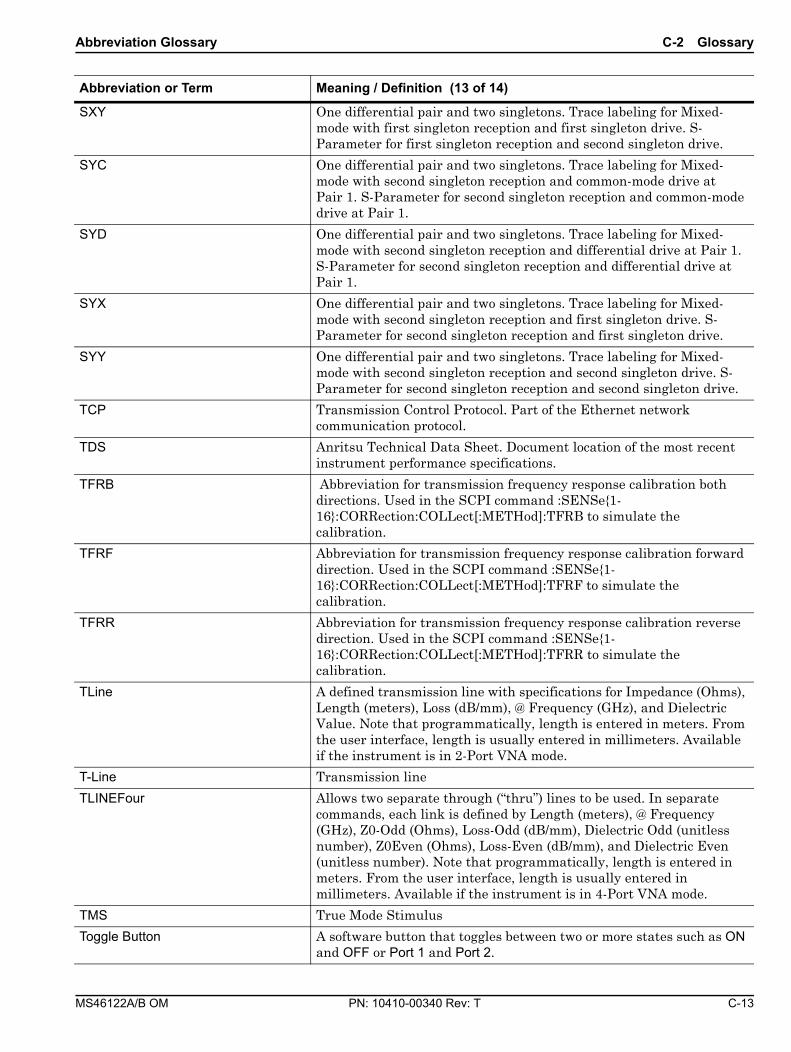
Abbreviation Glossary C-2 Glossary
MS46122A/B OM PN: 10410-00340 Rev: T C-13
SXY One differential pair and two singletons. Trace labeling for Mixed-mode with first singleton reception and first singleton drive. S-Parameter for first singleton reception and second singleton drive.
SYC One differential pair and two singletons. Trace labeling for Mixed-mode with second singleton reception and common-mode drive at Pair 1. S-Parameter for second singleton reception and common-mode drive at Pair 1.
SYD One differential pair and two singletons. Trace labeling for Mixed-mode with second singleton reception and differential drive at Pair 1. S-Parameter for second singleton reception and differential drive at Pair 1.
SYX One differential pair and two singletons. Trace labeling for Mixed-mode with second singleton reception and first singleton drive. S-Parameter for second singleton reception and first singleton drive.
SYY One differential pair and two singletons. Trace labeling for Mixed-mode with second singleton reception and second singleton drive. S-Parameter for second singleton reception and second singleton drive.
TCP Transmission Control Protocol. Part of the Ethernet network communication protocol.
TDS Anritsu Technical Data Sheet. Document location of the most recent instrument performance specifications.
TFRB Abbreviation for transmission frequency response calibration both directions. Used in the SCPI command :SENSe{1-16}:CORRection:COLLect[:METHod]:TFRB to simulate the calibration.
TFRF Abbreviation for transmission frequency response calibration forward direction. Used in the SCPI command :SENSe{1-16}:CORRection:COLLect[:METHod]:TFRF to simulate the calibration.
TFRR Abbreviation for transmission frequency response calibration reverse direction. Used in the SCPI command :SENSe{1-16}:CORRection:COLLect[:METHod]:TFRR to simulate the calibration.
TLine A defined transmission line with specifications for Impedance (Ohms), Length (meters), Loss (dB/mm), @ Frequency (GHz), and Dielectric Value. Note that programmatically, length is entered in meters. From the user interface, length is usually entered in millimeters. Available if the instrument is in 2-Port VNA mode.
T-Line Transmission line
TLINEFour Allows two separate through (“thru”) lines to be used. In separate commands, each link is defined by Length (meters), @ Frequency (GHz), Z0-Odd (Ohms), Loss-Odd (dB/mm), Dielectric Odd (unitless number), Z0Even (Ohms), Loss-Even (dB/mm), and Dielectric Even (unitless number). Note that programmatically, length is entered in meters. From the user interface, length is usually entered in millimeters. Available if the instrument is in 4-Port VNA mode.
TMS True Mode Stimulus
Toggle Button A software button that toggles between two or more states such as ON and OFF or Port 1 and Port 2.
Abbreviation or Term Meaning / Definition (13 of 14)

C-2 Glossary Abbreviation Glossary
C-14 PN: 10410-00340 Rev: T MS46122A/B OM
TR Instrument mode. Transmission/reflection mode.
TransfTransf.
TransferTransformation
Triple Offset Short Calibration method. Short-short-short-thru. Commonly abbreviated as “SSST.”
TRL Thru Reflect Line Calibration method. See LRL.
TRM Thru Reflect Match Calibration method. See ALRM.
TrTr.
Trace
TS Troubleshooting
TS Mode Troubleshooting Mode
TTL Transistor-Transistor Logic
U Units
um Distance units abbreviation. Micrometer.
Units/Div SCALE menu toolbar function. Measurement units per trace display division.
us Time units abbreviation. Microsecond (µs).
USB Universal Serial Bus
USB Memory Device Also called a “USB flash drive”, “USB stick”, “thumb drive”, or “memory stick.” In the context of Anritsu documentation, a USB memory device is used to transfer calibration, certification, and/or operating system updates to the MS46x20A instrument.
When the instrument interface or hardware uses another term such as “Calibration Memory Device,” its first use is always followed by the “USB Memory Device” in parenthesis.
For example: “...use the Calibration Memory Device (USB Memory Device) to load the characterization parameters for the calibration kit...”
USB stick See USB Memory Device.
UTF Universal Test Fixture
V VoltsVoltage
V AC Volts Alternating Current.
V Connector™ Anritsu Company trademarked connector name.Connector type. A 1.85 mm coaxial connector with a rated frequency range from DC to 65 GHz. V Connector is a trademark of Anritsu Company.
V DC Volts Direct Current
VCO Voltage Control Oscillator
VISA Virtual Instrument System Architecture
VNA Vector Network Analyzer
VSWR Voltage Standing Wave Ratio
Abbreviation or Term Meaning / Definition (14 of 14)

MS46122A/B OM PN: 10410-00340 Rev: T D-1
Appendix D — TroubleshootingD-1 IntroductionThis section provides troubleshooting tips when operating the MS46122A/B. Tips include:
• Section D-2 “No Hardware Detected”
• Section D-3 “Anritsu Hardware is Unavailable”
• Section D-4 “Driver Initialization Error”
• Section D-5 “Application Launch Failure”
• Section D-6 “EEPROM Does Not Match (Firmware Update)”
• Section D-7 “Updating EEPROM Unsuccessful (Firmware Update Failed)”
• Section D-8 “Updating Firmware Manually”
• Section D-9 “Traces Flat, No Sweeping”
• Section D-10 “Text Size Too Large”
• Section D-11 “Printout Does Not Capture the Entire ShockLine Screen”
• Section D-12 “Running ShockLine as Non-administrator”
D-2 No Hardware DetectedIf the ShockLine installation download results in a “No Hardware Detected” message, check the PC Device Manager. If installed successfully, the device should be present under Universal Serial Bus controllers as “Anritsu Programmed USB”, or under Other devices as MS46122x. See Figure D-1.
Figure D-1. USB Controller or Other Devices

D-2 No Hardware Detected Troubleshooting
D-2 PN: 10410-00340 Rev: T MS46122A/B OM
If it is displayed as “Anritsu Programmed USB” with an exclamation mark on it, perform an uninstall and delete the drivers until it is removed under USB controllers. See Figure D-2.
You might have to do this several times. However, if “No Hardware Detected” still appears in the PC Device Manager, please contact Anritsu Customer Service at:
https://www.anritsu.com/test-measurement/contact-us
Once it is installed successfully, it will appear in the Device Manager or Other Devices folder as in Figure D-1.
Then you can install the latest ShockLine software (if it’s not installed) and it will automatically install the drivers or install the drivers from “C:\Program Files (x86)\Anritsu Company\ShockLine\Application”.
Figure D-2. Confirm Device Uninstall
Figure D-3. Update Driver Software

Troubleshooting D-3 Anritsu Hardware is Unavailable
MS46122A/B OM PN: 10410-00340 Rev: T D-3
D-3 Anritsu Hardware is UnavailableShockLine software and IVI Clients cannot run simultaneously on the same PC. If ShockLine software is running and an IVI client is being started, then the ShockLine GUI will be automatically stopped. But if an IVI client is running, the ShockLine GUI will not be able to start and the following error message will be displayed as shown in Figure D-4. If this occurs, wait until the IVI client finishes and retry after to run ShockLine GUI.
Or if the IVI client was not properly closed, then the IVI Server has to be manually restarted because the hardware was not released.
Restart IVI ServerThe ShockLine Tray Daemon provides the Start IVI Server and Stop IVI Server user interface.
Figure D-4. Anritsu Hardware Is Unavailable
Figure D-5. ShockLine Tray Daemon (1 of 2)
1 32
CONNECTED

D-4 Driver Initialization Error Troubleshooting
D-4 PN: 10410-00340 Rev: T MS46122A/B OM
Indicator Color DefinitionsGreenWhen ShockLine Tray Daemon is green – the IVI Server is not running and that no IVI connections are available. Only ShockLine GUI can be used.
YellowWhen ShockLine Tray Daemon is yellow – the IVI Server is running. The IVI Clients or ShockLine GUI can be run.
RedNote the tray menu provides two status states when Red.
• If the state is “CONNECTED” – currently an IVI Client is connected and the hardware is busy; therefore, ShockLine GUI could not be used.
• If the state is “WAITING” – waiting for an IVI Client, but the hardware is not busy; therefore, ShockLine GUI nor an IVI Client can be run.
D-4 Driver Initialization ErrorIf an error occurs when trying to initialize an IVI Client as in Figure D-6, then the IVI Server has to be restarted as described in “Anritsu Hardware is Unavailable” on page D-3.
D-5 Application Launch FailureIn order to fix Application Launch Failure, perform the following.
1. Download the MVC++ 2015 package
• https://www.microsoft.com/download/confirmation.aspx?id=52685
2. Install the package
• If it returns an error saying that the same package is already installed, you might have to uninstall the current version of MVC++ 2015 first.
3. Download the ShockLine software.
• https://www.anritsu.com/test-measurement/support/downloads/software/dwl18844
1. Green Indicator2. Yellow Indicator
3. Red Indicator
Figure D-6. Driver Initialization Error
Figure D-5. ShockLine Tray Daemon (2 of 2)
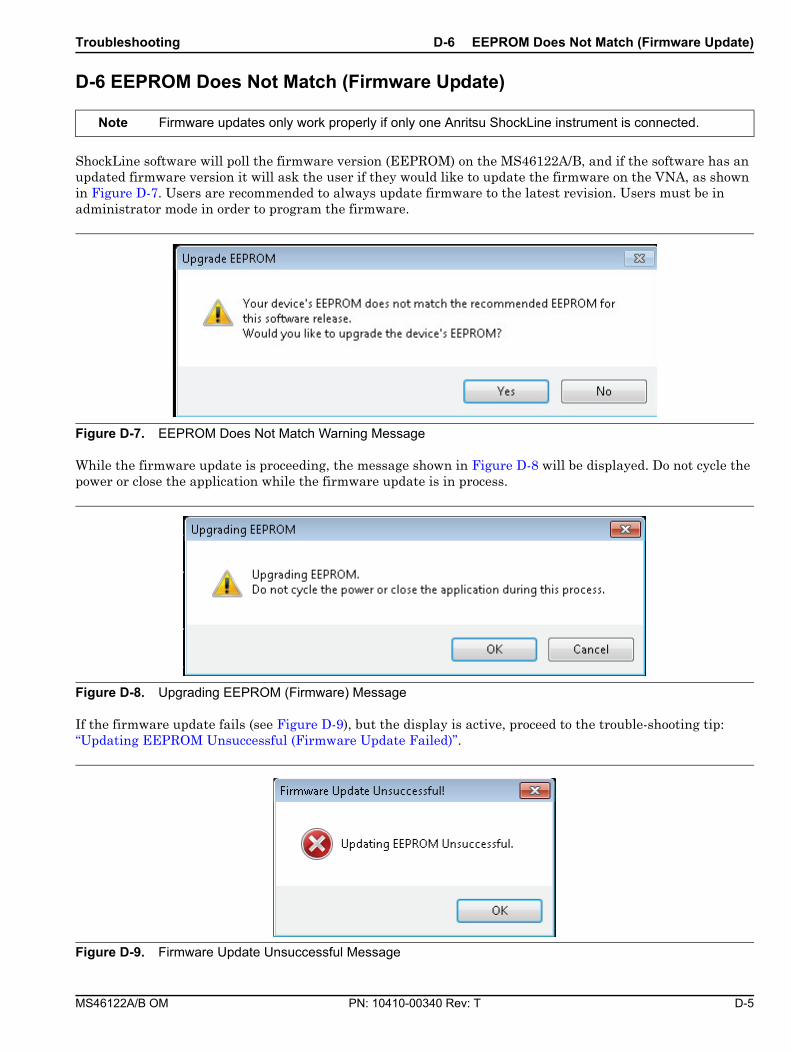
Troubleshooting D-6 EEPROM Does Not Match (Firmware Update)
MS46122A/B OM PN: 10410-00340 Rev: T D-5
D-6 EEPROM Does Not Match (Firmware Update)
ShockLine software will poll the firmware version (EEPROM) on the MS46122A/B, and if the software has an updated firmware version it will ask the user if they would like to update the firmware on the VNA, as shown in Figure D-7. Users are recommended to always update firmware to the latest revision. Users must be in administrator mode in order to program the firmware.
While the firmware update is proceeding, the message shown in Figure D-8 will be displayed. Do not cycle the power or close the application while the firmware update is in process.
If the firmware update fails (see Figure D-9), but the display is active, proceed to the trouble-shooting tip: “Updating EEPROM Unsuccessful (Firmware Update Failed)”.
Note Firmware updates only work properly if only one Anritsu ShockLine instrument is connected.
Figure D-7. EEPROM Does Not Match Warning Message
Figure D-8. Upgrading EEPROM (Firmware) Message
Figure D-9. Firmware Update Unsuccessful Message
D-7 Updating EEPROM Unsuccessful (Firmware Update Failed) Troubleshooting
D-6 PN: 10410-00340 Rev: T MS46122A/B OM
If, after the firmware update has completed, the trace display is completely flat and remains so after a reset, or if the firmware update fails (see Figure D-9) and the trace display is completely flat, proceed to the trouble-shooting tip: “Traces Flat, No Sweeping”.
D-7 Updating EEPROM Unsuccessful (Firmware Update Failed)If the firmware update fails (see Figure D-9), but the trace display is active, either:
• Exit ShockLine, disconnect all USB devices but keyboard/mouse and Anritsu ShockLine instrument, then try again.
• Make sure the user is running ShockLine as Administrator.
or
• Try to update the firmware manually (see the trouble-shooting tip “Updating Firmware Manually”).
D-8 Updating Firmware ManuallyIf the firmware update fails repeatedly, perform the following steps:
1. Launch ShockLine as Administrator.
2. Click No if prompted to update firmware on startup.
3. Navigate to UTILITIES > System.
4. Click Update FPGA (if ShockLine is not run as Administrator, this button will be disabled).
5. Navigate to C:\Program Files (x86)\Anritsu Company\ShockLine\Application\Firmware in the Updating Firmware dialog.
6. Select the folder that matches the attached instrument. Use the MS46322A/B folders for MS46122A/B.
7. Load the .fpga file from the selected folder.
8. Follow the prompts (may require closing the ShockLine application and/or rebooting).
Note Firmware updates only work properly if only one Anritsu ShockLine instrument is connected.
Caution Updating the firmware manually could result in an inoperable instrument, requiring assistance from Anritsu Customer Service.
Caution Attempting to load firmware for a non-matching instrument can render the instrument inoperable, and require a call to Anritsu Customer Service to get it working again.
CautionIf done incorrectly, manually updating the firmware can result in an inoperable instrument that will require help from Anritsu to get working again. Contact Anritsu Customer Service at:https://www.anritsu.com/test-measurement/contact-us
Troubleshooting D-9 Traces Flat, No Sweeping
MS46122A/B OM PN: 10410-00340 Rev: T D-7
D-9 Traces Flat, No SweepingIf, after a firmware update has completed, the port indicator is static and the trace display is completely flat and remains so after a preset, or if the firmware update fails (see Figure D-9) and the trace display is completely flat, perform the following steps:
1. Uninstall ShockLine software.
2. Uninstall IVI Shared Components software, if present.
3. Reboot the computer.
4. Re-install ShockLine software.
The MS46122A/B will successfully connect to ShockLine software and sweep without issue.
D-10 Text Size Too Large
1. Exit the ShockLine application.
2. Navigate to where the ShockLine executable is located:
a. Right click on the ShockLine application icon on the desktop.
b. Select Open file location (C:\Program Files (x86)\Anritsu Company\ShockLine \Application).
3. Right-click on AC_GUI_Main.exe and select Properties.4. Navigate to the Compatibility tab. Depending on your Windows version, this tab may vary.
Note What is displayed on different versions of Windows may vary.

D-10 Text Size Too Large Troubleshooting
D-8 PN: 10410-00340 Rev: T MS46122A/B OM
a. For Windows 7, the Compatibility tab looks like this. Uncheck Disable display scaling on high DPI settings:
Figure D-10. Compatibility Tab: Windows 7 and Windows 10 version 1607 and prior
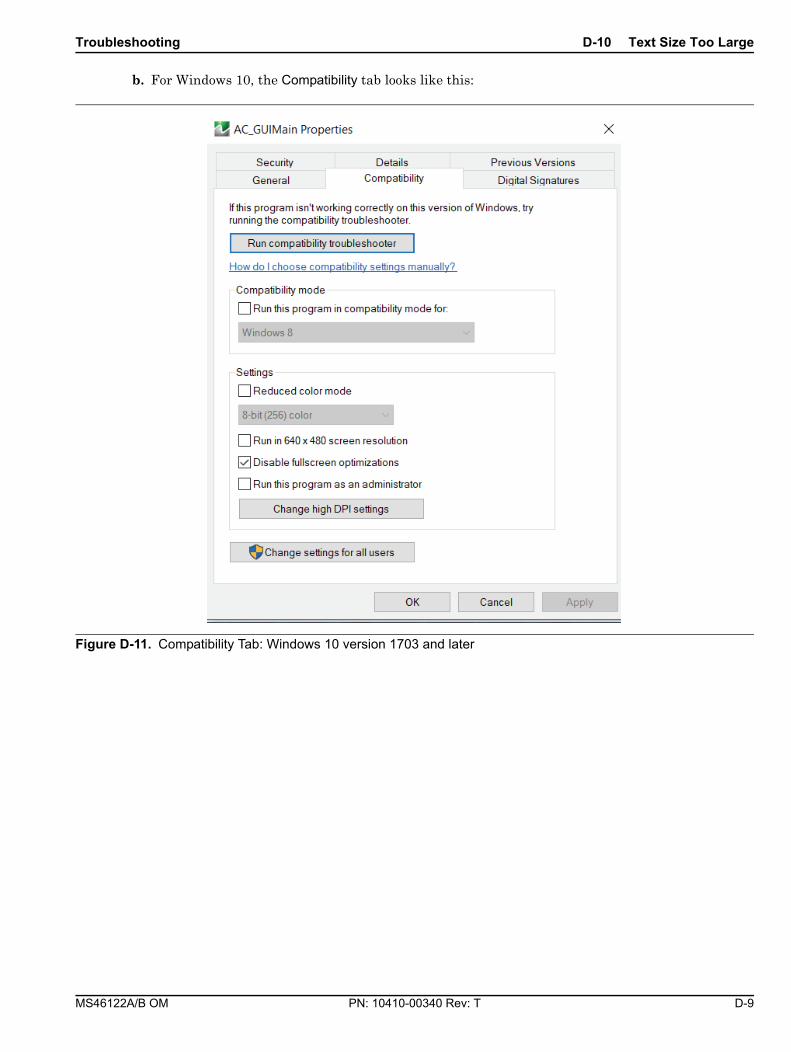
Troubleshooting D-10 Text Size Too Large
MS46122A/B OM PN: 10410-00340 Rev: T D-9
b. For Windows 10, the Compatibility tab looks like this:
Figure D-11. Compatibility Tab: Windows 10 version 1703 and later

D-10 Text Size Too Large Troubleshooting
D-10 PN: 10410-00340 Rev: T MS46122A/B OM
i. Click Change high DPI settings, which will display the following dialog:
ii. Select Use this setting to fix scaling problems for this program instead of the one in Settings.
iii.For Use the DPI that’s set for my main display when, select I open this program.
iv. Select Override high DPI scaling behavior. Scaling performed by Application.
Figure D-12. Change High DPI Settings Dialog

Troubleshooting D-11 Printout Does Not Capture the Entire ShockLine Screen
MS46122A/B OM PN: 10410-00340 Rev: T D-11
D-11 Printout Does Not Capture the Entire ShockLine Screen
If the printout does not capture the entire screen, perform the following steps:
1. Set the Windows Settings > System > Display > Scale and Layout to 100%.
Scaling Too Large Scaling 100%
Figure D-13. Windows System Display Settings: Scale and Layout
Figure D-14. Windows System Display Settings: Scale and Layout

D-12 Running ShockLine as Non-administrator Troubleshooting
D-12 PN: 10410-00340 Rev: T MS46122A/B OM
D-12 Running ShockLine as Non-administrator1. Right-click on the ShockLine Icon.
2. Select Properties from the drop-down menu.
3. Go to the Shortcut tab.
4. Click the Advanced button.
5. Un-click “Run as administrator”
Figure D-15. Setting ShockLine to Run as Non-Administrator

MS46122A/B OM PN: 10410-00340 Rev: T Index-1
Subject IndexAAirflow . . . . . . . . . . . . . . . . . . . . . . . . . . . . . . . . . . 3-1Altitude, operating . . . . . . . . . . . . . . . . . . . . . . . . 3-1Anritsu Hardware is Unavailable message . . . .D-3Anritsu Programmed USB message . . . . . . . . . .D-2APPLICATION Drop-Down Menu . . . . . . . . . . 4-12Application Icon . . . . . . . . . . . . . . . . . . . . . . . . . 4-18Auto-Return Button Group . . . . . . . . . . . . . . . . 4-32Average Icon . . . . . . . . . . . . . . . . . . . . . . . . . . . . 4-18
BBack Button . . . . . . . . . . . . . . . . . . . . . . . . . . . . 4-29Button Selection Icon . . . . . . . . . . . . . . . . 4-32, 4-33
CCALIBRATION Drop-Down Menu . . . . . . . . . . 4-12Calibration Icon . . . . . . . . . . . . . . . . . . . . . . . . . 4-18Calibration Kits . . . . . . . . . . . . . . . . . . . . . . . . . . 1-2Ch->Max Icon . . . . . . . . . . . . . . . . . . . . . . . . . . . 4-18Ch->Next Icon . . . . . . . . . . . . . . . . . . . . . . . . . . . 4-19Ch->Prev Icon . . . . . . . . . . . . . . . . . . . . . . . . . . . 4-19CHANNEL Drop-Down Menu . . . . . . . . . . . . . . 4-10Channel Icon . . . . . . . . . . . . . . . . . . . . . . . . . . . . 4-18Completion Checkmark Button . . . . . . . . . . . . . 4-33Complex Impedance . . . . . . . . . . . . . . . . . . . . . . 4-40Connectors . . . . . . . . . . . . . . . . . . . . . . . . . . . . . . 2-1Continue Icon . . . . . . . . . . . . . . . . . . . . . . . . . . . 4-18Cooling, during operation . . . . . . . . . . . . . . . . . . . 3-1Custom Icon 1 . . . . . . . . . . . . . . . . . . . . . . . . . . . 4-19Custom Icon 2 . . . . . . . . . . . . . . . . . . . . . . . . . . . 4-19Custom Icon 3 . . . . . . . . . . . . . . . . . . . . . . . . . . . 4-19Custom Icon 4 . . . . . . . . . . . . . . . . . . . . . . . . . . . 4-19Custom Icon 5 . . . . . . . . . . . . . . . . . . . . . . . . . . . 4-19
DDialog Boxes . . . . . . . . . . . . . . . . . . . . . . . . . . . . 4-34Dimensions . . . . . . . . . . . . . . . . . . . . . . . . . . . . . .B-3Display Areas . . . . . . . . . . . . . . . . . . . . . . . . . . . . 4-2Display Icon . . . . . . . . . . . . . . . . . . . . . . . . . . . . 4-20
EEEPROM, updating . . . . . . . . . . . . . . . . . . . . . . .D-5Environment
operating conditions . . . . . . . . . . . . . . . . . . . . 3-1power requirements . . . . . . . . . . . . . . . . . . . . 3-1storage . . . . . . . . . . . . . . . . . . . . . . . . . . . . . .B-3
Error 1101 while initializing client message . . .D-4Error message
Anritsu Hardware is Unavailable . . . . . . . . .D-3Anritsu Programmed USB . . . . . . . . . . . . . .D-2Error 1101 while initializing client message D-4
No Hardware Detected . . . . . . . . . . . . . 3-6, D-1External Devices . . . . . . . . . . . . . . . . . . . . . . . . . 3-4
FFILE Drop-Down Menu . . . . . . . . . . . . . . . . . . . . 4-7File Icon . . . . . . . . . . . . . . . . . . . . . . . . . . . . . . . 4-20Firmware, updating . . . . . . . . . . . . . . . . . . . . . . .D-5Freq Icon . . . . . . . . . . . . . . . . . . . . . . . . . . . . . . . 4-20Front Panel . . . . . . . . . . . . . . . . . . . . . . . . . . . . . . 2-1
GGroup Delay . . . . . . . . . . . . . . . . . . . . . . . 4-40, 4-43Group Delay Graphs . . . . . . . . . . . . . . . . . . . . . 4-49
HHELP Drop-Down Menu . . . . . . . . . . . . . . . . . . 4-15Hold Icon . . . . . . . . . . . . . . . . . . . . . . . . . . . . . . . 4-20Home Button . . . . . . . . . . . . . . . . . . . . . . . . . . . 4-29Humidity, operating . . . . . . . . . . . . . . . . . . . . . . . 3-1
IIcon Toolbar . . . . . . . . . . . . . . . . . . . . . . . . . . . . 4-17Icon Toolbar Functions . . . . . . . . . . . . . . . . . . . 4-17Imaginary . . . . . . . . . . . . . . . . . . . . . . . . . . . . . . 4-41Impedance . . . . . . . . . . . . . . . . . . . . . . . . . . . . . 4-41Initial Inspection . . . . . . . . . . . . . . . . . . . . . . . . . 3-1Inspection . . . . . . . . . . . . . . . . . . . . . . . . . . . . . . . 3-1Installation . . . . . . . . . . . . . . . . . . . . . . . . . . . . . . 3-1Installation category . . . . . . . . . . . . . . . . . . . . . . 3-1Installing ShockLine software . . . . . . . . . . . . . . . 3-4Instrument Status . . . . . . . . . . . . . . . . . . . . . . . 4-35Instrument Status Display Abbreviations . . . . 4-35IVI error message . . . . . . . . . . . . . . . . . . . . . . . . .D-4
LLaunching ShockLine software . . . . . . . . . . . . . . 3-5Limit Lines . . . . . . . . . . . . . . . . . . . . . . . . . . . . . 4-53Linear Mag . . . . . . . . . . . . . . . . . . . . . . . . . . . . . 4-41Linear Magnitude and Phase . . . . . . . . . . . . . . 4-42Log Mag . . . . . . . . . . . . . . . . . . . . . . . . . . . . . . . 4-41Log Magnitude and Phase . . . . . . . . . . . . . . . . . 4-41Log Polar . . . . . . . . . . . . . . . . . . . . . . . . . . . . . . . 4-42
MMAIN Drop-Down Menu . . . . . . . . . . . . . . . . . . . 4-9Main Screen . . . . . . . . . . . . . . . . . . . . . . . . . . . . . 4-1Marker Icon . . . . . . . . . . . . . . . . . . . . . . . . . . . . 4-21Marker-> Pk Rt Icon . . . . . . . . . . . . . . . . . . . . . 4-21Marker->Max Icon . . . . . . . . . . . . . . . . . . . . . . . 4-20Marker->Min Icon . . . . . . . . . . . . . . . . . . . . . . . 4-20Marker->Off . . . . . . . . . . . . . . . . . . . . . . . . . . . . 4-21

Index-2 PN: 10410-00340 Rev: T MS46122A/B OM
Marker->Peak Icon . . . . . . . . . . . . . . . . . . . . . . . 4-21Marker->Pk Lft Icon . . . . . . . . . . . . . . . . . . . . . . 4-21MEASUREMENT Drop-Down Menu . . . . . . . . 4-12Measurement Icon . . . . . . . . . . . . . . . . . . . . . . . 4-21Menu Bar . . . . . . . . . . . . . . . . . . . . . . . . . . . . . . . 4-6Menu Bar Drop-Down Menus . . . . . . . . . . . . . . . 4-7Menu Navigation Buttons . . . . . . . . . . . . . . . . . 4-29Modes
operate . . . . . . . . . . . . . . . . . . . . . . . . . . . . . . 3-3simulation . . . . . . . . . . . . . . . . . . . . . . . . . . . . 3-6standby . . . . . . . . . . . . . . . . . . . . . . . . . . . . . . 3-2
NNext Button . . . . . . . . . . . . . . . . . . . . . . . . . . . . . 4-29No Hardware Detected message . . . . . . . . . 3-6, D-1
OOperate Mode . . . . . . . . . . . . . . . . . . . . . . . . . . . . 3-3Operating conditions
airflow . . . . . . . . . . . . . . . . . . . . . . . . . . . . . . . 3-1altitude . . . . . . . . . . . . . . . . . . . . . . . . . . . . . . 3-1cooling . . . . . . . . . . . . . . . . . . . . . . . . . . . . . . . 3-1environment . . . . . . . . . . . . . . . . . . . . . . . . . . 3-1humidity . . . . . . . . . . . . . . . . . . . . . . . . . . . . . 3-1installation category . . . . . . . . . . . . . . . . . . . 3-1phase of power supply . . . . . . . . . . . . . . . . . . 3-1power requirements . . . . . . . . . . . . . . . . . . . . 3-1temperature . . . . . . . . . . . . . . . . . . . . . . . . . . 3-1warm-up time . . . . . . . . . . . . . . . . . . . . . . . . . 3-3
Optional Icon Toolbar Functions . . . . . . . . . . . . 4-18Options . . . . . . . . . . . . . . . . . . . . . . . . . . . . . . . . . 1-1
PPhase . . . . . . . . . . . . . . . . . . . . . . . . . . . . . . . . . . 4-41Phase and Magnitude . . . . . . . . . . . . . . . . . . . . . 4-40Phase of power supply . . . . . . . . . . . . . . . . . . . . . 3-1Polar Graphs . . . . . . . . . . . . . . . . . . . . . . . . . . . . 4-48Power Icon . . . . . . . . . . . . . . . . . . . . . . . . . . . . . . 4-21Power Requirements . . . . . . . . . . . . . . . . . . . . . . 3-1Power supply voltage . . . . . . . . . . . . . . . . . . . . . . 3-1Power-off procedure . . . . . . . . . . . . . . . . . . . . . . . 3-3Power-On/Power-Off Procedure . . . . . . . . . . . . . . 3-2Preparation for Use . . . . . . . . . . . . . . . . . . . . . . . 3-1Preset Icon . . . . . . . . . . . . . . . . . . . . . . . . . . . . . . 4-21Previous . . . . . . . . . . . . . . . . . . . . . . . . . . . . . . . . . 1-3Print Icon . . . . . . . . . . . . . . . . . . . . . . . . . . . . . . 4-22
RReal . . . . . . . . . . . . . . . . . . . . . . . . . . . . . . . . . . . 4-41Real and Imaginary . . . . . . . . . . . . . . . . . 4-40, 4-42Rear Panel Ports and Connectors . . . . . . . . . . . . 2-2
Rectilinear Paired Graphs . . . . . . . . . . . . . . . . . 4-46Rectilinear Single Graph . . . . . . . . . . . . . . . . . . 4-46Reference Lines . . . . . . . . . . . . . . . . . . . . 4-50, 4-51Reference Position . . . . . . . . . . . . . . . . . . . . . . . 4-50Response Icon . . . . . . . . . . . . . . . . . . . . . . . . . . . 4-22Running ShockLine software . . . . . . . . . . . . . . . . 3-5
SScale Icon . . . . . . . . . . . . . . . . . . . . . . . . . . . . . . 4-22Shipment . . . . . . . . . . . . . . . . . . . . . . . . . . . . . . . . B-3Shipping instrument . . . . . . . . . . . . . . . . . . . . . .B-3ShockLine software
installing . . . . . . . . . . . . . . . . . . . . . . . . . . . . 3-4running . . . . . . . . . . . . . . . . . . . . . . . . . . . . . . 3-5
Simulation Mode . . . . . . . . . . . . . . . . . . . . . . . . . 3-6Smith (R + jX) . . . . . . . . . . . . . . . . . . . . . . . . . . . 4-42Smith Charts . . . . . . . . . . . . . . . . . . . . . . . . . . . 4-47Splash Screen . . . . . . . . . . . . . . . . . . . . . . . . . . . . 3-3Standby Mode . . . . . . . . . . . . . . . . . . . . . . . . . . . . 3-2Startup Splash Screen . . . . . . . . . . . . . . . . . . . . . 3-3Storage . . . . . . . . . . . . . . . . . . . . . . . . . . . . . . . . .B-3Storage environment . . . . . . . . . . . . . . . . . . . . . .B-3Sweep Icon . . . . . . . . . . . . . . . . . . . . . . . . . . . . . 4-22SWR . . . . . . . . . . . . . . . . . . . . . . . . . . . . . . . . . . 4-41System Icon . . . . . . . . . . . . . . . . . . . . . . . . . . . . . 4-22
TTemperature, operating . . . . . . . . . . . . . . . . . . . . 3-1Time, warm-up . . . . . . . . . . . . . . . . . . . . . . . . . . . 3-3Toolbar . . . . . . . . . . . . . . . . . . . . . . . . . . . . . . . . 4-31Tr->Max Icon . . . . . . . . . . . . . . . . . . . . . . . . . . . 4-22Tr->Next Icon . . . . . . . . . . . . . . . . . . . . . . . . . . . 4-23TRACE Drop-Down Menu . . . . . . . . . . . . . . . . . 4-11Trace Icon . . . . . . . . . . . . . . . . . . . . . . . . . . . . . . 4-22Trace Label Abbreviations . . . . . . . . . . . . . . . . . 4-44Traces . . . . . . . . . . . . . . . . . . . . . . . . . . . . . 4-4, 4-39
UUnpacking the Product . . . . . . . . . . . . . . . . . . . . 3-1Updating firmware (EEPROM) . . . . . . . . . . . . . .D-5User Input . . . . . . . . . . . . . . . . . . . . . . . . . . . . . . . 1-4User Interface Navigation . . . . . . . . . . . . . . . . . . 1-3
VVentilation . . . . . . . . . . . . . . . . . . . . . . . . . . . . . . 3-1Verification Kits . . . . . . . . . . . . . . . . . . . . . . . . . . 1-3Voltage, of power supply . . . . . . . . . . . . . . . . . . . 3-1
WWarm-up time . . . . . . . . . . . . . . . . . . . . . . . . . . . . 3-3


Anritsu utilizes recycled paper and environmentally conscious inks and toner.
Anritsu Company490 Jarvis Drive
Morgan Hill, CA 95037-2809USA
http://www.anritsu.com
Related Documents