SHIPPING MARKET REVIEW – NOVEMBER 2021

Welcome message from author
This document is posted to help you gain knowledge. Please leave a comment to let me know what you think about it! Share it to your friends and learn new things together.
Transcript

SHIPPING MARKET REVIEW – NOVEMBER 2021
1Shipping Market Review – November 2021
DISCLAIMER
The persons named as the authors of this report hereby certify that: (i) all of the views expressed in the research
report accurately reflect the personal views of the authors on the subjects; and (ii) no part of their compensation was,
is, or will be, directly or indirectly, related to the specific recommendations or views expressed in the research report.
This report has been prepared by Danish Ship Finance A/S (“DSF”).
This report is provided to you for information purposes only. Whilst every effort has been taken to make the
information contained herein as reliable as possible, DSF does not represent the information as accurate or
complete, and it should not be relied upon as such. Any opinions expressed reflect DSF’s judgment at the time this
report was prepared and are subject to change without notice. DSF will not be responsible for the consequences of
reliance upon any opinion or statement contained in this report. This report is based on information obtained from
sources which DSF believes to be reliable, but DSF does not represent or warrant such information’s accuracy,
completeness, timeliness, merchantability or fitness for a particular purpose. The information in this report is not
intended to predict actual results, and actual results may differ substantially from forecasts and estimates provided in
this report. This report may not be reproduced, in whole or in part, without the prior written permission of DSF. To
Non-Danish residents: The contents hereof are intended for the use of non-private customers and may not be issued
or passed on to any person and/or institution without the prior written consent of DSF. Additional information
regarding this publication will be furnished upon request.

2Shipping Market Review – November 2021
HEAD OF INNOVATION & RESEARCH
Christopher Rex, [email protected]
ANALYTICAL TEAM
Jonas Hoffmann, Senior Analyst
Sebastian Müllertz, Analyst
Pardeep Singh, Analyst
Lucas Andersen, Junior Analyst
Louise Legart, Junior Analyst
3Shipping Market Review – November 2021
TABLE OF CONTENTSNavigating a route to net zero, 4
Shipping Markets At A Glance, 14
Shipbuilding, 19
Container, 25
Dry Bulk, 33
Crude Tanker, 41
Product Tanker, 49
LPG Carriers, 56
4Shipping Market Review – November 2021
NAVIGATING A ROUTE TO NET ZEROEnergy efficiency first - then fuels

5Shipping Market Review – November 2021
The global economy is raising its climate ambitions towards 2050. The call to decarbonise
large parts of the economy is likely to bring significant changes to entire industries,
sectors and business landscapes.
For the shipping industry, the transition is not only about vessels transporting cargo while
emitting less CO2; it is first and foremost about changing the tectonic plates underlying
the global economy. These ambitions could reverse the demand outlooks for entire vessel
segments. Think along the lines of renewable energy working to substitute oil, coal and
gas towards 2030 and 2050. This will clearly not happen overnight, but we could soon
begin to see some adverse industry dynamics gaining pace and increasingly shaping
earning outlooks.
Navigating the changing tides will not be easy. The energy transition will be a global
balancing act. Periods of great volatility in vessel demand are likely to become more
frequent. We have identified two key factors to monitor outside the shipping industry: the
regional adoption of renewable energy and relocation of basic materials industries (for
example, solar-powered smelters turning bauxite into green aluminium, co-locating steel
production with iron ore in areas with abundant renewable energy). These factors signal
not only important changes in trading routes for some segments but equally importantly
the erosion of virgin material flows.
The production of alternative fuels (i.e. zero-carbon) is currently low. However, the
production of hydrogen and hydrogen-based fuels is likely to scale up when renewable
energy sources become dominant suppliers of energy in a region, since the need to
balance the grid for long-duration seasonal conditions or unexpected renewable droughts
will increase. Still, in most places the shift in balance towards renewable energy sources
is some years into the future. We may not begin to see a utility-scale production of
hydrogen or hydrogen-based fuels until the 2030s, although small-scale local production
is likely to appear in the meantime.
The shipping industry is flirting with a scenario where not all vessels transition to the
same future fuel. However, an industry guided by fragmented decarbonisation strategies
may see not only increased costs but reduced attractiveness of vessels as an asset class
for both equity investors and debt providers. This will be particularly the case until the
industry finds a way to improve the balance between the energy density of hydrogen-
based fuels and the energy needs of deep-sea vessels.
The first steps towards vessel decarbonisation are about energy efficiency. It is generally
accepted throughout the industry that there are a wide range of potential energy
efficiency improvements that can be implemented. But the abatement potential has been
difficult to implement on account of split incentives among stakeholders: for instance,
customers taking on the risk of delays while shipowners benefit from lower fuel costs
(spot market), or shipowners being required to invest while customers reap many of the
fuel benefits (timecharter).
Navigating a pathway to zero-carbon shipping may entail significant business model
innovation (e.g. servitisation) to align incentives and ensure long-term collaboration
between stakeholders, including shipyards and OEMS.
PERSPECTIVES AND KEY TAKEAWAYSThe need to address climate change faster is also making business model innovation increasingly necessary
Addressing climate change requires a wide variety of innovations. The shipping industry will play its part, but the industry may look
radically different by the time the global economy has decarbonised. We will still need ships, but seaborne demand volumes could be
substantially lower and the composition of world trade could be significantly changed. The transformation will not be propelled by
new fuels but by leadership in energy efficiency. New fuels will be introduced, but they may not play first fiddle.
6Shipping Market Review – November 2021
The shipping industry transports nearly 80% of global cargo volumes while emitting 3%
of global emissions. Ships remain by far the most energy-efficient form of freight
transport, producing 20 to 25 grams of CO2 per tonne-kilometre, compared to up to 600
grams for aviation and between 50 and 150 grams for road-based transportation.
Seaborne trade volumes have historically expanded alongside the world economy. This
could be about to change with the global push for decarbonisation. Transportation of
fossil fuels currently accounts for almost 40% of seaborne trade volumes. These volumes
are increasingly likely to wane towards 2050 as the global economy decarbonises. This is
not to say that they will disappear imminently, but cargo volumes could shrink in large
volumes when new renewable energy installations come online.
There is no doubt that a major shift is underway in global energy markets, with the pace
and scale of the energy transition now outstripping even the most optimistic projections.
In 2020, renewable energy provided 90% of the world’s new electric power-generating
capacity and produced almost a third of the world’s electricity. This trend is only expected
to accelerate towards 2050.
The decarbonisation of the global economy reaches beyond the energy sector. Many of
the world’s biggest industries and sectors have adopted targets for net zero emissions by
2050. McKinsey (August 2021) estimates that as much as 65% of global GDP,
representing 40% of the global population, is now under a 2050 net zero commitment.
The call to decarbonise close to two-thirds of the global economy is likely to bring
significant changes to entire industries, sectors and business landscapes. It will create
second- and third-order effects that generate a host of extraordinary emergent benefits
and opportunities that cascade throughout the economy. But it may also destroy value,
redefine markets and alter global trade.
The shipping industry is a service provider to the industries and sectors of the global
economy. As these sectors – including the hard-to-abate sectors like steel, aluminium,
cement, plastics and aviation – work to cut carbon emissions, their products, spare parts
and services could take new forms, be used more sparingly, and be made in new ways, in
unexpected places and under novel business models (e.g. servitisation).
We are approaching a period of great change that will have a significant impact on costs,
asset values and earnings capacity. The reallocation of capital is expected to be massive.
The redistribution of cargo volumes, trade flows and parcel sizes will introduce changes at
scale. For some players, this will present a great business opportunity, while others will
see their markets shrink.
Many industry observers seem to be focusing mostly on the fuel challenge. There is
frequent discussion of how to transition towards fuels that are more costly, complex and
less efficient. These are valid topics, about which there are still unanswered questions,
but addressing them in isolation will not help establish a clear pathway to the future.
Industry players may need to navigate the decarbonisation journey facing declining
freight volumes and higher costs. Experience from previous disruptions indicates that
markets could be significantly changed by the mid-2030s. The ownership landscape could
become more consolidated and new business models are likely to mature.
RAISING AMBITIONS WHILE GEARING UP FOR BIG CHANGESThe global coalition for net zero emissions is growing
The shipping industry is working hard to set out a path to decarbonisation. Visibility is currently low, but the ambition is clear.
Pressure to reduce shipping's environmental footprint has increased sharply and continues to grow. Public and private actors are
driving decarbonisation efforts through various initiatives and mechanisms. Industry players may need to navigate the
decarbonisation journey facing declining freight volumes and higher costs. Complexity is on the rise.
7Shipping Market Review – November 2021
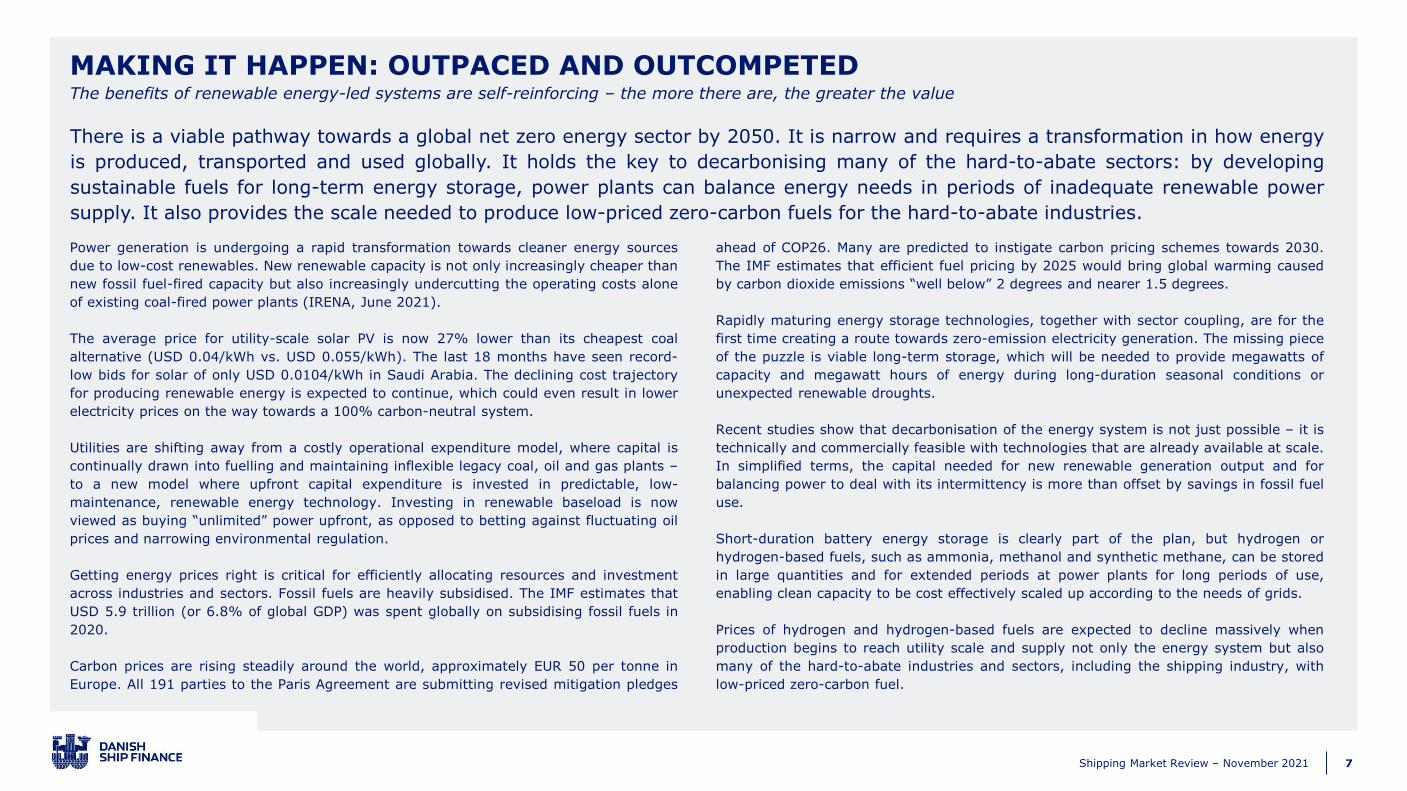
Power generation is undergoing a rapid transformation towards cleaner energy sources
due to low-cost renewables. New renewable capacity is not only increasingly cheaper than
new fossil fuel-fired capacity but also increasingly undercutting the operating costs alone
of existing coal-fired power plants (IRENA, June 2021).
The average price for utility-scale solar PV is now 27% lower than its cheapest coal
alternative (USD 0.04/kWh vs. USD 0.055/kWh). The last 18 months have seen record-
low bids for solar of only USD 0.0104/kWh in Saudi Arabia. The declining cost trajectory
for producing renewable energy is expected to continue, which could even result in lower
electricity prices on the way towards a 100% carbon-neutral system.
Utilities are shifting away from a costly operational expenditure model, where capital is
continually drawn into fuelling and maintaining inflexible legacy coal, oil and gas plants –
to a new model where upfront capital expenditure is invested in predictable, low-
maintenance, renewable energy technology. Investing in renewable baseload is now
viewed as buying “unlimited” power upfront, as opposed to betting against fluctuating oil
prices and narrowing environmental regulation.
Getting energy prices right is critical for efficiently allocating resources and investment
across industries and sectors. Fossil fuels are heavily subsidised. The IMF estimates that
USD 5.9 trillion (or 6.8% of global GDP) was spent globally on subsidising fossil fuels in
2020.
Carbon prices are rising steadily around the world, approximately EUR 50 per tonne in
Europe. All 191 parties to the Paris Agreement are submitting revised mitigation pledges
ahead of COP26. Many are predicted to instigate carbon pricing schemes towards 2030.
The IMF estimates that efficient fuel pricing by 2025 would bring global warming caused
by carbon dioxide emissions “well below” 2 degrees and nearer 1.5 degrees.
Rapidly maturing energy storage technologies, together with sector coupling, are for the
first time creating a route towards zero-emission electricity generation. The missing piece
of the puzzle is viable long-term storage, which will be needed to provide megawatts of
capacity and megawatt hours of energy during long-duration seasonal conditions or
unexpected renewable droughts.
Recent studies show that decarbonisation of the energy system is not just possible – it is
technically and commercially feasible with technologies that are already available at scale.
In simplified terms, the capital needed for new renewable generation output and for
balancing power to deal with its intermittency is more than offset by savings in fossil fuel
use.
Short-duration battery energy storage is clearly part of the plan, but hydrogen or
hydrogen-based fuels, such as ammonia, methanol and synthetic methane, can be stored
in large quantities and for extended periods at power plants for long periods of use,
enabling clean capacity to be cost effectively scaled up according to the needs of grids.
Prices of hydrogen and hydrogen-based fuels are expected to decline massively when
production begins to reach utility scale and supply not only the energy system but also
many of the hard-to-abate industries and sectors, including the shipping industry, with
low-priced zero-carbon fuel.
MAKING IT HAPPEN: OUTPACED AND OUTCOMPETEDThe benefits of renewable energy-led systems are self-reinforcing – the more there are, the greater the value
There is a viable pathway towards a global net zero energy sector by 2050. It is narrow and requires a transformation in how energy
is produced, transported and used globally. It holds the key to decarbonising many of the hard-to-abate sectors: by developing
sustainable fuels for long-term energy storage, power plants can balance energy needs in periods of inadequate renewable power
supply. It also provides the scale needed to produce low-priced zero-carbon fuels for the hard-to-abate industries.

8Shipping Market Review – November 2021
The decarbonisation of the global power sector is being driven by lower renewable energy
costs. Cheaper renewable energy is paving the way for low-priced hydrogen and
hydrogen-based fuels that will allow heavy transportation (i.e. big trucks, ships,
airplanes, trains and buses) and industrial heat – the thermal energy needed to make
steel, cement and other basic materials – to decarbonise towards the middle of the
century. The impact on seaborne trade from decarbonising industrial heat could be
radical.
Basic materials industries may relocate when industrial heat has been decarbonised.
Think of how the United Arab Emirates’ solar-powered smelter has turned parts of
Guinean bauxite into green aluminium for the German car industry. The low price of the
energy has determined the smelter location. Renewable electricity can efficiently deliver
any desired temperature directly or via infrared, microwaves, plasmas or hydrogen.
In today's markets, ore is often transported long distance by Dry Bulk carriers. Australia
and Brazil, for example, ship iron ore to Chinese coal-fired blast furnaces, which make
half the world’s steel. Such dirty process heat is likely to give way to clean heat
generated by renewables — elsewhere in China or imported — or clean-heat processes
will shift abroad altogether.
Australia’s Fortescue Metals is planning to build a green steel pilot plant this year that
taps the country’s abundant sun and wind resources to produce hydrogen. It plans to
build a commercial plant in Western Australia’s Pilbara region, co-locating steel
production with iron ore and locally abundant renewable energy rather than shipping ore
to dirty steel mills far away.
A pilot will clearly not change a global industry, and not all existing manufacturing plants
will switch to renewable heat. Many will, though, over the next few decades, or will be
replaced by purpose-built plants in regions with cheap renewable electricity. The point is
that the decarbonisation of industrial heat may not only cause onshore assets to be
stranded but could also significantly change the demand outlook for vessels currently
serving coal-fired blast furnaces for steel production, coal- or gas-fired cement kilns,
ethylene plants, chemical plants and aluminium production plants.
Seaborne trade volumes are likely to shrink for some of the shipping industry’s largest
cargo categories including crude oil, oil products, coal, and natural gas towards 2050.
That could also be the case for some of the largest Container vessels, albeit for different
reasons. When the narrative for the Container market shifts from labour costs to
emissions, we may begin to see the long-awaited push towards regionalisation, with
highly automated manufacturing powered by renewable energy.
On the other hand, other seaborne commodity classes could see massive increases in
trade volumes towards 2050. Take hydrogen-based fuels as an example. BloombergNEF
predicts that green hydrogen will beat natural-gas-based hydrogen this decade and
become competitively cheap towards 2050. Other examples include recycled materials,
which may create new trades for vessels smaller than those transporting virgin materials.
If these predictions prove fairly accurate, emissions from shipping will improve not only
with the introduction of new fuels but also owing to a massive reduction in seaborne
commodity demand.
DECARBONISATION LOWERS TRADE VOLUMESAccess to low-priced renewable energy may lead entire industries to relocate
It is often the case that the economic lifetimes of existing assets are intended to largely match their remaining technical lifetimes.
For some, the reality may turn out to be very different. The price of renewable energy and its ability, when scaled sufficiently, to
decarbonise and disrupt some of the shipping industry’s largest cargo categories may bring massive changes that cause assets to be
stranded across multiple industries and sectors.

9Shipping Market Review – November 2021
Seaborne trade volumes (million tonnes)
World cargo fleet (million dwt)
1,000 2,000 3,000 4,000 5,000 6,000
900
500
400
300
200
100
Dry Bulk (45%)12,000 vessels
Crude Tanker (16%)2,100 vessels
Container (16%)5,400 vessels
Product Tanker (8%)3,100 vessels
Chemical Tanker (3%)4,000 vessels
LNG (3%)600 vessels
LPG (1%)1,500 vessels
Dry Bulk carries 45% of global seaborne volumes
Source: Danish Ship Finance
Fossil fuels account for 40% of cargo volumes
carried by sea
80% OF GLOBAL CARGO VOLUMES ARE CARRIED BY SEA
10Shipping Market Review – November 2021
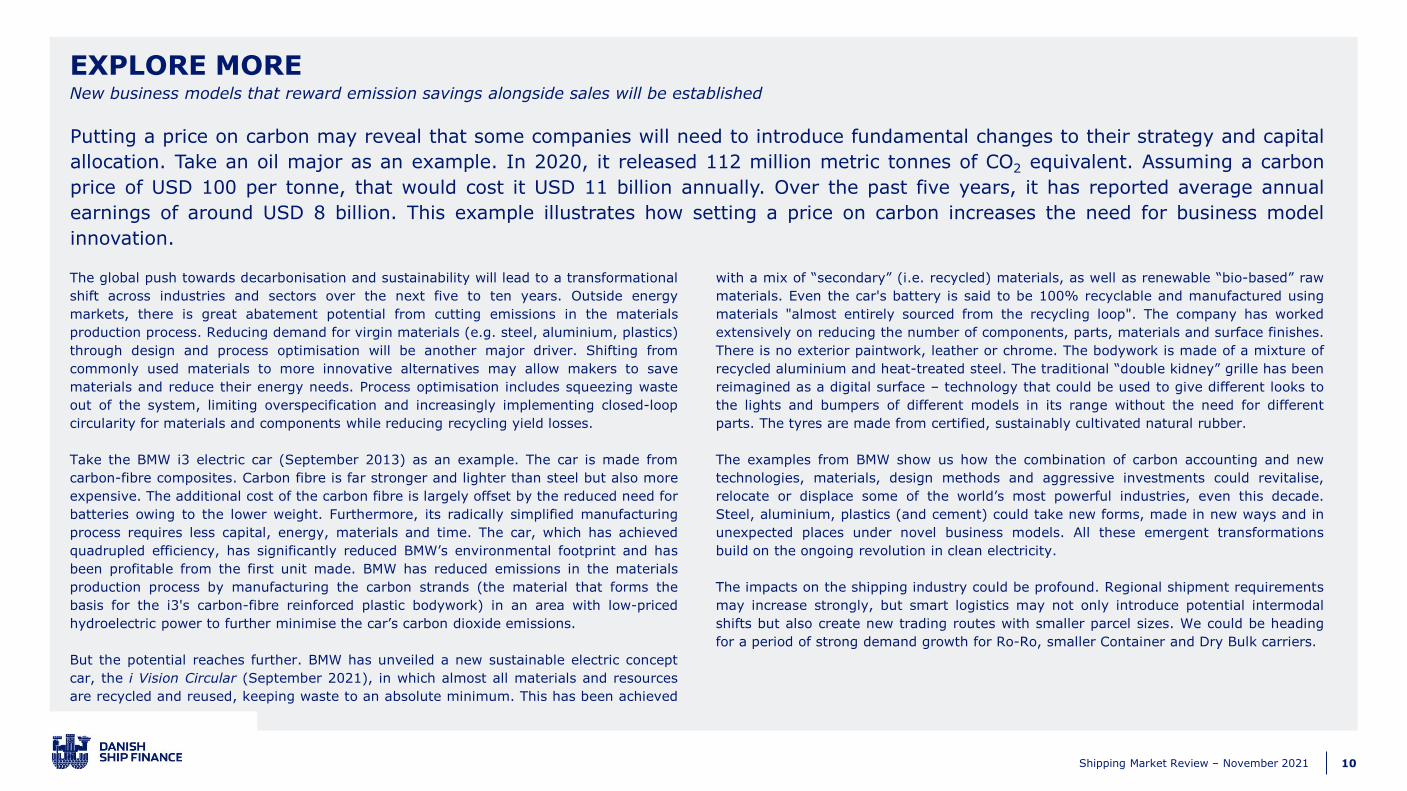
The global push towards decarbonisation and sustainability will lead to a transformational
shift across industries and sectors over the next five to ten years. Outside energy
markets, there is great abatement potential from cutting emissions in the materials
production process. Reducing demand for virgin materials (e.g. steel, aluminium, plastics)
through design and process optimisation will be another major driver. Shifting from
commonly used materials to more innovative alternatives may allow makers to save
materials and reduce their energy needs. Process optimisation includes squeezing waste
out of the system, limiting overspecification and increasingly implementing closed-loop
circularity for materials and components while reducing recycling yield losses.
Take the BMW i3 electric car (September 2013) as an example. The car is made from
carbon-fibre composites. Carbon fibre is far stronger and lighter than steel but also more
expensive. The additional cost of the carbon fibre is largely offset by the reduced need for
batteries owing to the lower weight. Furthermore, its radically simplified manufacturing
process requires less capital, energy, materials and time. The car, which has achieved
quadrupled efficiency, has significantly reduced BMW’s environmental footprint and has
been profitable from the first unit made. BMW has reduced emissions in the materials
production process by manufacturing the carbon strands (the material that forms the
basis for the i3's carbon-fibre reinforced plastic bodywork) in an area with low-priced
hydroelectric power to further minimise the car’s carbon dioxide emissions.
But the potential reaches further. BMW has unveiled a new sustainable electric concept
car, the i Vision Circular (September 2021), in which almost all materials and resources
are recycled and reused, keeping waste to an absolute minimum. This has been achieved
with a mix of “secondary” (i.e. recycled) materials, as well as renewable “bio-based” raw
materials. Even the car's battery is said to be 100% recyclable and manufactured using
materials "almost entirely sourced from the recycling loop". The company has worked
extensively on reducing the number of components, parts, materials and surface finishes.
There is no exterior paintwork, leather or chrome. The bodywork is made of a mixture of
recycled aluminium and heat-treated steel. The traditional “double kidney” grille has been
reimagined as a digital surface – technology that could be used to give different looks to
the lights and bumpers of different models in its range without the need for different
parts. The tyres are made from certified, sustainably cultivated natural rubber.
The examples from BMW show us how the combination of carbon accounting and new
technologies, materials, design methods and aggressive investments could revitalise,
relocate or displace some of the world’s most powerful industries, even this decade.
Steel, aluminium, plastics (and cement) could take new forms, made in new ways and in
unexpected places under novel business models. All these emergent transformations
build on the ongoing revolution in clean electricity.
The impacts on the shipping industry could be profound. Regional shipment requirements
may increase strongly, but smart logistics may not only introduce potential intermodal
shifts but also create new trading routes with smaller parcel sizes. We could be heading
for a period of strong demand growth for Ro-Ro, smaller Container and Dry Bulk carriers.
EXPLORE MORENew business models that reward emission savings alongside sales will be established
Putting a price on carbon may reveal that some companies will need to introduce fundamental changes to their strategy and capital
allocation. Take an oil major as an example. In 2020, it released 112 million metric tonnes of CO2 equivalent. Assuming a carbon
price of USD 100 per tonne, that would cost it USD 11 billion annually. Over the past five years, it has reported average annual
earnings of around USD 8 billion. This example illustrates how setting a price on carbon increases the need for business model
innovation.
11Shipping Market Review – November 2021
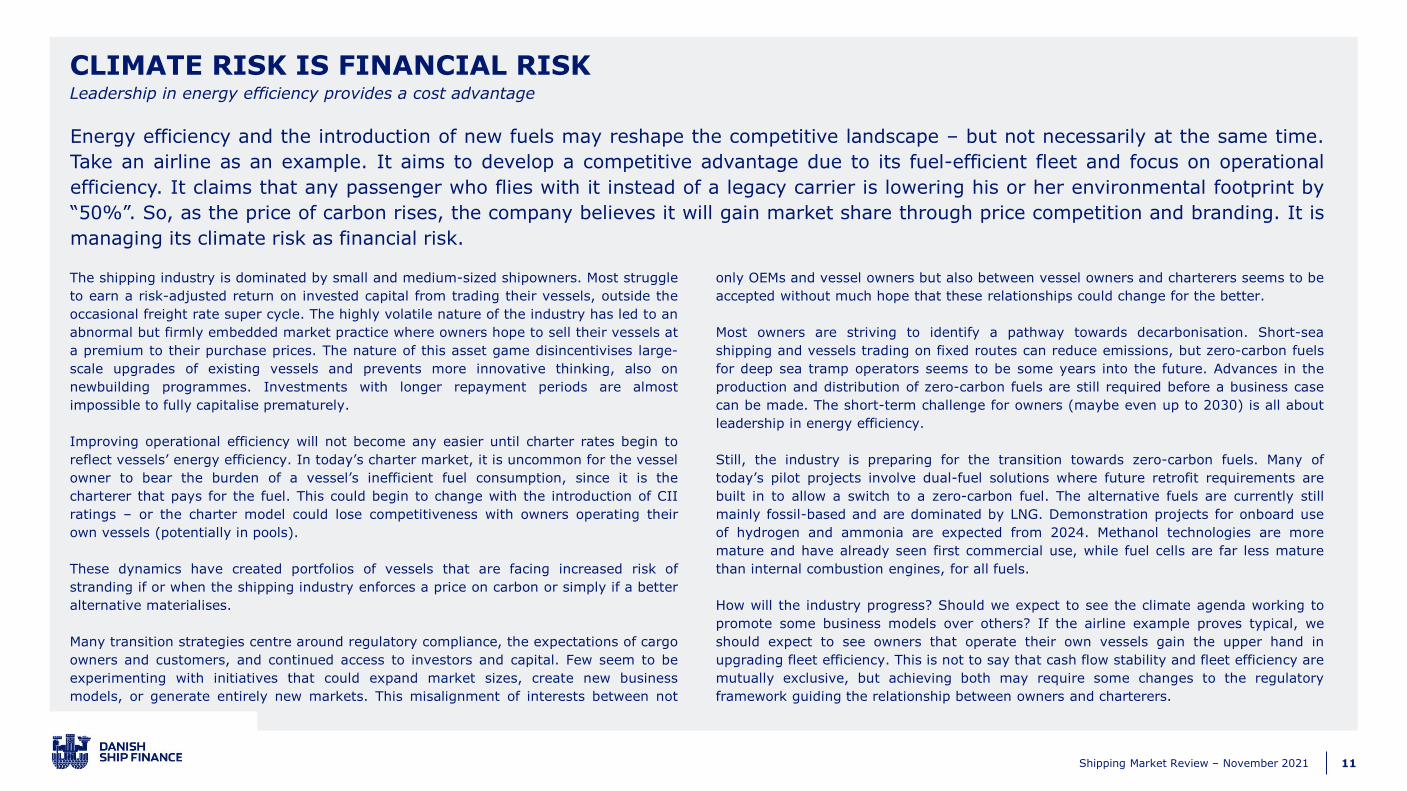
The shipping industry is dominated by small and medium-sized shipowners. Most struggle
to earn a risk-adjusted return on invested capital from trading their vessels, outside the
occasional freight rate super cycle. The highly volatile nature of the industry has led to an
abnormal but firmly embedded market practice where owners hope to sell their vessels at
a premium to their purchase prices. The nature of this asset game disincentivises large-
scale upgrades of existing vessels and prevents more innovative thinking, also on
newbuilding programmes. Investments with longer repayment periods are almost
impossible to fully capitalise prematurely.
Improving operational efficiency will not become any easier until charter rates begin to
reflect vessels’ energy efficiency. In today’s charter market, it is uncommon for the vessel
owner to bear the burden of a vessel’s inefficient fuel consumption, since it is the
charterer that pays for the fuel. This could begin to change with the introduction of CII
ratings – or the charter model could lose competitiveness with owners operating their
own vessels (potentially in pools).
These dynamics have created portfolios of vessels that are facing increased risk of
stranding if or when the shipping industry enforces a price on carbon or simply if a better
alternative materialises.
Many transition strategies centre around regulatory compliance, the expectations of cargo
owners and customers, and continued access to investors and capital. Few seem to be
experimenting with initiatives that could expand market sizes, create new business
models, or generate entirely new markets. This misalignment of interests between not
only OEMs and vessel owners but also between vessel owners and charterers seems to be
accepted without much hope that these relationships could change for the better.
Most owners are striving to identify a pathway towards decarbonisation. Short-sea
shipping and vessels trading on fixed routes can reduce emissions, but zero-carbon fuels
for deep sea tramp operators seems to be some years into the future. Advances in the
production and distribution of zero-carbon fuels are still required before a business case
can be made. The short-term challenge for owners (maybe even up to 2030) is all about
leadership in energy efficiency.
Still, the industry is preparing for the transition towards zero-carbon fuels. Many of
today’s pilot projects involve dual-fuel solutions where future retrofit requirements are
built in to allow a switch to a zero-carbon fuel. The alternative fuels are currently still
mainly fossil-based and are dominated by LNG. Demonstration projects for onboard use
of hydrogen and ammonia are expected from 2024. Methanol technologies are more
mature and have already seen first commercial use, while fuel cells are far less mature
than internal combustion engines, for all fuels.
How will the industry progress? Should we expect to see the climate agenda working to
promote some business models over others? If the airline example proves typical, we
should expect to see owners that operate their own vessels gain the upper hand in
upgrading fleet efficiency. This is not to say that cash flow stability and fleet efficiency are
mutually exclusive, but achieving both may require some changes to the regulatory
framework guiding the relationship between owners and charterers.
CLIMATE RISK IS FINANCIAL RISKLeadership in energy efficiency provides a cost advantage
Energy efficiency and the introduction of new fuels may reshape the competitive landscape – but not necessarily at the same time.
Take an airline as an example. It aims to develop a competitive advantage due to its fuel-efficient fleet and focus on operational
efficiency. It claims that any passenger who flies with it instead of a legacy carrier is lowering his or her environmental footprint by
“50%”. So, as the price of carbon rises, the company believes it will gain market share through price competition and branding. It is
managing its climate risk as financial risk.
12Shipping Market Review – November 2021
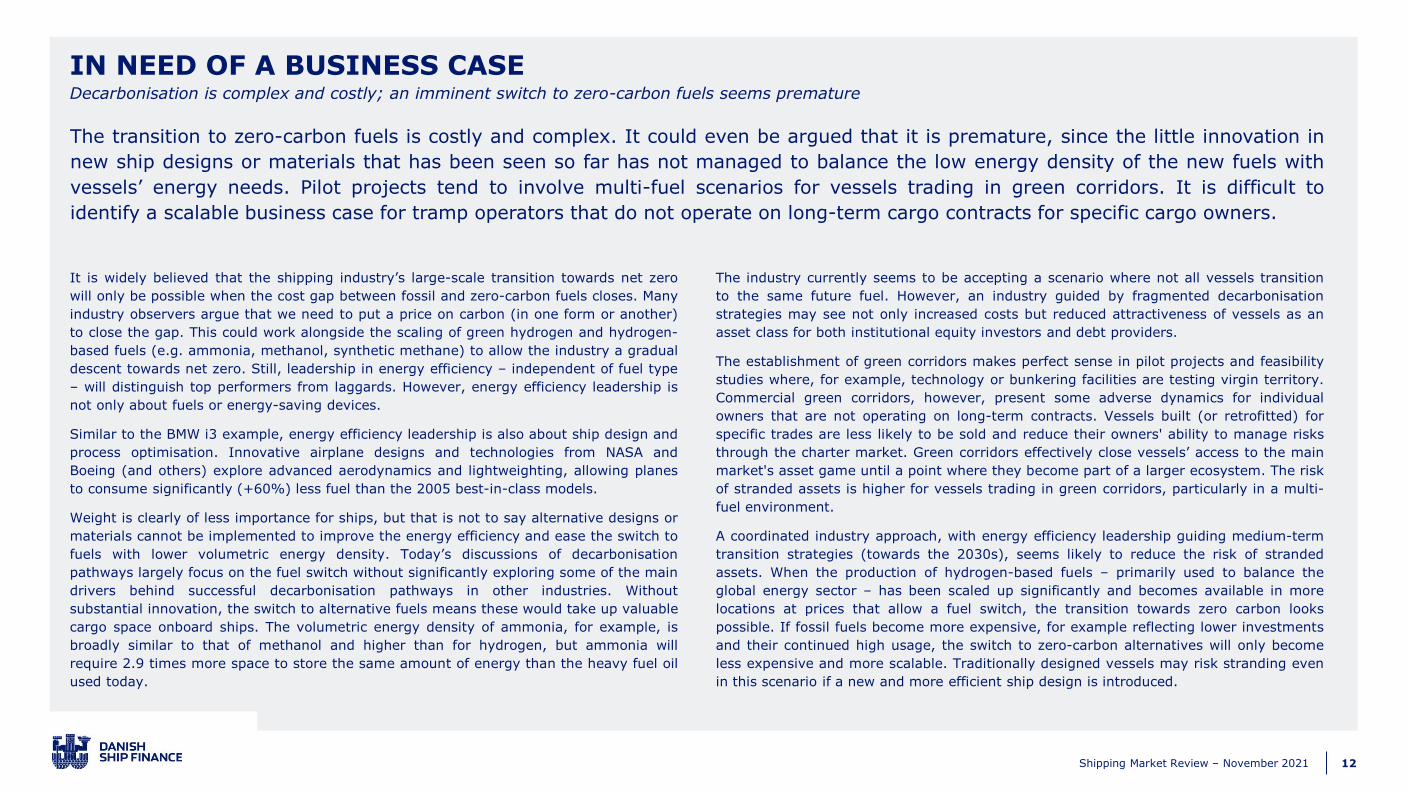
It is widely believed that the shipping industry’s large-scale transition towards net zero
will only be possible when the cost gap between fossil and zero-carbon fuels closes. Many
industry observers argue that we need to put a price on carbon (in one form or another)
to close the gap. This could work alongside the scaling of green hydrogen and hydrogen-
based fuels (e.g. ammonia, methanol, synthetic methane) to allow the industry a gradual
descent towards net zero. Still, leadership in energy efficiency – independent of fuel type
– will distinguish top performers from laggards. However, energy efficiency leadership is
not only about fuels or energy-saving devices.
Similar to the BMW i3 example, energy efficiency leadership is also about ship design and
process optimisation. Innovative airplane designs and technologies from NASA and
Boeing (and others) explore advanced aerodynamics and lightweighting, allowing planes
to consume significantly (+60%) less fuel than the 2005 best-in-class models.
Weight is clearly of less importance for ships, but that is not to say alternative designs or
materials cannot be implemented to improve the energy efficiency and ease the switch to
fuels with lower volumetric energy density. Today’s discussions of decarbonisation
pathways largely focus on the fuel switch without significantly exploring some of the main
drivers behind successful decarbonisation pathways in other industries. Without
substantial innovation, the switch to alternative fuels means these would take up valuable
cargo space onboard ships. The volumetric energy density of ammonia, for example, is
broadly similar to that of methanol and higher than for hydrogen, but ammonia will
require 2.9 times more space to store the same amount of energy than the heavy fuel oil
used today.
The industry currently seems to be accepting a scenario where not all vessels transition
to the same future fuel. However, an industry guided by fragmented decarbonisation
strategies may see not only increased costs but reduced attractiveness of vessels as an
asset class for both institutional equity investors and debt providers.
The establishment of green corridors makes perfect sense in pilot projects and feasibility
studies where, for example, technology or bunkering facilities are testing virgin territory.
Commercial green corridors, however, present some adverse dynamics for individual
owners that are not operating on long-term contracts. Vessels built (or retrofitted) for
specific trades are less likely to be sold and reduce their owners' ability to manage risks
through the charter market. Green corridors effectively close vessels’ access to the main
market's asset game until a point where they become part of a larger ecosystem. The risk
of stranded assets is higher for vessels trading in green corridors, particularly in a multi-
fuel environment.
A coordinated industry approach, with energy efficiency leadership guiding medium-term
transition strategies (towards the 2030s), seems likely to reduce the risk of stranded
assets. When the production of hydrogen-based fuels – primarily used to balance the
global energy sector – has been scaled up significantly and becomes available in more
locations at prices that allow a fuel switch, the transition towards zero carbon looks
possible. If fossil fuels become more expensive, for example reflecting lower investments
and their continued high usage, the switch to zero-carbon alternatives will only become
less expensive and more scalable. Traditionally designed vessels may risk stranding even
in this scenario if a new and more efficient ship design is introduced.
IN NEED OF A BUSINESS CASEDecarbonisation is complex and costly; an imminent switch to zero-carbon fuels seems premature
The transition to zero-carbon fuels is costly and complex. It could even be argued that it is premature, since the little innovation in
new ship designs or materials that has been seen so far has not managed to balance the low energy density of the new fuels with
vessels’ energy needs. Pilot projects tend to involve multi-fuel scenarios for vessels trading in green corridors. It is difficult to
identify a scalable business case for tramp operators that do not operate on long-term cargo contracts for specific cargo owners.
13Shipping Market Review – November 2021
The large-scale transition towards net zero by 2050 will, at some point (presumably
nearer 2030), require a full switch to zero-carbon fuels. Medium-term measures may, for
some, include blend-in of carbon-neutral fuels, while most short-term measures are
largely about increased fuel and energy efficiency.
The fragmented ownership landscape, combined with business models that currently
foster incentives with adverse consequences for emissions, increases the need for global
regulation and/or significant business model innovation. Both are likely to accelerate
changes to how value is created in the industry: from the asset game to the operation of
vessels.
There are several technical and operational measures that could improve vessel efficiency
but have yet to be implemented despite known cost advantages. It seems to be widely
accepted that individual ships could be optimised further to reduce fuel consumption by
as much as 30-50%.
Technical strategies that are independent of the propulsion system include improvements
in weight, in hull via slender design and bulbous bow, rudder and propeller design and
other propulsion improvements, as well as air lubrification and automated underwater
monitoring and maintenance. Further technical strategies for increasing energy efficiency
are closely related to conventional propulsion and auxiliary power systems. They are
focused on upgrading either through entirely new designs or retrofitting components of
existing designs.
Speed remains a key operational driver of emissions. The deployment of new
technologies and sensors combined with big data analytics and machine-learning helps
measure emissions and spark actions to reduce individual vessels’ fuel consumption. Still,
it should be noted that parts of current fleets are operating at reduced levels of
productivity (i.e. slow steaming) and that these sectors of the industry represent latent
emission increases in periods when additional demand can only be served by increased
speeds.
The abatement potential has been difficult to implement on account of split incentives
among stakeholders: for instance customers taking on the risk of delays while shipowners
benefit from lower fuel costs (spot market), or shipowners being required to invest while
customers reap much of the fuel benefits (timecharter). Incentives may need to be
aligned, or alternative business models developed, while ensuring collaboration between
stakeholders, including shipyards (and their OEM makers’ lists).
The future of ship owning could be defined by large and standardised fleets of vessels
that are offered as a premium product to the market (i.e. digital, circular and, eventually,
decarbonised) but priced as a utility. These vessels could be built and operated using
long-term servitisation models that allow regular efficiency upgrades to be implemented
without the need for additional investments from the asset owner. Cost leadership is
achieved by analysing and leveraging real-time data to increase vessel utilisation while
enabling predictive actions that introduce a new level of fuel and energy efficiency. ▪
ENERGY EFFICIENCY WILL DRIVE THE FIRST ROUND OF DECARBONISATIONShipping companies that do not proactively reduce their emissions stand to lose out
A fragmented approach to decarbonisation and fleet renewal may increase costs without bringing significant opportunities for
additional value creation from standardisation, digitalisation and business model innovation. With the introduction of servitisation
models, vessels can be improved regularly without asset owners being asked to invest in upgrades with long repayment profiles. We
need a race to the top, led by pioneering companies. This will spur all stakeholders to take bolder action.
14Shipping Market Review – November 2021
SHIPPING MARKETS AT A GLANCE
15Shipping Market Review – November 2021
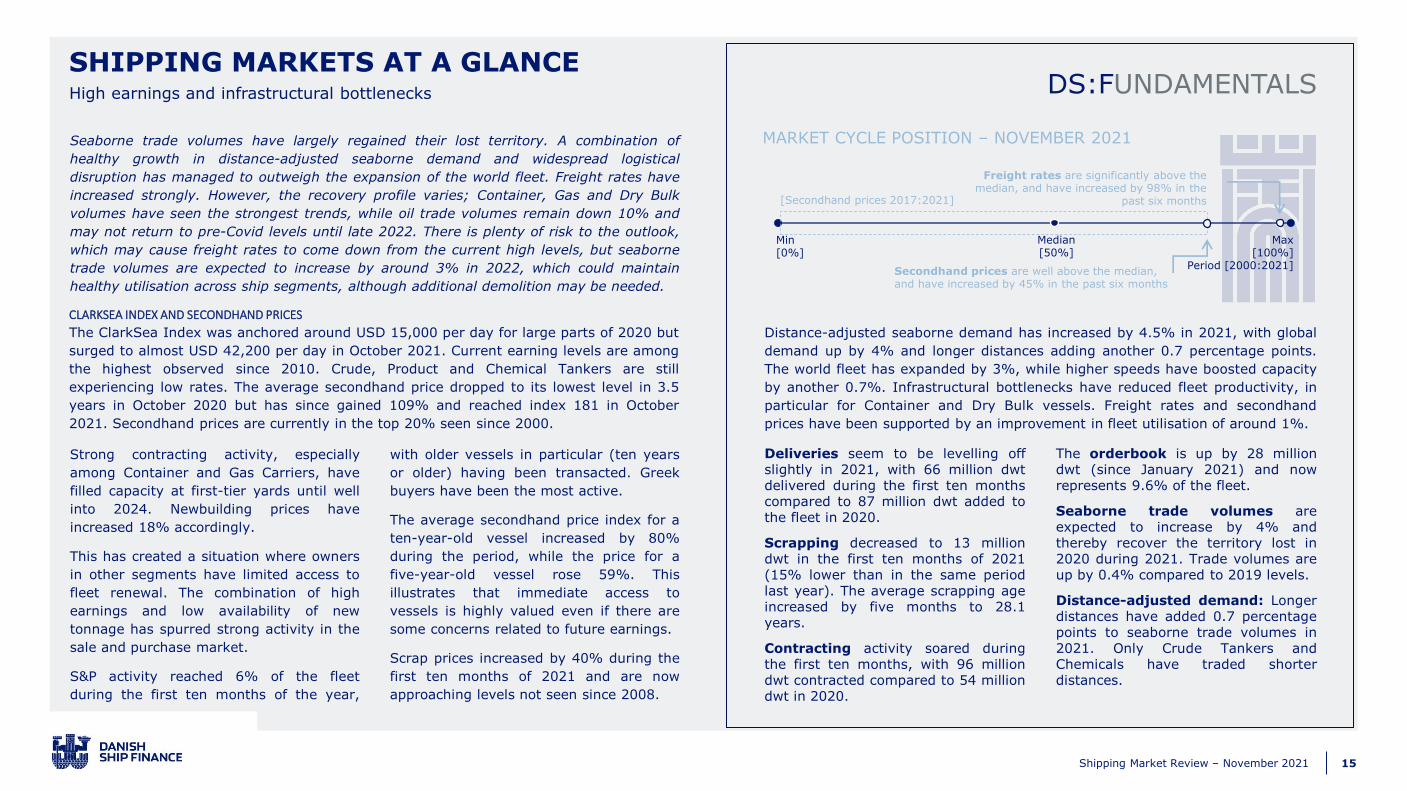
DS:FUNDAMENTALSHigh earnings and infrastructural bottlenecks
SHIPPING MARKETS AT A GLANCE
Seaborne trade volumes have largely regained their lost territory. A combination of
healthy growth in distance-adjusted seaborne demand and widespread logistical
disruption has managed to outweigh the expansion of the world fleet. Freight rates have
increased strongly. However, the recovery profile varies; Container, Gas and Dry Bulk
volumes have seen the strongest trends, while oil trade volumes remain down 10% and
may not return to pre-Covid levels until late 2022. There is plenty of risk to the outlook,
which may cause freight rates to come down from the current high levels, but seaborne
trade volumes are expected to increase by around 3% in 2022, which could maintain
healthy utilisation across ship segments, although additional demolition may be needed.
Distance-adjusted seaborne demand has increased by 4.5% in 2021, with global
demand up by 4% and longer distances adding another 0.7 percentage points.
The world fleet has expanded by 3%, while higher speeds have boosted capacity
by another 0.7%. Infrastructural bottlenecks have reduced fleet productivity, in
particular for Container and Dry Bulk vessels. Freight rates and secondhand
prices have been supported by an improvement in fleet utilisation of around 1%.
Deliveries seem to be levelling offslightly in 2021, with 66 million dwtdelivered during the first ten monthscompared to 87 million dwt added tothe fleet in 2020.
Scrapping decreased to 13 milliondwt in the first ten months of 2021(15% lower than in the same periodlast year). The average scrapping ageincreased by five months to 28.1years.
Contracting activity soared duringthe first ten months, with 96 milliondwt contracted compared to 54 milliondwt in 2020.
The orderbook is up by 28 milliondwt (since January 2021) and nowrepresents 9.6% of the fleet.
Seaborne trade volumes areexpected to increase by 4% andthereby recover the territory lost in2020 during 2021. Trade volumes areup by 0.4% compared to 2019 levels.
Distance-adjusted demand: Longerdistances have added 0.7 percentagepoints to seaborne trade volumes in2021. Only Crude Tankers andChemicals have traded shorterdistances.
Min[0%]
Max[100%]
Period [2000:2021]
Median[50%]
MARKET CYCLE POSITION – NOVEMBER 2021
CLARKSEA INDEX AND SECONDHAND PRICES
The ClarkSea Index was anchored around USD 15,000 per day for large parts of 2020 but
surged to almost USD 42,200 per day in October 2021. Current earning levels are among
the highest observed since 2010. Crude, Product and Chemical Tankers are still
experiencing low rates. The average secondhand price dropped to its lowest level in 3.5
years in October 2020 but has since gained 109% and reached index 181 in October
2021. Secondhand prices are currently in the top 20% seen since 2000.
Strong contracting activity, especially
among Container and Gas Carriers, have
filled capacity at first-tier yards until well
into 2024. Newbuilding prices have
increased 18% accordingly.
This has created a situation where owners
in other segments have limited access to
fleet renewal. The combination of high
earnings and low availability of new
tonnage has spurred strong activity in the
sale and purchase market.
S&P activity reached 6% of the fleet
during the first ten months of the year,
with older vessels in particular (ten years
or older) having been transacted. Greek
buyers have been the most active.
The average secondhand price index for a
ten-year-old vessel increased by 80%
during the period, while the price for a
five-year-old vessel rose 59%. This
illustrates that immediate access to
vessels is highly valued even if there are
some concerns related to future earnings.
Scrap prices increased by 40% during the
first ten months of 2021 and are now
approaching levels not seen since 2008.
Freight rates are significantly above the median, and have increased by 98% in the
past six months
Secondhand prices are well above the median, and have increased by 45% in the past six months
[Secondhand prices 2017:2021]
16Shipping Market Review – November 2021
Source: Clarksons, Drewry, Danish Ship Finance
AGE DISTRIBUTION (MILLION DWT) ACTUAL AND EXPECTED DELIVERIES (MILLION DWT) FLEET RENEWAL POTENTIAL (DWT)
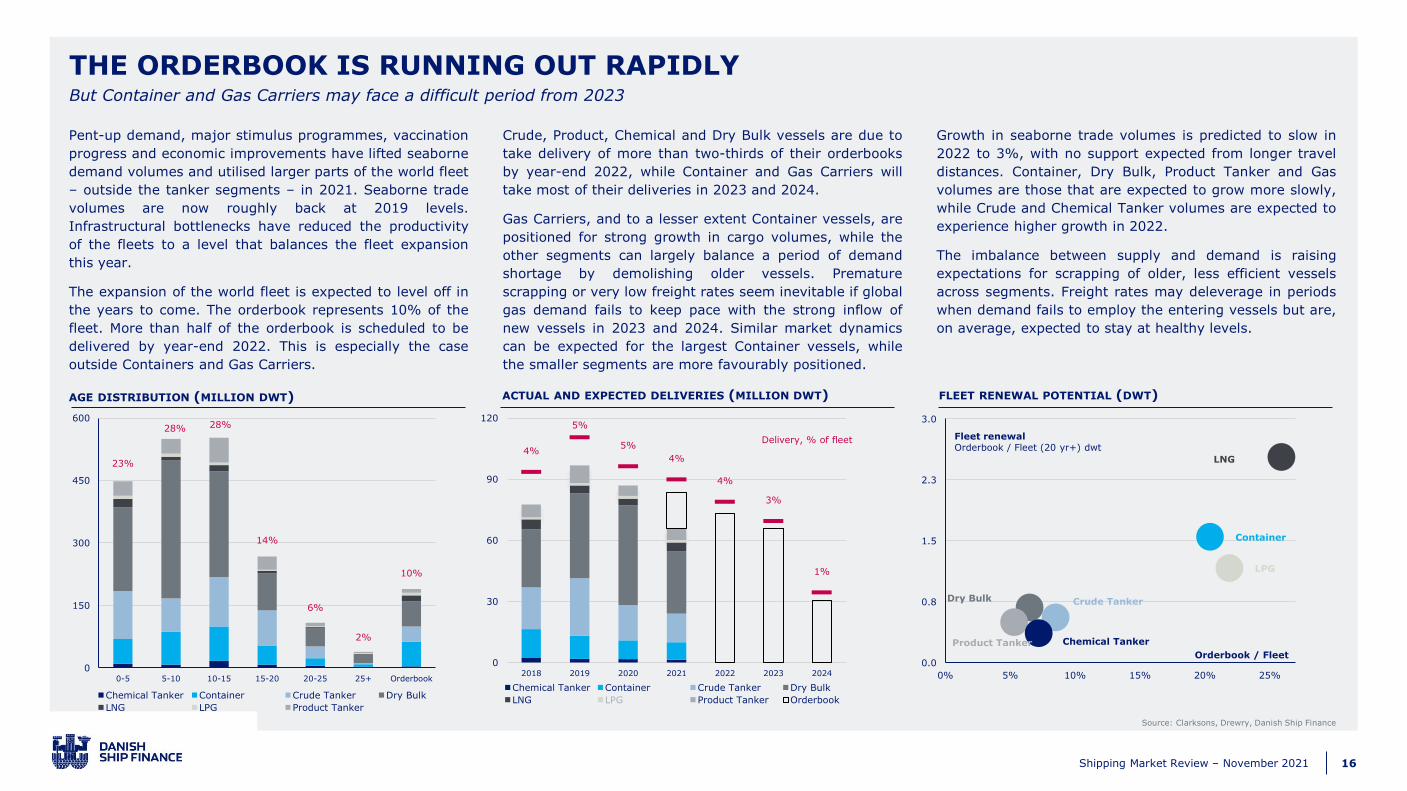
THE ORDERBOOK IS RUNNING OUT RAPIDLYBut Container and Gas Carriers may face a difficult period from 2023
Pent-up demand, major stimulus programmes, vaccination
progress and economic improvements have lifted seaborne
demand volumes and utilised larger parts of the world fleet
– outside the tanker segments – in 2021. Seaborne trade
volumes are now roughly back at 2019 levels.
Infrastructural bottlenecks have reduced the productivity
of the fleets to a level that balances the fleet expansion
this year.
The expansion of the world fleet is expected to level off in
the years to come. The orderbook represents 10% of the
fleet. More than half of the orderbook is scheduled to be
delivered by year-end 2022. This is especially the case
outside Containers and Gas Carriers.
Crude, Product, Chemical and Dry Bulk vessels are due to
take delivery of more than two-thirds of their orderbooks
by year-end 2022, while Container and Gas Carriers will
take most of their deliveries in 2023 and 2024.
Gas Carriers, and to a lesser extent Container vessels, are
positioned for strong growth in cargo volumes, while the
other segments can largely balance a period of demand
shortage by demolishing older vessels. Premature
scrapping or very low freight rates seem inevitable if global
gas demand fails to keep pace with the strong inflow of
new vessels in 2023 and 2024. Similar market dynamics
can be expected for the largest Container vessels, while
the smaller segments are more favourably positioned.
Growth in seaborne trade volumes is predicted to slow in
2022 to 3%, with no support expected from longer travel
distances. Container, Dry Bulk, Product Tanker and Gas
volumes are those that are expected to grow more slowly,
while Crude and Chemical Tanker volumes are expected to
experience higher growth in 2022.
The imbalance between supply and demand is raising
expectations for scrapping of older, less efficient vessels
across segments. Freight rates may deleverage in periods
when demand fails to employ the entering vessels but are,
on average, expected to stay at healthy levels.
Delivery, % of fleet
23%
28% 28%
14%
6%
2%
10%
0%
5%
10%
15%
20%
25%
30%
0
150
300
450
600
0-5 5-10 10-15 15-20 20-25 25+ Orderbook
Chemical Tanker Container Crude Tanker Dry Bulk
LNG LPG Product Tanker
4%
5%
5%
4%
4%
3%
1%
0%
1%
2%
3%
4%
5%
6%
0
30
60
90
120
2018 2019 2020 2021 2022 2023 2024
Chemical Tanker Container Crude Tanker Dry Bulk
LNG LPG Product Tanker Orderbook
Dry Bulk Crude Tanker
Container
Product Tanker Chemical Tanker
LPG
LNG
0.0
0.8
1.5
2.3
3.0
0% 5% 10% 15% 20% 25%
Fleet renewalOrderbook / Fleet (20 yr+) dwt
Orderbook / Fleet

17Shipping Market Review – November 2021
The push to decarbonise the global economy combined with the uneven economic
recovery is putting major strain on parts of the energy system. Despite all the advances
being made by renewables, there has been a large rebound in coal, gas and oil use in
2021 that has not been supported by increased storage and production. Prices have been
rising sharply, while inventories have run dangerously low. Oil inventories are only 94%
of their usual level, European gas storage 86%, and Indian and Chinese coal storage
below 50%. This is overshadowing signs of more structural changes, such as the
continuing rapid rise of renewables and electric vehicles.
The energy transition is a global balancing act. A reduction in oil and gas investment
requires a substantial increase in capital spending on renewable energy. Bans on fossil
fuels only work if there are low-carbon alternatives that can deliver the same energy
services, ideally at a similar or lower cost to consumers.
Energy investments are running at half the level needed to meet the ambition to achieve
net zero by 2050. Spending on renewables needs to rise, and the supply and demand of
fossil fuels needs to be wound down in tandem, without dangerous mismatches arising.
At the same time, investor pressure and fears of regulation have caused investment in
fossil fuels to slump since 2015. These investment imbalances could well herald a period
of greater volatility in both commodity markets and vessel demand.
The demand outlook for individual vessel segments is clearly shaped by long-term global
trends, but these trends may easily be eclipsed by short-term regional energy
imbalances. Transition strategies could aim to capitalise on regional energy imbalances
while navigating long-term trends through the age profile of fleets.
Take OECD refineries as an example. What would happen if the adoption of electric
vehicles and trucks took longer than anticipated while refinery capacity was retired? This
is clearly a puzzle with many elements, but for simplicity let us simply conclude that it
would create strong regional demand for Product Tankers. The point is that imbalances in
the energy transition may create periods of extraordinary changes in commodity prices
and global seaborne trade volumes. Freight rates are likely to experience periods of
extraordinary earnings but may likewise face periods of low demand. It remains to be
seen whether periods of high volatility will drive more players towards long-term
contracts, causing spot markets to shrink.
More global trade in electricity is required so that regions with abundant access to low-
priced solar and wind energy can export it. Today, only 4% of electricity in rich countries
is traded across borders, compared with 24% of global gas and 46% of oil. If clean
energy is converted into hydrogen and hydrogen-based fuels, renewable energy can be
traded and transported across borders, either by ship or with the use of existing gas
infrastructures. In time, the shipping industry could see a new market develop.
THE ENERGY TRANSITION MAY LEAD TO A PERIOD OF GREAT VOLATILITYIt is becoming increasingly difficult to handle the need for fleet renewal
The energy transition is driving a major shift in the primary energy mix away from carbon-intensive fuels towards low-carbon energy
sources. Fossil fuels are expected to shrink from today’s 80% of the fuel mix to around 20% by 2050. For the shipping industry, this
translates into massive cargo reductions in a sector that currently represents almost 40% of seaborne trade volumes. These volumes
are carried by almost 10,000 vessels (representing 30% of the deep-sea fleet’s cargo capacity). The phase-out of fossil fuels is likely
to result in periods of extraordinary volatility in not only commodity prices but also seaborne trade volumes.

18Shipping Market Review – November 2021
There is little doubt that the route to decarbonisation will – at some point –
involve the adoption of alternative fuels. For existing fleets, much of the
challenge is about reaching the targets for 2030; the 2050 net zero ambitions
are largely a quest for vessels not yet designed or built.
Many players have already begun the process, but others have yet to start.
Some have initiated pilots, while fewer have found ways to commercialise the
transition, albeit on a small scale. Important learnings are being collected
across the industry, with more still to come.
The route to 2030 could, for many vessels, largely be a question of fuel and
energy efficiency improvements carved out not only from retrofits but also from
the application of new technologies, sensors and data events. By digitalising all
aspects of vessels and their operations, crews and managers are leveraged to
take data-driven decisions and actions while experiencing vast improvements in
fuel and energy efficiency.
For vessel owners to act, some may need to see changes in their business
models or renegotiate terms with cargo owners, charterers or even with their
OEMs. Undoubtedly, some may simply call for others to pave the way for them,
but that seems unlikely to be a successful long-term strategy.
It is clear that owners are preparing their fleets for 2050, judging by the recent
ordering activity. We can see that many of the early adopters have vessels
trading on specific, or short-sea, routes, since these often have easier access to
alternative fuels, including LNG.
Some of the larger vessel segments, including tankers, Gas Carriers and
Offshore Supply vessels are facing challenged demand outlooks that may reduce
the need for significant fleet renewal after 2030 (figure: 1-4).
TRANSITION STRATEGYEnergy efficiency first, then new zero-carbon fuels – but “then” could be as late as the 2030s.
Long-term demand outlook[2020-2040]
0 Growth (+)
Transitioncontracting
Early adoption
[2020-2023]
Mediumadoption
[2024-2025]
Lateadoption[2025+]
12
11
6
108
71
13
5
9
2
3
4
(-) Decline
Source: Danish Ship Finance
FLEET RENEWAL TOWARDS ZERO-CARBON FUELS
1. Large Dry Bulk vessels*
2. Crude Tankers*
3. Product Tankers*
4. Offshore vessels*
5. Large Container vessels
6. Car Carriers
7. LPG vessels*
8. LNG vessels*
9. Chemical Tankers
10. Ro-Ro vessels
11. Short-sea vessels
12. Small Container vessels
13. Small Dry Bulk vessels
*Fossil fuel-related cargo
Transition strategies entail difficult choices. Many of the early initiatives may become subject to
expensive future retrofits, while players that wait to adopt alternative fuels may lose out on
customers who aim to be at the forefront of the climate agenda. However, all strategies involve
technology risk. Today’s strategies for achieving zero-carbon fuel acknowledge that these fuels
require significantly more space than their fossil fuel counterparts. The risk of stranded assets
will rise if or when a new vessel design that can deliver a better balance between energy storage
requirements and range can be presented.▪

19Shipping Market Review – November 2021
SHIPBUILDING
20Shipping Market Review – November 2021
DS:FUNDAMENTALSRelief for the industry after some sluggish years
SHIPBUILDING
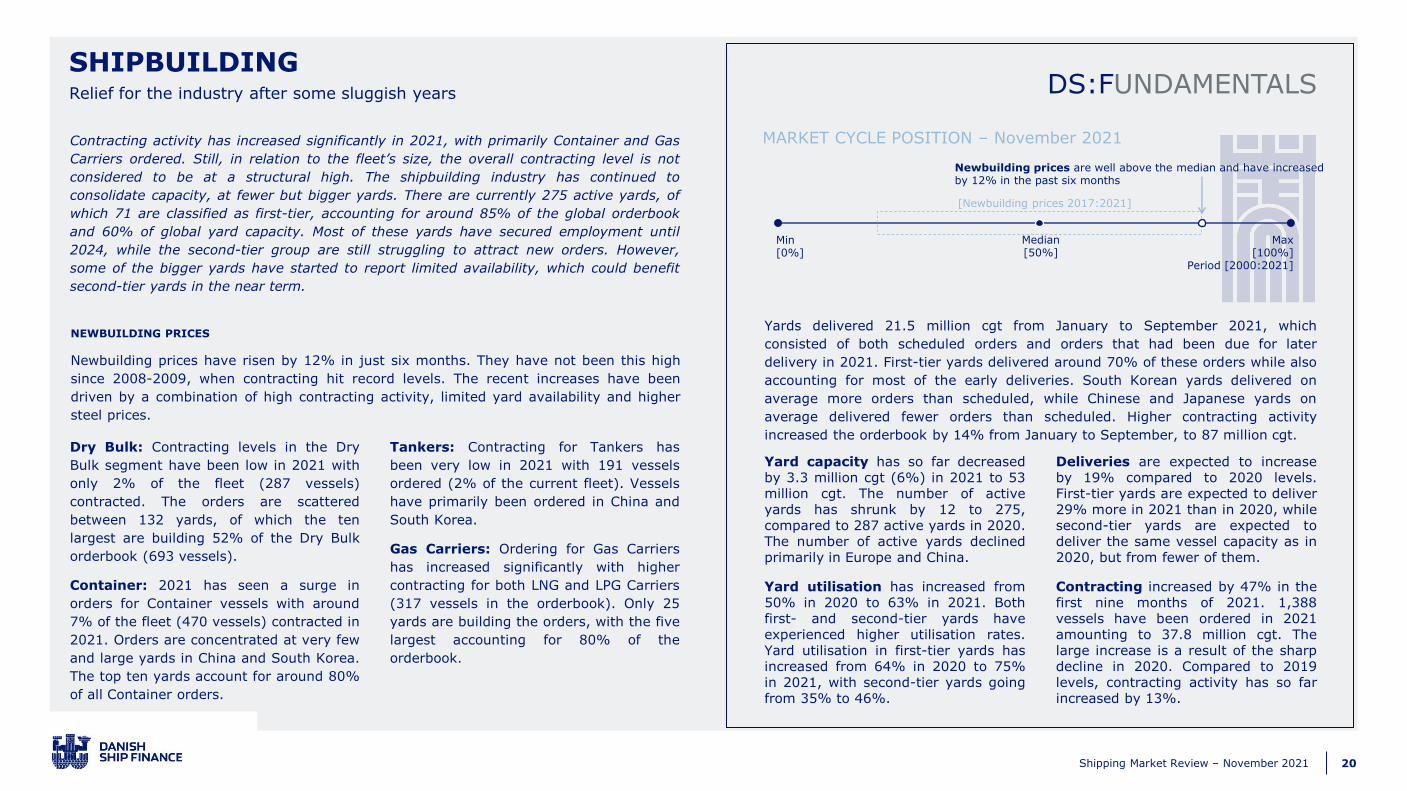
Contracting activity has increased significantly in 2021, with primarily Container and Gas
Carriers ordered. Still, in relation to the fleet’s size, the overall contracting level is not
considered to be at a structural high. The shipbuilding industry has continued to
consolidate capacity, at fewer but bigger yards. There are currently 275 active yards, of
which 71 are classified as first-tier, accounting for around 85% of the global orderbook
and 60% of global yard capacity. Most of these yards have secured employment until
2024, while the second-tier group are still struggling to attract new orders. However,
some of the bigger yards have started to report limited availability, which could benefit
second-tier yards in the near term.
Yards delivered 21.5 million cgt from January to September 2021, which
consisted of both scheduled orders and orders that had been due for later
delivery in 2021. First-tier yards delivered around 70% of these orders while also
accounting for most of the early deliveries. South Korean yards delivered on
average more orders than scheduled, while Chinese and Japanese yards on
average delivered fewer orders than scheduled. Higher contracting activity
increased the orderbook by 14% from January to September, to 87 million cgt.
NEWBUILDING PRICES
Newbuilding prices have risen by 12% in just six months. They have not been this high
since 2008-2009, when contracting hit record levels. The recent increases have been
driven by a combination of high contracting activity, limited yard availability and higher
steel prices.
Yard capacity has so far decreasedby 3.3 million cgt (6%) in 2021 to 53million cgt. The number of activeyards has shrunk by 12 to 275,compared to 287 active yards in 2020.The number of active yards declinedprimarily in Europe and China.
Yard utilisation has increased from50% in 2020 to 63% in 2021. Bothfirst- and second-tier yards haveexperienced higher utilisation rates.Yard utilisation in first-tier yards hasincreased from 64% in 2020 to 75%in 2021, with second-tier yards goingfrom 35% to 46%.
Deliveries are expected to increaseby 19% compared to 2020 levels.First-tier yards are expected to deliver29% more in 2021 than in 2020, whilesecond-tier yards are expected todeliver the same vessel capacity as in2020, but from fewer of them.
Contracting increased by 47% in thefirst nine months of 2021. 1,388vessels have been ordered in 2021amounting to 37.8 million cgt. Thelarge increase is a result of the sharpdecline in 2020. Compared to 2019levels, contracting activity has so farincreased by 13%.
Min[0%]
Max[100%]
Period [2000:2021]
Median[50%]
[Newbuilding prices 2017:2021]
Newbuilding prices are well above the median and have increased by 12% in the past six months
MARKET CYCLE POSITION – November 2021
Dry Bulk: Contracting levels in the Dry
Bulk segment have been low in 2021 with
only 2% of the fleet (287 vessels)
contracted. The orders are scattered
between 132 yards, of which the ten
largest are building 52% of the Dry Bulk
orderbook (693 vessels).
Container: 2021 has seen a surge in
orders for Container vessels with around
7% of the fleet (470 vessels) contracted in
2021. Orders are concentrated at very few
and large yards in China and South Korea.
The top ten yards account for around 80%
of all Container orders.
Tankers: Contracting for Tankers has
been very low in 2021 with 191 vessels
ordered (2% of the current fleet). Vessels
have primarily been ordered in China and
South Korea.
Gas Carriers: Ordering for Gas Carriers
has increased significantly with higher
contracting for both LNG and LPG Carriers
(317 vessels in the orderbook). Only 25
yards are building the orders, with the five
largest accounting for 80% of the
orderbook.
21Shipping Market Review – November 2021
Source: Clarksons, Danish Ship Finance
CONTRACTING (MILLION CGT) AND NEWBUILDING PRICE INDEX ACTIVE YARD CAPACITY (MILLION CGT) ORDERBOOK BY SEGMENT AND REGION (MILLION CGT)
MARKET DYNAMICS IN THE LAST SIX MONTHSIncreasing contracting activity has benefited some shipbuilding nations more than others
Increasing contracting activity combined with low yard
availability and high steel prices has pushed newbuilding
prices up. Chinese and South Korean yards have seized
the opportunity and secured work for the years to come.
INCREASING NEWBUILDING PRICES
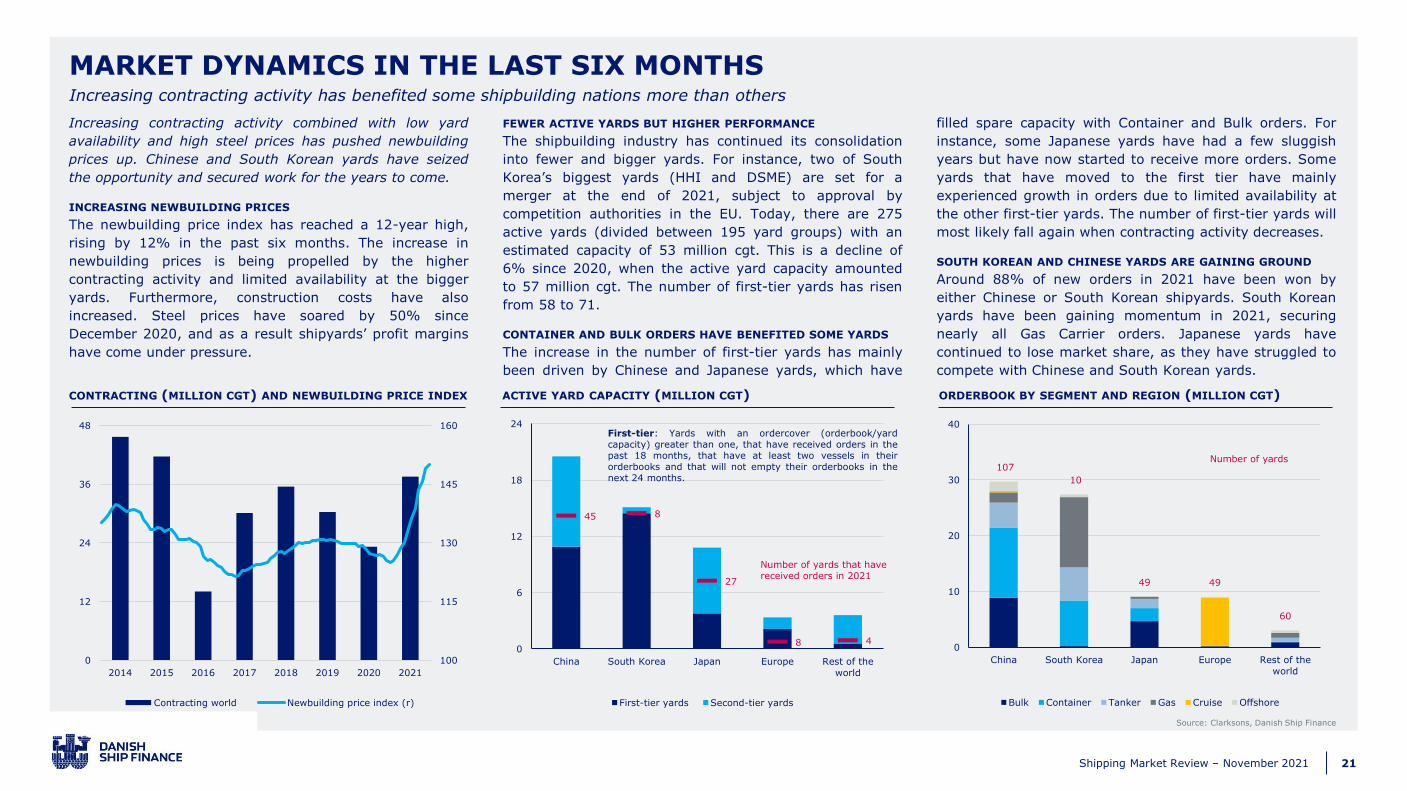
The newbuilding price index has reached a 12-year high,
rising by 12% in the past six months. The increase in
newbuilding prices is being propelled by the higher
contracting activity and limited availability at the bigger
yards. Furthermore, construction costs have also
increased. Steel prices have soared by 50% since
December 2020, and as a result shipyards’ profit margins
have come under pressure.
FEWER ACTIVE YARDS BUT HIGHER PERFORMANCE
The shipbuilding industry has continued its consolidation
into fewer and bigger yards. For instance, two of South
Korea’s biggest yards (HHI and DSME) are set for a
merger at the end of 2021, subject to approval by
competition authorities in the EU. Today, there are 275
active yards (divided between 195 yard groups) with an
estimated capacity of 53 million cgt. This is a decline of
6% since 2020, when the active yard capacity amounted
to 57 million cgt. The number of first-tier yards has risen
from 58 to 71.
CONTAINER AND BULK ORDERS HAVE BENEFITED SOME YARDS
The increase in the number of first-tier yards has mainly
been driven by Chinese and Japanese yards, which have
filled spare capacity with Container and Bulk orders. For
instance, some Japanese yards have had a few sluggish
years but have now started to receive more orders. Some
yards that have moved to the first tier have mainly
experienced growth in orders due to limited availability at
the other first-tier yards. The number of first-tier yards will
most likely fall again when contracting activity decreases.
SOUTH KOREAN AND CHINESE YARDS ARE GAINING GROUND
Around 88% of new orders in 2021 have been won by
either Chinese or South Korean shipyards. South Korean
yards have been gaining momentum in 2021, securing
nearly all Gas Carrier orders. Japanese yards have
continued to lose market share, as they have struggled to
compete with Chinese and South Korean yards.
100
115
130
145
160
0
12
24
36
48
2014 2015 2016 2017 2018 2019 2020 2021
Contracting world Newbuilding price index (r)
45 8
27
8 40
6
12
18
24
China South Korea Japan Europe Rest of the
world
First-tier yards Second-tier yards
107
10
49 49
60
0
10
20
30
40
China South Korea Japan Europe Rest of the
world
Bulk Container Tanker Gas Cruise Offshore
Number of yards that have received orders in 2021
Number of yards
First-tier: Yards with an ordercover (orderbook/yardcapacity) greater than one, that have received orders in thepast 18 months, that have at least two vessels in theirorderbooks and that will not empty their orderbooks in thenext 24 months.
22Shipping Market Review – November 2021
ORDERCOVER AND AVERAGE DELIVERY TIMES
SHARE OF GLOBAL ORDERBOOK (%) AND YARD CAPACITY (MILLION CGT)
DYNAMICS AT THE TOP TEN YARDSThe top ten yards dominate the shipbuilding market, with the rest still struggling to attract new orders
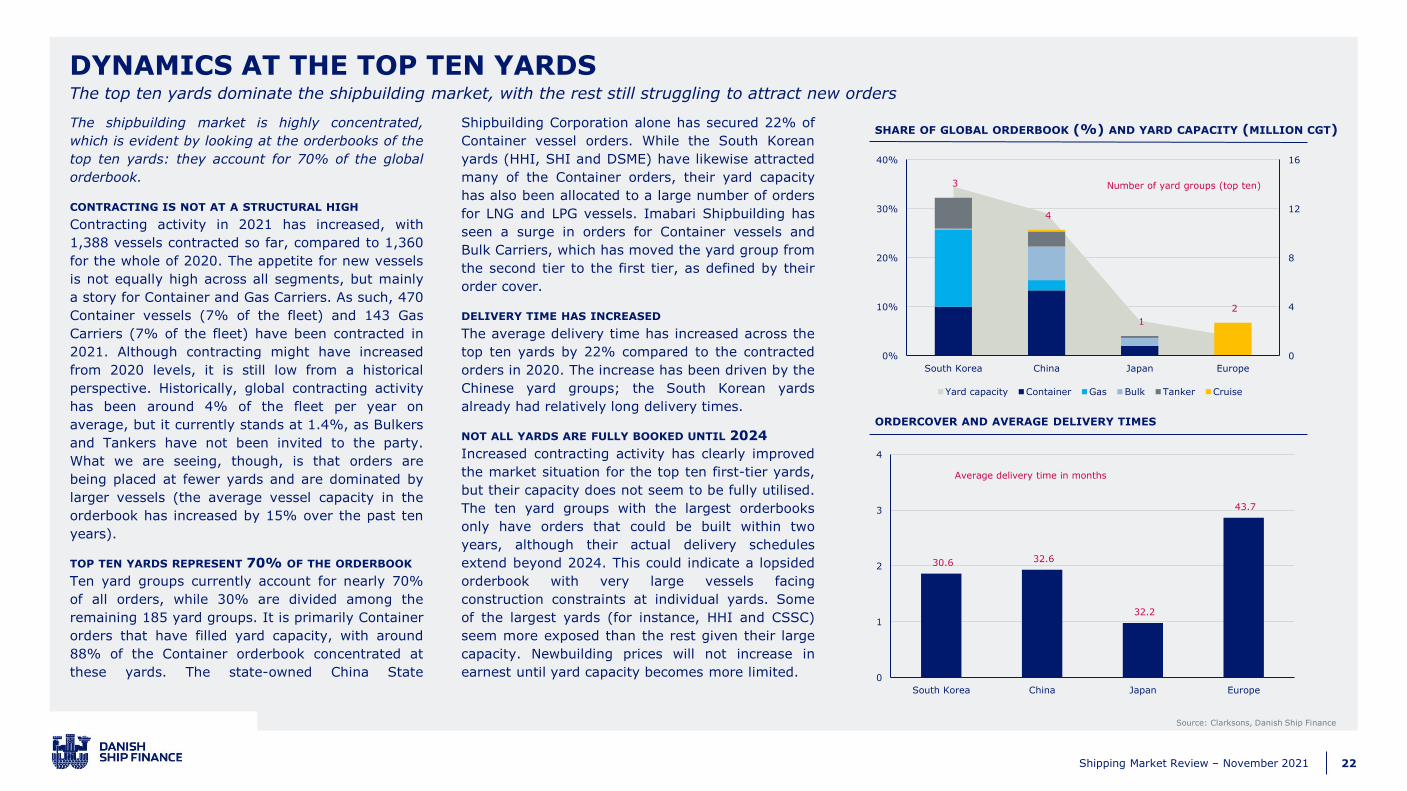
The shipbuilding market is highly concentrated,
which is evident by looking at the orderbooks of the
top ten yards: they account for 70% of the global
orderbook.
CONTRACTING IS NOT AT A STRUCTURAL HIGH
Contracting activity in 2021 has increased, with
1,388 vessels contracted so far, compared to 1,360
for the whole of 2020. The appetite for new vessels
is not equally high across all segments, but mainly
a story for Container and Gas Carriers. As such, 470
Container vessels (7% of the fleet) and 143 Gas
Carriers (7% of the fleet) have been contracted in
2021. Although contracting might have increased
from 2020 levels, it is still low from a historical
perspective. Historically, global contracting activity
has been around 4% of the fleet per year on
average, but it currently stands at 1.4%, as Bulkers
and Tankers have not been invited to the party.
What we are seeing, though, is that orders are
being placed at fewer yards and are dominated by
larger vessels (the average vessel capacity in the
orderbook has increased by 15% over the past ten
years).
TOP TEN YARDS REPRESENT 70% OF THE ORDERBOOK
Ten yard groups currently account for nearly 70%
of all orders, while 30% are divided among the
remaining 185 yard groups. It is primarily Container
orders that have filled yard capacity, with around
88% of the Container orderbook concentrated at
these yards. The state-owned China State
Shipbuilding Corporation alone has secured 22% of
Container vessel orders. While the South Korean
yards (HHI, SHI and DSME) have likewise attracted
many of the Container orders, their yard capacity
has also been allocated to a large number of orders
for LNG and LPG vessels. Imabari Shipbuilding has
seen a surge in orders for Container vessels and
Bulk Carriers, which has moved the yard group from
the second tier to the first tier, as defined by their
order cover.
DELIVERY TIME HAS INCREASED
The average delivery time has increased across the
top ten yards by 22% compared to the contracted
orders in 2020. The increase has been driven by the
Chinese yard groups; the South Korean yards
already had relatively long delivery times.
NOT ALL YARDS ARE FULLY BOOKED UNTIL 2024
Increased contracting activity has clearly improved
the market situation for the top ten first-tier yards,
but their capacity does not seem to be fully utilised.
The ten yard groups with the largest orderbooks
only have orders that could be built within two
years, although their actual delivery schedules
extend beyond 2024. This could indicate a lopsided
orderbook with very large vessels facing
construction constraints at individual yards. Some
of the largest yards (for instance, HHI and CSSC)
seem more exposed than the rest given their large
capacity. Newbuilding prices will not increase in
earnest until yard capacity becomes more limited.
Source: Clarksons, Danish Ship Finance
3
4
1
2
0
4
8
12
16
0%
10%
20%
30%
40%
South Korea China Japan Europe
Yard capacity Container Gas Bulk Tanker Cruise
30.6 32.6
32.2
43.7
0
1
2
3
4
South Korea China Japan Europe
Average delivery time in months
Number of yard groups (top ten)
23Shipping Market Review – November 2021
SHIPBUILDING MARKET OUTLOOK
DELIVERY PERFORMANCE (MILLION CGT)
Source: Clarksons, Danish Ship Finance
Employment secured in the short to medium term
YARD UTILISATION RATES (%)
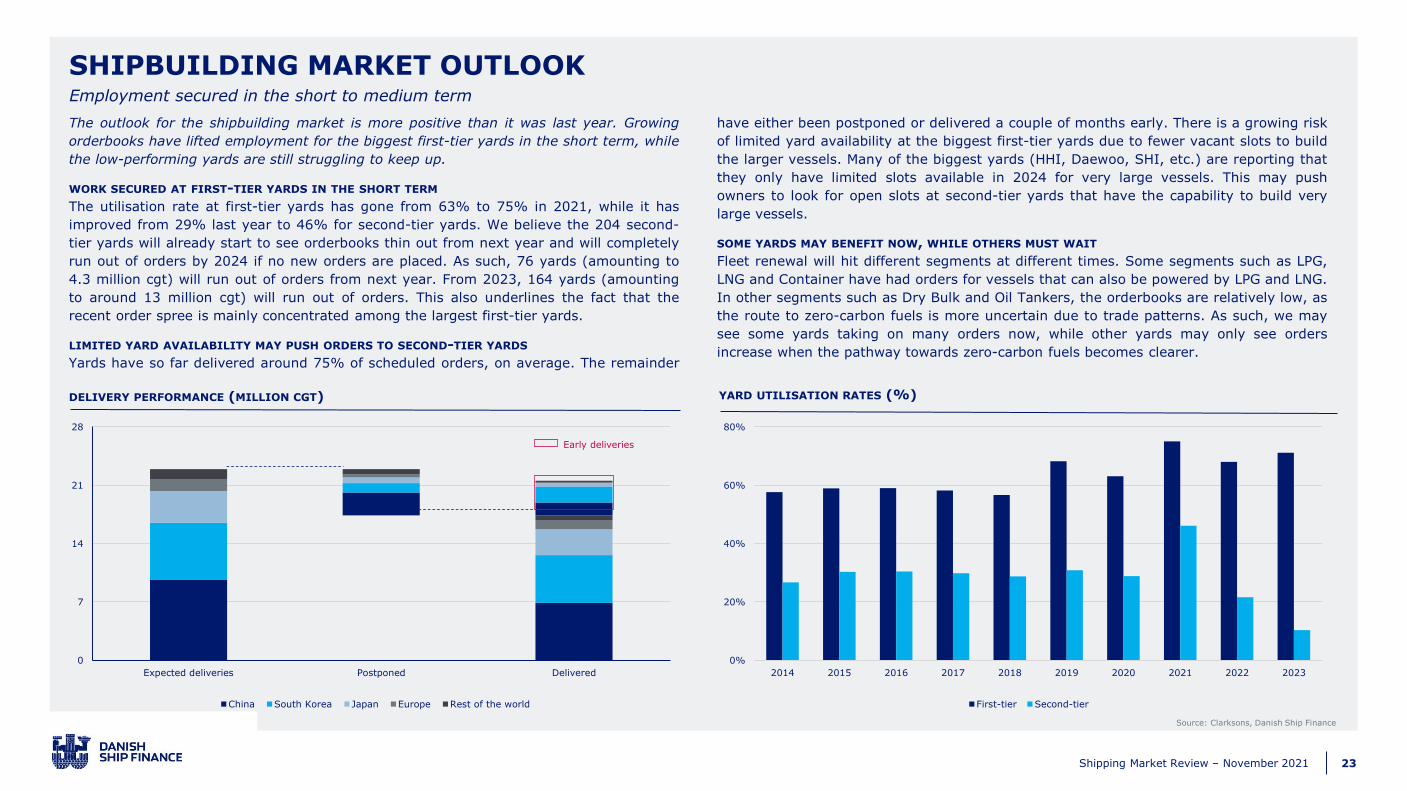
The outlook for the shipbuilding market is more positive than it was last year. Growing
orderbooks have lifted employment for the biggest first-tier yards in the short term, while
the low-performing yards are still struggling to keep up.
WORK SECURED AT FIRST-TIER YARDS IN THE SHORT TERM
The utilisation rate at first-tier yards has gone from 63% to 75% in 2021, while it has
improved from 29% last year to 46% for second-tier yards. We believe the 204 second-
tier yards will already start to see orderbooks thin out from next year and will completely
run out of orders by 2024 if no new orders are placed. As such, 76 yards (amounting to
4.3 million cgt) will run out of orders from next year. From 2023, 164 yards (amounting
to around 13 million cgt) will run out of orders. This also underlines the fact that the
recent order spree is mainly concentrated among the largest first-tier yards.
LIMITED YARD AVAILABILITY MAY PUSH ORDERS TO SECOND-TIER YARDS
Yards have so far delivered around 75% of scheduled orders, on average. The remainder
have either been postponed or delivered a couple of months early. There is a growing risk
of limited yard availability at the biggest first-tier yards due to fewer vacant slots to build
the larger vessels. Many of the biggest yards (HHI, Daewoo, SHI, etc.) are reporting that
they only have limited slots available in 2024 for very large vessels. This may push
owners to look for open slots at second-tier yards that have the capability to build very
large vessels.
SOME YARDS MAY BENEFIT NOW, WHILE OTHERS MUST WAIT
Fleet renewal will hit different segments at different times. Some segments such as LPG,
LNG and Container have had orders for vessels that can also be powered by LPG and LNG.
In other segments such as Dry Bulk and Oil Tankers, the orderbooks are relatively low, as
the route to zero-carbon fuels is more uncertain due to trade patterns. As such, we may
see some yards taking on many orders now, while other yards may only see orders
increase when the pathway towards zero-carbon fuels becomes clearer.
0
7
14
21
28
Expected deliveries Postponed Delivered
China South Korea Japan Europe Rest of the world
Early deliveries
0%
20%
40%
60%
80%
2014 2015 2016 2017 2018 2019 2020 2021 2022 2023
First-tier Second-tier
24Shipping Market Review – November 2021
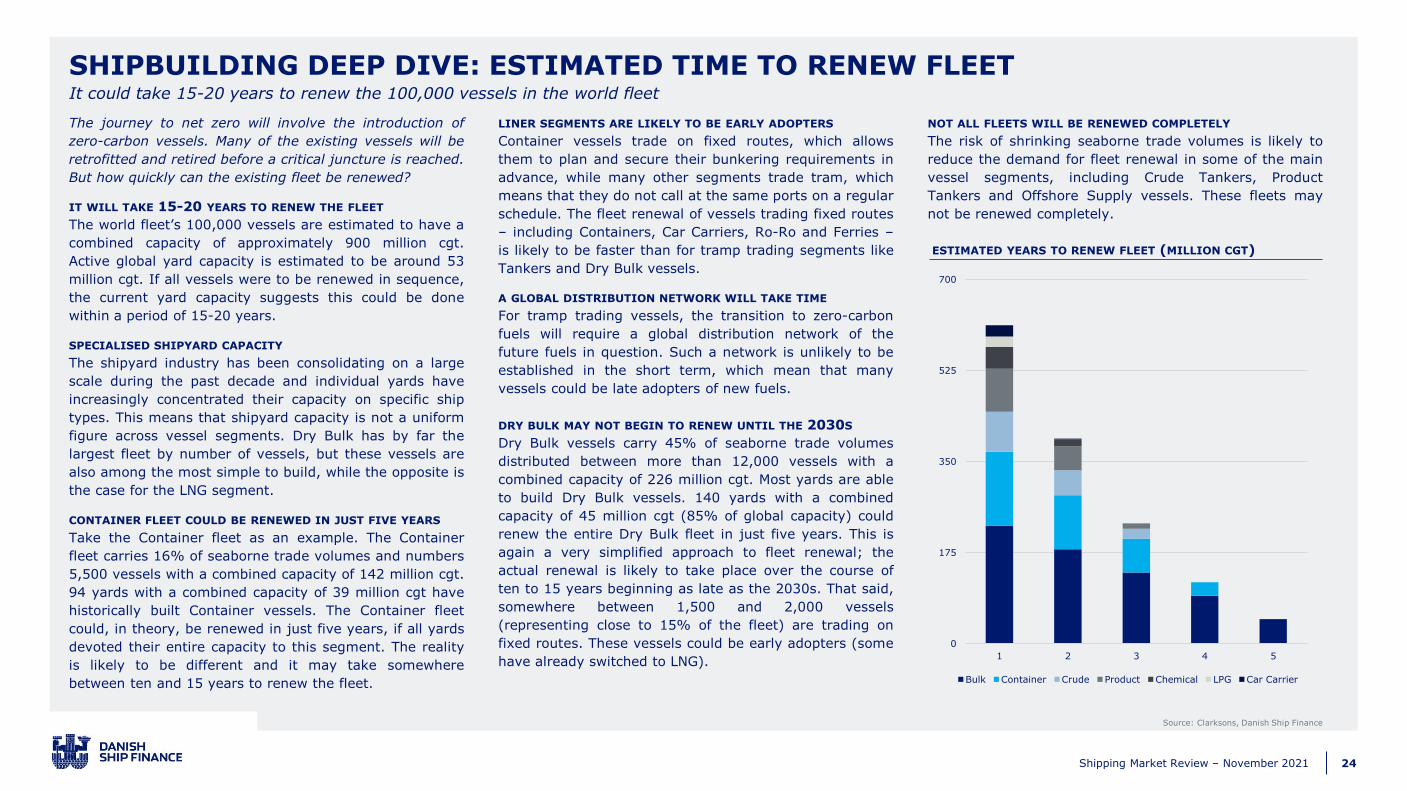
SHIPBUILDING DEEP DIVE: ESTIMATED TIME TO RENEW FLEETIt could take 15-20 years to renew the 100,000 vessels in the world fleet
The journey to net zero will involve the introduction of
zero-carbon vessels. Many of the existing vessels will be
retrofitted and retired before a critical juncture is reached.
But how quickly can the existing fleet be renewed?
IT WILL TAKE 15-20 YEARS TO RENEW THE FLEET
The world fleet’s 100,000 vessels are estimated to have a
combined capacity of approximately 900 million cgt.
Active global yard capacity is estimated to be around 53
million cgt. If all vessels were to be renewed in sequence,
the current yard capacity suggests this could be done
within a period of 15-20 years.
SPECIALISED SHIPYARD CAPACITY
The shipyard industry has been consolidating on a large
scale during the past decade and individual yards have
increasingly concentrated their capacity on specific ship
types. This means that shipyard capacity is not a uniform
figure across vessel segments. Dry Bulk has by far the
largest fleet by number of vessels, but these vessels are
also among the most simple to build, while the opposite is
the case for the LNG segment.
CONTAINER FLEET COULD BE RENEWED IN JUST FIVE YEARS
Take the Container fleet as an example. The Container
fleet carries 16% of seaborne trade volumes and numbers
5,500 vessels with a combined capacity of 142 million cgt.
94 yards with a combined capacity of 39 million cgt have
historically built Container vessels. The Container fleet
could, in theory, be renewed in just five years, if all yards
devoted their entire capacity to this segment. The reality
is likely to be different and it may take somewhere
between ten and 15 years to renew the fleet.
LINER SEGMENTS ARE LIKELY TO BE EARLY ADOPTERS
Container vessels trade on fixed routes, which allows
them to plan and secure their bunkering requirements in
advance, while many other segments trade tram, which
means that they do not call at the same ports on a regular
schedule. The fleet renewal of vessels trading fixed routes
– including Containers, Car Carriers, Ro-Ro and Ferries –
is likely to be faster than for tramp trading segments like
Tankers and Dry Bulk vessels.
A GLOBAL DISTRIBUTION NETWORK WILL TAKE TIME
For tramp trading vessels, the transition to zero-carbon
fuels will require a global distribution network of the
future fuels in question. Such a network is unlikely to be
established in the short term, which mean that many
vessels could be late adopters of new fuels.
DRY BULK MAY NOT BEGIN TO RENEW UNTIL THE 2030S
Dry Bulk vessels carry 45% of seaborne trade volumes
distributed between more than 12,000 vessels with a
combined capacity of 226 million cgt. Most yards are able
to build Dry Bulk vessels. 140 yards with a combined
capacity of 45 million cgt (85% of global capacity) could
renew the entire Dry Bulk fleet in just five years. This is
again a very simplified approach to fleet renewal; the
actual renewal is likely to take place over the course of
ten to 15 years beginning as late as the 2030s. That said,
somewhere between 1,500 and 2,000 vessels
(representing close to 15% of the fleet) are trading on
fixed routes. These vessels could be early adopters (some
have already switched to LNG).
NOT ALL FLEETS WILL BE RENEWED COMPLETELY
The risk of shrinking seaborne trade volumes is likely to
reduce the demand for fleet renewal in some of the main
vessel segments, including Crude Tankers, Product
Tankers and Offshore Supply vessels. These fleets may
not be renewed completely.
ESTIMATED YEARS TO RENEW FLEET (MILLION CGT)
0
175
350
525
700
1 2 3 4 5
Bulk Container Crude Product Chemical LPG Car Carrier
Source: Clarksons, Danish Ship Finance

25Shipping Market Review – November 2021
CONTAINER
26Shipping Market Review – November 2021
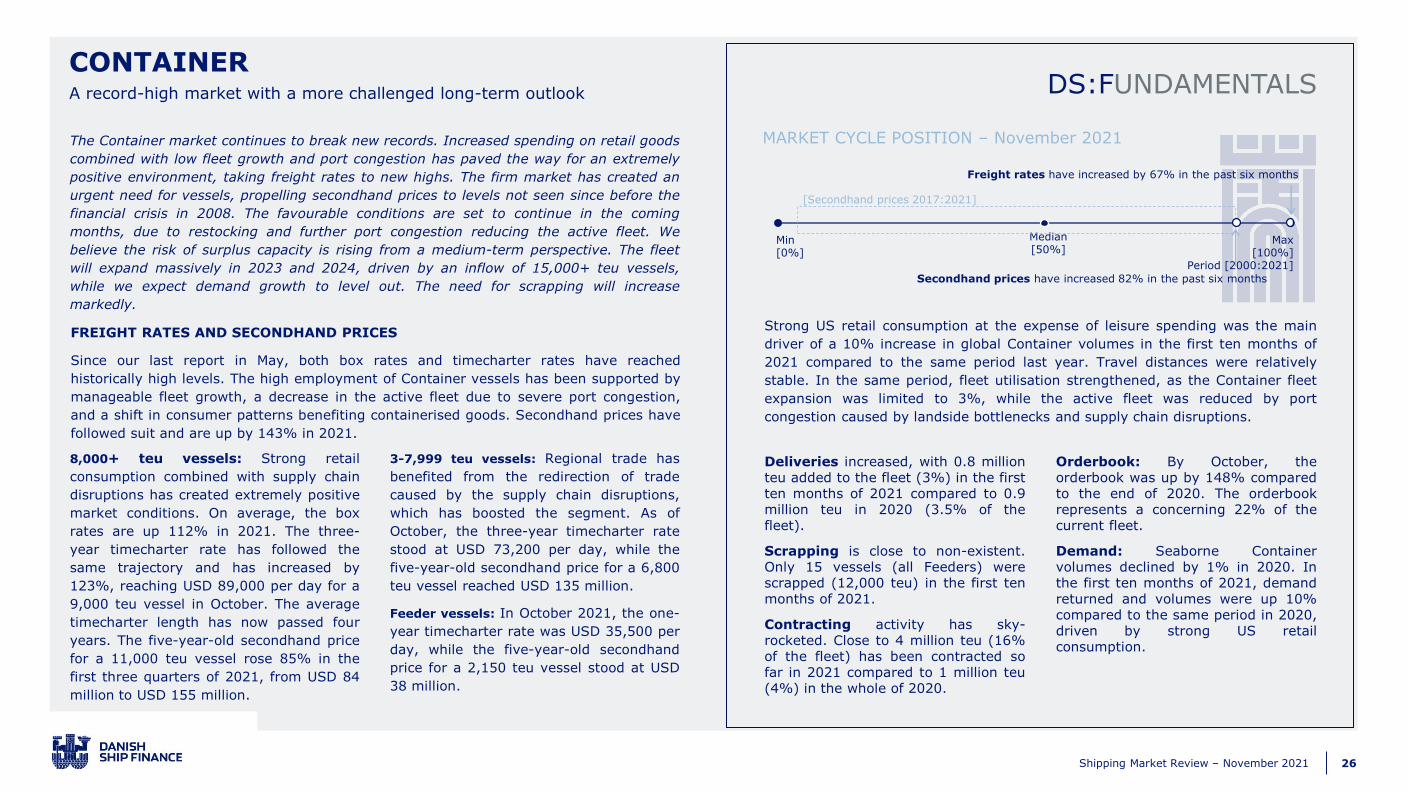
DS:FUNDAMENTALSA record-high market with a more challenged long-term outlook
CONTAINER
The Container market continues to break new records. Increased spending on retail goods
combined with low fleet growth and port congestion has paved the way for an extremely
positive environment, taking freight rates to new highs. The firm market has created an
urgent need for vessels, propelling secondhand prices to levels not seen since before the
financial crisis in 2008. The favourable conditions are set to continue in the coming
months, due to restocking and further port congestion reducing the active fleet. We
believe the risk of surplus capacity is rising from a medium-term perspective. The fleet
will expand massively in 2023 and 2024, driven by an inflow of 15,000+ teu vessels,
while we expect demand growth to level out. The need for scrapping will increase
markedly.
FREIGHT RATES AND SECONDHAND PRICES
Since our last report in May, both box rates and timecharter rates have reached
historically high levels. The high employment of Container vessels has been supported by
manageable fleet growth, a decrease in the active fleet due to severe port congestion,
and a shift in consumer patterns benefiting containerised goods. Secondhand prices have
followed suit and are up by 143% in 2021.
Strong US retail consumption at the expense of leisure spending was the main
driver of a 10% increase in global Container volumes in the first ten months of
2021 compared to the same period last year. Travel distances were relatively
stable. In the same period, fleet utilisation strengthened, as the Container fleet
expansion was limited to 3%, while the active fleet was reduced by port
congestion caused by landside bottlenecks and supply chain disruptions.
Deliveries increased, with 0.8 millionteu added to the fleet (3%) in the firstten months of 2021 compared to 0.9million teu in 2020 (3.5% of thefleet).
Scrapping is close to non-existent.Only 15 vessels (all Feeders) werescrapped (12,000 teu) in the first tenmonths of 2021.
Contracting activity has sky-rocketed. Close to 4 million teu (16%of the fleet) has been contracted sofar in 2021 compared to 1 million teu(4%) in the whole of 2020.
Orderbook: By October, theorderbook was up by 148% comparedto the end of 2020. The orderbookrepresents a concerning 22% of thecurrent fleet.
Demand: Seaborne Containervolumes declined by 1% in 2020. Inthe first ten months of 2021, demandreturned and volumes were up 10%compared to the same period in 2020,driven by strong US retailconsumption.
8,000+ teu vessels: Strong retail
consumption combined with supply chain
disruptions has created extremely positive
market conditions. On average, the box
rates are up 112% in 2021. The three-
year timecharter rate has followed the
same trajectory and has increased by
123%, reaching USD 89,000 per day for a
9,000 teu vessel in October. The average
timecharter length has now passed four
years. The five-year-old secondhand price
for a 11,000 teu vessel rose 85% in the
first three quarters of 2021, from USD 84
million to USD 155 million.
3-7,999 teu vessels: Regional trade has
benefited from the redirection of trade
caused by the supply chain disruptions,
which has boosted the segment. As of
October, the three-year timecharter rate
stood at USD 73,200 per day, while the
five-year-old secondhand price for a 6,800
teu vessel reached USD 135 million.
Feeder vessels: In October 2021, the one-
year timecharter rate was USD 35,500 per
day, while the five-year-old secondhand
price for a 2,150 teu vessel stood at USD
38 million.
Min[0%]
Max[100%]
Period [2000:2021]
Median[50%]
MARKET CYCLE POSITION – November 2021
Freight rates have increased by 67% in the past six months
[Secondhand prices 2017:2021]
Secondhand prices have increased 82% in the past six months
27Shipping Market Review – November 2021
Source: AXS Marine, Clarksons, Danish Ship Finance
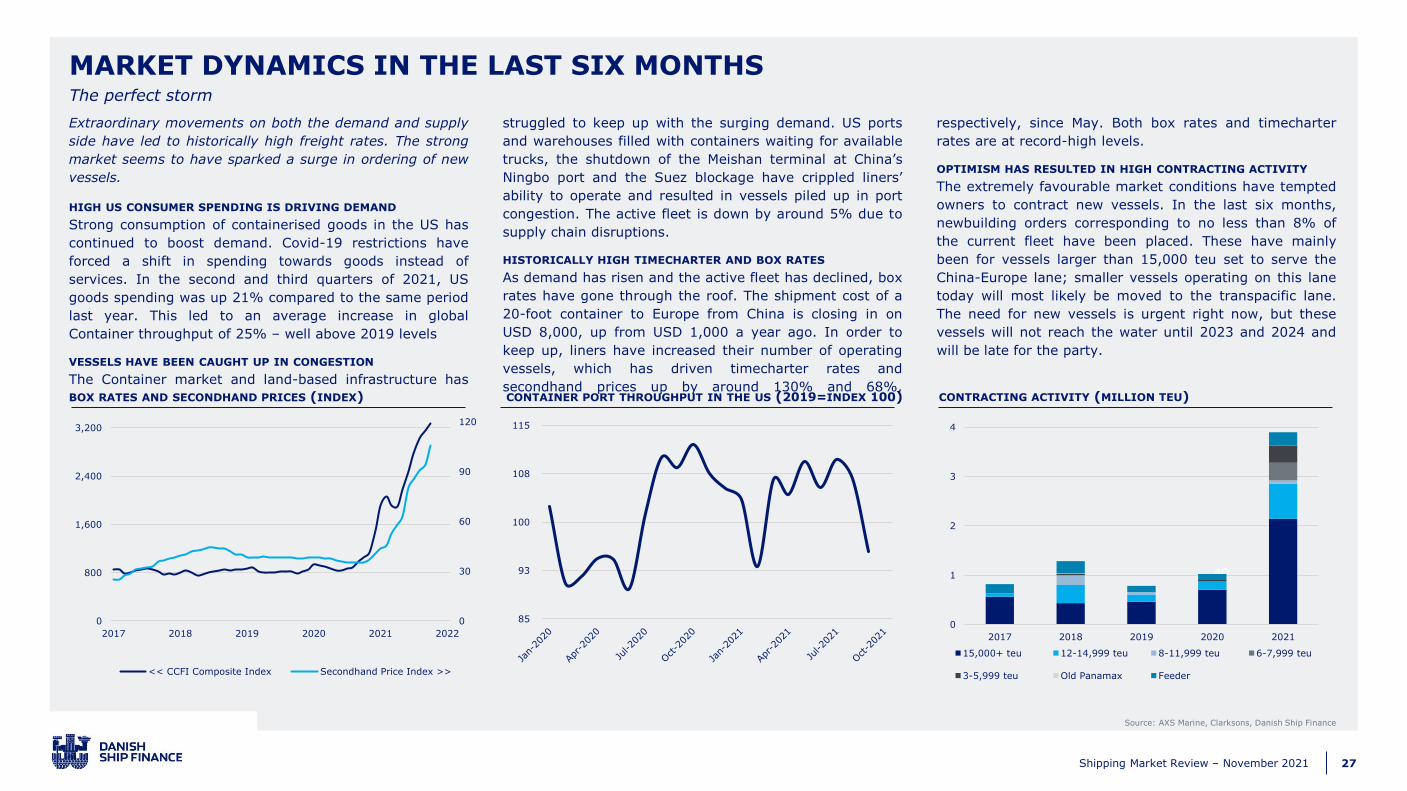
BOX RATES AND SECONDHAND PRICES (INDEX) CONTAINER PORT THROUGHPUT IN THE US (2019=INDEX 100) CONTRACTING ACTIVITY (MILLION TEU)
MARKET DYNAMICS IN THE LAST SIX MONTHSThe perfect storm
Extraordinary movements on both the demand and supply
side have led to historically high freight rates. The strong
market seems to have sparked a surge in ordering of new
vessels.
HIGH US CONSUMER SPENDING IS DRIVING DEMAND
Strong consumption of containerised goods in the US has
continued to boost demand. Covid-19 restrictions have
forced a shift in spending towards goods instead of
services. In the second and third quarters of 2021, US
goods spending was up 21% compared to the same period
last year. This led to an average increase in global
Container throughput of 25% – well above 2019 levels
VESSELS HAVE BEEN CAUGHT UP IN CONGESTION
The Container market and land-based infrastructure has
struggled to keep up with the surging demand. US ports
and warehouses filled with containers waiting for available
trucks, the shutdown of the Meishan terminal at China’s
Ningbo port and the Suez blockage have crippled liners’
ability to operate and resulted in vessels piled up in port
congestion. The active fleet is down by around 5% due to
supply chain disruptions.
HISTORICALLY HIGH TIMECHARTER AND BOX RATES
As demand has risen and the active fleet has declined, box
rates have gone through the roof. The shipment cost of a
20-foot container to Europe from China is closing in on
USD 8,000, up from USD 1,000 a year ago. In order to
keep up, liners have increased their number of operating
vessels, which has driven timecharter rates and
secondhand prices up by around 130% and 68%,
respectively, since May. Both box rates and timecharter
rates are at record-high levels.
OPTIMISM HAS RESULTED IN HIGH CONTRACTING ACTIVITY
The extremely favourable market conditions have tempted
owners to contract new vessels. In the last six months,
newbuilding orders corresponding to no less than 8% of
the current fleet have been placed. These have mainly
been for vessels larger than 15,000 teu set to serve the
China-Europe lane; smaller vessels operating on this lane
today will most likely be moved to the transpacific lane.
The need for new vessels is urgent right now, but these
vessels will not reach the water until 2023 and 2024 and
will be late for the party.
0
30
60
90
120
0
800
1,600
2,400
3,200
2017 2018 2019 2020 2021 2022
<< CCFI Composite Index Secondhand Price Index >>
4Q
0
1
2
3
4
2017 2018 2019 2020 2021
15,000+ teu 12-14,999 teu 8-11,999 teu 6-7,999 teu
3-5,999 teu Old Panamax Feeder
85
93
100
108
115
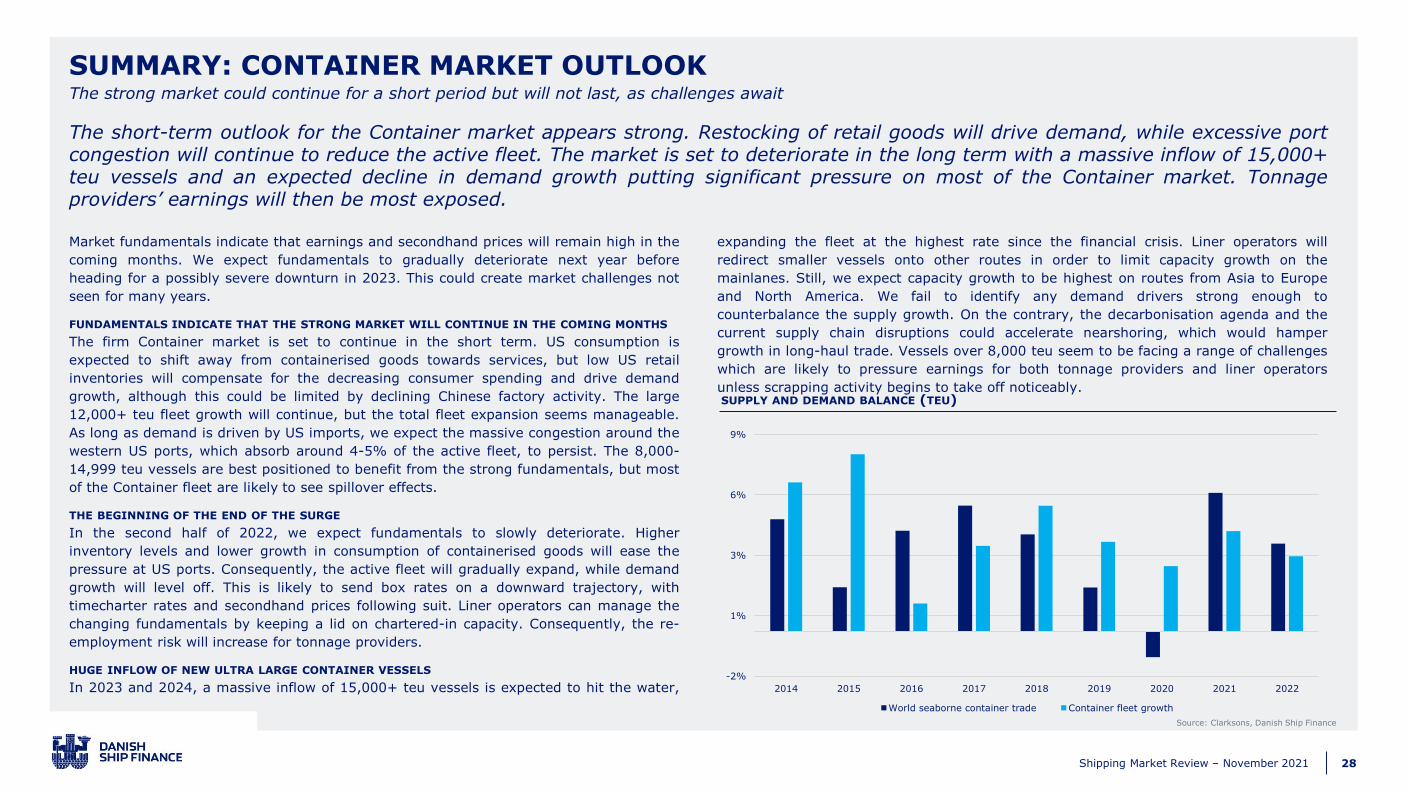
28Shipping Market Review – November 2021
Market fundamentals indicate that earnings and secondhand prices will remain high in the
coming months. We expect fundamentals to gradually deteriorate next year before
heading for a possibly severe downturn in 2023. This could create market challenges not
seen for many years.
FUNDAMENTALS INDICATE THAT THE STRONG MARKET WILL CONTINUE IN THE COMING MONTHS
The firm Container market is set to continue in the short term. US consumption is
expected to shift away from containerised goods towards services, but low US retail
inventories will compensate for the decreasing consumer spending and drive demand
growth, although this could be limited by declining Chinese factory activity. The large
12,000+ teu fleet growth will continue, but the total fleet expansion seems manageable.
As long as demand is driven by US imports, we expect the massive congestion around the
western US ports, which absorb around 4-5% of the active fleet, to persist. The 8,000-
14,999 teu vessels are best positioned to benefit from the strong fundamentals, but most
of the Container fleet are likely to see spillover effects.
THE BEGINNING OF THE END OF THE SURGE
In the second half of 2022, we expect fundamentals to slowly deteriorate. Higher
inventory levels and lower growth in consumption of containerised goods will ease the
pressure at US ports. Consequently, the active fleet will gradually expand, while demand
growth will level off. This is likely to send box rates on a downward trajectory, with
timecharter rates and secondhand prices following suit. Liner operators can manage the
changing fundamentals by keeping a lid on chartered-in capacity. Consequently, the re-
employment risk will increase for tonnage providers.
HUGE INFLOW OF NEW ULTRA LARGE CONTAINER VESSELS
In 2023 and 2024, a massive inflow of 15,000+ teu vessels is expected to hit the water,
expanding the fleet at the highest rate since the financial crisis. Liner operators will
redirect smaller vessels onto other routes in order to limit capacity growth on the
mainlanes. Still, we expect capacity growth to be highest on routes from Asia to Europe
and North America. We fail to identify any demand drivers strong enough to
counterbalance the supply growth. On the contrary, the decarbonisation agenda and the
current supply chain disruptions could accelerate nearshoring, which would hamper
growth in long-haul trade. Vessels over 8,000 teu seem to be facing a range of challenges
which are likely to pressure earnings for both tonnage providers and liner operators
unless scrapping activity begins to take off noticeably.
SUMMARY: CONTAINER MARKET OUTLOOK
Source: Clarksons, Danish Ship Finance
The strong market could continue for a short period but will not last, as challenges await
SUPPLY AND DEMAND BALANCE (TEU)
The short-term outlook for the Container market appears strong. Restocking of retail goods will drive demand, while excessive portcongestion will continue to reduce the active fleet. The market is set to deteriorate in the long term with a massive inflow of 15,000+teu vessels and an expected decline in demand growth putting significant pressure on most of the Container market. Tonnageproviders’ earnings will then be most exposed.
-2%
1%
3%
6%
9%
2014 2015 2016 2017 2018 2019 2020 2021 2022
World seaborne container trade Container fleet growth
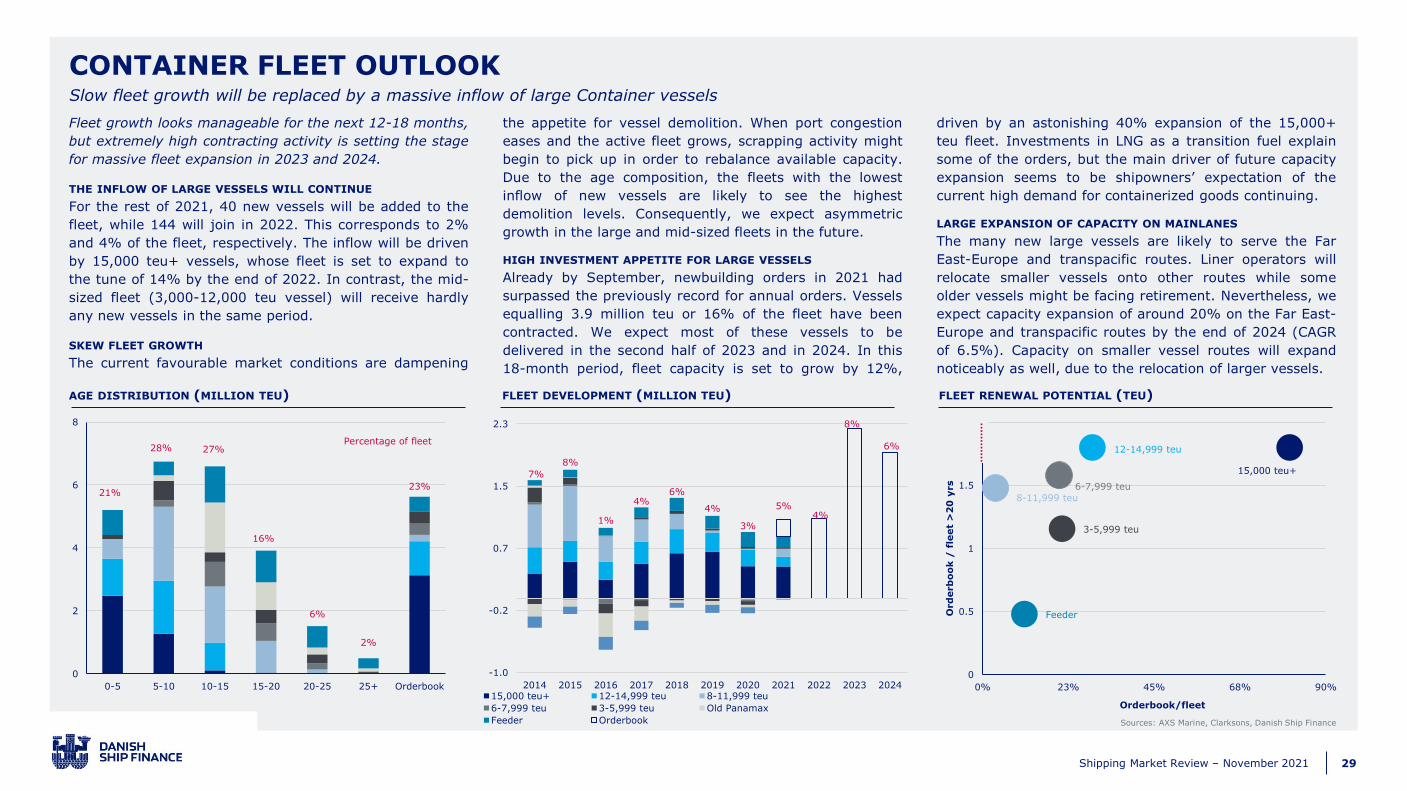
29Shipping Market Review – November 2021
Fleet growth looks manageable for the next 12-18 months,
but extremely high contracting activity is setting the stage
for massive fleet expansion in 2023 and 2024.
THE INFLOW OF LARGE VESSELS WILL CONTINUE
For the rest of 2021, 40 new vessels will be added to the
fleet, while 144 will join in 2022. This corresponds to 2%
and 4% of the fleet, respectively. The inflow will be driven
by 15,000 teu+ vessels, whose fleet is set to expand to
the tune of 14% by the end of 2022. In contrast, the mid-
sized fleet (3,000-12,000 teu vessel) will receive hardly
any new vessels in the same period.
SKEW FLEET GROWTH
The current favourable market conditions are dampening
the appetite for vessel demolition. When port congestion
eases and the active fleet grows, scrapping activity might
begin to pick up in order to rebalance available capacity.
Due to the age composition, the fleets with the lowest
inflow of new vessels are likely to see the highest
demolition levels. Consequently, we expect asymmetric
growth in the large and mid-sized fleets in the future.
HIGH INVESTMENT APPETITE FOR LARGE VESSELS
Already by September, newbuilding orders in 2021 had
surpassed the previously record for annual orders. Vessels
equalling 3.9 million teu or 16% of the fleet have been
contracted. We expect most of these vessels to be
delivered in the second half of 2023 and in 2024. In this
18-month period, fleet capacity is set to grow by 12%,
driven by an astonishing 40% expansion of the 15,000+
teu fleet. Investments in LNG as a transition fuel explain
some of the orders, but the main driver of future capacity
expansion seems to be shipowners’ expectation of the
current high demand for containerized goods continuing.
LARGE EXPANSION OF CAPACITY ON MAINLANES
The many new large vessels are likely to serve the Far
East-Europe and transpacific routes. Liner operators will
relocate smaller vessels onto other routes while some
older vessels might be facing retirement. Nevertheless, we
expect capacity expansion of around 20% on the Far East-
Europe and transpacific routes by the end of 2024 (CAGR
of 6.5%). Capacity on smaller vessel routes will expand
noticeably as well, due to the relocation of larger vessels.
Sources: AXS Marine, Clarksons, Danish Ship Finance
AGE DISTRIBUTION (MILLION TEU) FLEET DEVELOPMENT (MILLION TEU) FLEET RENEWAL POTENTIAL (TEU)
CONTAINER FLEET OUTLOOKSlow fleet growth will be replaced by a massive inflow of large Container vessels
21%
28% 27%
16%
6%
2%
23%
0%
5%
10%
15%
20%
25%
30%
0
2
4
6
8
0-5 5-10 10-15 15-20 20-25 25+ Orderbook
Percentage of fleet
15,000 teu+
12-14,999 teu
8-11,999 teu
6-7,999 teu
3-5,999 teu
Feeder
0
0.5
1
1.5
2
0% 23% 45% 68% 90%
Ord
erb
oo
k /
fle
et
>2
0 y
rs
Orderbook/fleet
7%
8%
1%
4%6%
4%
3%
5%4%
8%
6%
-1.0
-0.2
0.7
1.5
2.3
2014 2015 2016 2017 2018 2019 2020 2021 2022 2023 202415,000 teu+ 12-14,999 teu 8-11,999 teu
6-7,999 teu 3-5,999 teu Old Panamax
Feeder Orderbook

30Shipping Market Review – November 2021
SUPPLY CHAIN DISRUPTIONS* (INDEX)
VESSEL DEPLOYMENT (MILLION TEU)
FLEET DEEP DIVE: CONGESTION AT US PORTS The active fleet is being hampered considerably by redirected vessels and logistical disruptions
Liner operators are increasing capacity between
Asia and North America due to high demand. The
inland infrastructure is failing to cope with the large
number of vessels, causing congestion. The active
fleet is set to grow as the bottlenecks clear.
LARGE VESSELS’ MAINLANES
Networks of large Container vessels are designed
for transporting goods from low labour cost
countries to developed regions. The versatile 8,000-
14,999 teu vessels sail on a broad range of routes,
but most carry goods across the Pacific. Container
vessels larger than 15,000 teu mainly serve Asia-
Europe routes, due to draft constraints in other
import regions such as North America.
VESSEL CONCENTRATION ON TRANSPACIFIC SERVICES
Prior to the Covid-19 pandemic, capacity deployed
across the Pacific equalled that of the Far East-
Europe routes, but in order to cope with the
surprisingly high US demand for consumer goods,
liner operators started allocating more vessels
between Asia and the US during summer 2020.
From April to September, the monthly deployed
capacity rose by 35% to 5.2 million teu, driven by
additional 8,000-14,999 teu vessels being moved
from Far East-Europe and minor routes.
INCREASED NUMBER OF PORT CALLS FOLLOWED
The increased number of vessels on the transpacific
routes has put massive pressure on US ports. The
number of 8,000-14,999 teu vessels reaching the
US west coast increased from 350 in January 2020
to 415 in July 2021.
‘
INLAND LOGISTICAL DISRUPTIONS
The inland infrastructure has struggled to keep up
with the fast-growing number of containers
discharged at the ports. Filled storage facilities,
wrongly placed containers and a lack of port
workers and truckers are complicating vessel
handling in ports.
A MARKED REDUCTION IN THE ACTIVE FLEET
The extraordinary vessel traffic combined with the
lack of inland capabilities drove congestion at US
ports up from 4% to 8% of the total Container fleet
from January 2020 to October 2021. Adding the
correlated congestion in Eastern Asia, the active
Container fleet has been reduced by approximately
5% compared to before the pandemic, absorbing
more than one year's fleet growth.
RISK OF AVAILABLE CAPACITY INCREASING
The current congestion on the transpacific route will
take time to unravel, but deployed vessels and the
number of port calls seem to be slowly declining,
which could ease some of the pressure on the
inland infrastructure. We expect these dynamics to
accelerate during the first quarter of 2022, which
will push 8,000-14,999 teu vessels back onto Far
East-Europe and minor routes and increase the total
available capacity. Liner operators will have to
manage available capacity carefully and adjust
gradually as the US congestion eases, while
tonnage providers will face greater re-employment
risk, as the demand outlook seems challenging.
-16
4
24
44
64
2018 2019 2020 2021 2022
Euro area United States China Emerging market economies
-
4
7
11
14
Transpacific services Far East - Europe services Other services
Sources: AXS Marine, Clarksons, IMF, Danish Ship Finance*The difference between the supply delivery times subindex in the purchasing managers’ index (PMI) and acounterfactual, cyclical measure of supply delivery times based on the manufacturing output subindex in the PMI.
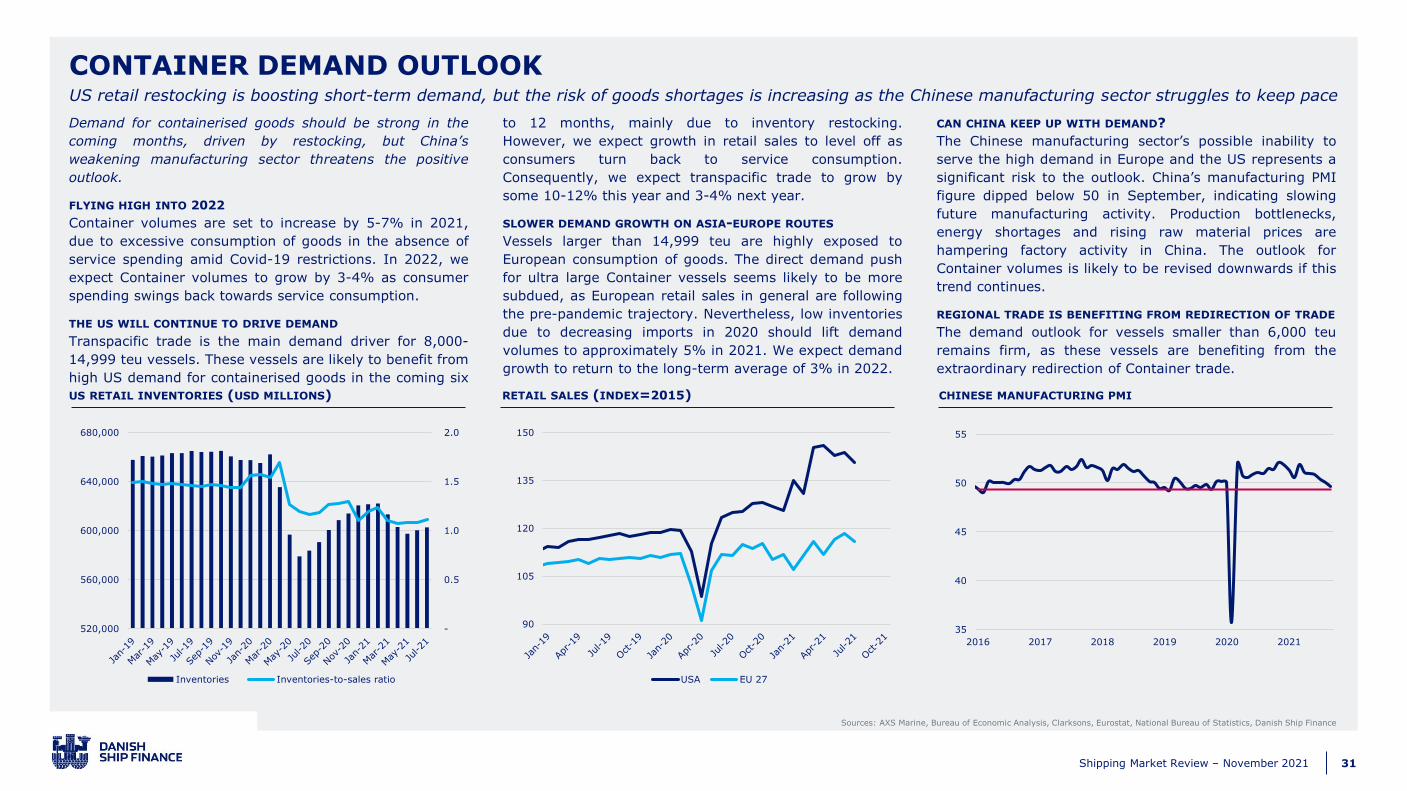
31Shipping Market Review – November 2021
Sources: AXS Marine, Bureau of Economic Analysis, Clarksons, Eurostat, National Bureau of Statistics, Danish Ship Finance
US RETAIL INVENTORIES (USD MILLIONS) RETAIL SALES (INDEX=2015) CHINESE MANUFACTURING PMI
CONTAINER DEMAND OUTLOOKUS retail restocking is boosting short-term demand, but the risk of goods shortages is increasing as the Chinese manufacturing sector struggles to keep pace
Demand for containerised goods should be strong in the
coming months, driven by restocking, but China’s
weakening manufacturing sector threatens the positive
outlook.
FLYING HIGH INTO 2022
Container volumes are set to increase by 5-7% in 2021,
due to excessive consumption of goods in the absence of
service spending amid Covid-19 restrictions. In 2022, we
expect Container volumes to grow by 3-4% as consumer
spending swings back towards service consumption.
THE US WILL CONTINUE TO DRIVE DEMAND
Transpacific trade is the main demand driver for 8,000-
14,999 teu vessels. These vessels are likely to benefit from
high US demand for containerised goods in the coming six
to 12 months, mainly due to inventory restocking.
However, we expect growth in retail sales to level off as
consumers turn back to service consumption.
Consequently, we expect transpacific trade to grow by
some 10-12% this year and 3-4% next year.
SLOWER DEMAND GROWTH ON ASIA-EUROPE ROUTES
Vessels larger than 14,999 teu are highly exposed to
European consumption of goods. The direct demand push
for ultra large Container vessels seems likely to be more
subdued, as European retail sales in general are following
the pre-pandemic trajectory. Nevertheless, low inventories
due to decreasing imports in 2020 should lift demand
volumes to approximately 5% in 2021. We expect demand
growth to return to the long-term average of 3% in 2022.
CAN CHINA KEEP UP WITH DEMAND?
The Chinese manufacturing sector’s possible inability to
serve the high demand in Europe and the US represents a
significant risk to the outlook. China’s manufacturing PMI
figure dipped below 50 in September, indicating slowing
future manufacturing activity. Production bottlenecks,
energy shortages and rising raw material prices are
hampering factory activity in China. The outlook for
Container volumes is likely to be revised downwards if this
trend continues.
REGIONAL TRADE IS BENEFITING FROM REDIRECTION OF TRADE
The demand outlook for vessels smaller than 6,000 teu
remains firm, as these vessels are benefiting from the
extraordinary redirection of Container trade.
35
40
45
50
55
2016 2017 2018 2019 2020 2021
-
0.5
1.0
1.5
2.0
520,000
560,000
600,000
640,000
680,000
Inventories Inventories-to-sales ratio
90
105
120
135
150
USA EU 27

32Shipping Market Review – November 2021
US spending on goods has been the main growth driver for the Container market, but
consumption is slowly shifting towards services. Meanwhile, performance indicators show
a potential weakening of the US economy. Both factors threaten to dampen long-term
demand growth substantially.
INCREASED US CONSUMPTION OF GOODS DURING THE PANDEMIC
The surge in Container demand is mainly attributable to US imports. On average, monthly
transpacific Container trade has increased by 18% year-on-year since January 2020. The
same figure for Far East-Europe trade is 3%. The main driver of the high US imports is a
redirection of consumer spending towards containerised goods and away from contact-
intensive activities owing to social distancing. Fuelled by government stimulus cheques,
US consumer spending on goods has increased by 20% compared to pre-pandemic levels.
SIGNS OF A REBOUND IN SERVICE SPENDING
US consumption of goods peaked in April 2021, when around 36% of spending was on
goods, compared to 30% in January 2020, highlighting the shift from services to goods
spending during the pandemic. However, while services spending has increased for six
consecutive months, consumption of goods has stagnated. In other words, Americans are
returning to restaurants and holiday resorts while keeping their budgets for clothing and
household equipment steady.
GOODS CONSUMPTION WILL DECREASE AS THE VACCINATION RATE INCREASES
Still, only 57% of the US population has been fully vaccinated as of October 2021 and the
number of new Covid-19 cases is only just starting to decline after a new wave of Covid-
19 hit the country in August. The number of vaccinated people is still increasing (albeit at
a slow pace), and as the number rises, contact-intensive services will be considered safer
to enjoy. We expect this to propel spending back from goods to services and normalise
the economy after the severe disruption by the pandemic.
KEY PERFORMANCE INDICATORS IN US ECONOMY HIGHLIGHT FUTURE RISK
A range of risk factors are building up and threatening the economic recovery in the US,
which could potentially reduce overall consumer spending. The US labour force is still
down by 3.1 million people compared to pre-pandemic levels. The unemployment figure
has remained steady despite the recent growth in service activity, indicating that the
higher unemployment could be more entrenched than expected. If this proves the case,
the inflation rate may not decrease from the current high levels. While fewer employed
people mean a smaller consumer base, higher inflation reduces the purchasing power of
the current consumer base if salary growth does not keep pace.
LOW LONG-TERM DEMAND GROWTH
Multiple factors point to a slowdown in US consumption of goods, and thereby hampering
the main growth driver for the Container market. Consequently, we expect the Container
demand boom to level off gradually during 2022. Beyond 2022, we see an increasing risk
of a demand growth rate below the historical average of 3%. This raises the long-term
unemployment risk for vessels larger than 12,000-14,999 teu (the preferred size on
transpacific trades), which is likely to affect all vessels larger than 8,000 teu.
DEMAND DEEP DIVE: US CONSUMPTION OF CONTAINERISED GOODS
Source: AXS Marine, IMF, USAFacts, U.S. Bureau of Economic Analysis, U.S. Census Bureau and Danish Ship Finance
The excessive increase in US demand for containerised goods seems to be levelling off and long-term demand growth looks challenged
US CONSUMER SPENDING (USD BILLION)
27%
30%
33%
36%
39%
0
1,500
3,000
4,500
6,000
Goods consumption Goods consumption as a share of total consumption

33Shipping Market Review – November 2021
DRY BULK
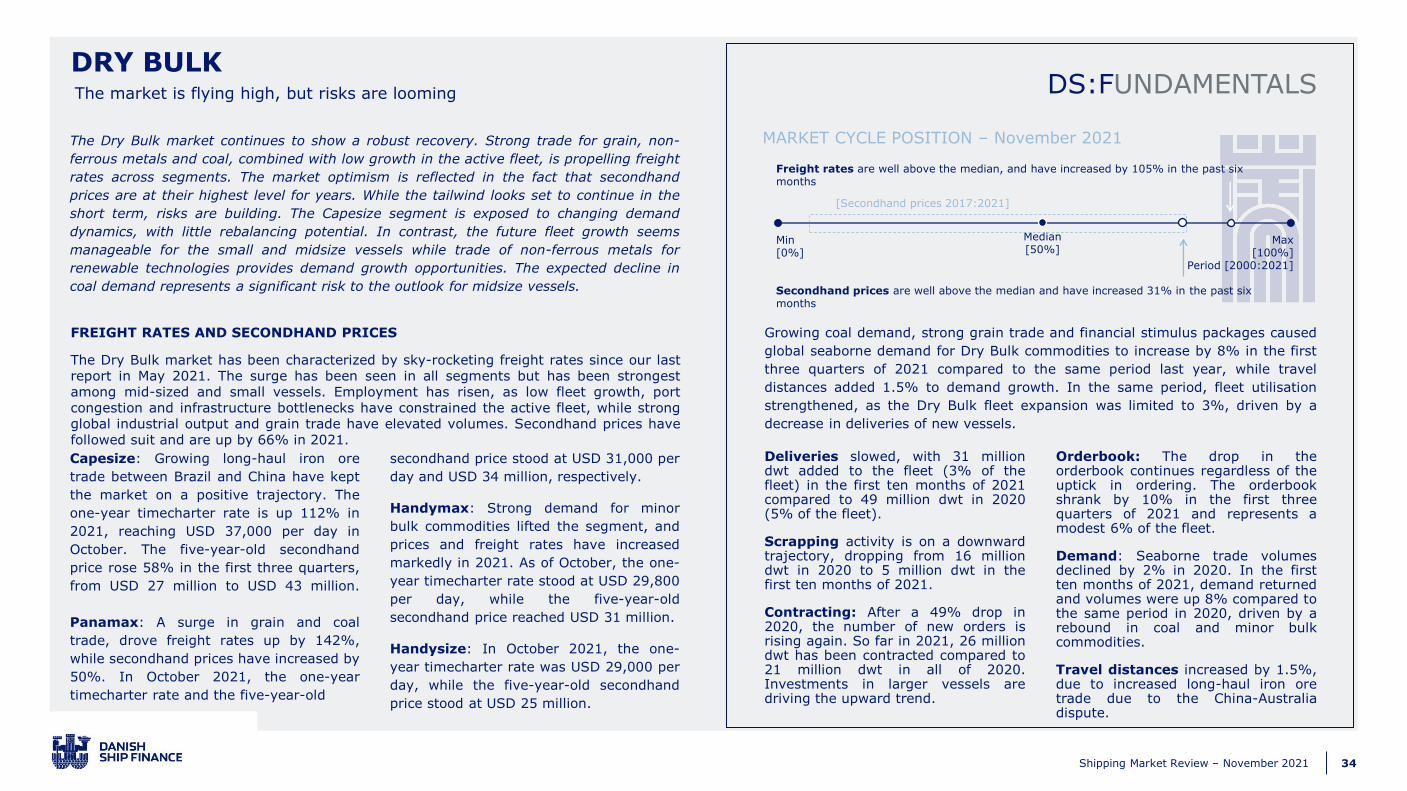
34Shipping Market Review – November 2021
DS:FUNDAMENTALS
Min[0%]
Max[100%]
Period [2000:2021]
Median[50%]
[Secondhand prices 2017:2021]
Freight rates are well above the median, and have increased by 105% in the past six months
Secondhand prices are well above the median and have increased 31% in the past six months
MARKET CYCLE POSITION – November 2021
The market is flying high, but risks are looming
DRY BULK
The Dry Bulk market continues to show a robust recovery. Strong trade for grain, non-
ferrous metals and coal, combined with low growth in the active fleet, is propelling freight
rates across segments. The market optimism is reflected in the fact that secondhand
prices are at their highest level for years. While the tailwind looks set to continue in the
short term, risks are building. The Capesize segment is exposed to changing demand
dynamics, with little rebalancing potential. In contrast, the future fleet growth seems
manageable for the small and midsize vessels while trade of non-ferrous metals for
renewable technologies provides demand growth opportunities. The expected decline in
coal demand represents a significant risk to the outlook for midsize vessels.
FREIGHT RATES AND SECONDHAND PRICES
The Dry Bulk market has been characterized by sky-rocketing freight rates since our lastreport in May 2021. The surge has been seen in all segments but has been strongestamong mid-sized and small vessels. Employment has risen, as low fleet growth, portcongestion and infrastructure bottlenecks have constrained the active fleet, while strongglobal industrial output and grain trade have elevated volumes. Secondhand prices havefollowed suit and are up by 66% in 2021.
Growing coal demand, strong grain trade and financial stimulus packages caused
global seaborne demand for Dry Bulk commodities to increase by 8% in the first
three quarters of 2021 compared to the same period last year, while travel
distances added 1.5% to demand growth. In the same period, fleet utilisation
strengthened, as the Dry Bulk fleet expansion was limited to 3%, driven by a
decrease in deliveries of new vessels.
Deliveries slowed, with 31 milliondwt added to the fleet (3% of thefleet) in the first ten months of 2021compared to 49 million dwt in 2020(5% of the fleet).
Scrapping activity is on a downwardtrajectory, dropping from 16 milliondwt in 2020 to 5 million dwt in thefirst ten months of 2021.
Contracting: After a 49% drop in2020, the number of new orders isrising again. So far in 2021, 26 milliondwt has been contracted compared to21 million dwt in all of 2020.Investments in larger vessels aredriving the upward trend.
Orderbook: The drop in theorderbook continues regardless of theuptick in ordering. The orderbookshrank by 10% in the first threequarters of 2021 and represents amodest 6% of the fleet.
Demand: Seaborne trade volumesdeclined by 2% in 2020. In the firstten months of 2021, demand returnedand volumes were up 8% compared tothe same period in 2020, driven by arebound in coal and minor bulkcommodities.
Travel distances increased by 1.5%,due to increased long-haul iron oretrade due to the China-Australiadispute.
Capesize: Growing long-haul iron ore
trade between Brazil and China have kept
the market on a positive trajectory. The
one-year timecharter rate is up 112% in
2021, reaching USD 37,000 per day in
October. The five-year-old secondhand
price rose 58% in the first three quarters,
from USD 27 million to USD 43 million.
Panamax: A surge in grain and coal
trade, drove freight rates up by 142%,
while secondhand prices have increased by
50%. In October 2021, the one-year
timecharter rate and the five-year-old
secondhand price stood at USD 31,000 per
day and USD 34 million, respectively.
Handymax: Strong demand for minor
bulk commodities lifted the segment, and
prices and freight rates have increased
markedly in 2021. As of October, the one-
year timecharter rate stood at USD 29,800
per day, while the five-year-old
secondhand price reached USD 31 million.
Handysize: In October 2021, the one-
year timecharter rate was USD 29,000 per
day, while the five-year-old secondhand
price stood at USD 25 million.
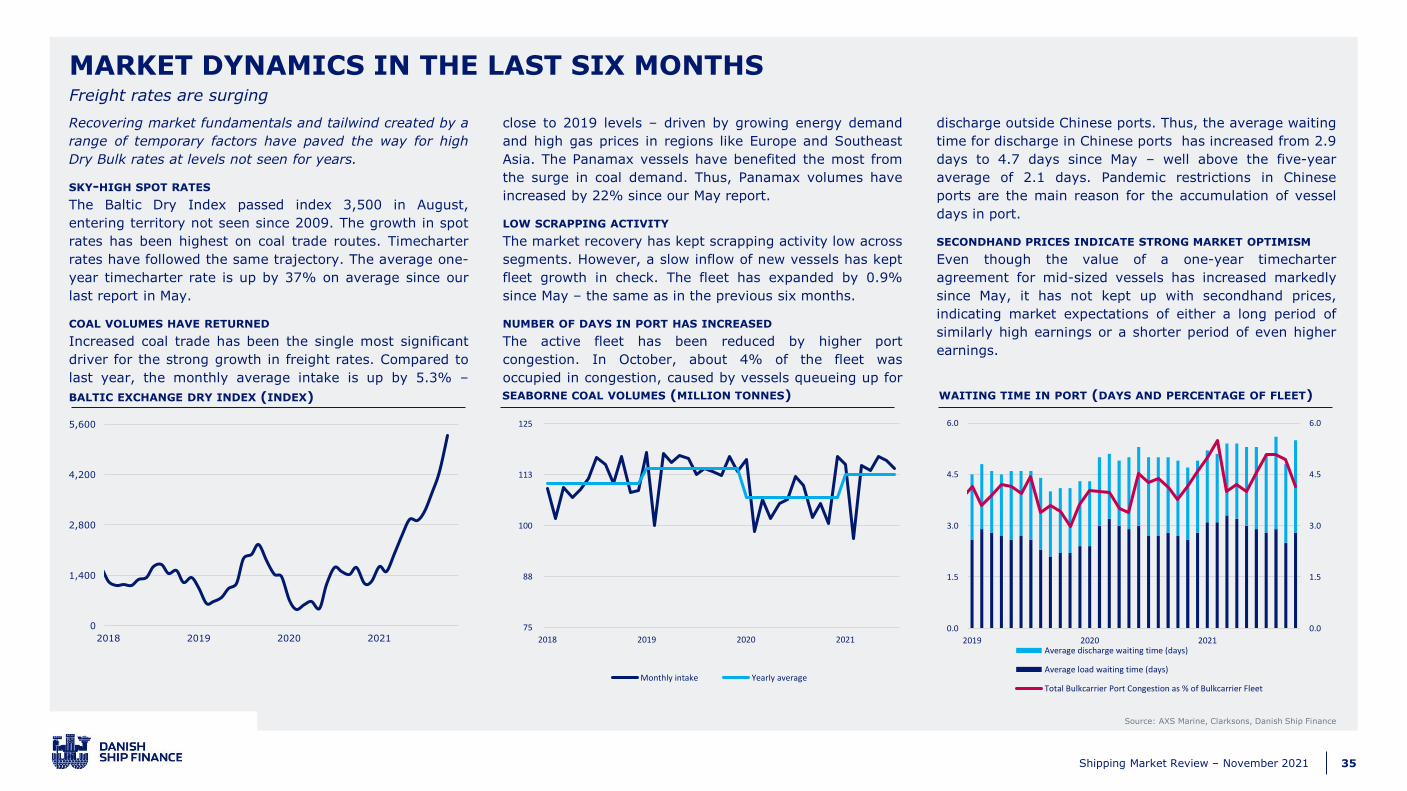
35Shipping Market Review – November 2021
Source: AXS Marine, Clarksons, Danish Ship Finance
BALTIC EXCHANGE DRY INDEX (INDEX) SEABORNE COAL VOLUMES (MILLION TONNES) WAITING TIME IN PORT (DAYS AND PERCENTAGE OF FLEET)
MARKET DYNAMICS IN THE LAST SIX MONTHSFreight rates are surging
Recovering market fundamentals and tailwind created by a
range of temporary factors have paved the way for high
Dry Bulk rates at levels not seen for years.
SKY-HIGH SPOT RATES
The Baltic Dry Index passed index 3,500 in August,
entering territory not seen since 2009. The growth in spot
rates has been highest on coal trade routes. Timecharter
rates have followed the same trajectory. The average one-
year timecharter rate is up by 37% on average since our
last report in May.
COAL VOLUMES HAVE RETURNED
Increased coal trade has been the single most significant
driver for the strong growth in freight rates. Compared to
last year, the monthly average intake is up by 5.3% –
close to 2019 levels – driven by growing energy demand
and high gas prices in regions like Europe and Southeast
Asia. The Panamax vessels have benefited the most from
the surge in coal demand. Thus, Panamax volumes have
increased by 22% since our May report.
LOW SCRAPPING ACTIVITY
The market recovery has kept scrapping activity low across
segments. However, a slow inflow of new vessels has kept
fleet growth in check. The fleet has expanded by 0.9%
since May – the same as in the previous six months.
NUMBER OF DAYS IN PORT HAS INCREASED
The active fleet has been reduced by higher port
congestion. In October, about 4% of the fleet was
occupied in congestion, caused by vessels queueing up for
discharge outside Chinese ports. Thus, the average waiting
time for discharge in Chinese ports has increased from 2.9
days to 4.7 days since May – well above the five-year
average of 2.1 days. Pandemic restrictions in Chinese
ports are the main reason for the accumulation of vessel
days in port.
SECONDHAND PRICES INDICATE STRONG MARKET OPTIMISM
Even though the value of a one-year timecharter
agreement for mid-sized vessels has increased markedly
since May, it has not kept up with secondhand prices,
indicating market expectations of either a long period of
similarly high earnings or a shorter period of even higher
earnings.
0
1,400
2,800
4,200
5,600
2018 2019 2020 2021 75
88
100
113
125
2018 2019 2020 2021
Monthly intake Yearly average
0.0
1.5
3.0
4.5
6.0
0.0
1.5
3.0
4.5
6.0
2019 2020 2021Average discharge waiting time (days)
Average load waiting time (days)
Total Bulkcarrier Port Congestion as % of Bulkcarrier Fleet
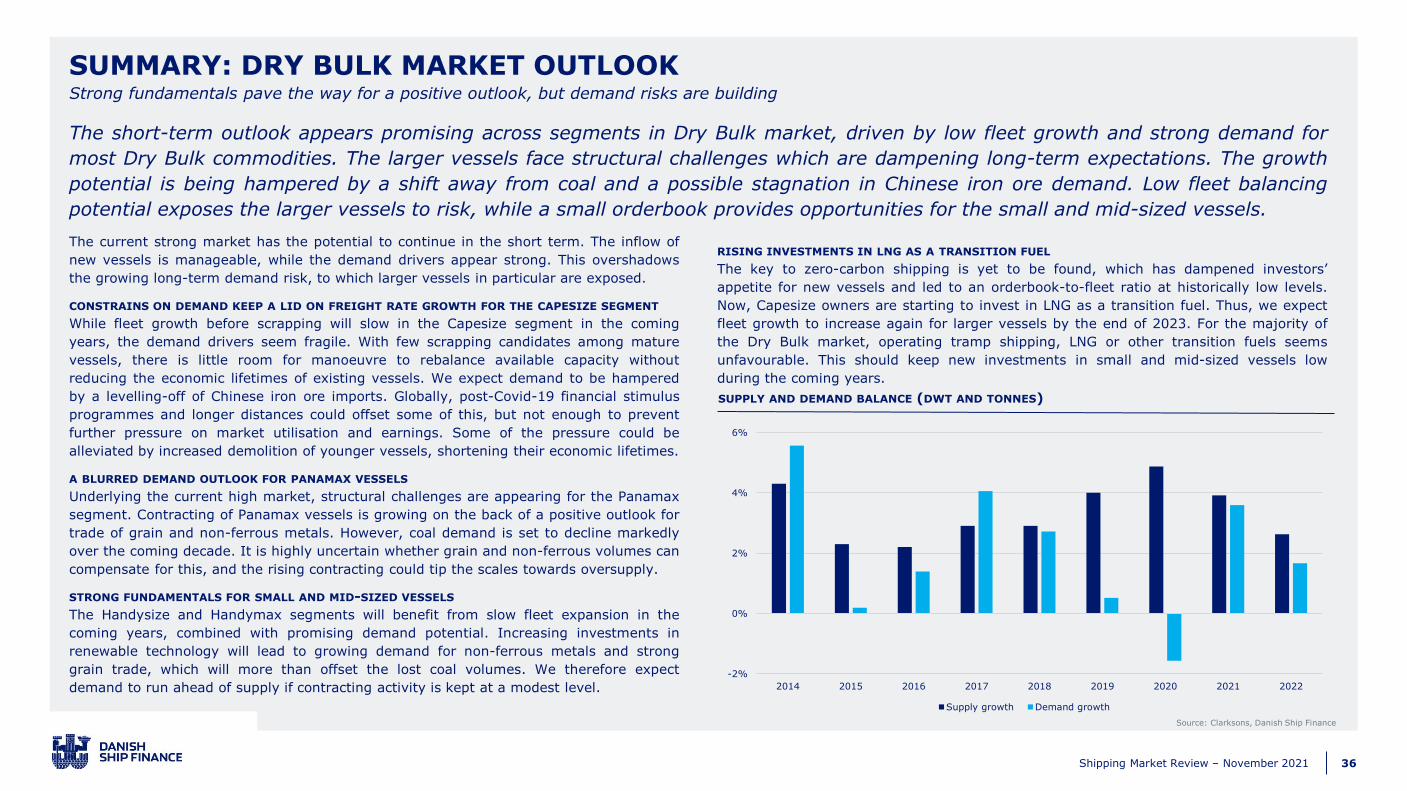
36Shipping Market Review – November 2021
The current strong market has the potential to continue in the short term. The inflow of
new vessels is manageable, while the demand drivers appear strong. This overshadows
the growing long-term demand risk, to which larger vessels in particular are exposed.
CONSTRAINS ON DEMAND KEEP A LID ON FREIGHT RATE GROWTH FOR THE CAPESIZE SEGMENT
While fleet growth before scrapping will slow in the Capesize segment in the coming
years, the demand drivers seem fragile. With few scrapping candidates among mature
vessels, there is little room for manoeuvre to rebalance available capacity without
reducing the economic lifetimes of existing vessels. We expect demand to be hampered
by a levelling-off of Chinese iron ore imports. Globally, post-Covid-19 financial stimulus
programmes and longer distances could offset some of this, but not enough to prevent
further pressure on market utilisation and earnings. Some of the pressure could be
alleviated by increased demolition of younger vessels, shortening their economic lifetimes.
A BLURRED DEMAND OUTLOOK FOR PANAMAX VESSELS
Underlying the current high market, structural challenges are appearing for the Panamax
segment. Contracting of Panamax vessels is growing on the back of a positive outlook for
trade of grain and non-ferrous metals. However, coal demand is set to decline markedly
over the coming decade. It is highly uncertain whether grain and non-ferrous volumes can
compensate for this, and the rising contracting could tip the scales towards oversupply.
STRONG FUNDAMENTALS FOR SMALL AND MID-SIZED VESSELS
The Handysize and Handymax segments will benefit from slow fleet expansion in the
coming years, combined with promising demand potential. Increasing investments in
renewable technology will lead to growing demand for non-ferrous metals and strong
grain trade, which will more than offset the lost coal volumes. We therefore expect
demand to run ahead of supply if contracting activity is kept at a modest level.
RISING INVESTMENTS IN LNG AS A TRANSITION FUEL
The key to zero-carbon shipping is yet to be found, which has dampened investors’
appetite for new vessels and led to an orderbook-to-fleet ratio at historically low levels.
Now, Capesize owners are starting to invest in LNG as a transition fuel. Thus, we expect
fleet growth to increase again for larger vessels by the end of 2023. For the majority of
the Dry Bulk market, operating tramp shipping, LNG or other transition fuels seems
unfavourable. This should keep new investments in small and mid-sized vessels low
during the coming years.
SUMMARY: DRY BULK MARKET OUTLOOK
Source: Clarksons, Danish Ship Finance
Strong fundamentals pave the way for a positive outlook, but demand risks are building
SUPPLY AND DEMAND BALANCE (DWT AND TONNES)
The short-term outlook appears promising across segments in Dry Bulk market, driven by low fleet growth and strong demand for
most Dry Bulk commodities. The larger vessels face structural challenges which are dampening long-term expectations. The growth
potential is being hampered by a shift away from coal and a possible stagnation in Chinese iron ore demand. Low fleet balancing
potential exposes the larger vessels to risk, while a small orderbook provides opportunities for the small and mid-sized vessels.
-2%
0%
2%
4%
6%
2014 2015 2016 2017 2018 2019 2020 2021 2022
Supply growth Demand growth

37Shipping Market Review – November 2021
Source: Clarksons, Danish Ship Finance
AGE DISTRIBUTION OF FLEET (MILLION DWT) FLEET DEVELOPMENT (MILLION DWT) FLEET RENEWAL POTENTIAL (DWT)
DRY BULK FLEET OUTLOOKLow fleet growth will shape the segment in the coming years
A small orderbook will keep fleet growth low in the next
12-18 months, but a renewed appetite for investing in
newbuildings could increase long-term fleet growth.
LOW FLEET GROWTH IN THE SHORT TERM
A historically low orderbook means fleet growth will be
manageable in most parts of the Dry Bulk market in the
coming years. In 2021 and 2022, the fleet is set to grow
by 4% and 3%, respectively, before scrapping. In 2022,
we expect the active fleet to grow by an additional 3% as
port congestion eases.
A LACK OF SCRAPPING POTENTIAL IN THE CAPESIZE FLEET
The inflow of new vessels to the Capesize fleet will slow in
the coming months, but a lack of scrapping candidates will
keep fleet growth at a moderate level. Only 39 Capesize
vessels are older than 20 years – of these, 14 are due for
special survey next year. These vessels represent 0.7% of
the existing fleet capacity. Scrapping these will only reduce
Capesize fleet growth to 3.7% by the end of 2022. In
addition, we expect Capesize scrapping activity to be even
less, as the current high market makes it less attractive for
owners to scrap their vessels. This exposes the Capesize
vessels to increased risk of unemployment if future
demand growth fails to materialise.
A CONSTANT INFLOW OF MID-SIZED VESSELS
In contrast to the Capesize fleet, the inflow of new
Panamax and Handymax vessels will remain stable over
the coming 14 months. By 2022, 145 and 178 vessels
(corresponding to 3% and 4% of the fleet) will enter the
Panamax and Handymax fleets, respectively. The
rebalancing potential is promising, but this is likely to be
neutralised by 2-4% growth in the active fleet as waiting
time in ports normalises. Thus, we expect the mid-sized
fleet to continue expanding by 3-4% in the coming years.
AN INCREASE IN LONG-TERM FLEET GROWTH
Some of the unusually high Dry Bulk earnings currently are
being reinvested in newbuilding contracts. By October,
contracting activity was up 55% versus the same period
last year, driven by the Capesize and Panamax segments.
The orderbook will grow by approximately 2 percentage
points if this trend continues until year-end. We believe
this trend will continue in 2022. Consequently, we expect
fleet growth to increase from 2024 onwards.
Fleet growth
21%
35%
27%
9%
5%
2%
6%
-
100.00
200.00
300.00
400.00
0-5 5-10 10-15 15-20 20-25 25+
Orderbook
Percentage of fleet
4% 2% 2%
3%
3%
4%
5%
4%
3%
1%
-40
-15
10
35
60
2014 2015 2016 2017 2018 2019 2020 2021 2022 2023
Capesize Panamax Handymax Handysize Orderbook
Capesize
Panamax
Handymax
Handysize0
1.2
2.4
3.6
4.8
0.0% 2.0% 4.0% 6.0% 8.0%
Ord
erb
oo
k /
fle
et
>2
0 y
rs
Orderbook/fleet
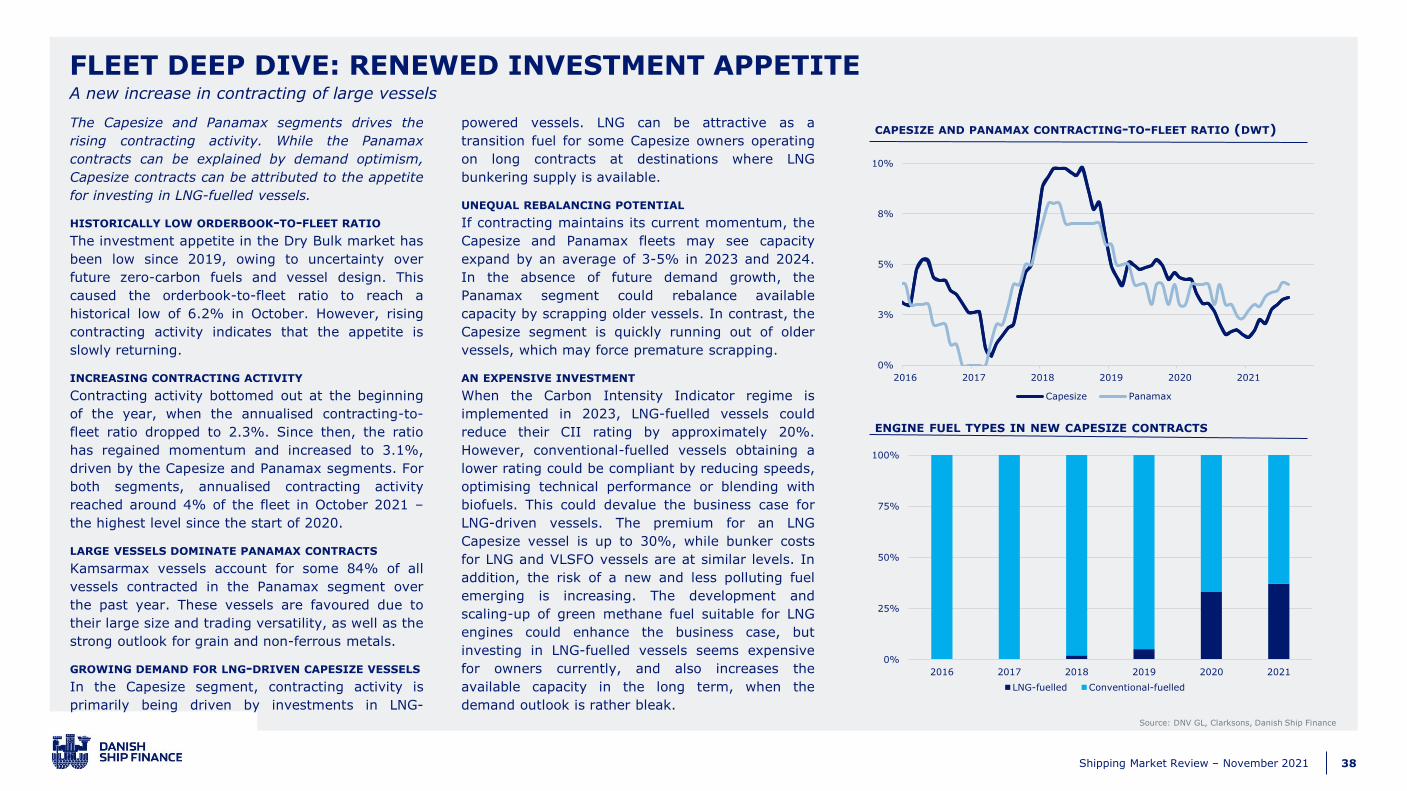
38Shipping Market Review – November 2021
CAPESIZE AND PANAMAX CONTRACTING-TO-FLEET RATIO (DWT)
FLEET DEEP DIVE: RENEWED INVESTMENT APPETITE A new increase in contracting of large vessels
0%
3%
5%
8%
10%
2016 2017 2018 2019 2020 2021
Capesize Panamax
The Capesize and Panamax segments drives the
rising contracting activity. While the Panamax
contracts can be explained by demand optimism,
Capesize contracts can be attributed to the appetite
for investing in LNG-fuelled vessels.
HISTORICALLY LOW ORDERBOOK-TO-FLEET RATIO
The investment appetite in the Dry Bulk market has
been low since 2019, owing to uncertainty over
future zero-carbon fuels and vessel design. This
caused the orderbook-to-fleet ratio to reach a
historical low of 6.2% in October. However, rising
contracting activity indicates that the appetite is
slowly returning.
INCREASING CONTRACTING ACTIVITY
Contracting activity bottomed out at the beginning
of the year, when the annualised contracting-to-
fleet ratio dropped to 2.3%. Since then, the ratio
has regained momentum and increased to 3.1%,
driven by the Capesize and Panamax segments. For
both segments, annualised contracting activity
reached around 4% of the fleet in October 2021 –
the highest level since the start of 2020.
LARGE VESSELS DOMINATE PANAMAX CONTRACTS
Kamsarmax vessels account for some 84% of all
vessels contracted in the Panamax segment over
the past year. These vessels are favoured due to
their large size and trading versatility, as well as the
strong outlook for grain and non-ferrous metals.
GROWING DEMAND FOR LNG-DRIVEN CAPESIZE VESSELS
In the Capesize segment, contracting activity is
primarily being driven by investments in LNG-
powered vessels. LNG can be attractive as a
transition fuel for some Capesize owners operating
on long contracts at destinations where LNG
bunkering supply is available.
UNEQUAL REBALANCING POTENTIAL
If contracting maintains its current momentum, the
Capesize and Panamax fleets may see capacity
expand by an average of 3-5% in 2023 and 2024.
In the absence of future demand growth, the
Panamax segment could rebalance available
capacity by scrapping older vessels. In contrast, the
Capesize segment is quickly running out of older
vessels, which may force premature scrapping.
AN EXPENSIVE INVESTMENT
When the Carbon Intensity Indicator regime is
implemented in 2023, LNG-fuelled vessels could
reduce their CII rating by approximately 20%.
However, conventional-fuelled vessels obtaining a
lower rating could be compliant by reducing speeds,
optimising technical performance or blending with
biofuels. This could devalue the business case for
LNG-driven vessels. The premium for an LNG
Capesize vessel is up to 30%, while bunker costs
for LNG and VLSFO vessels are at similar levels. In
addition, the risk of a new and less polluting fuel
emerging is increasing. The development and
scaling-up of green methane fuel suitable for LNG
engines could enhance the business case, but
investing in LNG-fuelled vessels seems expensive
for owners currently, and also increases the
available capacity in the long term, when the
demand outlook is rather bleak.
ENGINE FUEL TYPES IN NEW CAPESIZE CONTRACTS
Source: DNV GL, Clarksons, Danish Ship Finance
0%
25%
50%
75%
100%
2016 2017 2018 2019 2020 2021
LNG-fuelled Conventional-fuelled
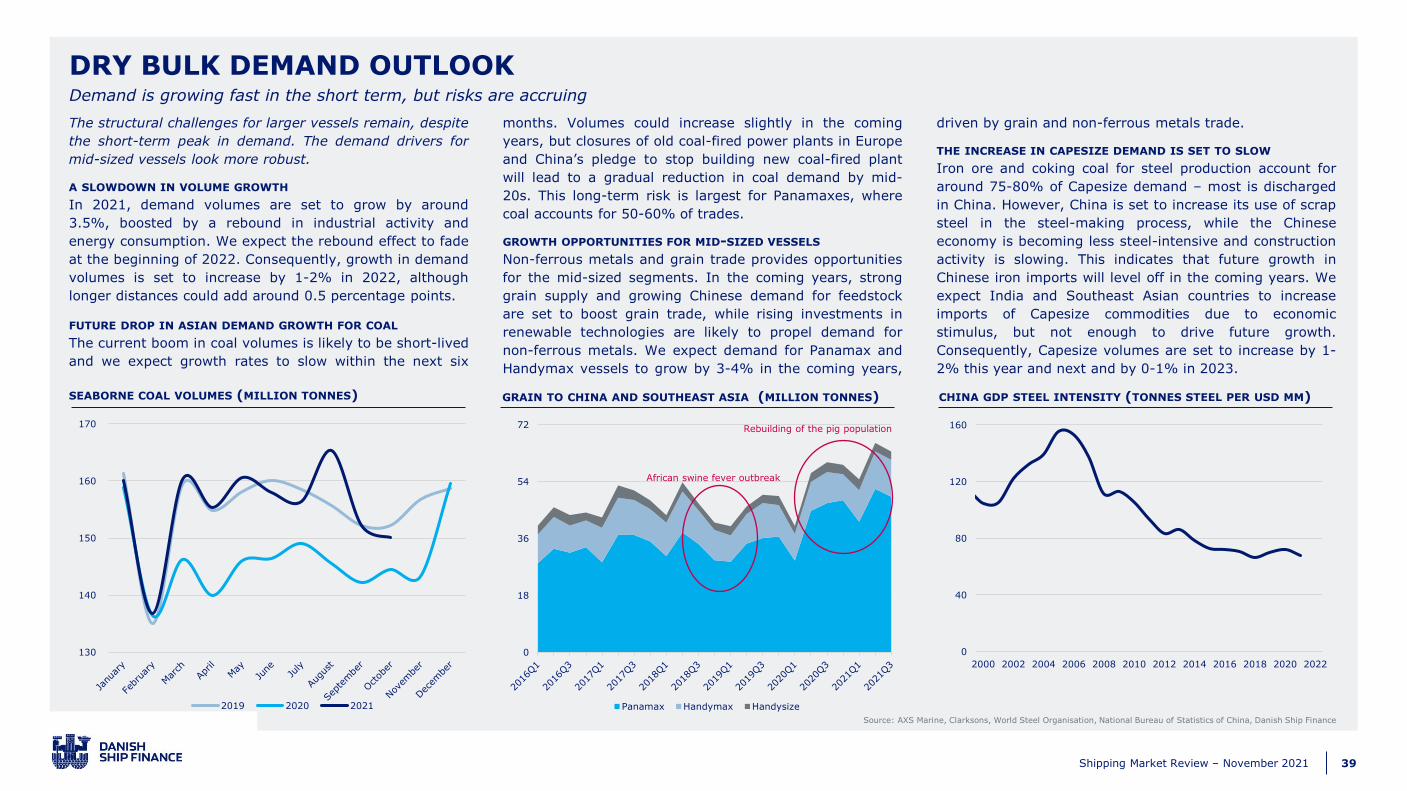
39Shipping Market Review – November 2021
Source: AXS Marine, Clarksons, World Steel Organisation, National Bureau of Statistics of China, Danish Ship Finance
SEABORNE COAL VOLUMES (MILLION TONNES) GRAIN TO CHINA AND SOUTHEAST ASIA (MILLION TONNES) CHINA GDP STEEL INTENSITY (TONNES STEEL PER USD MM)
DRY BULK DEMAND OUTLOOKDemand is growing fast in the short term, but risks are accruing
The structural challenges for larger vessels remain, despite
the short-term peak in demand. The demand drivers for
mid-sized vessels look more robust.
A SLOWDOWN IN VOLUME GROWTH
In 2021, demand volumes are set to grow by around
3.5%, boosted by a rebound in industrial activity and
energy consumption. We expect the rebound effect to fade
at the beginning of 2022. Consequently, growth in demand
volumes is set to increase by 1-2% in 2022, although
longer distances could add around 0.5 percentage points.
FUTURE DROP IN ASIAN DEMAND GROWTH FOR COAL
The current boom in coal volumes is likely to be short-lived
and we expect growth rates to slow within the next six
months. Volumes could increase slightly in the coming
years, but closures of old coal-fired power plants in Europe
and China’s pledge to stop building new coal-fired plant
will lead to a gradual reduction in coal demand by mid-
20s. This long-term risk is largest for Panamaxes, where
coal accounts for 50-60% of trades.
GROWTH OPPORTUNITIES FOR MID-SIZED VESSELS
Non-ferrous metals and grain trade provides opportunities
for the mid-sized segments. In the coming years, strong
grain supply and growing Chinese demand for feedstock
are set to boost grain trade, while rising investments in
renewable technologies are likely to propel demand for
non-ferrous metals. We expect demand for Panamax and
Handymax vessels to grow by 3-4% in the coming years,
driven by grain and non-ferrous metals trade.
THE INCREASE IN CAPESIZE DEMAND IS SET TO SLOW
Iron ore and coking coal for steel production account for
around 75-80% of Capesize demand – most is discharged
in China. However, China is set to increase its use of scrap
steel in the steel-making process, while the Chinese
economy is becoming less steel-intensive and construction
activity is slowing. This indicates that future growth in
Chinese iron imports will level off in the coming years. We
expect India and Southeast Asian countries to increase
imports of Capesize commodities due to economic
stimulus, but not enough to drive future growth.
Consequently, Capesize volumes are set to increase by 1-
2% this year and next and by 0-1% in 2023.
0
40
80
120
160
2000 2002 2004 2006 2008 2010 2012 2014 2016 2018 2020 2022
0
18
36
54
72
Panamax Handymax Handysize
African swine fever outbreak
Rebuilding of the pig population
130
140
150
160
170
2019 2020 2021
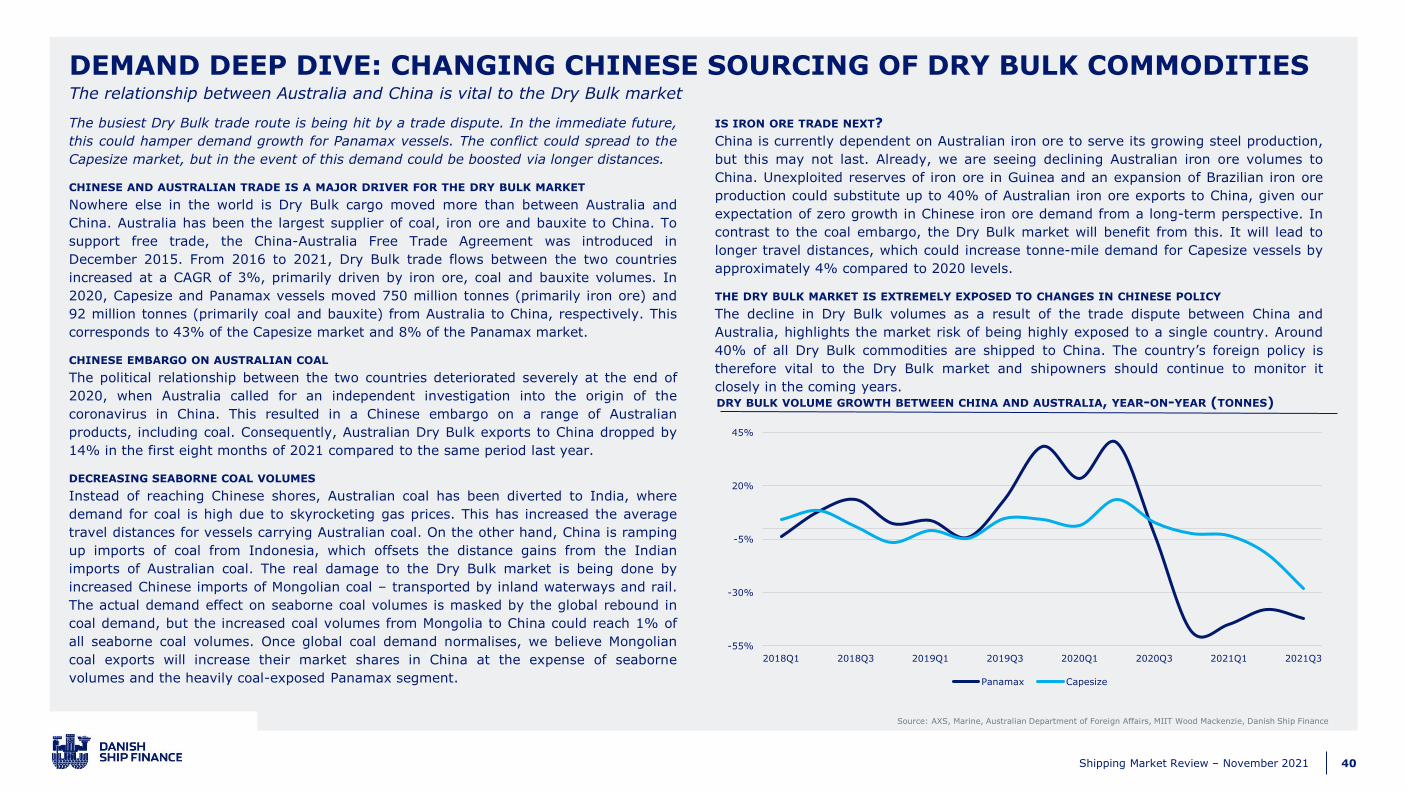
40Shipping Market Review – November 2021
The busiest Dry Bulk trade route is being hit by a trade dispute. In the immediate future,
this could hamper demand growth for Panamax vessels. The conflict could spread to the
Capesize market, but in the event of this demand could be boosted via longer distances.
CHINESE AND AUSTRALIAN TRADE IS A MAJOR DRIVER FOR THE DRY BULK MARKET
Nowhere else in the world is Dry Bulk cargo moved more than between Australia and
China. Australia has been the largest supplier of coal, iron ore and bauxite to China. To
support free trade, the China-Australia Free Trade Agreement was introduced in
December 2015. From 2016 to 2021, Dry Bulk trade flows between the two countries
increased at a CAGR of 3%, primarily driven by iron ore, coal and bauxite volumes. In
2020, Capesize and Panamax vessels moved 750 million tonnes (primarily iron ore) and
92 million tonnes (primarily coal and bauxite) from Australia to China, respectively. This
corresponds to 43% of the Capesize market and 8% of the Panamax market.
CHINESE EMBARGO ON AUSTRALIAN COAL
The political relationship between the two countries deteriorated severely at the end of
2020, when Australia called for an independent investigation into the origin of the
coronavirus in China. This resulted in a Chinese embargo on a range of Australian
products, including coal. Consequently, Australian Dry Bulk exports to China dropped by
14% in the first eight months of 2021 compared to the same period last year.
DECREASING SEABORNE COAL VOLUMES
Instead of reaching Chinese shores, Australian coal has been diverted to India, where
demand for coal is high due to skyrocketing gas prices. This has increased the average
travel distances for vessels carrying Australian coal. On the other hand, China is ramping
up imports of coal from Indonesia, which offsets the distance gains from the Indian
imports of Australian coal. The real damage to the Dry Bulk market is being done by
increased Chinese imports of Mongolian coal – transported by inland waterways and rail.
The actual demand effect on seaborne coal volumes is masked by the global rebound in
coal demand, but the increased coal volumes from Mongolia to China could reach 1% of
all seaborne coal volumes. Once global coal demand normalises, we believe Mongolian
coal exports will increase their market shares in China at the expense of seaborne
volumes and the heavily coal-exposed Panamax segment.
IS IRON ORE TRADE NEXT?
China is currently dependent on Australian iron ore to serve its growing steel production,
but this may not last. Already, we are seeing declining Australian iron ore volumes to
China. Unexploited reserves of iron ore in Guinea and an expansion of Brazilian iron ore
production could substitute up to 40% of Australian iron ore exports to China, given our
expectation of zero growth in Chinese iron ore demand from a long-term perspective. In
contrast to the coal embargo, the Dry Bulk market will benefit from this. It will lead to
longer travel distances, which could increase tonne-mile demand for Capesize vessels by
approximately 4% compared to 2020 levels.
THE DRY BULK MARKET IS EXTREMELY EXPOSED TO CHANGES IN CHINESE POLICY
The decline in Dry Bulk volumes as a result of the trade dispute between China and
Australia, highlights the market risk of being highly exposed to a single country. Around
40% of all Dry Bulk commodities are shipped to China. The country’s foreign policy is
therefore vital to the Dry Bulk market and shipowners should continue to monitor it
closely in the coming years.
Source: AXS, Marine, Australian Department of Foreign Affairs, MIIT Wood Mackenzie, Danish Ship Finance
The relationship between Australia and China is vital to the Dry Bulk market
DRY BULK VOLUME GROWTH BETWEEN CHINA AND AUSTRALIA, YEAR-ON-YEAR (TONNES)
DEMAND DEEP DIVE: CHANGING CHINESE SOURCING OF DRY BULK COMMODITIES
-55%
-30%
-5%
20%
45%
2018Q1 2018Q3 2019Q1 2019Q3 2020Q1 2020Q3 2021Q1 2021Q3
Panamax Capesize
41Shipping Market Review – November 2021
CRUDE TANKER
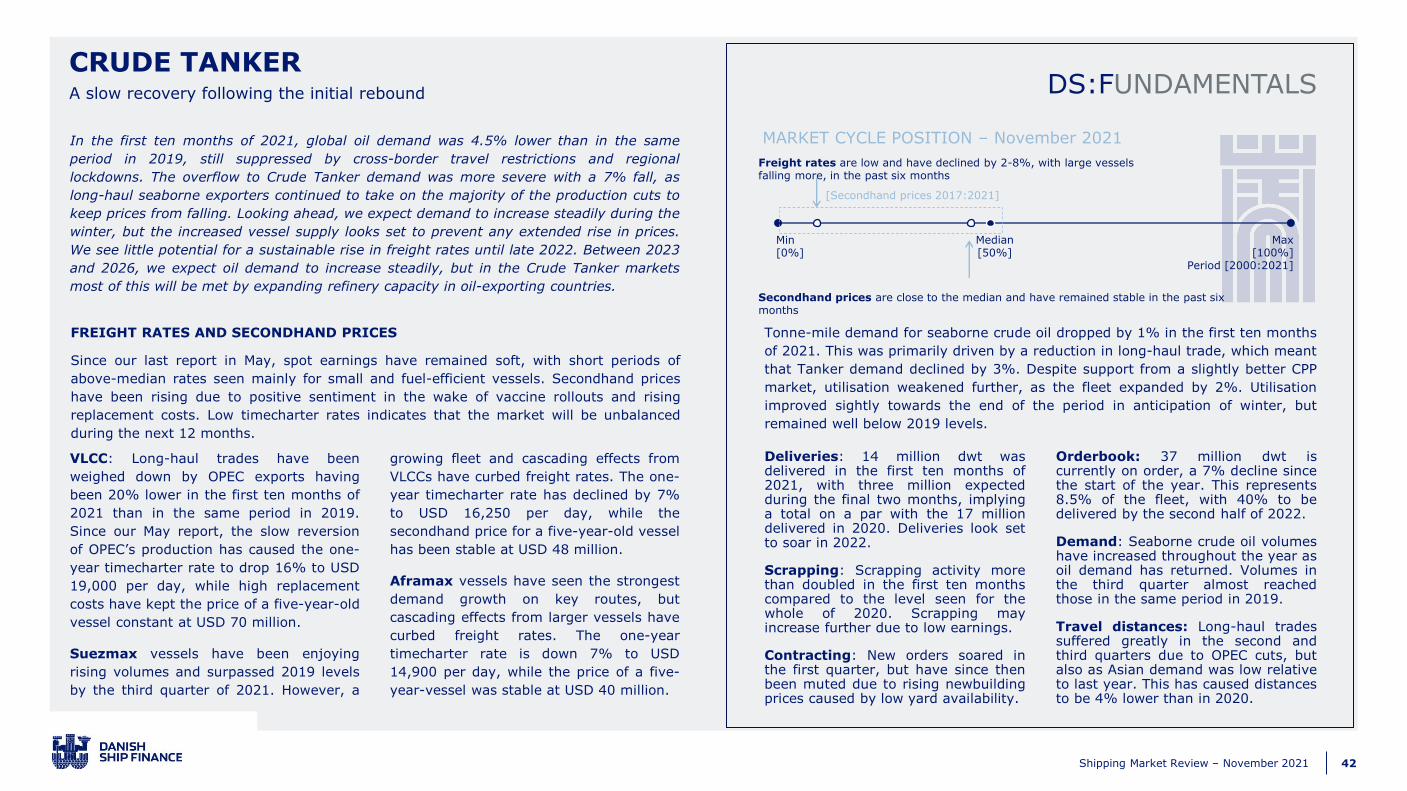
42Shipping Market Review – November 2021
DS:FUNDAMENTALSA slow recovery following the initial rebound
CRUDE TANKER
In the first ten months of 2021, global oil demand was 4.5% lower than in the same
period in 2019, still suppressed by cross-border travel restrictions and regional
lockdowns. The overflow to Crude Tanker demand was more severe with a 7% fall, as
long-haul seaborne exporters continued to take on the majority of the production cuts to
keep prices from falling. Looking ahead, we expect demand to increase steadily during the
winter, but the increased vessel supply looks set to prevent any extended rise in prices.
We see little potential for a sustainable rise in freight rates until late 2022. Between 2023
and 2026, we expect oil demand to increase steadily, but in the Crude Tanker markets
most of this will be met by expanding refinery capacity in oil-exporting countries.
FREIGHT RATES AND SECONDHAND PRICES
Since our last report in May, spot earnings have remained soft, with short periods of
above-median rates seen mainly for small and fuel-efficient vessels. Secondhand prices
have been rising due to positive sentiment in the wake of vaccine rollouts and rising
replacement costs. Low timecharter rates indicates that the market will be unbalanced
during the next 12 months.
Tonne-mile demand for seaborne crude oil dropped by 1% in the first ten months
of 2021. This was primarily driven by a reduction in long-haul trade, which meant
that Tanker demand declined by 3%. Despite support from a slightly better CPP
market, utilisation weakened further, as the fleet expanded by 2%. Utilisation
improved sightly towards the end of the period in anticipation of winter, but
remained well below 2019 levels.
Deliveries: 14 million dwt wasdelivered in the first ten months of2021, with three million expectedduring the final two months, implyinga total on a par with the 17 milliondelivered in 2020. Deliveries look setto soar in 2022.
Scrapping: Scrapping activity morethan doubled in the first ten monthscompared to the level seen for thewhole of 2020. Scrapping mayincrease further due to low earnings.
Contracting: New orders soared inthe first quarter, but have since thenbeen muted due to rising newbuildingprices caused by low yard availability.
Orderbook: 37 million dwt iscurrently on order, a 7% decline sincethe start of the year. This represents8.5% of the fleet, with 40% to bedelivered by the second half of 2022.
Demand: Seaborne crude oil volumeshave increased throughout the year asoil demand has returned. Volumes inthe third quarter almost reachedthose in the same period in 2019.
Travel distances: Long-haul tradessuffered greatly in the second andthird quarters due to OPEC cuts, butalso as Asian demand was low relativeto last year. This has caused distancesto be 4% lower than in 2020.
VLCC: Long-haul trades have been
weighed down by OPEC exports having
been 20% lower in the first ten months of
2021 than in the same period in 2019.
Since our May report, the slow reversion
of OPEC’s production has caused the one-
year timecharter rate to drop 16% to USD
19,000 per day, while high replacement
costs have kept the price of a five-year-old
vessel constant at USD 70 million.
Suezmax vessels have been enjoying
rising volumes and surpassed 2019 levels
by the third quarter of 2021. However, a
growing fleet and cascading effects from
VLCCs have curbed freight rates. The one-
year timecharter rate has declined by 7%
to USD 16,250 per day, while the
secondhand price for a five-year-old vessel
has been stable at USD 48 million.
Aframax vessels have seen the strongest
demand growth on key routes, but
cascading effects from larger vessels have
curbed freight rates. The one-year
timecharter rate is down 7% to USD
14,900 per day, while the price of a five-
year-vessel was stable at USD 40 million.
Min[0%]
Max[100%]
Period [2000:2021]
Median[50%]
[Secondhand prices 2017:2021]
Freight rates are low and have declined by 2-8%, with large vessels falling more, in the past six months
Secondhand prices are close to the median and have remained stable in the past six months
MARKET CYCLE POSITION – November 2021
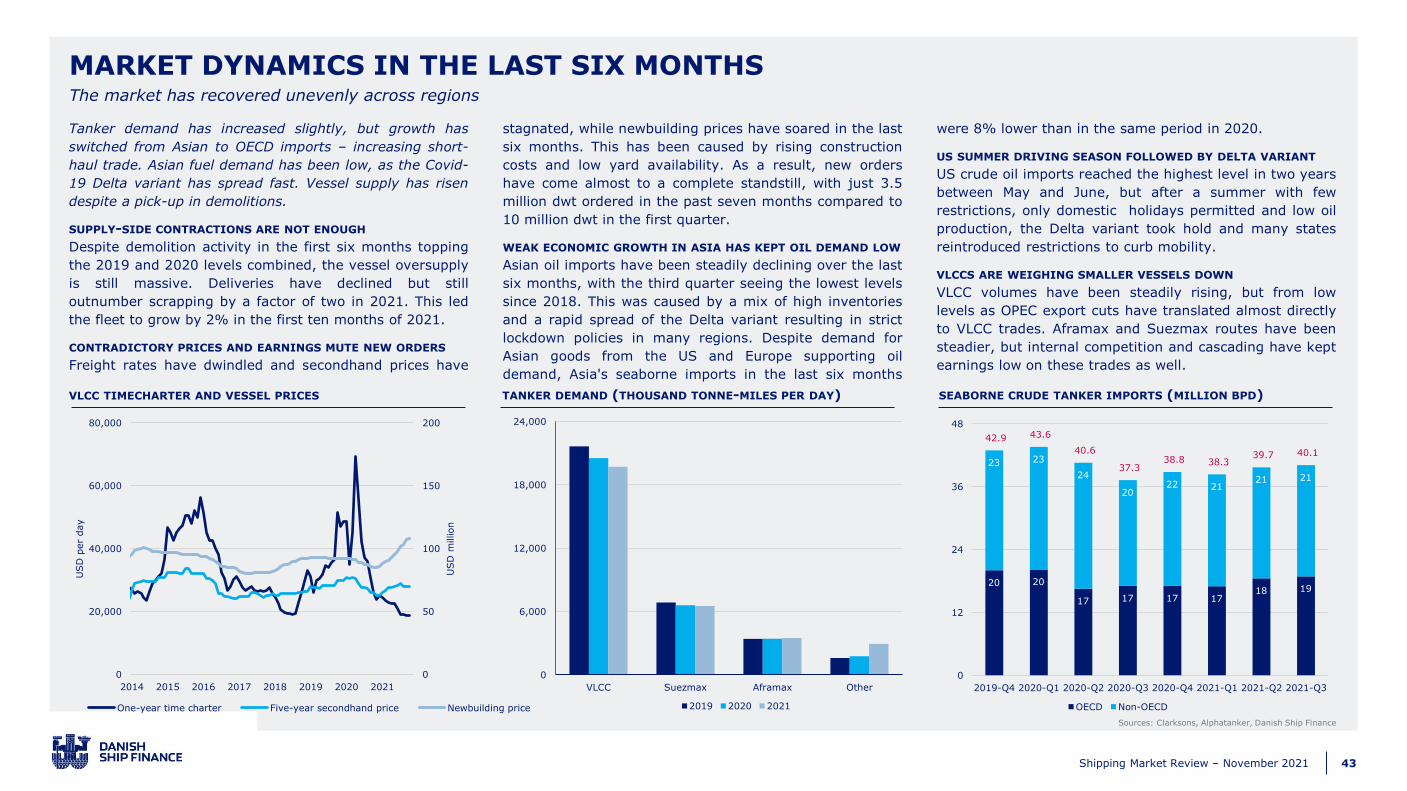
43Shipping Market Review – November 2021
20 20
17 17 17 17 18 19
23 23
24
20 22 21
21 21
42.9 43.6
40.6
37.3 38.8 38.3
39.7 40.1
0
12
24
36
48
2019-Q4 2020-Q1 2020-Q2 2020-Q3 2020-Q4 2021-Q1 2021-Q2 2021-Q3
OECD Non-OECD
Tanker demand has increased slightly, but growth has
switched from Asian to OECD imports – increasing short-
haul trade. Asian fuel demand has been low, as the Covid-
19 Delta variant has spread fast. Vessel supply has risen
despite a pick-up in demolitions.
SUPPLY-SIDE CONTRACTIONS ARE NOT ENOUGH
Despite demolition activity in the first six months topping
the 2019 and 2020 levels combined, the vessel oversupply
is still massive. Deliveries have declined but still
outnumber scrapping by a factor of two in 2021. This led
the fleet to grow by 2% in the first ten months of 2021.
CONTRADICTORY PRICES AND EARNINGS MUTE NEW ORDERS
Freight rates have dwindled and secondhand prices have
stagnated, while newbuilding prices have soared in the last
six months. This has been caused by rising construction
costs and low yard availability. As a result, new orders
have come almost to a complete standstill, with just 3.5
million dwt ordered in the past seven months compared to
10 million dwt in the first quarter.
WEAK ECONOMIC GROWTH IN ASIA HAS KEPT OIL DEMAND LOW
Asian oil imports have been steadily declining over the last
six months, with the third quarter seeing the lowest levels
since 2018. This was caused by a mix of high inventories
and a rapid spread of the Delta variant resulting in strict
lockdown policies in many regions. Despite demand for
Asian goods from the US and Europe supporting oil
demand, Asia's seaborne imports in the last six months
were 8% lower than in the same period in 2020.
US SUMMER DRIVING SEASON FOLLOWED BY DELTA VARIANT
US crude oil imports reached the highest level in two years
between May and June, but after a summer with few
restrictions, only domestic holidays permitted and low oil
production, the Delta variant took hold and many states
reintroduced restrictions to curb mobility.
VLCCS ARE WEIGHING SMALLER VESSELS DOWN
VLCC volumes have been steadily rising, but from low
levels as OPEC export cuts have translated almost directly
to VLCC trades. Aframax and Suezmax routes have been
steadier, but internal competition and cascading have kept
earnings low on these trades as well.
Sources: Clarksons, Alphatanker, Danish Ship Finance
VLCC TIMECHARTER AND VESSEL PRICES TANKER DEMAND (THOUSAND TONNE-MILES PER DAY) SEABORNE CRUDE TANKER IMPORTS (MILLION BPD)
MARKET DYNAMICS IN THE LAST SIX MONTHSThe market has recovered unevenly across regions
0
50
100
150
200
0
20,000
40,000
60,000
80,000
2014 2015 2016 2017 2018 2019 2020 2021
USD
million
USD
per
day
One-year time charter Five-year secondhand price Newbuilding price
0
6,000
12,000
18,000
24,000
VLCC Suezmax Aframax Other
2019 2020 2021

44Shipping Market Review – November 2021
TANKER DEMAND WILL CONTINUE TO TREND UPWARDS THROUGHOUT THE WINTER
80% of oil demand comes from countries that have yet to achieve any kind of herd
immunity. The vaccine rollout continues to accelerate in developing countries and
countries unable to obtain herd immunity have found ways to return to a semblance of
normal life. Still, uncertainty looms regarding further lockdowns as people spend more
time inside. However, we expect the trend of rising tonne-miles in the last six months to
continue throughout the winter, especially as gasoil will be used to replace insufficient
amounts of natural gas in some areas, followed by a seasonal downturn in the spring.
AN EXTREMELY FRONT-LOADED ORDERBOOK WILL BE REPLACED BY A STABLE SUPPLY OUTLOOK
Extreme levels of ordering of Containerships and LNG Carriers has reduced available
shipyard capacity at preferred Crude Tanker shipyards until late 2024. Up to the end of
2022, vessels corresponding to 6% of the fleet are due to be delivered. We have also
identified scrapping candidates equal to 6% of the fleet. Still, demolition of these vessels
would provide little support for freight rates, since only half of them are actively trading.
In 2023, the orderbook will deteriorate sharply, while we expect demand to breach 2019
levels by a few percent. Freight rates are therefore likely to increase from 2023 (if owners
refrain from ordering vessels at second-tier yards and continue to scrap older vessels).
CHINESE SEABORNE OIL IMPORTS COULD BE CLOSE TO PEAKING
Recent restrictive actions taken against private Chinese refineries seem to be a first step
in trimming excess capacity in the industry. It seems unlikely that China will strengthen
its position as a regional refining hub. The initial impact on tankers may be small, as we
expect state entities to fill the gap, but steps towards reducing refined oil product exports
seem inevitable. Chinese oil consumption is expected to grow by just one million bpd
before peaking in 2026. China exports around the same amount of CPP. Therefore,
actions taken to eliminate these could bring Chinese seaborne oil imports close to a peak.
TANKERS RELY ON OIL DEMAND RISING AS REFINERY EXPANSION WILL HAVE NEGATIVE EFFECT
Refineries in export countries are designed to run largely on domestic oil, and with state
interests involved we do not expect large amounts of alternative grades to be imported.
The refinery expansion countries could therefore lower seaborne crude oil volumes by two
million bpd in the next three years (5% of 2019 volumes). This means that growth in
seaborne crude demand from import countries seem to be less than one million bpd.
However, whereas the expansion in import countries will mainly affect VLCCs, half the
contraction in export countries will impact smaller Tankers. This indicates a stronger
outlook for long-haul trade than short-haul for both Crude and Product Tankers.
SUMMARY: CRUDE TANKER MARKET OUTLOOK
Sources: Clarksons, Danish Ship Finance
A sustainable recovery still seems a year away
SUPPLY AND DEMAND BALANCE (DWT AND TONNE-MILE)
The recovery in demand for Crude Tankers will continue throughout the winter, with an extra boost from high natural gas and coal
prices, but we expect the continuous expansion in the fleet to prevent any extended rise in freight rates. Following a seasonal
downturn in the spring, expectations for the second half of 2022 are positive, with oil demand surpassing pre-Covid levels, but a
much larger fleet awaits.
5%
1%
7%
3%
2%
4%
6%
3%
0%
-7%
1%
6%
-10%
-5%
0%
5%
10%
2017 2018 2019 2020 2021 2022
Supply growth Demand growth

45Shipping Market Review – November 2021
The orderbook is dwindling rapidly and low yard availability
is postponing potential fleet renewal. The fleet is likely to
expand ahead of demand this year and in 2022, but fleet
utilisation is expected to improve from 2023.
THE ORDERBOOK OUTWEIGHS SCRAPPING POTENTIAL
The orderbook is currently low, representing 9% of the
fleet, but will add to the excess capacity in the market.
The fleet is scheduled to expand by 6% by year-end 2022.
We have identified scrapping candidates also representing
6% of the fleet for this period.
CONTRACTING IS EXPECTED TO STAY LOW
Just six yards have delivered 90% of VLCCs during the last
five years. These yards are currently occupied with
building Container and LNG Carriers until 2024. Hence,
there is little room for new VLCCs to enter service from
these yards in that period. This has further inflated
newbuilding prices and may lead to owners holding on to
existing tonnage or seeking out the secondhand market.
DEMOLITION ACTIVITY MAY HAVE LIMITED IMPACT ON RATES
Some of the identified scrapping candidates have been
employed as floating storage and others to handle
sanctioned oil. These factors are expected to level off,
exposing vessels to demolition, but the effect on utilisation
from scrapping these vessels will be small. In addition, the
remaining scrapping candidates travel less than half as
much as young vessels in terms of tonne-miles. We
therefore estimate that demolition may only reduce the
fleet by around 3% before end-year 2022. For freight rates
to increase before the end of 2022, demand will have to
outpace current expectations, or more (and younger)
vessels will need to be scrapped.
DUAL-FUEL ENGINES WITH LNG ARE POPULAR AMONG VLCCS
The energy transition creates a bleak long-term outlook for
fossil fuels in general and vessels transporting fossil fuels
in particular. Still, some owners are aiming to help the
transition by ordering LNG-fuelled VLCCs. This is a
relatively new occurrence: 12 months ago, only three
vessels, representing 5% of the orderbook, were LNG
fuelled, while this number has grown to 21 vessels
representing 30% of the orderbook. LNG has been tested
among Aframaxes for a few years, while Suezmaxes have
not gone in that direction yet to any large degree.
Sources: Clarksons, Danish Ship Finance
AGE DISTRIBUTION (MILLION DWT) FLEET DEVELOPMENT (MILLION DWT) CONTRACTING ACTIVITY BY ENGINE TYPE (MILLION DWT)
CRUDE TANKER FLEET OUTLOOKShort-term pain, medium-term gain
25%
18%
29%
20%
7%
1%
9%
0
40
80
120
160
0-5 5-10 10-15 15-20 20-25 25+ Orderbook
Percentage of fleet
0.6% 2.2%
5.9%
5.1%
0.8%
6.6%
3.3%2.5%
4.9%
2.5%
-20
-5
10
25
40
2014 2015 2016 2017 2018 2019 2020 2021 2022 2023
VLCC Suezmax Aframax Orderbook
Fleet growth
0
6
12
18
24
2015 2016 2017 2018 2019 2020 2021
Pure oil fuel Dual-Fuel (LNG)

46Shipping Market Review – November 2021
Sources: Clarksons, IEA, Alphatanker, Danish Ship Finance
NEWBUILDING PRICES (USD MILLION) GLOBAL ORDERBOOK (MILLION CGT) ACTIVE SHIPYARDS WITH CRUDE TANKER EXPERIENCE
FLEET DEEP DIVE: SHIPYARD OUTLOOKContainer and LNG orders are limiting VLCC yard capacity, which may support future earnings when demand returns
The combination of a front-loaded orderbook and a lack of
available yard capacity is creating an abnormal situation
where prices are rising despite low earnings. The low yard
availability is pushing newbuilding prices upwards, while
the market’s strong preference for young and fuel-efficient
fleets is supporting secondhand prices through increased
replacement costs.
PREFERRED YARDS ARE FULL FOR LARGER VESSELS
Six yards representing 25% of global yard capacity have
built 90% of all VLCCs since 2015. Their orderbooks reveal
close to fully booked capacity until mid-2024, longer if
remaining purchase options are exercised. Large LNG
Carriers and Containerships are taking up 75% of capacity
at these yards. Similar trends can be seen for Suezmaxes,
while Aframaxes are less affected.
SHIPYARDS WILL NOT EXPAND CAPACITY
Shipyards have been struggling to handle surplus capacity
during the past decade. A group of first-tier yards,
including the six yards building VLCCs, have been growing
via horizontal integration to obtain economies of scale but
also to reduce capacity in the market. The yard industry is
becoming less fragmented and individual yards are
becoming more specialised. Most owners seem reluctant to
order vessels at less specialised yards. There are few signs
of yard capacity expanding, but some second-tier yards
could be employed to support production at first-tier
yards.
REVERTED RELATIONSHIP BETWEEN SHIP PRICES
The combination of low availability and increasing
construction costs have sent newbuilding prices for all
Crude Tankers to a twelve year high. The high replacement
costs have trickled through to secondhand prices for young
vessels to some degree, despite the current low earnings
environment.
THE OUTCOME SEEM TO BE VERY SUPPORTIVE OF EARNINGS
The low yard availability is creating some adverse short-
term dynamics where secondhand prices are disconnected
from earnings but could be sowing the seeds for a period
of strong earnings starting as early as the second half of
2023 and onwards if owners refrain from ordering vessels
at second-tier yards with available capacity.
0
50
100
150
200
2000 2005 2010 2015 2020
VLCC Suezmax Aframax
0
25
50
75
100
sep-20 sep-21
Other yards Top ten Crude Tanker yards
42%
14%
0
20
40
60
80
2006 2008 2010 2012 2014 2016 2018 2020 2021
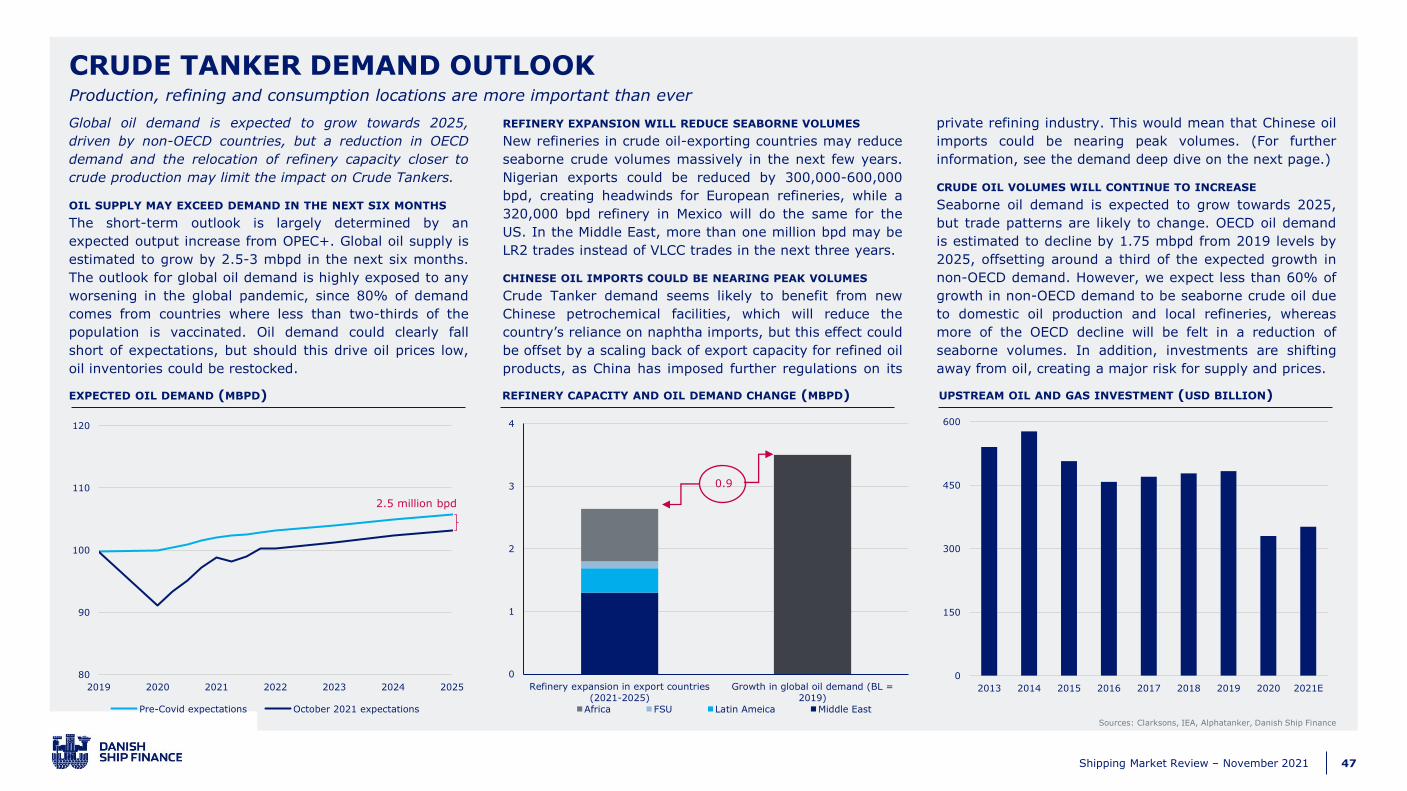
47Shipping Market Review – November 2021
0
150
300
450
600
2013 2014 2015 2016 2017 2018 2019 2020 2021E
Sources: Clarksons, IEA, Alphatanker, Danish Ship Finance
EXPECTED OIL DEMAND (MBPD) REFINERY CAPACITY AND OIL DEMAND CHANGE (MBPD) UPSTREAM OIL AND GAS INVESTMENT (USD BILLION)
CRUDE TANKER DEMAND OUTLOOKProduction, refining and consumption locations are more important than ever
Global oil demand is expected to grow towards 2025,
driven by non-OECD countries, but a reduction in OECD
demand and the relocation of refinery capacity closer to
crude production may limit the impact on Crude Tankers.
OIL SUPPLY MAY EXCEED DEMAND IN THE NEXT SIX MONTHS
The short-term outlook is largely determined by an
expected output increase from OPEC+. Global oil supply is
estimated to grow by 2.5-3 mbpd in the next six months.
The outlook for global oil demand is highly exposed to any
worsening in the global pandemic, since 80% of demand
comes from countries where less than two-thirds of the
population is vaccinated. Oil demand could clearly fall
short of expectations, but should this drive oil prices low,
oil inventories could be restocked.
REFINERY EXPANSION WILL REDUCE SEABORNE VOLUMES
New refineries in crude oil-exporting countries may reduce
seaborne crude volumes massively in the next few years.
Nigerian exports could be reduced by 300,000-600,000
bpd, creating headwinds for European refineries, while a
320,000 bpd refinery in Mexico will do the same for the
US. In the Middle East, more than one million bpd may be
LR2 trades instead of VLCC trades in the next three years.
CHINESE OIL IMPORTS COULD BE NEARING PEAK VOLUMES
Crude Tanker demand seems likely to benefit from new
Chinese petrochemical facilities, which will reduce the
country’s reliance on naphtha imports, but this effect could
be offset by a scaling back of export capacity for refined oil
products, as China has imposed further regulations on its
private refining industry. This would mean that Chinese oil
imports could be nearing peak volumes. (For further
information, see the demand deep dive on the next page.)
CRUDE OIL VOLUMES WILL CONTINUE TO INCREASE
Seaborne oil demand is expected to grow towards 2025,
but trade patterns are likely to change. OECD oil demand
is estimated to decline by 1.75 mbpd from 2019 levels by
2025, offsetting around a third of the expected growth in
non-OECD demand. However, we expect less than 60% of
growth in non-OECD demand to be seaborne crude oil due
to domestic oil production and local refineries, whereas
more of the OECD decline will be felt in a reduction of
seaborne volumes. In addition, investments are shifting
away from oil, creating a major risk for supply and prices.
80
90
100
110
120
2019 2020 2021 2022 2023 2024 2025
Pre-Covid expectations October 2021 expectations
2.5 million bpd
0
1
2
3
4
Refinery expansion in export countries
(2021-2025)
Growth in global oil demand (BL =
2019)
Africa FSU Latin Ameica Middle East
0.9
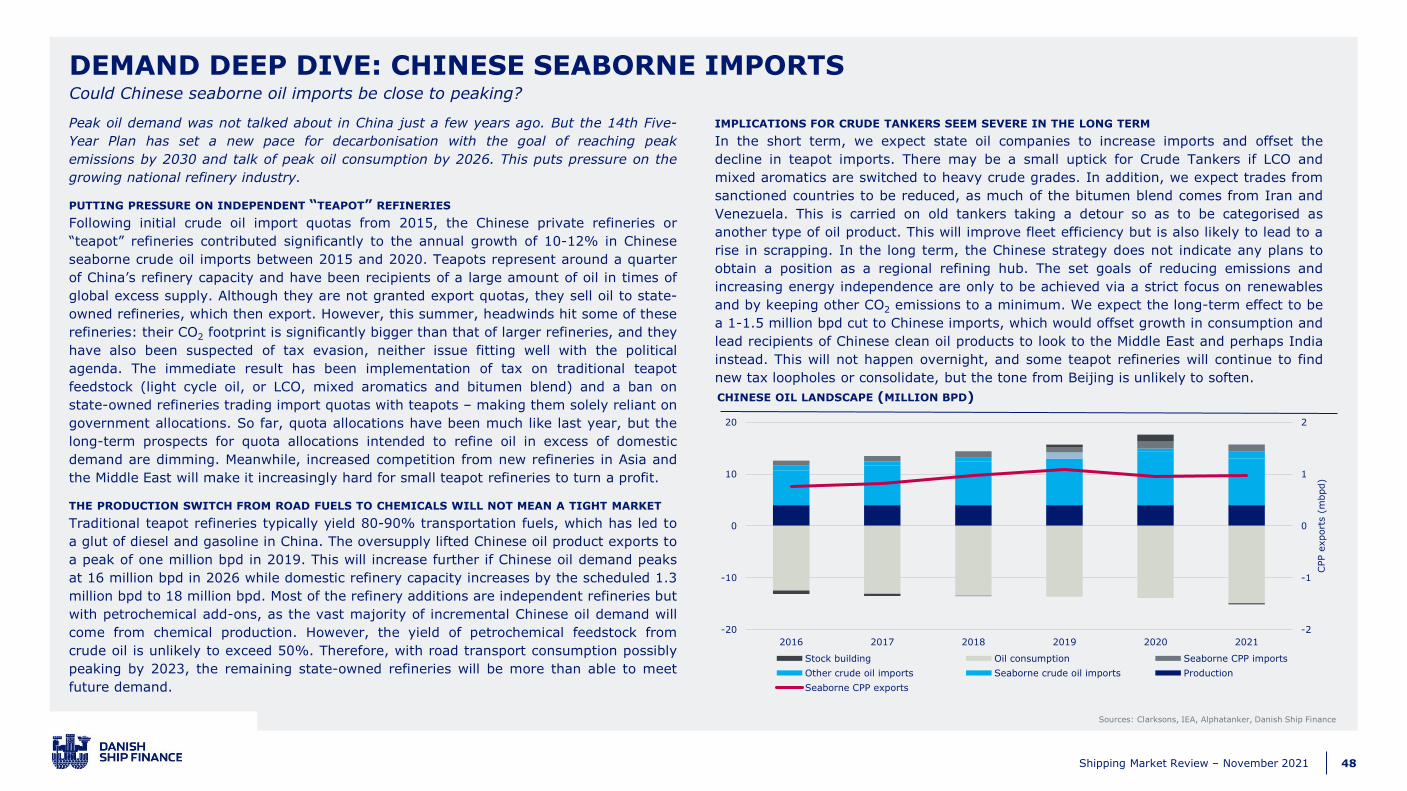
48Shipping Market Review – November 2021
Peak oil demand was not talked about in China just a few years ago. But the 14th Five-
Year Plan has set a new pace for decarbonisation with the goal of reaching peak
emissions by 2030 and talk of peak oil consumption by 2026. This puts pressure on the
growing national refinery industry.
PUTTING PRESSURE ON INDEPENDENT “TEAPOT” REFINERIES
Following initial crude oil import quotas from 2015, the Chinese private refineries or
“teapot” refineries contributed significantly to the annual growth of 10-12% in Chinese
seaborne crude oil imports between 2015 and 2020. Teapots represent around a quarter
of China’s refinery capacity and have been recipients of a large amount of oil in times of
global excess supply. Although they are not granted export quotas, they sell oil to state-
owned refineries, which then export. However, this summer, headwinds hit some of these
refineries: their CO2 footprint is significantly bigger than that of larger refineries, and they
have also been suspected of tax evasion, neither issue fitting well with the political
agenda. The immediate result has been implementation of tax on traditional teapot
feedstock (light cycle oil, or LCO, mixed aromatics and bitumen blend) and a ban on
state-owned refineries trading import quotas with teapots – making them solely reliant on
government allocations. So far, quota allocations have been much like last year, but the
long-term prospects for quota allocations intended to refine oil in excess of domestic
demand are dimming. Meanwhile, increased competition from new refineries in Asia and
the Middle East will make it increasingly hard for small teapot refineries to turn a profit.
THE PRODUCTION SWITCH FROM ROAD FUELS TO CHEMICALS WILL NOT MEAN A TIGHT MARKET
Traditional teapot refineries typically yield 80-90% transportation fuels, which has led to
a glut of diesel and gasoline in China. The oversupply lifted Chinese oil product exports to
a peak of one million bpd in 2019. This will increase further if Chinese oil demand peaks
at 16 million bpd in 2026 while domestic refinery capacity increases by the scheduled 1.3
million bpd to 18 million bpd. Most of the refinery additions are independent refineries but
with petrochemical add-ons, as the vast majority of incremental Chinese oil demand will
come from chemical production. However, the yield of petrochemical feedstock from
crude oil is unlikely to exceed 50%. Therefore, with road transport consumption possibly
peaking by 2023, the remaining state-owned refineries will be more than able to meet
future demand.
IMPLICATIONS FOR CRUDE TANKERS SEEM SEVERE IN THE LONG TERM
In the short term, we expect state oil companies to increase imports and offset the
decline in teapot imports. There may be a small uptick for Crude Tankers if LCO and
mixed aromatics are switched to heavy crude grades. In addition, we expect trades from
sanctioned countries to be reduced, as much of the bitumen blend comes from Iran and
Venezuela. This is carried on old tankers taking a detour so as to be categorised as
another type of oil product. This will improve fleet efficiency but is also likely to lead to a
rise in scrapping. In the long term, the Chinese strategy does not indicate any plans to
obtain a position as a regional refining hub. The set goals of reducing emissions and
increasing energy independence are only to be achieved via a strict focus on renewables
and by keeping other CO2 emissions to a minimum. We expect the long-term effect to be
a 1-1.5 million bpd cut to Chinese imports, which would offset growth in consumption and
lead recipients of Chinese clean oil products to look to the Middle East and perhaps India
instead. This will not happen overnight, and some teapot refineries will continue to find
new tax loopholes or consolidate, but the tone from Beijing is unlikely to soften.
DEMAND DEEP DIVE: CHINESE SEABORNE IMPORTS
Sources: Clarksons, IEA, Alphatanker, Danish Ship Finance
Could Chinese seaborne oil imports be close to peaking?
CHINESE OIL LANDSCAPE (MILLION BPD)
-2
-1
0
1
2
-20
-10
0
10
20
2016 2017 2018 2019 2020 2021
CPP e
xport
s (
mbpd)
Stock building Oil consumption Seaborne CPP imports
Other crude oil imports Seaborne crude oil imports Production
Seaborne CPP exports
49Shipping Market Review – November 2021
PRODUCT TANKER
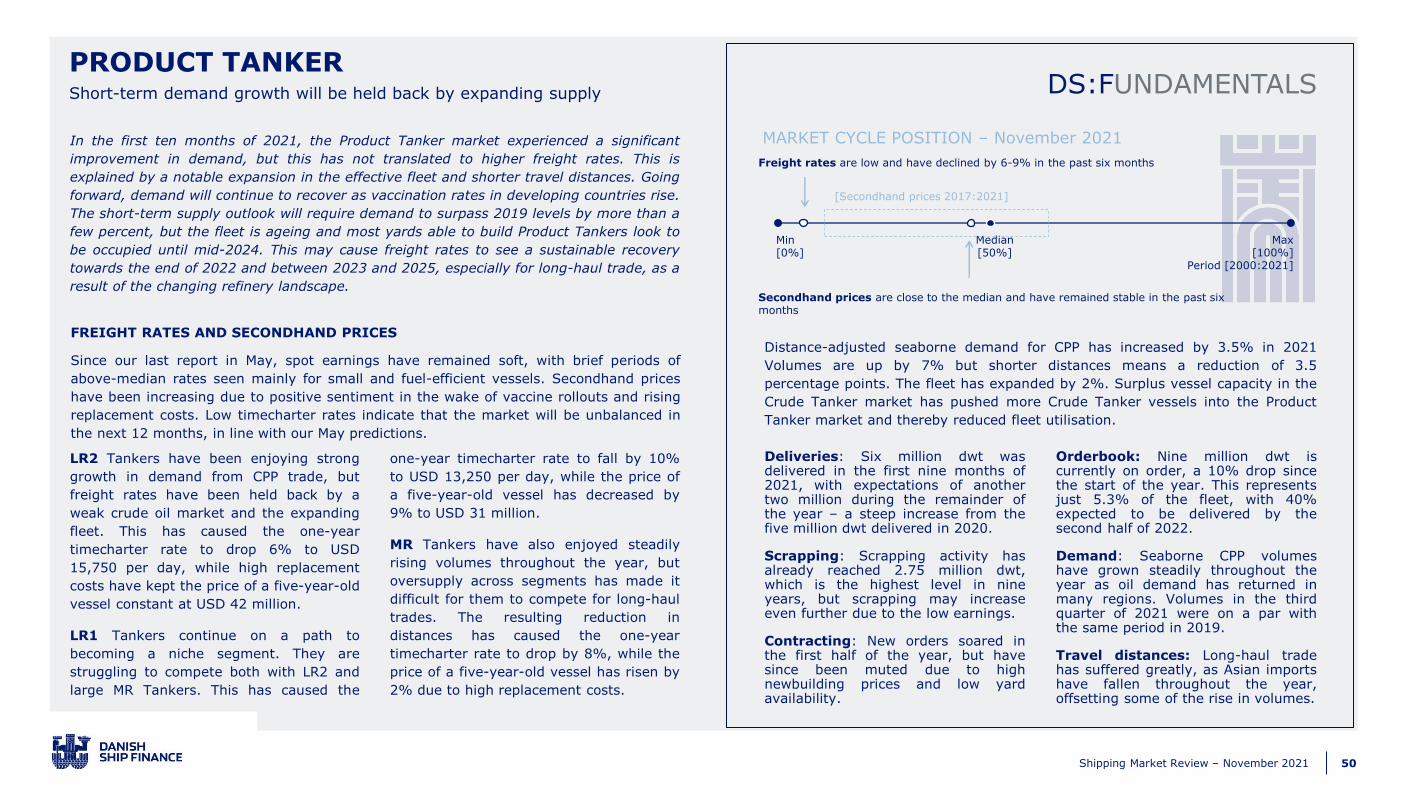
50Shipping Market Review – November 2021
DS:FUNDAMENTALSShort-term demand growth will be held back by expanding supply
PRODUCT TANKER
In the first ten months of 2021, the Product Tanker market experienced a significant
improvement in demand, but this has not translated to higher freight rates. This is
explained by a notable expansion in the effective fleet and shorter travel distances. Going
forward, demand will continue to recover as vaccination rates in developing countries rise.
The short-term supply outlook will require demand to surpass 2019 levels by more than a
few percent, but the fleet is ageing and most yards able to build Product Tankers look to
be occupied until mid-2024. This may cause freight rates to see a sustainable recovery
towards the end of 2022 and between 2023 and 2025, especially for long-haul trade, as a
result of the changing refinery landscape.
FREIGHT RATES AND SECONDHAND PRICES
Since our last report in May, spot earnings have remained soft, with brief periods of
above-median rates seen mainly for small and fuel-efficient vessels. Secondhand prices
have been increasing due to positive sentiment in the wake of vaccine rollouts and rising
replacement costs. Low timecharter rates indicate that the market will be unbalanced in
the next 12 months, in line with our May predictions.
Distance-adjusted seaborne demand for CPP has increased by 3.5% in 2021
Volumes are up by 7% but shorter distances means a reduction of 3.5
percentage points. The fleet has expanded by 2%. Surplus vessel capacity in the
Crude Tanker market has pushed more Crude Tanker vessels into the Product
Tanker market and thereby reduced fleet utilisation.
Deliveries: Six million dwt wasdelivered in the first nine months of2021, with expectations of anothertwo million during the remainder ofthe year – a steep increase from thefive million dwt delivered in 2020.
Scrapping: Scrapping activity hasalready reached 2.75 million dwt,which is the highest level in nineyears, but scrapping may increaseeven further due to the low earnings.
Contracting: New orders soared inthe first half of the year, but havesince been muted due to highnewbuilding prices and low yardavailability.
Orderbook: Nine million dwt iscurrently on order, a 10% drop sincethe start of the year. This representsjust 5.3% of the fleet, with 40%expected to be delivered by thesecond half of 2022.
Demand: Seaborne CPP volumeshave grown steadily throughout theyear as oil demand has returned inmany regions. Volumes in the thirdquarter of 2021 were on a par withthe same period in 2019.
Travel distances: Long-haul tradehas suffered greatly, as Asian importshave fallen throughout the year,offsetting some of the rise in volumes.
LR2 Tankers have been enjoying strong
growth in demand from CPP trade, but
freight rates have been held back by a
weak crude oil market and the expanding
fleet. This has caused the one-year
timecharter rate to drop 6% to USD
15,750 per day, while high replacement
costs have kept the price of a five-year-old
vessel constant at USD 42 million.
LR1 Tankers continue on a path to
becoming a niche segment. They are
struggling to compete both with LR2 and
large MR Tankers. This has caused the
one-year timecharter rate to fall by 10%
to USD 13,250 per day, while the price of
a five-year-old vessel has decreased by
9% to USD 31 million.
MR Tankers have also enjoyed steadily
rising volumes throughout the year, but
oversupply across segments has made it
difficult for them to compete for long-haul
trades. The resulting reduction in
distances has caused the one-year
timecharter rate to drop by 8%, while the
price of a five-year-old vessel has risen by
2% due to high replacement costs.
Min[0%]
Max[100%]
Period [2000:2021]
Median[50%]
[Secondhand prices 2017:2021]
Freight rates are low and have declined by 6-9% in the past six months
Secondhand prices are close to the median and have remained stable in the past six months
MARKET CYCLE POSITION – November 2021
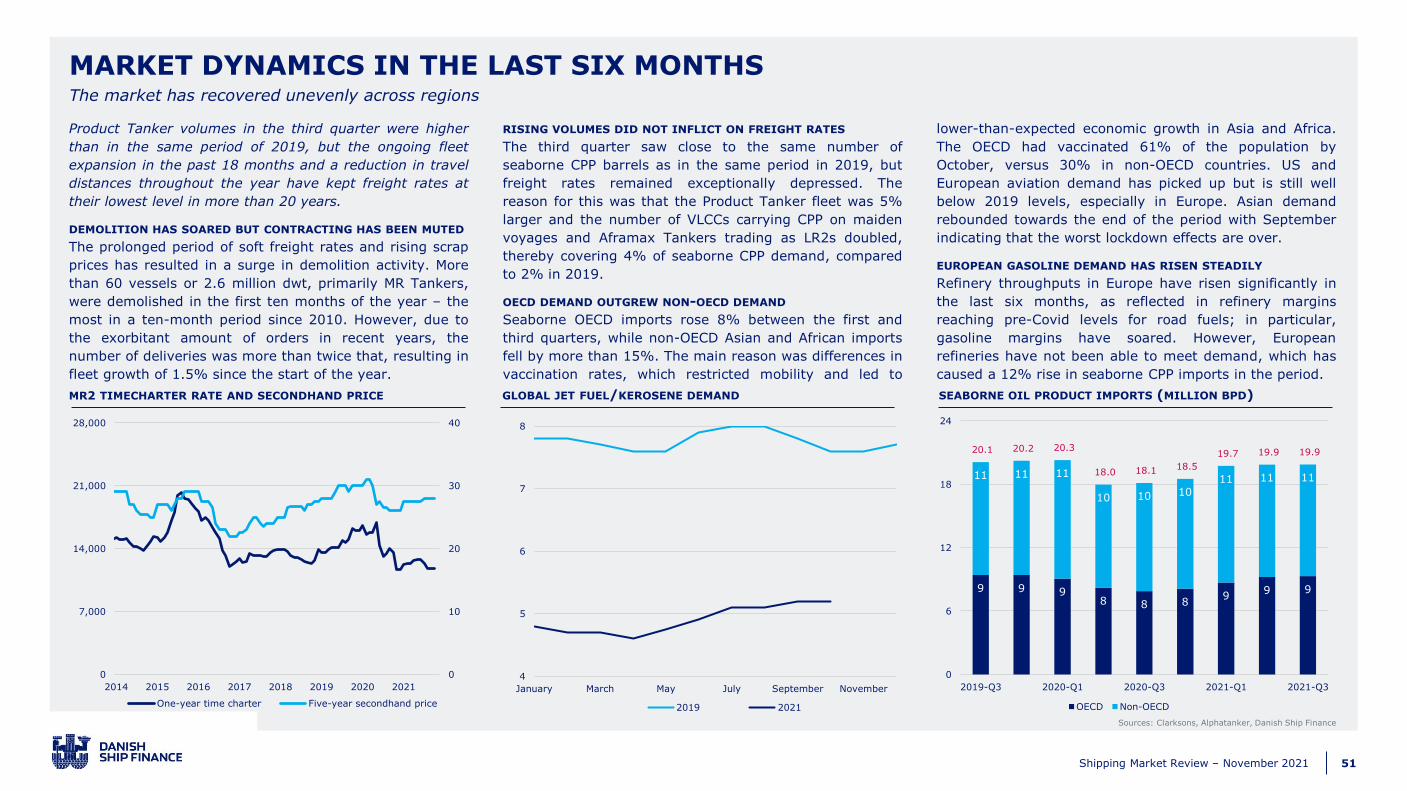
51Shipping Market Review – November 2021
9 9 9 8 8 8
9 9 9
11 11 11
10 10 10 11 11 11
20.1 20.2 20.3
18.0 18.1 18.5
19.7 19.9 19.9
0
6
12
18
24
2019-Q3 2020-Q1 2020-Q3 2021-Q1 2021-Q3
OECD Non-OECD
Product Tanker volumes in the third quarter were higher
than in the same period of 2019, but the ongoing fleet
expansion in the past 18 months and a reduction in travel
distances throughout the year have kept freight rates at
their lowest level in more than 20 years.
DEMOLITION HAS SOARED BUT CONTRACTING HAS BEEN MUTED
The prolonged period of soft freight rates and rising scrap
prices has resulted in a surge in demolition activity. More
than 60 vessels or 2.6 million dwt, primarily MR Tankers,
were demolished in the first ten months of the year – the
most in a ten-month period since 2010. However, due to
the exorbitant amount of orders in recent years, the
number of deliveries was more than twice that, resulting in
fleet growth of 1.5% since the start of the year.
RISING VOLUMES DID NOT INFLICT ON FREIGHT RATES
The third quarter saw close to the same number of
seaborne CPP barrels as in the same period in 2019, but
freight rates remained exceptionally depressed. The
reason for this was that the Product Tanker fleet was 5%
larger and the number of VLCCs carrying CPP on maiden
voyages and Aframax Tankers trading as LR2s doubled,
thereby covering 4% of seaborne CPP demand, compared
to 2% in 2019.
OECD DEMAND OUTGREW NON-OECD DEMAND
Seaborne OECD imports rose 8% between the first and
third quarters, while non-OECD Asian and African imports
fell by more than 15%. The main reason was differences in
vaccination rates, which restricted mobility and led to
lower-than-expected economic growth in Asia and Africa.
The OECD had vaccinated 61% of the population by
October, versus 30% in non-OECD countries. US and
European aviation demand has picked up but is still well
below 2019 levels, especially in Europe. Asian demand
rebounded towards the end of the period with September
indicating that the worst lockdown effects are over.
EUROPEAN GASOLINE DEMAND HAS RISEN STEADILY
Refinery throughputs in Europe have risen significantly in
the last six months, as reflected in refinery margins
reaching pre-Covid levels for road fuels; in particular,
gasoline margins have soared. However, European
refineries have not been able to meet demand, which has
caused a 12% rise in seaborne CPP imports in the period.
Sources: Clarksons, Alphatanker, Danish Ship Finance
MR2 TIMECHARTER RATE AND SECONDHAND PRICE GLOBAL JET FUEL/KEROSENE DEMAND SEABORNE OIL PRODUCT IMPORTS (MILLION BPD)
MARKET DYNAMICS IN THE LAST SIX MONTHSThe market has recovered unevenly across regions
0
10
20
30
40
0
7,000
14,000
21,000
28,000
2014 2015 2016 2017 2018 2019 2020 2021
One-year time charter Five-year secondhand price
4
5
6
7
8
January March May July September November
2019 2021
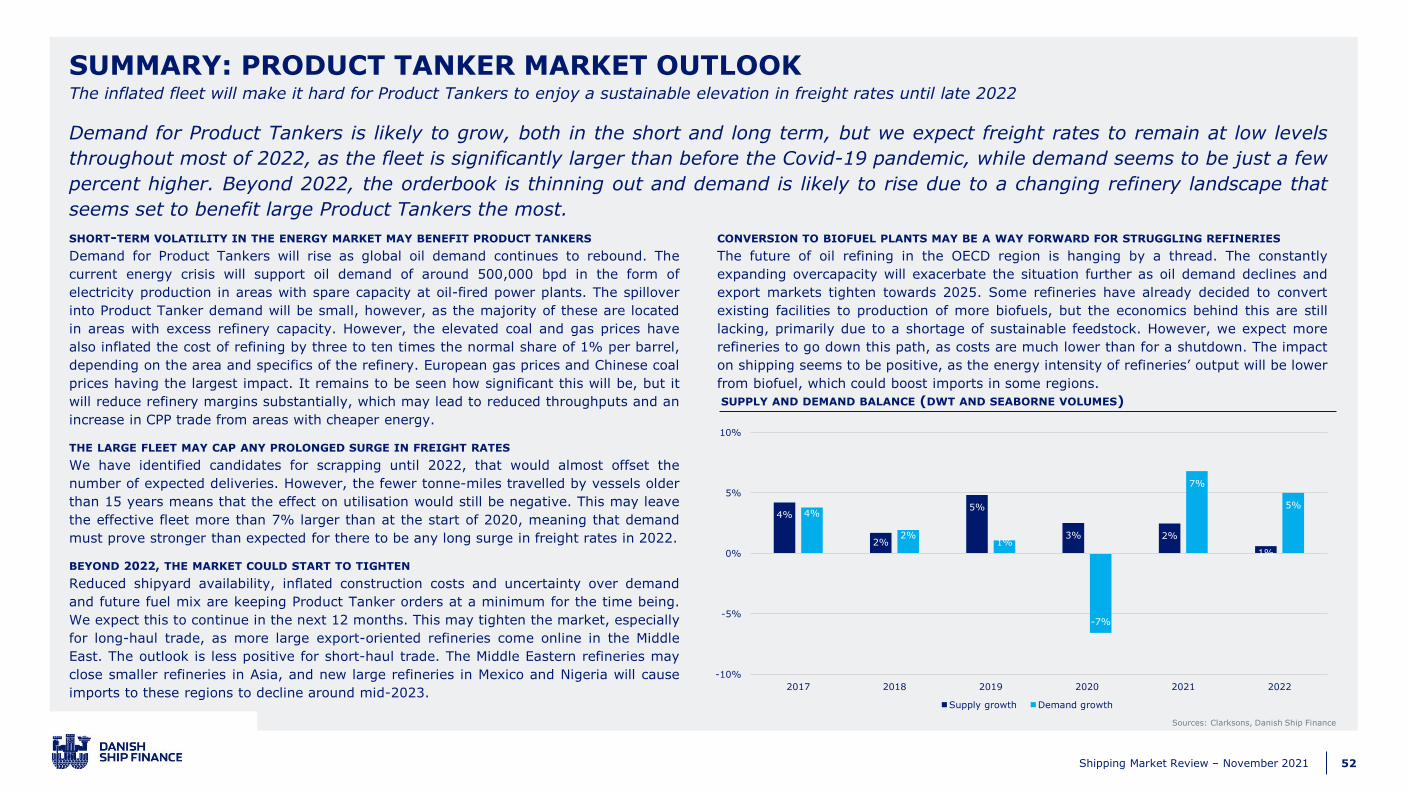
52Shipping Market Review – November 2021
SHORT-TERM VOLATILITY IN THE ENERGY MARKET MAY BENEFIT PRODUCT TANKERS
Demand for Product Tankers will rise as global oil demand continues to rebound. The
current energy crisis will support oil demand of around 500,000 bpd in the form of
electricity production in areas with spare capacity at oil-fired power plants. The spillover
into Product Tanker demand will be small, however, as the majority of these are located
in areas with excess refinery capacity. However, the elevated coal and gas prices have
also inflated the cost of refining by three to ten times the normal share of 1% per barrel,
depending on the area and specifics of the refinery. European gas prices and Chinese coal
prices having the largest impact. It remains to be seen how significant this will be, but it
will reduce refinery margins substantially, which may lead to reduced throughputs and an
increase in CPP trade from areas with cheaper energy.
THE LARGE FLEET MAY CAP ANY PROLONGED SURGE IN FREIGHT RATES
We have identified candidates for scrapping until 2022, that would almost offset the
number of expected deliveries. However, the fewer tonne-miles travelled by vessels older
than 15 years means that the effect on utilisation would still be negative. This may leave
the effective fleet more than 7% larger than at the start of 2020, meaning that demand
must prove stronger than expected for there to be any long surge in freight rates in 2022.
BEYOND 2022, THE MARKET COULD START TO TIGHTEN
Reduced shipyard availability, inflated construction costs and uncertainty over demand
and future fuel mix are keeping Product Tanker orders at a minimum for the time being.
We expect this to continue in the next 12 months. This may tighten the market, especially
for long-haul trade, as more large export-oriented refineries come online in the Middle
East. The outlook is less positive for short-haul trade. The Middle Eastern refineries may
close smaller refineries in Asia, and new large refineries in Mexico and Nigeria will cause
imports to these regions to decline around mid-2023.
CONVERSION TO BIOFUEL PLANTS MAY BE A WAY FORWARD FOR STRUGGLING REFINERIES
The future of oil refining in the OECD region is hanging by a thread. The constantly
expanding overcapacity will exacerbate the situation further as oil demand declines and
export markets tighten towards 2025. Some refineries have already decided to convert
existing facilities to production of more biofuels, but the economics behind this are still
lacking, primarily due to a shortage of sustainable feedstock. However, we expect more
refineries to go down this path, as costs are much lower than for a shutdown. The impact
on shipping seems to be positive, as the energy intensity of refineries’ output will be lower
from biofuel, which could boost imports in some regions.
SUMMARY: PRODUCT TANKER MARKET OUTLOOK
Sources: Clarksons, Danish Ship Finance
The inflated fleet will make it hard for Product Tankers to enjoy a sustainable elevation in freight rates until late 2022
SUPPLY AND DEMAND BALANCE (DWT AND SEABORNE VOLUMES)
Demand for Product Tankers is likely to grow, both in the short and long term, but we expect freight rates to remain at low levels
throughout most of 2022, as the fleet is significantly larger than before the Covid-19 pandemic, while demand seems to be just a few
percent higher. Beyond 2022, the orderbook is thinning out and demand is likely to rise due to a changing refinery landscape that
seems set to benefit large Product Tankers the most.
4%
2%
5%
3% 2%
1%
4%
2%1%
-7%
7%
5%
-10%
-5%
0%
5%
10%
2017 2018 2019 2020 2021 2022
Supply growth Demand growth

53Shipping Market Review – November 2021
The fleet will continue to expand but at a slower rate than
vessels turning 15 years old. This may provide a boost to
young fuel-efficient vessels but could also put a cap on any
surge in freight rates if the older vessels stay in the fleet.
TOO FEW DEMOLITION CANDIDATES WILL IMPACT RATES
We have identified scrapping candidates before year-end
2022 corresponding to 4% of the fleet, which would offset
much of the 4.5% that is expected to be delivered.
However, the tonne-miles travelled for the scrapping
candidates are only around half those of newly built
vessels, limiting the impact on freight rates substantially.
CRUDE TANKER DEMAND UNLIKELY TO SUPPORT FREIGHT RATES
A seemingly weaker crude oil market in the next 18
months is unlikely to offer much support for LR Tankers.
On the contrary, we expect a continuing trend of VLCCs
carrying CPP on maiden voyages and dirty tankers being
washed clean. The chemical market may offer some
respite, but the impact would be relatively small.
CONTRACTING ACTIVITY IS UNLIKELY TO EXPERIENCE GROWTH
Six yards have built 90% of LR2 Tankers in the last five
years, while two yards have built over 50% of all MR
vessels. These yards will be occupied with Container and
Gas Carrier orders until mid-2024. We expect this to
reduce contracting significantly in the next 12-18 months,
as yards are likely to keep prices high for now, and most
owners are unwilling to place orders at second-tier yards.
THE REDUCTION IN ECONOMIC LIFETIMES SEEMS BRIEF
Since 2017, the share of tonne-miles travelled for vessels
older than 15 has grown from 3% to 12% because ship
capacity has risen from 12% to 23%. We expect this trend
to continue in the next five years, due to low contracting,
many vessels turning 15 and upcoming regulations that
are more likely to reduce speeds than economic lifetimes.
Tonne-mile demand drops sharply after vessels turn 15,
but the many ships in this age group will cap freight rates.
EXTREMELY OPAQUE PATH TO REDUCING EMISSIONS
The high concentration of small vessels with diverse trade
routes makes Product Tankers one of the hardest shipping
segments to decarbonise. Existing solutions seem
unviable, but the impending CII ratings may prove to be
more than just a licence to operate, as transparency will
make it easier for cargo owners to demand certain vessels.
Sources: Clarksons, Danish Ship Finance
AGE DISTRIBUTION (MILLION DWT) FLEET DEVELOPMENT (MILLION DWT) TOP 10 PRODUCT TANKER YARDS (MILLION CGT)
PRODUCT TANKER FLEET OUTLOOKShort-term pain, medium-term gain
20%
21%
35%
18%
5%
2%
5%
0
40
80
120
160
0-5 5-10 10-15 15-20 20-25 25+ Orderbook
Percentage of fleet
4.0%
6.0%
6.2%
4.2%
1.7%
4.8%
2.5%
3.0%
2.6%
1.8%
-4
0
4
8
12
2014 2015 2016 2017 2018 2019 2020 2021 2022 2023
LR2 LR1 MR Orderbook
Fleet growth
0
4
8
12
16
2022 2023 2024 2025
Orderbook
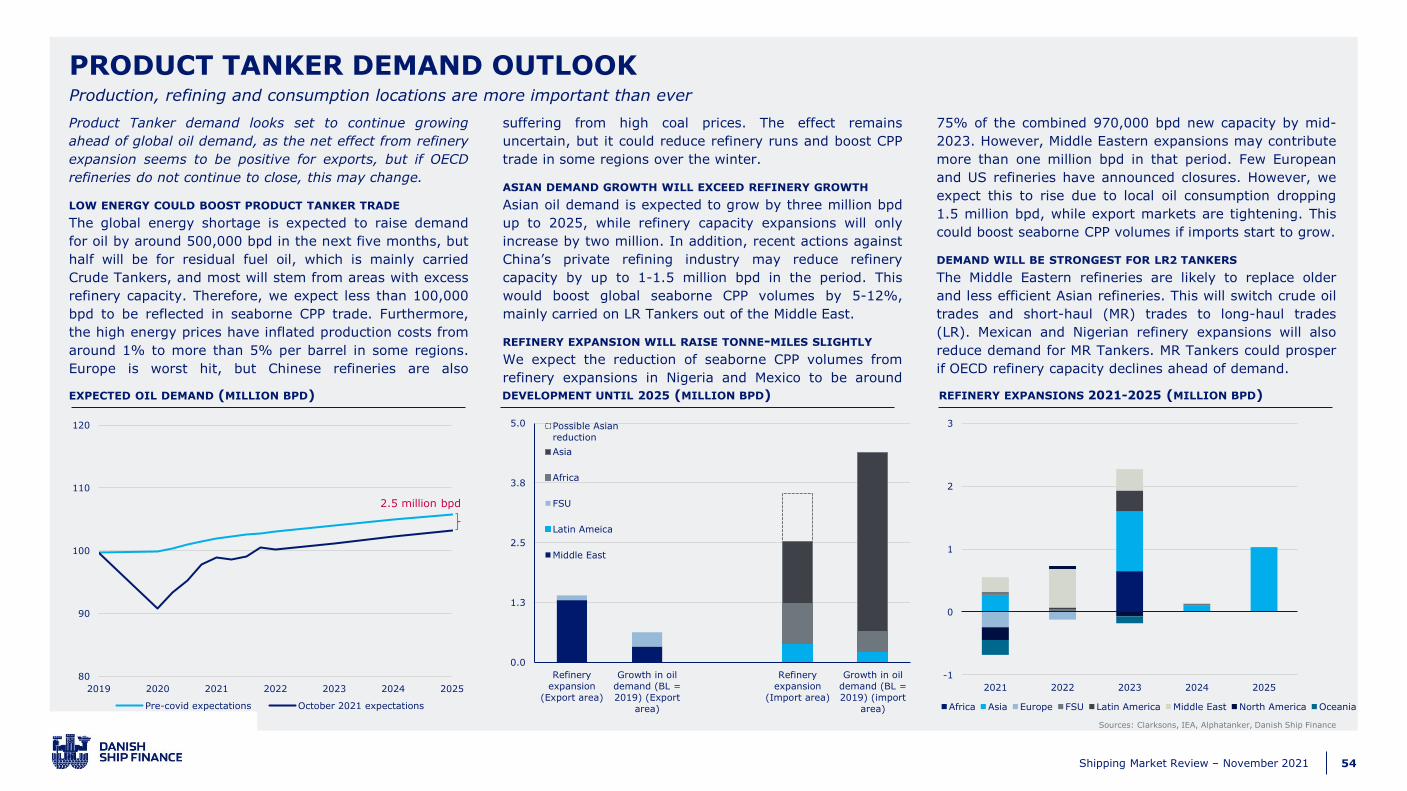
54Shipping Market Review – November 2021
Sources: Clarksons, IEA, Alphatanker, Danish Ship Finance
EXPECTED OIL DEMAND (MILLION BPD) DEVELOPMENT UNTIL 2025 (MILLION BPD) REFINERY EXPANSIONS 2021-2025 (MILLION BPD)
PRODUCT TANKER DEMAND OUTLOOKProduction, refining and consumption locations are more important than ever
Product Tanker demand looks set to continue growing
ahead of global oil demand, as the net effect from refinery
expansion seems to be positive for exports, but if OECD
refineries do not continue to close, this may change.
LOW ENERGY COULD BOOST PRODUCT TANKER TRADE
The global energy shortage is expected to raise demand
for oil by around 500,000 bpd in the next five months, but
half will be for residual fuel oil, which is mainly carried
Crude Tankers, and most will stem from areas with excess
refinery capacity. Therefore, we expect less than 100,000
bpd to be reflected in seaborne CPP trade. Furthermore,
the high energy prices have inflated production costs from
around 1% to more than 5% per barrel in some regions.
Europe is worst hit, but Chinese refineries are also
suffering from high coal prices. The effect remains
uncertain, but it could reduce refinery runs and boost CPP
trade in some regions over the winter.
ASIAN DEMAND GROWTH WILL EXCEED REFINERY GROWTH
Asian oil demand is expected to grow by three million bpd
up to 2025, while refinery capacity expansions will only
increase by two million. In addition, recent actions against
China’s private refining industry may reduce refinery
capacity by up to 1-1.5 million bpd in the period. This
would boost global seaborne CPP volumes by 5-12%,
mainly carried on LR Tankers out of the Middle East.
REFINERY EXPANSION WILL RAISE TONNE-MILES SLIGHTLY
We expect the reduction of seaborne CPP volumes from
refinery expansions in Nigeria and Mexico to be around
75% of the combined 970,000 bpd new capacity by mid-
2023. However, Middle Eastern expansions may contribute
more than one million bpd in that period. Few European
and US refineries have announced closures. However, we
expect this to rise due to local oil consumption dropping
1.5 million bpd, while export markets are tightening. This
could boost seaborne CPP volumes if imports start to grow.
DEMAND WILL BE STRONGEST FOR LR2 TANKERS
The Middle Eastern refineries are likely to replace older
and less efficient Asian refineries. This will switch crude oil
trades and short-haul (MR) trades to long-haul trades
(LR). Mexican and Nigerian refinery expansions will also
reduce demand for MR Tankers. MR Tankers could prosper
if OECD refinery capacity declines ahead of demand.
80
90
100
110
120
2019 2020 2021 2022 2023 2024 2025
Pre-covid expectations October 2021 expectations
2.5 million bpd
0.0
1.3
2.5
3.8
5.0
Refinery
expansion
(Export area)
Growth in oil
demand (BL =
2019) (Export
area)
Column1 Refinery
expansion
(Import area)
Growth in oil
demand (BL =
2019) (import
area)
Possible Asian
reduction
Asia
Africa
FSU
Latin Ameica
Middle East
-1
0
1
2
3
2021 2022 2023 2024 2025
Africa Asia Europe FSU Latin America Middle East North America Oceania
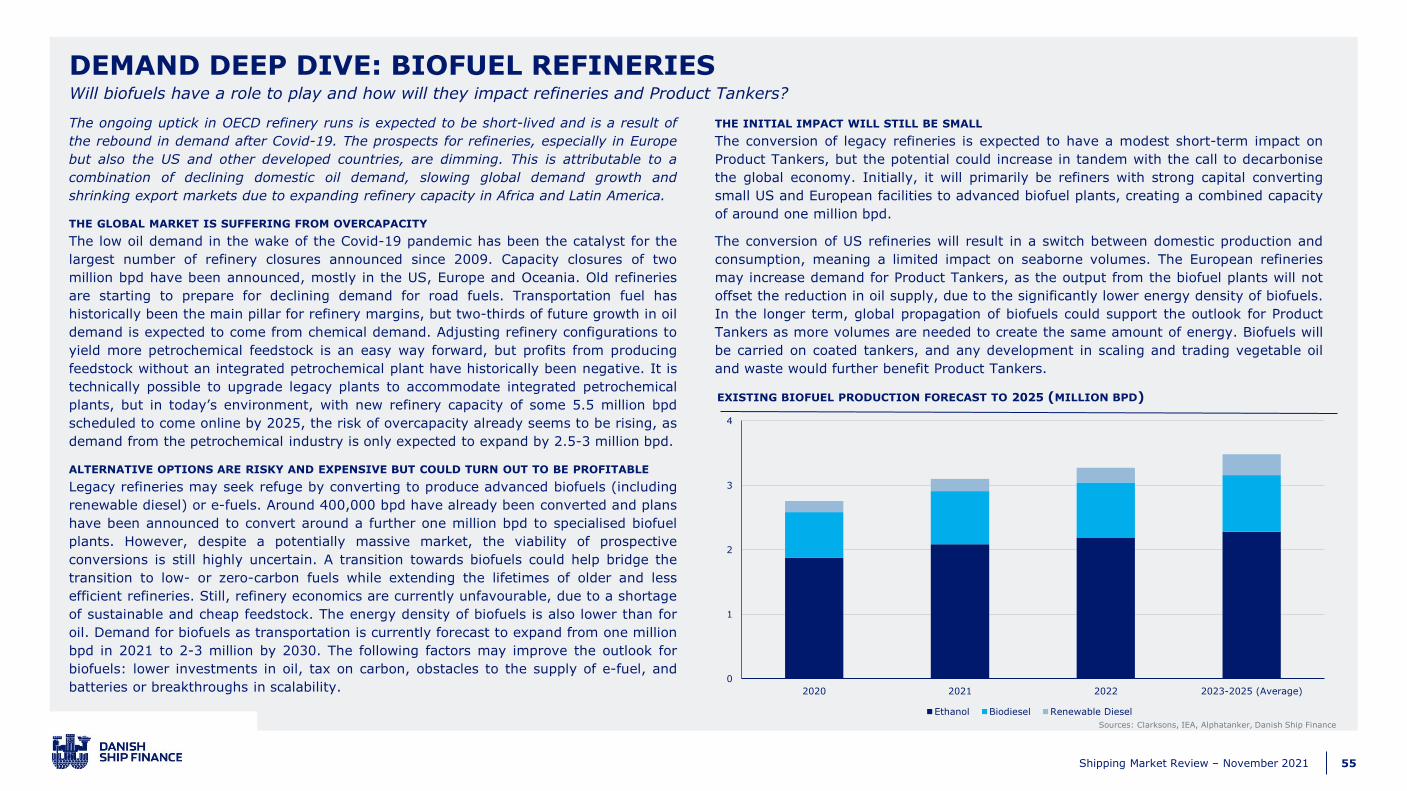
55Shipping Market Review – November 2021
The ongoing uptick in OECD refinery runs is expected to be short-lived and is a result of
the rebound in demand after Covid-19. The prospects for refineries, especially in Europe
but also the US and other developed countries, are dimming. This is attributable to a
combination of declining domestic oil demand, slowing global demand growth and
shrinking export markets due to expanding refinery capacity in Africa and Latin America.
THE GLOBAL MARKET IS SUFFERING FROM OVERCAPACITY
The low oil demand in the wake of the Covid-19 pandemic has been the catalyst for the
largest number of refinery closures announced since 2009. Capacity closures of two
million bpd have been announced, mostly in the US, Europe and Oceania. Old refineries
are starting to prepare for declining demand for road fuels. Transportation fuel has
historically been the main pillar for refinery margins, but two-thirds of future growth in oil
demand is expected to come from chemical demand. Adjusting refinery configurations to
yield more petrochemical feedstock is an easy way forward, but profits from producing
feedstock without an integrated petrochemical plant have historically been negative. It is
technically possible to upgrade legacy plants to accommodate integrated petrochemical
plants, but in today’s environment, with new refinery capacity of some 5.5 million bpd
scheduled to come online by 2025, the risk of overcapacity already seems to be rising, as
demand from the petrochemical industry is only expected to expand by 2.5-3 million bpd.
ALTERNATIVE OPTIONS ARE RISKY AND EXPENSIVE BUT COULD TURN OUT TO BE PROFITABLE
Legacy refineries may seek refuge by converting to produce advanced biofuels (including
renewable diesel) or e-fuels. Around 400,000 bpd have already been converted and plans
have been announced to convert around a further one million bpd to specialised biofuel
plants. However, despite a potentially massive market, the viability of prospective
conversions is still highly uncertain. A transition towards biofuels could help bridge the
transition to low- or zero-carbon fuels while extending the lifetimes of older and less
efficient refineries. Still, refinery economics are currently unfavourable, due to a shortage
of sustainable and cheap feedstock. The energy density of biofuels is also lower than for
oil. Demand for biofuels as transportation is currently forecast to expand from one million
bpd in 2021 to 2-3 million by 2030. The following factors may improve the outlook for
biofuels: lower investments in oil, tax on carbon, obstacles to the supply of e-fuel, and
batteries or breakthroughs in scalability.
THE INITIAL IMPACT WILL STILL BE SMALL
The conversion of legacy refineries is expected to have a modest short-term impact on
Product Tankers, but the potential could increase in tandem with the call to decarbonise
the global economy. Initially, it will primarily be refiners with strong capital converting
small US and European facilities to advanced biofuel plants, creating a combined capacity
of around one million bpd.
The conversion of US refineries will result in a switch between domestic production and
consumption, meaning a limited impact on seaborne volumes. The European refineries
may increase demand for Product Tankers, as the output from the biofuel plants will not
offset the reduction in oil supply, due to the significantly lower energy density of biofuels.
In the longer term, global propagation of biofuels could support the outlook for Product
Tankers as more volumes are needed to create the same amount of energy. Biofuels will
be carried on coated tankers, and any development in scaling and trading vegetable oil
and waste would further benefit Product Tankers.
DEMAND DEEP DIVE: BIOFUEL REFINERIES
Sources: Clarksons, IEA, Alphatanker, Danish Ship Finance
Will biofuels have a role to play and how will they impact refineries and Product Tankers?
EXISTING BIOFUEL PRODUCTION FORECAST TO 2025 (MILLION BPD)
0
1
2
3
4
2020 2021 2022 2023-2025 (Average)
Ethanol Biodiesel Renewable Diesel

56Shipping Market Review – November 2021
LPG CARRIER
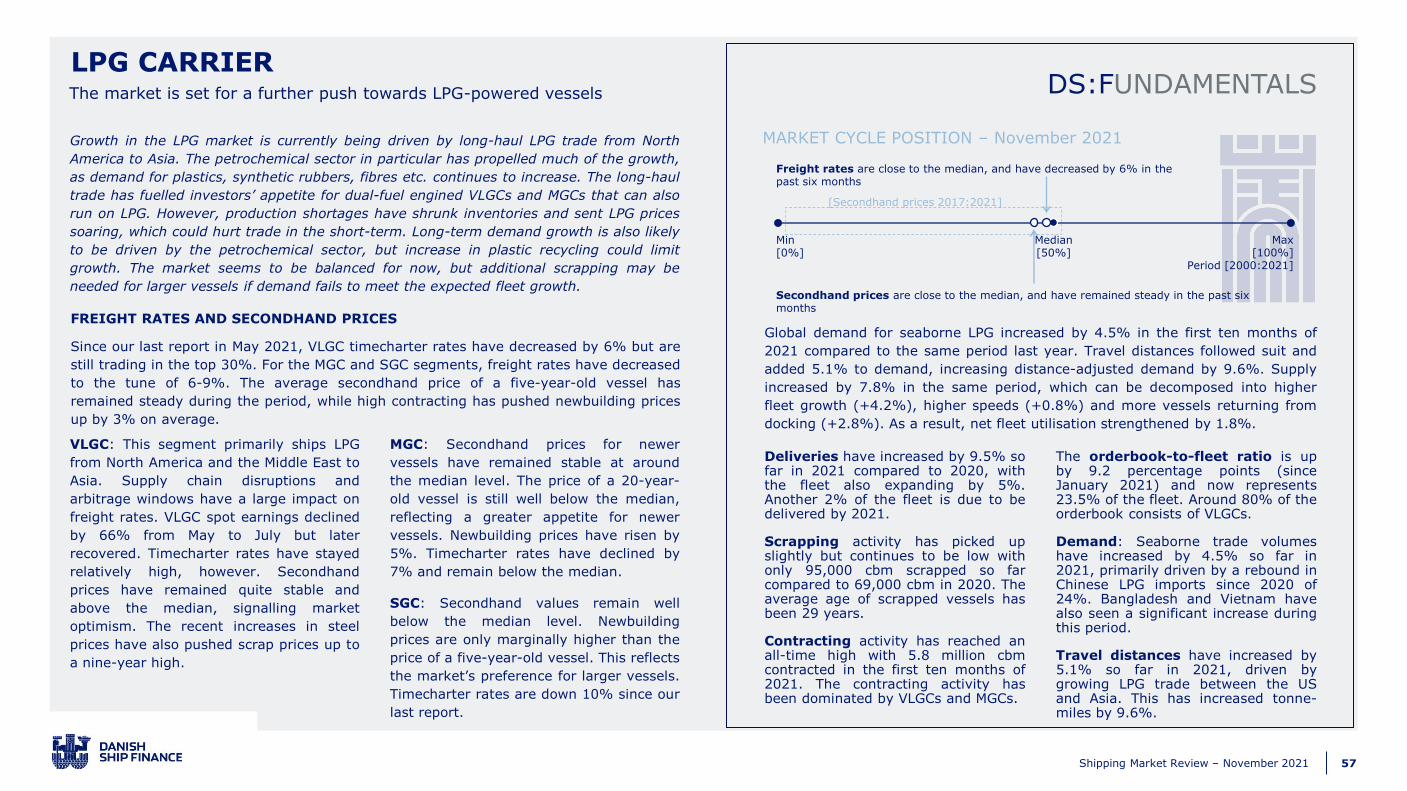
57Shipping Market Review – November 2021
DS:FUNDAMENTALSThe market is set for a further push towards LPG-powered vessels
LPG CARRIER
Growth in the LPG market is currently being driven by long-haul LPG trade from North
America to Asia. The petrochemical sector in particular has propelled much of the growth,
as demand for plastics, synthetic rubbers, fibres etc. continues to increase. The long-haul
trade has fuelled investors’ appetite for dual-fuel engined VLGCs and MGCs that can also
run on LPG. However, production shortages have shrunk inventories and sent LPG prices
soaring, which could hurt trade in the short-term. Long-term demand growth is also likely
to be driven by the petrochemical sector, but increase in plastic recycling could limit
growth. The market seems to be balanced for now, but additional scrapping may be
needed for larger vessels if demand fails to meet the expected fleet growth.
FREIGHT RATES AND SECONDHAND PRICES
Since our last report in May 2021, VLGC timecharter rates have decreased by 6% but are
still trading in the top 30%. For the MGC and SGC segments, freight rates have decreased
to the tune of 6-9%. The average secondhand price of a five-year-old vessel has
remained steady during the period, while high contracting has pushed newbuilding prices
up by 3% on average.
Global demand for seaborne LPG increased by 4.5% in the first ten months of
2021 compared to the same period last year. Travel distances followed suit and
added 5.1% to demand, increasing distance-adjusted demand by 9.6%. Supply
increased by 7.8% in the same period, which can be decomposed into higher
fleet growth (+4.2%), higher speeds (+0.8%) and more vessels returning from
docking (+2.8%). As a result, net fleet utilisation strengthened by 1.8%.
Deliveries have increased by 9.5% sofar in 2021 compared to 2020, withthe fleet also expanding by 5%.Another 2% of the fleet is due to bedelivered by 2021.
Scrapping activity has picked upslightly but continues to be low withonly 95,000 cbm scrapped so farcompared to 69,000 cbm in 2020. Theaverage age of scrapped vessels hasbeen 29 years.
Contracting activity has reached anall-time high with 5.8 million cbmcontracted in the first ten months of2021. The contracting activity hasbeen dominated by VLGCs and MGCs.
The orderbook-to-fleet ratio is upby 9.2 percentage points (sinceJanuary 2021) and now represents23.5% of the fleet. Around 80% of theorderbook consists of VLGCs.
Demand: Seaborne trade volumeshave increased by 4.5% so far in2021, primarily driven by a rebound inChinese LPG imports since 2020 of24%. Bangladesh and Vietnam havealso seen a significant increase duringthis period.
Travel distances have increased by5.1% so far in 2021, driven bygrowing LPG trade between the USand Asia. This has increased tonne-miles by 9.6%.
VLGC: This segment primarily ships LPG
from North America and the Middle East to
Asia. Supply chain disruptions and
arbitrage windows have a large impact on
freight rates. VLGC spot earnings declined
by 66% from May to July but later
recovered. Timecharter rates have stayed
relatively high, however. Secondhand
prices have remained quite stable and
above the median, signalling market
optimism. The recent increases in steel
prices have also pushed scrap prices up to
a nine-year high.
MGC: Secondhand prices for newer
vessels have remained stable at around
the median level. The price of a 20-year-
old vessel is still well below the median,
reflecting a greater appetite for newer
vessels. Newbuilding prices have risen by
5%. Timecharter rates have declined by
7% and remain below the median.
SGC: Secondhand values remain well
below the median level. Newbuilding
prices are only marginally higher than the
price of a five-year-old vessel. This reflects
the market’s preference for larger vessels.
Timecharter rates are down 10% since our
last report.
Min[0%]
Max[100%]
Period [2000:2021]
Median[50%]
[Secondhand prices 2017:2021]
Freight rates are close to the median, and have decreased by 6% in the past six months
Secondhand prices are close to the median, and have remained steady in the past six months
MARKET CYCLE POSITION – November 2021

58Shipping Market Review – November 2021
Source: AXS Marine, Clarksons, Danish Ship Finance
ONE-YEAR TIMECHARTER AND SPOT RATES (USD PER DAY) CONTRACTING ACTIVITY (MILLION CBM) EXPORTS FROM THE US (MILLION MT)
MARKET DYNAMICS IN THE LAST SIX MONTHSThe orderbook-to-fleet ratio has reached a five-year high
Since our last report, contracting activity has continued to
soar with 5.8 million cbm having now been contracted in
2021. We are seeing a greater appetite for larger vessels
powered by LPG.
SPOT RATES CONTINUE THEIR BUMPY RIDE
The spot rate market for the VLGC segment has remained
volatile since our last report in May. Spot earnings from
Houston to Chiba, which is often used as a spot price
reference for the LPG trade between North America and
Asia, declined by 33% from May to July, only to rebound a
month later. The high volatility in the spot market has
been caused by increasing gas prices, which led to some
cargo cancellations in July due to a narrowing LPG price
arbitrage between the US and Asia. Gas prices have risen
sharply over the past year due to increasing demand and
steady production levels, which has caused LPG prices to
reach a six-year high. This highlights how large an effect
short-term disruptions in demand can have on VLGC
freight rates.
HIGH CONTRACTING ACTIVITY FOR LARGER VESSELS
Contracting activity in 2021 has reached an all-time high
with levels equivalent to 16% of the current fleet. A large
part of the contracting activity concerns VLGC and MGC
vessels with dual-fuel engines that can also be powered by
LPG. Generally, dual-fuel engined vessels are more
expensive than those powered by conventional fuel. This
has resulted in an increase in the general newbuilding
price index. From the first to the second quarter, we saw
an average increase in newbuilding prices of 3%, which
was also partly explained by higher steel prices.
INCREASING EXPORTS FROM THE US
Seaborne LPG trade increased by 9% in third quarter
compared to the same period last year. US exports to
China were the primary driver of this growth. However,
seaborne import volumes also rose in other key import
markets such as South Korea, Japan, Southeast Asia and
Europe. Exports increased significantly despite only a
modest increase in US production levels – the increase in
exports was primarily sourced from inventories.
0
30,000
60,000
90,000
120,000
2015 2016 2017 2018 2019 2020 2021
1-year TC TCE earnings Houston-Chiba
0.0
2.0
4.0
6.0
8.0
2014 2015 2016 2017 2018 2019 2020 YTD
2021
0.0
1.5
3.0
4.5
6.0
2019 2020 2021
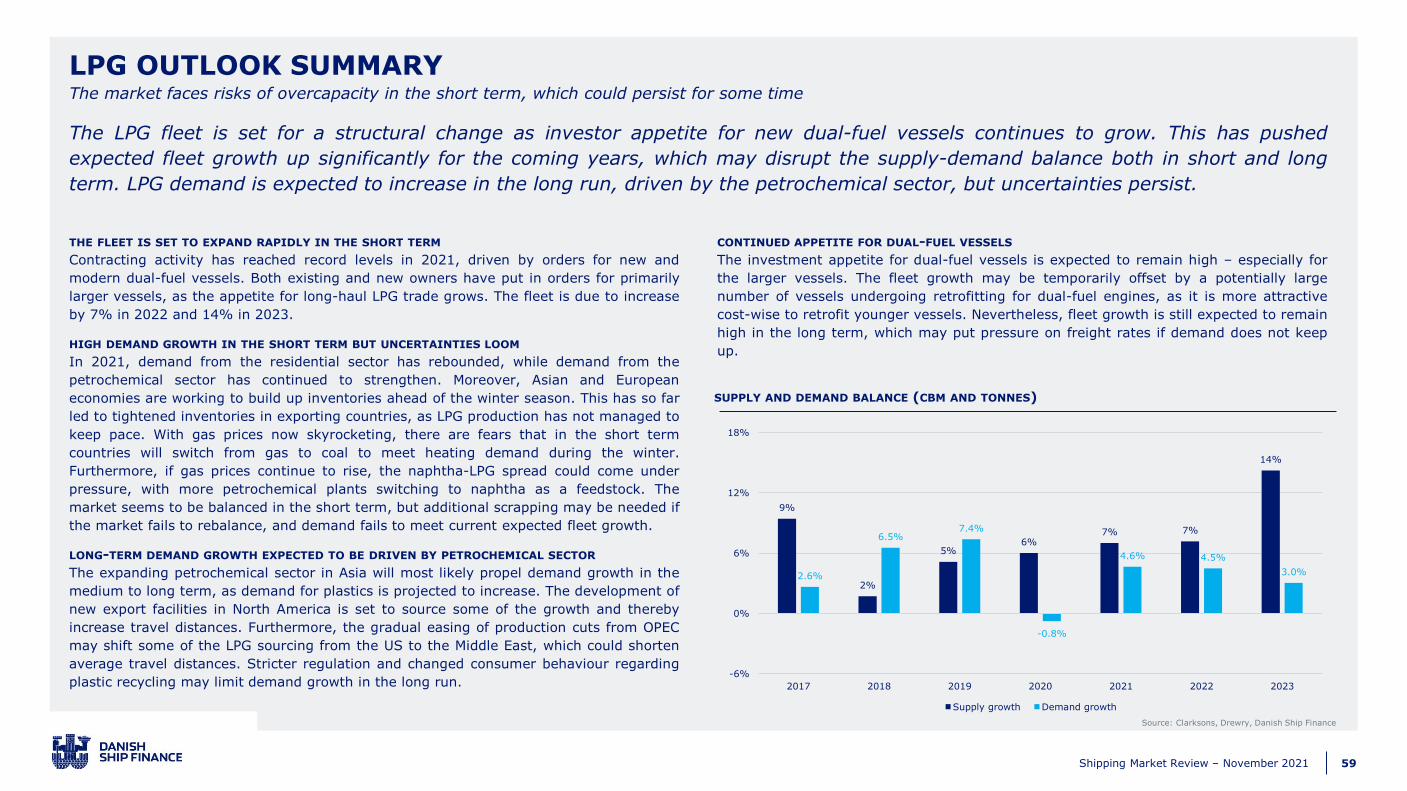
59Shipping Market Review – November 2021
THE FLEET IS SET TO EXPAND RAPIDLY IN THE SHORT TERM
Contracting activity has reached record levels in 2021, driven by orders for new and
modern dual-fuel vessels. Both existing and new owners have put in orders for primarily
larger vessels, as the appetite for long-haul LPG trade grows. The fleet is due to increase
by 7% in 2022 and 14% in 2023.
HIGH DEMAND GROWTH IN THE SHORT TERM BUT UNCERTAINTIES LOOM
In 2021, demand from the residential sector has rebounded, while demand from the
petrochemical sector has continued to strengthen. Moreover, Asian and European
economies are working to build up inventories ahead of the winter season. This has so far
led to tightened inventories in exporting countries, as LPG production has not managed to
keep pace. With gas prices now skyrocketing, there are fears that in the short term
countries will switch from gas to coal to meet heating demand during the winter.
Furthermore, if gas prices continue to rise, the naphtha-LPG spread could come under
pressure, with more petrochemical plants switching to naphtha as a feedstock. The
market seems to be balanced in the short term, but additional scrapping may be needed if
the market fails to rebalance, and demand fails to meet current expected fleet growth.
LONG-TERM DEMAND GROWTH EXPECTED TO BE DRIVEN BY PETROCHEMICAL SECTOR
The expanding petrochemical sector in Asia will most likely propel demand growth in the
medium to long term, as demand for plastics is projected to increase. The development of
new export facilities in North America is set to source some of the growth and thereby
increase travel distances. Furthermore, the gradual easing of production cuts from OPEC
may shift some of the LPG sourcing from the US to the Middle East, which could shorten
average travel distances. Stricter regulation and changed consumer behaviour regarding
plastic recycling may limit demand growth in the long run.
CONTINUED APPETITE FOR DUAL-FUEL VESSELS
The investment appetite for dual-fuel vessels is expected to remain high – especially for
the larger vessels. The fleet growth may be temporarily offset by a potentially large
number of vessels undergoing retrofitting for dual-fuel engines, as it is more attractive
cost-wise to retrofit younger vessels. Nevertheless, fleet growth is still expected to remain
high in the long term, which may put pressure on freight rates if demand does not keep
up.
LPG OUTLOOK SUMMARY
Source: Clarksons, Drewry, Danish Ship Finance
The market faces risks of overcapacity in the short term, which could persist for some time
SUPPLY AND DEMAND BALANCE (CBM AND TONNES)
The LPG fleet is set for a structural change as investor appetite for new dual-fuel vessels continues to grow. This has pushed
expected fleet growth up significantly for the coming years, which may disrupt the supply-demand balance both in short and long
term. LPG demand is expected to increase in the long run, driven by the petrochemical sector, but uncertainties persist.
9%
2%
5%6%
7% 7%
14%
2.6%
6.5%7.4%
-0.8%
4.6% 4.5%
3.0%
-6%
0%
6%
12%
18%
2017 2018 2019 2020 2021 2022 2023
Supply growth Demand growth
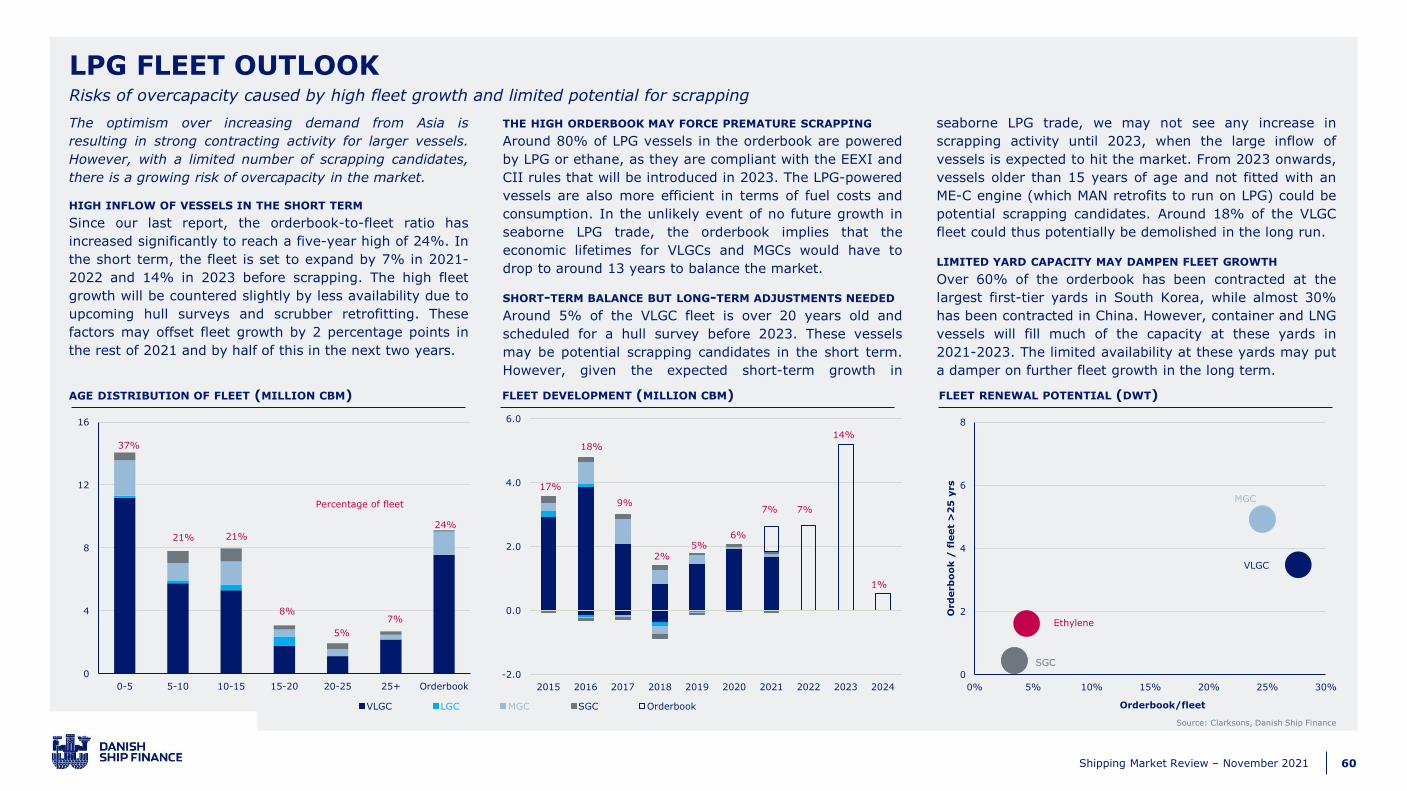
60Shipping Market Review – November 2021
Source: Clarksons, Danish Ship Finance
AGE DISTRIBUTION OF FLEET (MILLION CBM) FLEET DEVELOPMENT (MILLION CBM) FLEET RENEWAL POTENTIAL (DWT)
LPG FLEET OUTLOOKRisks of overcapacity caused by high fleet growth and limited potential for scrapping
The optimism over increasing demand from Asia is
resulting in strong contracting activity for larger vessels.
However, with a limited number of scrapping candidates,
there is a growing risk of overcapacity in the market.
HIGH INFLOW OF VESSELS IN THE SHORT TERM
Since our last report, the orderbook-to-fleet ratio has
increased significantly to reach a five-year high of 24%. In
the short term, the fleet is set to expand by 7% in 2021-
2022 and 14% in 2023 before scrapping. The high fleet
growth will be countered slightly by less availability due to
upcoming hull surveys and scrubber retrofitting. These
factors may offset fleet growth by 2 percentage points in
the rest of 2021 and by half of this in the next two years.
THE HIGH ORDERBOOK MAY FORCE PREMATURE SCRAPPING
Around 80% of LPG vessels in the orderbook are powered
by LPG or ethane, as they are compliant with the EEXI and
CII rules that will be introduced in 2023. The LPG-powered
vessels are also more efficient in terms of fuel costs and
consumption. In the unlikely event of no future growth in
seaborne LPG trade, the orderbook implies that the
economic lifetimes for VLGCs and MGCs would have to
drop to around 13 years to balance the market.
SHORT-TERM BALANCE BUT LONG-TERM ADJUSTMENTS NEEDED
Around 5% of the VLGC fleet is over 20 years old and
scheduled for a hull survey before 2023. These vessels
may be potential scrapping candidates in the short term.
However, given the expected short-term growth in
seaborne LPG trade, we may not see any increase in
scrapping activity until 2023, when the large inflow of
vessels is expected to hit the market. From 2023 onwards,
vessels older than 15 years of age and not fitted with an
ME-C engine (which MAN retrofits to run on LPG) could be
potential scrapping candidates. Around 18% of the VLGC
fleet could thus potentially be demolished in the long run.
LIMITED YARD CAPACITY MAY DAMPEN FLEET GROWTH
Over 60% of the orderbook has been contracted at the
largest first-tier yards in South Korea, while almost 30%
has been contracted in China. However, container and LNG
vessels will fill much of the capacity at these yards in
2021-2023. The limited availability at these yards may put
a damper on further fleet growth in the long term.
37%
21% 21%
8%
5%
7%
24%
0
4
8
12
16
0-5 5-10 10-15 15-20 20-25 25+ Orderbook
Percentage of fleet
17%
18%
9%
2%5%
6%
7% 7%
14%
1%
-2.0
0.0
2.0
4.0
6.0
2015 2016 2017 2018 2019 2020 2021 2022 2023 2024
VLGC LGC MGC SGC Orderbook
VLGC
Ethylene
MGC
SGC
0
2
4
6
8
0% 5% 10% 15% 20% 25% 30%
Ord
erb
oo
k /
fle
et
>2
5 y
rs
Orderbook/fleet

61Shipping Market Review – November 2021
DISCOUNTED FUEL SAVINGS BY VESSEL* AGE (USD MILLIONS)
ORDERBOOK BY OWNER TYPE (SHARE OF VESSELS ON ORDER)
FLEET OUTLOOK DEEP DIVE – NEW OWNERS ENTERING THE MARKETThe large orderbook is partly attributable to new owners entering the VLGC and MGC segments
A growing number of new owners are entering the
LPG market with new and modern vessels. This may
put pressure on existing owners to act by either
contracting new vessels or retrofitting older vessels.
NEW OWNERS ATTRACTED TO THE LPG MARKET
35% of the VLGC orders have been ordered by
companies that are either new to owning VLGC
vessels or have only owned VLGCs in the past two
years. The proportion is even higher for MGCs, for
which 42% of orders are from new or relatively new
owners. The new owners are chartering firms and
vessel owners from other segments, but we are also
seeing completely new owners, with LPG
production/trading firms having started to insource
the logistics part of the supply chain.
GROWING PRESSURE ON EXISTING SHIPOWNERS
Nearly all vessels ordered by new owners are fitted
with dual-fuel engines. The inflow of new vessels is
putting increasing pressure on existing owners, as
there are concerns that they will not be able to
compete in terms of costs on long-haul voyages.
This broadly leaves existing owners with the choice
of either retrofitting existing vessels or renewing
their fleets by contracting new vessels.
STILL LARGE POTENTIAL FOR FLEET RENEWAL
Existing owners that have placed orders for new
vessels have – so far – expanded their fleets
instead of renewing them. The average owner has
reduced its fleet by 10% while placing new orders
that add 60% to its fleet. Moreover, there are many
existing owners that have not placed any orders or
retrofitted for dual-fuel engines. When the entire
orderbook has been delivered, dual-fuel engined
vessels will account for around 26% of the VLGC
segment and 16% of the MGCs. Although existing
owners are expected to reduce their older tonnage
in the long term, there are still many existing
VLGCs and MGCs that are at risk of being
outperformed.
LARGE POTENTIAL TO RETROFIT VLGCS
Some existing owners are also looking into
retrofitting their existing fleets with dual-fuel
engines. The business case depends on many
factors such as costs, fuel consumption and prices.
The VLGCs that have recently been retrofitted have
reported retrofitting costs of around USD 8-9
million, which as a perspective, is three times
higher than a scrubber retrofit cost. Furthermore,
an LPG-powered VLGC on average consumes 10%
less fuel. The fuel price spread between LPG and
VLSFO is estimated to be around USD 75 per toe.
Thus, assuming an economic lifetime of 25 years
and a constant fuel spread, it would be profitable to
retrofit a VLGC vessel up to the age of 15-16 years.
Around 20% of the VLGCs are therefore not
potential candidates for retrofitting.
LESS POLLUTION FROM RETROFITTING
Retrofitting not only brings benefits in terms of
lower voyage emissions; some estimates show that
the retrofitting process also emits 35 times less CO2
than building a new vessel.
0%
25%
50%
75%
100%
VLGC MGC
New owner Relatively new owner Existing owner
0.0
4.0
8.0
12.0
16.0
10 year 15 year 20 year
Source: Clarksons, DNV, MAN Energy, Danish Ship Finance
Initial investment
*The calculations are based on the average fuel consumption of a VLGC with a capacity of 84k cbm
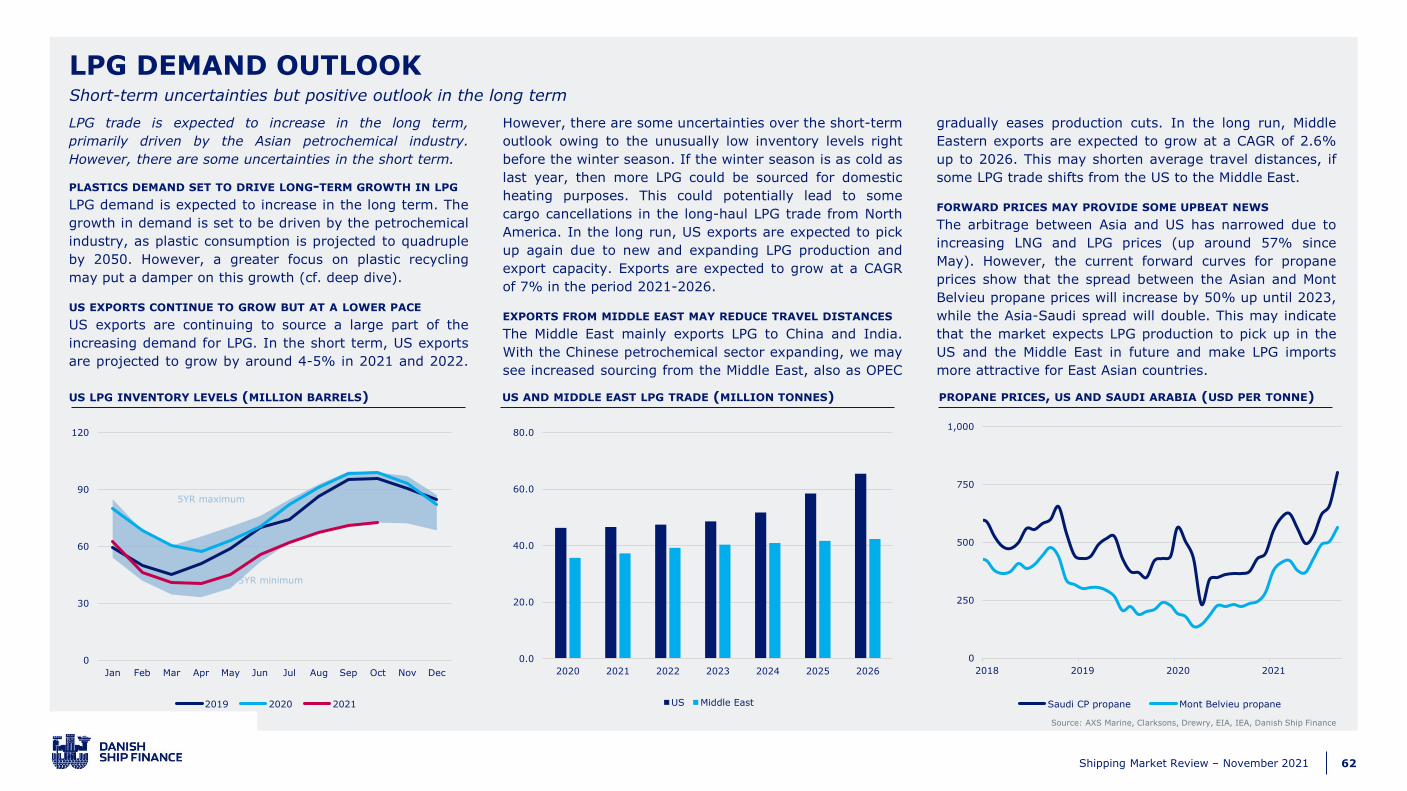
62Shipping Market Review – November 2021
Source: AXS Marine, Clarksons, Drewry, EIA, IEA, Danish Ship Finance
US LPG INVENTORY LEVELS (MILLION BARRELS) US AND MIDDLE EAST LPG TRADE (MILLION TONNES) PROPANE PRICES, US AND SAUDI ARABIA (USD PER TONNE)
LPG DEMAND OUTLOOKShort-term uncertainties but positive outlook in the long term
LPG trade is expected to increase in the long term,
primarily driven by the Asian petrochemical industry.
However, there are some uncertainties in the short term.
PLASTICS DEMAND SET TO DRIVE LONG-TERM GROWTH IN LPG
LPG demand is expected to increase in the long term. The
growth in demand is set to be driven by the petrochemical
industry, as plastic consumption is projected to quadruple
by 2050. However, a greater focus on plastic recycling
may put a damper on this growth (cf. deep dive).
US EXPORTS CONTINUE TO GROW BUT AT A LOWER PACE
US exports are continuing to source a large part of the
increasing demand for LPG. In the short term, US exports
are projected to grow by around 4-5% in 2021 and 2022.
However, there are some uncertainties over the short-term
outlook owing to the unusually low inventory levels right
before the winter season. If the winter season is as cold as
last year, then more LPG could be sourced for domestic
heating purposes. This could potentially lead to some
cargo cancellations in the long-haul LPG trade from North
America. In the long run, US exports are expected to pick
up again due to new and expanding LPG production and
export capacity. Exports are expected to grow at a CAGR
of 7% in the period 2021-2026.
EXPORTS FROM MIDDLE EAST MAY REDUCE TRAVEL DISTANCES
The Middle East mainly exports LPG to China and India.
With the Chinese petrochemical sector expanding, we may
see increased sourcing from the Middle East, also as OPEC
gradually eases production cuts. In the long run, Middle
Eastern exports are expected to grow at a CAGR of 2.6%
up to 2026. This may shorten average travel distances, if
some LPG trade shifts from the US to the Middle East.
FORWARD PRICES MAY PROVIDE SOME UPBEAT NEWS
The arbitrage between Asia and US has narrowed due to
increasing LNG and LPG prices (up around 57% since
May). However, the current forward curves for propane
prices show that the spread between the Asian and Mont
Belvieu propane prices will increase by 50% up until 2023,
while the Asia-Saudi spread will double. This may indicate
that the market expects LPG production to pick up in the
US and the Middle East in future and make LPG imports
more attractive for East Asian countries.
0
30
60
90
120
Jan Feb Mar Apr May Jun Jul Aug Sep Oct Nov Dec
2019 2020 2021
0
250
500
750
1,000
2018 2019 2020 2021
Saudi CP propane Mont Belvieu propane
0.0
20.0
40.0
60.0
80.0
2020 2021 2022 2023 2024 2025 2026
US Middle East
5YR maximum
5YR minimum
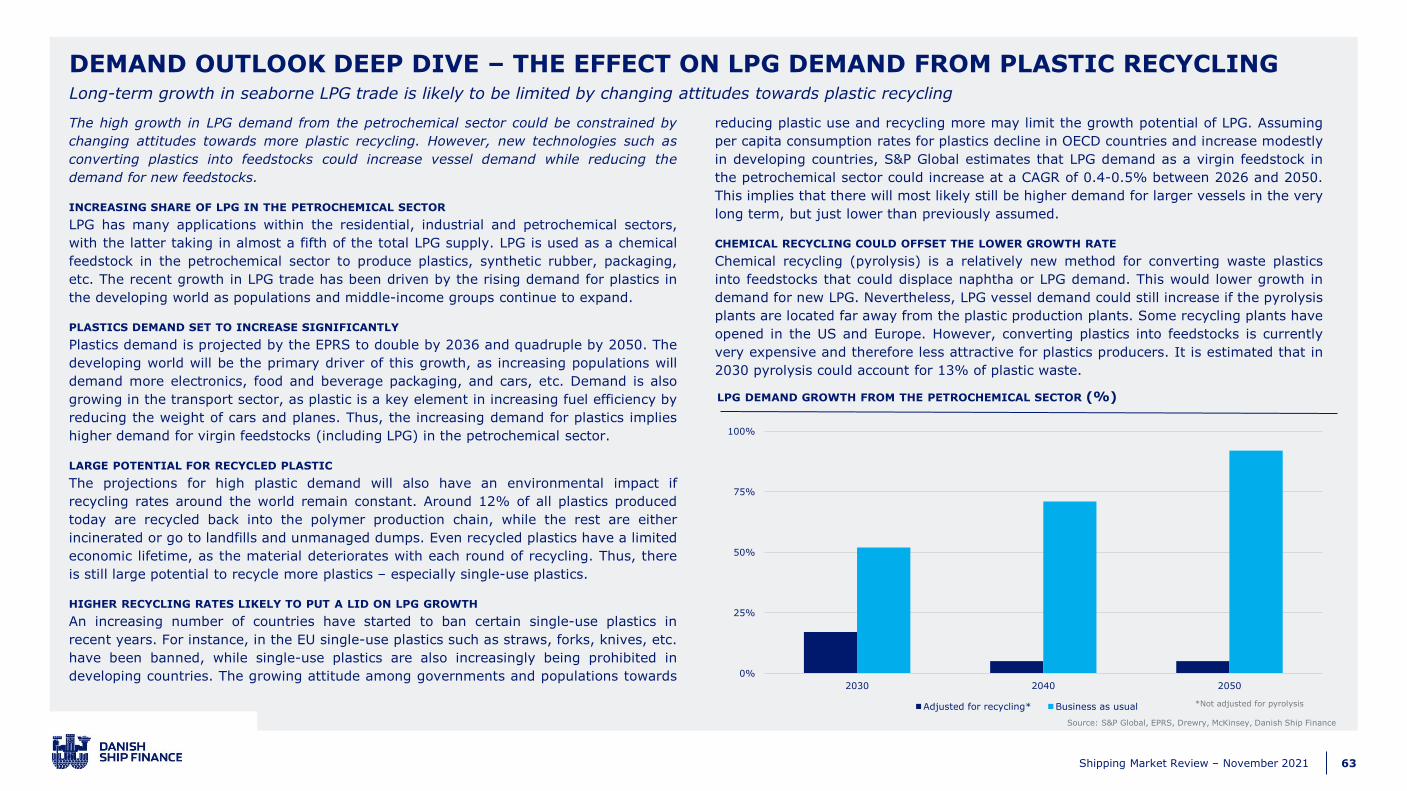
63Shipping Market Review – November 2021
The high growth in LPG demand from the petrochemical sector could be constrained by
changing attitudes towards more plastic recycling. However, new technologies such as
converting plastics into feedstocks could increase vessel demand while reducing the
demand for new feedstocks.
INCREASING SHARE OF LPG IN THE PETROCHEMICAL SECTOR
LPG has many applications within the residential, industrial and petrochemical sectors,
with the latter taking in almost a fifth of the total LPG supply. LPG is used as a chemical
feedstock in the petrochemical sector to produce plastics, synthetic rubber, packaging,
etc. The recent growth in LPG trade has been driven by the rising demand for plastics in
the developing world as populations and middle-income groups continue to expand.
PLASTICS DEMAND SET TO INCREASE SIGNIFICANTLY
Plastics demand is projected by the EPRS to double by 2036 and quadruple by 2050. The
developing world will be the primary driver of this growth, as increasing populations will
demand more electronics, food and beverage packaging, and cars, etc. Demand is also
growing in the transport sector, as plastic is a key element in increasing fuel efficiency by
reducing the weight of cars and planes. Thus, the increasing demand for plastics implies
higher demand for virgin feedstocks (including LPG) in the petrochemical sector.
LARGE POTENTIAL FOR RECYCLED PLASTIC
The projections for high plastic demand will also have an environmental impact if
recycling rates around the world remain constant. Around 12% of all plastics produced
today are recycled back into the polymer production chain, while the rest are either
incinerated or go to landfills and unmanaged dumps. Even recycled plastics have a limited
economic lifetime, as the material deteriorates with each round of recycling. Thus, there
is still large potential to recycle more plastics – especially single-use plastics.
HIGHER RECYCLING RATES LIKELY TO PUT A LID ON LPG GROWTH
An increasing number of countries have started to ban certain single-use plastics in
recent years. For instance, in the EU single-use plastics such as straws, forks, knives, etc.
have been banned, while single-use plastics are also increasingly being prohibited in
developing countries. The growing attitude among governments and populations towards
reducing plastic use and recycling more may limit the growth potential of LPG. Assuming
per capita consumption rates for plastics decline in OECD countries and increase modestly
in developing countries, S&P Global estimates that LPG demand as a virgin feedstock in
the petrochemical sector could increase at a CAGR of 0.4-0.5% between 2026 and 2050.
This implies that there will most likely still be higher demand for larger vessels in the very
long term, but just lower than previously assumed.
CHEMICAL RECYCLING COULD OFFSET THE LOWER GROWTH RATE
Chemical recycling (pyrolysis) is a relatively new method for converting waste plastics
into feedstocks that could displace naphtha or LPG demand. This would lower growth in
demand for new LPG. Nevertheless, LPG vessel demand could still increase if the pyrolysis
plants are located far away from the plastic production plants. Some recycling plants have
opened in the US and Europe. However, converting plastics into feedstocks is currently
very expensive and therefore less attractive for plastics producers. It is estimated that in
2030 pyrolysis could account for 13% of plastic waste.
DEMAND OUTLOOK DEEP DIVE – THE EFFECT ON LPG DEMAND FROM PLASTIC RECYCLING
Source: S&P Global, EPRS, Drewry, McKinsey, Danish Ship Finance
Long-term growth in seaborne LPG trade is likely to be limited by changing attitudes towards plastic recycling
LPG DEMAND GROWTH FROM THE PETROCHEMICAL SECTOR (%)
0%
25%
50%
75%
100%
2030 2040 2050
Adjusted for recycling* Business as usual *Not adjusted for pyrolysis

64Shipping Market Review – November 2021
THIS PAGE IS INTENTIONALLY LEFT BLANK

65Shipping Market Review – November 2021
www.shipfinance.dk
Related Documents