Shifts in plant respiration and carbon use efficiency at a large-scale drought experiment in the eastern Amazon D. B. Metcalfe 1,9 , P. Meir 2 , L. E. O. C. Araga ˜o 3 , R. Lobo-do-Vale 4 , D. Galbraith 1,2 , R. A. Fisher 5 , M. M. Chaves 4 , J. P. Maroco 6 , A. C. L. da Costa 7 , S. S. de Almeida 8 , A. P. Braga 7 , P. H. L. Gonc ¸alves 7 , J. de Athaydes 7 , M. da Costa 7 , T. T. B. Portela 7 , A. A. R. de Oliveira 7 , Y. Malhi 1 and M. Williams 2 1 Centre for the Environment, University of Oxford, Oxford, UK; 2 School of Geosciences, University of Edinburgh, Edinburgh, UK; 3 School of Geography, University of Exeter, Exeter, UK; 4 Instituto Superior de Agronomia, Universidade Tecnica de Lisboa, Lisbon, Portugal; 5 Los Alamos National Laboratory, Los Alamos, NM, USA; 6 Instituto de Tecnologia Quimica e Biologica, Oeiras, Portugal; 7 Centro de Geocie ˆncias, Universidade Federal do Para ´, Belem, Brazil; 8 Coordenac ¸a ˜o de Bota ˆnica, Museu Paraense Emilio Goeldi, Brazil; 9 Present address: Department of Forest Ecology and Management, Swedish University of Agricultural Sciences, Skogsmarksgra ¨nd, Umea ˚, Sweden Author for correspondence: Daniel B. Metcalfe Tel.: + 44 1865 285182 Email: [email protected] Received: 15 February 2010 Accepted: 19 April 2010 New Phytologist (2010) 187: 608–621 doi: 10.1111/j.1469-8137.2010.03319.x Key words: Amazon rain forest, carbon cycling, carbon dioxide, carbon use efficiency, drought, gross primary productivity, net primary productivity, partitioning. Summary • The effects of drought on the Amazon rainforest are potentially large but remain poorly understood. Here, carbon (C) cycling after 5 yr of a large-scale through-fall exclusion (TFE) experiment excluding about 50% of incident rainfall from an east- ern Amazon rainforest was compared with a nearby control plot. • Principal C stocks and fluxes were intensively measured in 2005. Additional minor components were either quantified in later site measurements or derived from the available literature. • Total ecosystem respiration (R eco ) and total plant C expenditure (PCE, the sum of net primary productivity (NPP) and autotrophic respiration (R auto )), were ele- vated on the TFE plot relative to the control. The increase in PCE and R eco was mainly caused by a rise in R auto from foliage and roots. Heterotrophic respiration did not differ substantially between plots. NPP was 2.4 ± 1.4 t C ha )1 yr )1 lower on the TFE than the control. Ecosystem carbon use efficiency, the proportion of PCE invested in NPP, was lower in the TFE plot (0.24 ± 0.04) than in the control (0.32 ± 0.04). • Drought caused by the TFE treatment appeared to drive fundamental shifts in ecosystem C cycling with potentially important consequences for long-term forest C storage. Introduction Tropical forests play a key role in global biogeochemical cycles and climate. The Amazon rainforest alone contains 70–120 billion tonnes of carbon (C) in vegetation, an amount of C equivalent to over a decade of global anthro- pogenic emissions (Houghton et al., 2001; Malhi et al., 2006; Saatchi et al., 2007). Recent analyses predict an increased probability of greater drought frequency and severity across the Amazon over the next 100 yr because of climate change, regional deforestation and fire (Werth & Avissar, 2002; Christensen et al., 2007; Cox et al., 2008; Harris et al., 2008; Malhi et al., 2008). The effects of drought upon ecosystem structure and function in the Amazon are potentially large but remain poorly defined. Relatively little information from field studies is available to test whether the modelled representation of drought effects in the region – decreased forest photosynthesis and increased soil CO 2 efflux (Tian et al., 1998; Peylin et al., 2005; Zeng et al., 2005) – is realistic. Model projections are constrained particularly by a lack of detailed knowledge about the physi- cal controls upon ecosystem C partitioning and soil CO 2 efflux. A range of studies from drought experiments in the Amazon have examined numerous C cycle components in isolation (Nepstad et al., 2002; Davidson et al., 2004, 2008; Sotta et al., 2007; Metcalfe et al., 2007a, 2008, 2010; Brando et al., 2008; da Silva et al., 2009; Meir et al., 2009; da Costa et al., 2010), but none have yet synthesized these New Phytologist Research 608 New Phytologist (2010) 187: 608–621 www.newphytologist.com ȑ The Authors (2010) Journal compilation ȑ New Phytologist Trust (2010)

Welcome message from author
This document is posted to help you gain knowledge. Please leave a comment to let me know what you think about it! Share it to your friends and learn new things together.
Transcript
Shifts in plant respiration and carbon use efficiency at alarge-scale drought experiment in the eastern Amazon
D. B. Metcalfe1,9, P. Meir2, L. E. O. C. Aragao3, R. Lobo-do-Vale4, D. Galbraith1,2, R. A. Fisher5,
M. M. Chaves4, J. P. Maroco6, A. C. L. da Costa7, S. S. de Almeida8, A. P. Braga7, P. H. L. Goncalves7,
J. de Athaydes7, M. da Costa7, T. T. B. Portela7, A. A. R. de Oliveira7, Y. Malhi1 and M. Williams2
1Centre for the Environment, University of Oxford, Oxford, UK; 2School of Geosciences, University of Edinburgh, Edinburgh, UK; 3School of Geography,
University of Exeter, Exeter, UK; 4Instituto Superior de Agronomia, Universidade Tecnica de Lisboa, Lisbon, Portugal; 5Los Alamos National Laboratory,
Los Alamos, NM, USA; 6Instituto de Tecnologia Quimica e Biologica, Oeiras, Portugal; 7Centro de Geociencias, Universidade Federal do Para, Belem,
Brazil; 8Coordenacao de Botanica, Museu Paraense Emilio Goeldi, Brazil; 9Present address: Department of Forest Ecology and Management, Swedish
University of Agricultural Sciences, Skogsmarksgrand, Umea, Sweden
Author for correspondence:Daniel B. Metcalfe
Tel.: + 44 1865 285182
Email: [email protected]
Received: 15 February 2010Accepted: 19 April 2010
New Phytologist (2010) 187: 608–621doi: 10.1111/j.1469-8137.2010.03319.x
Key words: Amazon rain forest, carboncycling, carbon dioxide, carbon useefficiency, drought, gross primaryproductivity, net primary productivity,partitioning.
Summary
• The effects of drought on the Amazon rainforest are potentially large but remain
poorly understood. Here, carbon (C) cycling after 5 yr of a large-scale through-fall
exclusion (TFE) experiment excluding about 50% of incident rainfall from an east-
ern Amazon rainforest was compared with a nearby control plot.
• Principal C stocks and fluxes were intensively measured in 2005. Additional
minor components were either quantified in later site measurements or derived
from the available literature.
• Total ecosystem respiration (Reco) and total plant C expenditure (PCE, the sum
of net primary productivity (NPP) and autotrophic respiration (Rauto)), were ele-
vated on the TFE plot relative to the control. The increase in PCE and Reco was
mainly caused by a rise in Rauto from foliage and roots. Heterotrophic respiration
did not differ substantially between plots. NPP was 2.4 ± 1.4 t C ha)1 yr)1 lower
on the TFE than the control. Ecosystem carbon use efficiency, the proportion of
PCE invested in NPP, was lower in the TFE plot (0.24 ± 0.04) than in the control
(0.32 ± 0.04).
• Drought caused by the TFE treatment appeared to drive fundamental shifts in
ecosystem C cycling with potentially important consequences for long-term forest
C storage.
Introduction
Tropical forests play a key role in global biogeochemicalcycles and climate. The Amazon rainforest alone contains70–120 billion tonnes of carbon (C) in vegetation, anamount of C equivalent to over a decade of global anthro-pogenic emissions (Houghton et al., 2001; Malhi et al.,2006; Saatchi et al., 2007). Recent analyses predict anincreased probability of greater drought frequency andseverity across the Amazon over the next 100 yr because ofclimate change, regional deforestation and fire (Werth &Avissar, 2002; Christensen et al., 2007; Cox et al., 2008;Harris et al., 2008; Malhi et al., 2008). The effects ofdrought upon ecosystem structure and function in the
Amazon are potentially large but remain poorly defined.Relatively little information from field studies is available totest whether the modelled representation of drought effectsin the region – decreased forest photosynthesis and increasedsoil CO2 efflux (Tian et al., 1998; Peylin et al., 2005; Zenget al., 2005) – is realistic. Model projections are constrainedparticularly by a lack of detailed knowledge about the physi-cal controls upon ecosystem C partitioning and soil CO2
efflux. A range of studies from drought experiments in theAmazon have examined numerous C cycle components inisolation (Nepstad et al., 2002; Davidson et al., 2004, 2008;Sotta et al., 2007; Metcalfe et al., 2007a, 2008, 2010;Brando et al., 2008; da Silva et al., 2009; Meir et al., 2009;da Costa et al., 2010), but none have yet synthesized these
NewPhytologistResearch
608 New Phytologist (2010) 187: 608–621
www.newphytologist.com� The Authors (2010)
Journal compilation � New Phytologist Trust (2010)

individual components to construct a full C budget of adroughted Amazon forest.
The overall purpose of this study, therefore, was to examinethe impacts of a large-scale through-fall exclusion (TFE)treatment in an eastern Amazon primary rainforest onecosystem C cycling and partitioning. Our analysis here iscentred on measurements made across one full seasonalcycle, 4 yr after imposition of the TFE treatment, in 2005,comparing data from the TFE and a nearby control plot.While the TFE treatment was not replicated (Hurlbert,1984, 2004), it provides insights into ecosystem processesthat would otherwise have been impossible to capture insmaller-scale experiments (Carpenter, 1996; Sullivan, 1997;Osmond et al., 2004; Stokstad, 2005). On both plots, forthe focal period of 2005, we estimated and integratedall key ecosystem C fluxes to measure forest net primaryproductivity (NPP) and ecosystem respiration (Reco):
Reco ¼ Rhetero þ Rauto Eqn 1
where Rhetero and Rauto represent R from heterotrophic andautotrophic sources, respectively. The total amount of Cexpended by trees at a stand scale (plant C expenditure,PCE) was estimated as:
PCE ¼ NPPþ Rauto Eqn 2
Under steady-state conditions, where C inputs equal out-puts, the following should hold true:
GPP � PCE � Reco Eqn 3
where GPP (gross primary productivity) is the total quan-tity of C entering the forest via photosynthesis. We assessedwhether this assumption was valid for both plots by com-paring GPP estimated from a previous study, which applieda site-parameterized ecophysiological model to both plots(Fisher et al., 2007), with our estimates of plot-level PCEand Reco. In the case of a substantial imbalance between treeGPP and PCE
NTP ¼ PCE� GPP Eqn 4
We examined the implications for the net change in treeC balance (net tree production, NTP).
Materials and Methods
Field site and experimental design
The study site is located in the Caxiuana National Forest,Para State, northeastern Brazil (1�43¢3.5¢¢S, 51�27¢36¢¢W).The forest is a lowland terra firme rainforest with high annualrainfall (2000–2500 mm) and a pronounced dry season
(Table 1). Across the entire year, mean soil surface tempera-ture is approximately 25�C, with little seasonal and diurnalvariation. The soil type is a highly weathered yellow Oxisol(Quesada et al., 2009). In January 2002, a 1 ha plot (TFEplot) was modified by the installation of plastic panels placedat 1–2 m above the ground, excluding approximately 50%of incident rainfall, and causing a shift in soil water availabil-ity, plant water relations, leaf physiology and, ultimately,tree growth and survival (Fig. 1). The change in annual rain-fall magnitude and dry season length imposed by the TFEtreatment simulated some key aspects of a precipitationregime more commonly encountered in some savannas anddeciduous forests in the region (Betts et al., 2004; Malhiet al., 2009a), which is consistent with long-term climatepredictions for the region from at least one major globalclimate model- HadCM3 (Collins et al., 2001).
Air temperature beneath the TFE panels was c. 2�Cwarmer than ambient air during the dry season, althoughsoil temperature remained similar to ambient valuesthroughout. During the wet season, air temperatures aboveand below the TFE panels were similar (da Costa et al.,2006). The boundary of the TFE plot was trenched to adepth of 1–2 m and lined with plastic to minimize lateralingress of water from adjacent, wetter soil. The control plotperimeter was also trenched to avoid confounding treat-ment effects. All measurements were taken at least 10 minside the perimeter of each plot to minimize edge effects.
Above-ground carbon stocks and solid fluxes
Canopy leaf area density and leaf morphology data werederived from Metcalfe et al. (2010). To calculate leaf area
Table 1 Key vegetation and soil features for each plot surveyed
Plot characteristics Control TFE
VegetationTree number ha)1 532 501Tree species number 118 113Surface litter mass (t C ha)1) 2.7 ± 0.2 3.4 ± 0.5
Soil 0–10 cmBulk density (t m3) 1.4 1.2Clay content (%) 18 13Silt content (%) 5 4Sand content (%) 77 83pH 4 4Carbon concentration (mg g)1) 9 12Nitrogen concentration (mg g)1) 0.4 0.3Phosphorus concentration (mg g)1) 0.1 0.2Carbon : nitrogen ratio 23 35Soil cation exchange (cmol dm)3) 0.8 0.7
Values indicate mean ± 95% confidence intervals (where availableand appropriate). Surface litter means are derived from 25replicates. TFE, through-fall exclusion. Tree number and basal arearepresent all individuals over 10 cm diameter at breast height,measured in January 2005. Soil values are collated from data inSotta et al. (2007).
NewPhytologist Research 609
� The Authors (2010)
Journal compilation � New Phytologist Trust (2010)
New Phytologist (2010) 187: 608–621
www.newphytologist.com

index (LAI, m2 leaf m)2 ground), images of the canopywere recorded at 25 locations within each plot in late 2004and early 2007 with a digital camera and hemisphericallens; total LAI was apportioned into canopy height catego-ries with LAI height profile data collected at a tower in thecentre of each plot. Mean leaf mass per unit area (LMA) foreach plot was calculated for the same periods by harvestingleaves from different canopy layers, determining area anddry mass of each leaf, then dividing dry mass by one-sidedarea. Values intermediate to those calculated on the twosampling dates were used to estimate LAI and LMA in2005. To derive estimates of total plot foliar biomass, LAIand LMA from each canopy layer were multiplied and thenthe estimated foliar biomass for each layer was summed.
The monthly flux of litter falling from the canopy in2005 was recorded in 20 mesh traps (area = 1 m2 per trap)placed at 1 m above the ground surface on the control plot,and above the plastic panels on the TFE plot (height 2–2.5 m). Litter retrieved from the traps was dried at 70�C toconstant mass, separated into leaves, flowers, fruits and
seeds, woody material < 2 cm diameter and weighed.Previous studies have shown that 36–40% of litterfall isintercepted before it reaches litter traps and decomposedwithin the canopy (Edwards, 1977; Frangi & Lugo, 1985),so we multiplied recorded litterfall by 1.3 to providea conservative correction for this ‘canopy storage’ term. Inaddition, litterfall collection in mesh traps does not accountfor material lost via herbivory (12–30% of canopy leaf mass,Clark et al., 2001). Therefore, we conservatively estimatedmean herbivory on both plots as 10% of leaf litterfall.
Branches > 2 cm diameter falling from live trees were notadequately sampled by mesh traps and so this flux was sepa-rately monitored between December 2008 and August2009 by collecting, drying at 70�C to constant mass andweighing all woody material > 2 cm diameter whichappeared along four 1 · 80 m transects per plot that hadpreviously been cleared of all woody material (see theGround carbon stocks and solid fluxes section).
Plot values for live and dead stem standing biomass,growth, recruitment and mortality were obtained from da
(a)
(b)
(c)
(d)
(e)
(f)
(g)
(h)
Fig. 1 Through-fall exclusion (TFE) effects onkey forest processes before, during and afterthe study period of 2005 (highlighted). Greycircles and bars, control; closed circles andbars, through-fall exclusion. The arrow at thebase of each panel indicates the beginning ofthe TFE treatment. (a) Rainfall is presented asdaily totals (grey line), 30 d moving average(black line) and annual totals for thepreceding year (black bars). (b) Soil volumetricmoisture values before and after 2005represent the mean of hourly measurementsfrom time domain reflectometer probes(TDR) installed at 5,100 and 250 cm soildepths in a single soil pit on each plot. During2005, soil moisture values are the mean of 25TDR soil surface (30 cm soil depth) monthlymeasurements along a regularly spaced gridwithin each plot. (c) Sapflow and leaf waterpotential (d) data are derived from Fisheret al. (2006). Leaf dark respiration (R) (e)and leaf area index (f) data are reproducedfrom Metcalfe et al. (2010). (g) Tree stemgrowth and mortality (h) estimates includeonly stems > 10 cm diameter at breast height(DBH); these data are reproduced from daCosta et al. (2010). Error bars indicate 95%confidence intervals around plot means.Given the unreplicated nature of the plots,error bars represent only within-plot spatialvariation and measurement error rather thanlandscape scale heterogeneity.
610 Research
NewPhytologist
� The Authors (2010)
Journal compilation � New Phytologist Trust (2010)
New Phytologist (2010) 187: 608–621
www.newphytologist.com

Costa et al. (2010). Annual stem growth increment wasrecorded for all live tree stems > 10 cm diameter at breastheight (DBH, 1.35 m) between 2001 and 2008.Recruitment of new trees into the > 10 cm DBH categorywas recorded in August 2005. Tree diameter was convertedto mean (± 95% confidence intervals) above-ground stemmass using eight previously published allometric equations(da Costa et al., 2010). Mortality was assessed as death ordisappearance of previously permanently marked stems.
In addition to stem mass loss via mortality, we included aterm for mass loss via live tree damage (heartwood rot,crown and partial trunk loss) of 0.44 ± 0.10 t C ha)1 yr)1
from Chambers et al. (2001). The biomass of smaller stemswas estimated once in March 2005 by recording diameterof all stems between 2 and 10 cm DBH in a 20 · 20 marea on both plots, and using the same DBH–biomass con-version equations as for the larger stems using mean wooddensity for trees > 10 cm DBH on each plot (0.7 g cm)3),and extrapolating this value to the rest of the plot area. Thegrowth of stems between 2 and 10 cm DBH was estimatedby quantifying the proportion of growth to biomassfor stems > 10 cm DBH, and multiplying this value byestimated plot biomass of stems between 2 and 10 cmDBH. This method assumed that tree growth wassimilar across size classes, which was unlikely, but inthe absence of direct measurements of the growth ofstems 2–10 cm DBH it yielded an approximation of thisrelatively minor component (< 1% of total NPP in ouranalysis).
Ground carbon stocks and solid fluxes
Coarse woody debris (CWD) necromass was calculated inDecember 2009 by removing and weighing in situ allwoody material > 2 cm diameter along four 1 · 80 m tran-sects within each plot. A subset of this material was thendried at 70�C to constant mass and reweighed to derive acorrection factor for the wet mass values from the rest of thematerial. Then each piece of the subset was measured withcallipers to estimate surface area. The correlation betweenpiece surface area (cm2) and dry weight (g) was used to esti-mate surface area of all pieces collected on the plots(r2 = 0.81, mass = 16.49 · area0.63). Finally, each piecefrom the subset was placed into a water-filled cylinder tomeasure piece volume, and hence tissue density (drymass ⁄ volume). Density was estimated separately for fiveclasses of wood decomposition following Harmon et al.(1995). In cases where material within the transect was toolarge to remove and weigh manually, the diameter at threepoints was recorded to estimate surface area and volume,and wood density associated with the decomposition classwas used to convert the volume of each piece into mass.Total plot CWD mass and surface area were calculated asthe sum of the smaller pieces removed from the transects
and the larger pieces remaining on the transects. To back-calculate CWD biomass for 2005, our study period, weassumed that the rate of CWD accumulation necessary toachieve the observed 2009 plot difference was proportionalto stem mortality, quantified annually by da Costa et al.(2010).
Ground surface fine litter mass (including woodymaterial < 2 cm diameter) was collected from 25 areas(0.25 m2) in each plot in December 2009. Litter sampleswere cleaned of inorganic detritus, dried at 70�C toconstant mass and weighed.
Fine root biomass and production data were derivedfrom Metcalfe et al. (2008). Briefly, 27 soil cores down to30 cm depth were removed from each plot in 2005, fineroots (< 2 mm diameter) were removed following themethod of Metcalfe et al. (2007b), dried at 70�C to con-stant mass and then weighed. Fine roots below 30 cm andcoarse roots (> 2 mm diameter) were not sampled withthese cores. To correct for this, four 1.5 · 1.5 m holes wereexcavated to 3 m soil depth in each plot in June 2008. Allroots retrieved were collected, dried at 70�C to constantmass and weighed. Dry root mass was apportioned into soildepth and diameter categories. From these data (DGalbraith, unpublished), the proportions of fine root massthrough the entire soil column down to 3 m soil depthlocated within the surface (control = 0.63, TFE = 0.65),and of total root mass represented by roots < 2 mm diame-ter (control = 0.08, TFE = 0.49), were calculated andapplied to the measured surface fine root values to estimatetotal root mass and production down to 3 m soil depth andfor all root diameters. Because of the low sample size in thisstudy, we applied error estimates of 13% around coarse rootstanding biomass and growth values from a more extensivesampling programme in a similar forest (Silver et al., 2000).To back-calculate coarse root biomass for 2005, our mainperiod of interest, we assumed that the rate of coarse rootmortality necessary to achieve the observed differencebetween plots in 2008 was proportional to the measuredrate of stem mortality (da Costa et al., 2010). To quantifycoarse root growth, the proportion of growth to biomass ofstems > 10 cm DBH was quantified, and this value wasmultiplied by the estimated plot biomass of coarse roots,down to 3 m soil depth. This method assumed that coarseroot growth and stem growth were similar and that coarseroot growth was constant down the soil profile. This was asource of uncertainty but in the absence of direct measure-ments of coarse root growth anywhere in the soil profile andfine root growth below 30 cm soil depth it yielded anapproximation of this relatively minor component (< 11%of total NPP in our analysis).
Net dissolved organic carbon (DOC) export (DOCrunoff – DOC deposition) was taken as 0.19 ± 0.07 t Cha)1 yr)1 from an intensive study of DOC dynamics in acentral Amazon catchment (Waterloo et al., 2006).
NewPhytologist Research 611
� The Authors (2010)
Journal compilation � New Phytologist Trust (2010)
New Phytologist (2010) 187: 608–621
www.newphytologist.com

Carbon dioxide efflux
Leaf area index and leaf dark R data were derived fromMetcalfe et al. (2010). Leaf dark R was recorded from leavesthroughout the canopy in 2003 and 2007. All measurementcampaigns sampled fully expanded, nonsenescent, undiseasedleaves. Leaf dark R was recorded after CO2 gas exchange indark conditions had stabilized (usually after c. 10 min), atambient air CO2 concentration (360–380 ppm) and humid-ity (60–80%). Estimates of leaf dark R per unit leaf area in eachcanopy layer was multiplied by mean plot LAI located withinthe same canopy layer, and then all layers were summed toderive plot-level estimates of night-time leaf R assuming 12 hof darkness each day throughout the year and a constant tem-perature of 25�C (Metcalfe et al., 2010). Values for 2005 wereestimated as the mean of the measurements in November2003 and January 2007. Leaf light R on both plots wasestimated as 67% of leaf dark R from Lloyd et al. (2009), whoused light response curves from another lowland Amazon for-est (Domingues et al., 2005) and applied light-inhibitionequations from eucalyptus seedlings (Atkin et al., 2000).
Emissions of volatile organic compounds (VOCs) consti-tute another minor source of C from leaves. We used a value of0.13 ± 0.05 t C ha)1 yr)1 for this component (Malhi et al.,2009b) which sums published estimates of VOC, includingisoprene and terpene (Kuhn et al., 2007), and methane(do Carmo et al., 2006) emissions from tropical forests.
No site measurements of live tree stem R at 1.3 m wereavailable, so a value of 0.6 ± 0.08 lmol m)2 stem surfaces)1 was taken from the existing literature (Nepstad et al.,2002; Meir & Grace, 2002) and applied to both plots. Thismay underestimate total stem R rates since portions of stemhigher up (Yoda, 1983) and branches (Cavaleri et al., 2006)tend to have higher CO2 effluxes than the main bole nearthe ground. Tree stem area was estimated using a taperfunction to estimate stem basal diameter for all trees> 2 cm DBH on both plots (Chambers et al., 2000) andthen applying an equation relating basal diameter to totalstem surface area (Yoneda, 1993) from 315 terra firmeAmazon trees (Chambers et al., 2004). Plot-level scale stemC efflux was estimated by multiplying Rstem per unit stemarea by total plot live stem area.
Soil CO2 efflux data were derived from Metcalfe et al.(2007a). Total soil CO2 efflux (Rsoil) was recorded eachmonth through 2005 at 25 points in each plot. Rsoil was par-titioned into contributions from surface organic litter, rootsand soil organic matter at nine points on each plot in the dry(November 2004) and wet (June 2005) seasons. Monthlycontributions from each of the Rsoil components were line-arly interpolated between these two periods.
R from coarse woody debris was recorded once in August2009 from 12 to 16 pieces of dead wood on the ground foreach of the five decomposition classes (see the Groundcarbon stocks and solid fluxes section for details of the
CWD necromass survey) randomly selected on the controland TFE plots. We included the R contribution fromstanding dead trees using the same surface area estimationmethodology as live stems, and assuming they had similarCO2 efflux rates to ground CWD, which was a source ofuncertainty but in the absence of detailed informationabout wood decomposition patterns in the tropics it yieldedan approximation of this relatively minor component(< 11% of total R in our analysis). Plot-level dead wood Rwas estimated by multiplying stem R per unit dead woodarea by total plot dead wood surface area.
Data analysis and presentation
The lack of treatment replication precluded fully comparativestatistical analysis (Hurlbert, 1984, 2004), but 95% confi-dence intervals were calculated around means as an indicationof the reliability of the observed mean differences at a plotscale. Throughout the manuscript, therefore, error bars repre-sent only within-plot spatial variation and measurement errorrather than landscape-scale heterogeneity. Errors were propa-gated by quadrature of absolute errors for addition and sub-traction, and quadrature of relative errors for division andmultiplication (Aragao et al., 2009). This assumes that theerrors are independent and normally distributed. All R termswere summed into Rauto and Rhetero contributions, whichtogether make up Reco. Total NPP was calculated as the sumof all plant growth components, and PCE was then estimatedas the sum of total NPP and Rauto. Carbon use efficiency(CUE) at an ecosystem level and individually for differentplant components (canopy, stems, roots) was calculated as:
CUE ¼ NPP
NPPþ RautoEqn 5
Turnover time (1 ⁄ turnover rate) estimates for specificcomponents on the control plot were derived by dividing Cfluxes by stocks. Independent checks on C flux estimateswere derived from eddy covariance (Carswell et al., 2002)and detailed modelling studies (Fisher et al., 2007) at thesite, albeit for different time periods from the current study.In addition, data were compared to published equations,which use a mass balance approach assuming steady-stateconditions, to estimate total below-ground allocation(TBCA; equations from Raich & Nadelhoffer (1989) weremodified to include contributions from coarse wood, rootlitter and DOC) and soil CO2 efflux (Malhi et al., 2009b)
Results
Ecosystem C balance, partitioning and CUE
Estimated PCE during the period of measurement was slightlygreater in the TFE (33.9 ± 3.6 t C ha)1 yr)1) than in the
612 Research
NewPhytologist
� The Authors (2010)
Journal compilation � New Phytologist Trust (2010)
New Phytologist (2010) 187: 608–621
www.newphytologist.com

control plot (33.0 ± 2.9 t C ha)1 yr)1) (Table 2, Fig. 2). Reco
was elevated on the TFE plot compared with the control plot,although there was substantial uncertainty around the plotmeans (Table 2, Fig. 2; 36.6 ± 3.7 and 32.6 ± 2.9 t Cha)1 yr)1, respectively). Greater Reco in the TFE plot wasmainly attributable to the higher Rauto flux of25.8 ± 3.4 t C ha)1 yr)1 compared with 22.4 ± 2.8 t Cha)1 yr)1 in the control (Table 2, Fig. 2), which in turn wasdriven by a rise in canopy and root R (Table 2, Fig. 3b). By con-trast, Rhetero was similar between plots (c. 10.5 t C ha)1 yr)1)because greater estimated TFE dead wood R was offset by lowersoil heterotrophic CO2 efflux (Table 2, Fig. 3b).
Total estimated NPP was 2.4 ± 1.4 t C ha)1 yr)1 loweron the TFE plot relative to the control (Table 2, Fig. 3a).On both plots, approximately half of NPP was derived fromthe canopy, with the remainder split evenly between rootsand stems (Table 2, Fig. 3a). The trees on both plots allo-cated slightly more total assimilated C (NPP and Rauto) tothe canopy (c. 38%) than stems (c. 33%) or roots (c. 28%),of which 70–80% was comprised of Rauto for every compo-nent (Table 2). On both plots, canopy CUE was higherthan either stem or root CUE (Fig. 4). The TFE treatmentwas associated with a lower CUE in all plant organs,but particularly canopy CUE (control, 0.41 ± 0.07;TFE, 0.30 ± 0.07). The overall effect was a lowerecosystem CUE in the TFE plot of 0.24 ± 0.04 comparedwith 0.32 ± 0.04 in the control plot (Table 2, Fig. 4).
Quantities and dynamics of C stocks
The ratio of below to above-ground live plant C stocks was0.64 ± 0.21 in the control plot compared with 0.15 ± 0.05
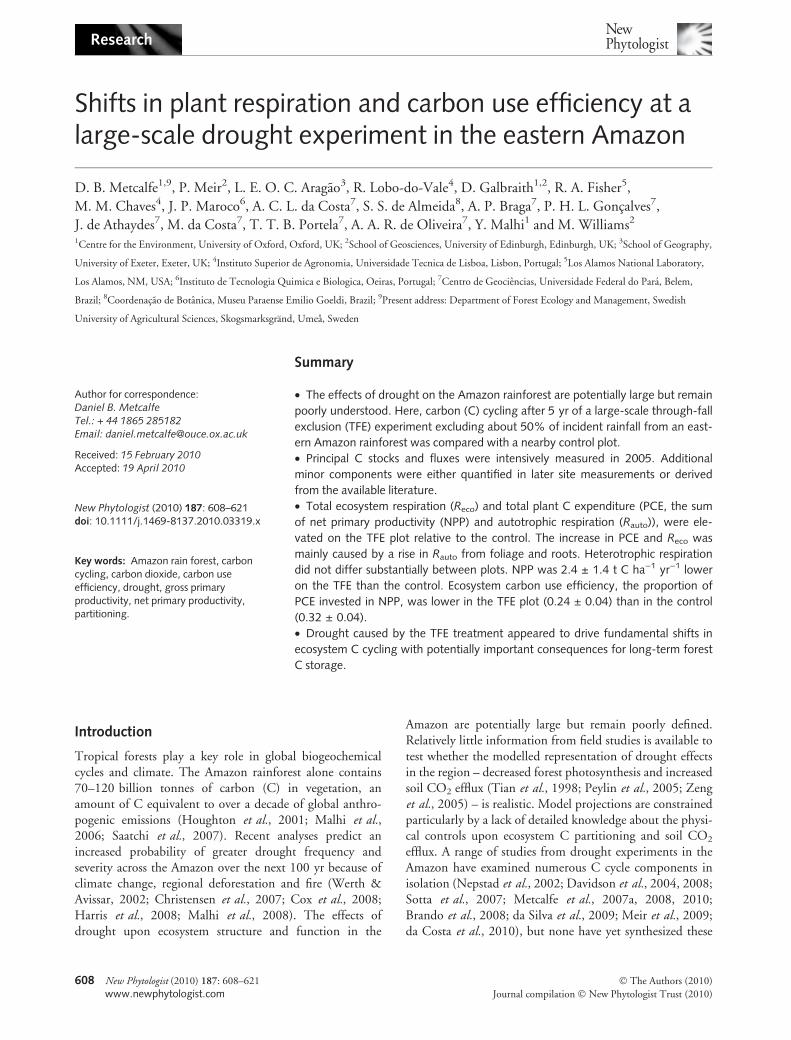
in the TFE plot (Fig. 5). In the control plot, estimatedmean turnover time of live canopy foliage, fine litter on theground, CWD, fine roots and live stems were 0.5, 0.7, 4.4,3.4 and 88.0 yr, respectively (Fig. 6). Stocks of C in groundfine litter were slightly elevated in the TFE plot (Table 1, c.0.7 t C ha)1 yr)1), despite lower influx from canopy
40
30
20
10
0Reco RecoPCE PCE
Control TFE
Eco
syst
em-l
evel
car
bo
n f
luxe
s(t
C h
a–1 y
r–1)
Fig. 2 Total ecosystem-level carbon fluxes on the plots. Grey bars,net primary productivity (NPP); open bars, autotrophic respiration(Rauto); closed bars, heterotrophic respiration (Rhetero). All data andtheir sources are specified in Table 2. Error bars indicate 95%confidence intervals around the total flux values. Given theunreplicated nature of the plots, error bars represent only within-plotspatial variation and measurement error rather than landscape-scaleheterogeneity. Reco, ecosystem respiration; TFE, through-fallexclusion; PCE, plant carbon expenditure.
(a)
(b)
12
10
8
6
4
2
040
30
20
10
0
SOMRootsFine litterDead woodLive stemsCanopy
Control TFE
Net
pri
mar
y p
rod
uct
ivit
y (t
C h
a–1 y
r–1)
Res
pir
atio
n (
tC h
a–1 y
r–1)
Fig. 3 Net primary productivity (NPP) (a) and respiration (R) (b)from different above- and below-ground ecosystem components onboth plots. All data and their sources are specified in Table 2. Errorbars indicate 95% confidence intervals around the total flux values.Given the unreplicated nature of the plots, error bars represent onlywithin-plot spatial variation and measurement error rather thanlandscape-scale heterogeneity. Foliage R incorporates measured leafdark R (Metcalfe et al., 2010) and modelled leaf light R (Lloydet al., 2009); stem R is from all stems > 2 cm diameter at breastheight assuming the same value of R per unit stem surface area onboth plots derived from the existing literature (Meir & Grace, 2002;Nepstad et al., 2002), while dead wood R includes contributionsfrom coarse woody debris (CWD) on the ground and standing deadstems. Dead wood R was measured in 2009 and back-calculated to2005 assuming dead stem and CWD stock accumulation wasproportional to measured tree mortality. Canopy productionincorporates measured litterfall and literature-based estimates forherbivory, canopy storage of litter and volatile organic carbonemissions. Stem NPP values are derived from da Costa et al. (2010)and include growth of all stems > 2 cm diameter at breast height,branch fall and recruitment. Root growth includes both fine andcoarse root growth down to 3 m soil depth using root profile datafrom D Galbraith (unpublished). TFE, through-fall exclusion; SOM,soil organic matter.
NewPhytologist Research 613
� The Authors (2010)
Journal compilation � New Phytologist Trust (2010)
New Phytologist (2010) 187: 608–621
www.newphytologist.com

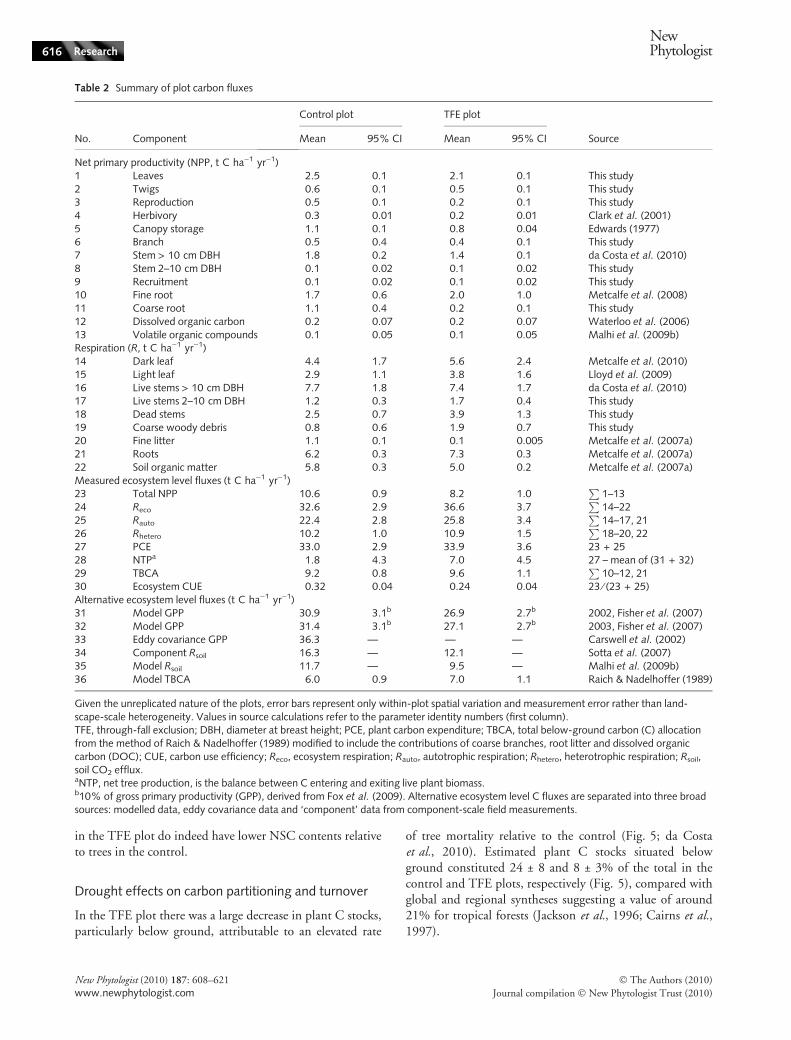
litterfall (Table 2, Fig. 3a; 0.9 ± 0.2 t C ha)1 yr)1) com-pared with the control. In the TFE plot, microbial fine litterR removed only around 4% of ground fine litter C stockeach year (Tables 1, 2), which means that to balance Cinputs from litterfall whilst accounting for the observedincrease in ground litter C stock relative to the control,75 ± 6% of the TFE fine litter stock must annually beenremoved by processes other than microbial R (Fig. 7), suchas physical disintegration and ⁄ or consumption by detriti-vores. Using the same approach, a greater percentage of the
control plot standing surface litter C stock was removedeach year via both microbial R (43 ± 4%) and other pro-cesses (95 ± 11%; Fig. 7). In the control plot, the annualdecomposition metrics for ground litter exceeded 100%because turnover time was < 1 yr (Fig. 6).
Quantities and dynamics of CO2 fluxes
Plot differences in CO2 efflux were the net product of shiftsin both R per unit area of plant material (e.g. leaves,CWD), and the total amount of plant material area. Thesetwo properties often responded in different ways to theTFE treatment. For example, across all measurement peri-ods, mean dark leaf R per unit leaf area was greater in theTFE plot (0.51 ± 0.05 lmol m)2 s)1) than in the controlplot (0.34 ± 0.03 lmol m)2 s)1), while LAI declined over7 yr following the imposition of the TFE treatment by c.1 m2 m)2 relative to the control (Metcalfe et al., 2010).The net product of these interacting factors was a markedincrease in plot-level dark leaf R (Table 2, Fig. 3b; Metcalfeet al., 2010) in the TFE plot (5.6 ± 2.4 t C ha)1 yr)1)relative to the control (4.4 ± 1.7 t C ha)1 yr)1).
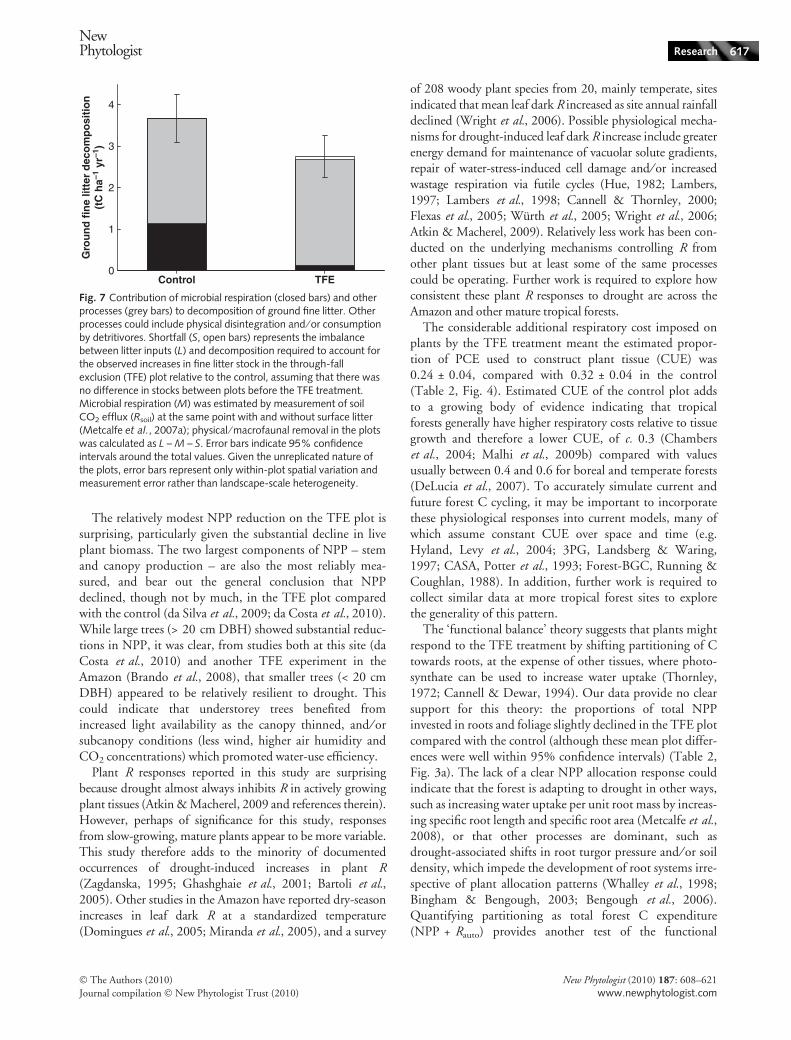
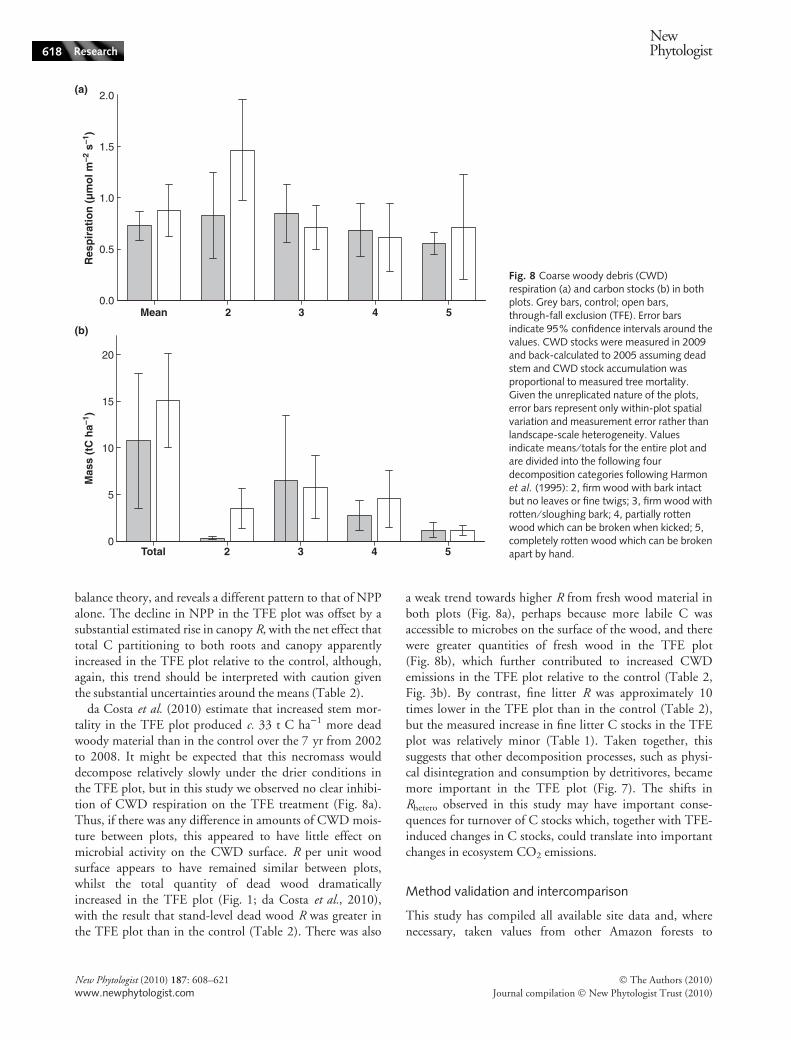
Total dead wood surface areas were 0.19 ± 0.05 and0.27 ± 0.06 m2 m)2 in the control and TFE plots, respec-tively. In both plots, c. 70% of dead wood area was in theform of standing stems with the remainder comprisingground CWD. The mean CWD R values per unit woodarea were 4.6 ± 0.9 and 5.5 ± 1.6 lmol m)2 s)1 in thecontrol and TFE plots, respectively. The weak trendtowards higher mean CWD R on the TFE plot was specifi-cally attributable to the greater quantity of relatively unde-composed CWD in the TFE plot (Fig. 8b), possibly from agreater recent input of new wood via increased tree mortal-ity and branch fall, which appeared to have a higher rate ofR (Fig. 8a). The combination of a greater quantity of fresh,undecomposed CWD in the TFE plot and elevated rates ofR per unit area of fresh CWD translated into total CWD Rof 5.7 ± 1.5 t C ha)1 yr)1 in the TFE plot compared with3.3 ± 0.9 t C ha)1 yr)1 in the control (Table 2, Fig. 3b).
Estimated plot-level stem R emissions (Table 2, Fig. 3b)were similar in the TFE (9.1 ± 1.8 t C ha)1 yr)1) andcontrol plots (8.8 ± 1.8 t C ha)1 yr)1) because the lowerstem area of trees > 10 cm DBH in the TFE plot wasoutweighed by the higher stem area of trees between 2 and10 cm DBH.
Rsoil, the sum of fine litter, root and soil organic matterrespiration, was only slightly diminished by 0.69 ±0.14 t C ha)1 yr)1 in the TFE plot relative to the controlduring the measurement year of 2005 (Table 2, Fig. 3b;Metcalfe et al., 2007a). The relative contribution of auto-trophic and heterotrophic sources to Rsoil differed betweenplots. Thus, in the control plot, Rsoil was divided almostequally between heterotrophic (53%, 6.9 ± 0.3 t C ha)1 yr)1)and autotrophic (47%, 6.2 ± 0.3 t C ha)1 yr)1) contributions,
0.5
0.4
0.3
0.2
0.1
0.0Ecosystem Leaves Stems RootsC
arb
on
use
eff
icie
ncy
(N
PP
/ N
PP
+ R
)
Fig. 4 Carbon use efficiency (CUE) at the ecosystem level and fordifferent above- and below-ground plant components on both plots.Grey bars, control; open bars, through-fall exclusion. All data andtheir sources are specified in Table 2. Error bars indicate 95%confidence intervals around the mean CUE values. Given theunreplicated nature of the plots, error bars represent only within-plotspatial variation and measurement error rather than landscape-scaleheterogeneity. NPP, net primary productivity; R, respiration.
Control TFE
400
300
200
Pla
nt c
arbo
n st
ocks
(tC
ha–1
)
100
0
Fig. 5 Stocks of carbon in different above- and below-ground plantcomponents on both plots. Open bars, canopy; grey bars, stems;closed bars, roots. Error bars indicate 95% confidence intervalsaround the total stocks. Given the unreplicated nature of the plots,error bars represent only within-plot spatial variation and measure-ment error rather than landscape-scale heterogeneity. Root stocksare presented down to 3 m soil depth using root profile data from DGalbraith (unpublished). TFE, through-fall exclusion.
614 Research
NewPhytologist
� The Authors (2010)
Journal compilation � New Phytologist Trust (2010)
New Phytologist (2010) 187: 608–621
www.newphytologist.com
whereas Rsoil in the TFE plot was dominated to a greater extentby autotrophic sources (59%, 7.3 ± 0.3 t C ha)1 yr)1) andheterotrophic R (41%, 5.1 ± 0.2 t C ha)1 yr)1) contrib-uted relatively less (Table 2, Fig. 3b). Expected Rsoil andTBCA, calculated for the control plot from C inputs andassuming steady-state conditions, were both lower than ourmeasurements (Table 2).
Discussion
Drought effects on net carbon fluxes: patterns andprocesses
A key assumption of the multi-component integration‘bottom-up’ approach employed here to examine C cycling atan eastern Amazon rainforest, is that steady state conditionsexist at the site, and therefore that PCE is approximately equalto GPP. In the control plot, where steady-state conditions areplausible (at least over the timescale of the experiment), PCEestimated for the year of 2005 for this study (33.0 ±2.9 t C ha)1 yr)1) was quite similar to estimates of GPP over2002 and 2003 made using an ecophysiological model para-meterized at the two plots (c. 30 t C ha)1 yr)1; Table 2; Fisheret al., 2007). By contrast, PCE in the TFE plot(33.9 ± 3.6 t C ha)1 yr)1) was higher than the modelledGPP in the TFE plot of 26.9 and 27.1 t C ha)1 yr)1 in 2002and 2003, respectively (Table 2; Fisher et al., 2007). As a pre-liminary exploration of the possible consequences of this mis-match between PCE and GPP in the TFE plot, we conductedthe following analysis. We calculated the mean of the twoannual modelled GPP estimates from the TFE plot and,assuming these estimates were representative of the forest in2005 and had an uncertainty of 10% (Fox et al., 2009), wethen subtracted this GPP value from measured PCE for2005. The result implies that the TFE forest was expending7.0 ± 4.5 t C ha)1 yr)1 more than it was assimilating (nettree production; Table 2). Clearly, a major uncertaintywith this analysis is the assumption that modelled 2002and 2003 GPP values are representative of conditions in 2005
– although, if anything, stand-level GPP values would beexpected to decline further after 2003, and preliminary runsof the site-parameterized ecophysiological model beyond2003 support this view (R Fisher, pers. comm.), which wouldsuggest that the discrepancy between 2005 GPP andPCE ⁄ Reco was likely to be even larger. Useful future lines ofenquiry would be to quantify the sources of uncertainty thatcould not be incorporated into this analysis (e.g. TFE effectson stem allometry, stem R, leaf light R, herbivory, canopy lit-ter storage, leaf temperature) to test this hypothesis further.
Notwithstanding the uncertainty surrounding this analy-sis, the substantial apparent ‘overspend’ of C by the forestcould feasibly be sourced from nonstructural carbohydrate(NSC) stores and reductions in NPP. From the availableliterature, we estimate that the TFE forest may have had c.20 t C ha)1 of available NSC (c. 8% of live biomass;Graham et al., 2003; Wurth et al., 2005; Poorter &Kitajima, 2007) to draw upon at the beginning of the TFEtreatment. In addition, during the treatment, the TFEforest would be making annual savings from lower NPPconstruction (25% of biomass; Penning de Vries, 1975)and maintenance R costs on the order of 3 t C ha)1 yr)1
(data not shown).Previous work at the study site has indicated that the
larger canopy trees responded isohydrically to drought, bymaintaining leaf water potential above a minimum criticalvalue to avoid xylem embolism, but thereby also reducing Cassimilation rates (Fisher et al., 2006). This ‘C starvation’hypothesis (McDowell et al., 2008; McDowell & Sevanto,2010) could provide one potential mechanistic explanationfor the observed increase in tree mortality on the TFE plot(da Costa et al., 2010) and decline in reproduction (DBMetcalfe, unpublished). Our estimate of a large possible Coverspend relative to likely NSC reserves is consistent witha scenario whereby trees may reach critically low amountsof NSC under extended drought conditions, and contraryto previous suggestions that large NSC pool sizes in foresttrees render C starvation-induced mortality unlikely (Salaet al., 2010). An obvious next step is to verify whether trees
7
6
5
4
3
2
1
0
Turn
over
(yr
)
Turn
over
(yr
)
Canopy Fine litter CWD Fine roots Stems
120
100
80
60
40
20
0
Fig. 6 Turnover time of different ecosystemcomponents on the control plot. Turnover iscalculated assuming steady-state conditionsas input or output ⁄ stock. Error bars indicate95% confidence intervals around the meanturnover time values. Given the unreplicatednature of the plots, error bars represent onlywithin-plot spatial variation and measure-ment error rather than landscape-scaleheterogeneity. CWD, coarse woody debris.
NewPhytologist Research 615
� The Authors (2010)
Journal compilation � New Phytologist Trust (2010)
New Phytologist (2010) 187: 608–621
www.newphytologist.com
in the TFE plot do indeed have lower NSC contents relativeto trees in the control.
Drought effects on carbon partitioning and turnover
In the TFE plot there was a large decrease in plant C stocks,particularly below ground, attributable to an elevated rate
of tree mortality relative to the control (Fig. 5; da Costaet al., 2010). Estimated plant C stocks situated belowground constituted 24 ± 8 and 8 ± 3% of the total in thecontrol and TFE plots, respectively (Fig. 5), compared withglobal and regional syntheses suggesting a value of around21% for tropical forests (Jackson et al., 1996; Cairns et al.,1997).
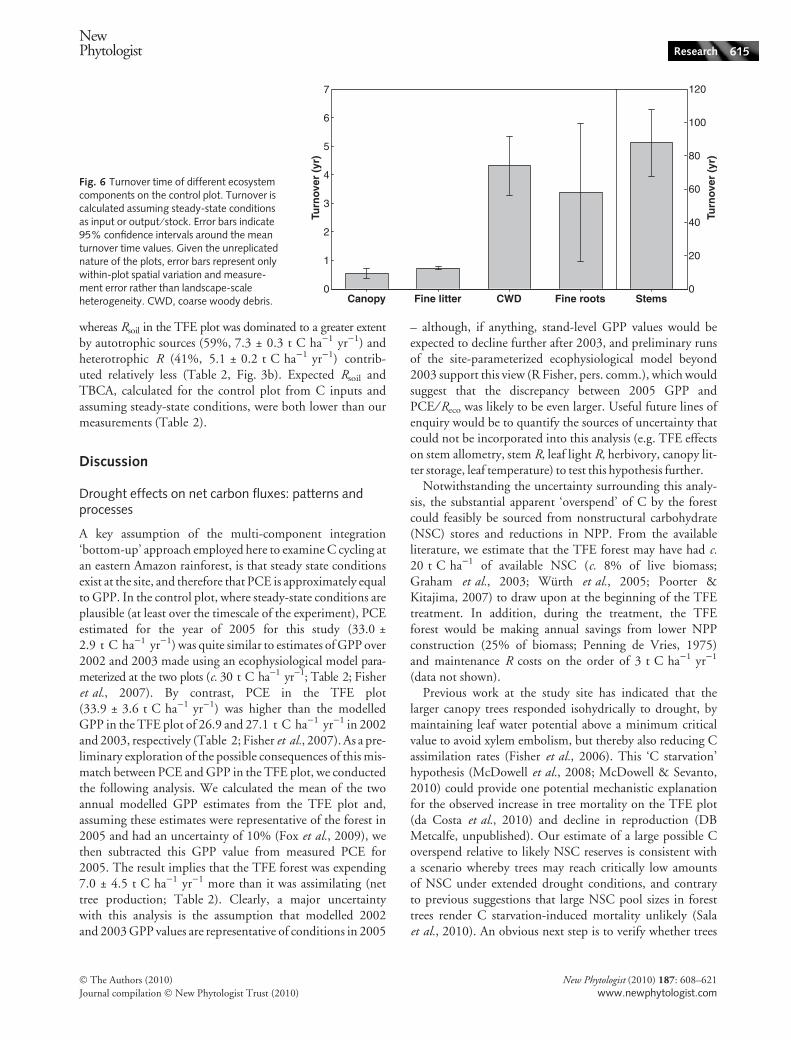
Table 2 Summary of plot carbon fluxes
No. Component
Control plot TFE plot
SourceMean 95% CI Mean 95% CI
Net primary productivity (NPP, t C ha)1 yr)1)1 Leaves 2.5 0.1 2.1 0.1 This study2 Twigs 0.6 0.1 0.5 0.1 This study3 Reproduction 0.5 0.1 0.2 0.1 This study4 Herbivory 0.3 0.01 0.2 0.01 Clark et al. (2001)5 Canopy storage 1.1 0.1 0.8 0.04 Edwards (1977)6 Branch 0.5 0.4 0.4 0.1 This study7 Stem > 10 cm DBH 1.8 0.2 1.4 0.1 da Costa et al. (2010)8 Stem 2–10 cm DBH 0.1 0.02 0.1 0.02 This study9 Recruitment 0.1 0.02 0.1 0.02 This study10 Fine root 1.7 0.6 2.0 1.0 Metcalfe et al. (2008)11 Coarse root 1.1 0.4 0.2 0.1 This study12 Dissolved organic carbon 0.2 0.07 0.2 0.07 Waterloo et al. (2006)13 Volatile organic compounds 0.1 0.05 0.1 0.05 Malhi et al. (2009b)Respiration (R, t C ha)1 yr)1)14 Dark leaf 4.4 1.7 5.6 2.4 Metcalfe et al. (2010)15 Light leaf 2.9 1.1 3.8 1.6 Lloyd et al. (2009)16 Live stems > 10 cm DBH 7.7 1.8 7.4 1.7 da Costa et al. (2010)17 Live stems 2–10 cm DBH 1.2 0.3 1.7 0.4 This study18 Dead stems 2.5 0.7 3.9 1.3 This study19 Coarse woody debris 0.8 0.6 1.9 0.7 This study20 Fine litter 1.1 0.1 0.1 0.005 Metcalfe et al. (2007a)21 Roots 6.2 0.3 7.3 0.3 Metcalfe et al. (2007a)22 Soil organic matter 5.8 0.3 5.0 0.2 Metcalfe et al. (2007a)Measured ecosystem level fluxes (t C ha)1 yr)1)23 Total NPP 10.6 0.9 8.2 1.0
P1–13
24 Reco 32.6 2.9 36.6 3.7P
14–2225 Rauto 22.4 2.8 25.8 3.4
P14–17, 21
26 Rhetero 10.2 1.0 10.9 1.5P
18–20, 2227 PCE 33.0 2.9 33.9 3.6 23 + 2528 NTPa 1.8 4.3 7.0 4.5 27 – mean of (31 + 32)29 TBCA 9.2 0.8 9.6 1.1
P10–12, 21
30 Ecosystem CUE 0.32 0.04 0.24 0.04 23 ⁄ (23 + 25)Alternative ecosystem level fluxes (t C ha)1 yr)1)31 Model GPP 30.9 3.1b 26.9 2.7b 2002, Fisher et al. (2007)32 Model GPP 31.4 3.1b 27.1 2.7b 2003, Fisher et al. (2007)33 Eddy covariance GPP 36.3 — — — Carswell et al. (2002)34 Component Rsoil 16.3 — 12.1 — Sotta et al. (2007)35 Model Rsoil 11.7 — 9.5 — Malhi et al. (2009b)36 Model TBCA 6.0 0.9 7.0 1.1 Raich & Nadelhoffer (1989)
Given the unreplicated nature of the plots, error bars represent only within-plot spatial variation and measurement error rather than land-scape-scale heterogeneity. Values in source calculations refer to the parameter identity numbers (first column).TFE, through-fall exclusion; DBH, diameter at breast height; PCE, plant carbon expenditure; TBCA, total below-ground carbon (C) allocationfrom the method of Raich & Nadelhoffer (1989) modified to include the contributions of coarse branches, root litter and dissolved organiccarbon (DOC); CUE, carbon use efficiency; Reco, ecosystem respiration; Rauto, autotrophic respiration; Rhetero, heterotrophic respiration; Rsoil,soil CO2 efflux.aNTP, net tree production, is the balance between C entering and exiting live plant biomass.b10% of gross primary productivity (GPP), derived from Fox et al. (2009). Alternative ecosystem level C fluxes are separated into three broadsources: modelled data, eddy covariance data and ‘component’ data from component-scale field measurements.
616 Research
NewPhytologist
� The Authors (2010)
Journal compilation � New Phytologist Trust (2010)
New Phytologist (2010) 187: 608–621
www.newphytologist.com
The relatively modest NPP reduction on the TFE plot issurprising, particularly given the substantial decline in liveplant biomass. The two largest components of NPP – stemand canopy production – are also the most reliably mea-sured, and bear out the general conclusion that NPPdeclined, though not by much, in the TFE plot comparedwith the control (da Silva et al., 2009; da Costa et al., 2010).While large trees (> 20 cm DBH) showed substantial reduc-tions in NPP, it was clear, from studies both at this site (daCosta et al., 2010) and another TFE experiment in theAmazon (Brando et al., 2008), that smaller trees (< 20 cmDBH) appeared to be relatively resilient to drought. Thiscould indicate that understorey trees benefited fromincreased light availability as the canopy thinned, and ⁄ orsubcanopy conditions (less wind, higher air humidity andCO2 concentrations) which promoted water-use efficiency.
Plant R responses reported in this study are surprisingbecause drought almost always inhibits R in actively growingplant tissues (Atkin & Macherel, 2009 and references therein).However, perhaps of significance for this study, responsesfrom slow-growing, mature plants appear to be more variable.This study therefore adds to the minority of documentedoccurrences of drought-induced increases in plant R(Zagdanska, 1995; Ghashghaie et al., 2001; Bartoli et al.,2005). Other studies in the Amazon have reported dry-seasonincreases in leaf dark R at a standardized temperature(Domingues et al., 2005; Miranda et al., 2005), and a survey
of 208 woody plant species from 20, mainly temperate, sitesindicated that mean leaf dark R increased as site annual rainfalldeclined (Wright et al., 2006). Possible physiological mecha-nisms for drought-induced leaf dark R increase include greaterenergy demand for maintenance of vacuolar solute gradients,repair of water-stress-induced cell damage and ⁄ or increasedwastage respiration via futile cycles (Hue, 1982; Lambers,1997; Lambers et al., 1998; Cannell & Thornley, 2000;Flexas et al., 2005; Wurth et al., 2005; Wright et al., 2006;Atkin & Macherel, 2009). Relatively less work has been con-ducted on the underlying mechanisms controlling R fromother plant tissues but at least some of the same processescould be operating. Further work is required to explore howconsistent these plant R responses to drought are across theAmazon and other mature tropical forests.
The considerable additional respiratory cost imposed onplants by the TFE treatment meant the estimated propor-tion of PCE used to construct plant tissue (CUE) was0.24 ± 0.04, compared with 0.32 ± 0.04 in the control(Table 2, Fig. 4). Estimated CUE of the control plot addsto a growing body of evidence indicating that tropicalforests generally have higher respiratory costs relative to tissuegrowth and therefore a lower CUE, of c. 0.3 (Chamberset al., 2004; Malhi et al., 2009b) compared with valuesusually between 0.4 and 0.6 for boreal and temperate forests(DeLucia et al., 2007). To accurately simulate current andfuture forest C cycling, it may be important to incorporatethese physiological responses into current models, many ofwhich assume constant CUE over space and time (e.g.Hyland, Levy et al., 2004; 3PG, Landsberg & Waring,1997; CASA, Potter et al., 1993; Forest-BGC, Running &Coughlan, 1988). In addition, further work is required tocollect similar data at more tropical forest sites to explorethe generality of this pattern.
The ‘functional balance’ theory suggests that plants mightrespond to the TFE treatment by shifting partitioning of Ctowards roots, at the expense of other tissues, where photo-synthate can be used to increase water uptake (Thornley,1972; Cannell & Dewar, 1994). Our data provide no clearsupport for this theory: the proportions of total NPPinvested in roots and foliage slightly declined in the TFE plotcompared with the control (although these mean plot differ-ences were well within 95% confidence intervals) (Table 2,Fig. 3a). The lack of a clear NPP allocation response couldindicate that the forest is adapting to drought in other ways,such as increasing water uptake per unit root mass by increas-ing specific root length and specific root area (Metcalfe et al.,2008), or that other processes are dominant, such asdrought-associated shifts in root turgor pressure and ⁄ or soildensity, which impede the development of root systems irre-spective of plant allocation patterns (Whalley et al., 1998;Bingham & Bengough, 2003; Bengough et al., 2006).Quantifying partitioning as total forest C expenditure(NPP + Rauto) provides another test of the functional
4
3
2
1
0
Gro
un
d f
ine
litte
r d
eco
mp
osi
tio
n(t
C h
a–1 y
r–1)
Control TFE
Fig. 7 Contribution of microbial respiration (closed bars) and otherprocesses (grey bars) to decomposition of ground fine litter. Otherprocesses could include physical disintegration and ⁄ or consumptionby detritivores. Shortfall (S, open bars) represents the imbalancebetween litter inputs (L) and decomposition required to account forthe observed increases in fine litter stock in the through-fallexclusion (TFE) plot relative to the control, assuming that there wasno difference in stocks between plots before the TFE treatment.Microbial respiration (M) was estimated by measurement of soilCO2 efflux (Rsoil) at the same point with and without surface litter(Metcalfe et al., 2007a); physical ⁄ macrofaunal removal in the plotswas calculated as L – M – S. Error bars indicate 95% confidenceintervals around the total values. Given the unreplicated nature ofthe plots, error bars represent only within-plot spatial variation andmeasurement error rather than landscape-scale heterogeneity.
NewPhytologist Research 617
� The Authors (2010)
Journal compilation � New Phytologist Trust (2010)
New Phytologist (2010) 187: 608–621
www.newphytologist.com
balance theory, and reveals a different pattern to that of NPPalone. The decline in NPP in the TFE plot was offset by asubstantial estimated rise in canopy R, with the net effect thattotal C partitioning to both roots and canopy apparentlyincreased in the TFE plot relative to the control, although,again, this trend should be interpreted with caution giventhe substantial uncertainties around the means (Table 2).
da Costa et al. (2010) estimate that increased stem mor-tality in the TFE plot produced c. 33 t C ha)1 more deadwoody material than in the control over the 7 yr from 2002to 2008. It might be expected that this necromass woulddecompose relatively slowly under the drier conditions inthe TFE plot, but in this study we observed no clear inhibi-tion of CWD respiration on the TFE treatment (Fig. 8a).Thus, if there was any difference in amounts of CWD mois-ture between plots, this appeared to have little effect onmicrobial activity on the CWD surface. R per unit woodsurface appears to have remained similar between plots,whilst the total quantity of dead wood dramaticallyincreased in the TFE plot (Fig. 1; da Costa et al., 2010),with the result that stand-level dead wood R was greater inthe TFE plot than in the control (Table 2). There was also
a weak trend towards higher R from fresh wood material inboth plots (Fig. 8a), perhaps because more labile C wasaccessible to microbes on the surface of the wood, and therewere greater quantities of fresh wood in the TFE plot(Fig. 8b), which further contributed to increased CWDemissions in the TFE plot relative to the control (Table 2,Fig. 3b). By contrast, fine litter R was approximately 10times lower in the TFE plot than in the control (Table 2),but the measured increase in fine litter C stocks in the TFEplot was relatively minor (Table 1). Taken together, thissuggests that other decomposition processes, such as physi-cal disintegration and consumption by detritivores, becamemore important in the TFE plot (Fig. 7). The shifts inRhetero observed in this study may have important conse-quences for turnover of C stocks which, together with TFE-induced changes in C stocks, could translate into importantchanges in ecosystem CO2 emissions.
Method validation and intercomparison
This study has compiled all available site data and, wherenecessary, taken values from other Amazon forests to
(a)
(b)
2.0
1.5
1.0
0.5
0.0
20
15
10
5
0
Mean 2 3 4 5
32Total 4 5
Mas
s (t
C h
a–1)
Res
pir
atio
n (
µm
ol m
–2 s
–1)
Fig. 8 Coarse woody debris (CWD)respiration (a) and carbon stocks (b) in bothplots. Grey bars, control; open bars,through-fall exclusion (TFE). Error barsindicate 95% confidence intervals around thevalues. CWD stocks were measured in 2009and back-calculated to 2005 assuming deadstem and CWD stock accumulation wasproportional to measured tree mortality.Given the unreplicated nature of the plots,error bars represent only within-plot spatialvariation and measurement error rather thanlandscape-scale heterogeneity. Valuesindicate means ⁄ totals for the entire plot andare divided into the following fourdecomposition categories following Harmonet al. (1995): 2, firm wood with bark intactbut no leaves or fine twigs; 3, firm wood withrotten ⁄ sloughing bark; 4, partially rottenwood which can be broken when kicked; 5,completely rotten wood which can be brokenapart by hand.
618 Research
NewPhytologist
� The Authors (2010)
Journal compilation � New Phytologist Trust (2010)
New Phytologist (2010) 187: 608–621
www.newphytologist.com

construct a detailed snapshot of estimated C fluxes in thefourth year of a drought experiment in eastern Amazonia.Analyses of longer-term change of some components andmore detailed work focused on individual components maybe found elsewhere (Nepstad et al., 2002; Davidson et al.,2004, 2008; Sotta et al., 2007; Metcalfe et al., 2007a,2008, 2010; Brando et al., 2008; Meir et al., 2008; da Silvaet al., 2009; Meir et al., 2009; da Costa et al., 2010). The‘bottom-up’ approach used in this study to estimate PCEand Reco in the control plot showed a reasonable degree ofconsistency with earlier estimates of stand-level C fluxes atthis site made using both eddy covariance and modellingmethods (Table 2). However, from the equations whichestimate Rsoil (Malhi et al., 2009b) and TBCA (Raich &Nadelhoffer, 1989) from above- and below-ground Cinputs, there is an indication that there is higher measuredRsoil and TBCA than expected (Table 2), which could indi-cate insufficient field sampling or that further work isrequired to parameterize the mass balance models. Eddycovariance studies in central ⁄ eastern Amazon terra firmeold-growth forest have recorded very different rates ofannual ecosystem C uptake and release, with distinct sea-sonal patterns (Saleska et al., 2003; Ometto et al., 2005).Bottom-up measurements could help to specify whichcomponents of Reco (e.g. Rauto vs Rhetero) and GPP (e.g. R vsNPP) contribute to explaining the observed differences.This study provides some of the first insights intoecosystem-level shifts in Amazon forest C metabolismassociated with drought, which, although constrained bynumerous uncertainties, provide a foundation for futuremodelling and experimental work testing questions andpatterns arising from the data presented.
Acknowledgements
This research contributes to the Brazil-led LBA project andwas supported by a NERC PhD studentship and researchgrant (NER ⁄ A ⁄ S ⁄ 2003 ⁄ 1609), a RS Dudley Stamp award,and a University of Edinburgh Elizabeth Sinclair award.Thanks to Leonardo Sa and Ima Vieira for their scientificsupport and collaboration, and the Museu Paraense EmilioGoeldi for the use of its field station and laboratoryfacilities.
References
Aragao LEOC, Malhi Y, Metcalf DB, Silva-Espejo JE, Jimenez E,
Navarrete D, Almeida S, da Costa ACL, Salinas N, Phillips OL
et al. 2009. Above- and below-ground net primary productivity
across ten Amazonian forests on contrasting soils. Biogeosciences 6:
2759–2778.
Atkin OK, Evans JR, Ball MC, Lambers H, Pons TL. 2000. Leaf
respiration of snow gum in the light and dark: interactions between
temperature and irradiance. Plant Physiology 122: 915–923.
Atkin OK, Macherel D. 2009. The crucial role of plant mitochondria in
orchestrating drought tolerance. Annals of Botany 103: 581–597.
Bartoli CG, Gomez F, Gergoff G, Guiamet JJ, Puntarulo S. 2005. Up-
regulation of the mitochondrial alternative oxidase pathway enhances
photosynthetic electron transport under drought conditions. Journal ofExperimental Botany 56: 1269–1276.
Bengough AG, Bransby MF, Hans J, McKenna SJ, Roberts TJ, Valentine
TA. 2006. Root responses to soil physical conditions; growth dynamics
from field to cell. Journal of Experimental Botany 57: 437–447.
Betts RA, Cox PM, Collins M, Harris PP, Huntingford C, Jones CD.
2004. The role of ecosystem-atmosphere interactions in simulated
Amazonian precipitation decrease and forest dieback under global
climate warming. Theoretical Applied Climatology 78: 157–175.
Bingham IJ, Bengough AG. 2003. Morphological plasticity of wheat and
barley roots in response to spatial variation in soil strength. Plant andSoil 250: 273–282.
Brando PM, Nepstad DC, Davidson EA, Trumbore SE, Ray D, Camargo
P. 2008. Drought effects on litterfall, wood production, and
belowground carbon cycling in an Amazon forest: results of a through-
fall reduction experiment. Philosophical Transactions of the Royal Societyof London – Biological Sciences 363: 1839–1848.
Cairns MA, Brown S, Helme EH, Baumgardner GA. 1997. Root biomass
allocation in the world’s upland forests. Oecologia 111: 1–11.
Cannell MGR, Dewar RC. 1994. Carbon allocation in trees: a review of
concepts for modelling. Advances in Ecological Research 25: 59–104.
Cannell MGR, Thornley JHM. 2000. Modelling the components of plant
respiration: some guiding principles. Annals of Botany 85: 45–54.
do Carmo JB, Keller M, Dias JD, de Camargo PB, Crill P. 2006. A
source of methane from upland forests in the Brazilian Amazon.
Geophysical Research Letters 33: L04809. doi: 10.1029/2005GL025436.
Carpenter SR. 1996. Microcosm experiments have limited relevance for
community and ecosystem ecology. Ecology 77: 677–680.
Carswell FE, Costa AL, Palheta M, Malhi Y, Meir P, de Costa PR, de
Ruivo M, do Leal SM, Costa JMN, Clement RJ et al. 2002.
Seasonality in CO2 and H2O flux at an eastern Amazonian rain forest.
Journal of Geophysical Research – Atmospheres 107(D20): 8076. doi:
10.1029/2000JD000284.
Cavaleri MA, Oberhauer SF, Ryan MG. 2006. Wood CO2 efflux in a
primary tropical forest. Global Change Biology 12: 2442–2458.
Chambers JQ, dos Santos J, Ribeiro RJ, Higuchi N. 2001. Tree
damage, allometric relationships, and above-ground net primary
production in central Amazon forest. Forest Ecology and Management152: 73–84.
Chambers JQ, Higuchi N, Schimel JP, Ferreira LV, Melack JM. 2000.
Decomposition and carbon cycling of dead trees in tropical forests of the
central Amazon. Oecologia 122: 380–388.
Chambers JQ, Tribuzy ES, Toledo LC, Crispim BF, Higuchi N, Dos
Santos J, Araujo AC, Kruijt B, Nobre AD, Trumbore SE. 2004.
Respiration from a tropical forest ecosystem: partitioning of sources and
low carbon use efficiency. Ecological Applications 14: 72–88.
Christensen JH, Hewitson B, Busuioc A, Chen A, Gao X, Held I, Jones R,
Kolli RK, Kwon WT, Laprise R et al. 2007. Regional climate
projections. In: Solomon S, Qin D, Manning M, Chen Z, Marquis M,
Averyt KB, Tignor M, Miller ML, eds. Climate Change 2007: the physicalscience basis. Cambridge, UK: Cambridge University Press, 847–940.
Clark DA, Brown S, Kicklighter DW, Chambers JQ, Thomlinson JR, Ni
J, Holland EA. 2001. NPP in tropical forests: an evaluation and
synthesis of the existing field data. Ecological Applications 11: 371–384.
Collins M, Tett SFB, Cooper C. 2001. The internal climate variability of
HadCM3, a version of the Hadley Centre coupled model without flux
adjustments. Climate Dynamics 17: 61–81.
da Costa ACL, Braga AP, Goncalves PHL, Da Costa RF, Athaydes Silva
JA Jr, Malhi YS, Aragao LEOC, Meir P. 2006. Estudos
NewPhytologist Research 619
� The Authors (2010)
Journal compilation � New Phytologist Trust (2010)
New Phytologist (2010) 187: 608–621
www.newphytologist.com

hidrometeorologicos em uma floresta tropical chuvosa na Amazonia –
Projeto Esecaflor. Revista Brasileira de Meteorologia 21: 283–290.
da Costa ACL, Galbraith D, Almeida S, Portela BTT, da Costa M,
de Athaydes Silva Junior J, Braga AP, de Goncalves PHL, de Oliveira
AAR, Fisher R et al. 2010. Effect of 7 yr of experimental drought on
vegetation dynamics and biomass storage of an eastern Amazonian
rainforest. New Phytologist 187: 579–591.
Cox PM, Harris PP, Huntingford C, Betts RA, Collins M, Jones CD,
Jupp TE, Marengo JA, Nobre CA. 2008. Increasing risk of
Amazonian drought due to decreasing aerosol pollution. Nature 453:
212–216.
Davidson EA, Ishida FY, Nepstad DC. 2004. Effects of an experimental
drought on soil emissions of carbon dioxide, methane, nitrous oxide,
and nitric oxide in a moist tropical forest. Global Change Biology 10:
718–730.
Davidson EA, Nepstad DC, Ishida FY, Brando PM. 2008. Effects of an
experimental drought and recovery on soil emissions of carbon dioxide,
methane, nitrous oxide, and nitric oxide in a moist tropical forest.
Global Change Biology 14: 2582–2590.
DeLucia EH, Drake JE, Thomas RB, Gonzalez-Meler M. 2007. Forest
carbon use efficiency: is respiration a constant fraction of gross primary
productivity? Global Change Biology 13: 1157–1167.
Domingues TF, Berry JA, Martinelli LA, Ometto JPH, Ehleringer JR.
2005. Parameterization of canopy structure and leaf-level gas exchange
for an eastern Amazonian tropical rain forest (Tapajos National Forest,
Para, Brazil). Earth Interactions 9: 1–23.
Edwards PJ. 1977. Studies of mineral cycling in a montane rain forest in
New Guinea II. Production and disappearance of litter. Journal ofEcology 65: 971–992.
Fisher RA, Williams M, Lobo do Vale R, da Costa ACL, Meir P. 2006.
Evidence from Amazonian forests is consistent with isohydric control of
leaf water potential. Plant, Cell & Environment 29: 151–165.
Fisher RA, Williams M, Lola da Costa A, Malhi Y, da Costa RF, Almeida
S, Meir P. 2007. The response of an eastern Amazonian rain forest to
drought stress: results and modeling analyses from a throughfall
exclusion experiment. Global Change Biology 13: 2361–2378.
Flexas J, Galmes J, Ribas- Carbo M, Medrano H. 2005. The effects of
water stress on plant respiration. In: Lambers H, Ribas-Carbo M, eds.
Plant respiration: from cell to ecosystem. Dordecht, the Netherlands:
Springer, 95–135.
Fox A, Williams M, Richardson AD, Cameron D, Gove JH, Quaife T,
Ricciuto D, Reichstein M, Tomelleri E, Trudinger CM et al. 2009.
The REFLEX project: comparing different algorithms and
implementations for the inversion of a terrestrial ecosystem model
against eddy covariance data. Agricultural and Forest Meteorology 149:
1597–1615.
Frangi JL, Lugo AE. 1985. Ecosystem dynamics of a subtropical
floodplain forest. Ecological Monographs 55: 351–369.
Ghashghaie J, Duranceau M, Badeck FW, Cornic G, Adeline MT,
Deleens E. 2001. Delta C13 of CO2 respired in the dark in relation to
delta C13 of leaf metabolites: comparison between Nicotiana sylvestrisand Helianthus annuus under drought. Plant, Cell & Environment 24:
505–515.
Graham EA, Mulkey SS, Kitajima K, Phillips NG, Wright SJ. 2003.
Cloud cover limits net CO2 uptake and growth of a rainforest tree
during tropical rainy seasons. Proceedings of the National Academy ofSciences, USA 100: 572–576.
Harmon ME, Whigham DF, Sexton J, Olmsted I. 1995. Decomposition
and mass of dead wood in the dry tropical forests of the northeastern
Yucatan Peninsula, Mexico. Biotropica 27: 305–316.
Harris PP, Huntingford C, Cox PM. 2008. Amazon Basin climate under
global warming: the role of the sea-surface temperature. PhilosophicalTransactions of the Royal Society of London – Biological Sciences 363:
1753–1759.
Houghton RA, Lawrence KT, Hackler JL, Brown S. 2001. The spatial
distribution of forest biomass in the Brazilian Amazon: a comparison of
estimates. Global Change Biology 7: 731–746.
Hue L. 1982. Futile cycles and regulation of metabolism. In: Sies H, ed.
Metabolic compartmentation. Burlington, MA, USA: Academic Press,
71–97.
Hurlbert SH. 1984. Pseudoreplication and the design of ecological field
experiments. Ecological Monographs 54: 187–211.
Hurlbert SH. 2004. On misinterpretations of pseudoreplication and
related matters: a reply to Oksanen. Oikos 104: 591–597.
Jackson RB, Canadell J, Ehleringer JR, Mooney HA, Sala OE, Schulze
ED. 1996. A global analysis of root distributions for terrestrial biomes.
Oecologia 108: 389–411.
Kuhn U, Andreae MO, Ammann C, Araujo AC, Brancaleoni E, Ciccioli
P, Dindorf T, Frattoni M, Gatti LV, Ganzeveld L et al. 2007. Isoprene
and monoterpene fluxes from Central Amazonian rainforest inferred
from tower-based and airborne measurements, and implications on the
atmospheric chemistry and the local carbon budget. AtmosphericChemistry and Physics 7: 2855–2879.
Lambers H. 1997. Respiration and the alternative oxidase. In: Foyer CH,
Quick WP, eds. A molecular approach to primary metabolism in plants.London, UK: Taylor & Francis, 295–309.
Lambers H, Chapin FS III, Pons TL. 1998. Plant physiological ecology.New York, NY, USA: Springer-Verlag.
Landsberg JJ, Waring RH. 1997. A generalised model of forest
productivity using simplified concepts of radiation-use efficiency, carbon
balance and partitioning. Forest Ecology and Management 95: 209–228.
Levy PE, Cannell MGR, Friend AD. 2004. Modelling the impact of
future changes in 811 climate, CO2 concentration and land use on
natural ecosystems and the terrestrial 812 carbon sink. GlobalEnvironmental Change 14: 21–30.
Lloyd J, Patino S, Paiva RQ, Nardoto GB, Quesada CA, Santos AJB,
Baker TR, Brand WA, Hilke I, Gielmann H et al. 2009. Variations in
leaf physiological properties within Amazon forest canopies.
Biogeosciences Discussions 6: 4639–4692.
Malhi Y, Aragao LEOC, Galbraith D, Huntingford C, Fisher R,
Zelazowski P, Sitch S, McSweeney C, Meir P. 2009a. Exploring the
likelihood and mechanism of a climate-change-induced dieback of the
Amazon rainforest. Proceedings of the National Academy of Sciences, USA.
doi: 10.1073/pnas.0804619106.
Malhi Y, Aragao LEOC, Metcalfe DB, Paiva R, Quesada CA, Almeida S,
Anderson L, Brando P, Chambers JQ, da Costa ACL et al. 2009b.
Comprehensive assessment of carbon productivity, allocation and
storage in three Amazonian forests. Global Change Biology 15: 1255–
1274.
Malhi Y, Timmons Roberts J, Betts RA, Killeen TJ, Li W, Nobre C.
2008. Climate change, deforestation, and the fate of the Amazon.
Science 319: 169–172.
Malhi Y, Wood D, Baker TR, Wright J, Phillips OL, Cochrane T, Meir
P, Chave J, Almeida S, Arroyo L et al. 2006. The regional variation of
aboveground live biomass in old-growth Amazonian forests. GlobalChange Biology 12: 1107–1138.
McDowell N, Pockman WT, Allen CD, Breshears DD, Cobb N, Kolb T,
Plaut J, Sperry J, West A, Williams DG et al. 2008. Mechanisms of
plant survival and mortality during drought: why do some plants survive
while others succumb to drought? New Phytologist 178: 719–739.
McDowell N, Sevanto S. 2010. The mechanisms of carbon starvation:
how, when, or does it even occur at all? New Phytologist 186: 264–266.
Meir P, Brando PM, Nepstad D, Vasconcelos S, Costa ACL, Davidson E,
Almeida S, Fisher RA, Sotta ED, Zarin D et al. 2009. The effects of
drought on Amazonian rain forests. In: Keller M, Bustamente M, Gash
J, Silva Dias P, eds. Amazonia and global change. Washington, DC,
USA: American Geophysical Union Geophysical Monograph Series
186: 429–449.
620 Research
NewPhytologist
� The Authors (2010)
Journal compilation � New Phytologist Trust (2010)
New Phytologist (2010) 187: 608–621
www.newphytologist.com
Meir P, Grace J. 2002. Scaling relationships for woody tissue respiration in
two tropical forests. Plant, Cell & Environment 25: 963–973.
Meir P, Metcalfe DB, Costa ACL, Fisher RA. 2008. The fate of
assimilated carbon during drought: impacts on respiration in Amazon
rainforests. Philosophical Transactions of the Royal Society of London –Biological Sciences 363: 1849–1855.
Metcalfe DB, Lobo-do-Vale R, Chaves MM, Maroco JP, Aragao LEOC,
Malhi Y, Da Costa AL, Braga A, Goncalves PL, De Athaydes J et al.2010. Impacts of experimentally imposed drought on leaf respiration
and morphology in an Amazon rainforest. Functional Ecology. doi:
10.1111/j.1365-2435.2009.01683.x
Metcalfe DB, Meir P, Aragao LEOC, Da Costa ACL, Braga AP,
Goncalves PHL, De Athaydes Silva J Jr, de Almeida SS, Dawson LA,
Malhi Y et al. 2008. The effects of water availability on root growth and
morphology in an Amazon rainforest. Plant and Soil 311: 189–199.
Metcalfe DB, Meir P, Aragao LEOC, Malhi Y, da Costa ACL, Braga A,
Goncalves PHL, de Athaydes J, de Almeida SS, Williams M. 2007a.
Factors controlling spatio-temporal variation in carbon dioxide efflux
from surface litter, roots, and soil organic matter at four rain forest sites
in the eastern Amazon. Journal of Geophysical Research – Biogeosciences112: G04001. doi: 10.1029/2007JG000443.
Metcalfe DB, Williams M, Aragao LEOC, Da Costa ACL, De Almeida
SS, Braga AP, Goncalves PHL, De Athaydes Silva J Jr, Malhi Y, Meir
P. 2007b. A method for extracting plant roots from soil which facilitates
rapid samples processing without compromising measurement accuracy.
New Phytologist 174: 697–703.
Miranda EJ, Vourlitis GL, Filho NP, Priante PC, Campelo JH, Suli GS,
Fritzen CL, De Almeida Lobo F, Shiraiwa S. 2005. Seasonal variation
in the leaf gas exchange of tropical forest trees in the rain forest- savanna
transition of the southern Amazon basin. Journal of Tropical Ecology 21:
451–460.
Nepstad DC, Moutinho P, Dias MB, Davidson E, Cardinot G,
Markewitz D, Figueiredo R, Vianna N, Chambers J, Ray D et al.2002. The effects of partial throughfall exclusion on canopy processes,
aboveground production and biogeochemistry of an Amazon forest.
Journal of Geophysical Research – Atmospheres 107: 1–18.
Ometto JPHB, Nobre AD, Rocha HR, Artaxo P, Martinelli LA. 2005.
Amazonia and the modern carbon cycle: lessons learned. Oecologia 143:
483–500.
Osmond B, Ananyev G, Berry J, Langdon C, Kolber Z, Lin G, Monson
R, Nichol C, Rascher U, Schurr U et al. 2004. Changing the way we
think about global change research: scaling up in experimental
ecosystem science. Global Change Biology 10: 393–407.
Penning de Vries FWT. 1975. The cost of maintenance processes in plant
cells. Annals of Botany 39: 77–92.
Peylin P, Bousquet P, le Quere C, Sitch S, Friedlingstein P, McKinley G,
Gruber N, Rayner P, Ciais P 2005. Multiple constraints on regional
CO2 flux variations over land and oceans. Global Biogeochemical Cycles19: GB1011. doi: 10.1029/2003GB002214.
Poorter L, Kitajima K. 2007. Carbohydrate storage and light
requirements of tropical moist and dry forest tree species. Ecology88: 1000–1011.
Potter CS, Randerson JT, Field CB, Matson PA, Vitousek PM, Mooney
HA, Klooster SA. 1993. Terrestrial ecosystem production: a process
model based on global satellite and surface data. Global BiogeochemicalCycles 7: 811–841.
Quesada CA, Lloyd J, Anderson LO, Fyllas NM, Schwarz M, Czimczik
CI. 2009. Soils of amazonia with particular reference to the rainfor sites.
Biogeosciences 6: 3851–3921.
Raich JW, Nadelhoffer KJ. 1989. Below-ground carbon allocation in
forest ecosystems global trends. Ecology 70: 1346–1354.
Running SW, Coughlan JC. 1988. A general-model of forest ecosystem
processes for regional applications: I. Hydrologic balance, canopy
gas-exchange and primary production processes. Ecological Modelling 42:
125–154.
Saatchi SS, Houghton RA, Dos Santos Alvala RC, Soares JV, Yu Y. 2007.
Distribution of aboveground live biomass in the Amazon basin. GlobalChange Biology 13: 816–837.
Sala A, Piper F, Hoch G. 2010. Physiological mechanisms of drought-
induced tree mortality are far from being resolved. New Phytologist 186:
274–281.
Saleska SR, Miller SD, Matross DM, Goulden ML, Wofsy SC, da Rocha
HR, de Camargo PB, Crill P, Daube BC, de Freitas HC et al. 2003.
Carbon in Amazon forests: unexpected seasonal fluxes and disturbance-
induced losses. Science 302: 1554–1557.
da Silva RM, da Costa JMN, Ruivo MDLP, da Costa ACL, Almeida SS.
2009. Influencia de variaveis meteorologicas na producao de liteira na
Estacao Cientıfica Ferreira Penna, Caxiuana, Para. Acta Amazonica 39:
573–582.
Silver W, Neff JC, McGroddy M, Veldkamp E, Keller M, Oliveira RC Jr.
2000. Effects of soil texture on belowground carbon and nutrient
storage in a lowland Amazonian forest ecosystem. Ecosystems 3: 193–
209.
Sotta ED, Veldkamp E, Schwendenmann L, Guimaraes BR, Paixao RK,
Ruivo MLP, da Costa ACL, Meir P. 2007. Effects of an induced
drought on soil carbon dioxide (CO2) efflux and soil CO2 production in
an eastern Amazonian rainforest, Brazil. Global Change Biology 13:
2218–2229.
Stokstad E. 2005. Experimental drought predicts grim future for
rainforest. Science 308: 346–347.
Sullivan TJ. 1997. Ecosystem manipulation experimentation as a means of
testing a biogeochemical model. Environmental Management 21: 15–21.
Thornley JHM. 1972. A balanced quantitative model for root : shoot
ratios in vegetative plants. Annals of Botany 36: 431–441.
Tian H, Melillo JM, Kicklighter DW, McGuire AD, Helfrich J,
Moore B III, Vorosmarty CJ. 1998. Effect of interannual climate
variability on carbon storage in Amazonian ecosystems. Nature 396:
664–667.
Waterloo MJ, Oliveira SM, Drucker DP, Nobre AD, Cuartas LA,
Hodnett MG, Langedijk I, Jans WWP, Tomasella J,
de Araujo AC et al. 2006. Export of organic carbon in run-off from an
Amazonian rainforest blackwater catchment. Hydrological Processes 20:
2581–2597.
Werth D, Avissar R. 2002. The local and global effects of Amazon
deforestation. Journal of Geophysical Research 107: 8087. doi: 10.1029/
2001/JD000717.
Whalley WR, Bengough AG, Dexter AR. 1998. Water stress induced by
PEG decreases the maximum growth pressure of the roots of pea
seedlings. Journal of Experimental Botany 49: 1689–1694.
Wright IJ, Reich PB, Atkin OK, Lusk CH, Tjoelker MG, Westoby M.
2006. Irradiance, temperature and rainfall influence leaf dark respiration
in woody plants: evidence from comparisons across 20 sites. NewPhytologist 169: 309–319.
Wurth MKR, Pelaez-Riedl S, Wright SJ, Korner C. 2005. Non-structural
carbohydrate pools in a tropical forest. Oecologia 143: 11–24.
Yoda K. 1983. Community respiration in a lowland rain forest in Pasoh,
peninsular Malaysia. Japanese Journal of Ecology 33: 183–197.
Yoneda T. 1993. Surface area of woody organs of an evergreen broadleaf
forest tree in Japan, southeast Asia. Journal of Plant Research 106: 229–
237.
Zagdanska B. 1995. Respiratory energy demand for protein turnover and
ion transport in wheat leaves upon water deficit. Physiologia Plantarum95: 428–436.
Zeng N, Mariotti A, Wetzel P 2005. Terrestrial mechanisms of
interannual CO2 variability. Global Biogeochemical Cycles 19: GB1016.
doi: 10.1029/2004GB002273.
NewPhytologist Research 621
� The Authors (2010)
Journal compilation � New Phytologist Trust (2010)
New Phytologist (2010) 187: 608–621
www.newphytologist.com
Related Documents