1 Supporting Information. Yong-Chao Su, Chen-Yu Wu, Cheng-Hong Yang, Bo- Sheng Li, Sin-Hua Moi, Yu-Da Lin. Machine learning data imputation and prediction of foraging group size in a kleptoparasitic spider

Welcome message from author
This document is posted to help you gain knowledge. Please leave a comment to let me know what you think about it! Share it to your friends and learn new things together.
Transcript

1
Supporting Information. Yong-Chao Su, Chen-Yu Wu, Cheng-Hong Yang, Bo-Sheng Li, Sin-Hua Moi, Yu-Da Lin. Machine learning data imputation and prediction of foraging group size in a kleptoparasitic spider
2
Supportive Table legends
Table S1. All data matrices used in this article. (a) Original dataset (b) RAW (c)
ZERO (d) MEAN (e) KNN (f) CART (g) RF
Table S1 is avaiable at
https://drive.google.com/file/d/1lyoQZFzpwQGCv9rWktH5js77Mn6DhKsi/view?usp
=sharing
Table S2. The data matrix of the Pearson correlation coefficient between each feature
from the imputation datasets.
Table S2 is avaiable at
https://drive.google.com/file/d/1Y8o5tKVDXbu6K_CG9WbSO7_5fCdzM7Z5/view?
usp=sharing
Table S3. The data matrix of the difference between the correlation coefficient of
feature pairs in the non-missing set and each data imputation method.
Table S3 is avaiable at https://drive.google.com/file/d/150-SbCwJQNpAZ-
t5XSF1E_CIqtjW4jw9/view?usp=sharing

3
Supportive Figure legends
Figure S1. Pearson correlation between features pair from RF data set, since Min D Klepto and Klepto Y/N; Min D Klepto and Min D Host are highly correlated, we calculated four combinations respectively. (a) The correlation between Klepto NUM, Min D Klepto, and the other. (b) The correlation between Klepto NUM, Min D Host, and the other. (c) The correlation between Klepto Y/N, Min D Klepto, and the other. (d) The correlation between Klepto Y/N, Min D Host, and the other.
4
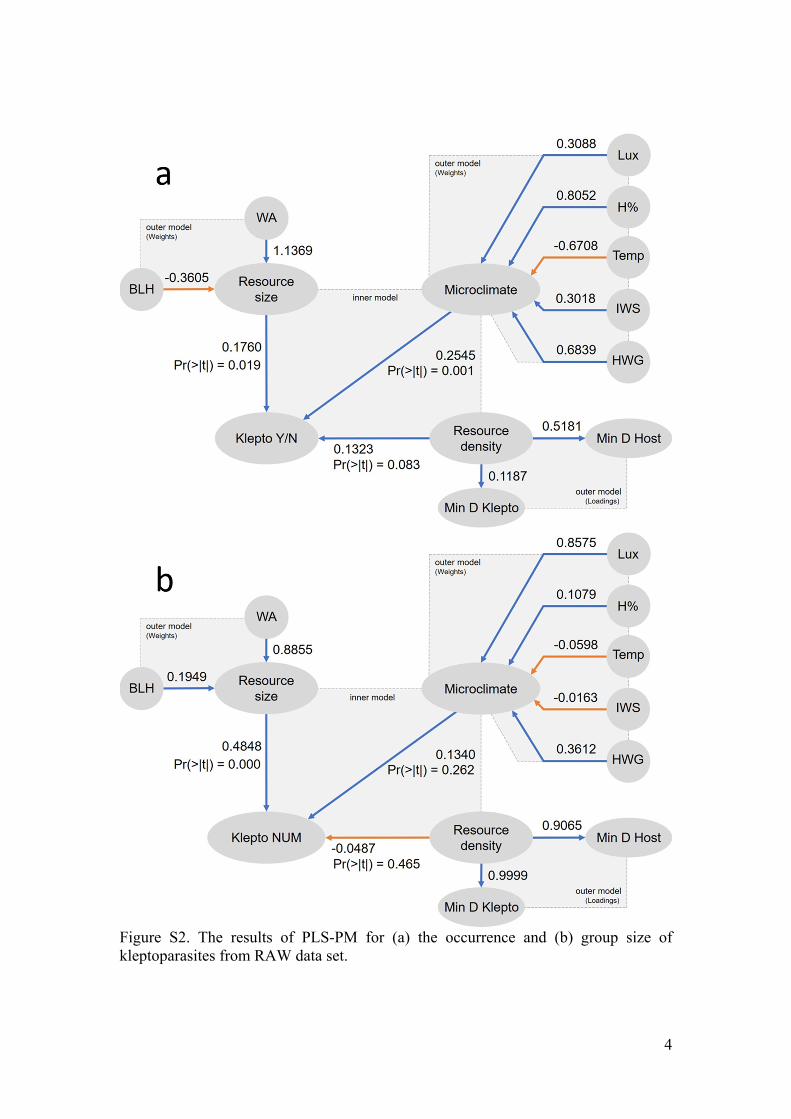
Figure S2. The results of PLS-PM for (a) the occurrence and (b) group size of kleptoparasites from RAW data set.

5
Figure S3. The results of PLS-PM for (a) the occurrence and (b) group size of kleptoparasites from ZERO data set.

6
Figure S4. The results of PLS-PM for (a) the occurrence and (b) group size of kleptoparasites from MEAN data set.

7
Figure S5. The results of PLS-PM for (a) the occurrence and (b) group size of kleptoparasites from KNN data set.

8
Figure S6. The results of PLS-PM for (a) the occurrence and (b) group size of kleptoparasites from CART data set.
Related Documents


![Chapter 21 Cache - National Tsing Hua Universityoz.nthu.edu.tw/~d947207/chap21_cache.pdf · Chapter 21 Cache Speaker: Lung-Sheng Chien Reference: [1] David A. Patterson and John L.](https://static.cupdf.com/doc/110x72/5f0679157e708231d4182adc/chapter-21-cache-national-tsing-hua-d947207chap21cachepdf-chapter-21-cache.jpg)

![RAM (Random Access Memory) - National Tsing Hua …oz.nthu.edu.tw/~d947207/chap22_dram.pdf · RAM (Random Access Memory) Speaker: Lung -Sheng Chien Reference: [1] Bruce Jacob, Spencer](https://static.cupdf.com/doc/110x72/5a7224f47f8b9abb538d4e3e/ram-random-access-memory-national-tsing-hua-oznthuedutwd947207chap22drampdfpdf.jpg)

