Hydrochemical Effects of Using Coal Combustion Byproducts as Structural Fill and Capping Material at an Abandoned Mine Lands Reclamation Site, Southwestern Indiana SHAWN NAYLOR GREG A. OLYPHANT TRACY D. BRANAM

SHAWN NAYLOR GREG A. OLYPHANT TRACY D. BRANAM. Pros: Disposal of large volumes of byproducts associated with energy production Minimal disturbance of.
Dec 18, 2015
Welcome message from author
This document is posted to help you gain knowledge. Please leave a comment to let me know what you think about it! Share it to your friends and learn new things together.
Transcript
Hydrochemical Effects of Using Coal Combustion Byproducts as
Structural Fill and Capping Material at an Abandoned Mine
Lands Reclamation Site, Southwestern Indiana
SHAWN NAYLOR GREG A. OLYPHANTTRACY D. BRANAM

Pros:
•Disposal of large volumesof byproducts associated with energy production
•Minimal disturbance of adjacent areas for fill materials
•Introduce alkalinity
•Low permeability of some engineered CCBsprevents recharge and movement of groundwater
Cons:
•Contains potentially toxic metals
•Poor understanding of leachate mobility in natural environments
•Subsequent removal of these materials would present difficulties if such measures were ever deemed necessary
Pros and Cons of Using CCBs in Reclamation

The Indiana Department of Natural Resources wanted to use CCBs to positively alter the hydrology of an AML site and improve chemistry of surface water exiting the site
Reclamation goal
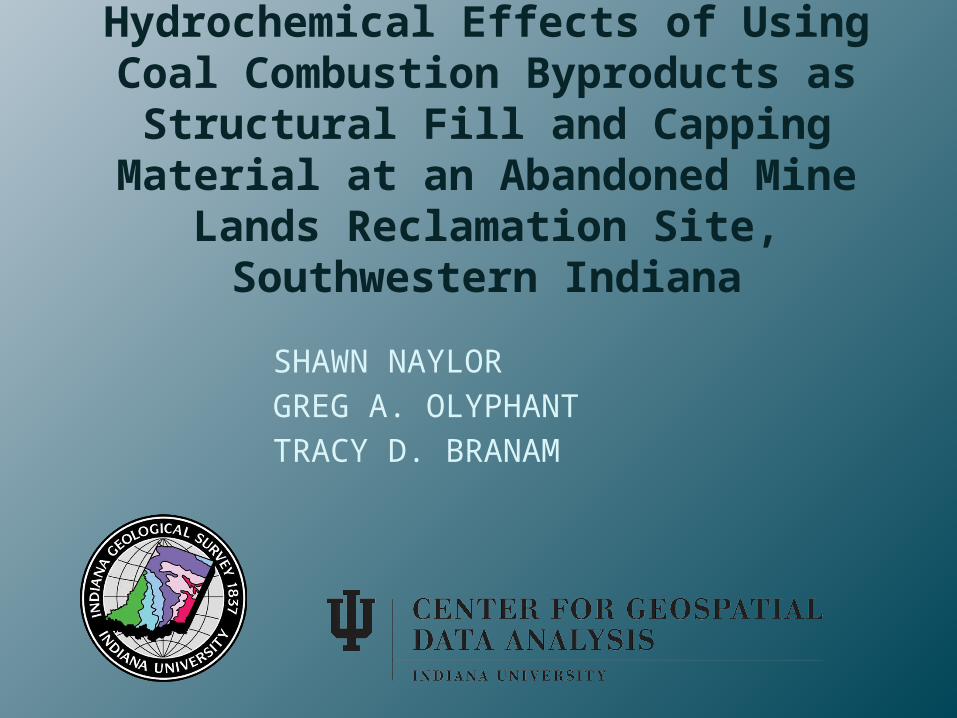
Although several researchers have used laboratory experiments to examine the physical and chemical characteristics of CCBs, studies that comprehensively examine the impacts of CCBs in applied settings are few.
To determine the long-term physical and chemical effects of CCBs on a reclaimed AML site, baseline data are compared with post-reclamation data from several unique monitoring sites where CCBs were emplaced.
Purpose of study
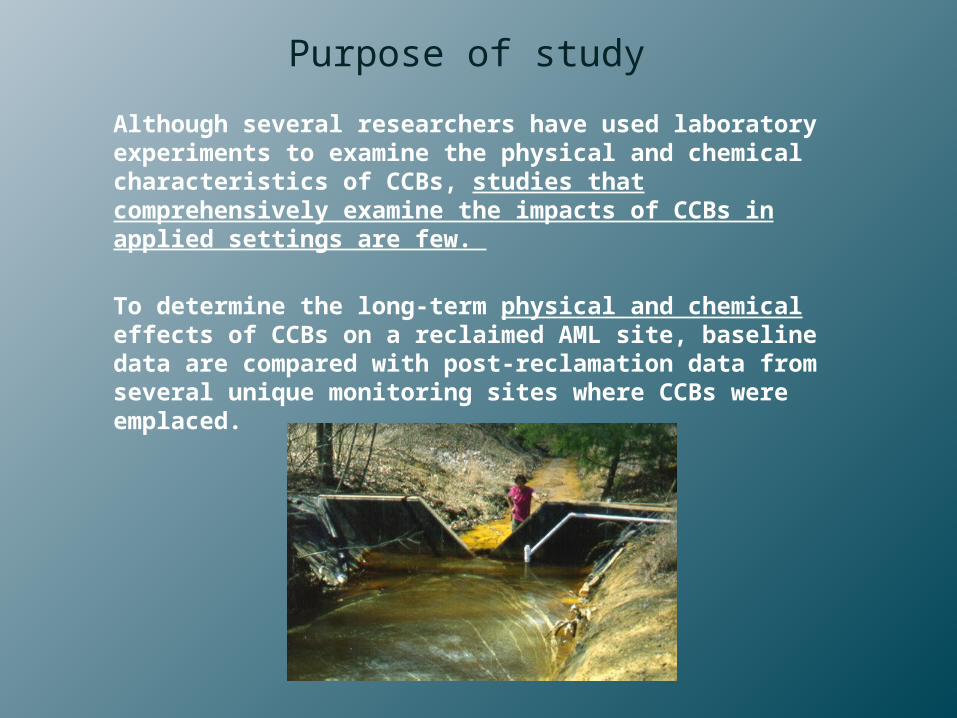
•Surface and underground coal mining, 1895 to 1983
•Pyrite / associated weathering products were distributed among a large pyritic refuse pile in a central lowland area, underground mine workings, and highwall ponds (total area ~50 hectares)
History of Midwestern AML site
•AMD issued from a spring draining the underground mine workings and as baseflow from the central lowland aquifer
•In 1996, ~450,000 m3 of CCBs were used as cap and fill material during reclamation
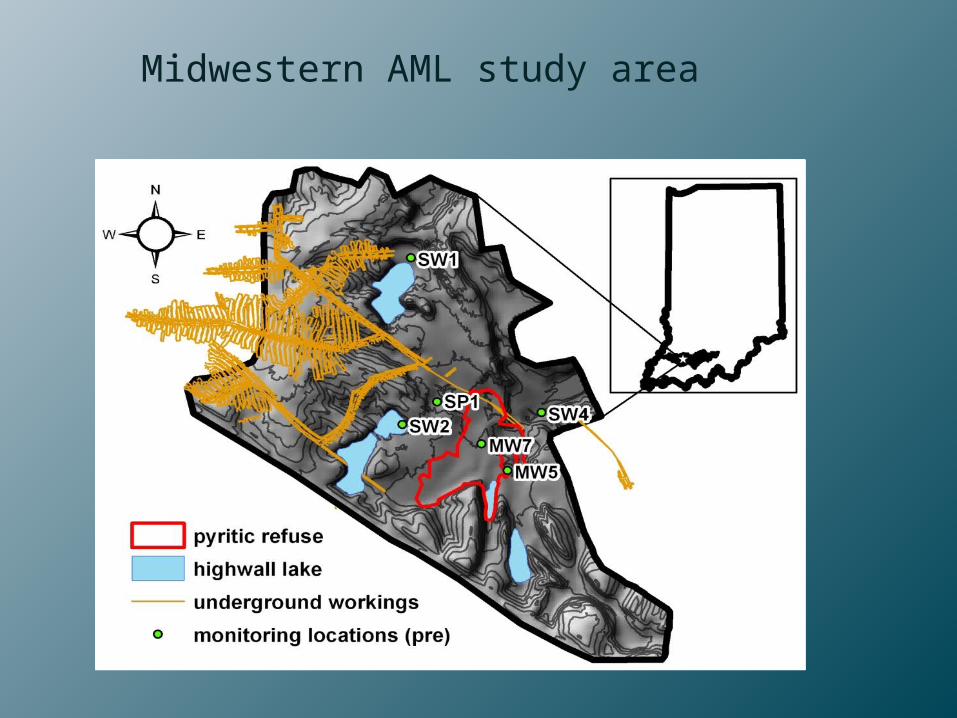
Midwestern AML study area
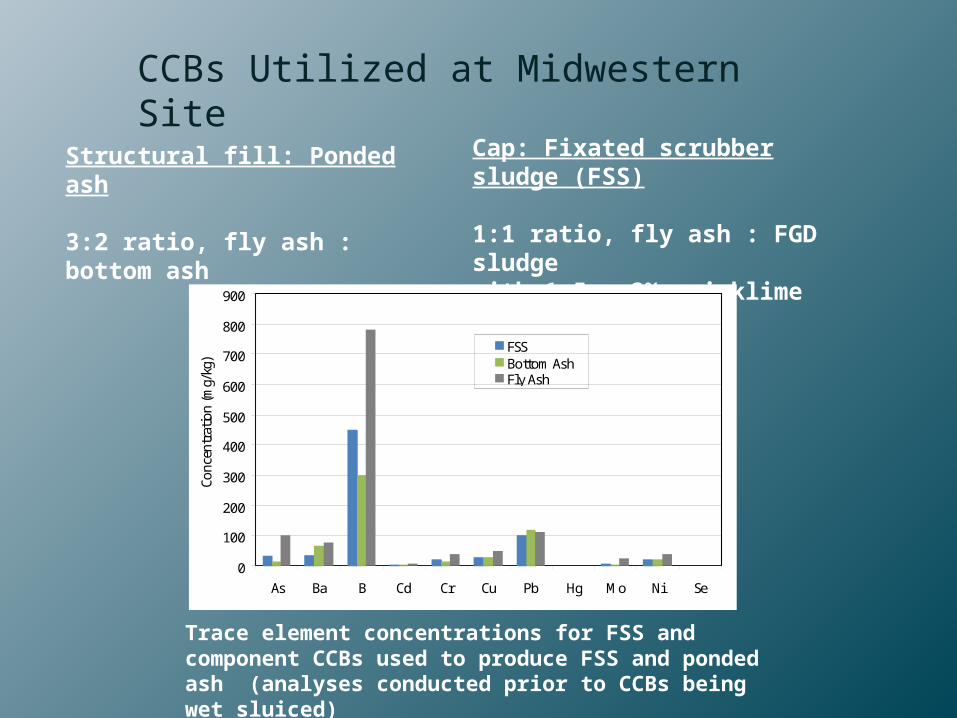
CCBs Utilized at Midwestern Site
Structural fill: Ponded ash
3:2 ratio, fly ash : bottom ash
Cap: Fixated scrubber sludge (FSS)
1:1 ratio, fly ash : FGD sludgewith 1.5 - 2% quicklime
0
100
200
300
400
500
600
700
800
900
As Ba B Cd Cr Cu Pb Hg Mo Ni Se
Conc
entr
ation
(mg/
kg)
FSSBottom AshFly Ash
Trace element concentrations for FSS and component CCBs used to produce FSS and ponded ash (analyses conducted prior to CCBs being wet sluiced)
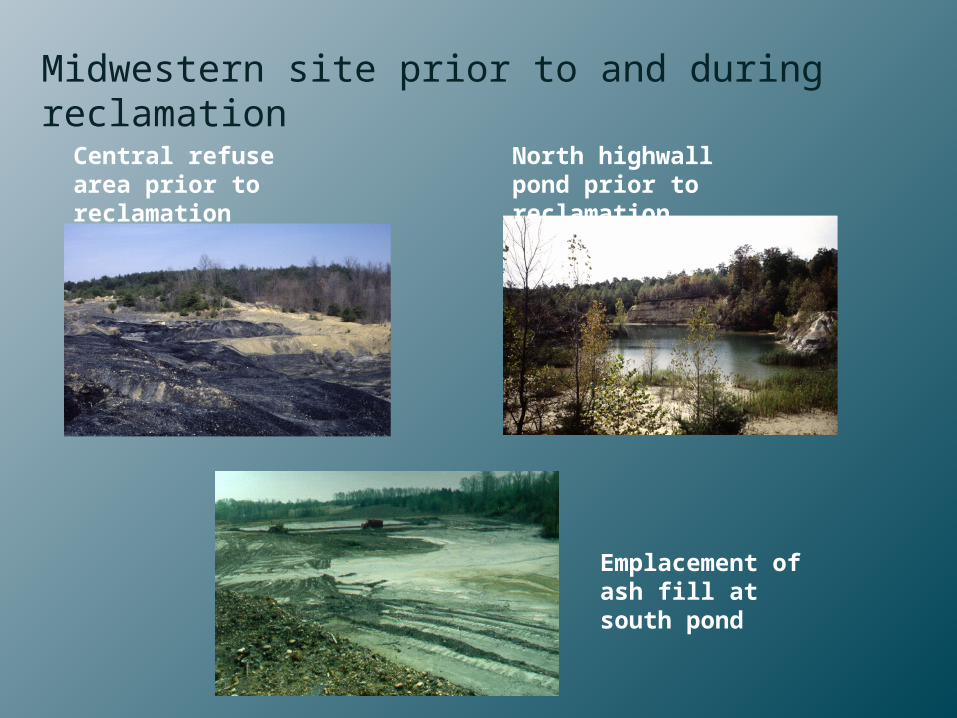
Central refuse area prior to reclamation
Midwestern site prior to and during reclamation
North highwall pond prior to reclamation
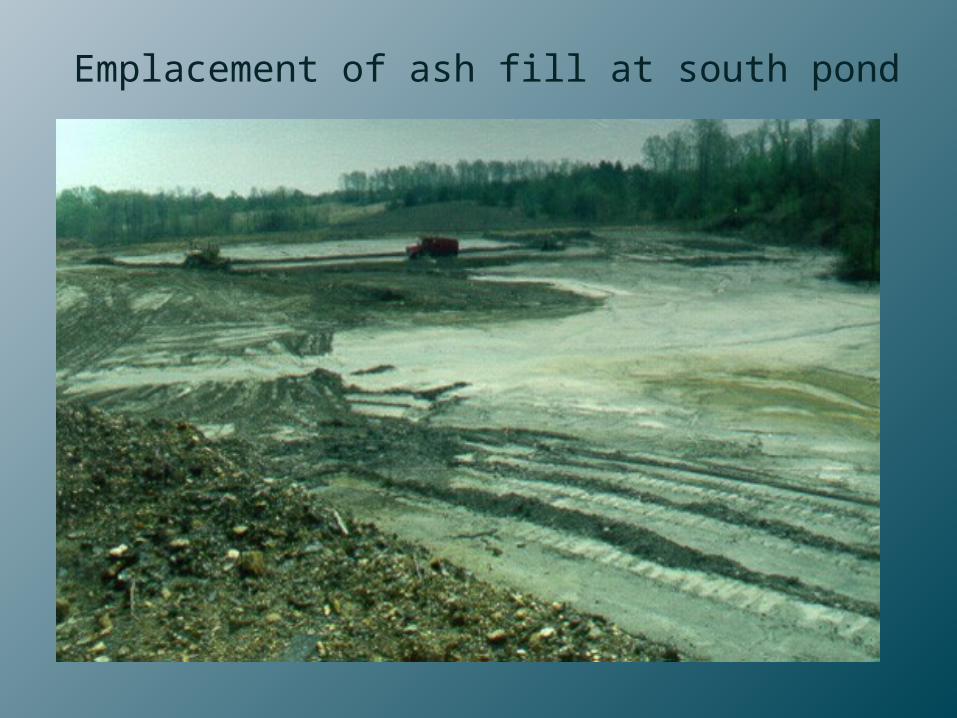
Emplacement of ash fill at south pond

Central refuse area prior to reclamation

Central refuse area prior to reclamation
Midwestern site prior to and during reclamation
North highwall pond prior to reclamation
Emplacement of ash fill at south pond
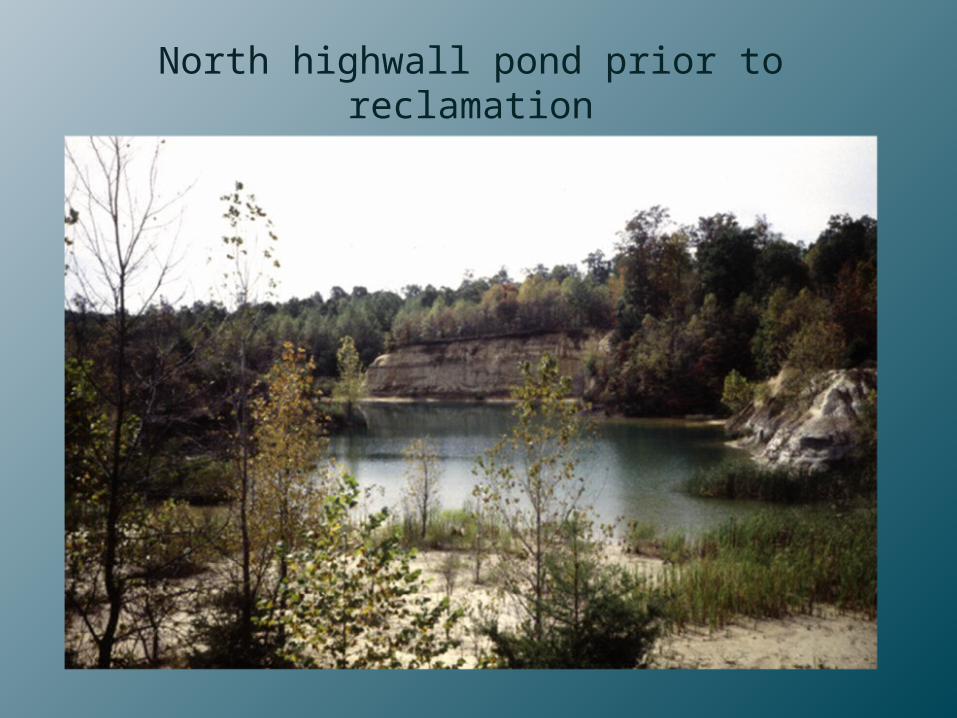
North highwall pond prior to reclamation

Central refuse area prior to reclamation
Midwestern site prior to and during reclamation
North highwall pond prior to reclamation
Emplacement of ash fill at south pond
Emplacement of ash fill at south pond
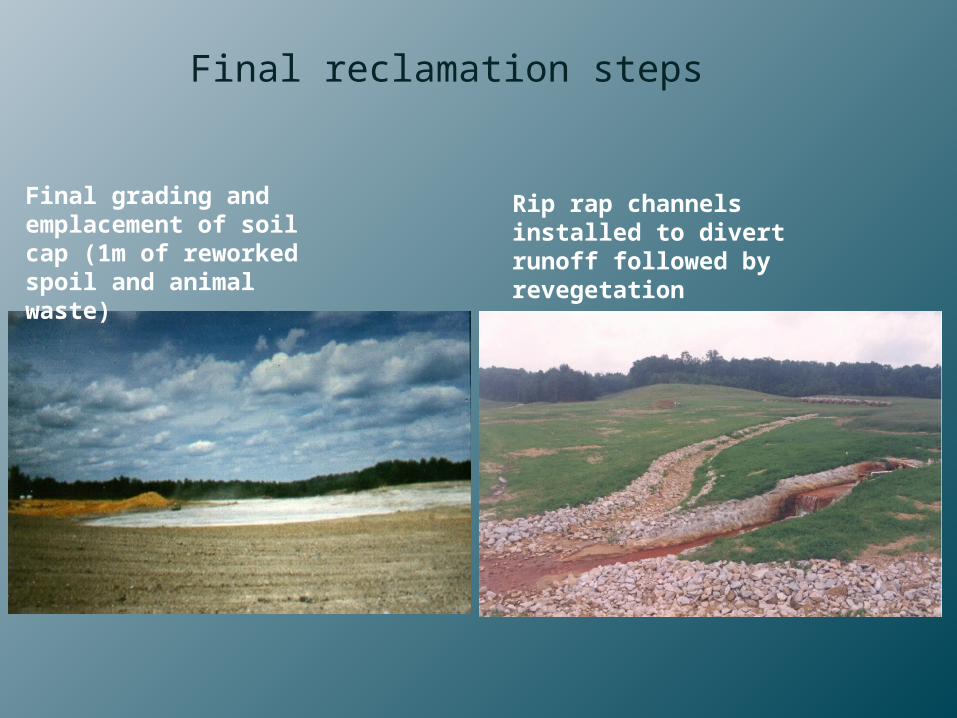
Final grading and emplacement of soil cap (1m of reworked spoil and animal waste)
Final reclamation steps
Rip rap channels installed to divert runoff followed by revegetation
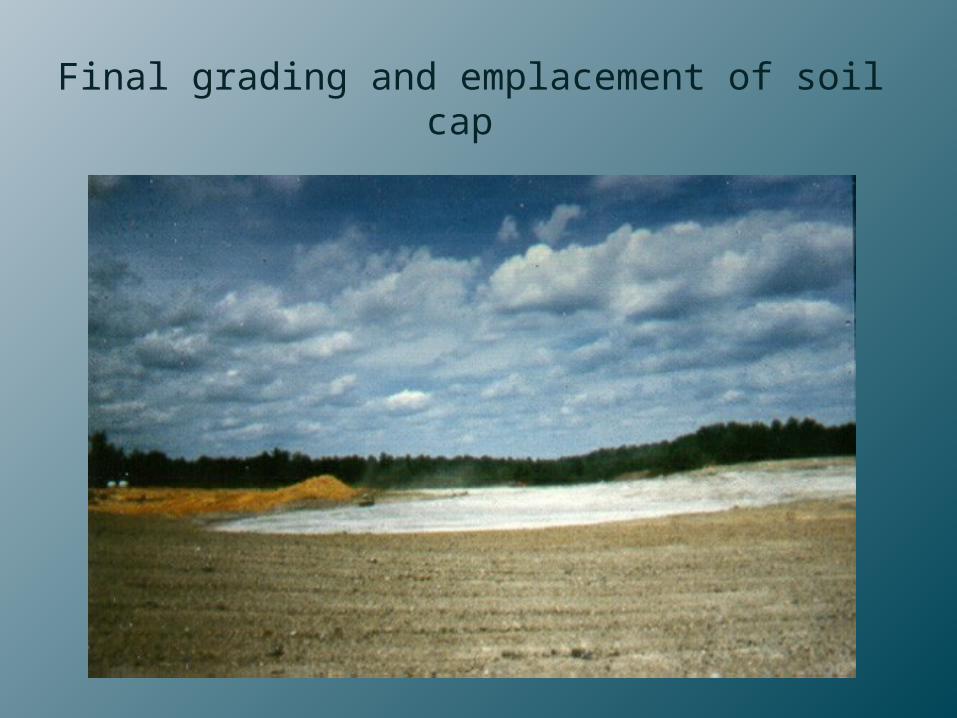
Final grading and emplacement of soil cap

Final grading and emplacement of soil cap (1m of reworked spoil and animal waste)
Final reclamation steps
Rip rap channels installed to divert runoff followed by revegetation
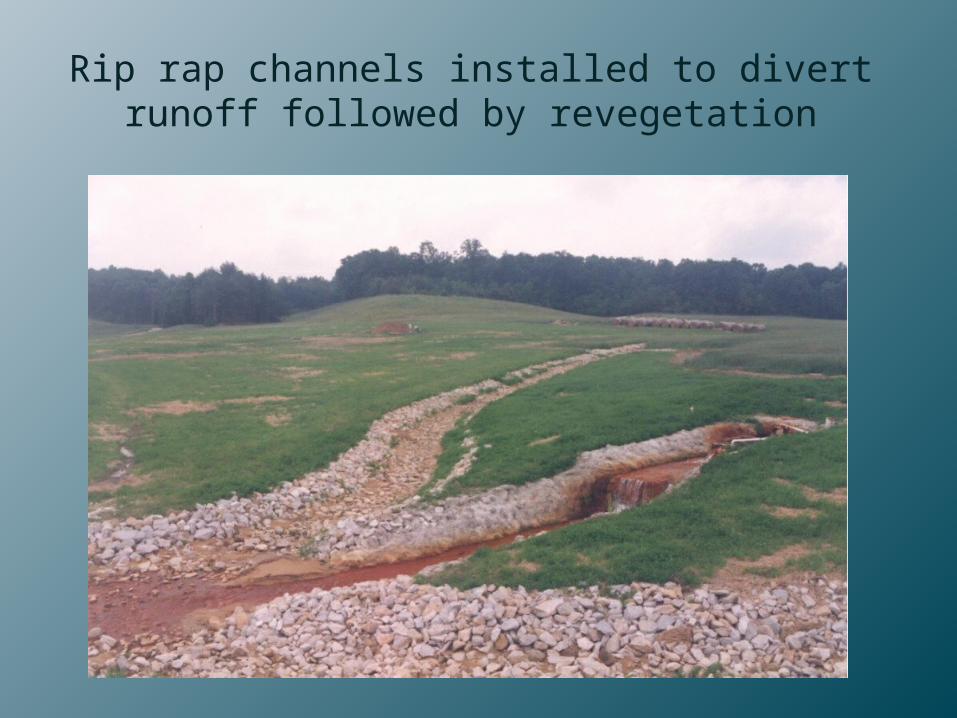
Rip rap channels installed to divert runoff followed by revegetation

Post-reclamation monitoring (November 1996 – November 2009)
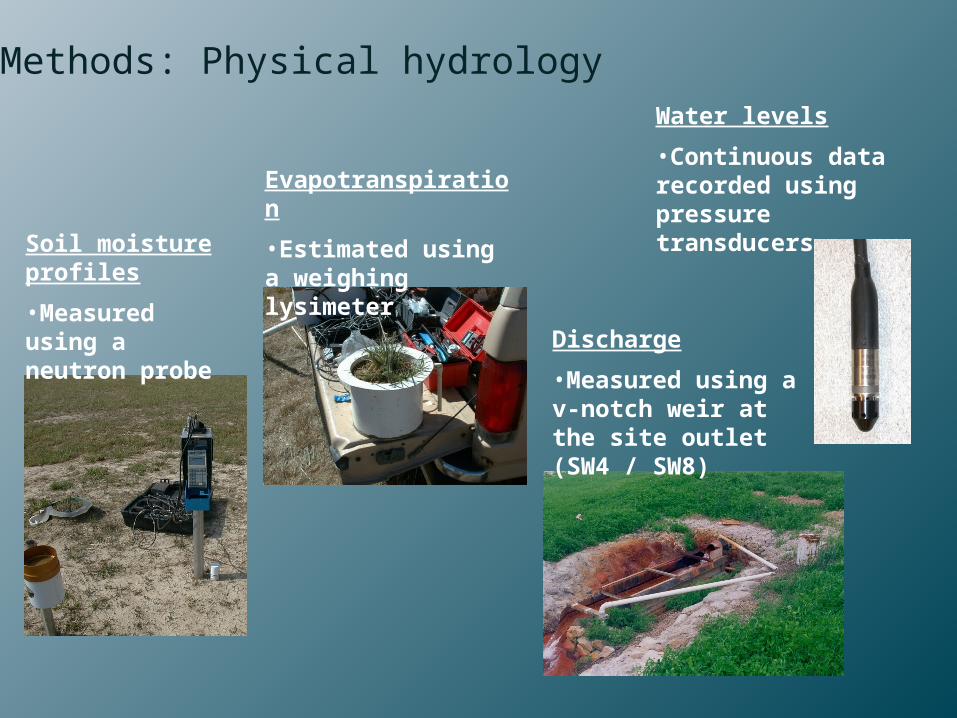
Methods: Physical hydrology
Soil moisture profiles
•Measured using a neutron probe
Evapotranspiration
•Estimated using a weighing lysimeter
Discharge
•Measured using a v-notch weir at the site outlet (SW4 / SW8)
Water levels
•Continuous data recorded using pressure transducers
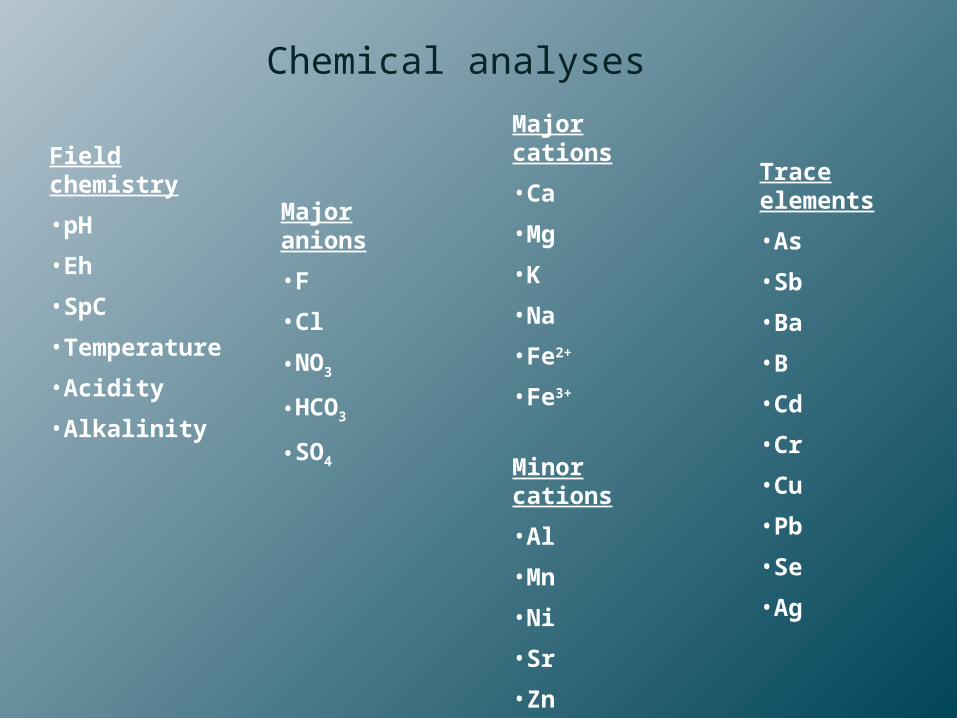
Chemical analyses
Field chemistry
•pH
•Eh
•SpC
•Temperature
•Acidity
•Alkalinity
Major cations
•Ca
•Mg
•K
•Na
•Fe2+
•Fe3+
Trace elements
•As
•Sb
•Ba
•B
•Cd
•Cr
•Cu
•Pb
•Se
•Ag
Minor cations
•Al
•Mn
•Ni
•Sr
•Zn
Major anions
•F
•Cl
•NO3
•HCO3
•SO4
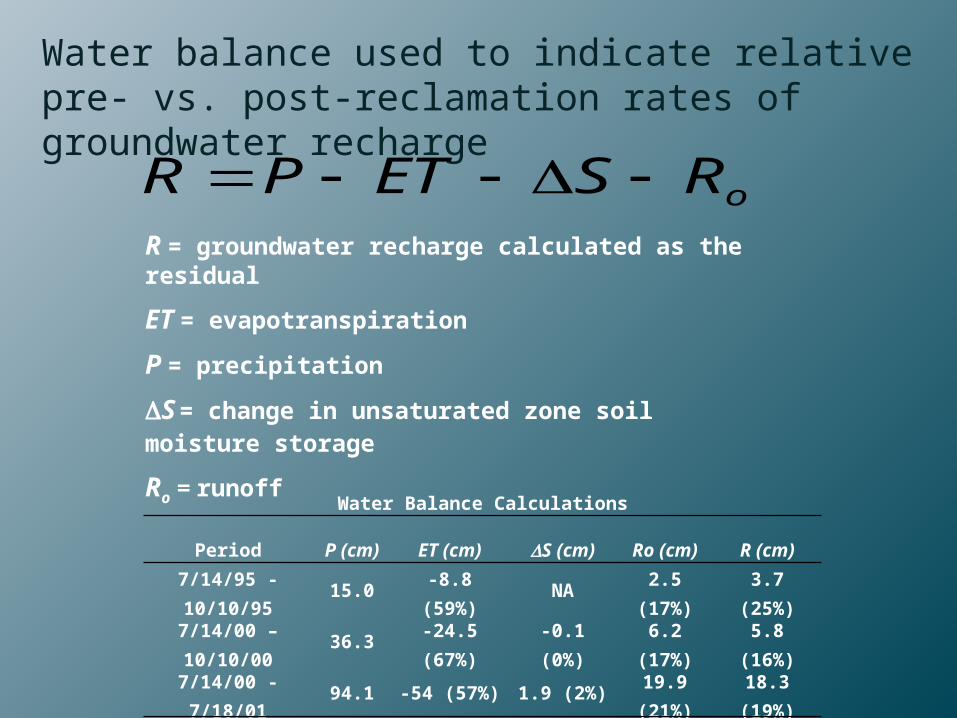
oRSETPR R = groundwater recharge calculated as the residual
ET = evapotranspiration
P = precipitation
DS = change in unsaturated zone soil moisture storage
Ro = runoff
Water Balance Calculations
Period P (cm) ET (cm) DS (cm) Ro (cm) R (cm)
7/14/95 - 10/10/95 15.0 -8.8 (59%) NA2.5
(17%)3.7 (25%)
7/14/00 – 10/10/00
36.3 -24.5 (67%) -0.1 (0%)6.2
(17%)5.8 (16%)
7/14/00 - 7/18/01 94.1 -54 (57%) 1.9 (2%)19.9
(21%)18.3 (19%)
Water balance used to indicate relative pre- vs. post-reclamation rates of groundwater recharge

ttttt ePbBbbWL 210
Statistical analysis of refuse aquifer water level changes
Statistical Model:
DWLt = daily water level change in refuse aquifer (MW7)
b0 = regression constant
b1 = regression coefficient for barometric pressure (“barometric efficiency”)
DBt = daily barometric pressure change (cm H2O)
b2 = regression coefficient for precipitation
Pt = daily precipitation (cm)
ret = autocorrelated error term
ut = random error term
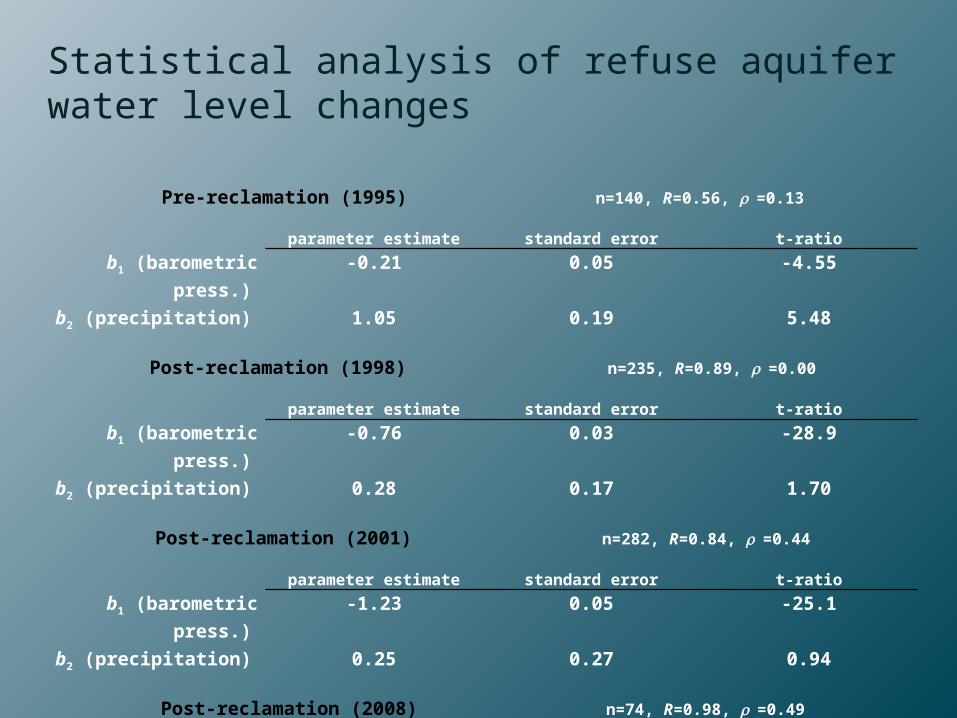
Pre-reclamation (1995) n=140, R=0.56, r =0.13
parameter estimate standard error t-ratiob1 (barometric press.) -0.21 0.05 -4.55
b2 (precipitation) 1.05 0.19 5.48
Post-reclamation (1998) n=235, R=0.89, r =0.00
parameter estimate standard error t-ratiob1 (barometric press.) -0.76 0.03 -28.9
b2 (precipitation) 0.28 0.17 1.70
Post-reclamation (2001) n=282, R=0.84, r =0.44
parameter estimate standard error t-ratiob1 (barometric press.) -1.23 0.05 -25.1
b2 (precipitation) 0.25 0.27 0.94
Post-reclamation (2008) n=74, R=0.98, r =0.49
parameter estimate standard error t-ratiob1 (barometric press.) -0.79 0.02 -40.0
b2 (precipitation) -0.04 0.18 -0.20
Statistical analysis of refuse aquifer water level changes
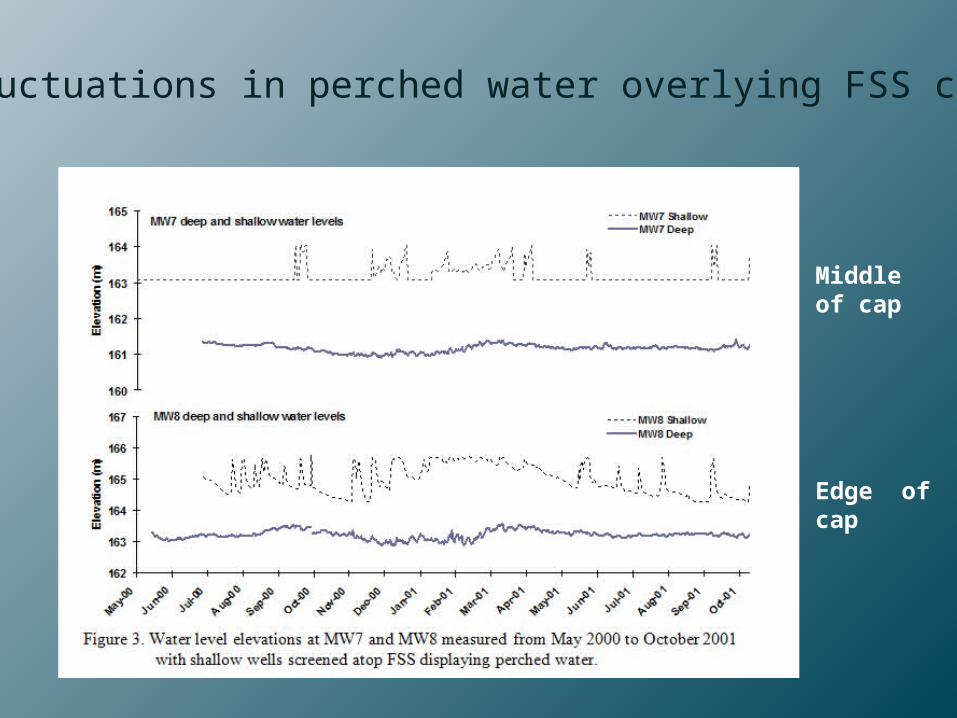
Fluctuations in perched water overlying FSS cap
Middle of cap
Edge of cap

0.30.6000000000
000010.9
1.2
1.5
1.8
2.1
2.4
2.7
3.1
3.4
3.7
4
4.3
0 0.1 0.2 0.3 0.4 0.5
MW 4 Soil Moisture
Volumetric Moisture Content
Dep
th (m
)
Top of FSS layer
Spoil
N = 28
0.3
0.600000000000001
0.9
1.2
1.5
1.8
2.1
2.4
2.7
3
3.3
0 0.1 0.2 0.3 0.4 0.5
MW7 Soil Moisture
Volumetric Moisture ContentD
epth
(m)
Top of FSS layer
N = 27
Soil moisture data from former central lowland area
whiskers = min/max
bars = 25th/ 75th percentile
white line = median value
red squares = mean value
SO4
(mg/l)
Fe(mg/l)
Acidity(mg/l)
Alkalinity(mg/l)
pH SpC(μmhos/cm)
TDS(mg/l)
Pre-reclamation water chemistry (April through August 1995)
SP1n=3
13801220-1540
7665-82
369193-720
110-34
4.13.7-5.1
19581927-1988
20331900-2100
MW7n=3
129678200-17500
44332800-5700
117327507-15817
00-0
1.41.1-1.8
2209313700-32800
2333312000-35000
SW4n=4
23532280-2500
243190-330
714451-901
00-0
2.92.8-3.1
32153030-3350
36503300-3900
SW2n=4
550370-690
346-80
27892-523
00-0
2.72.6-3.1
1479930-1758
848600-970
SW1n=4
18694-240
61-18
10411-350
00-0
4.24.0-5.3
460392-508
338230-420
MW5n=4
26952520-2880
285250-320
885825-979
00-0
3.13.0-3.4
35553390-3790
42753700-4700
Post-reclamation water chemistry (November 1996 through June 2007)
SP2A1463
722-1680n=20
8664-120n=19
159122-217
n=20
267218-323
n=20
6.46.0-7.3n=20
25311836-2810
n=20
26322336-3000
n=17
MW78119
2192-15900n=20
2421785-5700
n=18
58391560-13413
n=20
00-0
n=20
2.31.6-4.0n=20
88904103-20800
n=20
151226405-29000
n=17
SW81579
625-2360n=20
282-83n=19
1390-350n=19
320-140n=20
3.52.7-7.0n=20
24481408-3389
n=20
24521600-3600
n=17
MW81794
1650-2270n=20
10-6
n=19
200-70n=20
5529-123n=20
7.06.2-8.7n=20
30142516-3269
n=20
41922686-6823
n=17
MW91687
1370-1972n=18
14516-197n=18
37243-578n=17
234104-460
n=18
6.05.6-7.1n=18
27401832-3172
n=18
30092400-3600
n=17
MW5S2745
2175-4740n=17
27546-482n=17
524110-913
n=17
1100-330n=16
5.24.3-6.8n=17
37262872-4950
n=17
50193500-9100
n=15
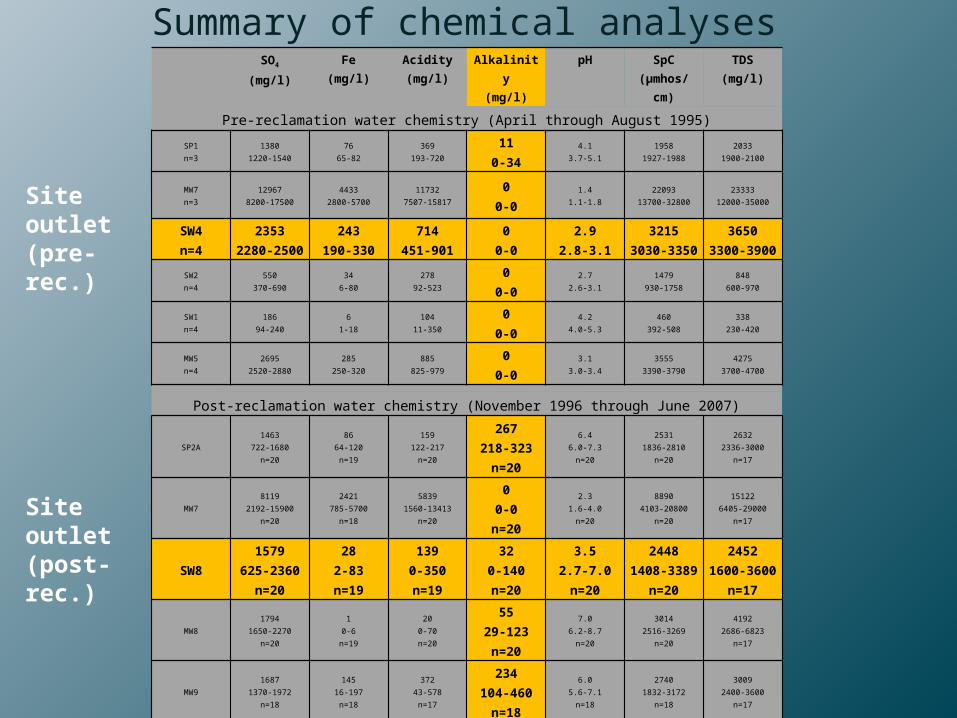
Summary of chemical analyses
Site outlet(pre-rec.)
Site outlet(post-rec.)
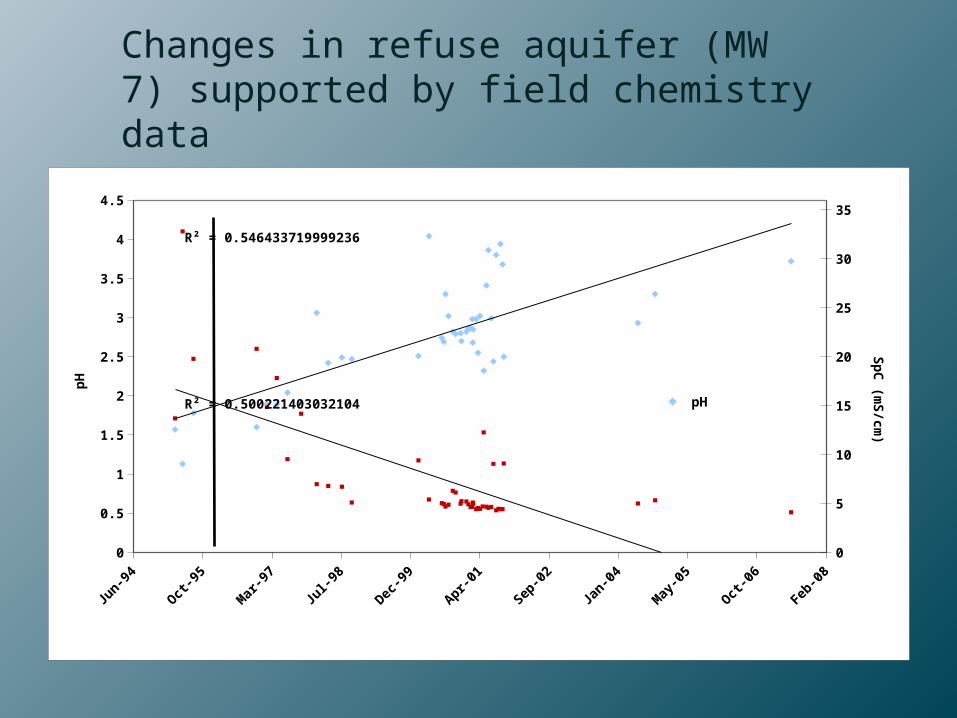
Changes in refuse aquifer (MW 7) supported by field chemistry data
Jun-9
4
Oct-9
5
Mar
-97
Jul-9
8
Dec-9
9
Apr-01
Sep-0
2
Jan-0
4
May
-05
Oct-0
6
Feb-0
80
0.5
1
1.5
2
2.5
3
3.5
4
4.5
0
5
10
15
20
25
30
35
R² = 0.500221403032104
R² = 0.546433719999236
pHLinear (pH)
pH
Sp
C (m
S/cm
)
Jun-9
4
Oct-9
5
Mar
-97
Jul-9
8
Dec-9
9
Apr-01
Sep-0
2
Jan-0
4
May
-05
Oct-0
6
Feb-0
8
Jul-0
9
Nov-10
0
2000
4000
6000
8000
10000
12000
14000
16000
0
1000
2000
3000
4000
5000
6000
7000
8000
acidity arsenic
To
tal
acid
ity
(mg
/L)
Arsen
ic (µg/L
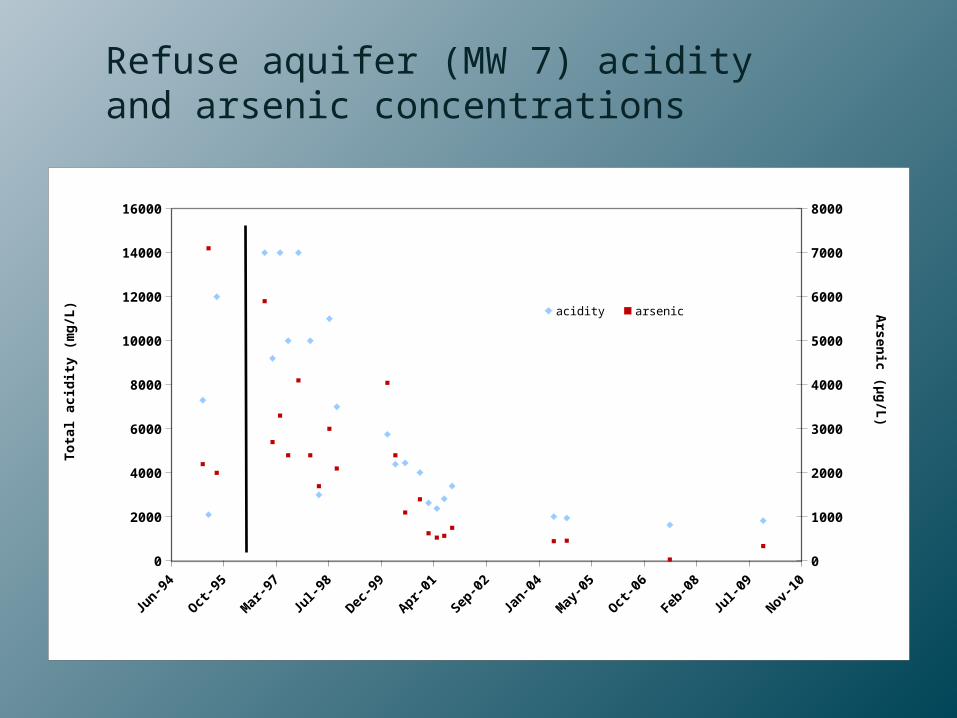
)Refuse aquifer (MW 7) acidity and arsenic concentrations
Jun-9
4
Oct-9
5
Mar
-97
Jul-9
8
Dec-9
9
Apr-01
Sep-0
2
Jan-0
4
May
-05
Oct-0
6
Feb-0
8
Jul-0
9
Nov-10
0
5
10
15
20
25
30
35
40
MW7 SW2/MW8 SW1/MW9
Bo
ron
(m
g/L
)
FSS over refuse
FSS over ash-filled pond
Ash-filled pond
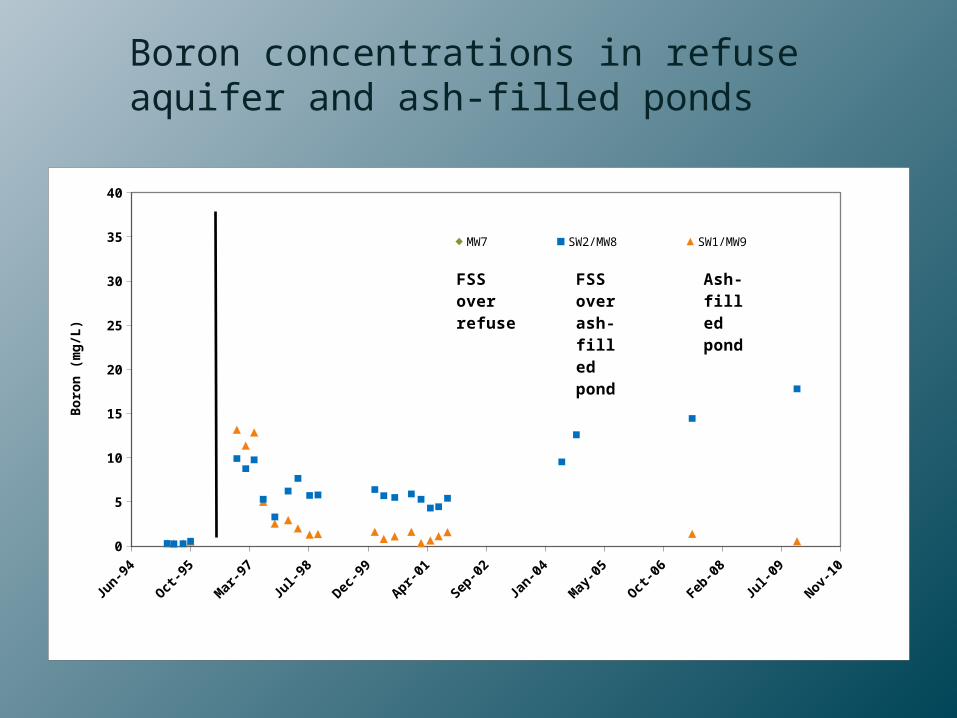
Boron concentrations in refuse aquifer and ash-filled ponds
Jun-9
4
Oct-9
5
Mar
-97
Jul-9
8
Dec-9
9
Apr-01
Sep-0
2
Jan-0
4
May
-05
Oct-0
6
Feb-0
8
Jul-0
9
Nov-10
0
10
20
30
40
50
SW2/MW8 SW1/MW9
Ars
enic
(µg
/L)
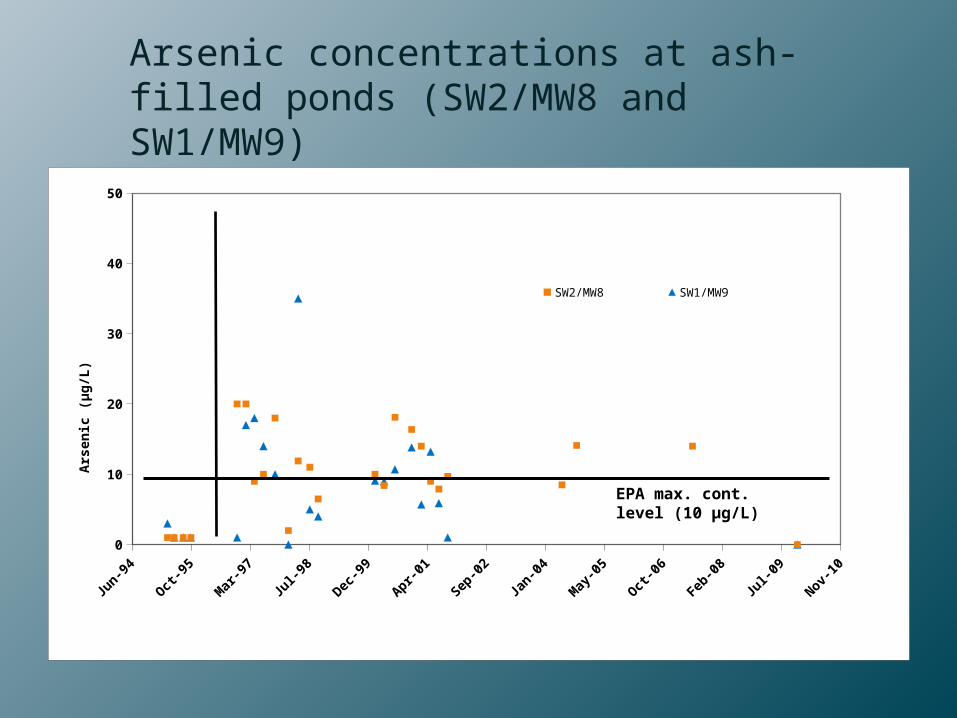
Arsenic concentrations at ash-filled ponds (SW2/MW8 and SW1/MW9)
EPA max. cont. level (10 µg/L)
Conclusions – physical hydrology
•There has been a reduction in groundwater recharge that is attributed to:
1. Effectiveness of FSS cap that is distributed over 15% of the study area
2. Re-vegetation efforts have increased evapotranspiration
3. Increased barometric efficiency of the refuse aquifer indicates that it is now behaving as a confined aquifer
4. Perched water atop the FSS and little fluctuation in soil moisture content within the cap indicate that direct recharge of the refuse aquifer with oxygenated meteoric water is no longer taking place

Conclusions – hydrochemistry
•Long-term general improvements in water quality can be seen at each monitoring site
•Alkalinity is now intermittently present at the site outlet and most of the other sites now regularly contain alkalinity
•Improving trends in pH and SpC at the refuse aquifer (MW7) coincide with decreases in sulfate, total iron, lead, and total acidity
•Arsenic and Boron remain slightly elevated at ash-filled lakes although the most recent sampling event in November, 2009 resulted in non-detect results for Arsenic at these sites

Acknowledgements
•Much of this work was funded by grants from the Indiana Department on Natural Resources, Division of Reclamation
•Field work, including instrumentation and data collection, was coordinated by Jack Haddan with assistance from Curt Thomas, Kevin Spindler, Dana Cannon, Jeff Olyphant, and Jimmy Boswell. Lab analyses were conducted by Peg Ennis and Ron Smith. Denver Harper played a vital role in the design of the monitoring network, interpretation of pre-reclamation mine features and hydrology, as well as the development of a site GIS database.
Questions?
Related Documents