Sharpening the ACRE Tool Pat Westhoff ([email protected] ) Based on work by Scott Gerlt & Peter Zimmel National Farm Business Management Conference St. Louis, June 15, 2009

Sharpening the ACRE Tool Pat Westhoff ([email protected])[email protected] Based on work by Scott Gerlt & Peter Zimmel National Farm Business.
Dec 30, 2015
Welcome message from author
This document is posted to help you gain knowledge. Please leave a comment to let me know what you think about it! Share it to your friends and learn new things together.
Transcript

Sharpening the ACRE Tool
Pat Westhoff ([email protected])Based on work by Scott Gerlt & Peter Zimmel
National Farm Business Management ConferenceSt. Louis, June 15, 2009

Today’s agenda
ACRE program What is ACRE? How are the calculations made? Example Decision tree Sign up
ACRE tool

ACRE
ACRE, the Average Crop Revenue Election program Offers protection against reduction in gross
revenue
Departure from fixed, price-based programs
For payments to occur, state and farm actual revenue must be less than trigger levels that adjust from year to year

ACRE’s moving targets
Two triggers must be pulled State actual revenue must fall below the state ACRE
guarantee AND Actual farm revenue must fall below the farm ACRE
benchmark established for your farm
Get a new guarantee each year Once established, the state ACRE guarantee cannot move more
than 10 percent per year.
Four Important Revenues
Missouri ACRE Guarantee
Missouri Actual
Your Farm ACRE Benchmark
Your Farm Actual

The trade-off
Potential payments are quite large, but Producers give up:
▪ 20% of direct payments (only guaranteed payment)▪ All countercyclical payments▪ And must accept 30% lower loan rate
Crop Loan Rate 70% of Loan Rate
Corn ($/bu) 1.95 1.365
Soybeans ($/bu) 5.00 3.50
Wheat ($/bu) 2.75 1.92
Grain Sorghum ($/bu) 1.95 1.365
Cotton ($/lb) 0.52 0.364
Rice ($/cwt) 6.50 4.55
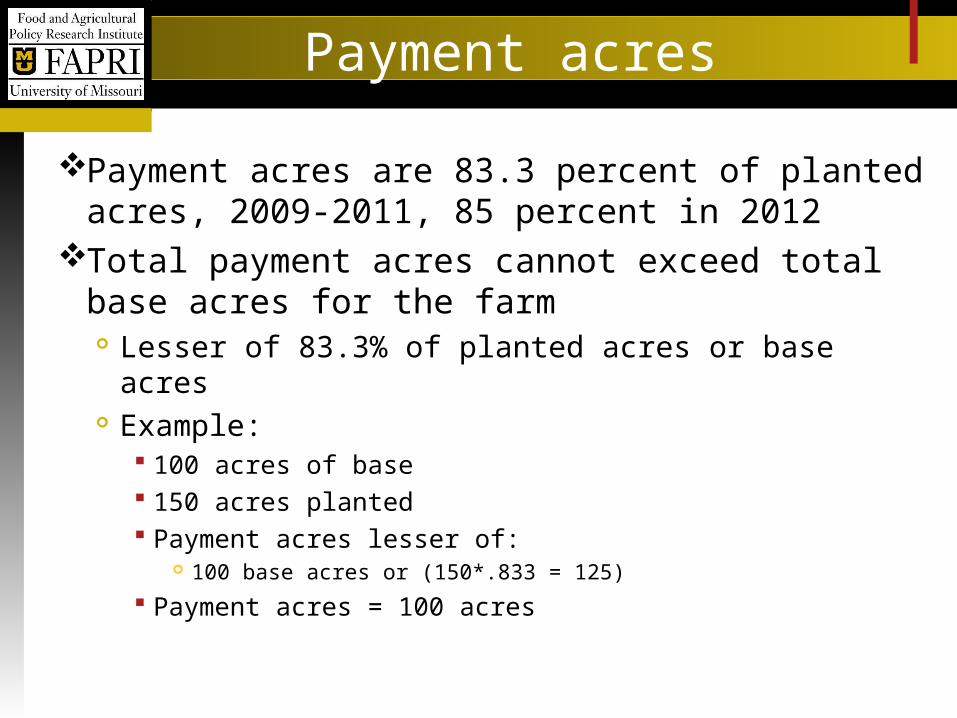
Payment acres
Payment acres are 83.3 percent of planted acres, 2009-2011, 85 percent in 2012
Total payment acres cannot exceed total base acres for the farm Lesser of 83.3% of planted acres or base acres Example:
100 acres of base 150 acres planted Payment acres lesser of:
100 base acres or (150*.833 = 125)
Payment acres = 100 acres
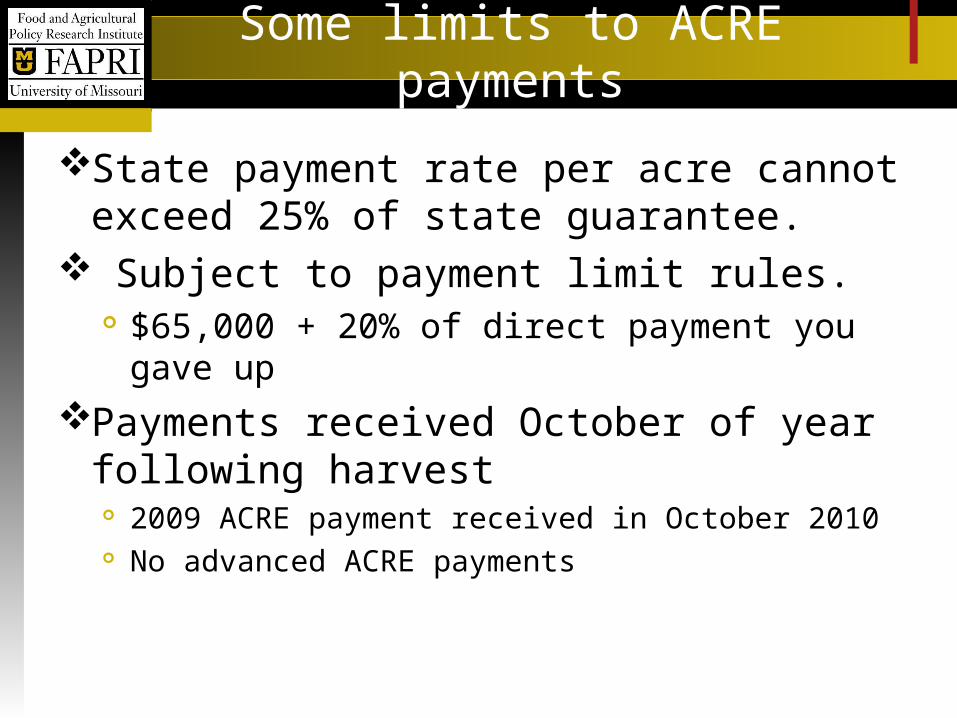
Some limits to ACRE payments
State payment rate per acre cannot exceed 25% of state guarantee.
Subject to payment limit rules. $65,000 + 20% of direct payment you gave up
Payments received October of year following harvest
2009 ACRE payment received in October 2010 No advanced ACRE payments

State ACRE guarantee calculation
State ACRE guarantee revenue per planted acre =
Recent 2-year average national season-average farm price
▪ times5-year Olympic average of state yields per
planted acre,▪ times
90%

Farm ACRE benchmark calculation
Farm ACRE benchmark revenue per planted acre =
Recent 2-year average national price
▪ times5-year Olympic average of farm yields per
planted acre,
▪ plus Crop insurance premiums paid

Farm benchmark yields
Yields from 5 most recent yearsHigher of:
95% of county average yield Actual farm yield determined by:
Total production divided by total PLANTED acres
If you use 95% of county average for any of the 5 years that you HAD production of that crop, you have to use 95% of county average for all 5 years

Acceptable production records
Crop insurance and NAP recordsLoan and LDP recordsCommercially sold production records
Commercial receipts, settlement sheets, warehouse ledger sheets, load summaries
Fed to livestock Documentary evidence
Such as contemporaneous measurements, truck scale tickets, contemporaneous diaries
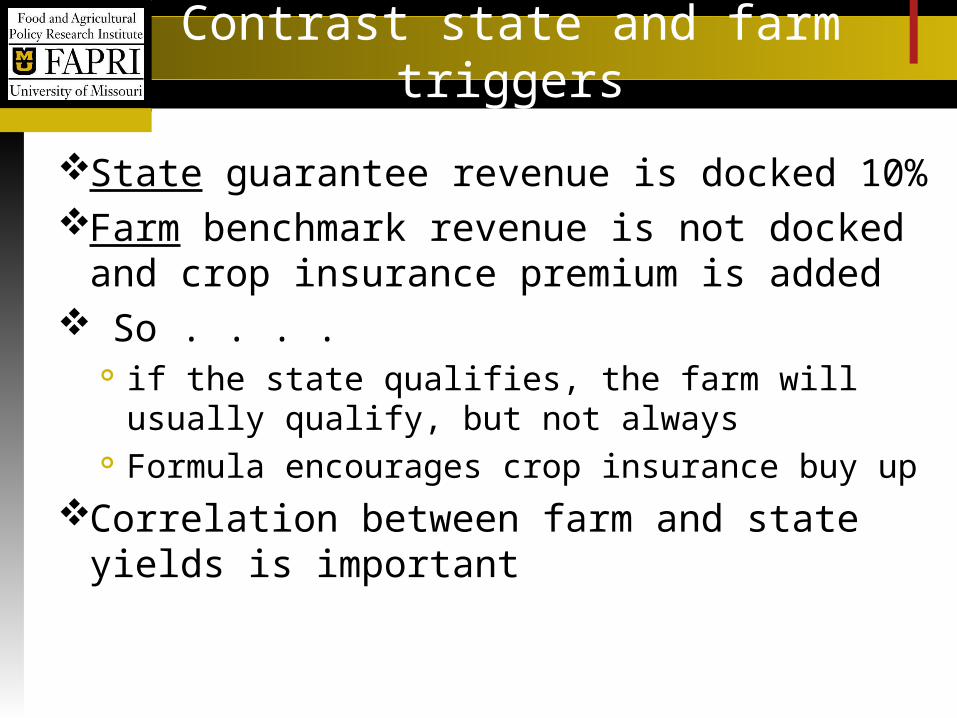
Contrast state and farm triggers
State guarantee revenue is docked 10%Farm benchmark revenue is not docked and
crop insurance premium is added So . . . .
if the state qualifies, the farm will usually qualify, but not always
Formula encourages crop insurance buy up
Correlation between farm and state yields is important

Adjustments and stipulations
Farm payments are adjusted for yields Olympic avg farm relative to Olympic avg state
There is no minimum farm loss to meet the trigger If farm level loss is $0.01 per acre, payment is
same as if farm level loss is $100 per acre But ACRE payments = 0 if farm revenue exceeds
farm benchmark by even $0.01 per acre
Separate ACRE payments calculated for each program crop planted, then summed for farm
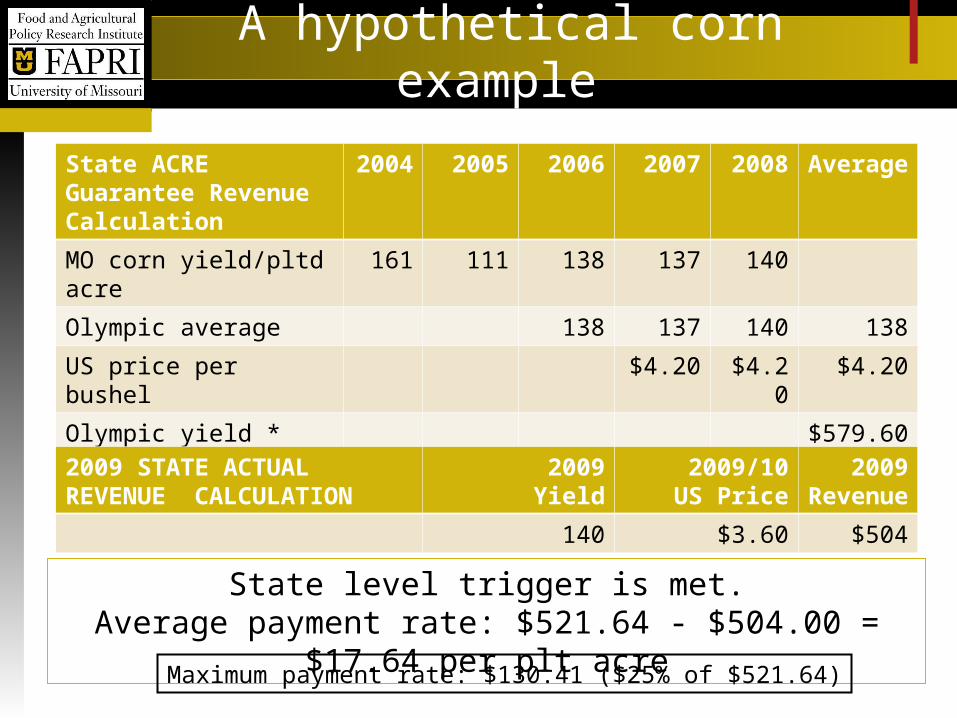
A hypothetical corn example
State ACRE Guarantee Revenue Calculation
2004 2005 2006 2007 2008 Average
MO corn yield/pltd acre 161 111 138 137 140
Olympic average 138 137 140 138
US price per bushel $4.20 $4.20 $4.20
Olympic yield * avg price $579.60
MO revenue guarantee with 10% adjustment $521.64
State level trigger is met.Average payment rate: $521.64 - $504.00 = $17.64
per plt acre
2009 STATE ACTUALREVENUE CALCULATION
2009 Yield
2009/10 US Price
2009Revenue
140 $3.60 $504
Maximum payment rate: $130.41 ($25% of $521.64)
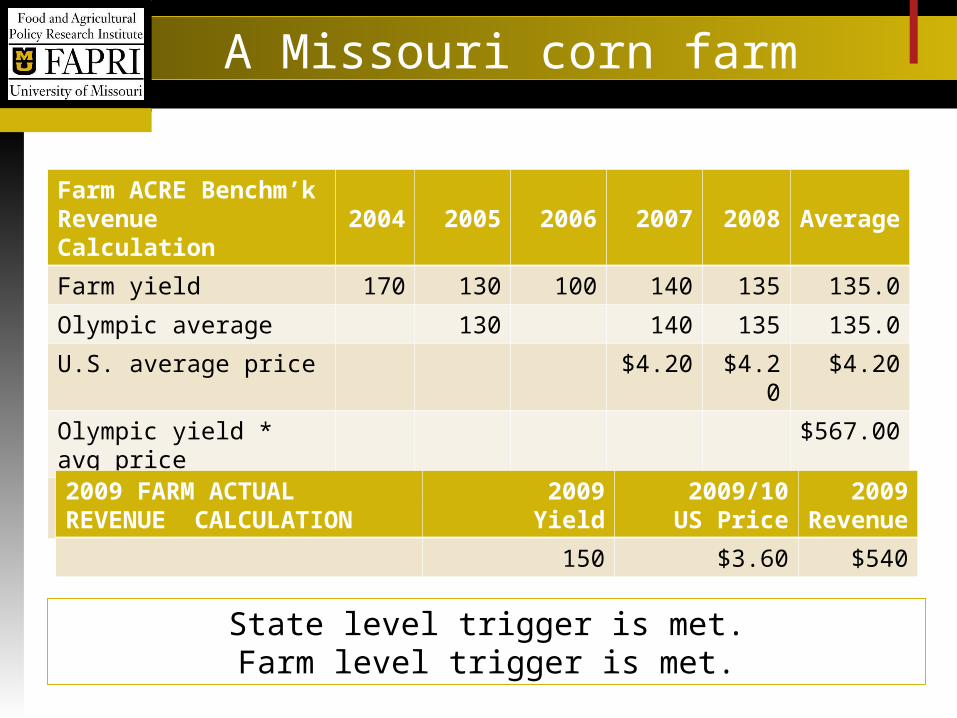
A Missouri corn farm
Farm ACRE Benchm’k Revenue Calculation 2004 2005 2006 2007 2008 Average
Farm yield 170 130 100 140 135 135.0
Olympic average 130 140 135 135.0
U.S. average price $4.20 $4.20 $4.20
Olympic yield * avg price $567.00
Farm revenue benchmark with $25.00 crop insurance $592.00
2009 FARM ACTUALREVENUE CALCULATION
2009 Yield
2009/10 US Price
2009Revenue
150 $3.60 $540
State level trigger is met.Farm level trigger is met.
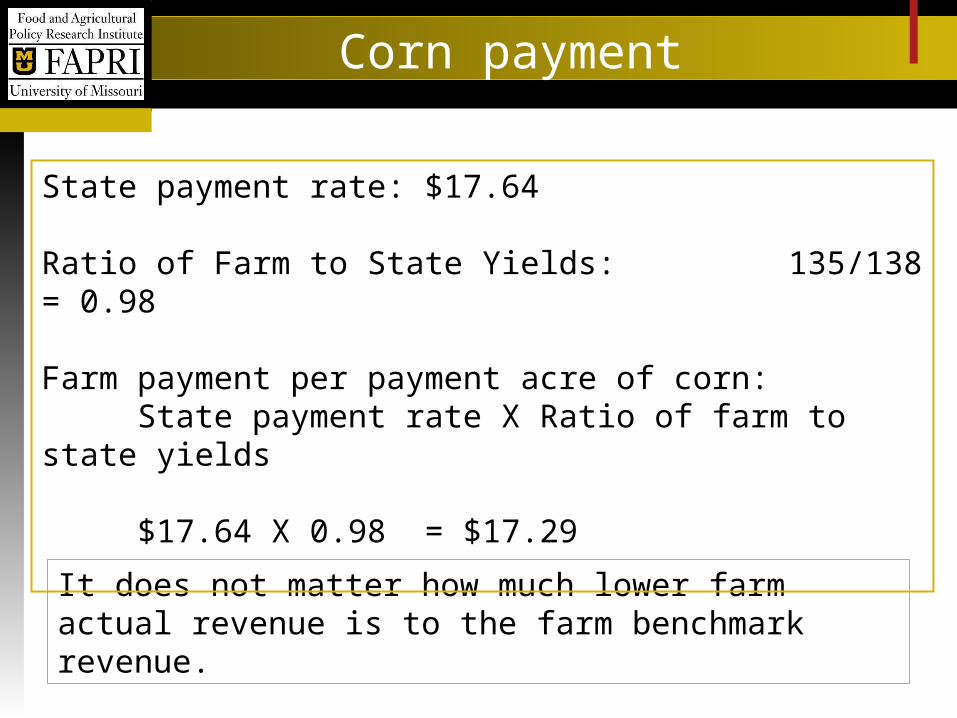
Corn payment
It does not matter how much lower farm actual revenue is to the farm benchmark revenue.
State payment rate: $17.64
Ratio of Farm to State Yields: 135/138 = 0.98
Farm payment per payment acre of corn:State payment rate X Ratio of farm to state
yields
$17.64 X 0.98 = $17.29
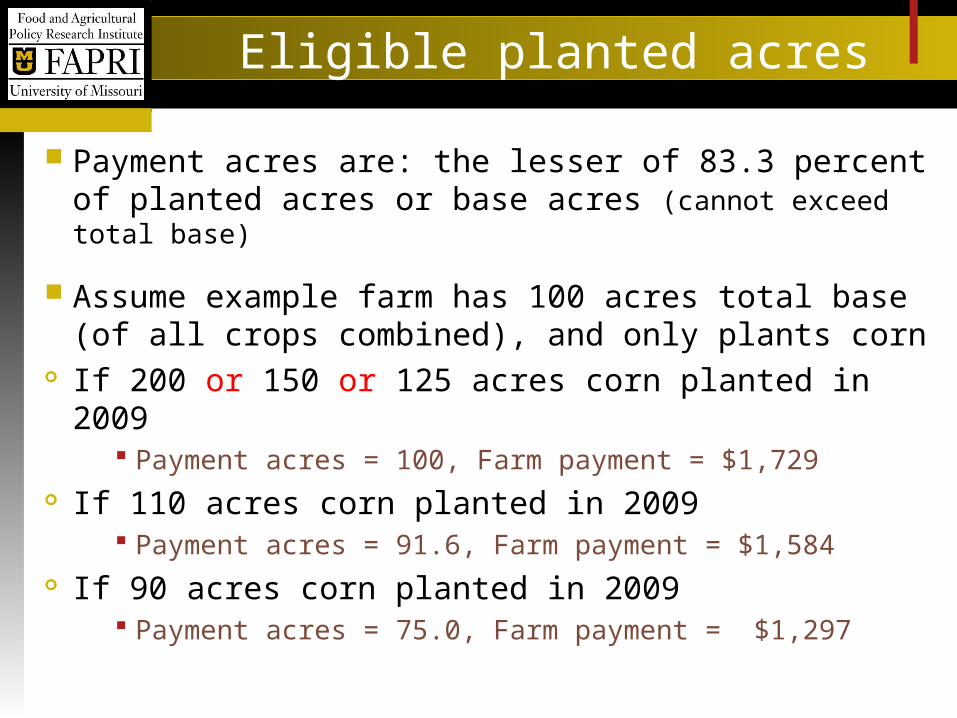
Eligible planted acres
Payment acres are: the lesser of 83.3 percent of planted acres or base acres (cannot exceed total base)
Assume example farm has 100 acres total base (of all crops combined), and only plants corn
If 200 or 150 or 125 acres corn planted in 2009 Payment acres = 100, Farm payment = $1,729
If 110 acres corn planted in 2009 Payment acres = 91.6, Farm payment = $1,584
If 90 acres corn planted in 2009 Payment acres = 75.0, Farm payment = $1,297
Deciding whether to participate
IF future revenue is steady or increasing Zero ACRE payments
and lose 20% of direct payment
IF future revenue declines Payments likely to be
larger than foregone payments —potential to be a lot large.
In some ways, sort of like a crop insurance choice Like crop insurance, most likely outcome in any given
year is no ACRE payments, but When payments occur, they could be large Are likely benefits enough to justify “premium” of
reduced traditional program payments?
Differences from crop insurance Payment depends on state results Once decide to participate, in for life of farm bill Must enroll all crops on a farm
Deciding whether to participate

ACRE decision tree:State payment trigger
Prices
State Yields
Level
State Yields
Down
State Yields
Up
No MaybeYes Maybe NoNo
Average Average
Yes Yes Maybe
Up
Average
Down UpDown UpDown
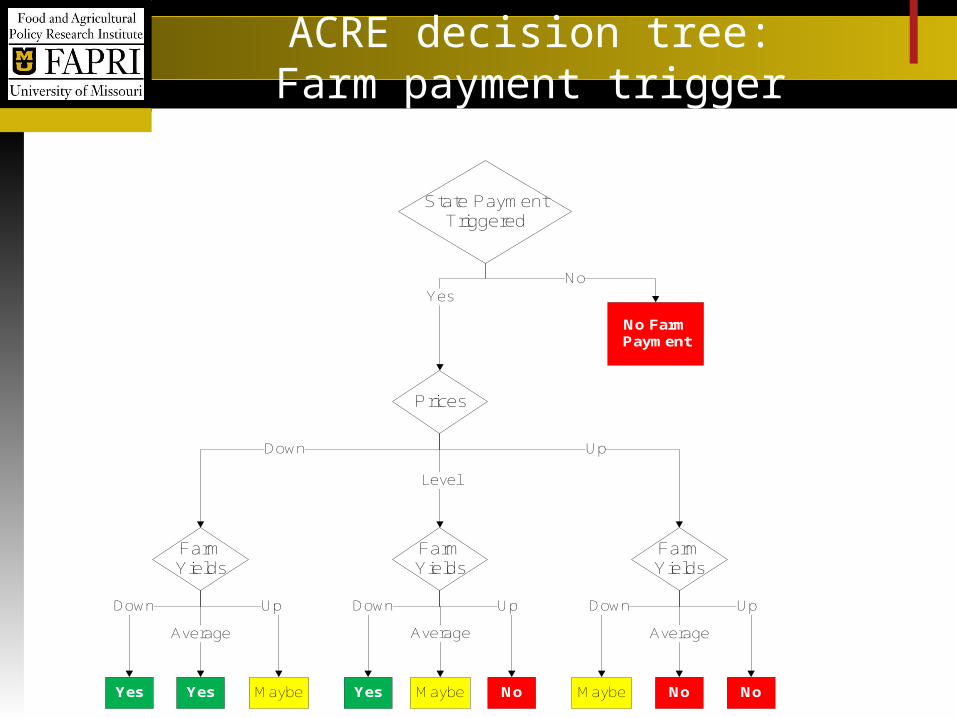
ACRE decision tree:Farm payment trigger
Prices
Farm Yields
Level
Farm Yields
Down
FarmYields
Up
No MaybeYes Maybe NoNo
Average Average
Yes Yes Maybe
Up
Average
Down UpDown UpDown
State Payment Triggered
Yes
No Farm Payment
No
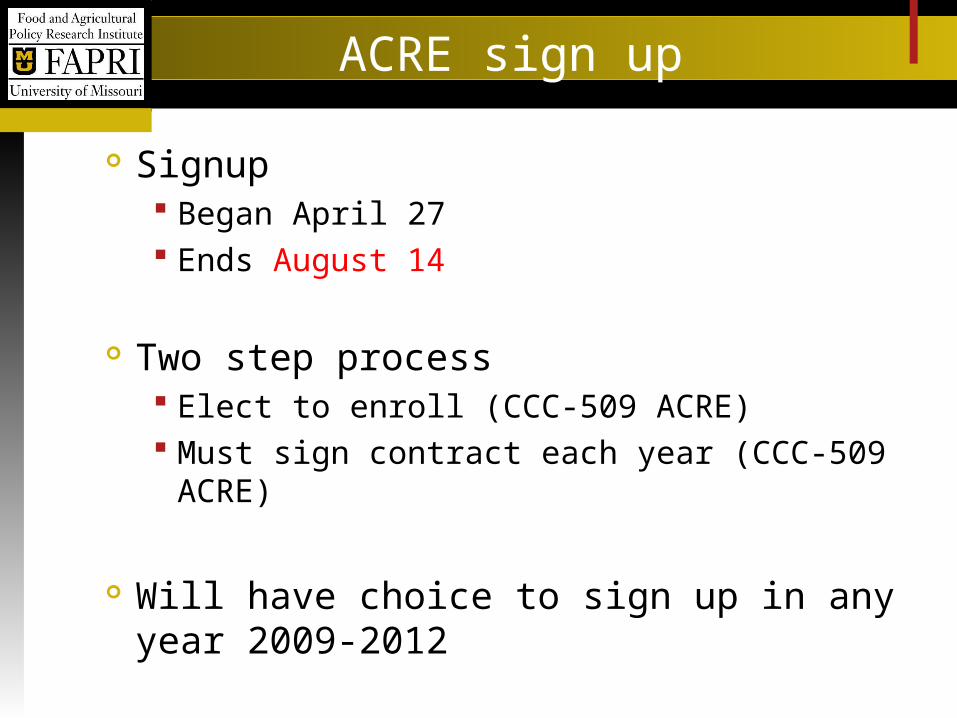
ACRE sign up
Signup Began April 27 Ends August 14
Two step process Elect to enroll (CCC-509 ACRE) Must sign contract each year (CCC-509 ACRE)
Will have choice to sign up in any year 2009-2012
ACRE sign up
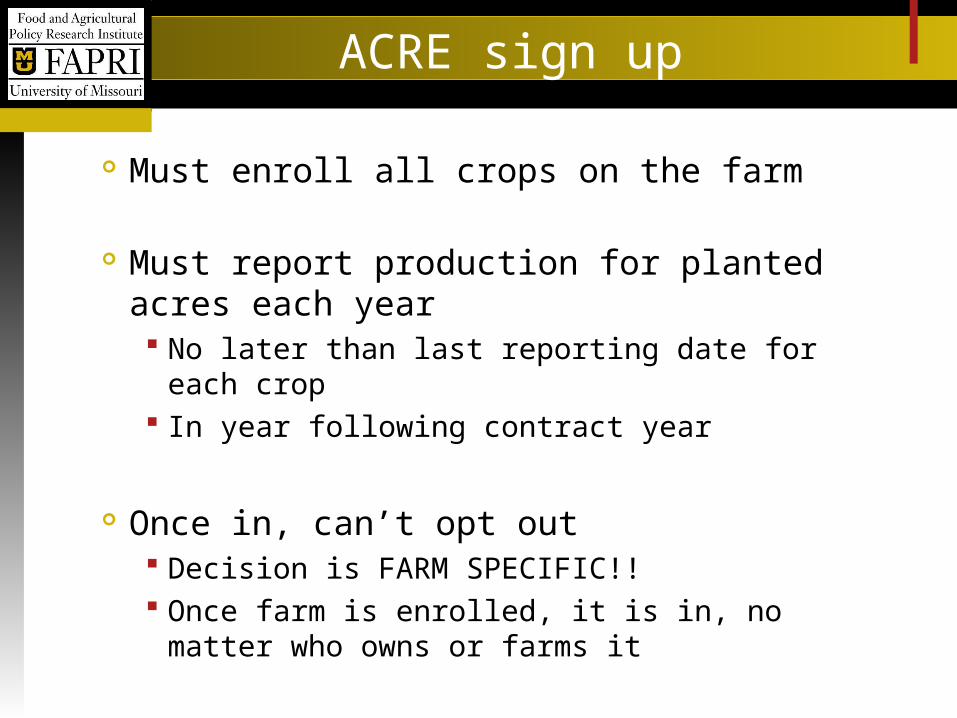
Must enroll all crops on the farm
Must report production for planted acres each year No later than last reporting date for each crop In year following contract year
Once in, can’t opt out Decision is FARM SPECIFIC!! Once farm is enrolled, it is in, no matter who owns
or farms it
What type of farms benefit?
Must be determined farm-by-farm
One key is how your farm yields correlate with state yields Do they move in sync?
However, we can look at averages from FAPRI simulations for some clues . . .
WA
OR
CA
NV
ID
MT
WY
UT
AZ
ND
SD
NE
KSCO
NM
TX
OK*
MN
IA
MO
AR*
LAMS
AL
GA
WI
IL IN
OHPA
KY
TN NC
SC
FL
VA
ME
NYMI
NH
MA
CTRI
NJ MDDE
WV
VT
DC
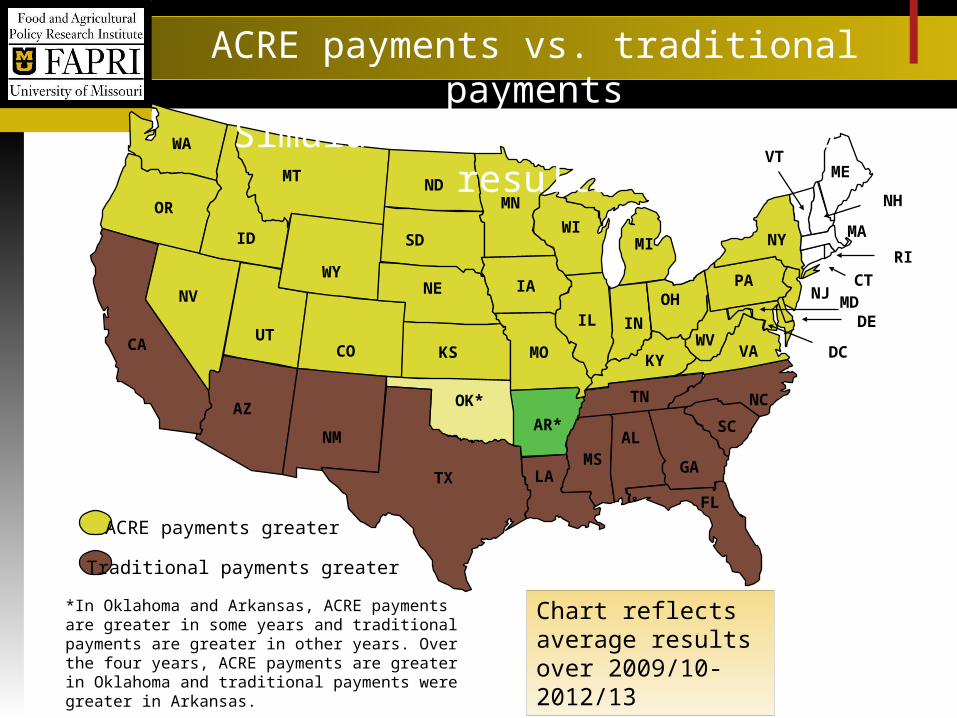
Traditional payments greater
ACRE payments greater
ACRE payments vs. traditional paymentsSimulation of state average results
Chart reflects average results over 2009/10-2012/13
*In Oklahoma and Arkansas, ACRE payments are greater in some years and traditional payments are greater in other years. Over the four years, ACRE payments are greater in Oklahoma and traditional payments were greater in Arkansas.
Missouri simulation results
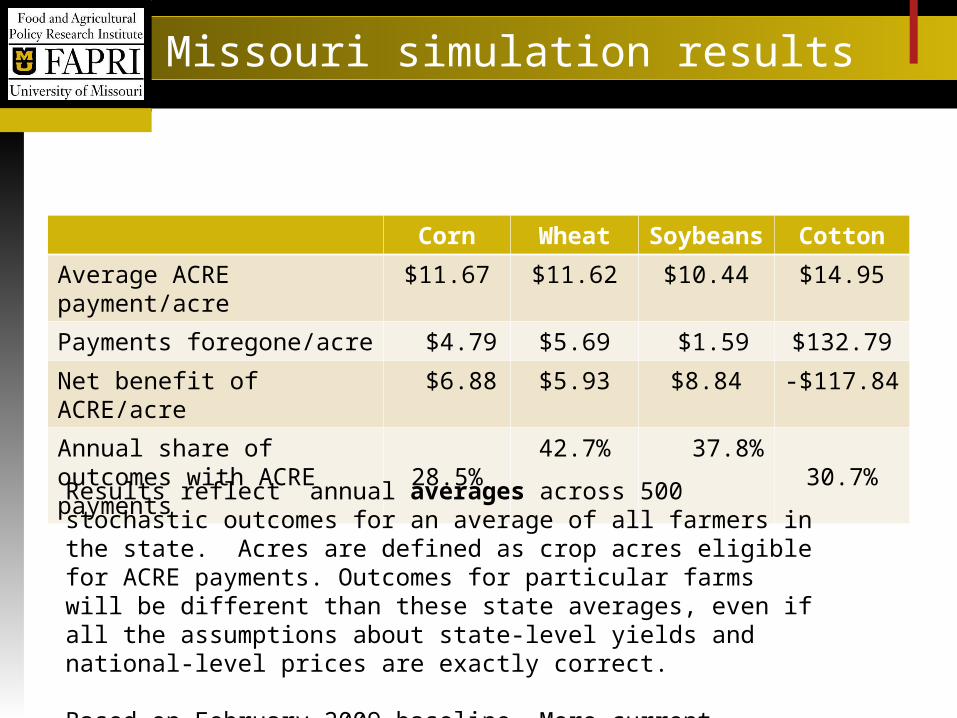
Corn Wheat Soybeans Cotton
Average ACRE payment/acre $11.67 $11.62 $10.44 $14.95
Payments foregone/acre $4.79 $5.69 $1.59 $132.79
Net benefit of ACRE/acre $6.88 $5.93 $8.84 -$117.84
Annual share of outcomes with ACRE payments
28.5% 42.7% 37.8% 30.7%
Results reflect annual averages across 500 stochastic outcomes for an average of all farmers in the state. Acres are defined as crop acres eligible for ACRE payments. Outcomes for particular farms will be different than these state averages, even if all the assumptions about state-level yields and national-level prices are exactly correct.
Based on February 2009 baseline. More current information would yield different estimates.

FAPRI ACRE Risk Management Tool:The FARM Tool
Compare staying in the CCP program or enrolling in the ACRE program
Excel spreadsheet (Version 2003 or newer)
Available for download from the FAPRI web site http://www.fapri.missouri.edu

Sample farm
242.9 base acres 124.5 ac corn 118.4 ac soybeans
230 acres planted acres 125 ac corn 105 ac soybeans
Payment acres for ACRE program = 191.6 230 * .833

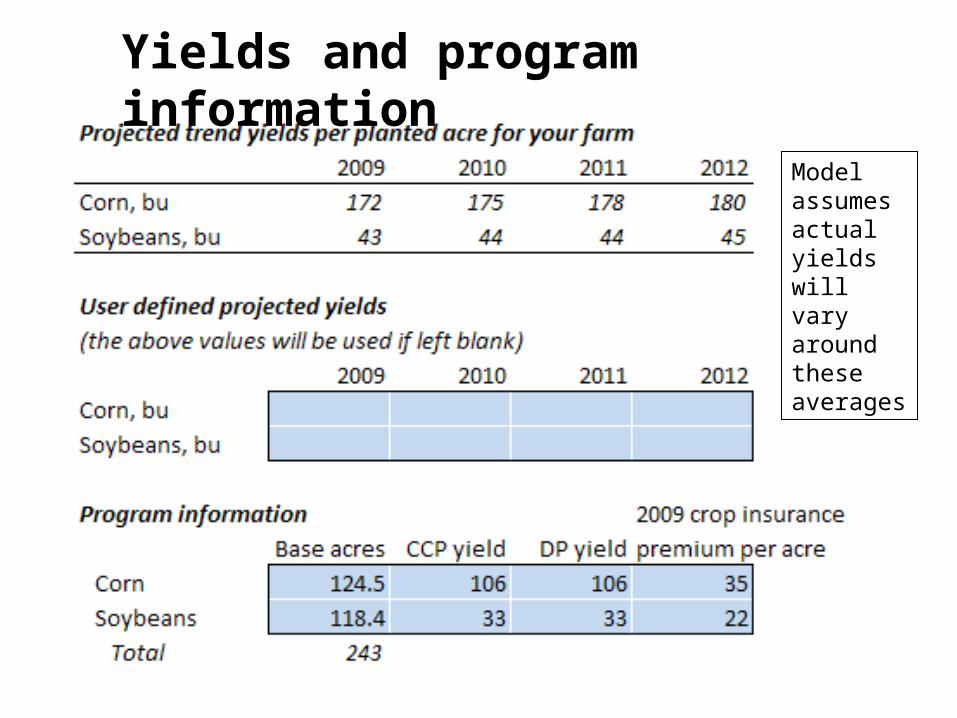
Yields and program information
Model assumes actual yields will vary around these averages

Base Acres = 243
Planted and payment acres

Try different price paths to see what impact it has on payments!
Average price assumptions
The model assumes a distribution around these average prices
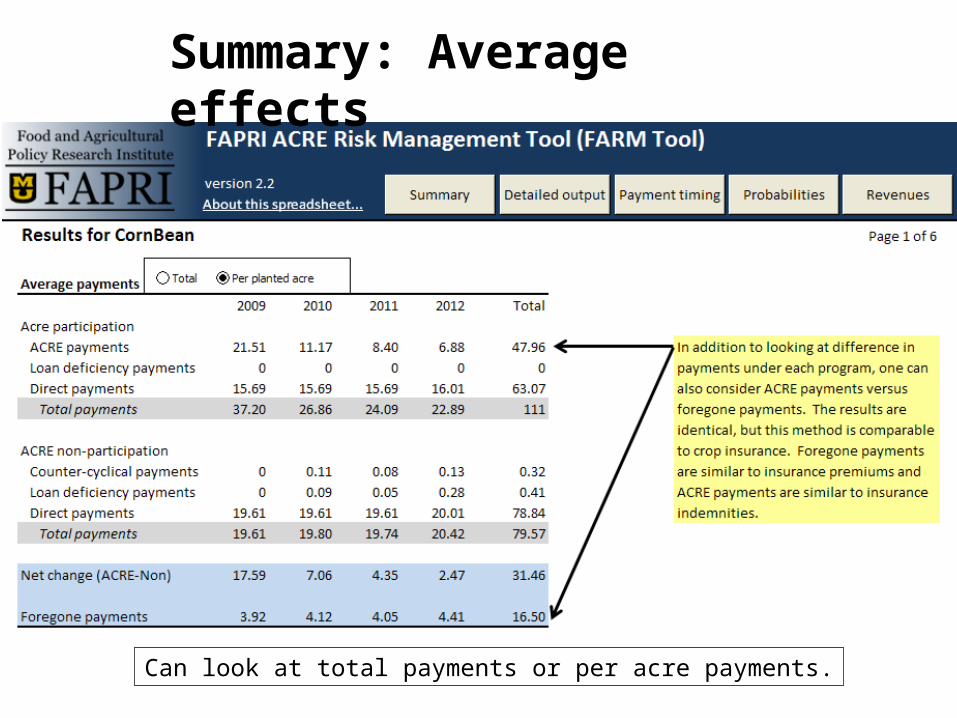
Can look at total payments or per acre payments.
Summary: Average effects

Summary: Probabilities

Detail by crop
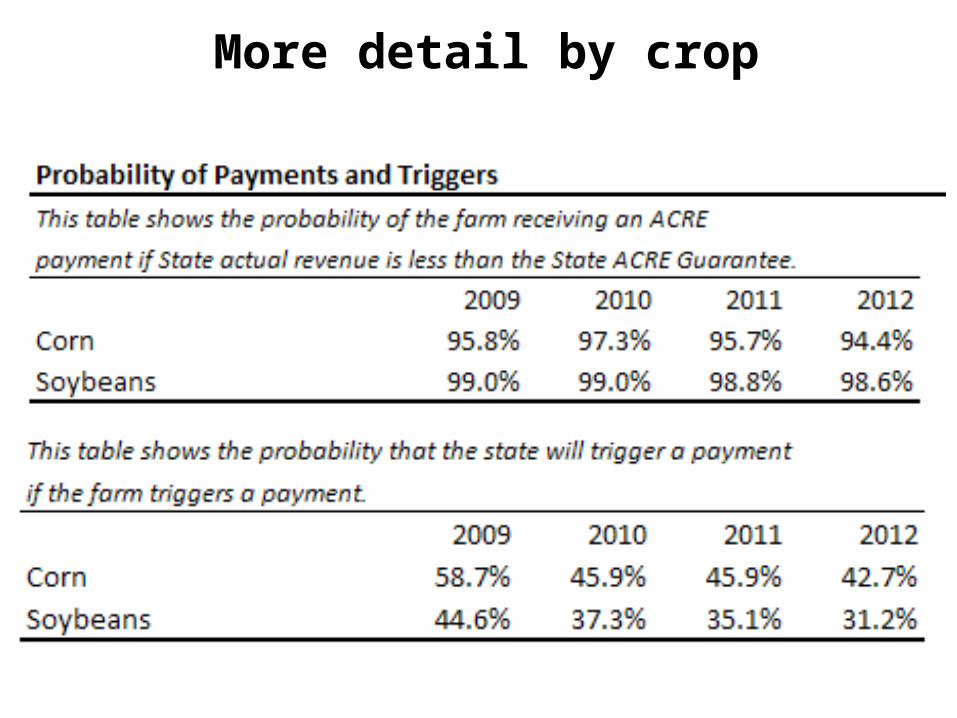
More detail by crop

What if prices are much lower?
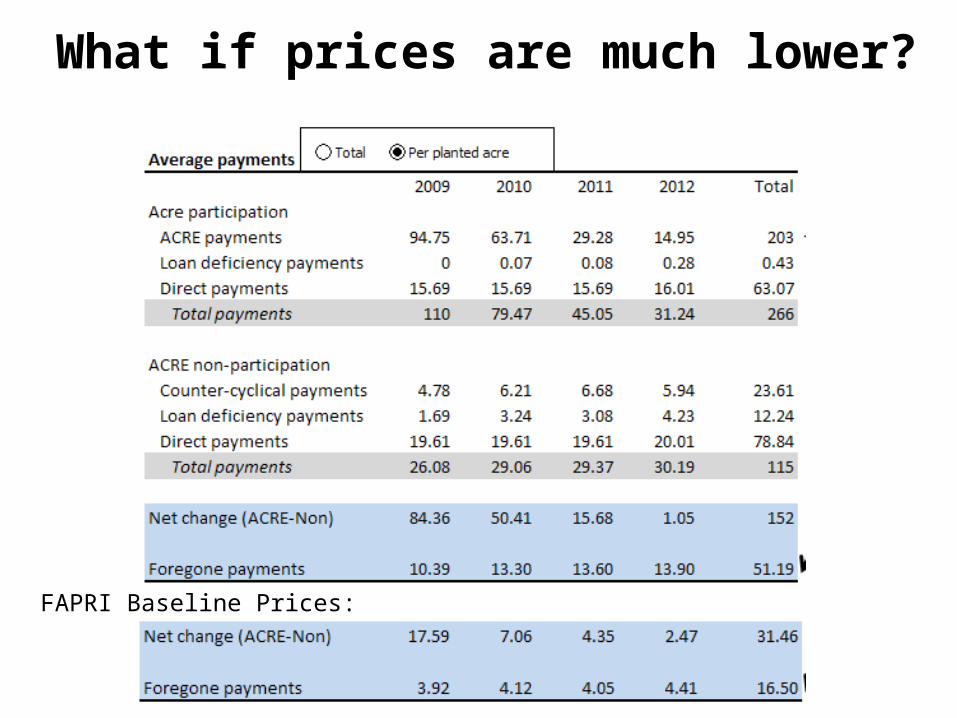
FAPRI Baseline Prices:
What if prices are much lower?

FARM Tool
Currently available for download http://www.fapri.missouri.edu
Educational effort underway Contact Peter Zimmel if you are interested:
Email: [email protected] Office: 573-884-8787 Cell: 573-529-9010
Related Documents