Pankaj Sharma SUBMITTED IN ACCORDANCE WITH THE REQUIREMENTS FOR THE PH.D. IN BIOCHEMISTRY DEGREE IN THE FACULTY OF NATURAL AND AGRICULTURAL SCIENCES, DEPARTMENT OF BIOTECHNOLOGY AT THE UNIVERSITY OF THE FREE STATE February 2015 Prof. Hugh-George Patterton The role of post translational modifications in the regulation of binding of linker histone Hho1 to chromatin in Saccharomyces cerevisiae

Welcome message from author
This document is posted to help you gain knowledge. Please leave a comment to let me know what you think about it! Share it to your friends and learn new things together.
Transcript
Pankaj Sharma
SUBMITTED IN ACCORDANCE WITH THE REQUIREMENTS FOR THE
PH.D. IN BIOCHEMISTRY DEGREE IN
THE FACULTY OF NATURAL AND AGRICULTURAL SCIENCES,
DEPARTMENT OF BIOTECHNOLOGY AT THE UNIVERSITY OF THE FREE STATE
February 2015
Prof. Hugh-George Patterton
The role of post translational modifications in
the regulation of binding of linker histone Hho1
to chromatin in Saccharomyces cerevisiae
ii
Contents
Contents i
List of Figures vii
List of Tables ix
Abstract 1
1 General Introduction 1
1.1 Chromatin 1
1.1.1 Chromatin and its Epigenetic Regulation 1
1.1.2 Chromatin Structure 3
1.1.3 Linker histone 7
1.1.3.1 Linker histone positioning and interactions 7
1.1.3.2 Evolution of linker histone sequence and structure 9
1.2 Euchromatin and heterochromatin 13
1.2.1 Yeast as a model organism to study chromatin compaction 14
1.2.2 Mechanism of heterochromatin formation in yeast 15
1.2.3 Chromatin territories and boundary elements 18
1.2.4 Nucleosome positioning 19
1.2.5 DNA supercoiling 22
1.2.6 Linker histone and chromatin compaction 23
1.2.6.1 Canonical linker histone in chromatin compaction 23
1.2.6.2 Hho1p in chromatin compaction 24
1.2.7 Chromatin remodeling 26
1.2.7.1 Chromatin remodelers 27
1.2.7.2 Histone Chaperones 29
1.3 Other factors regulating chromatin compaction 30
1.3.1 Histone variants 30
1.3.1.1 Core histone Variants 31
iii
1.3.1.2 Linker Histone Variants 32
1.3.2 NRL and H1 stoichiometry 35
1.3.3 Mobility and binding partners of linker histones 37
1.3.4 Post-translational modifications of histones 39
1.3.4.1 Linker histone modifications 43
1.3.4.1.1 Phosphorylation 43
1.3.4.1.2 Other linker histone modifications 46
1.3.4.2 Post-translational modifications of core histones 47
1.3.4.3 Cross-talk between PTMs 48
1.4 The evolution of chromatin research 50
1.4.1 Methods in chromatin biology 50
1.4.2 A case for reductionist approach in an era of systems biology 52
1.4.2.1 Affinity coupled MS, the gold standard for protein characterization 53
1.4.3 Linker histone purification 55
1.5 Thesis objective 56
2 Purification and Characterization of rHho1p 58
2.1 Introduction and Objectives 58
2.2 Materials and Methods 58
2.2.1 Bacterial Strains and Media 58
2.2.2 Expression vector construction 59
2.2.3 Expression optimization and purification of recombinant Hho1p 60
2.2.4 Protein quantitation 62
2.2.5 SDS-PAGE analysis 63
2.2.5.1 Coomassie staining 63
2.2.5.2 Silver Staining 63
2.2.5.3 Image acquisition and processing 64
2.2.6 Mass spectrometric analysis 64
2.2.6.1 Protease digestion 64
iv
2.2.6.1.1 In-solution digestion 64
2.2.6.1.2 In-gel digestion 65
2.2.6.1.3 Stage tip purification 65
2.2.6.2 MALDI-TOF analysis 65
2.2.6.3 LC-ESI-MS/MS analysis 66
2.2.7 Hho1 retrieval 67
2.2.7.1 Precipitation of rHho1p 67
2.2.7.2 Acid solubility of rHho1 67
2.2.8 Western blotting analysis 68
2.2.9 RP-HPLC analysis 69
2.2.10 Cross-linking analysis 69
2.3 Results and Discussion 70
2.3.1 Sub-cloning and purification of Hho1p 70
2.3.2 Biochemical characterization of Hho1p 74
2.3.2.1 Solubility in precipitating agents: ammonium sulphate, polyethylene
glycol, trichloroacetic acid and acetone 76
2.3.2.2 Acid stability of rHho1p 77
2.3.2.3 Western blot analysis 78
2.3.2.4 Acid extractability of native Hho1p 78
2.3.2.5 RP-HPLC analysis of rHho1p 80
2.3.2.6 Cross-linking analysis of rHho1p 82
3 Generation, Purification and Characterization of αHho1p Antibody 84
3.1 Introduction and Objectives 84
3.2 Materials and Methods 86
3.2.1 Generation of αHho1 peptide antibody 86
3.2.2 Generation of αHho1 protein antibody 86
3.2.3 ELISA 88
3.2.4 Generation of monospecific αHho1p antibody by affinity chromatography 89
3.2.4.1 Crude antiserum purification on Protein A Sepharose 89
3.2.4.2 Generation of Affi®-gel-10 coupled rHho1p column 89
3.2.4.3 Generation of CNBr-activated Sepharose coupled rHho1p column 90

v
3.2.5 Coupling of αHho1p antibody to Dyna beads for rHho1p binding analysis 90
3.3 Results and Discussion 91
3.3.1 ELISA 91
3.3.2 Optimization of transfer of yeast histones for Western blotting 91
3.3.3 Optimization of semi-quantitative Western blotting 94
3.3.4 Preparation of a chromatographic matrix for the immune-purification of
the αHho1p antibody 95
3.3.5 Affinity purification of αHho1p antibody on an Affi®-gel-10 coupled
rHho1p column 95
3.3.6 Affinity purification of αHho1p antibody on Protein A column 95
3.3.7 Affinity purification of αHho1p antibody on a CNBr-activated Sepharose
coupled rHho1p column 98
3.3.8 Preparation of αHho1p antibody matrix for the purification of Hho1p 100
4 Purification and Characterization of Native Hho1p 101
4.1 Introduction and Objectives 101
4.2 Workflow choice 101
4.2.1 Hho1p extraction and analysis from whole cells or purified nuclei 102
4.2.2 Platforms for affinity purification and interaction analysis 104
4.2.3 Reverse phase (RP)-HPLC fractionation of histones 106
4.2.4 A primer on Mass Spectrometry 109
4.2.4.1 MS as a tool for detection and quantitation 109
4.2.4.2 MS instrumentation 109
4.2.4.3 MS fragmentation and workflow design 112
4.2.4.4 MS data analysis 113
4.2.4.5 Bottom-up histone LC-MS/MS analysis 114
4.3 Materials and Methods 116
4.3.1 Yeast strains and growth medium 116
4.3.2 Cell counting 117
4.3.3 DAPI Staining and Microscopy 117
4.3.4 Preparation of yeast protein extracts by mechanochemical lysis 118
4.3.5 Preparation of yeast nuclear extracts by mechanochemical lysis 118
4.3.6 Preparation of yeast nuclear extracts by enzymatic lysis 119

vi
4.3.6.1 Nuclei preparation by standard method 119
4.3.6.2 Nuclei preparation by high speed centrifugation 120
4.3.6.3 Nuclei preparation by slow speed centrifugation 121
4.3.6.4 Rapid nuclei preparation by dry ice homogenization 121
4.3.7 Acid extraction of histones 121
4.3.7.1 By resuspension 121
4.3.7.2 By freeze-thaw treatment 122
4.3.8 RP-HPLC and MS analysis 122
4.3.9 Analysis of effect of salt concentration on Hho1p eviction from chromatin 123
4.3.10 Affinity purication of native Hho1p 123
4.4 Results and Discussion 125
4.4.1 Assessment of protocol efficiency for the extraction of Hho1p 125
4.4.1.1 Mechanochemical yeast cell lysis 125
4.4.1.2 Pressure mediated nuclei isolation 126
4.4.1.3 Enzymatic yeast cell wall lysis for nuclei isolation 128
4.4.1.4 Reverse phase purification of SNAE 129
4.4.1.5 Western and MS identification of Hho1p in SNAE 131
4.4.1.6 Analysis of Hho1p extraction by rapid nuclei isolation method 134
4.4.2 Affinity purification of native Hho1p 139
4.4.2.1 Effect of salt concentration on Hho1p extraction 139
4.4.2.2 Column preparation and affinity capture 141
4.4.3 Biochemical analysis of Hho1p 142
4.4.3.1 Modification status of Hho1p during exponential and stationary phase 142
4.4.3.2 Sequence, topology, and interactions of Hho1p 144
Concluding remarks 138
Future aspects 153
Appendices 155
Bibliography 165
vii
List of Figures
Figure .............................................. Page
Figure 1.1. Epigenetic mechanisms. ......................................................................................... 2
Figure 1.2. Crystal structure of the nucleosome core particle (PDB 1KX 5). ............................ 4
Figure 1.3. Electron micrographs of chromatin. ....................................................................... 5
Figure 1.4. Tetranucleosome structure. ................................................................................... 6
Figure 1.5. Structural model of the GH1-nucleosome complex in surface representation. ... 8
Figure 1.6. Histone H5 Globular Domain ................................................................................ 10
Figure 1.7. Linker histone sequence alignment ...................................................................... 12
Figure 1.8. Genome compartmentalization ............................................................................ 13
Figure 1.9. Various phases of yeast cell growth ..................................................................... 15
Figure 1.10. Silencing depends on homodimerization capacity and interactions
between SIR proteins and nucleosomes .............................................................. 17
Figure 1.11. Nucleosome sequence preferences ................................................................... 20
Figure 1.12. Nucleosome positioning in the archetypical yeast gene .................................... 21
Figure 1.13. Remodeler families defined by their ATPase...................................................... 27
Figure 1.14. Core histone variants. ......................................................................................... 31
Figure 1.15. Evolutionary tree showing number of H1 variants in various species. .............. 33
Figure 1.16. Overview of multiple functions of H1 ................................................................. 34
Figure 1.17. NRL versus H1: nucleosome per nucleosome ratio ............................................ 36
Figure 1.18. An illustration of the acetylation state of the NTD of core histones .................. 41
Figure 1.19. Readers of histone PTMs .................................................................................... 42
Figure 1.20. Core histone modifications in yeast. .................................................................. 47
Figure 1.21. Cross-talk between histone post-translational modification ............................. 48
Figure 1.22. A brief time line of chromatin research .............................................................. 51
Figure 1.23. An overview of methodology ............................................................................. 57
Figure 2.1. Construction of pET28b(+)-HHO1 expression vector ........................................... 70
Figure 2.2. Recombinant Hho1p purified to homogeneity by a single IMAC step ................. 72
Figure 2.3. MALDI-TOF spectra of rHho1p .............................................................................. 73
Figure 2.4. Mass spectrometric identification of Hho1p by ESI-MS/MS ................................ 74
Figure 2.5. Relative rHho1p recovery by different precipitating agents ................................ 76
Figure 2.6. Recombinant Hho1p is poorly stable and / or extractable from perchloric
and phosphoric acid as compared to hydrochloric and sulphuric acid ............... 77
Figure 2.7. Western to validate the specificity of αHho1p Antibody
recognized probable self-association of rHho1 ................................................... 78
Figure 2.8. Native Hho1p is poorly stable in and/ or extractable from perchloric acid
as compared to hydrochloric and sulphuric acid ................................................. 79
viii
Figure 2.9. rHho1p elutes as a partial higher molecular weight band from RP-HPLC .......... 81
Figure 2.10. Cross-linking analysis or rHho1p does not provide conclusive results ............... 83
Figure 3.1. ELISA analysis of Antibody titer ............................................................................ 92
Figure 3.2. Optimization of electro-transfer of yeast histones for Western blotting ............ 93
Figure 3.3. Optimization of semi-quantitative Western blotting ........................................... 94
Figure 3.4. Elution profile of αHho1p Ab from the antigen affinity matrix ............................ 96
Figure 3.5. Purification of IgG on Protein A Sepharose .......................................................... 97
Figure 3.6. Affinity purification of Antibody monospecific to Hho1p .................................... 98
Figure 3.7. Scale up of the affinity purification of Antibody monospecific to Hho1p ............ 99
Figure 3.8. Retention / elution of rHho1p from a Dyna bead coupled αHho1p Ab matrix. . 100
Figure 4.1. Schematic diagram showing cross-linking of Antibody to protein A beads. ...... 106
Figure 4.2. Electrospray ionization process. ......................................................................... 110
Figure 4.3. Relative efficiency of yeast protein extraction by mechanochemical lysis ........ 126
Figure 4.4. Optimization of release of yeast nuclei by French press lysis ............................ 127
Figure 4.5. Detection of native Hho1p in yeast nuclear extract ........................................... 128
Figure 4.6. Comparison of yeast histone fractionation on Jupiter, Dionex and Vydac
RP-HPLC columns ............................................................................................... 130
Figure 4.7. Native Hho1p is recognized in total histones extracted by
standard nuclear isolation followed by acid solubilization ............................... 131
Figure 4.8. Identification of native Hho1p in EP SNAE ......................................................... 132
Figure 4.9. Native Hho1p degrades within 24 h of storage at -20 °C .................................... 134
Figure 4.10. Rapid histone isolation protocol produced clean yeast histone preparation .. 135
Figure 4.11. Band moving just below rHho1p was weakly detected by αHho1p Antibody . 135
Figure 4.12. Separation of acid extract of nuclei prepared by rapid method
on a Jupiter column ............................................................................................ 136
Figure 4.13. Identification of yeast core histones in acid extract of nuclei
prepared by rapid method ................................................................................. 137
Figure 4.14. Band moving just below rHho1p in nuclear extract is not Hho1p .................... 138
Figure 4.15. PCR confirmation of HHO1 deletion mutant. ................................................... 138
Figure 4.16. Buffer salt concentration has minimal effect on native Hho1p extraction ...... 140
Figure 4.17. Elution profile of native Hho1p isolated from exponential growth
on Affigel-10 coupled monospecific αHho1p Antibody. .................................... 141
Figure 4.18. Elution profile of native Hho1p......................................................................... 142
Figure 4.19. Hho1p peptides identified with high confidence in various LC-MS/MS runs. .. 143
Figure 4.20. Prediction of disordered regions in Hho1p sequence by GlobPlot2.0. ............ 145
Figure 4.21. Chromosome dynamics during the cell cycle.. ................................................. 146
Figure 4.22. NetPhos prediction of phosphorylation potential of Hho1p. ........................... 148
Figure 4.23. Post-translational modification sites identified in the sequence of Hho1p. .... 149

ix
List of Tables
Table Page
Table 1.1. Specific H1-protein interactions. ........................................................................... 40
Table 1.2. Histone H1 post-translational modifications identified by mass spectrometry .... 44
Table 2.1. Primers used to construct pET28b(+)-Hho1p clone. .............................................. 59
Table 2.2. Table showing the individual score and expect (E) values of rHho1p peptides .... 75
Table 4.1. Various protocols tested for mechanochemical yeast cell lysis .......................... 119
Table 4.2. Specifications of C18-RP columns used for histone analysis ............................... 122
Table 4.3. Standard IDA criteria for ESI-MS/MS fragmentation ........................................... 123
Table 4.4. The individual score and expect values of the singly, doubly and triply
charged native Hho1p peptides identified. ....................................................... 133
x
Statement
I declare that the thesis hereby handed in for the qualification PhD in Biochemistry at the
University of the Free State, is my own independent work and that I have not previously
submitted the same work for a qualification at / in another University / faculty.
I hereby concede the copyright to the University of the Free State.
Pankaj Sharma
Epigenetics and DNA Function Laboratory
Biotechnology
University of the Free State
Bloemfontein, Free State
South Africa, 9301

xi
Acknowledgments
In the words of Masayo Takahashi, ‘so many people, it would be like credits rolling at the
end of a movie’.
First and foremost, I express my sincere gratitude to Professor Hugh-George
Patterton for his amicable guidance and support. Thank you for keeping your door open at
all times.
It was the unflinching support from family and friends that made this journey a
joyous one. I fondly remember the time spent in the company of current and former
coworkers, including Shannon, Mzwanele, Elize, Gabŕe, Christiaan, Rahul, Krishnapal,
Balveer and Yograj. Thank you for sharing your invaluable time, advice and expertise with
me.
A special word of thanks to the laboratories at the Department of Biotechnology,
Botany, Chemistry, Hematology, and the Center for Microscopy for extending your friendly
assistance, as and when required.
I gratefully acknowledge the services rendered by the support staff at the University
of Free State, including people from Analytical facility, Animal facility, Finances, Information
technology, Instrumentation, Electronics, Housing and residence affairs, Student affairs, and
the International office. I am indebted to your kindness and practical approach to work.
I would also like to acknowledge my previous supervisors, Professor Bijender Kumar
Bajaj and Professor Namita Surolia who made me a part of their scientific endeavor and
allowed me to learn-by-doing.
I am grateful to everyone who gave me an opportunity to know and share
professional and personal time with them. I would not have made it without you. Lastly, I
would like to thank the Cluster for Advanced Biomolecular Research for financial support.
xii
Abbreviations
AB - Ammonium bicarbonate
ACN - Acetonitrile
Asf1 - Anti-silencing function 1
BSA - Bovine serum albumin
CAD - Collision activated ………… dissociation
CAF-1 - Chromatin assembly factor 1
CBB - Coomassie brilliant blue
cdc - Cell division cyclin
CDK - Cyclin dependent kinase
CEH - Chicken erythrocyte histone extract
CID - Collision induced dissociation
CNBr - Cyanogen bromide
CTD - C-terminal domain
CTH TIIIS - Calf thymus histones Type IIIS
CUR - Curtain gas
CV - Column volume
DAPI - 4’,6-Diamidine-2’-phenylindole dihydrochloride
DMA - Dimethyl adipimidate
Dot1 - Disruptor of telomeric ……………………. silencing
DSB - Double strand break
DTT - Dithiothreitol
ECD - Electron capture dissociation
EDTA - Ethylene diamine tetra acetic acid
ELISA - Enzyme-linked immunosorbant assay
ETD - Electron transfer dissociation
eNP - Egg nucleoplasmin
FA - Formic acid
FCA - Freund’s complete adjuvant
FIA - Freund’s incomplete adjuvant
Fob1p - Fork blocking less 1 protein
FPLC - Fast pressure liquid chromatography
FT-ICR - Fourier transform-ion cyclotron resonance
GTA - Glutaraldehyde
GI - Globular domain I
GII - Globular domain II
HCCA - 4-hydroxy-α-cyano-cinammic acid
HDM - Histone demethyases
HILIC - Hydrophilic interaction chromatography
HMT - Histone methyl transferase
IAA - Iodoacetamide
ID - Internal diameter
IDA - Information dependent acquisition
IHT - Interface heating temperature
IMAC - Immobilized metal affinity chromatography
INO80 - Inositol-requiring protein 80
IPTG - Isopropyl β-D-1-thiogalactopyranoside

xiii
kDa - Kilodalton
LIT - Linear ion-trap
LOD - Limit of detection
LTQ - Linear triple quadrupole
MgCl2 - Magnesium chloride
m/z - Mass upon charge ratio
MALDI - Matrix assisted laser desorption ionization
MRM - Multiple reaction monitoring
MS/MS - Tandem mass spectrometry
MyoD - Myogenic differentiation
Nap1 - Nucleosome assembly ……..protein 1
NCP - Nucleosome core particle
NDR - Nucleosome depleted region
Net1 - Nucleolar silencing ……..establishing factor and ……..telophase regulator 1
NIB - Nuclei isolation buffer
NRL - Nucleosome repeat length
NTD - N- terminal domain
ORC - Origin recognition complex
PAGE - Polyacrylamide gel electrophoresis
PCR - Polymerase chain reaction
PMSF - Phenyl methane sulfonyl fluoride
PTM - Post-translational modification
Q - Quadrupole
RCF - Relative centrifugal force
RENT - Regulator of nucleolar silencing and telophase exit
RFB - Replication fork barrier binding protein
RISC - RNA induced silencing complex
RNAE - Rapid nuclear acid extract
RP-HPLC - Reverse phase high pressure liquid chromatography
RPM - Revolutions per minute
RT - Room temperature
Rtt106 - Regulator of Ty1 ….…… …… transposition
SAGA - Spt-Ada-Gcn5 ……………………. ……..acetyltransferase
Sas2 - Something about silencing 2
SDS - Sodium dodecyl sulphate
SNAE - Standard nuclear acid …… extract
sNASP - Somatic nuclear auto- ……………………. antigenic sperm protein
SPB - Spindle pole body
TCA - Trichloro acetic acid
TFA - Trifluoro acetic acid
1
Abstract
The eukaryotic genome is functionally organized into a highly ordered nucleoprotein
structure, chromatin. Apart from the four nucleosomal core histones, the linker histone is
pivotal to fluidity and compaction of chromatin. Yeast, a single cell eukaryote, has a short
nucleosomal repeat length, and possesses a structurally unique H1. This thesis is an attempt
to study the influence of post translational modifications in regulating the interactions of
yeast linker histone with chromatin. Chapter 1 gives a broad overview of available literature.
Chapter 2 presents the results from cloning, expression, purification and partial
characterization of Hho1p. The physiochemical characteristics of recombinant protein were
studied with a view to perform subsequent purification of native Hho1p from yeast strains.
The solubility and precipitation of rHho1p were explored under several conditions. Unlike
canonical linker histone, Hho1p was found to be insoluble in Perchloric acid. Chapter 3
comprises generation and characterization of polyclonal antibody against Hho1p. Affinity
purified monospecific antibodies were used to optimize semi-quantitative Western blotting.
Preliminary results from Western blotting analysis suggest that Hho1p is capable of
oligomeric interactions. Chapter 4 presents results for optimization of conditions for Hho1p
extraction from yeast cells or nuclei. For nuclear extract preparation, a standard method
and its rapid variation, developed to limit Hho1p proteolysis, were used. The acid extraction
of Hho1p from nuclei followed by its purification by reverse phase chromatography
provided low yield for downstream analysis. However, sufficient quantities of native Hho1p
could be extracted from cell lysate using affinity matrices prepared with the monospecific
αHho1p antibodies generated in-house. Several novel post translational modification sites
and binding partners of Hho1p were identified from both logarithmic and stationary phase
of yeast cell growth, providing an insight into the stage specific regulation of Hho1p
chromatin binding.

CHAPTER 1
1
1 General Introduction
1.1 Chromatin
In prokaryotes, the genomic DNA (gDNA) is cytoplasmic. It is inter-wound as a plectonemic
nucleoid around factors like HU proteins and polyamines. However, the eukaryotic gDNA is
bound by a nuclear envelope. A typical eukaryotic cell contains about two meters of DNA
condensed to fit within a small nucleus (~10-20 μm diameter) by adopting a toroidal writhe
around a discrete histone scaffold. Based on its stainability with dyes (Gk. Khroma-colored),
this highly ordered protein-DNA ensemble that serves as the physiological template for all
DNA related transactions is called chromatin (1–3).
1.1.1 Chromatin and its Epigenetic Regulation
The scale of genomic DNA compaction requires multiple layers of kinetic, physical and
biochemical information to allow its dynamic expression, while maintaining its stable
inheritance (4, 5). As an ever increasing number of studies unravel this complexity, we
continue to understand how inheritance of features from the parent to offspring is not
solely encoded by the DNA sequence only (6–8). For example, cellular differentiation in
multicellular eukaryotes does not involve changes in primary DNA sequence. It is often
attributed to factors that modulate the chromatin structure in response to environmental
and developmental cues. Some of these factors include the spatio-temporally regulated
modifications of DNA and histones, histone variants, ATP dependent chromatin remodeling
enzymes and the differential expression and localization of transcription factors.
Chromatin is the putative carrier of epigenetic information. The term ‘Epigenetics’
was coined by Conrad Waddington in 1942 (9). It may loosely be defined as the study of
deposition and transmission of such chemical and structural modifications of chromatin that
bring the phenotype into being by altering gene expression and genome stability, without
changing the underlying DNA sequence (10). The epigenetic information considerably
extends the information potential of the genetic code (11). Some of the prominent
CHAPTER 1
2
epigenetic players that modulate the expression and stability of chromatin include the
methylation of DNA (12), different covalent modifications of histones (13, 14), histone
variants (15–17), the nuclear architecture (18, 19) and the non-coding RNAs (20, 21).
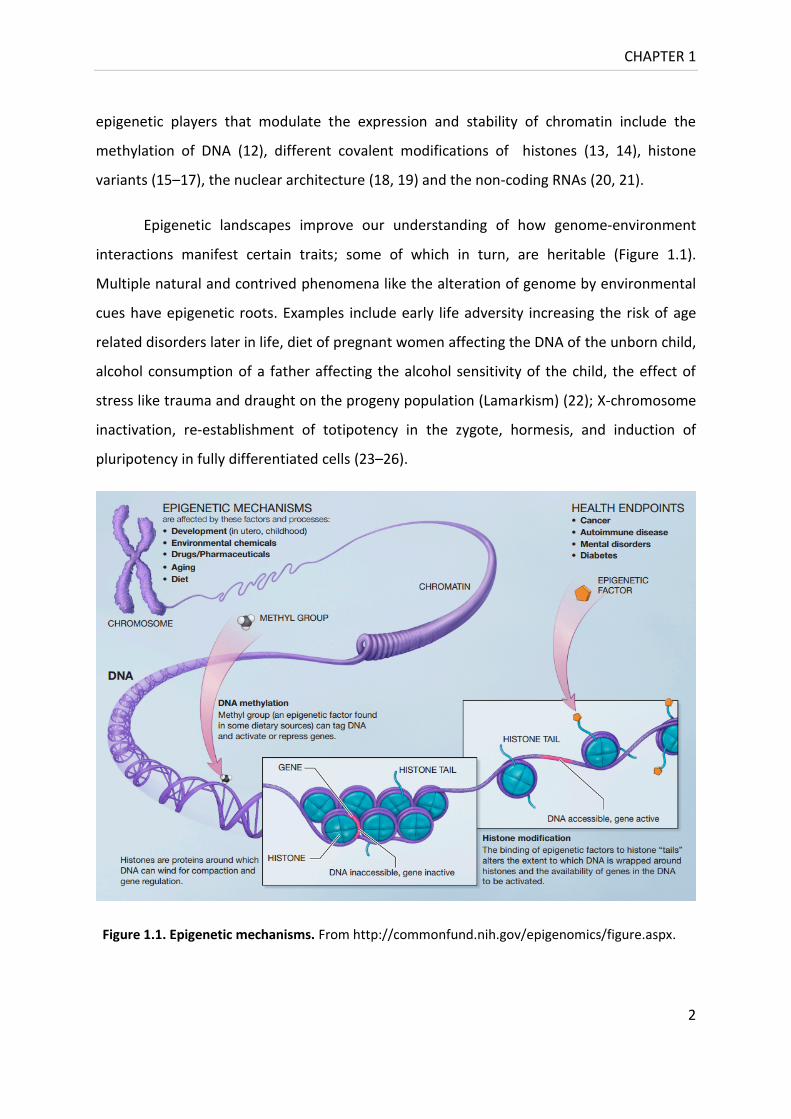
Epigenetic landscapes improve our understanding of how genome-environment
interactions manifest certain traits; some of which in turn, are heritable (Figure 1.1).
Multiple natural and contrived phenomena like the alteration of genome by environmental
cues have epigenetic roots. Examples include early life adversity increasing the risk of age
related disorders later in life, diet of pregnant women affecting the DNA of the unborn child,
alcohol consumption of a father affecting the alcohol sensitivity of the child, the effect of
stress like trauma and draught on the progeny population (Lamarkism) (22); X-chromosome
inactivation, re-establishment of totipotency in the zygote, hormesis, and induction of
pluripotency in fully differentiated cells (23–26).
Figure 1.1. Epigenetic mechanisms. From http://commonfund.nih.gov/epigenomics/figure.aspx.
CHAPTER 1
3
A number of aberrant chromatin associated epigenetic patterns have been
associated with disease conditions involving abnormal differentiation, premature aging and
cancer. Therefore, the pharmacological interventions to monitor and / or modulate the
progression of a particular state based on the stage specific epigenetic markers are being
actively sought (27, 28).
1.1.2 Chromatin Structure
The naked deoxyribonucleotide (DNA) template is a double stranded helix, 2 nm in
diameter. Each DNA strand consists of the four nitrogenous bases [adenine (A), thymine (T),
guanine (G) and cytosine (C)] linked by phosphodiester bonds. The nucleotides in the two
DNA strands are base paired to one another by hydrogen bonds in a complimentary (A=T,
G≡C) format. This anti-parallel, right handed wrap of the two strands leads to the formation
of alternate major and minor grooves (29).
Each of the four core histones (H2A, H2B, H3 and H4) contains a central globular
domain with an architecturally conserved histone fold motif, comprising helix1-strandA-
helix2-strandB-helix3 (30). This motif is used for hand-shake dimerization of H2A with H2B,
and H3 with H4, primarily via hydrophobic contacts (30, 31). The histone dimers further
associate via four helix bundle interfaces (32). The two H3/H4 dimers contact at the H3-H3
interface to form the (H4/H3)2 tetramer, which is stable in solution. Similarly, a H2A/H2B
dimer contacts either end of the (H4/H3)2 tetramer by a H4-H2B four helix bundle. The
histone octamer thus formed comprises the central (H3/H4)2 tetramer flanked by two
adjacent H2A/H2B dimers displaying a two-fold symmetry around a pseudo dyad axis
passing the H3-H3 four helix bundle dimerization interface (31, 33–35). The (H3/H4)2
tetramer assembly is the rate limiting step in the nucleosome assembly process, and is
regulated by the concerted action of chaperones and modifications on newly synthesized H3
and H4 (36). Also, the tetramer-dimer interactions at the H2B-H4 four helix bundle interface
lead to a cooperative nucleosome assembly. These interactions are weaker than those at
the H3-H3 interface, and require the presence of high salt (~2M) or DNA.
CHAPTER 1
4
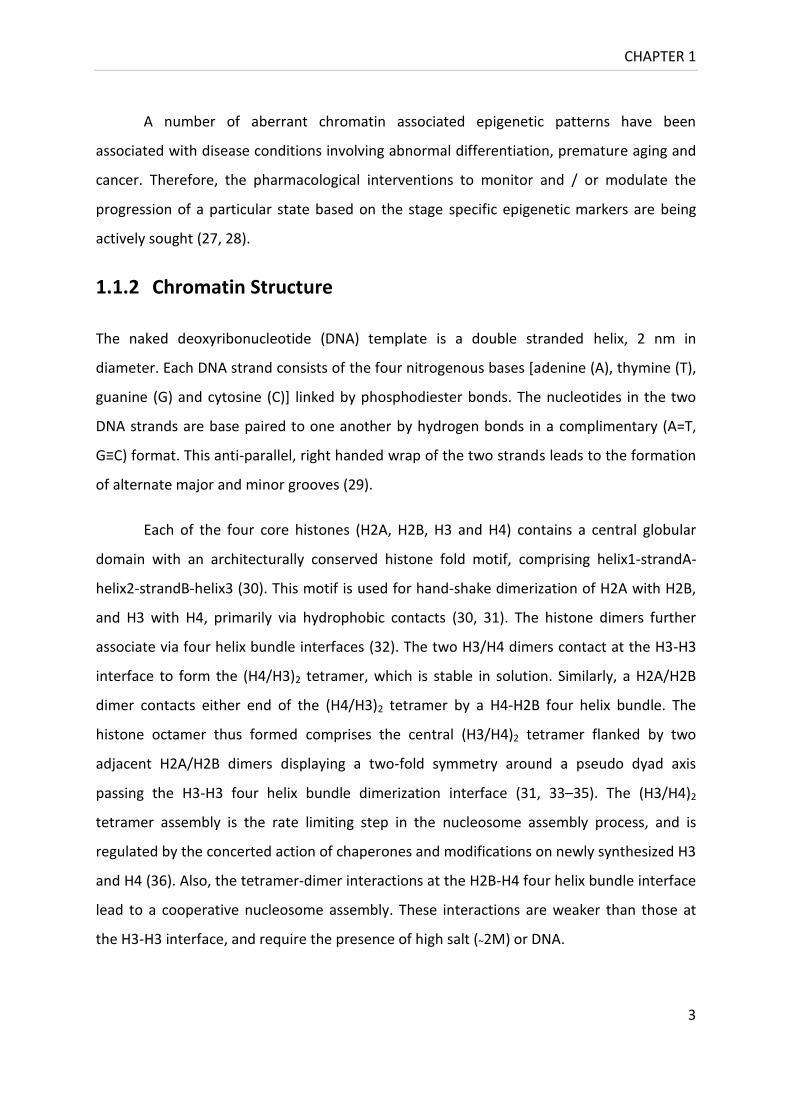
Between 145-147 bp of DNA wraps around the core histone octamer spool in about
1¾ left handed super-helical turns to form a nucleosome, regarded as the fundamental unit
of chromatin (4, 37–39). A crystal structure of the nucleosome core particle (NCP) solved to
atomic (1.9 Å) resolution (PDB 1KX5) provides DNA-histone and histone-histone contact
information (Figure 1.2) (38). The nucleosomes connected by linker segments give DNA its
~11nm ‘beads on a string appearance’, as seen when nuclei are lysed in very low ionic
strength (Figure 1.3) (40, 41). Recent evidence suggests that this is the primary form the
genome adopts in vivo.
Chromatin arrays observed in situ or assembled in vitro, either in presence of linker
histones or physiological salt conditions (such as 1-2 mM magnesium or 100-200 mM
Figure 1.2. Crystal structure of the nucleosome core particle (PDB 1KX 5). Front and side view with
H3, H4, H2A, H2B and DNA colored in salmon, bright orange, light blue, light green, and grey
respectively. The protruding N-terminal tails are shown in stick form. Adapted from (627).
CHAPTER 1
5
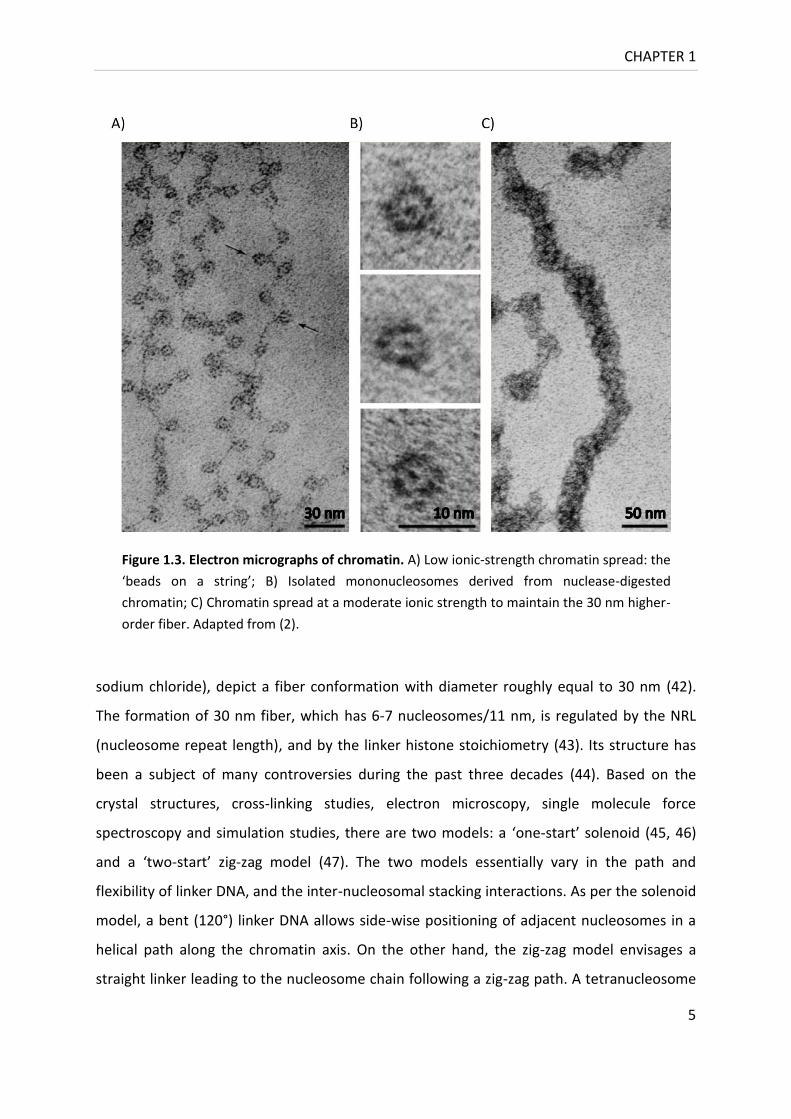
sodium chloride), depict a fiber conformation with diameter roughly equal to 30 nm (42).
The formation of 30 nm fiber, which has 6-7 nucleosomes/11 nm, is regulated by the NRL
(nucleosome repeat length), and by the linker histone stoichiometry (43). Its structure has
been a subject of many controversies during the past three decades (44). Based on the
crystal structures, cross-linking studies, electron microscopy, single molecule force
spectroscopy and simulation studies, there are two models: a ‘one-start’ solenoid (45, 46)
and a ‘two-start’ zig-zag model (47). The two models essentially vary in the path and
flexibility of linker DNA, and the inter-nucleosomal stacking interactions. As per the solenoid
model, a bent (120°) linker DNA allows side-wise positioning of adjacent nucleosomes in a
helical path along the chromatin axis. On the other hand, the zig-zag model envisages a
straight linker leading to the nucleosome chain following a zig-zag path. A tetranucleosome
Figure 1.3. Electron micrographs of chromatin. A) Low ionic-strength chromatin spread: the
‘beads on a string’; B) Isolated mononucleosomes derived from nuclease-digested
chromatin; C) Chromatin spread at a moderate ionic strength to maintain the 30 nm higher-
order fiber. Adapted from (2).

CHAPTER 1
6
with a 20 bp linker was reconstituted in the absence of linker histone using 180 mM
magnesium chloride. The resultant crystals solved to 9 Å resolution (PDB 1ZBB) showed
straight linkers creating a zig-zag architecture (Figure 1.4) (48). However, the
tetranucleosome structure may lack broad functional relevance because in a long
polynucleosomal stretch, multiple structural forms co-exist due to variations in the
underlying DNA sequence and the surrounding conditions (49). In fact, chromatin may have
a polymorphic composition and seeking a defined structure is like ‛Chasing a Mirage’ (50).
Mitotic chromosomes represent the highest order of chromatin module
organization. Each chromatid arm of a chromosome may be ~700 nm in diameter, providing
a 10,000 fold compaction to the naked DNA template (51). Although much of the detail still
remains obscure, the process involves nuclear tethering, long range fiber-fiber interactions,
topoisomerase II activity, and addition of non-histone scaffolding proteins. These proteins
include the chromosomal ATPase – Structural Maintenance of Chromosome proteins
(SMCs), and may form a part of cohesin and condensin ring complexes (52–55).
Figure 1.4. Tetranucleosome structure. An orthogonal view of the two fold
axis passing through the straight linker DNA segment LS, relating to
nucleosome N1 and N2 to N1’ and N2’ and bent linker DNA segment LB to
LB’. Adapted from (48).
CHAPTER 1
7
1.1.3 Linker histone
Linker histones were first recognized as a distinct class of lysine-rich histones (56), which
could be separated from major basic nuclear proteins by ion exchange chromatography
(57). Specifically, it is the abundance of lysine in linker histones that allows for a more
dynamic interaction with DNA (58). Other basic non-histone proteins capable of efficient
DNA condensation include the arginine rich protamines from spermatozoa.
1.1.3.1 Linker histone positioning and interactions
Initial results from salt dependent chromatin condensation, nuclease protection and
electron microscopic analysis lead to the proposal that the linker histone stabilizes
chromatin at low ionic strength and is likely to situate at the entry-exit sites of DNA on the
nucleosomal dyad axis (59–62).
The native chromatin precipitates at magnesium chloride concentrations above 1.5
mM; but in the absence of H1 it remains soluble up to 5 mM MgCl2. Briefly, the salt
dependent chromatin condensation typically exhibits a folding transition at low salt
concentration. A further increase in ionic strength leads to reversible oligomerization into
large (>100 S) soluble assemblages. The successful formation of superstructures like the
compact nucleosomal arrays / chromatin filaments organized into a 30 nm chromatin fiber,
and the higher order chromosomal structures requires H1 (4, 63, 64).
The nucleosomes strongly protect 147 bp of DNA against micrococcal nuclease
(MNase), which preferentially digests linker DNA. By virtue of its binding, the linker histone
gives an extra ~20 bp (15-30 bp) protection to chromatin. This leads to the formation of the
~160 bp (160-166 bp) chromatosome particle (65–68). In the absence of an X-ray crystal
structure of nucleosome bound H1, the exact location of the protected 20 bp linker DNA has
remained contentious for a long time (69). Accordingly, H1-nucleosome binding with respect
to the dyad axis is envisioned either to be symmetric or asymmetric. The symmetric binding
model argues for binding to 10 bp of DNA from either side of the nucleosome core, thereby
sealing the entry-exit ends over the nucleosome in a stem structure (67, 70). In contrast, the
asymmetric model proposes binding to 20 bp from one side of the nucleosomal dyad only
CHAPTER 1
8
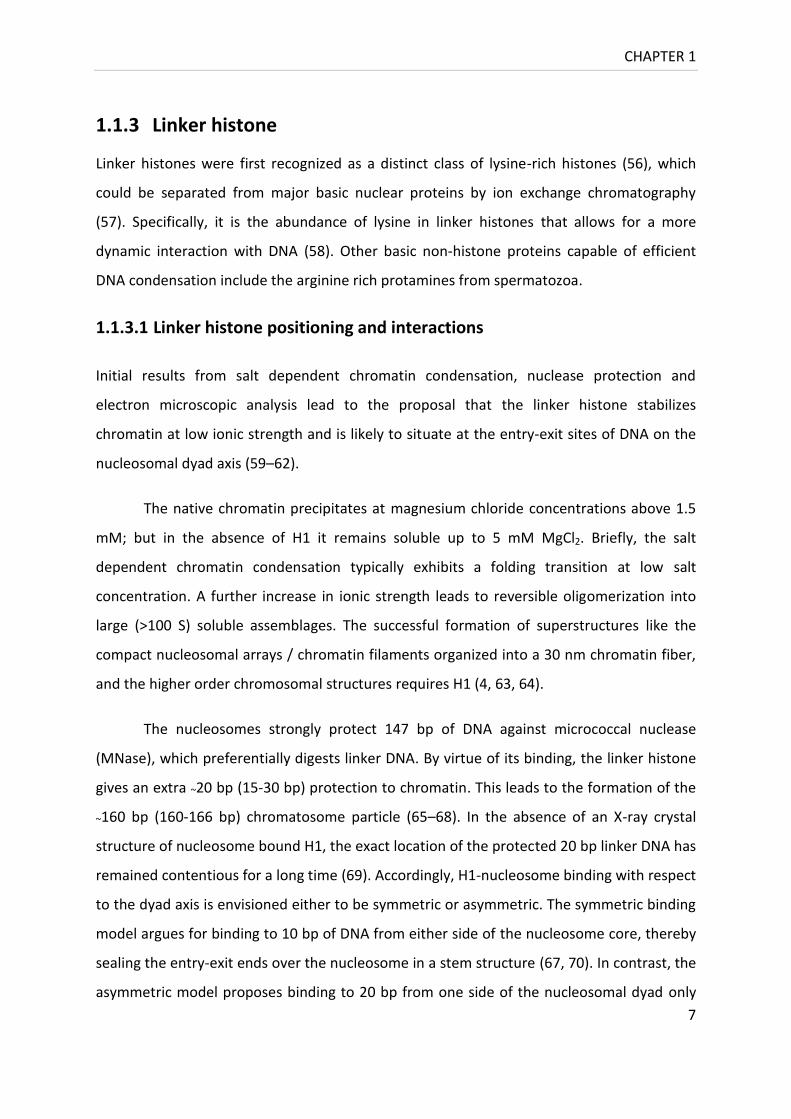
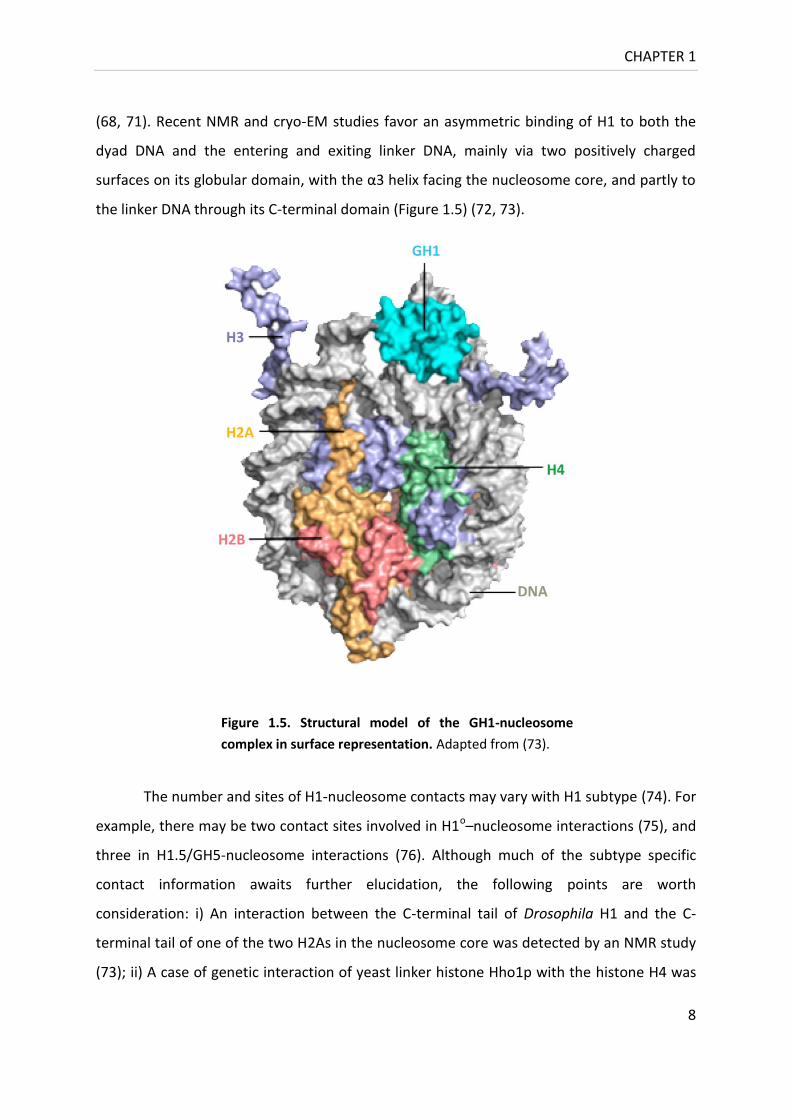
(68, 71). Recent NMR and cryo-EM studies favor an asymmetric binding of H1 to both the
dyad DNA and the entering and exiting linker DNA, mainly via two positively charged
surfaces on its globular domain, with the α3 helix facing the nucleosome core, and partly to
the linker DNA through its C-terminal domain (Figure 1.5) (72, 73).
The number and sites of H1-nucleosome contacts may vary with H1 subtype (74). For
example, there may be two contact sites involved in H1o–nucleosome interactions (75), and
three in H1.5/GH5-nucleosome interactions (76). Although much of the subtype specific
contact information awaits further elucidation, the following points are worth
consideration: i) An interaction between the C-terminal tail of Drosophila H1 and the C-
terminal tail of one of the two H2As in the nucleosome core was detected by an NMR study
(73); ii) A case of genetic interaction of yeast linker histone Hho1p with the histone H4 was
Figure 1.5. Structural model of the GH1-nucleosome
complex in surface representation. Adapted from (73).
CHAPTER 1
9
documented. It reported suppression in the transcriptional silencing defect of a H4 globular
domain mutant (H4-Y88G) upon HHO1 deletion (77); iii) A prominent interaction of the H4
tail with the acidic patch formed by the H2A-H2B dimer on the adjacent nucleosome is
essential for survival and contributes to the chromatin fiber twist (78). Also, the asymmetric
location of H1 discriminates two sides of the mononucleosome and contributes to the fiber
twist (72). This asymmetry is reminiscent of the dichotomy of the nucleosomal surface
centered on H3K79 and located at the surface of the H3/H4 histone fold motif that interacts
with DNA (79). It was first identified in yeast mutants, viz. SIN [Switch defective / sucrose
non fermenting (SWI/SNF) remodeler switch independent] and LRS (loss of ribosomal DNA
silencing). These mutants behave differentially to transcriptional activators at different
heterochromatic loci, thereby implying domain specific modulation of heterochromatin (80–
82).
1.1.3.2 Evolution of linker histone sequence and structure
‘Nothing in biology makes sense except in the light of evolution’ (83). Depending on their
genomic context, mutations in DNA can lie anywhere in the spectrum from being lethal to
bestowing adaptive behavior. For example, there are ultra-conserved regions of DNA, not
known to serve any essential function, which when translocate might lead to cell death. A
high sequence identity within coding region generally signifies an important role, like the
synthesis of a structural protein. Amino acid deletions or substitutions in these regions may
cause an aberrant phenotype, or even lethality. In contrast, high sequence variability in
coding DNA sequence may suggest a regulatory role for the encoded protein. Select
mutations in such a region might confer a survival advantage. An example is mutations in
the members of p53 family of tumor suppressor proteins which evolved in cancer to
promote survival in a hypoxic environment induced by outgrowth of blood supply (84).
Histones are some of the most conserved eukaryotic proteins. While H3 and H4 are
about 90% conserved, and H2A and H2B about 70% conserved, the linker histone is the least
conserved histone (85). Not only the sequence, but also the structure, function and
evolutionary origin of linker histone differs from that of the core histones. The core histones
have a ubiquitous histone fold motif which exhibits intermolecular dimerization mediated
CHAPTER 1
10
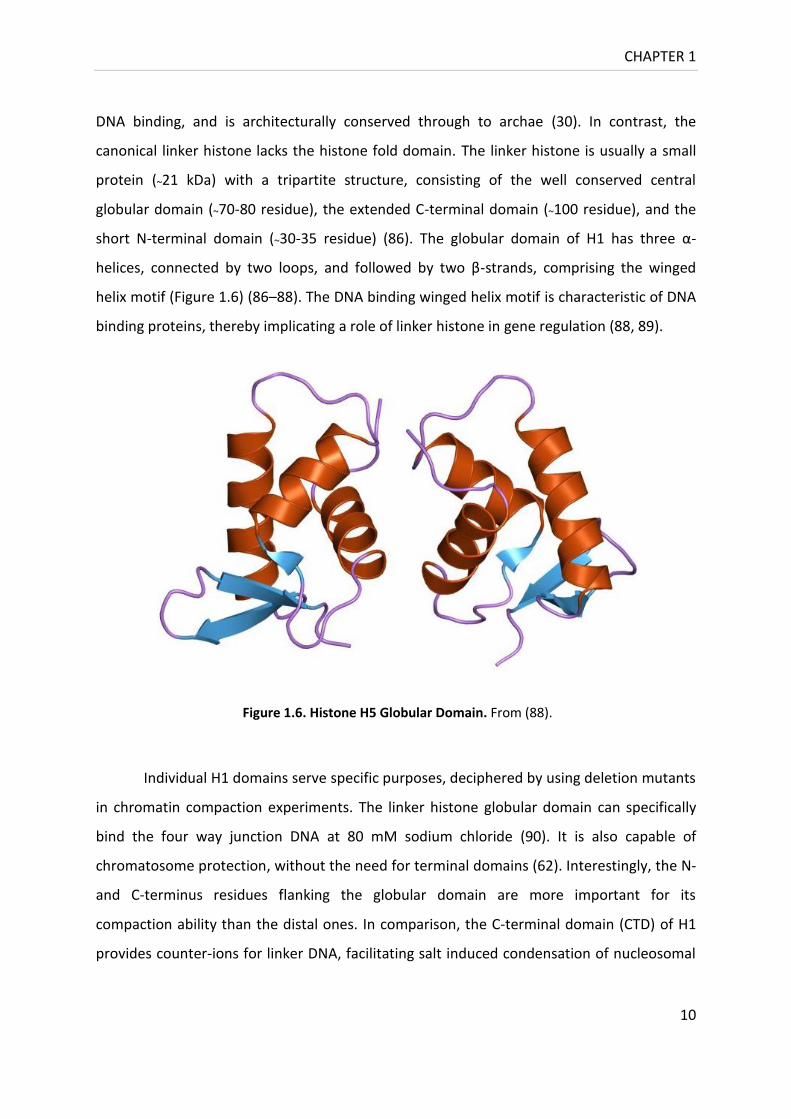
DNA binding, and is architecturally conserved through to archae (30). In contrast, the
canonical linker histone lacks the histone fold domain. The linker histone is usually a small
protein (~21 kDa) with a tripartite structure, consisting of the well conserved central
globular domain (~70-80 residue), the extended C-terminal domain (~100 residue), and the
short N-terminal domain (~30-35 residue) (86). The globular domain of H1 has three α-
helices, connected by two loops, and followed by two β-strands, comprising the winged
helix motif (Figure 1.6) (86–88). The DNA binding winged helix motif is characteristic of DNA
binding proteins, thereby implicating a role of linker histone in gene regulation (88, 89).
Individual H1 domains serve specific purposes, deciphered by using deletion mutants
in chromatin compaction experiments. The linker histone globular domain can specifically
bind the four way junction DNA at 80 mM sodium chloride (90). It is also capable of
chromatosome protection, without the need for terminal domains (62). Interestingly, the N-
and C-terminus residues flanking the globular domain are more important for its
compaction ability than the distal ones. In comparison, the C-terminal domain (CTD) of H1
provides counter-ions for linker DNA, facilitating salt induced condensation of nucleosomal
Figure 1.6. Histone H5 Globular Domain. From (88).

CHAPTER 1
11
array (91). The presence of N-terminal domain (NTD) also contributes to the binding affinity
and improves the chromatosome protection ability of H1 (92, 93).
Both the NTD and the CTD of H1 are rich in proline, alanine and lysine residues; and
are unstructured in solution (94, 95). Intrinsically disordered proteins are often involved in
regulatory pathways. In such cases, binding of a protein to its specific partner induces a
specific conformational change required for structure-induced activity. Several in vitro
folding studies show that the CTD of H1 is required for chromatin compaction, and adopts a
helical structure upon DNA binding (96–98). Circular dichroism, 1H-NMR and Infra-red
spectroscopy experiments further suggest that alpha helicity is also induced in the CTD of
linker histone by large tetrahedral anions, like phosphate, sulphate, and perchlorate, as well
as by the organic solvent 2,2,2-triflurorethanol (TFE); probably by mimicking the charge
effects of DNA (97, 99, 100). The C-terminus of H1 has proline kinked AK (alanine-lysine) α-
helical domains, required for fully compacted chromatin (62, 92, 101). Some H1 variants,
like H1d, also possess one or more β-turn sequence motif S/TPKK in the CTD that improve(s)
the DNA condensing ability of linker histone (102, 103). These motifs might kink around the
linker DNA, due to proline bends or helix breaks, and bind partly at or across the major
groove (97, 104). The N-terminus of H1 is the least conserved and nominally unstructured
domain. However, in presence of TFE or DNA, its basic residue cluster close to globular
domain exhibits induced alpha helicity (105). In vitro, the N-terminus has little contribution
to higher order compaction, but may improve the binding affinity of H1 to chromatin (92,
106). However, the in vivo results vary with H1 variants. For example, N-terminal deletion of
H1.1 show only a modest alteration in binding affinity by FRAP studies (107). In contrast, the
N-terminal deletion mutant of H1.4 shows considerably diminished chromatin binding
affinity, as followed by change in NRL upon in vivo mRNA injection into Xenopus oocytes
(108).
The evolutionary origin of linker histone has been traced back to eubacteria (58).
Amongst eukaryotes, the modular organization of linker histone domains varies. The
globular domain of animal H1s has an insert that is absent in plant H1s. Protists such as
Trypanosoma brucei (kinetoplastids) and Tetrahymena thermophila (ciliates) have a linker

CHAPTER 1
12
Figure 1.7. Linker histone sequence alignment. (A) Schematic of two putative globular domains of
Hho1p: GI and GII; (B) Structure-based sequence alignments of the globular domain regions of linker
histones in protists, animals and fungi. Histone abbreviations and sequence identity to scGI are:
gg, Gallus gallus (chicken), ggH5- 37.2%, ggH1- 32.1%; hs, Homo sapiens (human), hsH1.0-
33.3%; dm, Drosophila melanogaster (fruit fly), dmH1- 29.5%; ce, Caenorhabditis
elegans (nematoda), ceH1- 30.8%; od, Oikopleura dioica (tonicata), odH1- 39.7%; nc, Neurospora
crassa (fungus), ncH1- 50.0%; an, Aspergillus nidulans (fungus), anH1- 51.3%; ai, Ascobolus
immersus (fungus), aiH1- 52.6%; sc, Saccharomyces cerevisiae (yeast), scGII- 50.6%, scGI- 100%.
Key residues for the formation of hydrophobic core and highly conserved basic residues are
highlighted in magenta and blue, respectively. Adapted from (113).
histone which comprises only the C-terminus of canonical H1 (109, 110). However, the
canonical CTD is missing in the only linker histone protein encoded by the YPL127c gene in
the yeast genome (111). Also designated as HHO1 for histone H one, the gene encodes a
polyadenylated RNA expressed throughout the cell cycle at a constant high level. It is
translated into a 258 residue protein (Hho1p) corresponding to the molecular weight 27.8
kDa. Due to basic nature, Hho1p binds excess SDS and migrates on SDS PAGE at ~33 kDa. It is
31% identical and 44% similar in amino acid sequence to its human H1 counterpart. The
modular domain organization of Hho1p is unique. It comprises an NTD followed by two
globular domains, linked by a ~42 residue long CTD like sequence (Figure 1.7A). The NMR
structure of the two domains has been deciphered individually (112). Sequence alignment
shows that the Hho1p globular domain II (GII) lacks critical residues in the two DNA binding
sites found in globular domain I (GI) (Figure 1.7B) (113). Moreover, the loop between helices
two and three in GII is unstable / unfolded below 250 mM phosphate and leads to a
decrease in chromatosome protection ability of Hho1p (112, 114).
CHAPTER 1
13
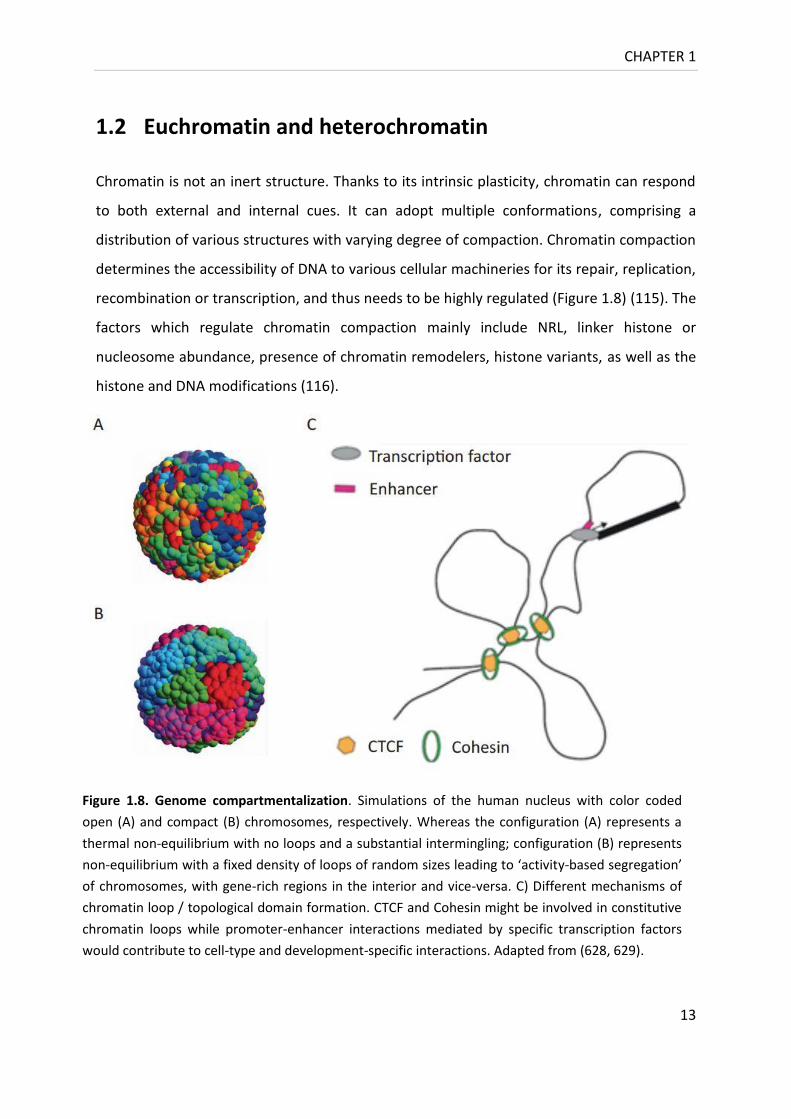
Figure 1.8. Genome compartmentalization. Simulations of the human nucleus with color coded
open (A) and compact (B) chromosomes, respectively. Whereas the configuration (A) represents a
thermal non-equilibrium with no loops and a substantial intermingling; configuration (B) represents
non-equilibrium with a fixed density of loops of random sizes leading to ‘activity-based segregation’
of chromosomes, with gene-rich regions in the interior and vice-versa. C) Different mechanisms of
chromatin loop / topological domain formation. CTCF and Cohesin might be involved in constitutive
chromatin loops while promoter-enhancer interactions mediated by specific transcription factors
would contribute to cell-type and development-specific interactions. Adapted from (628, 629).
1.2 Euchromatin and heterochromatin
Chromatin is not an inert structure. Thanks to its intrinsic plasticity, chromatin can respond
to both external and internal cues. It can adopt multiple conformations, comprising a
distribution of various structures with varying degree of compaction. Chromatin compaction
determines the accessibility of DNA to various cellular machineries for its repair, replication,
recombination or transcription, and thus needs to be highly regulated (Figure 1.8) (115). The
factors which regulate chromatin compaction mainly include NRL, linker histone or
nucleosome abundance, presence of chromatin remodelers, histone variants, as well as the
histone and DNA modifications (116).
CHAPTER 1
14
The ‘open’ or euchromatic configuration is conducive to DNA mediated processes
while the ‘closed’ or heterochromatic hinders the access of DNA to modulators. Usually, the
constitutive heterochromatin is associated with peri-centromeric, sub-telomeric and rDNA
chromosomal regions. In contrast, the facultative heterochromatin has a random, but
function-related distribution in the chromosome.
1.2.1 Yeast as a model organism to study chromatin compaction
Saccharomyces cerevisiae is considered a model eukaryote because of its unicellular, non-
pathogenic nature and a short reproductive cycle (90 min at 30 °C). Furthermore, yeast has a
relatively simple genomic organization, is easy to genetically manipulate and offers a vast
number of strain backgrounds as well as quantitative data sets. A number of surprising
discoveries, powerful research tools, and important medical benefits have arisen from
efforts to decipher complex biological phenomena in yeast (117). Studies of histone mutant
libraries along with genome wide screens for mutations that impair silencing in yeast have
played an important role in understanding the components and mechanism of silent
chromatinization.
A haploid yeast nucleus is about 1 μm in diameter. Being smaller in size than the
nuclei of higher eukaryotes, it is difficult to study microscopically. It is, however, remarkable
in undergoing a closed mitosis, i.e., the nuclear envelope is not dissolved. Each chromosome
is connected to the spindle pole body (SPB) via a microtubule per centromere, thus giving
the RABI configuration to chromosomes during cell division (5). Also, the crescent shaped
nucleolus, the SPB, and the constitutive heterochromatic domains such as the telomeres
remain tethered to the nuclear envelope. Moreover, there is little detectable condensation
of chromosomes or reduction in transcription, except in the rDNA (118).
The 12.5 Mbp genome (0.012 pg) of haploid yeast is organized into sixteen poorly
defined interphase chromosomes around ~20 fg histones per cell. It encodes about 6250
genes at a density of 1.9 genes per Kbp; approximately 900 of which are involved in cell
cycle regulation. Importantly, the nutrient supply controls cell cycle and cell growth through
signaling, metabolism and transcription (119). In nature, most microbes live under nutrient

CHAPTER 1
15
Figure 1.9. Various phases of yeast cell growth. Adapted from (121).
deprived conditions. Under starvation, the diploid cells of S. cerevisiae, heterozygous for the
mating type locus, cease to grow at a culture density between 3-5 Χ 108 cells per ml, and
enter the stationary or G0 phase (Figure 1.9) (120). When grown to G0 in rich media, yeast
cells can retain 100% viability for up to three months. This phase may thus be considered as
‘a physiological state coordinated with a cell cycle arrest’ (121). Cells in G0 exhibit
characteristically folded chromosomes (122), reduced transcription and translation, along
with an increase in resistance to various stresses, like heat shock (121).
1.2.2 Mechanism of heterochromatin formation in yeast
The constitutive heterochromatin in yeast is found at telomeric, rDNA and mating type loci.
Yeast telomeres are composed of multiple TG1-3 repeats. The rDNA comprises ~200 tandem
repeats of 35S rDNA. Each of these repeats is 9.1 kb long and contains intergenic spacers
IGS1 and IGS2 (123, 124). They are located on the long arm of chromosome 12, and
clustered into the nucleolus. The two homothallic mating type loci: left (HMLα) and right
(HMRa), bear extra copies of mating type alleles. They are located on chromosome three,
~12 Kb from left telomere (HMLα) and ~23 Kb from right telomere (HMRa).
CHAPTER 1
16
Chromatin compaction is regulated by the SIR (Silent Information Regulator) proteins.
The Sir family comprises a set of evolutionary conserved proteins. Most prokaryotes encode
one Sir protein, humans-seven (Sir T1-7); whereas S. cerevisiae encodes five [Sir2, Hst1-
Hst4]. The Sir2 or sirtuin family of deacetylases (Type III HDACs) uses NAD+ as cofactor,
thereby linking nutrient availability and metabolic state of cell to gene expression, cell cycle
progression and life span regulation. The human SirT1 is a homologue of yeast Sir2p. SirT1 is
known to interact with histone H1 to promote facultative heterochromatin formation (125).
At the homothallic mating type loci and sub-telomeric loci, silencing begins by binding
of bivalent multifunctional nuclear factors like the origin recognition complex (ORC),
repressor activator protein 1 (Rap1p) and / or ARS binding factor 1 (Abf1p) to the nucleation
points called silencers (126). Sir1p or Sir3p/Sir4p complex is then recruited either via ORC or
Rap1p interaction, respectively. Sir1p also binds Sir4p, playing a role in the establishment of
silencing. The subsequent binding of Sir2p to Sir3p and Sir4p in a 1:1:1 ratio leads to the
formation of the SIR complex (127).
While Sir2p and Sir4p can be recruited to H4K16ac sites, Sir3p preferentially binds
hypo-acetylated histones and sits at the interface between two adjacent nucleosomes (128)
(Figure 1.10). Where Sir4p and Sir2p concentrations are limiting, Dot1 (Disruptor of
telomeric silencing 1) and Sas2 (Something about silencing 2) inhibit the binding of Sir3p by
depositing the H3K79me and H4K16ac marks, respectively. Thus, the cooperation between
Dot1 and Sas2 generates a barrier to the spread of SIR-mediated repression. The
recruitment as well as spread of SIR proteins is reinforced by homo-dimerization of Sir3p
winged helix and Sir4p coiled coil domains. This heightens the overall concentration of SIR
protein complex, overcoming that of Dot1 in proximity of recruitment sites. A sequential,
cooperative binding of the Holo-SIR proteins involves repeated cycles of Sir2p mediated
histone de-acetylation and self-interaction of the SIR complex. The iterative recruitment of
SIR complex leads to lateral propagation of silencing. In yeast, the SIR complex spreads
silencing domains in a sequence independent manner, much like the heterochromatin in
higher eukaryotes.
CHAPTER 1
17
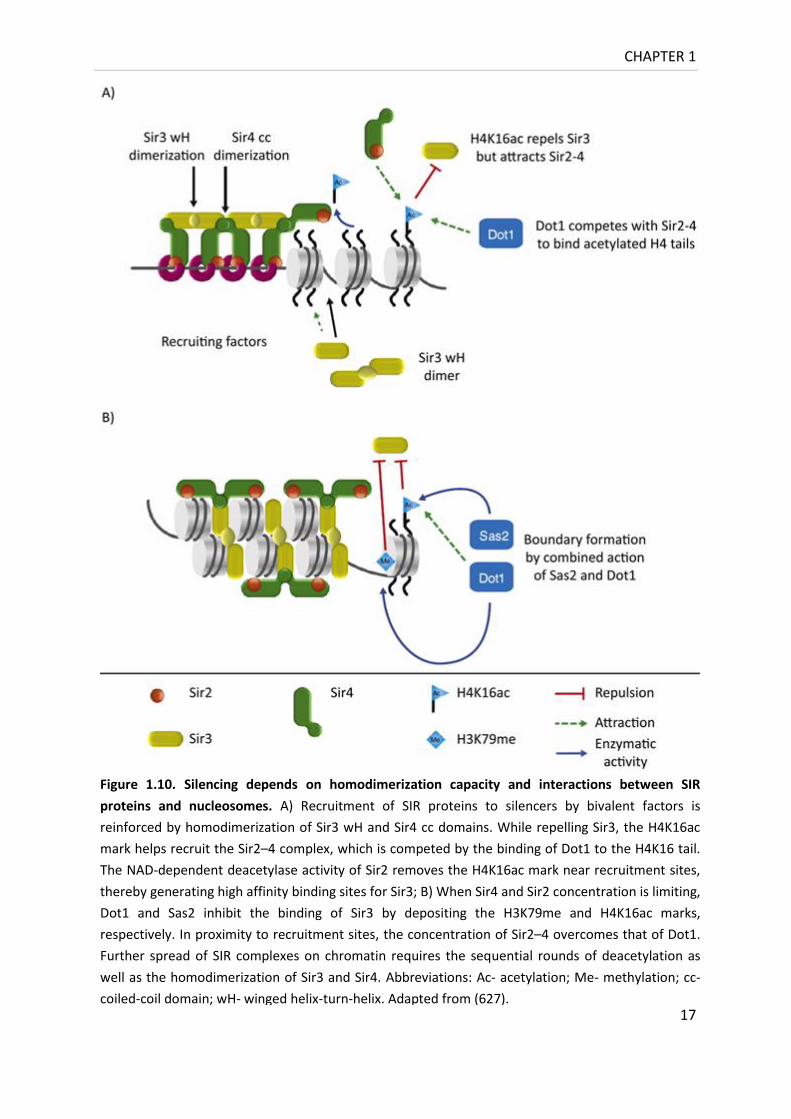
Figure 1.10. Silencing depends on homodimerization capacity and interactions between SIR
proteins and nucleosomes. A) Recruitment of SIR proteins to silencers by bivalent factors is
reinforced by homodimerization of Sir3 wH and Sir4 cc domains. While repelling Sir3, the H4K16ac
mark helps recruit the Sir2–4 complex, which is competed by the binding of Dot1 to the H4K16 tail.
The NAD-dependent deacetylase activity of Sir2 removes the H4K16ac mark near recruitment sites,
thereby generating high affinity binding sites for Sir3; B) When Sir4 and Sir2 concentration is limiting,
Dot1 and Sas2 inhibit the binding of Sir3 by depositing the H3K79me and H4K16ac marks,
respectively. In proximity to recruitment sites, the concentration of Sir2–4 overcomes that of Dot1.
Further spread of SIR complexes on chromatin requires the sequential rounds of deacetylation as
well as the homodimerization of Sir3 and Sir4. Abbreviations: Ac- acetylation; Me- methylation; cc-
coiled-coil domain; wH- winged helix-turn-helix. Adapted from (627).

CHAPTER 1
18
The rDNA compaction uses the RENT complex (Regulator of Nucleolar Silencing and
Telophase Exit) instead of Sir3p/Sir4p complex (129). The RENT complex contains Sir2p,
Net1 and Cdc14 proteins. Besides the SIR complex, CAPs (Chromatin Architectural Proteins)
also regulate chromatin compaction. Examples include MeCP2 (Methyl CpG Binding Protein)
and HP1 (Heterochromatin Protein 1). The MeCP2 induces both local and global changes in
chromatin condensation (130), while HP1 is a CAP essential for silencing in metazoans, but
absent in S. cerevisiae. Apart from these, Set1 (a H3K4 methyl transferase) is also required
for transcriptional silencing at telomeres and rDNA in yeast. Set1 acts in a Sir2p independent
fashion (131–133). It forms a part of the multiprotein complex called COMPASS (Complex of
Proteins Associated with Set1) which was identified as the first histone H3K4 methylase
(134, 135).
1.2.3 Chromatin territories and boundary elements
The interphase genome is loosely packaged as chromatin, with each chromosome occupying
a preferential territory (136). Association with the nuclear periphery or the lamina is related
to the formation of constitutive heterochromatin, as in case of the inactive X-chromosome.
Tethering to the nuclear pore, on the contrary, results in an open chromatin configuration.
This may occur in order to facilitate the rapid export of the RNA product to the cytoplasm. In
contrast, the center of the nucleus is predominantly euchromatic. It has the transcription
factories which possess relatively higher local concentrations of transcription factors and
RNA polymerases. Repositioning from nuclear lamina to nuclear interior is a prerequisite for
gene activity (Figure 1.8A, B). The term ‘position effect’ coined in this regard, refers to the
phenomenon of change in expression level of a gene based on its proximity to a particular
chromatin domain on the chromosome (137). Not only the global, but also the local
positioning of a gene may determine its silencing or expression. The relative proximity of
neighboring chromosomes may also determine interactions like co-regulated gene
expression or translocations.
A fine balance between histone acetylase (HAT) and deacetylase (HDAC) activity
leaves the active chromatin with hyper-acetylated histones, and silent chromatin with hypo-
CHAPTER 1
19
acetylated histones. To illustrate, active genes and enhancers are marked with acetylated
H4K16. H4K16 acetylation weakens the inter-nucleosomal interaction between the amino-
terminus of H4 and the acidic patch on H2A, thus loosening compaction (138). Besides, the
deacetylation of H4K16ac, H3K14ac and H3K9ac by Sir2p maintains the heterochromatin
domains, and prevents the ubiquitous spread of euchromatin. On the contrary, chromatin
boundary or insulator elements between heterochromatin and euchromatin avoid the
spread of heterochromatin due to the linear polymerization of the SIR complex over DNA.
Interestingly, Hho1p was found to reinforce the action of several barrier elements (139).
These elements are bound by certain proteins like the CTCF (absent in S. cerevisiae),
enriched for certain modifications like H3K9me and devoid of others, like histone
acetylation (140, 141). Besides these, the conserved histone variant H2A.Z is known to
localize to chromatin boundaries, therein protecting euchromatin against ectopic spread of
heterochromatin (142). The loading of H2A.Z on to nucleosomes by the yeast SWR complex
depends on the NuA4 mediated acetylation of H2A and H4 in the nucleosomal core (143);
while INO80 complex is involved in its removal (144).
1.2.4 Nucleosome positioning
Nucleosomes pose an obstacle to processes that operate on a naked DNA template (145).
The loss of nucleosomes or weakly positioned nucleosomes can enhance the transcriptional
competence of chromatin (146, 147). Concomitantly, the packaging of DNA into
nucleosomes was found to control the levels of gene transcription during the yeast cell cycle
(148, 149). Moreover, the exact position of nucleosomes regulates several biological
functions (150). For example, nucleosomes can act as speed bumps for elongating RNAP II,
facilitating kinetic coupling of transcription with polymerase fidelity as well as gene splicing
at intron/exons junctions (151, 152).
The positioning of nucleosomes is influenced by chromosomal location, template
DNA sequence, and CpG methylation; as well as by trans factors like transcription factors,
remodeler ATPases and histone chaperones (149, 153, 154). While nucleosomes are
depleted at telomeres, the centromeric DNA sequence is strongly occupied (155, 156).

CHAPTER 1
20
Figure 1.11. Nucleosome sequence preferences. From (630).
Nucleosomes are more populated within coding as compared to noncoding regions, except
in case of genes for ribosomal RNA and transfer RNA (155, 157). In addition, higher GC
content in exons than in introns positively correlates with relatively higher nucleosome
occupancy in the former (158, 159).
The polyA sequences are intrinsically stiff. These poly (dA:dT) tracts are enriched in
nucleosome free regions, for instance, within the eukaryotic promoters (160, 161).
However, remodelers can position nucleosomes to unfavorable sequences in promoter
region to mediate gene silencing (162). Interestingly, nucleosome depletion over AT rich
sequences correlates with the overall AT% in vivo. Moreover, certain sequences, like the
Widom 601 fragment, promote well positioned nucleosomes (163). In general, the
sequences which favor DNA bending have a ~10 bp periodic AA, TT or TA dinucleotides that
oscillate in phase with each other and out of phase with ~10 bp periodic GC dinucleotides
(Figure 1.11) (155, 164). This pattern of dinucleotide recurrence extends beyond
nucleosomal DNA in chicken and flies but not in yeast, which possess a shorter linker DNA
(165).
CHAPTER 1
21
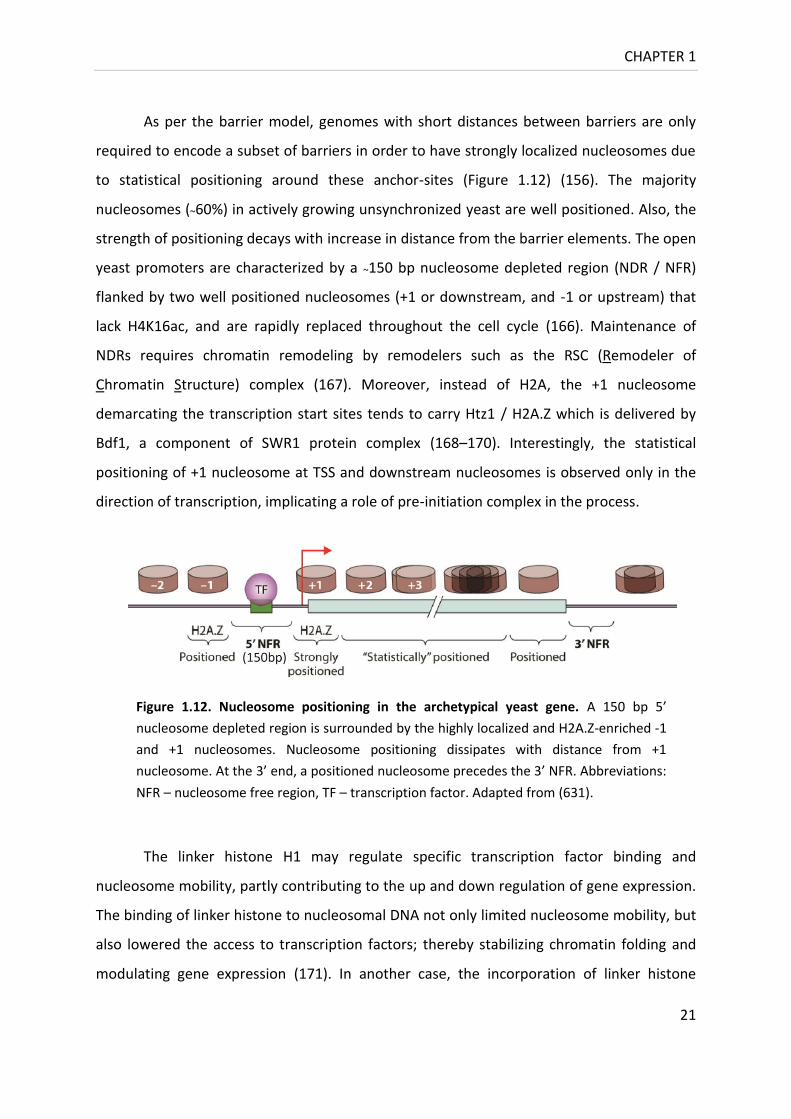
As per the barrier model, genomes with short distances between barriers are only
required to encode a subset of barriers in order to have strongly localized nucleosomes due
to statistical positioning around these anchor-sites (Figure 1.12) (156). The majority
nucleosomes (~60%) in actively growing unsynchronized yeast are well positioned. Also, the
strength of positioning decays with increase in distance from the barrier elements. The open
yeast promoters are characterized by a ~150 bp nucleosome depleted region (NDR / NFR)
flanked by two well positioned nucleosomes (+1 or downstream, and -1 or upstream) that
lack H4K16ac, and are rapidly replaced throughout the cell cycle (166). Maintenance of
NDRs requires chromatin remodeling by remodelers such as the RSC (Remodeler of
Chromatin Structure) complex (167). Moreover, instead of H2A, the +1 nucleosome
demarcating the transcription start sites tends to carry Htz1 / H2A.Z which is delivered by
Bdf1, a component of SWR1 protein complex (168–170). Interestingly, the statistical
positioning of +1 nucleosome at TSS and downstream nucleosomes is observed only in the
direction of transcription, implicating a role of pre-initiation complex in the process.
The linker histone H1 may regulate specific transcription factor binding and
nucleosome mobility, partly contributing to the up and down regulation of gene expression.
The binding of linker histone to nucleosomal DNA not only limited nucleosome mobility, but
also lowered the access to transcription factors; thereby stabilizing chromatin folding and
modulating gene expression (171). In another case, the incorporation of linker histone
Figure 1.12. Nucleosome positioning in the archetypical yeast gene. A 150 bp 5’
nucleosome depleted region is surrounded by the highly localized and H2A.Z-enriched -1
and +1 nucleosomes. Nucleosome positioning dissipates with distance from +1
nucleosome. At the 3’ end, a positioned nucleosome precedes the 3’ NFR. Abbreviations:
NFR – nucleosome free region, TF – transcription factor. Adapted from (631).
CHAPTER 1
22
during in vitro assembly not only decreased restriction enzyme access, and lowered basal
transcription; but also improved nucleosome positioning, and favored access to sequence-
specific binding factors (172). In an exception, indirect-end-labeling demonstrated specific
positioning of nucleosomes in three different regions of Tetrahymena macronuclear
genome, with no alteration in positioning in the absence of H1 (173).
1.2.5 DNA supercoiling
The local sequence specificity targeted by molecular factors is partly constrained by the
generic DNA polymer topology. Concomitantly, nucleosome positioning is also determined
by the regulation of DNA supercoiling by topoisomerases, helicases and gyrases (174).
The local torsional distortion of circular DNA or of DNA loops tethered to
chromosomal proteins may be accommodated by relative changes in twist (Tw) and writhe
(Wr). This mutual change in twist and writhe correlates with the change in linking number
(Lk), given by ΔLk = ΔTw + ΔWr. Thus, in the absence of any linking number change, a change
in DNA twist must be balanced by a compensatory change in its writhe. A positive linking
number corresponds to a positively supercoiled DNA, and vice-versa. Circular DNA is usually
negatively supercoiled in vivo. Negative supercoils act as a source of free energy not only to
aid the stabilization of secondary structures such as cruciform, but also in strand separation
for various DNA functions (175).
Positively charged residues in the histones contact the phosphate backbone of the
DNA every ~10.4 bp, establishing relatively weak histone-DNA contacts per nucleosome.
Each of these 14 sites has a conserved arginine that inserts into minor groove (176, 177).
These stabilize the wrap, but are labile enough to facilitate helix opening for DNA protein
interactions. For example, during transcription the elongating RNA polymerase II generates
positive supercoils ahead, and negative supercoils behind it. In order to maintain a
transcriptionally competent folded state of the chromatin template, RNAP II requires a
concerted act with topoisomerases and the histone chaperone Asf1 (Anti-silencing factor 1),
which co-migrates with it and facilitates H3-H4 eviction (178).
CHAPTER 1
23
The incorporation of the histone H3 variant: mammalian centromere protein-A
(CENP-A), and its centromeric H3 (CenH3) counterparts in other organisms, demarcate the
centromeric nucleosome (179, 180). The presence of CENP-A induces positive supercoiling
owing to a right handed wrap of DNA. The S. cerevisiae variant of CENP-A is known as Cse4p,
and is present at a well-defined 125 bp centromeric DNA locus. AFM observations suggest
formation of a nucleosome smaller in diameter, called hemi or hexa-some, at this locus
(181). Cse4p can functionally replace human CENP-A, and plays an epigenetic role in
centromere assignment (182).
1.2.6 Linker histone and chromatin compaction
1.2.6.1 Canonical linker histone in chromatin compaction
As discussed above, DNA condensation is introduced by the binding of linker histone to
entry-exit DNA at the nucleosomal dyad, thereby effectively sealing two turns of DNA on the
histone octamer core (62). In vitro, mini-chromosome reconstitution experiments
demonstrated that the addition of linker histones induces condensation (183). Similarly, the
binding of linker histone can alter global chromatin structure in vivo (184, 185), such that a
large increase in cellular H1 may even be lethal. The over-expression of H1 in Xenopus laevis
egg extracts causes chromosomes to hyper compact into an inseparable mass, whereas its
immune-depletion leads to aberrant ~2 fold elongated chromosomes that cannot segregate
during anaphase (186, 187). In vitro, linker histone acts as a general repressor of
transcription (188). However, there are cases of stimulation or repression of a limited
number of genes upon H1 binding in vivo. In Drosophila, linker histones act as strong
dominant suppressors of silencing, with opposing effects on genes inserted in pericenteric
heterochromatin and euchromatin (189).
Depletion of H1 in mammalian cells led to a decrease in global nucleosome spacing,
reduction in local chromatin compaction, and decrease in certain core histone
modifications. H1 depletion led to an increase in nuclear size of Tetrahymena macronucleus
(190), yeast spore nucleus (191), and nucleus of cell lines derived from mice H1 knockout
cells. Similarly, depleting H1 impaired embryonic stem cell differentiation (192), while doing
CHAPTER 1
24
so in Drosophila led to a strong activation of transposons (193). An increase in number of
core particles and shortened linker DNA was observed in case of mice H1 knockout cells
(194). Microarray analysis of mice spermocytes with H1 levels genetically depleted to 75%
of normal levels showed only 17 genes out of 9000 with an expression difference two fold or
greater (195). Moreover, above 20% and 50% reduction of normal linker histone levels
caused embryonic lethality in mice (184), and larval lethality in fruit fly (189), respectively. In
contrast, knockouts of H1 in some plants and lower eukaryotes such as Saccharomyces
cerevisiae (196), Tetrahymena thermophila (190), Arabidopsis thaliana (197), Caenorhabditis
elegans (198), and Ascobolus immersus (199) were not lethal or detrimental to gamete
formation, challenging the essential role of H1 in cellular homoeostasis. Although there
were no major changes in cellular phenotype, developmental de-regulation and life-span
defects, were observed in most of these cases (197, 200, 201).
Linker histones have a higher binding affinity for methylated DNA (202), AT-rich DNA
(165), and crossovers of double helical DNA which occur at the dyad axis, and at the Holliday
junction intermediates formed during homologous recombination (203–205). The
methylation of promoter DNA inhibited transcription at a lower H1: DNA ratio than an
unmethylated template (206). Furthermore, an increase in DNA methylation and nuclease
susceptibility was observed when the only linker histone copy in multicellular fungus
Ascolobus immersus was deleted (200). Also, lower H1 levels in H1 variant knockout(s) led to
alteration in the methylation pattern of specific regulatory genes without influencing global
DNA methylation (184, 197). In comparison, dsRNA mediated knockout of all H1 genes in
Arabidopsis caused only minor, though statistically significant changes in the methylation
pattern of repetitive and single-copy sequences (197). Collectively, these results point
towards a cooperation between DNA methylation and linker histone binding in regulation of
transcription and gene silencing.
1.2.6.2 Hho1p in chromatin compaction
The nuclear localization of Hho1p was confirmed by GFP tagging (207). Further analysis
using ChIP suggested that Hho1p preferentially associates with the rDNA (201, 208). When
the level of Hho1p was increased in vivo, the DNA repair properties were altered, thus

CHAPTER 1
25
suggesting Hho1p mediated inhibition of homologous recombination (201). Specifically,
Hho1p inhibited rDNA recombination, as measured by expression and loss of Ty1HIS3
marker elements inserted at the rDNA locus (209). It was previously demonstrated that the
accumulation of extra-chromosomal ribosomal DNA circles (ERCs) in SIR2Δ mutants of S.
cerevisiae correspond to high level of recombination at rDNA loci and shortened lifespan
(210). In congruence, HHO1 deletion caused premature aging in certain yeast strains (201),
suggesting that Hho1p can elongate the life span by inhibiting rDNA recombination.
Concomitantly, Hho1p deletion lead to 3.4 fold increase in recombination at rDNA.
However, a lower number of Holliday junction intermediates formed during reciprocal
recombination in HHO1Δ cells: WT (~0.75: 1) signified the repression of overall
recombination in a H1 null background (209). The study also contradicted pre-mature aging
results of Down et al., perhaps due to strain specific differences. Besides, the authors
proposed a Sir2 independent pathway for Hho1p mediated repression of recombination at
rDNA locus (209), owing to several observations. First, accumulation of ERCs was not
observed in the HHO1Δ strain. Second, the rate of loss of TyHIS3 element in HHO1Δ cells
and SIR2Δ cells added up to that in SIR2ΔHHO1Δ double mutant. Third, while the level of
H3K9-K14 acetylated histones at the rDNA NTS in SIR2Δ cells was higher than the wild type
cells, that of HHO1Δ cells was found to be similar to the levels in wild type cells.
Under normal conditions, transcriptional silencing at rDNA, mating type loci and
telomeres is independent of Hho1p (139, 196, 201, 211). Consistent with this, the deletion
of linker histone HHO1 caused a reduction in only 27 transcripts by a factor ≥2, indicating
that Hho1p regulates transcription of only a subset of genes (196, 207, 212). Broadly, gene
silencing might either be a direct effect of H1 binding or an indirect effect of H1 mediated
sequestration of factors required for silencing. Over expression of Hho1p decreased the
abundance of SIR complex at some loci by impeding its propagation away from a silencer
(139). This suggests that Hho1p can only act during propagation, and not initial
establishment of heterochromatin. Therefore, the authors hypothesized that an increase in
Hho1p levels might inhibit transcriptional silencing on its own, or in conjunction with
barriers to heterochromatin.
CHAPTER 1
26
In vitro, Hho1p could form a 1: 1 ternary complex with reconstituted dinucleosomes.
Like canonical H1, Hho1p extended a chromatosome protection against MNase digestion
with a kinetic pause at ~168 bp, suggesting it to be the bona fide yeast linker histone (196).
The in vivo protein concentration, however, might be significantly less than the nucleosome
cores (201, 208). The protein levels of Hho1p were found to stay constant during active
growth, and through to semi-quiescence. However, its binding to chromatin increased
during the stationary phase, with an immediate eviction upon re-entry into exponential
growth (213). Since stationary phase displays extensive chromatin condensation, the role of
Hho1p in silencing becomes crucial. Nonetheless, Hho1p binding positively co-related with
global chromatin compaction in various stages of yeast life cycle (185, 191, 213). Using
comet assay and MNase digestion, a decrease in higher order chromatin compaction,
accompanied by slower growth, was observed upon HHO1 deletion (214). Interestingly, an
improved survival and increased chronological life span in HHO1 null background as
compared to the wild type cells was also observed. While Simpson and co-workers found
Hho1p to be non-essential for sporulation, Berger and team reported that its depletion early
in sporulation promotes meiosis, while enrichment late in sporulation facilitates genome
compaction in mature spores (191, 196).
1.2.7 Chromatin remodeling
DNA replication, repair, recombination and transcription either involve de novo histone
deposition on free DNA, or histone redistribution within chromatin by an active ATP-driven
process (215). Interactions between ATPase-remodeling complexes, histone chaperones and
histone post-translational modifications contribute to the chromatin assembly-disassembly
process (216, 217). For instance, the mobilization of linker histone on sperm chromatin is
greatly enhanced in the presence of Xenopus oocyte extracts (218). Although in vitro
chromatin assembly using yeast extract may mobilize and position the nucleosomes
successfully, the position of the +1 nucleosome is not as stable as in vivo. Moreover, the
position of nucleosomes downstream to the +1 nucleosome also degrades rapidly with
distance, suggesting a host of in vivo interactions amongst various factors involved in the
process.
CHAPTER 1
27
1.2.7.1 Chromatin remodelers
ATP dependent chromatin remodelers are multi-subunit complexes that hydrolyze ATP to
generate the energy required in order to move the nucleosomes to densely packed or
sparsely located regions of the genome. Remodeler activity may lead to histone exchange,
nucleosome sliding or disassembly mediated eviction (3, 219). ATP dependent remodelers
share a common subunit with a helicase like ATPase domain belonging to the SNF2
superfamily of proteins, and differ in having unique motifs for recruitment and specific
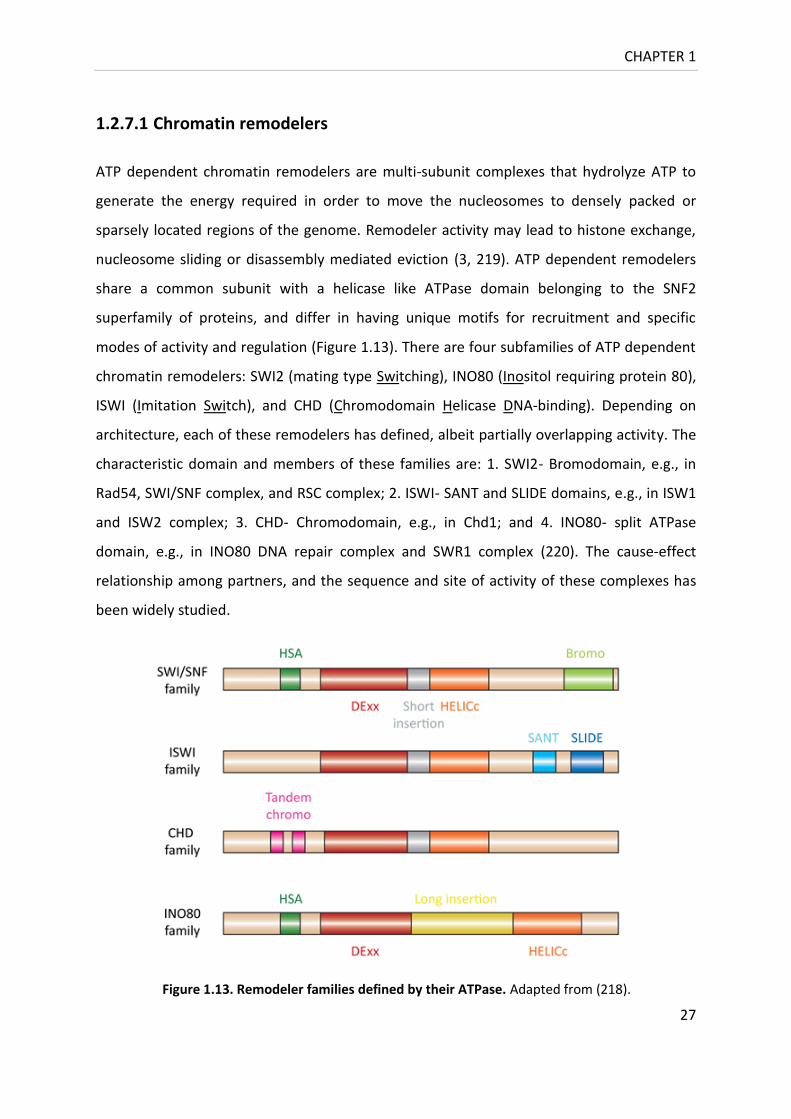
modes of activity and regulation (Figure 1.13). There are four subfamilies of ATP dependent
chromatin remodelers: SWI2 (mating type Switching), INO80 (Inositol requiring protein 80),
ISWI (Imitation Switch), and CHD (Chromodomain Helicase DNA-binding). Depending on
architecture, each of these remodelers has defined, albeit partially overlapping activity. The
characteristic domain and members of these families are: 1. SWI2- Bromodomain, e.g., in
Rad54, SWI/SNF complex, and RSC complex; 2. ISWI- SANT and SLIDE domains, e.g., in ISW1
and ISW2 complex; 3. CHD- Chromodomain, e.g., in Chd1; and 4. INO80- split ATPase
domain, e.g., in INO80 DNA repair complex and SWR1 complex (220). The cause-effect
relationship among partners, and the sequence and site of activity of these complexes has
been widely studied.
Figure 1.13. Remodeler families defined by their ATPase. Adapted from (218).
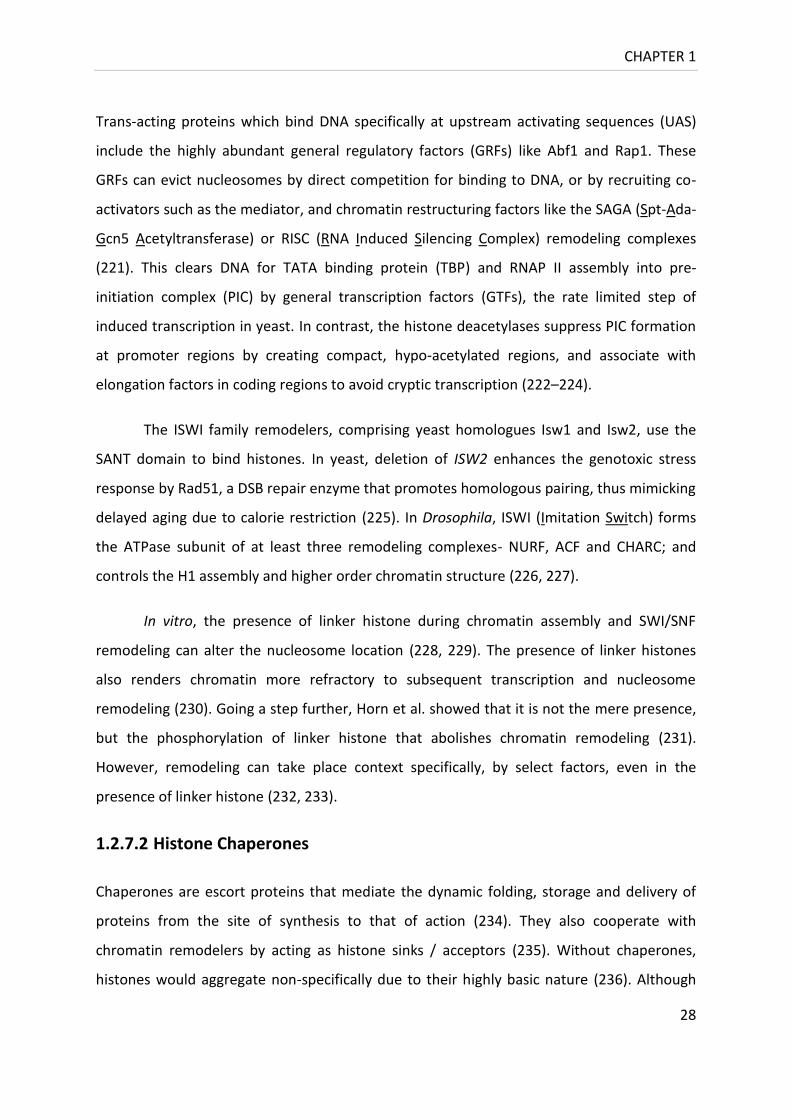
CHAPTER 1
28
Trans-acting proteins which bind DNA specifically at upstream activating sequences (UAS)
include the highly abundant general regulatory factors (GRFs) like Abf1 and Rap1. These
GRFs can evict nucleosomes by direct competition for binding to DNA, or by recruiting co-
activators such as the mediator, and chromatin restructuring factors like the SAGA (Spt-Ada-
Gcn5 Acetyltransferase) or RISC (RNA Induced Silencing Complex) remodeling complexes
(221). This clears DNA for TATA binding protein (TBP) and RNAP II assembly into pre-
initiation complex (PIC) by general transcription factors (GTFs), the rate limited step of
induced transcription in yeast. In contrast, the histone deacetylases suppress PIC formation
at promoter regions by creating compact, hypo-acetylated regions, and associate with
elongation factors in coding regions to avoid cryptic transcription (222–224).
The ISWI family remodelers, comprising yeast homologues Isw1 and Isw2, use the
SANT domain to bind histones. In yeast, deletion of ISW2 enhances the genotoxic stress
response by Rad51, a DSB repair enzyme that promotes homologous pairing, thus mimicking
delayed aging due to calorie restriction (225). In Drosophila, ISWI (Imitation Switch) forms
the ATPase subunit of at least three remodeling complexes- NURF, ACF and CHARC; and
controls the H1 assembly and higher order chromatin structure (226, 227).
In vitro, the presence of linker histone during chromatin assembly and SWI/SNF
remodeling can alter the nucleosome location (228, 229). The presence of linker histones
also renders chromatin more refractory to subsequent transcription and nucleosome
remodeling (230). Going a step further, Horn et al. showed that it is not the mere presence,
but the phosphorylation of linker histone that abolishes chromatin remodeling (231).
However, remodeling can take place context specifically, by select factors, even in the
presence of linker histone (232, 233).
1.2.7.2 Histone Chaperones
Chaperones are escort proteins that mediate the dynamic folding, storage and delivery of
proteins from the site of synthesis to that of action (234). They also cooperate with
chromatin remodelers by acting as histone sinks / acceptors (235). Without chaperones,
histones would aggregate non-specifically due to their highly basic nature (236). Although
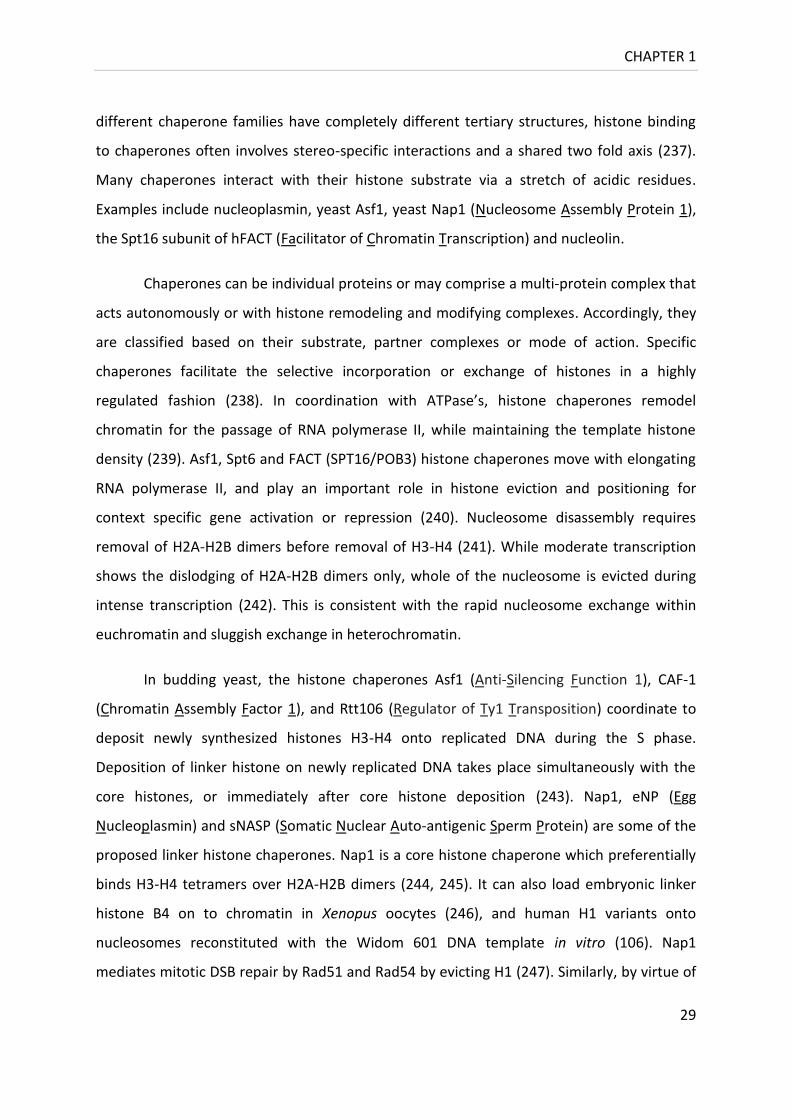
CHAPTER 1
29
different chaperone families have completely different tertiary structures, histone binding
to chaperones often involves stereo-specific interactions and a shared two fold axis (237).
Many chaperones interact with their histone substrate via a stretch of acidic residues.
Examples include nucleoplasmin, yeast Asf1, yeast Nap1 (Nucleosome Assembly Protein 1),
the Spt16 subunit of hFACT (Facilitator of Chromatin Transcription) and nucleolin.
Chaperones can be individual proteins or may comprise a multi-protein complex that
acts autonomously or with histone remodeling and modifying complexes. Accordingly, they
are classified based on their substrate, partner complexes or mode of action. Specific
chaperones facilitate the selective incorporation or exchange of histones in a highly
regulated fashion (238). In coordination with ATPase’s, histone chaperones remodel
chromatin for the passage of RNA polymerase II, while maintaining the template histone
density (239). Asf1, Spt6 and FACT (SPT16/POB3) histone chaperones move with elongating
RNA polymerase II, and play an important role in histone eviction and positioning for
context specific gene activation or repression (240). Nucleosome disassembly requires
removal of H2A-H2B dimers before removal of H3-H4 (241). While moderate transcription
shows the dislodging of H2A-H2B dimers only, whole of the nucleosome is evicted during
intense transcription (242). This is consistent with the rapid nucleosome exchange within
euchromatin and sluggish exchange in heterochromatin.
In budding yeast, the histone chaperones Asf1 (Anti-Silencing Function 1), CAF-1
(Chromatin Assembly Factor 1), and Rtt106 (Regulator of Ty1 Transposition) coordinate to
deposit newly synthesized histones H3-H4 onto replicated DNA during the S phase.
Deposition of linker histone on newly replicated DNA takes place simultaneously with the
core histones, or immediately after core histone deposition (243). Nap1, eNP (Egg
Nucleoplasmin) and sNASP (Somatic Nuclear Auto-antigenic Sperm Protein) are some of the
proposed linker histone chaperones. Nap1 is a core histone chaperone which preferentially
binds H3-H4 tetramers over H2A-H2B dimers (244, 245). It can also load embryonic linker
histone B4 on to chromatin in Xenopus oocytes (246), and human H1 variants onto
nucleosomes reconstituted with the Widom 601 DNA template in vitro (106). Nap1
mediates mitotic DSB repair by Rad51 and Rad54 by evicting H1 (247). Similarly, by virtue of

CHAPTER 1
30
its ability to specifically bind H1 and load it onto nucleosomal arrays, sNASP has also been
proposed to be the bona fide linker histone chaperone (248). NASP forms a homodimer, and
binds H1 through its tail domains with nM (nano molar) affinity in vitro (248, 249). It is
essential for replication and cell cycle progression (250). Besides, the Xenopus specific H2A-
H2B chaperone eNP can also efficiently mobilize chicken linker histone in vitro (251).
1.3 Other factors regulating chromatin compaction
Apart from factors discussed above, the prominent factors regulating chromatin compaction
include nucleosome repeat length (NRL), histone variants, post-translational modifications,
binding partners and dynamics of core as well as linker histones.
1.3.1 Histone variants
Histone variants are non-allelic forms of conventional histones, characterized by their
differences that confer specific structure and function to chromatin (252). Variants are
expressed at a lower level than their major-type counterparts, and can be mitotically
inherited.
In higher eukaryotes, the major core histones, such as H3.1, are synthesized
primarily in the S phase and deposited at replication forks in a replication coupled (RC)
manner (as H3.1-H4). On the other hand, the numerous replacement variants, like H3.3, are
often constitutively synthesized at low levels and incorporated in a replication independent
manner (as H3.3-H4). However, based on their specific role, histone variants can be
deposited by chromatin remodelers either in a replication dependent or replication
independent manner (253). The genes encoding the histones (HHO1 - linker histone; HTA1
and HTA2 - H2A; HTB1 and HTB2 - H2B; HHT1 and HHT2 - H3; HHF1 and HHF2 - H4) are the
only genes transcribed during yeast S phase (254).
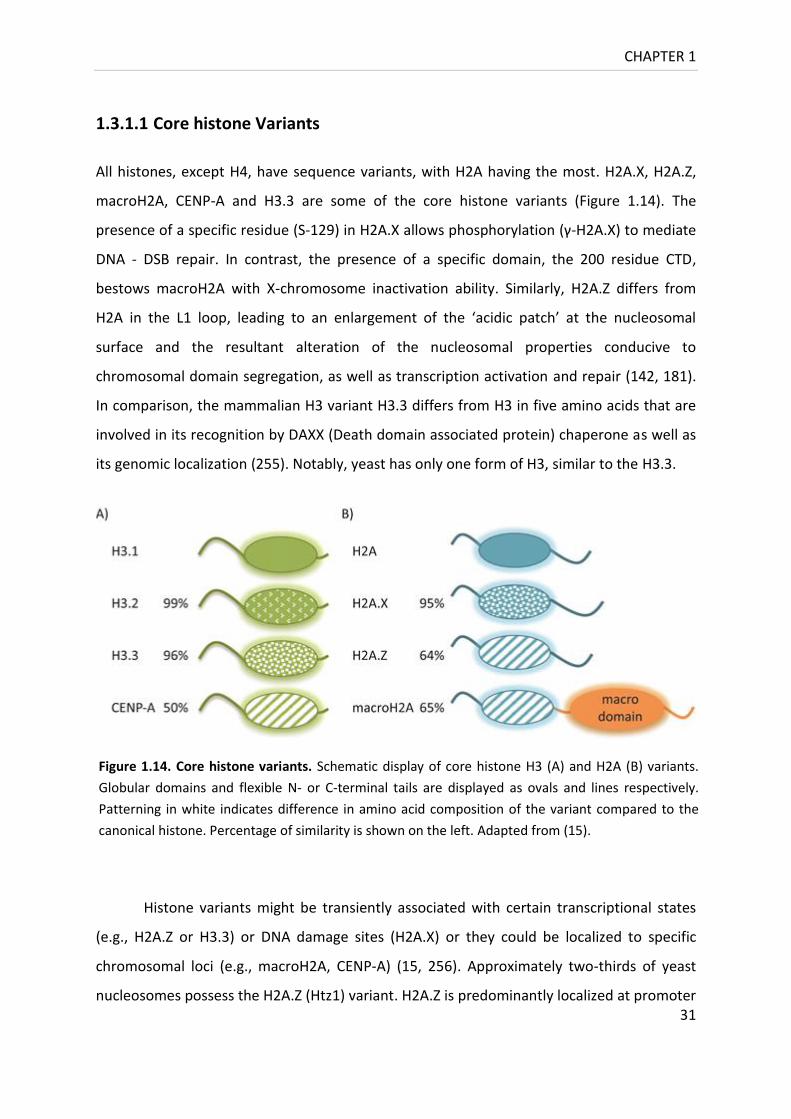
CHAPTER 1
31
1.3.1.1 Core histone Variants
All histones, except H4, have sequence variants, with H2A having the most. H2A.X, H2A.Z,
macroH2A, CENP-A and H3.3 are some of the core histone variants (Figure 1.14). The
presence of a specific residue (S-129) in H2A.X allows phosphorylation (γ-H2A.X) to mediate
DNA - DSB repair. In contrast, the presence of a specific domain, the 200 residue CTD,
bestows macroH2A with X-chromosome inactivation ability. Similarly, H2A.Z differs from
H2A in the L1 loop, leading to an enlargement of the ‘acidic patch’ at the nucleosomal
surface and the resultant alteration of the nucleosomal properties conducive to
chromosomal domain segregation, as well as transcription activation and repair (142, 181).
In comparison, the mammalian H3 variant H3.3 differs from H3 in five amino acids that are
involved in its recognition by DAXX (Death domain associated protein) chaperone as well as
its genomic localization (255). Notably, yeast has only one form of H3, similar to the H3.3.
Histone variants might be transiently associated with certain transcriptional states
(e.g., H2A.Z or H3.3) or DNA damage sites (H2A.X) or they could be localized to specific
chromosomal loci (e.g., macroH2A, CENP-A) (15, 256). Approximately two-thirds of yeast
nucleosomes possess the H2A.Z (Htz1) variant. H2A.Z is predominantly localized at promoter
Figure 1.14. Core histone variants. Schematic display of core histone H3 (A) and H2A (B) variants.
Globular domains and flexible N- or C-terminal tails are displayed as ovals and lines respectively.
Patterning in white indicates difference in amino acid composition of the variant compared to the
canonical histone. Percentage of similarity is shown on the left. Adapted from (15).

CHAPTER 1
32
regions of inactive (TATA-less) genes in euchromatin, keeping them in a state poised for
transcriptional activation (257, 258). H2A.Z also stabilizes transcriptional elongation
complexes by enabling efficient remodeling (259). Importantly, H2A.Z affects nucleosome
positioning on defined DNA templates and displaces H1 from chromatin (260). Moreover, in
higher eukaryotes, the replacement variant H3.3 has been reported to inhibit linker histone
binding to chromatin, decrease the NRL and greatly impair higher order chromatin folding
(261). H3.3 is the hallmark of active genes and also marks the enhancers (253). It promotes
chromatin folding by assisting recruitment of H2A.Z on promoters (262).
1.3.1.2 Linker Histone Variants
H1 shows species-, tissue- and development- specific micro-heterogeneity implying its
important role in spatio-temporal regulation of chromatin structure-function. There are
multiple H1 isoforms in higher organisms, and at least one isoform in all eukaryotes (Figure
1.15) (263). The mammalian H1 orthologs (originated from a common ancestor and
separated by speciation) are highly conserved. In contrast, H1 paralogs (originated by gene
duplication events) show conservation within the globular domain and divergence among
termini (16). Homo sapiens have eleven tissue specific non-allelic H1 variants: seven somatic
- H1.1, H1.2, H1.3, H1.4, H1.5 (ubiquitous), H1.0 (terminally differentiated cells) (264), and
H1x (involved in chromosome alignment and segregation) (265); three spermatogenic - H1t,
H1T2 and H1LS1; and one oocyte specific - H1foo (266–268). Similarly, Mus musculus has
eleven H1 variants which are paralogous to one another and orthologous to human H1
variants. While Hho1p, the yeast linker histone, is encoded by a single gene copy; the single
Drosophila H1 is encoded by multiple gene copies. Avian erythrocytes are unique in having a
nucleus, and express the linker histone variant H5 along with somatic linker histone H1
(269). Xenopus oocytes express the variant B4/H1M only, which promotes the expression of
the oocyte specific 5S rRNA gene (270, 271).
The functional differences of H1 variants are imparted not only by their sequence
divergence, but more importantly by their spatio-temporal expression / abundance (Figure
1.16). H1 expression levels are regulated primarily at the level of transcription, with a minor
contribution from splicing and mRNA stability (272). The replication-independent
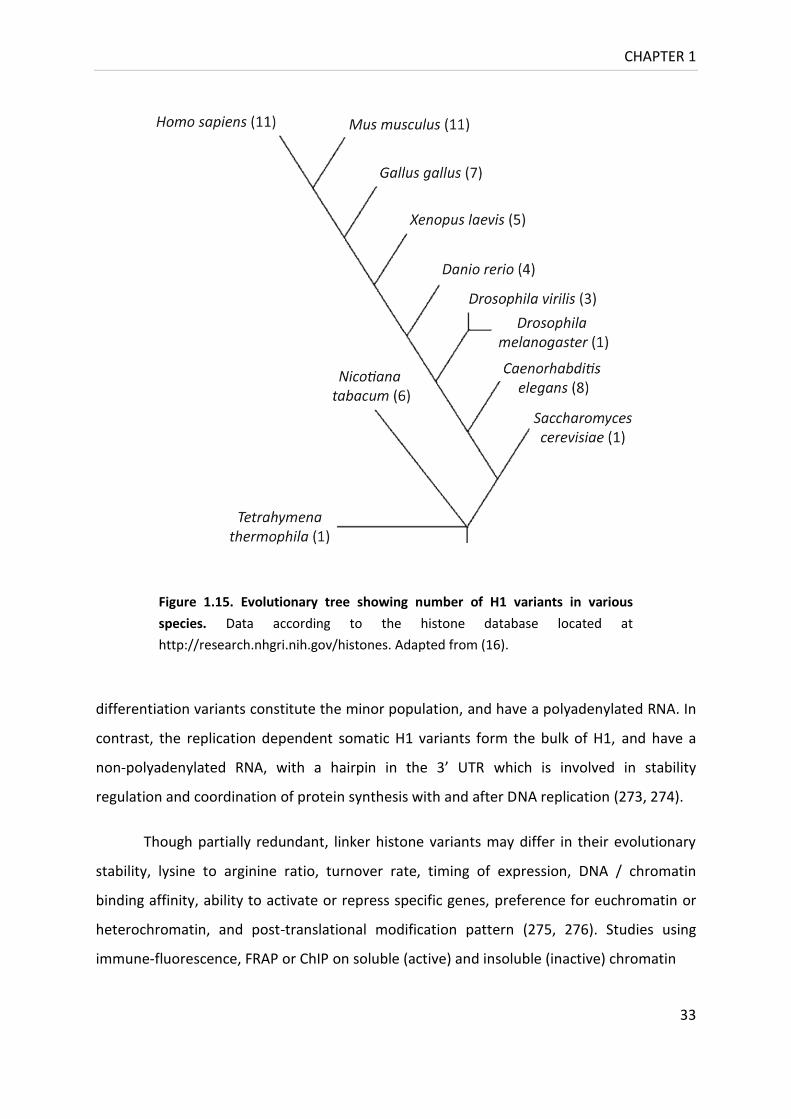
CHAPTER 1
33
differentiation variants constitute the minor population, and have a polyadenylated RNA. In
contrast, the replication dependent somatic H1 variants form the bulk of H1, and have a
non-polyadenylated RNA, with a hairpin in the 3’ UTR which is involved in stability
regulation and coordination of protein synthesis with and after DNA replication (273, 274).
Though partially redundant, linker histone variants may differ in their evolutionary
stability, lysine to arginine ratio, turnover rate, timing of expression, DNA / chromatin
binding affinity, ability to activate or repress specific genes, preference for euchromatin or
heterochromatin, and post-translational modification pattern (275, 276). Studies using
immune-fluorescence, FRAP or ChIP on soluble (active) and insoluble (inactive) chromatin
Figure 1.15. Evolutionary tree showing number of H1 variants in various
species. Data according to the histone database located at
http://research.nhgri.nih.gov/histones. Adapted from (16).

CHAPTER 1
34
suggest a differential genomic distribution of H1 variants (7, 277–279). In some cases, the
genomic distribution of H1 variants is segregated in blocks or chromosomal domains such
that they act synergistically to fine tune, rather than globally regulate chromatin structure
and function (266).
The transgenic mice models confirm the differential role of H1 subtypes in the
control of gene expression. RNAi mediated suppression of H1.1 expression lead to severe
germline differentiation abnormalities in Caenorhabditis elegans (198). When expressed in
yeast, the chromatin compaction ability of human H1 subtypes is similar to that exhibited in
a bacterial expression system. Konishi et al. demonstrated a role for linker histone H1c or
Figure 1.16. Overview of multiple functions of H1. Adapted from (16).
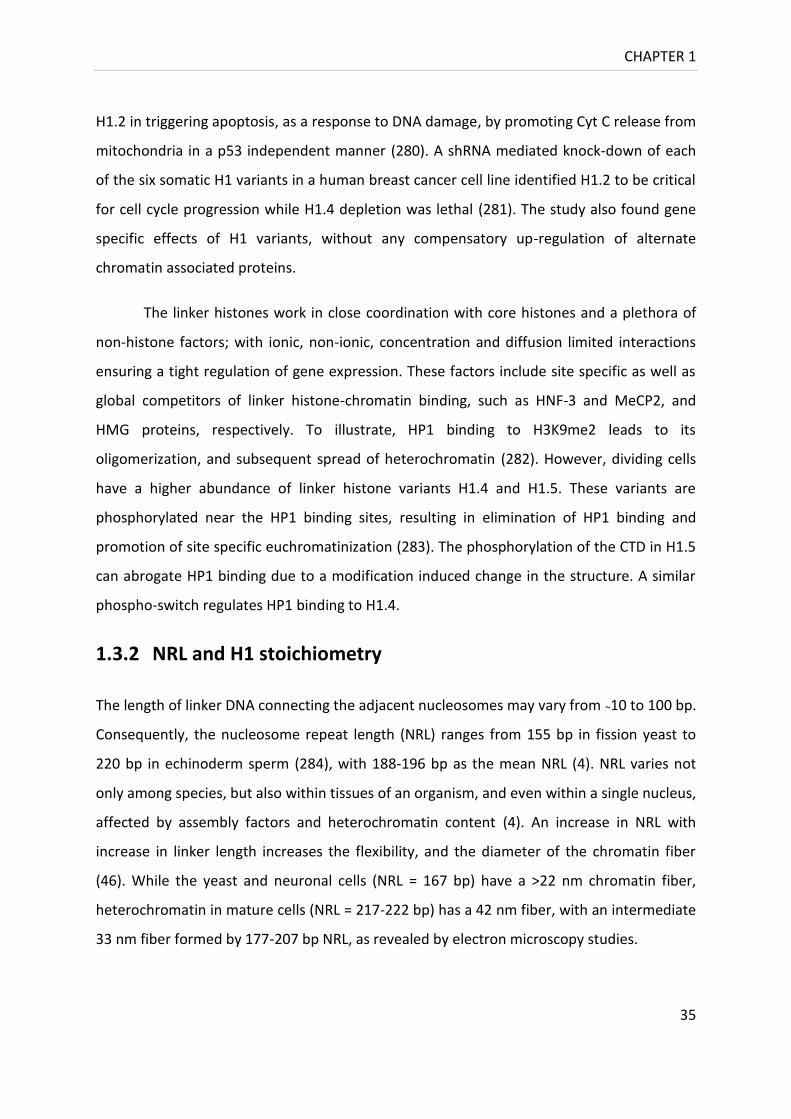
CHAPTER 1
35
H1.2 in triggering apoptosis, as a response to DNA damage, by promoting Cyt C release from
mitochondria in a p53 independent manner (280). A shRNA mediated knock-down of each
of the six somatic H1 variants in a human breast cancer cell line identified H1.2 to be critical
for cell cycle progression while H1.4 depletion was lethal (281). The study also found gene
specific effects of H1 variants, without any compensatory up-regulation of alternate
chromatin associated proteins.
The linker histones work in close coordination with core histones and a plethora of
non-histone factors; with ionic, non-ionic, concentration and diffusion limited interactions
ensuring a tight regulation of gene expression. These factors include site specific as well as
global competitors of linker histone-chromatin binding, such as HNF-3 and MeCP2, and
HMG proteins, respectively. To illustrate, HP1 binding to H3K9me2 leads to its
oligomerization, and subsequent spread of heterochromatin (282). However, dividing cells
have a higher abundance of linker histone variants H1.4 and H1.5. These variants are
phosphorylated near the HP1 binding sites, resulting in elimination of HP1 binding and
promotion of site specific euchromatinization (283). The phosphorylation of the CTD in H1.5
can abrogate HP1 binding due to a modification induced change in the structure. A similar
phospho-switch regulates HP1 binding to H1.4.
1.3.2 NRL and H1 stoichiometry
The length of linker DNA connecting the adjacent nucleosomes may vary from ~10 to 100 bp.
Consequently, the nucleosome repeat length (NRL) ranges from 155 bp in fission yeast to
220 bp in echinoderm sperm (284), with 188-196 bp as the mean NRL (4). NRL varies not
only among species, but also within tissues of an organism, and even within a single nucleus,
affected by assembly factors and heterochromatin content (4). An increase in NRL with
increase in linker length increases the flexibility, and the diameter of the chromatin fiber
(46). While the yeast and neuronal cells (NRL = 167 bp) have a >22 nm chromatin fiber,
heterochromatin in mature cells (NRL = 217-222 bp) has a 42 nm fiber, with an intermediate
33 nm fiber formed by 177-207 bp NRL, as revealed by electron microscopy studies.

CHAPTER 1
36
In vivo, an increase in DNA linker length, as observed with cell differentiation (285),
is proportional not only to DNA compaction, but also to H1: nucleosome stoichiometry
(284). Simply stated, more H1 is required to compact chromatin with longer linker DNA
(Figure 1.17). Conversely, an increase in NRL, up to a point of saturation, is observed with
overexpression of H1. Moderate over-expression of H1 not only increases the MNase
resistance of chromatin but also the nucleosome spacing with an associated increase in NRL
(286). Similarly, the addition of recombinant H1 to Drosophila melanogaster embryo
extracts, which lack H1, leads to an increase in NRL (287). Linker histone variants differ in
their ability to increase NRL, as seen by cytosolic mRNA injection into Xenopus oocytes,
followed by NRL determination (288). In this in vivo model system, the authors compared
the NRL saturation with H1 subtype overexpression, and detected a saturable increase for
all variants tested, except H1.5. An increase of ~13-20 bp was reported for chicken H5,
human hH1.4, Xenopus differentiation-specific xH1(0) and the somatic variant xH1A; while
for hH1.2 and hH1.3, the increase corresponded to ~4.5-7 bp. Concomitantly, the inverse
happens by depletion of H1 in mammalian cells (194).
Figure 1.17. NRL versus H1: nucleosome per nucleosome ratio. Dashed line
is linear regression for the mouse data shown as red squares: 1. Wild type
thymus, 2. Wild type liver; 3. H1-depleted liver; 4. H1-depleted thymus; 5.
Wild-type ES cell; 6. H1-depleted ES cell. Circles – Neuron and glia data.
Diamond – Chicken erythrocyte chromatin (CEN). Triangles – S. cerevisiae
data. Adapted from (284).
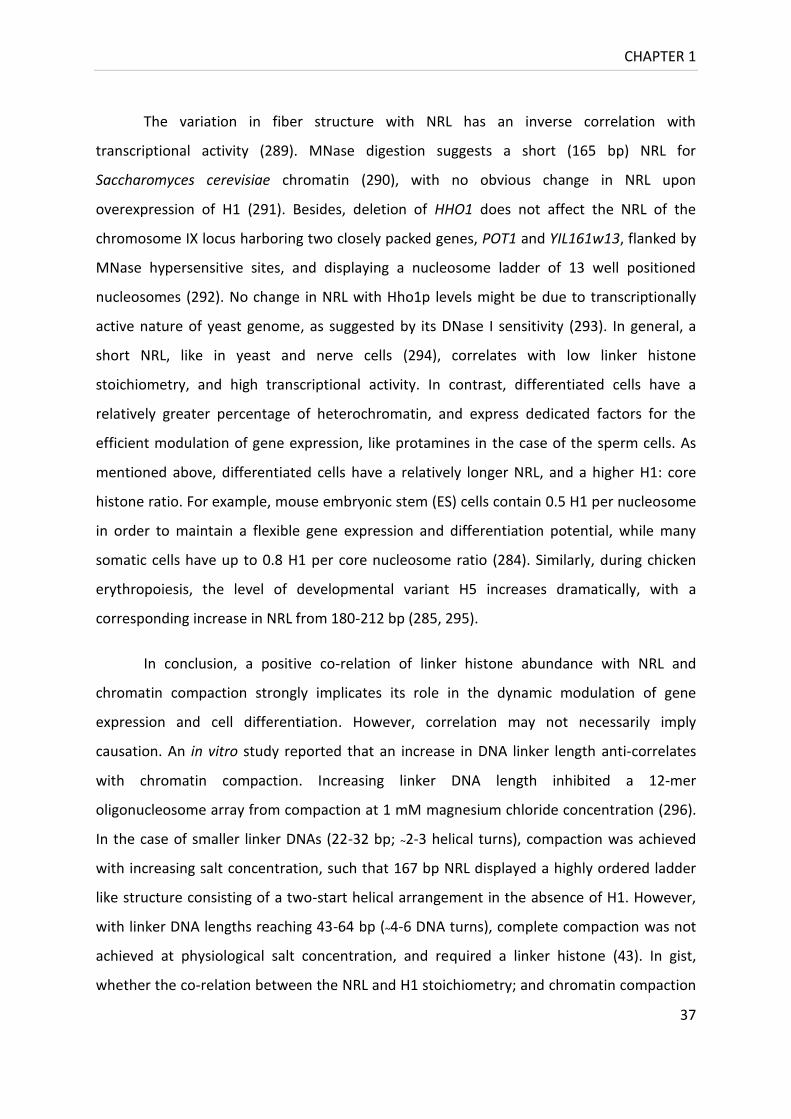
CHAPTER 1
37
The variation in fiber structure with NRL has an inverse correlation with
transcriptional activity (289). MNase digestion suggests a short (165 bp) NRL for
Saccharomyces cerevisiae chromatin (290), with no obvious change in NRL upon
overexpression of H1 (291). Besides, deletion of HHO1 does not affect the NRL of the
chromosome IX locus harboring two closely packed genes, POT1 and YIL161w13, flanked by
MNase hypersensitive sites, and displaying a nucleosome ladder of 13 well positioned
nucleosomes (292). No change in NRL with Hho1p levels might be due to transcriptionally
active nature of yeast genome, as suggested by its DNase I sensitivity (293). In general, a
short NRL, like in yeast and nerve cells (294), correlates with low linker histone
stoichiometry, and high transcriptional activity. In contrast, differentiated cells have a
relatively greater percentage of heterochromatin, and express dedicated factors for the
efficient modulation of gene expression, like protamines in the case of the sperm cells. As
mentioned above, differentiated cells have a relatively longer NRL, and a higher H1: core
histone ratio. For example, mouse embryonic stem (ES) cells contain 0.5 H1 per nucleosome
in order to maintain a flexible gene expression and differentiation potential, while many
somatic cells have up to 0.8 H1 per core nucleosome ratio (284). Similarly, during chicken
erythropoiesis, the level of developmental variant H5 increases dramatically, with a
corresponding increase in NRL from 180-212 bp (285, 295).
In conclusion, a positive co-relation of linker histone abundance with NRL and
chromatin compaction strongly implicates its role in the dynamic modulation of gene
expression and cell differentiation. However, correlation may not necessarily imply
causation. An in vitro study reported that an increase in DNA linker length anti-correlates
with chromatin compaction. Increasing linker DNA length inhibited a 12-mer
oligonucleosome array from compaction at 1 mM magnesium chloride concentration (296).
In the case of smaller linker DNAs (22-32 bp; ~2-3 helical turns), compaction was achieved
with increasing salt concentration, such that 167 bp NRL displayed a highly ordered ladder
like structure consisting of a two-start helical arrangement in the absence of H1. However,
with linker DNA lengths reaching 43-64 bp (~4-6 DNA turns), complete compaction was not
achieved at physiological salt concentration, and required a linker histone (43). In gist,
whether the co-relation between the NRL and H1 stoichiometry; and chromatin compaction
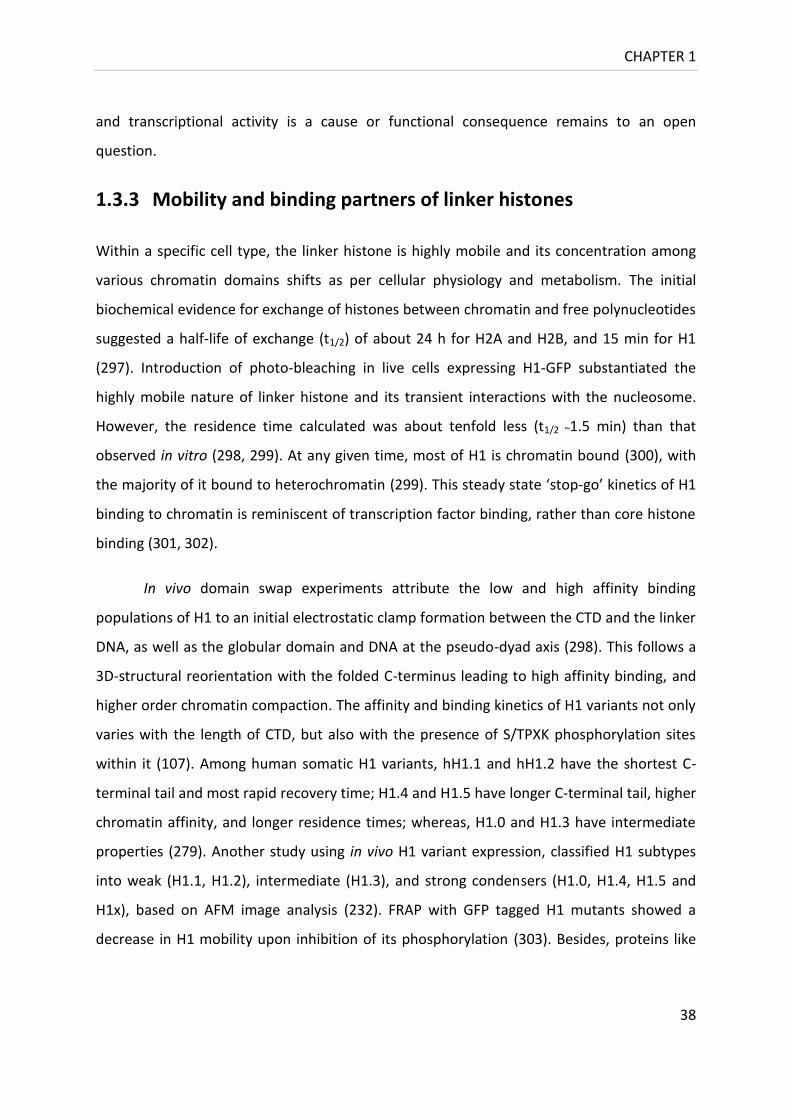
CHAPTER 1
38
and transcriptional activity is a cause or functional consequence remains to an open
question.
1.3.3 Mobility and binding partners of linker histones
Within a specific cell type, the linker histone is highly mobile and its concentration among
various chromatin domains shifts as per cellular physiology and metabolism. The initial
biochemical evidence for exchange of histones between chromatin and free polynucleotides
suggested a half-life of exchange (t1/2) of about 24 h for H2A and H2B, and 15 min for H1
(297). Introduction of photo-bleaching in live cells expressing H1-GFP substantiated the
highly mobile nature of linker histone and its transient interactions with the nucleosome.
However, the residence time calculated was about tenfold less (t1/2 ~1.5 min) than that
observed in vitro (298, 299). At any given time, most of H1 is chromatin bound (300), with
the majority of it bound to heterochromatin (299). This steady state ‘stop-go’ kinetics of H1
binding to chromatin is reminiscent of transcription factor binding, rather than core histone
binding (301, 302).
In vivo domain swap experiments attribute the low and high affinity binding
populations of H1 to an initial electrostatic clamp formation between the CTD and the linker
DNA, as well as the globular domain and DNA at the pseudo-dyad axis (298). This follows a
3D-structural reorientation with the folded C-terminus leading to high affinity binding, and
higher order chromatin compaction. The affinity and binding kinetics of H1 variants not only
varies with the length of CTD, but also with the presence of S/TPXK phosphorylation sites
within it (107). Among human somatic H1 variants, hH1.1 and hH1.2 have the shortest C-
terminal tail and most rapid recovery time; H1.4 and H1.5 have longer C-terminal tail, higher
chromatin affinity, and longer residence times; whereas, H1.0 and H1.3 have intermediate
properties (279). Another study using in vivo H1 variant expression, classified H1 subtypes
into weak (H1.1, H1.2), intermediate (H1.3), and strong condensers (H1.0, H1.4, H1.5 and
H1x), based on AFM image analysis (232). FRAP with GFP tagged H1 mutants showed a
decrease in H1 mobility upon inhibition of its phosphorylation (303). Besides, proteins like
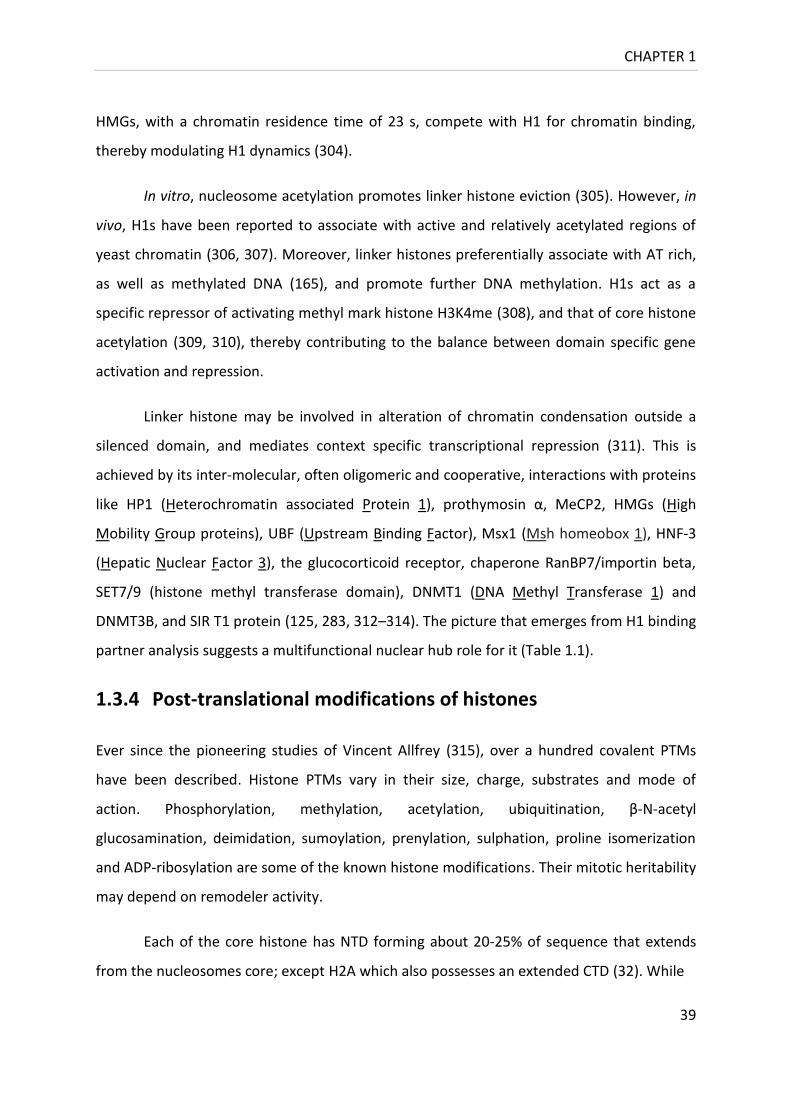
CHAPTER 1
39
HMGs, with a chromatin residence time of 23 s, compete with H1 for chromatin binding,
thereby modulating H1 dynamics (304).
In vitro, nucleosome acetylation promotes linker histone eviction (305). However, in
vivo, H1s have been reported to associate with active and relatively acetylated regions of
yeast chromatin (306, 307). Moreover, linker histones preferentially associate with AT rich,
as well as methylated DNA (165), and promote further DNA methylation. H1s act as a
specific repressor of activating methyl mark histone H3K4me (308), and that of core histone
acetylation (309, 310), thereby contributing to the balance between domain specific gene
activation and repression.
Linker histone may be involved in alteration of chromatin condensation outside a
silenced domain, and mediates context specific transcriptional repression (311). This is
achieved by its inter-molecular, often oligomeric and cooperative, interactions with proteins
like HP1 (Heterochromatin associated Protein 1), prothymosin α, MeCP2, HMGs (High
Mobility Group proteins), UBF (Upstream Binding Factor), Msx1 (Msh homeobox 1), HNF-3
(Hepatic Nuclear Factor 3), the glucocorticoid receptor, chaperone RanBP7/importin beta,
SET7/9 (histone methyl transferase domain), DNMT1 (DNA Methyl Transferase 1) and
DNMT3B, and SIR T1 protein (125, 283, 312–314). The picture that emerges from H1 binding
partner analysis suggests a multifunctional nuclear hub role for it (Table 1.1).
1.3.4 Post-translational modifications of histones
Ever since the pioneering studies of Vincent Allfrey (315), over a hundred covalent PTMs
have been described. Histone PTMs vary in their size, charge, substrates and mode of
action. Phosphorylation, methylation, acetylation, ubiquitination, β-N-acetyl
glucosamination, deimidation, sumoylation, prenylation, sulphation, proline isomerization
and ADP-ribosylation are some of the known histone modifications. Their mitotic heritability
may depend on remodeler activity.
Each of the core histone has NTD forming about 20-25% of sequence that extends
from the nucleosomes core; except H2A which also possesses an extended CTD (32). While
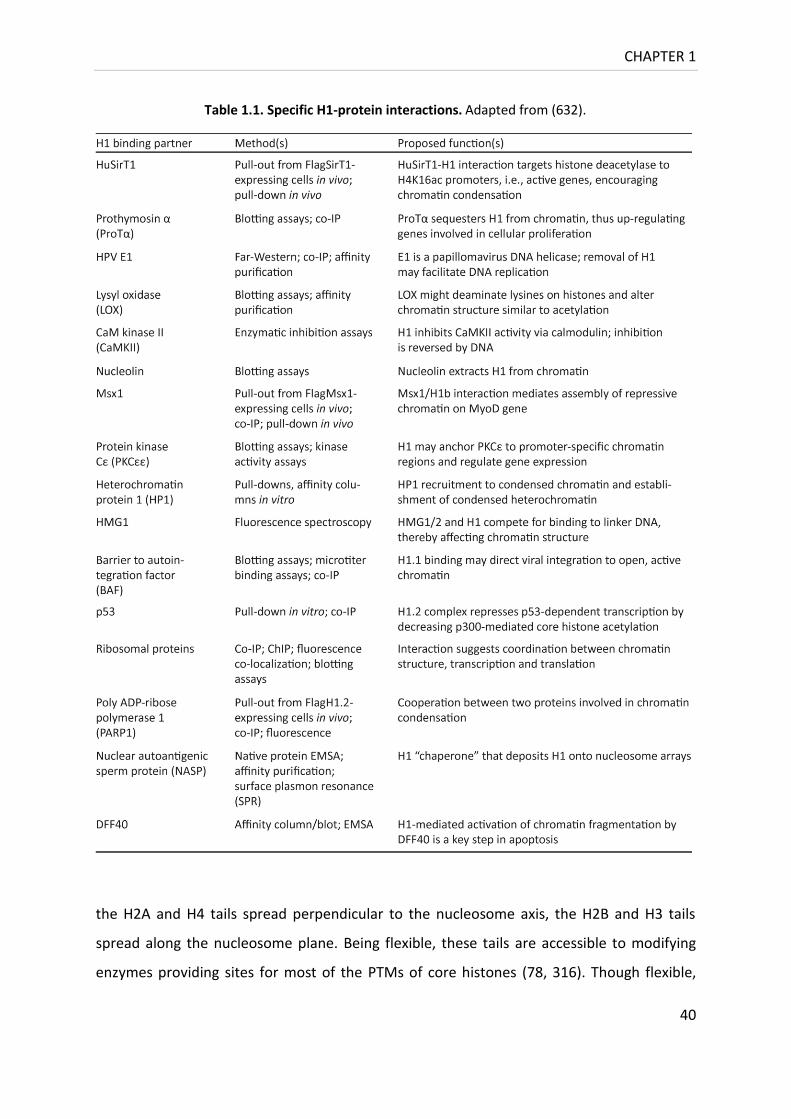
CHAPTER 1
40
the H2A and H4 tails spread perpendicular to the nucleosome axis, the H2B and H3 tails
spread along the nucleosome plane. Being flexible, these tails are accessible to modifying
enzymes providing sites for most of the PTMs of core histones (78, 316). Though flexible,
Table 1.1. Specific H1-protein interactions. Adapted from (632).

CHAPTER 1
41
histone tails might adopt defined secondary and tertiary structure (317–319). Histone tail
modifications may also regulate histone-histone, histone-DNA, histone-other factor, and
inter-nucleosomal contacts (176). Besides core histone tails, PTMs have also been identified
in the core histone fold domains involved in formation of the lateral surface of the
nucleosome, like H3K56ac in yeast (320).
Histone acetylation occurs exclusively at lysine residues (Figure 1.18). Since, it is
governed by the simultaneous presence of HDACs (Histone Deacetylases) and HATs (Histone
Acetyl Transferases) in the cell, acetylation is a dynamic modification with a high turn-over
rate, such as in circadian rhythms (321). Because histone acetylation is not mitotically
heritable, it may rather be considered as a chromatin mark instead of an epigenetic mark.
Several transcriptional co-activators including HATs, BET nuclear factors (Bromo and Extra
Terminal domain proteins like BRD2, BRD4 and BDF1), and SWI/SNF remodeling factors
(BRM1 and BRG1) have bromo-domains (~70 kDa) that bind acetylated histones (Figure
1.19). In general, histone acetylation promotes open chromatin; thereby facilitating
replication, repair, recombination, and transcription by H1 eviction. Moreover, deletion of
N-terminal core histone tails, which are HAT substrates, abrogates the effect (322–325).
Figure 1.18. An illustration of the acetylation state of the NTD of
core histones (not to scale). Adapted from (633).
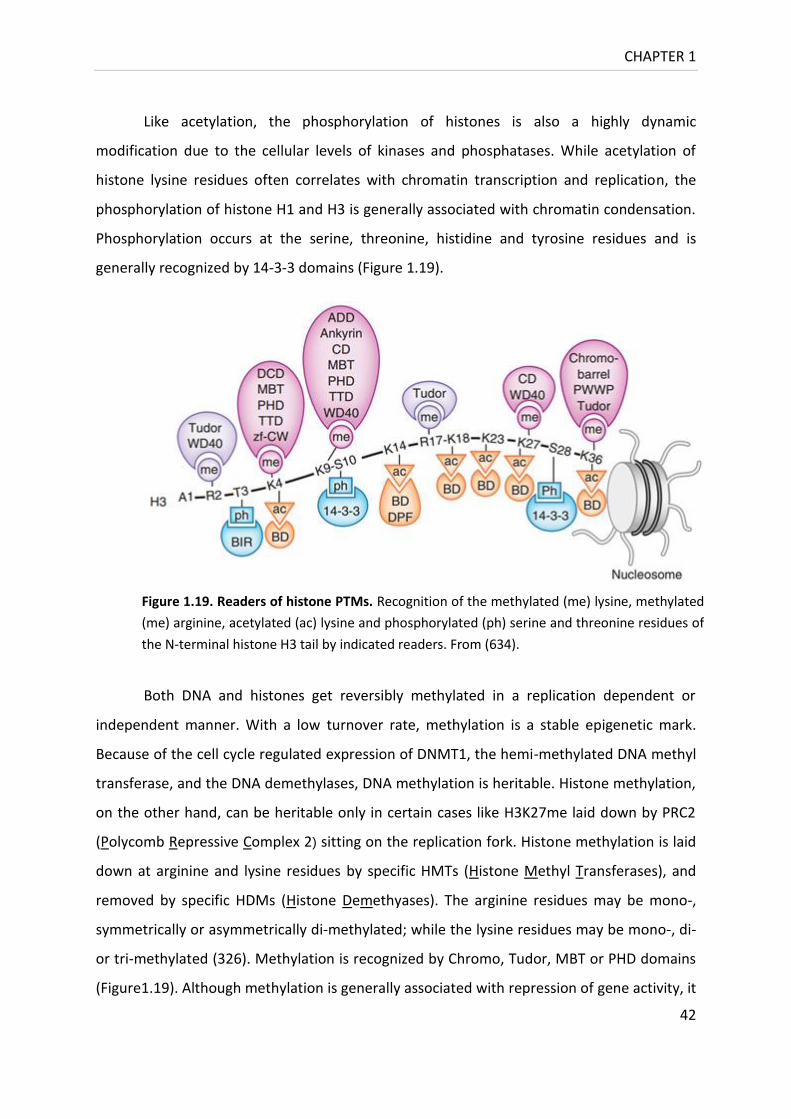
CHAPTER 1
42
Like acetylation, the phosphorylation of histones is also a highly dynamic
modification due to the cellular levels of kinases and phosphatases. While acetylation of
histone lysine residues often correlates with chromatin transcription and replication, the
phosphorylation of histone H1 and H3 is generally associated with chromatin condensation.
Phosphorylation occurs at the serine, threonine, histidine and tyrosine residues and is
generally recognized by 14-3-3 domains (Figure 1.19).
Both DNA and histones get reversibly methylated in a replication dependent or
independent manner. With a low turnover rate, methylation is a stable epigenetic mark.
Because of the cell cycle regulated expression of DNMT1, the hemi-methylated DNA methyl
transferase, and the DNA demethylases, DNA methylation is heritable. Histone methylation,
on the other hand, can be heritable only in certain cases like H3K27me laid down by PRC2
(Polycomb Repressive Complex 2) sitting on the replication fork. Histone methylation is laid
down at arginine and lysine residues by specific HMTs (Histone Methyl Transferases), and
removed by specific HDMs (Histone Demethyases). The arginine residues may be mono-,
symmetrically or asymmetrically di-methylated; while the lysine residues may be mono-, di-
or tri-methylated (326). Methylation is recognized by Chromo, Tudor, MBT or PHD domains
(Figure1.19). Although methylation is generally associated with repression of gene activity, it
Figure 1.19. Readers of histone PTMs. Recognition of the methylated (me) lysine, methylated
(me) arginine, acetylated (ac) lysine and phosphorylated (ph) serine and threonine residues of
the N-terminal histone H3 tail by indicated readers. From (634).
CHAPTER 1
43
can alter expression in a context specific way. For example, H3K4me is associated with
active chromatin; H3K9me3 with constitutive heterochromatin, and H3K9me1, H3K9me2
and H3K27me with facultative heterochromatin (327). In budding yeast, three prominent
histone methylation marks are laid, i.e., on histone H3- K4 (KMT2/SET1), K36 (KMT3/SET2),
and K79 (KMT4/DOT1) (328). However, the repertoire is functionally enhanced in higher
eukaryotes, pointing towards the importance of this modification in gene regulation.
1.3.4.1 Linker histone modifications
The H1 post-translational modifications reported till date include acetylation, methylation,
phosphorylation, ADP-ribosylation, formylation and ubiquitination (Table 1.2). Many of the
modifications which influence nucleosomal DNA binding are located within the globular
domain of various linker histone subtypes (Table 1.2) (329). Specific post-translational
modifications of linker histone are linked to timing of replication and mitosis (330, 331).
1.3.4.1.1 Phosphorylation
Phosphorylation and dephosphorylation is a common regulatory mechanism for protein
function and cell cycle regulation, with H1 as an atypical example (332–334). H1 is the
preferred kinase substrate of dephosphorylated p34cdc2, which forms a part of MPF
(mitosis promoting factor) (335). Levels of H1 phosphorylation are usually lowest in G1 and
increase continuously during S and G2, attaining a high in late G2 (336). It may be enticing to
view the regulation of H1-chromatin binding by the levels of H1 phosphorylation.
Simplistically, the phosphorylation of linker histone renders it less basic, influencing the DNA
protein interactions negatively, in turn enhancing the mobility of H1 within the nucleus and
inducing DNA replication (337) and transcription (338). Based on antibody studies, it has
been proposed that the phosphorylation of H1 mediates initial transient chromatin
decondensation allowing access to DNA binding proteins (339). However, brief examination
of available data suggests that while a low degree of interphase phosphorylation of H1 CTD
decreases its binding affinity leading to a transcriptionally poised chromatin (340, 341), a
high degree of mitotic H1 phosphorylation correlates with decrease in linker histone
mobility accompanied by chromosome condensation and segregation (87, 303, 334).

CHAPTER 1
44
Bradbury and co-workers first showed that the linker histone phosphorylation
increases during the cell cycle, attaining a peak at metaphase and drops drastically
thereafter, using an ingenious combination of phase contrast microscopy, radioactive
labeling and separation of histones (87). It was soon realized that the short tail motifs of H1
contain consensus K[S/T]P or [S/T]PXZ motifs (where X is any amino acid and Z is a basic
amino acid), recognized for phosphorylation by CDC family kinases (342). The kinase activity
of CDK’s (cyclin dependent kinases) determines DNA replication and chromosome
segregation (343). CDK activation requires the binding of specific regulatory subunit of cdc
family (Cell Division Cyclins), named for their cyclic expression during various phases of cell
cycle. The levels of H1 phosphorylation appear to depend on the relative abundance of
protein phosphatase 1 and Cdk1 (Cdc2)/Cyclin B kinase within the cell (344, 345).
Unlike other histones, it is generally held that for H1, the number of sites
phosphorylated, as opposed to particular residues phosphorylated, determines cellular
outcomes (346). For example, in Tetrahymena, H1 phosphorylation mimics its partial
removal thereby regulating transcription akin to a H1 deletion strain (338). The
phosphorylation of linker histones by Cdk1/Cyclin B disrupts its C-terminal binding to HP1α.
This decreases the affinity of HP1 to heterochromatin and promotes efficient cell cycle
progression (347). The phosphorylation of H1.4, the most conserved linker histone variant,
is concentrated at active 45S pre-rRNA gene promoters and is responsive to differential
steroid hormone response elements. Moreover, specific sites within H1 variants H1.2 and
H1.4 are exclusively phosphorylated in mitosis, whereas others are modified in both mitosis
and interphase (348). Similarly, different H1 subtypes from HeLa cells show diversity in CTD
phosphorylation before and after onset of DNA replication (349, 350). In an in vitro SV40
minichromosome system, both G0-H1 and M-H1 showed reduced replication efficiency
compared to S-H1 (351). Further, a decrease in H1 phosphorylation in tsBN2 mutants results
in incomplete DNA replication (352).
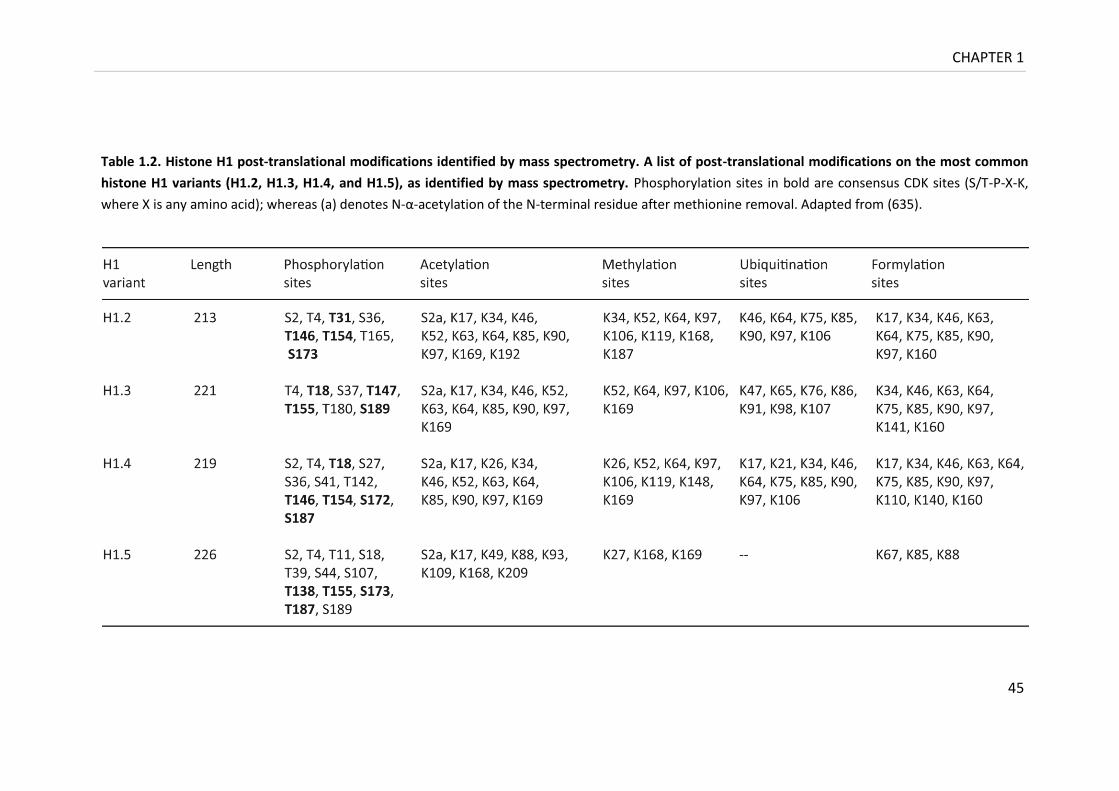
CHAPTER 1
45
Table 1.2. Histone H1 post-translational modifications identified by mass spectrometry. A list of post-translational modifications on the most common
histone H1 variants (H1.2, H1.3, H1.4, and H1.5), as identified by mass spectrometry. Phosphorylation sites in bold are consensus CDK sites (S/T-P-X-K,
where X is any amino acid); whereas (a) denotes N-α-acetylation of the N-terminal residue after methionine removal. Adapted from (635).
CHAPTER 1
46
Not-withstanding the foregoing, the existence of conflicting data about the influence
of this cell cycle dependent modification on chromatin condensation is baffling (336). On
the one hand, linker histone phosphorylation was reported to promote chromatin
decondensation in Tetrahymena amitotic nucleus, sea urchin sperm, and chicken
erythrocytes (353–355). However, on the other hand, linker histone phosphorylation has
been positively related with chromatin condensation in studies involving temperature
sensitive (ts) growth mutants of FM3A (mouse) and BN2 (baby hamster kidney cells) (334,
352, 356), as well as kinase inhibition by staurosporine, and topoisomerase II inhibition by
VM26 (357, 358). Also, inhibition of dephosphorylation by protein phosphatase 1 and 2A
inhibitors like okadaic acid, calyculin A and fostriecin induced chromatin condensation
resulting in premature entry into mitosis (359–361). Similarly, treatment of p34cdc2 ts
kinase mutants with phosphatase inhibitors resulted in fully condensed chromosomes (362).
Although phosphorylation was one of the first modifications investigated intensively,
the advent of mass spectrometry has been a ‘game-changer’ in rejuvenating the interest in
phosphorylation analysis (363).
1.3.4.1.2 Other linker histone modifications
Linker histone undergoes several PTMs (Table 1.2), but most remain functionally
uncharacterized. The acetylation of H1.4K34 by HAT GCN5 which occurs throughout the cell
cycle (364), and affects transcription positively is the only well characterized H1 acetylation.
H1.4K34ac, along with H3K4me3, mobilizes H1 and promotes recruitment of the GTF- TFIID
at the promoters. In contrast, the lysine methylation of linker histone is known to cause
transcriptional repression (365). Besides, O-Glycosylation of H1 by O-GlcNAc transferase
(OGT), which transfers a N-acetyl-glucosamine (O-β-GlcNAc) sugar group to Ser or Thr
residues, and its removal by O-GlcNAc transferase (O-GlcNAcase), has been suggested to
regulate mitotic progression, and cellular stress response, possibly by countering
phosphorylation of H1 and H3 (366, 367). Furthermore, the selective ADP-ribosylation of H1
has been long known, but the exact mode of its action remains elusive. Besides, linker
histone variants also show site specific formylation and ubiquitination, the mechanistic
details of which remain unknown.

CHAPTER 1
47
1.3.4.2 Post-translational modifications of core histones
The core histone PTMs can influence chromatin compaction either by altering the
electrostatic interaction with DNA or by acting as docking sites for the recruitment of other
chromatin associated proteins (Figure 1.20). For example, phosphorylation of H3 and H4
occur mainly during mitosis and G2/M arrested cells display a general loss of acetylation in
all histones whereas H2A modifications are constant throughout cell cycle. It is plausible to
consider that the modifications of core histones might determine the association of linker
histone to chromatin either directly by blocking a binding site or providing one, or indirectly
by recruiting a secondary binding partner which inhibits or promotes H1 binding. A tight cell
cycle regulation of histone modifications, right from their incorporation to their
degradation, maintains cellular homeostasis.
1.3.4.3 Cross-talk between PTMs
The existence of an extensive distance based cross-talk of histone modifications, referred as
the ‘histone code’ or histone language, provides the cell with endless possibilities for
modulation of chromatin compaction and gene activity (14, 368). A tremendous degree of
synergism as well as antagonism has been discovered between the various histone
modifications that determines the local structural and functional potential of a chromatin
region (Figure 1.21) (369). Individually, or in various combinations, these marks can
generate a downstream response like DNA compaction, repair, transcription or cellular
apoptosis by altering ionic DNA-protein or protein-protein interactions, and providing
recruitment sites for effector proteins (‘readers’). As the readers may participate in a
number of overlapping pathways, some modifications might be necessary for a particular
pathway, but they might not be sufficient on their own for another (370). The cross-talk
involving histone PTMs may be classified into five groups.
H4 PTMs: The deacetylation of H4K16 is required for Sir3 binding and spread of
heterochromatin. In contrast, the acetylation of H4K16 is needed for binding of Dot1, an
HMT which methylates H3K79. H3K79me, in turn, is required for the establishment of
heterochromatin boundary as well as transcriptional elongation (79). During mitosis,
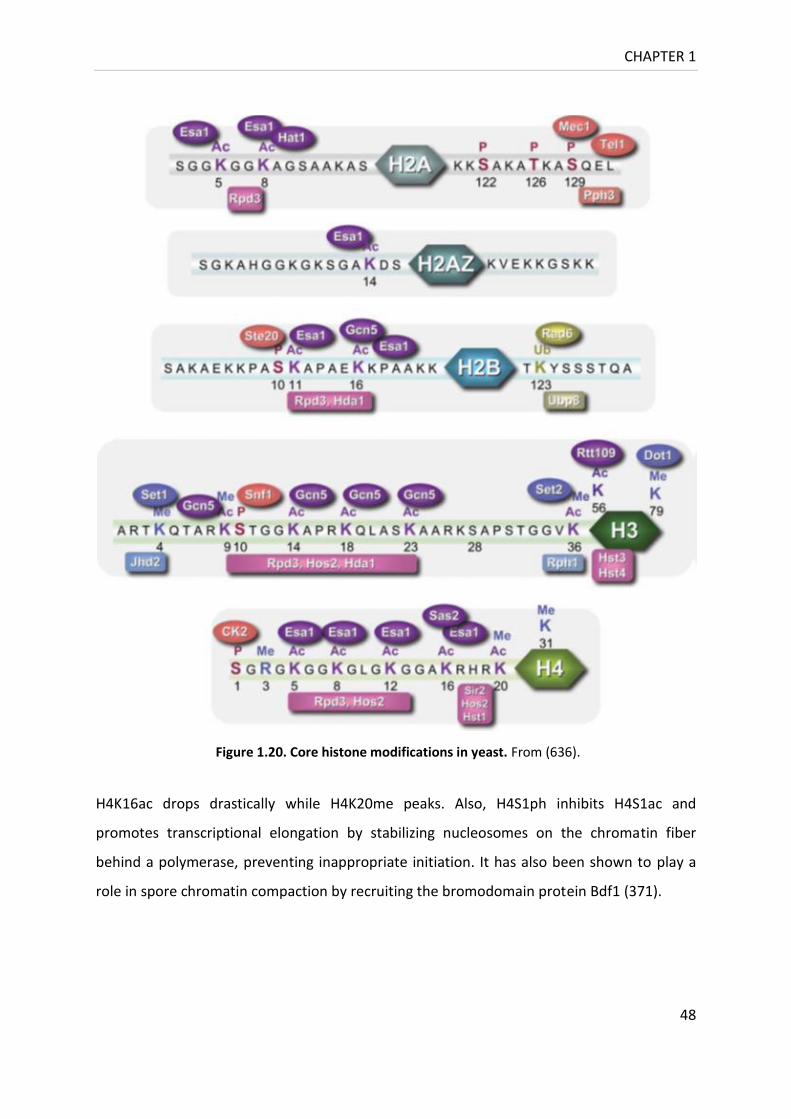
CHAPTER 1
48
H4K16ac drops drastically while H4K20me peaks. Also, H4S1ph inhibits H4S1ac and
promotes transcriptional elongation by stabilizing nucleosomes on the chromatin fiber
behind a polymerase, preventing inappropriate initiation. It has also been shown to play a
role in spore chromatin compaction by recruiting the bromodomain protein Bdf1 (371).
Figure 1.20. Core histone modifications in yeast. From (636).
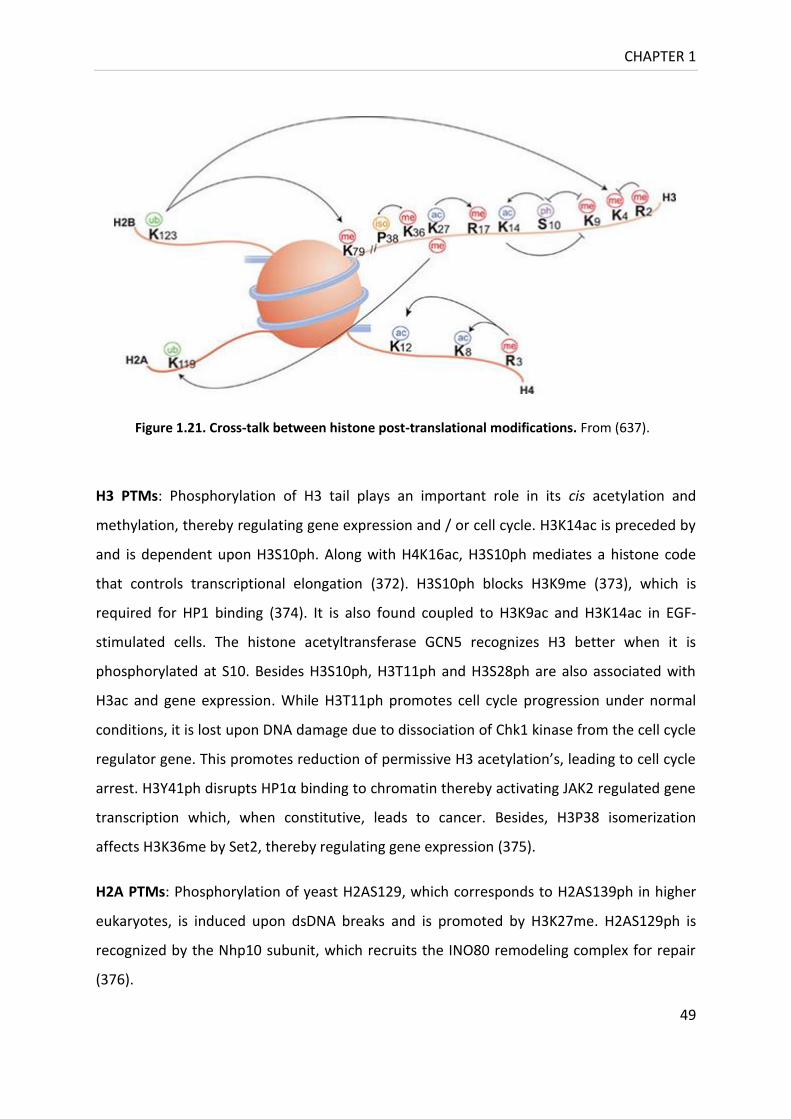
CHAPTER 1
49
H3 PTMs: Phosphorylation of H3 tail plays an important role in its cis acetylation and
methylation, thereby regulating gene expression and / or cell cycle. H3K14ac is preceded by
and is dependent upon H3S10ph. Along with H4K16ac, H3S10ph mediates a histone code
that controls transcriptional elongation (372). H3S10ph blocks H3K9me (373), which is
required for HP1 binding (374). It is also found coupled to H3K9ac and H3K14ac in EGF-
stimulated cells. The histone acetyltransferase GCN5 recognizes H3 better when it is
phosphorylated at S10. Besides H3S10ph, H3T11ph and H3S28ph are also associated with
H3ac and gene expression. While H3T11ph promotes cell cycle progression under normal
conditions, it is lost upon DNA damage due to dissociation of Chk1 kinase from the cell cycle
regulator gene. This promotes reduction of permissive H3 acetylation’s, leading to cell cycle
arrest. H3Y41ph disrupts HP1α binding to chromatin thereby activating JAK2 regulated gene
transcription which, when constitutive, leads to cancer. Besides, H3P38 isomerization
affects H3K36me by Set2, thereby regulating gene expression (375).
H2A PTMs: Phosphorylation of yeast H2AS129, which corresponds to H2AS139ph in higher
eukaryotes, is induced upon dsDNA breaks and is promoted by H3K27me. H2AS129ph is
recognized by the Nhp10 subunit, which recruits the INO80 remodeling complex for repair
(376).
Figure 1.21. Cross-talk between histone post-translational modifications. From (637).
CHAPTER 1
50
H2B PTMs: The deacetylation of H2BK11 by HDAC Hos3 is required for H2BS10ph, which in
turn is needed for apoptotic chromosome condensation. Also, H2BUb is required for
H3K4me3. Besides, H2BUb inhibits Aurora B kinase which phosphorylates H3S10 and H3S28.
H1 PTMs: Isoform specific phosphorylation of H1.4S27 by Aurora B kinase blocks HP1α
binding to H1.4K26me2 (377, 378). Also, Pin1 mediated proline isomerization of
phosphorylated H1 cooperates with the acetylation of core histones to negatively regulate
the binding of H1 to chromatin (331).
1.4 The evolution of chromatin research
1.4.1 Methods in chromatin biology
Though the prospect of understanding chromatin structure presents a fascinating
opportunity to understand cellular function, it simultaneously presents a daunting technical
challenge. A plethora of both low and high resolution techniques, both individually and in
various combinations, have been extensively used to study the structure and function of
chromatin and the epigenomic landscape (Figure 1.22). These include biochemical
(chromatography, analytical ultracentrifugation, antibody and enzyme interventions like
DNase I and MNase digestions, Western blots, immune-precipitations, gel electrophoresis
(AGE, PAGE, AU/AUT-PAGE), FACS, designer chemistry, in vitro reconstitutions, end-
labelling, chemical or UV-laser crosslinking and footprinting), genetic (manipulations,
microarray hybridization, and parallel sequencing), sophisticated imaging (dye staining and
banding, fluorescent probes, electron microscopy (EM), cryo-EM, soft touch AFM, FRAP,
FCCS and image analysis (379), structural (LC-MS/MS, XRD, SPR, NMR, elastic
measurements, optical tweezers), and computational methods (bioinformatics, nano-
engineering and theoretical studies) (380, 381).
As technology advances and disciplines bridge, novel opportunities are created for
innovative synergism, in devising previously inconceivable hybrid experimental systems to
address fundamental biological questions. High throughput sequencing has been one of the
most enabling methods for a biologist. Facilitated by advances in data handling and
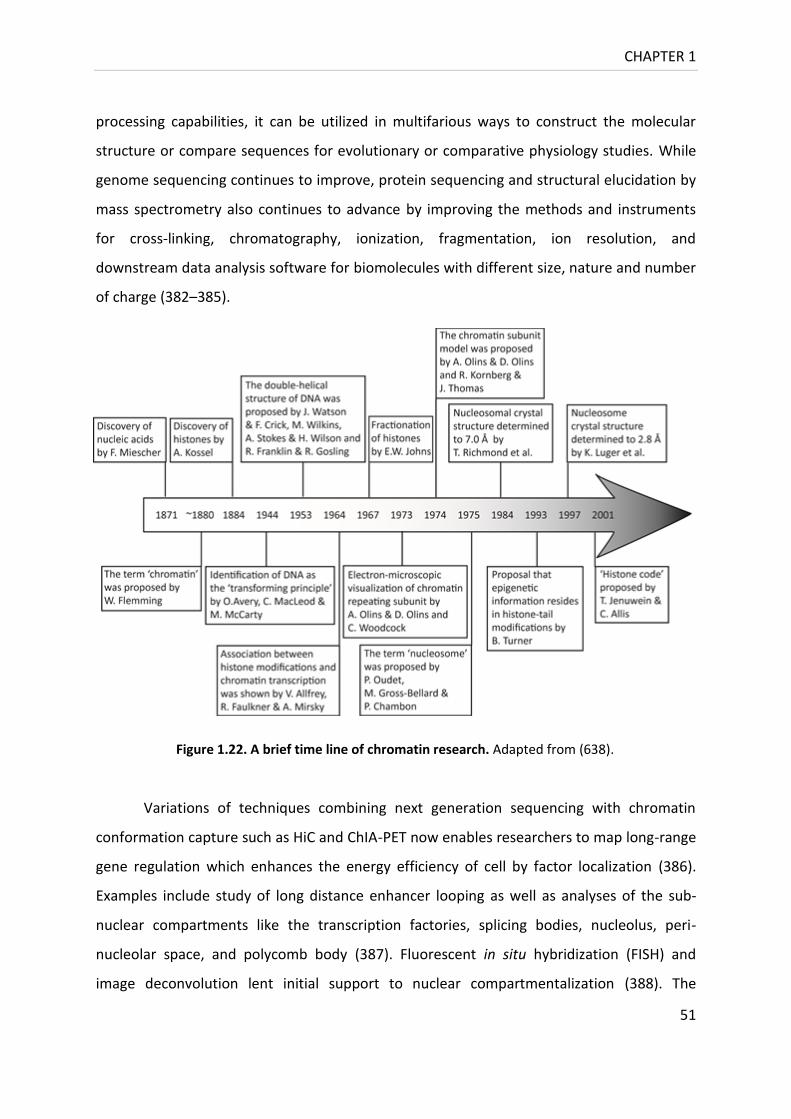
CHAPTER 1
51
processing capabilities, it can be utilized in multifarious ways to construct the molecular
structure or compare sequences for evolutionary or comparative physiology studies. While
genome sequencing continues to improve, protein sequencing and structural elucidation by
mass spectrometry also continues to advance by improving the methods and instruments
for cross-linking, chromatography, ionization, fragmentation, ion resolution, and
downstream data analysis software for biomolecules with different size, nature and number
of charge (382–385).
Variations of techniques combining next generation sequencing with chromatin
conformation capture such as HiC and ChIA-PET now enables researchers to map long-range
gene regulation which enhances the energy efficiency of cell by factor localization (386).
Examples include study of long distance enhancer looping as well as analyses of the sub-
nuclear compartments like the transcription factories, splicing bodies, nucleolus, peri-
nucleolar space, and polycomb body (387). Fluorescent in situ hybridization (FISH) and
image deconvolution lent initial support to nuclear compartmentalization (388). The
Figure 1.22. A brief time line of chromatin research. Adapted from (638).
CHAPTER 1
52
transcription factories were first identified as sites teeming with RNA polymerase II and
variant concentrations of different transcription factors, where select genes from different
chromosomes could come close together for coordinated gene expression (389). Aberrant
fusions between genes making close contact at these sites has recently been associated
with cancers, which could be identified by the 3D shape of their genome (390).
In the past, phylogenetic trees were constructed based on a single conserved bio-
molecular feature like rRNA. Recent trends show a preference for whole proteome based
phylogenetics. In times to come, scientific understanding of epigenetic marks may advance
well enough to predict facets of individual or species evolution by epigenetic landscape
determination using techniques like chromo-genome and 3D karyotype mapping (391–393).
1.4.2 A case for reductionist approach in an era of systems biology
A system comprises units, which when better understood, enhance the overall robustness
of the system module configuration (394). However, the overlapping nature of system
modules renders the information susceptible to a weak link, thus compromising its
resolution. Therefore, for a high confidence assignment of intra and inter-connectivity of
components within a module, accurate models based on temporal and spatial resolution of
expression and interactions are required (395). A reductionist approach based on dissecting
the sub-systems to individual components, while simultaneously modifying the bigger
picture to increase authenticity of the system construct, can thus be argued for. This
approach also enables hypothesis driven research with a clear rationale.
Genome sequencing provides information encoded in DNA, but it does not
completely define all cellular processes. Even though, it has led to significant fundamental
and pharmacological advances; a genome sequencing rush could not have provided
elaborate biochemical information. Since proteome, unlike genome, is dynamic and at the
helm of cellular business affairs, a proteomics approach to systems biology could deliver a
finer understanding of cellular networks. Proteins on their own, or in complex with other
proteins and / or non-coding RNA’s, may influence the regulation of gene expression. But,
CHAPTER 1
53
proteins, unlike DNA, which is relatively stable; may have a dynamic spatio-temporal
abundance, and isoform nature, thereby rendering many a proteomic experiments tedious.
Using a multi-faceted approach, the biological information acquired can be
substantiated by alternate experimental techniques, thus pushing forward our boundaries
of knowledge. Biological problems often require problem specific approaches and utilizing a
single technique could be of value when considering the error rate normalization. However,
addressing a query in multiple ways, and integrating results from various reductionist
approaches into the broader system-wise picture may improve the confidence of final
results (396). Although the choice of an experimental design for a top-down or bottom-up
proteomics approach might be based on necessity, instrumentation, and expertise
constraints (397); a reductionist approach often provides finer results. This obviates the
garbage in-garbage out trouble with characterizing the whole at once. Moreover, it also
enables the continuous integration of ‘cleaner’ molecular results for further modeling and
simulation (119).
1.4.2.1 Affinity coupled MS, the gold standard for protein characterization
Purification of a protein may enable the characterization of its various biochemical and
biophysical properties. Features like the abundance, interaction partners, localization and
modification status of a protein can be determined by techniques like Western blotting,
immune-precipitation, immune-microscopy, affinity purification and mass-spectrometry.
Protein purification often involves steps that exploit its size, shape and / or charge
properties. Availability of a suitable antibody allows isolation of corresponding antigen as an
immune-precipitate or bead-reactome, using antibody immobilized on beads. Bead based
immobilization may enhance the stability of proteins (398), and can be used to generate an
affinity matrix for purification of antigen or antibody (399, 400). However, in case of newly
discovered proteins with no available antibody or for proteins with low immunogenicity,
epitope tagging may assist purification and characterization. Based upon the downstream
application of interest, there are a variety of epitopes that can be incorporated by gene
fusion. For example: a polypeptide tag like HIS (Hexa-histidine), c-myc (EQKLISEEDL), FLAG
(DYKDDDDK), TAP (Tandem Affinity Purification), SF (Streptavidin: WSAPQFEK), HA

CHAPTER 1
54
(Heamoglutannin: YPYDVPDYA); or a protein tag like GST (Glutathione S-Transferase), Halo,
GFP (Green Fluorescent Protein), or protein A (401) could be used. Co-IP is perhaps the
single most important application of epitope tagging. It can be used to verify the expression
of a protein in a tissue, purify it or perform an interaction analysis (402, 403).
H1 was found to physically interact with the RFB (Replication Fork Barrier binding)
protein Fob1p (Fork Blocking less 1) by affinity capture mass spectrometry using a Fob1-TAP
tagged strain (404). Interestingly, Fob1p not only induces silencing by recruiting the RENT
silencing complex to rDNA, but is also required for contraction or expansion of the rDNA
repeats by stimulating recombination, and recruiting the condensin complex (405). Similarly,
the Co-IP of H1b with Flag-Msx1 established the cooperative interaction of two proteins.
Moreover, the interaction between H1b and Msx1 was found to down regulate MyoD
(Myogenic Differentiation), the transcription factor involved in muscle differentiation (406).
Although highly specific polyclonal or monoclonal antibodies can be raised against
antigenic peptides, in certain cases presence of a neighboring modification in native protein
sequence can block the access of antibody to the site of interest (373). Such a masking
effect of epitope was observed when a carboxy-terminally tagged version of Hho1p (3x HA
or 3X myc) failed to reproduce the reinforcement of barrier activity provided by WT protein
(139). Therefore, it might be relevant to raise antibody against the protein of interest, rather
than using the epitope specific peptide antibody. Also, latter is generally less stable than the
anti-protein antibody, and might also suffer occlusion by neighboring stereochemistry.
Besides cross-reactivity with other sites on the same or other proteins in mixture, and
variable specificity might be the problems faced during PTM identification using antibodies.
Identification of proteins and their post-translational modifications with mass-
spectrometry is unbiased to structural variation. Mass-spectrometry also enables
elucidation of the three dimensional structure of a macromolecular complex, which is
otherwise difficult to solve at high resolution by standard structural methods (407, 408). In
2001, the first novel histone mark was discovered by MS, H4R3me (409). This was soon
followed by the first comprehensive bottom up analysis of histones (H3 and H4), published
CHAPTER 1
55
by Burlingame and colleagues in 2002 (410, 411), literally opening up flood gates for LC-
MS/MS based proteome analysis (412–414).
Phosphorylation is one of the most intensely investigated PTMs for several reasons.
First, it is involved in diverse cellular processes. Second, a staggering number of kinases and
phosphatases are encoded by most genomes. Third, the extent of the proteome which
shows spatio-temporally regulated phosphorylation is enormous. Fourth, the throughput of
phosphorylation research has enhanced in the recent past because of the development of
novel labeling and peptide fragmentation methods in mass spectrometry.
Phosphorylation is a labile modification that shows poor ionization, and is often
detected as a neutral loss of 80 Da or 98 Da corresponding to phosphate group (HPO3) or
phosphoric group (H3PO4) by high energy CID (Collision Induced Dissociation) in combination
with an orbitrap mass analyzer (415). However, confident phosphorylation site identification
is complicated by the fact that it can occur heterogeneously at more than one amino acid
(serine, threonine, histidine, and / or tyrosine) at sub-stoichiometric levels (416).
Nonetheless, in 2001, the usefulness of bottom-up proteomics in monitoring changes in H1
phosphorylation from cells treated with dexamethasone was first demonstrated by Banks
and coworkers (417). In 2006, the identification of seven phosphorylation sites in
Tetrahymena thermophila H1 using stable isotope labeling, IMAC and tandem mass-
spectrometry was jointly reported by Hunt and Allis group (418).
1.4.3 Linker histone purification
Traditionally, histones were purified from nuclei exploiting their selective dissociation from
chromatin with increasing salt concentration, solubility in acids, and / or selective organic
precipitation. Linker histone dissociates from chromatin at 600 mM sodium chloride, and is
found to be soluble in 5% perchloric acid (PA). However, PA did not extract any chromatin
proteins from yeast (419). In fact, sea urchin H1 and human H1 subtypes expressed in yeast
were purified to homogeneity using PA solubilization based on the premise that yeast H1 is
insoluble in PA (291, 420). The existence of a linker histone in yeast was hotly contested due
to conflicting acid solubility and gel mobility evidence (419, 421, 422). A 20 kDa protein,
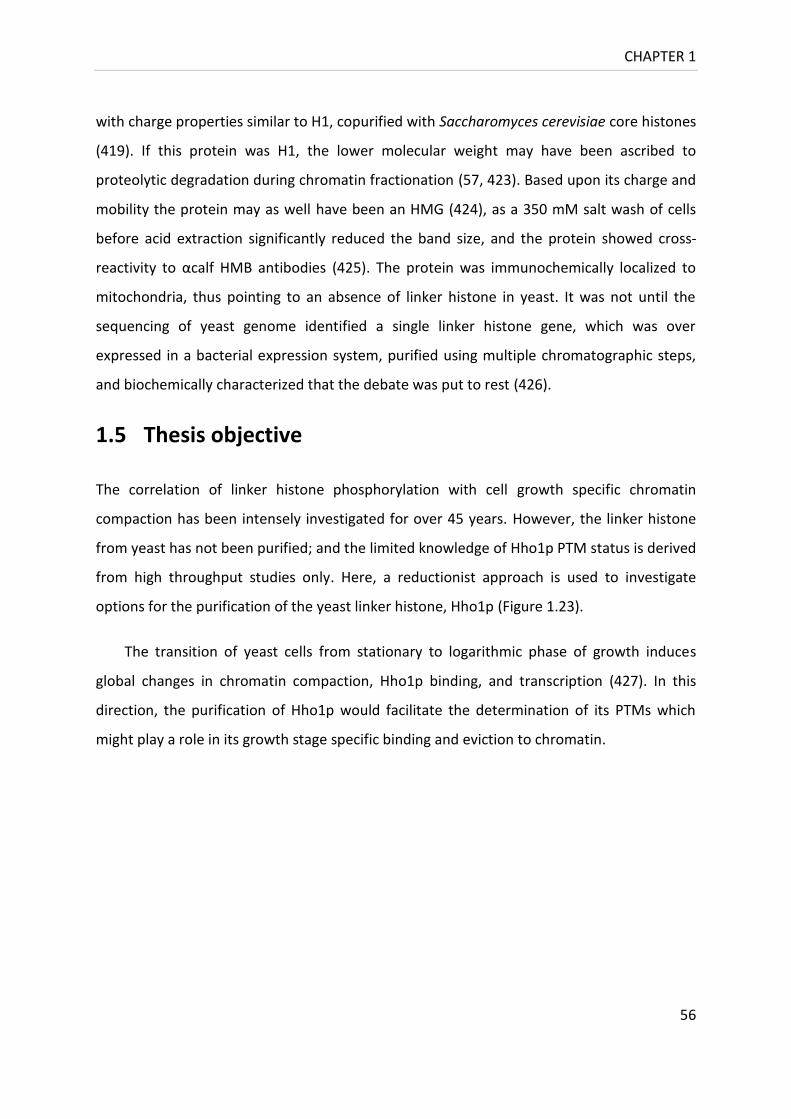
CHAPTER 1
56
with charge properties similar to H1, copurified with Saccharomyces cerevisiae core histones
(419). If this protein was H1, the lower molecular weight may have been ascribed to
proteolytic degradation during chromatin fractionation (57, 423). Based upon its charge and
mobility the protein may as well have been an HMG (424), as a 350 mM salt wash of cells
before acid extraction significantly reduced the band size, and the protein showed cross-
reactivity to αcalf HMB antibodies (425). The protein was immunochemically localized to
mitochondria, thus pointing to an absence of linker histone in yeast. It was not until the
sequencing of yeast genome identified a single linker histone gene, which was over
expressed in a bacterial expression system, purified using multiple chromatographic steps,
and biochemically characterized that the debate was put to rest (426).
1.5 Thesis objective
The correlation of linker histone phosphorylation with cell growth specific chromatin
compaction has been intensely investigated for over 45 years. However, the linker histone
from yeast has not been purified; and the limited knowledge of Hho1p PTM status is derived
from high throughput studies only. Here, a reductionist approach is used to investigate
options for the purification of the yeast linker histone, Hho1p (Figure 1.23).
The transition of yeast cells from stationary to logarithmic phase of growth induces
global changes in chromatin compaction, Hho1p binding, and transcription (427). In this
direction, the purification of Hho1p would facilitate the determination of its PTMs which
might play a role in its growth stage specific binding and eviction to chromatin.
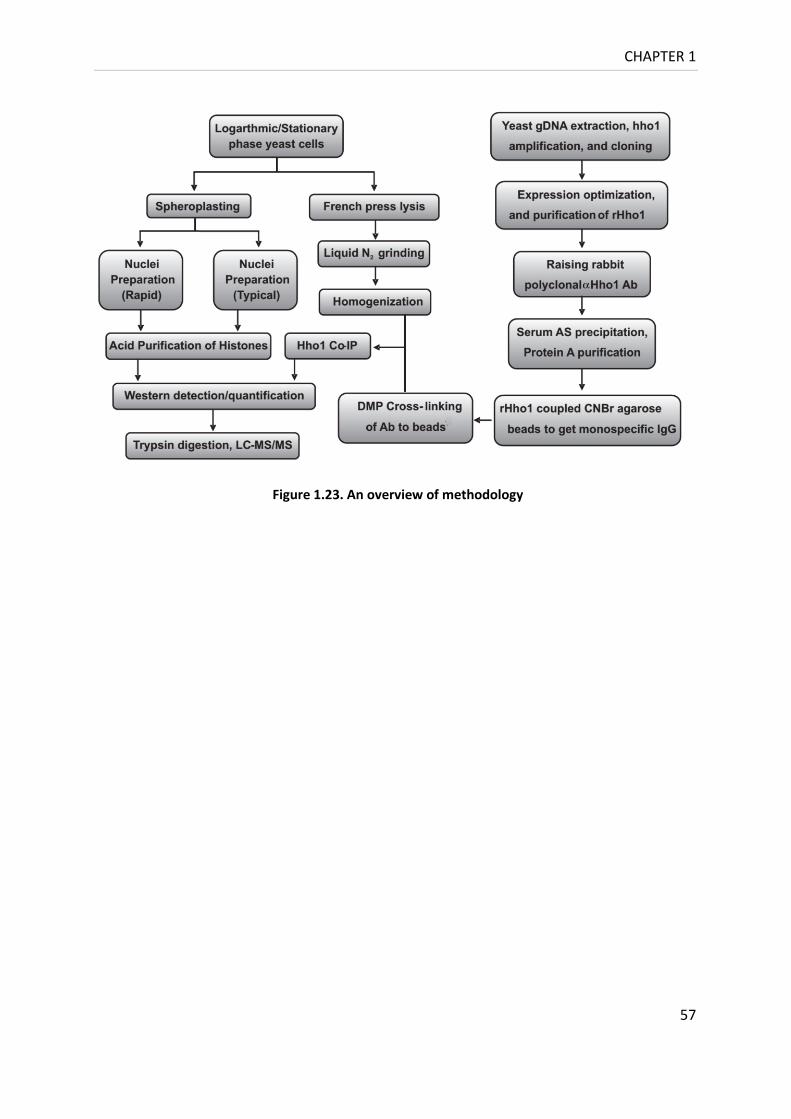
CHAPTER 1
57
Figure 1.23. An overview of methodology

CHAPTER 2
58
2 Purification and Characterization of rHho1p
2.1 Introduction and Objectives
The preparation of a recombinant protein is usually very helpful in the development of an
isolation procedure for the native protein. It may also enable characterization of the
structure-function relationship of a protein. In addition, bacterial heterologous over-
expression allows isolation of the recombinant protein without any post-translational
modifications, and it can therefore be utilized for the generation and purification of
antibody directed against the native protein.
2.2 Materials and Methods
2.2.1 Bacterial Strains and Media
DH5α [E.coli F- endA1 glnV44 thi-1 recA1 relA1 gyrA96 deoR nupG (Φ80dlacZΔM15)
Δ(lacZYA-argF) U169 hsdR17 (rK- mK
+) λ–], and XL10 Gold [endA1 glnV44 recA1 thi-1 gyrA96
relA1 lac Hte Δ(mcrA)183 Δ(mcrCB-hsdSMR-mrr)173 tetr F'[proAB lacIqZΔM15
Tn10(Tetr Amy Cmr)]] (Stratagene) strains were used for cloning. Oneshot® BL21(DE3) pLysS
[E.coli B F- ompT hsdSB(rB- mB
-) dcm+ Tetr gal λ(DE3) endA Hte (pLysS Camr)] (Invitrogen), or
BL21 GOLD (DE3) [E. coli B F– ompT hsdS(rB– mB
–) dcm+ Tetr gal λ(DE3) endA Hte] (Agilent)
strains were used for expression. Bacterial cells were either grown in Luria Bertani (LB)
broth: 1% (w/v) bacto-tryptone, 0.5% (w/v) yeast extract, 1% (w/v) sodium chloride, or 2x
yeast extract tryptone (YT): 1.6% (w/v) bacto tryptone, 1% (w/v) bacto yeast extract, 0.5%
(w/v) sodium chloride, pH 7 with 0.1% (w/v) glucose media, as applicable. 1.5% (w/v) agar
was added to media to prepare plates. Glycerol stocks were maintained at -80 °C in LB
media with 0.5% (w/v) glucose and 15% (v/v) glycerol.
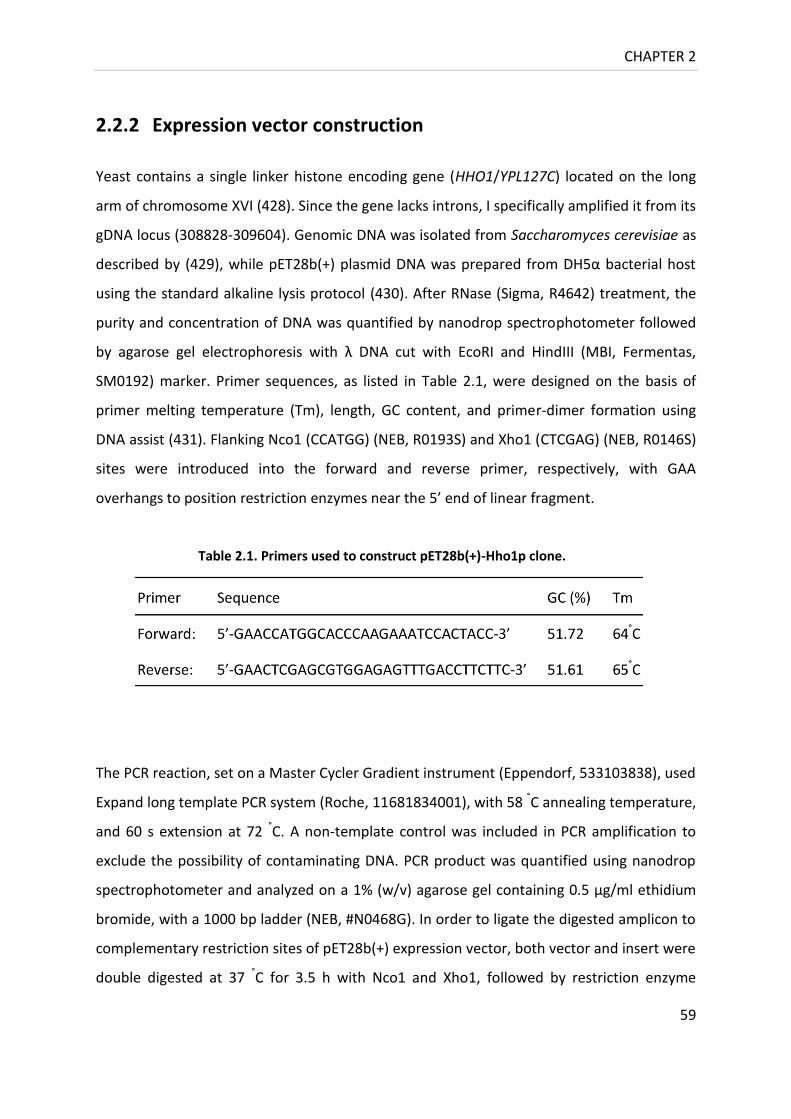
CHAPTER 2
59
2.2.2 Expression vector construction
Yeast contains a single linker histone encoding gene (HHO1/YPL127C) located on the long
arm of chromosome XVI (428). Since the gene lacks introns, I specifically amplified it from its
gDNA locus (308828-309604). Genomic DNA was isolated from Saccharomyces cerevisiae as
described by (429), while pET28b(+) plasmid DNA was prepared from DH5α bacterial host
using the standard alkaline lysis protocol (430). After RNase (Sigma, R4642) treatment, the
purity and concentration of DNA was quantified by nanodrop spectrophotometer followed
by agarose gel electrophoresis with λ DNA cut with EcoRI and HindIII (MBI, Fermentas,
SM0192) marker. Primer sequences, as listed in Table 2.1, were designed on the basis of
primer melting temperature (Tm), length, GC content, and primer-dimer formation using
DNA assist (431). Flanking Nco1 (CCATGG) (NEB, R0193S) and Xho1 (CTCGAG) (NEB, R0146S)
sites were introduced into the forward and reverse primer, respectively, with GAA
overhangs to position restriction enzymes near the 5’ end of linear fragment.
The PCR reaction, set on a Master Cycler Gradient instrument (Eppendorf, 533103838), used
Expand long template PCR system (Roche, 11681834001), with 58 °C annealing temperature,
and 60 s extension at 72 °C. A non-template control was included in PCR amplification to
exclude the possibility of contaminating DNA. PCR product was quantified using nanodrop
spectrophotometer and analyzed on a 1% (w/v) agarose gel containing 0.5 μg/ml ethidium
bromide, with a 1000 bp ladder (NEB, #N0468G). In order to ligate the digested amplicon to
complementary restriction sites of pET28b(+) expression vector, both vector and insert were
double digested at 37 °C for 3.5 h with Nco1 and Xho1, followed by restriction enzyme
Table 2.1. Primers used to construct pET28b(+)-Hho1p clone.

CHAPTER 2
60
deactivation at 65 °C for 20 min. To avoid self-ligation of singly digested template, the vector
was dephosphorylated before insert ligation using Antarctic phosphatase (NEB, M0289S) at
37 °C for 30 min, followed by enzyme deactivation at 65 °C, 5 min. Double digested insert
and vector were eluted from 1% (w/v) low melting agarose gel using Wizard SV gel elution
kit (Promega, A9280). They were ligated at 4 °C, overnight, using T4 ligase (Roche, 716359),
at 3: 1 and 6: 1 molar ratio, respectively. XL10 gold E. coli cells were made chemically
competent to 107 cfu/μg of pUC18 DNA by Inoue method (432). The experimental and
control ligation reactions were transformed into these cells using heat shock treatment (42
°C, 45 s) in a water bath (Labcon, Haake DC10). The transformants were grown in a 37 °C
incubator (Scientific, Series 9000) on LB-agar plates supplemented with 30 μg/ml
kanamycin. The colonies were screened by cracking, and the plasmid DNA was isolated from
clones. The clones were positively confirmed by insert release, and PCR amplification with
GoTaq® Hot Start polymerase (Promega, M5001). Phusion high fidelity DNA polymerase
(NEB, M0530S) was used to amplify the insert for sequencing.
2.2.3 Expression optimization and purification of recombinant
Hho1p
Chemically competent E.coli BL21-GOLD (DE3) or BL21 (DE3)pLysS cells were transformed
with pET28b(+)-HHO1 vector by a 20 or 30 s heat shock at 42 °C, respectively. Transformants
were grown in LB media supplemented with kanamycin (30 μg/ml) with or without
chloramphenicol (35 μg/ml), at 37 °C with continuous shaking in an orbital shaker incubator
(Sanyo). Expression was optimized in 10 ml secondary cultures using either 0.2 or 0.8 mM
IPTG for induction at OD600 of 0.6, followed by growth at either 30 °C or 37 °C for 2, 4 or 6 h
each. Cells were harvested, weighed, and water washed followed by suspension in 1:5 (w/v)
of B-PER (Pierce, 78248) containing 1 mM PMSF (Sigma, 78830), and 0.5 mg/ml lysozyme
(Sigma, L6876) each. Suspension was rotated at RT for 1 h using suspension mixer (BM
Scientific, SM3000), with intermittent vortex using Vortex-Genie® 2 (Scientific Industries,
Inc., ISCISI-0246). The supernatant was collected by a 15 min spin at 14,000 rpm, 4 °C using
Eppendorf 5415D centrifuge with F-45-24-11 rotor. The supernatant was adjusted to 5 mM
magnesium chloride, 1 mM DTT (Bio-rad, 161-0610), and 2.5 μg DNase I (Roche,
CHAPTER 2
61
10104159001) was added per 70 mg starting pellet mass. After a 30 min incubation at 4 °C,
the protein concentration was measured at OD595 as per (433), and 25 μg protein analyzed
per lane on a 12% (w/v) polyacrylamide gel.
Hho1p was over-expressed using optimized conditions in 2-4 l of LB or 2x YT, 0.1%
(w/v) glucose media under antibiotic stress in 5 l Erlenmeyer flasks. The cells were harvested
and water washed using JLA 16.25 rotor on an Allegra 64R centrifuge (Beckman Coulter).
Pellet was suspended at 1: 1 (w/v) of purification buffer (0.02 M HEPES, pH 7.3, 0.2 M
sodium perchlorate, 10% (v/v) glycerol, and 1 mM PMSF) by vigorous vortexing,
accompanied by repeated aspiration with a 10 ml serological pipette. A 0.3 mg/ml final
concentration of lysozyme dissolved in 0.1 mM EDTA was added at 1: 1 (w/v) ratio, and the
suspension was incubated at RT for 10 min with rotation on a Hula Mixer® (Life
Technologies). The total suspension volume was raised to 4: 1 (w/v) by addition of ice-cold
purification buffer, and cell lysis was completed by a single 30 kPsi stroke of French press at
RT. DNase I and magnesium chloride were added to a final concentration of 1 μg/ml and 5
mM, respectively, and the lysate was cleared by a 20,000 rpm, 30 min spin using Avanti JE
centrifuge with JA25.5 rotor (Beckman Coulter). The supernatant was adjusted to 20 mM
imidazole (Sigma, 56750) for IMAC purification on an appropriate affinity resin. To facilitate
the purification, either HisTrap FF, 1 ml (GE Healthcare, 29-0486-31) column coupled to an
ÄKTA FPLC system (GE Healthcare) or HisPurTM Ni2+-NTA resin (Thermo Scientific, 88221)
packed in a Econo-Pac® (Bio-rad, 732-1010) column, run under gravity or with peristaltic
pump P-1 (Pharmacia Biotech, 18-1110-91) was utilized. A systematic step gradient of
imidazole concentration in purification buffer was used to wash-off the non-specifically
bound protein before specific elution of rHho1p. The purified protein was desalted to
eliminate imidazole either using a HiTrap desalting column, 5 ml (GE Healthcare, 29-0486-
84) or 6-8 kDa molecular weight cut off dialysis tubing (SpectraPor, Molecular porous). The
protein was concentrated using Amicon® Ultra- 15 10K centrifugal filter devices (Millipore,
UFC901008), and stored at -20 °C. The Ni2+-NTA beads were regenerated by stripping [5 CV
of 20 mM phosphate (pH 7.4) containing 50 mM EDTA, 0.5 M sodium chloride], and washing
[5 CV each of water and 20 mM phosphate buffer (pH 7.4)], followed by recharging (0.5 CV
of 0.1 M nickel sulphate), washing (5 CV each water and buffer), and storage at RT in 20%
CHAPTER 2
62
(v/v) ethanol. Similarly, the FPLC columns for IMAC and desalting applications were stored in
20% (v/v) ethanol after each use.
2.2.4 Protein quantitation
Protein quantification of cell lysate was done by the Bradford method (Bradford, 1976).
However, linker histone is poorly detected by Bradford reagent. Moreover, the
quantification of core histones by this method provides a gross underestimate of the protein
concentration.
Proteins can also be quantified based on their molar absorptivity / extinction
coefficient at 280 nm (ε, M-1cm-1) (434). Tryptophan (ε 5500), the most conserved residue in
proteins, is the major contributor to A280; with a minor contribution from tyrosine (ε 1490)
and cysteine (ε 125), such that ε (protein / peptide) equals (nW x 5500) + (nY x 1490) + (nC x
125), where n is the number of each residue (435). Immunoglobulin IgG was quantified at
OD280 using spectrophotometer (DU®730, Beckman Coulter); assuming A1mg/ml equal to 1.36
in a 1 cm path length quartz cuvette (Wuxi Natural, Q31051). However, histones, especially
the linker histones, are deficient in tryptophan. Infact, Hho1p lacks tryptophan. Considering
a monoisotopic molecular weight of 27.78 kDa, 1 μM Hho1p equals 27.8 μg/ml. The ε value
of 8940 M-1cm-1 for Hho1p is contributed by one cysteine and six tyrosine residues, giving it
a low OD280 (A1mg/ml = 0.321). Therefore, a measurement at OD214/230, corresponding to
peptide bond absorption, rather than OD280, is a much better indicator of histone
concentration. While a 1 mg/ml preparation of core histones gives an absorbance (A1mg/ml)
value of 3.3 at OD230, the value for H1 is 1.85 (436). Although reliable, absorbance values
may be skewed by buffer composition, low tryptophan content, formula used for
calculation, sample complexity, or incomplete protein denaturation. Besides ε, amino acid
sequence analysis has also been used to quantify linker histone concentration (437).
Within its LOD (limit of detection), the protein quantitation based on fluorescence is
not only simpler but also one of the most sensitive. For this reason, we used qubit
fluorimeter (Invitrogen, Q32857) for routine protein quantitation. The qubit® protein assay
CHAPTER 2
63
kit (Molecular Probes, Invitrogen, Q33212) was used to generate a standard with 0, 20 and
40 ng protein per 200 μl reaction volume, as per the manufacturer’s instruction.
2.2.5 SDS-PAGE analysis
Protein was regularly resolved on a vertical 8 x 15 cm SDS-polyacrylamide slab gel, as per
(438). The protein was boiled for 5 min in loading buffer [62.6 mM Tris-HCl (pH 6.8), 1%
(w/v) SDS, 0.01% (w/v) bromophenol blue, 10% (w/v) glycerol, 5% (v/v) β-ME]. After sample
loading, the gel was run for 90 min at a constant voltage of 150 V, RT in a Mini-PROTEAN® III
or tetra electrophoresis system (Bio-Rad). While the recombinant Hho1p was resolved on a
12% resolving and 5% stacking gel, and the yeast histone extracts were resolved on 15%
resolving and 5% stacking Tris-glycine SDS-polyacrylamide gels. The IgG fractions were
analyzed on 10% resolving and 4% stacking Tris-bicine SDS-PAGE gels. The gels were casted
using 19: 1 acrylamide / bis solution (Bio-Rad, 161-0144), and run at 150 V constant for 80 to
100 min. Appropriate protein molecular weight markers including SM0431 (MBI Fermentas),
chicken erythrocytes histones or calf thymus histones, type IIIS (CTH TIIIS, Sigma, H5505)
were used when required.
2.2.5.1 Coomassie staining
Microwave oven (LG, MS 3040S) assisted CBB-R250 staining and destaining of
polyacrylamide gel was performed as per (439). Gels were stored in an aqueous solution of
5% (v/v) acetic acid, and 10% (v/v) glycerol at RT.
2.2.5.2 Silver Staining
Gel was fixed in 50 ml of methanol: acetic-acid: water: formaldehyde (37%) solution (25: 12:
63: 0.1, v/v/v/v) for 2 h, followed by three 50% (v/v) ethanol washes for 20 min each. It was
sensitized with 25 ml of 0.02% (w/v) sodium thiosulphate pentahydrate (Na2S2O3 5H20) for 5
min, and water washed five times for 15 s each. This was followed by 20 min of 0.2% (w/v)
silver nitrate, 0.04% formaldehyde impregnation, and 3 water washes for 20 s each. Bands
were developed by incubation in freshly prepared 25 ml solution comprising 3% (w/v)
CHAPTER 2
64
sodium carbonate, 0.004% (w/v) sodium thiosulphate and 0.02% formaldehyde followed by
immediate immersion in 50 ml methanol: acetic acid: water stop solution (50: 12: 38, v/v/v)
and incubated at RT for 10 min. An improved version of same has recently been published
(440).
2.2.5.3 Image acquisition and processing
The agarose gels were imaged on a GeldocTM XR+ system (Bio-rad), whereas the images of
CBB-R250 or silver stained polyacrylamide gels, Ponceau S (Merck, #1.14275.0010) stained
AmershamTM HybondTM ECL blotting membrane (GE Healthcare, RPN203D), and X-ray film
(Agfa, CP-GU NIF, CE 18 X 24cm) developed by enhanced chemiluminescence were captured
on Pharos FXTM Plus Molecular Imager (Bio-rad). The molecular weight was interpolated
with respect to standard by point to point regression method using QuantiT software.
Further processing was done in Adobe Photoshop and Illustrator CS3.
2.2.6 Mass spectrometric analysis
2.2.6.1 Protease digestion
Protein was either digested in-gel or in-solution using Glu-C (Roche, 11047817001) or
Trypsin (Promega, #V5280) protease. The peptides were analyzed by MS/MS or LC-MS/MS
identification with or without C18 Stage tip (Proxeon, SP301) purification.
2.2.6.1.1 In-solution digestion
A rapid in-solution digestion protocol was developed for mass spectrometric peptide
analysis by ESI-MS. Protein and trypsin were mixed in 20: 1 ratio in 50 mM ammonium
bicarbonate (AB; Sigma, A6141), 1 mM DTT (Bio-Rad, 161-0610) and incubated in a gradient
thermocycler. The 15 min reaction involved the increase in temperature from 37 °C to 51 °C
by a one degree increment per min, with the lid at 45 °C. Sample was acidified to 5% (v/v)
formic acid (FA; Sigma, 9676) for direct LC-MS analysis.
CHAPTER 2
65
2.2.6.1.2 In-gel digestion
A standard protocol for in-gel digestion and peptide purification was adapted from (441).
Briefly, excised gel pieces were diced into approximately 1 mm2 segments using a scalpel
(Onemed, 22-406082*001). They were rinsed with 25 μl of freshly prepared 150 mM AB
buffer for 5 min. This was followed by dehydration with excess (50 μl) ACN (LC-MS
chromasolv; Sigma, 34967) for 5 min. Next, gel pieces were dried and embedded protein
was reduced with 25 μl of 10 mM DTT in 50 mM AB buffer for 1 h at 55 °C. After cooling to
RT, the solution was replaced with 25 μl of 250 mM IAA in 50 mM AB buffer. After 1 h
sample incubation at RT, the alkylation solution was removed and gel pieces were
dehydrated with ACN. Then, gel pieces were swollen in digestion buffer at 25 °C for 12-18 h
using 1: 20 ratio of protein: protease (w/w). Afterwards, gel pieces were rinsed with 25 μl
AB and the solution was collected in a separate tube after a 5,000 xg, 1 min spin, using a gel
loader tip. Gel pieces were dehydrated in 25 μl of 50% (v/v) ACN, 5% (v/v) FA for 5 min. The
supernatant was collected and pooled. Then, gel pieces were rehydrated with minimal
volume of 50 mM AB for 5 min, and the supernatant was pooled. Dehydration was repeated
with 50 μl of 100% (v/v) ACN for 5 min. The solution was pooled, and evaporated at medium
heat setting in a speed-vac (Savant). Sample was reconstituted in 10-20 μl of 0.5% (v/v) FA
for MS analysis on Q-TRAP 4000 (AB SCIEX).
2.2.6.1.3 Stage tip purification
A 200 μl C18 Stage tip was equilibrated in 1 CV of 80% (v/v) ACN, 5% (v/v) FA in water (LC-
MS chromasolv; Sigma, 39253), followed by re-equilibration in 1 CV of 5% (v/v) FA. Sample
was loaded in 1 CV of 5% (v/v) FA. Tip was washed with 1 CV of 5% (v/v) FA. Sample was
eluted in minimum volume of 80% (v/v) ACN, 5% (v/v) FA for ESI or saturated α-cyano-4-
hydroxycinnamic acid (HCCA) in 70% (v/v) ACN, 0.1% (v/v) TFA (Merck, #1.08178.0050) for
MALDI.
2.2.6.2 MALDI-TOF analysis
The MSP 96 micro scout ground steel target (Bruker Daltonics, 224990) was repeatedly
washed with methanol / water / methanol and dried with kim-wipe paper towels. A 20-50 μl
CHAPTER 2
66
of thin layer substrate comprising HCCA saturated in ACN: water (66: 33, v/v) with 0.1% (v/v)
TFA was applied on left center of grid, spread by wiping the plate in a unidirectional motion,
and allowed to air dry. A 1 μl sample of 10 μM Hho1p was mixed with 9 μl of HCCA
saturated in 66% (v/v) ACN, 0.1% (v/v) TFA in deionized water. An aliquot (0.5 μl) was
spotted over thin matrix layer, dried, and washed with 2 μl of 0.1% (v/v) aqueous TFA, as
per (442). The spectra was acquired on Microflex MALDI-TOF instrument (Bruker Daltonics)
following a workflow designed on Flex control 3.0 (350 ns PIE delay, 20 Hz laser repetition
rate, 1.65 kV linear detector voltage, 20 kV and 18.5 kV ion source voltage 1 and 2,
respectively, 9 kV ion source lens voltage, and 880 shots), and peaks were assigned using
Flex analysis 3.0.
2.2.6.3 LC-ESI-MS/MS analysis
Protein digest was electro sprayed either directly through nano-electrospray capillaries
(Proxeon, ES380), or after separation by an Agilent 1200 nano-LC system (Agilent). Peptides
were separated either on Zorbax® 300 SB-C18, C18, 3.5 μ, 300 Å, 150 mm x 75 μm column
(Agilent, 5065-9911) or home-made capillary columns packed using a high pressure column
loader with integrated stirrer (Proxeon, SP036). In general, 150 mm fused silica tubing with
75 µm id/360 µm od (Proxeon, ES445) was used for column preparation while 1/32’’ fused
silica lined polyetheretherketone (PEEKsil) 250 X 0.025 mm id tubing (SGE, 62454) was used
for plumbing. The peptides were eluted using a slow aqueous acetonitrile gradient (10-25%,
v/v) in a 2-3 h run.
MS was operated in positive ion mode, with nano-electrospray (0.35 μl/min) or
capillary-electrospray (5 μl/min). In general, nebulizer gas (GS1) and ion-spray voltage (IS)
was applied at skimmer, while interface plate (IHT) was maintained at high temperature to
generate a steady ion-vapor plume at the source. A continuous flow of curtain gas (CUR)
was used between the curtain plate and the orifice plate to throw away neutrals.
Declustering potential was applied to the orifice plate to take away clusters and adducts. A
dynamic fill time was chosen to cater for space-charging effect. High collision gas setting
was used to fragment ions in q2. Spectra was recorded by setting IDA criteria to detect three
highest peaks above a cut-off (100,000-200,000 cps) between 400-2000 m/z from an EMS
CHAPTER 2
67
scan, enhance their resolution for charge state determination by an enhanced scan, and
fragment them using rolling collision energy in a product ion scan.
Extended SWISS Prot database search of tandem MS spectra using MASCOT (Matrix-
Science) was used to compare the calculated mass values to theoretical digests, while
applying cleavage rules to the entries in the database. Predefined modifications, mass error
tolerance (1000 to 1200 mDa), and charge state (+1, +2, +3) were incorporated in the search
space. Scores, reported as -10*log10 (P), indicated match significance with probability P,
where high score meant low probability.
2.2.7 Hho1 retrieval
2.2.7.1 Precipitation of rHho1p
The relative precipitation of 100 μg Hho1p in 20 mM Tris-HCl (pH 8.0), 200 mM sodium
chloride for 2 h at 4 °C using TCA (30%, w/v; Sigma, T6399), ammonium sulphate (50%, w/v;
Merck, 1124020 EM), chilled acetone (4 volumes; Sigma, 34850), and polyethylene glycol
4000 (30%, v/v; Sigma, P3640) was analyzed by protein quantitation and SDS-PAGE.
2.2.7.2 Acid solubility of rHho1
To test the solubility of yeast linker histone in sulphuric, hydrochloric, perchloric and
phosphoric acid, 75 μg of rHho1p was raised to 0.25 M of respective acid in 1 ml total
volume by adding equal volume of 0.5 M acid. After 2 h of mixing at 4 °C, sample was spun
for 15 min at 14,000 rpm, 4 °C. 0.6 g of ammonium sulphate was dissolved per tube by
stepwise addition accompanied by vortexing. Mixture was resuspended for 2 h at 4 °C
followed by a 30 min 14,000 rpm spin at 4 °C. Pellet was dried and resuspended in 75 μl of
10 mM Tris-HCl (pH 8.0), 1 mM DTT buffer. Protein was quantitated and analyzed by SDS-
PAGE. Similarly, a Western blot was conducted on TCA precipitated 0.25 M and 0.5 M
hydrochloric, sulphuric or perchloric acid soluble fraction of W303 yeast cell lysate, with
nuclear protein and rHho1p as controls.
CHAPTER 2
68
2.2.8 Western blotting analysis
The concentration of secondary antibody (donkey αrabbit IgG HRP-conjugated; Abcam
ab16284) required for Western blot analysis was optimized by dot blot analysis of its various
dilutions on ECL membrane.
Protein was transferred with membrane on anode for 70 min at 30 °C. Transfer was
optimized by varying the concentration of SDS in the transfer buffer from 0, 0.05 to 0.1%
(w/v) SDS. Transfer orientation was marked, and the membrane was blocked at RT for 1 h or
overnight at 4 °C in PBST, 5% (w/v) BSA (Sigma, A4503) in tupperware or plastic bags made
using impulse sealer (Hongzhan, KS-300). Since azide (NaN3) inhibits peroxidases, its use as a
microbicide was avoided in Western wash buffers. Membrane was rinsed twice in PBST
(0.137 M NaCl, 2.7 mM KCl, 10 mM Na2HPO4, 1.8 mM KH2PO4, 0.1% Triton X-100, pH 7.4)
and incubated with appropriate primary antibody dilution in PBST, 5% (w/v) BSA for 1 h at
RT. The membrane was given four PBST washes, twice -15 min each, followed by twice -5
min duration each. It was incubated with secondary antibody (1: 10,000 in PBST) for 1 h at
RT, and washed as above. Subsequent processing steps were undertaken in a dark room
with a red light. The components of super signal west pico substrate (Thermo Scientific,
34080 / 1856135 and 1856136) were equilibrated to RT and mixed appropriately.
Membrane was placed on saran wrap with protein surface up, and the detection reagent
was overlaid on it. Excess buffer was drained after 2 to 5 min incubation. The blot was
wrapped carefully without taking any bubbles. It was placed in cassette with protein surface
facing X-ray film in a hypercasette (GE Healthcare) from 30 s to 30 min, as per signal
intensity. Thereafter, the film was developed in 1x of manual X-ray developer concentrate
(Axim, 8651), water washed, fixed in 1x of manual X-ray fixer concentrate (Axim, 8349),
water washed, dried, and imaged.
The concentration of various primary antibodies, optimized by slot blot assay, ranged
from 1: 500 to 1: 10,000. For instance, Western on protein extracts from JDY43 strain used a
1: 10,000 dilution of αmyc antibody and 1: 20,000 dilution of HRP-conjugated secondary
antibody.
CHAPTER 2
69
2.2.9 RP-HPLC analysis
To analyze its retention behavior on a RP-HPLC column, 10 μg of rHho1p was injected onto a
Jupiter, C18, 5 μ, 300 Å, 4.6 mm x 250 μm column (Phenomenex, 00G-4053-E0, Serial no.
430238-2) from a 250 μl polypropylene vial (Dionex, 160133) with a snap cap (Dionex,
160135). Column was maintained at RT or 40 °C during the run. The protein was eluted in a
step gradient of buffer B: 0.1% (v/v) TFA in ACN: water (90: 10%, v/v) from starting buffer A:
0.1% (v/v) TFA in ACN: water (5: 95%, v/v). Shimadzu HPLC system with the following
module configuration: detector- SPD 20AV, autosampler-SIL 20A, column oven-CTO-10AS
VP, conductivity detector- CDD-10A VP, communications bus module- CBM 20A, liquid
chromatography- LC-20AT was used for the purpose. The deuterium lamp set at 210 nm was
found to be a much better indicator of protein concentration than the tungsten lamp set at
280 nm. So, A210 was measured as an indicator of peptide bond absorbance, with lamp
operated at an acquisition frequency of 2 Hz. Individual peaks were collected, and eluates
lyophilized and resuspended in a minimal volume of 10 mM Tris-HCl (pH 8) for SDS-PAGE.
Column was equilibrated to loading solvent before each run, cleaned thoroughly till a stable
baseline post run, and stored in 25% (v/v) ACN, as recommended. It was regenerated by 40
ml washes each of ACN: water (5: 95%, v/v), THF, and ACN: water (95: 5%, v/v) mobile
phases, when required, as per the manufacturer’s instructions.
2.2.10 Cross-linking analysis
10 μg each of chicken erythrocyte histone extract (CEH) was cross-linked at 25 °C for 1, 2, 3,
4, and 5 min respectively using 2.5% glutaraldehyde (GTA) (Sigma, G5882). The reaction was
quenched using 97 mM glycine (using 10x Tris-glycine SDS-PAGE running buffer) and
analyzed by gel electrophoresis. Similarly, 5 μg of rHho1 was cross-linked with 50 μM GTA
and 100 μM dimethyl adipimidate (DMA) (Sigma, 285625) at 25 °C for 0, 2, 5, and 10 min
each. A negative control reaction was set with 1% (w/v) SDS added at time zero and carried
on for 10 min. Reactions were quenched with 0.1 M Tris-HCl (pH 7.5), and resolved by SDS-
PAGE.
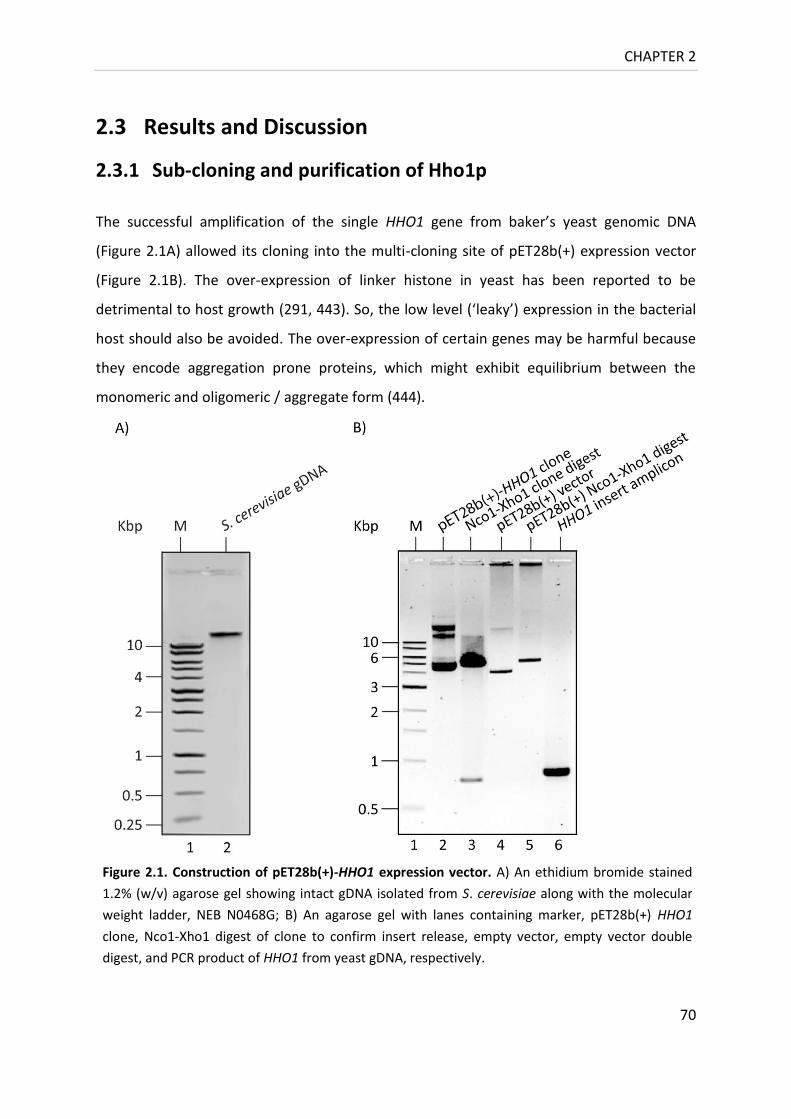
CHAPTER 2
70
2.3 Results and Discussion
2.3.1 Sub-cloning and purification of Hho1p
The successful amplification of the single HHO1 gene from baker’s yeast genomic DNA
(Figure 2.1A) allowed its cloning into the multi-cloning site of pET28b(+) expression vector
(Figure 2.1B). The over-expression of linker histone in yeast has been reported to be
detrimental to host growth (291, 443). So, the low level (‘leaky’) expression in the bacterial
host should also be avoided. The over-expression of certain genes may be harmful because
they encode aggregation prone proteins, which might exhibit equilibrium between the
monomeric and oligomeric / aggregate form (444).
Figure 2.1. Construction of pET28b(+)-HHO1 expression vector. A) An ethidium bromide stained
1.2% (w/v) agarose gel showing intact gDNA isolated from S. cerevisiae along with the molecular
weight ladder, NEB N0468G; B) An agarose gel with lanes containing marker, pET28b(+) HHO1
clone, Nco1-Xho1 digest of clone to confirm insert release, empty vector, empty vector double
digest, and PCR product of HHO1 from yeast gDNA, respectively.
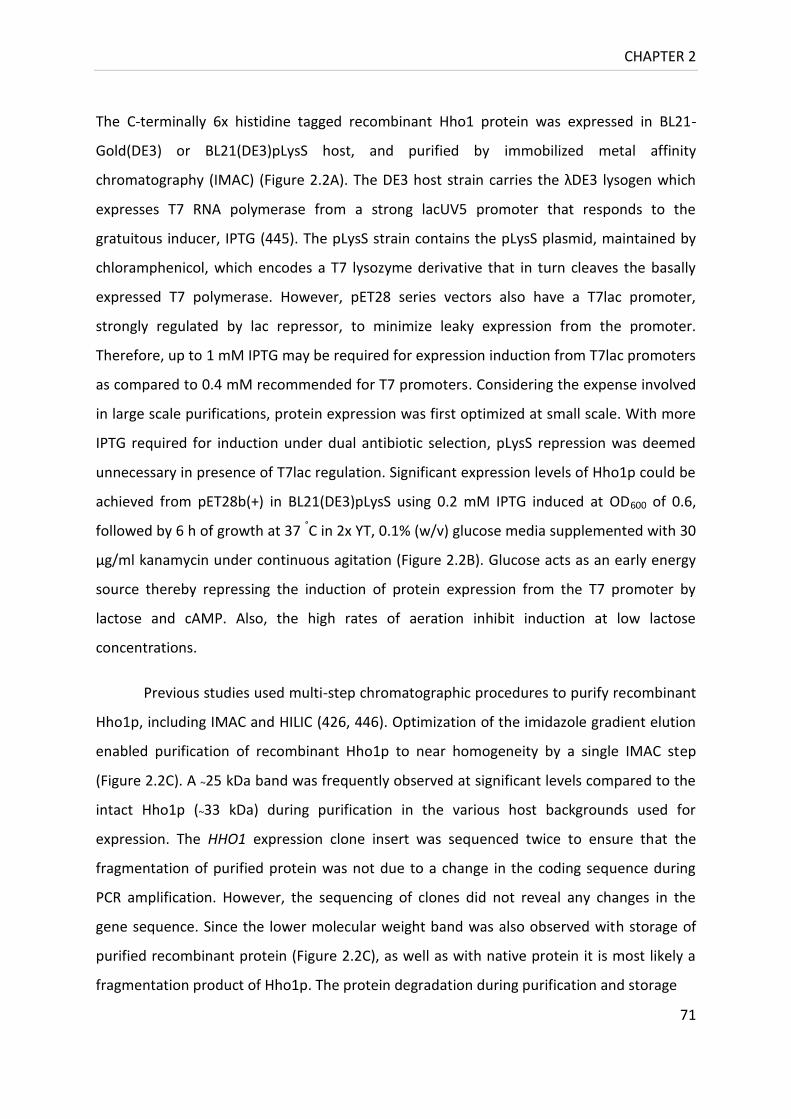
CHAPTER 2
71
The C-terminally 6x histidine tagged recombinant Hho1 protein was expressed in BL21-
Gold(DE3) or BL21(DE3)pLysS host, and purified by immobilized metal affinity
chromatography (IMAC) (Figure 2.2A). The DE3 host strain carries the λDE3 lysogen which
expresses T7 RNA polymerase from a strong lacUV5 promoter that responds to the
gratuitous inducer, IPTG (445). The pLysS strain contains the pLysS plasmid, maintained by
chloramphenicol, which encodes a T7 lysozyme derivative that in turn cleaves the basally
expressed T7 polymerase. However, pET28 series vectors also have a T7lac promoter,
strongly regulated by lac repressor, to minimize leaky expression from the promoter.
Therefore, up to 1 mM IPTG may be required for expression induction from T7lac promoters
as compared to 0.4 mM recommended for T7 promoters. Considering the expense involved
in large scale purifications, protein expression was first optimized at small scale. With more
IPTG required for induction under dual antibiotic selection, pLysS repression was deemed
unnecessary in presence of T7lac regulation. Significant expression levels of Hho1p could be
achieved from pET28b(+) in BL21(DE3)pLysS using 0.2 mM IPTG induced at OD600 of 0.6,
followed by 6 h of growth at 37 °C in 2x YT, 0.1% (w/v) glucose media supplemented with 30
μg/ml kanamycin under continuous agitation (Figure 2.2B). Glucose acts as an early energy
source thereby repressing the induction of protein expression from the T7 promoter by
lactose and cAMP. Also, the high rates of aeration inhibit induction at low lactose
concentrations.
Previous studies used multi-step chromatographic procedures to purify recombinant
Hho1p, including IMAC and HILIC (426, 446). Optimization of the imidazole gradient elution
enabled purification of recombinant Hho1p to near homogeneity by a single IMAC step
(Figure 2.2C). A ~25 kDa band was frequently observed at significant levels compared to the
intact Hho1p (~33 kDa) during purification in the various host backgrounds used for
expression. The HHO1 expression clone insert was sequenced twice to ensure that the
fragmentation of purified protein was not due to a change in the coding sequence during
PCR amplification. However, the sequencing of clones did not reveal any changes in the
gene sequence. Since the lower molecular weight band was also observed with storage of
purified recombinant protein (Figure 2.2C), as well as with native protein it is most likely a
fragmentation product of Hho1p. The protein degradation during purification and storage
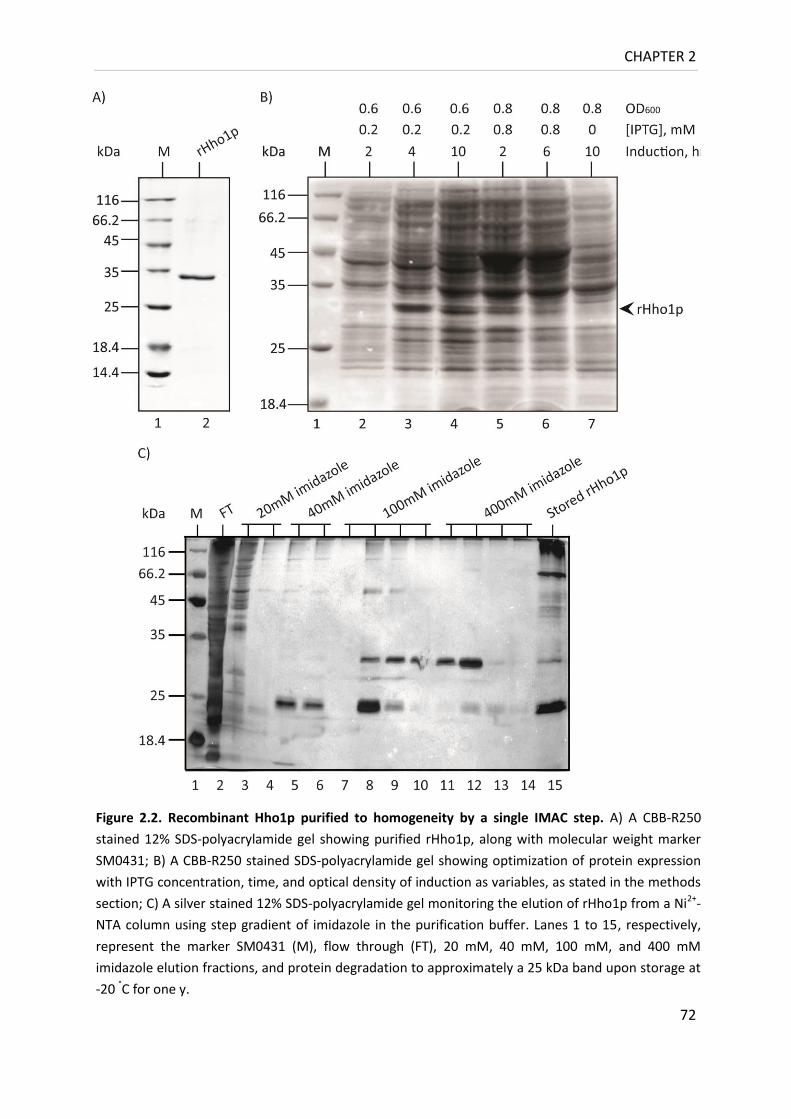
CHAPTER 2
72
Figure 2.2. Recombinant Hho1p purified to homogeneity by a single IMAC step. A) A CBB-R250
stained 12% SDS-polyacrylamide gel showing purified rHho1p, along with molecular weight marker
SM0431; B) A CBB-R250 stained SDS-polyacrylamide gel showing optimization of protein expression
with IPTG concentration, time, and optical density of induction as variables, as stated in the methods
section; C) A silver stained 12% SDS-polyacrylamide gel monitoring the elution of rHho1p from a Ni2+-
NTA column using step gradient of imidazole in the purification buffer. Lanes 1 to 15, respectively,
represent the marker SM0431 (M), flow through (FT), 20 mM, 40 mM, 100 mM, and 400 mM
imidazole elution fractions, and protein degradation to approximately a 25 kDa band upon storage at
-20 °C for one y.
CHAPTER 2
73
could perhaps be attributed to a host protease, or a low self-cleavage activity of Hho1p.
Another study reported a highly specific recognition of native Hho1p by Western blotting of
rapidly prepared total yeast protein extracts (447) at approximately 23.5 kDa (139). A higher
molecular weight band, corresponding to twice the molecular weight of recombinant Hho1p
was also observed in stored protein (as seen in lane 15, Figure 2.2).
The identity of the recombinant Hho1 protein was confirmed by mass spectrometry
(MS) and Western blotting. Initially, a MALDI-TOF analysis was performed to determine the
molecular weight of the purified, intact protein. The recovered MS spectrum, however,
showed evidence of protein degradation, with the highest molecular weight peak present at
21.5 kDa (Figure 2.3) as opposed to 27.8 kDa. This behavior is typical of meta-stable ions
that show spontaneous decomposition in the field-free TOF drift path. However, the
relatively low reproducibility of fragment mass accuracy and difficulty in controlling the
degree of fragmentation made it technically challenging to pin-point the site of cleavage in
the protein sequence. Therefore, LC-MS/MS, with its soft ionization ESI interface was used
to identify the over-expressed protein (Figure 2.4). The MS/MS results positively identified
the purified, recombinant protein as yeast Hho1p.
Figure 2.3. MALDI-TOF spectra of rHho1p. A mass peak close to the molecular weight of extra
band picked up on SDS-polyacrylamide gel during Hho1p purification was observed by MALDI-TOF.
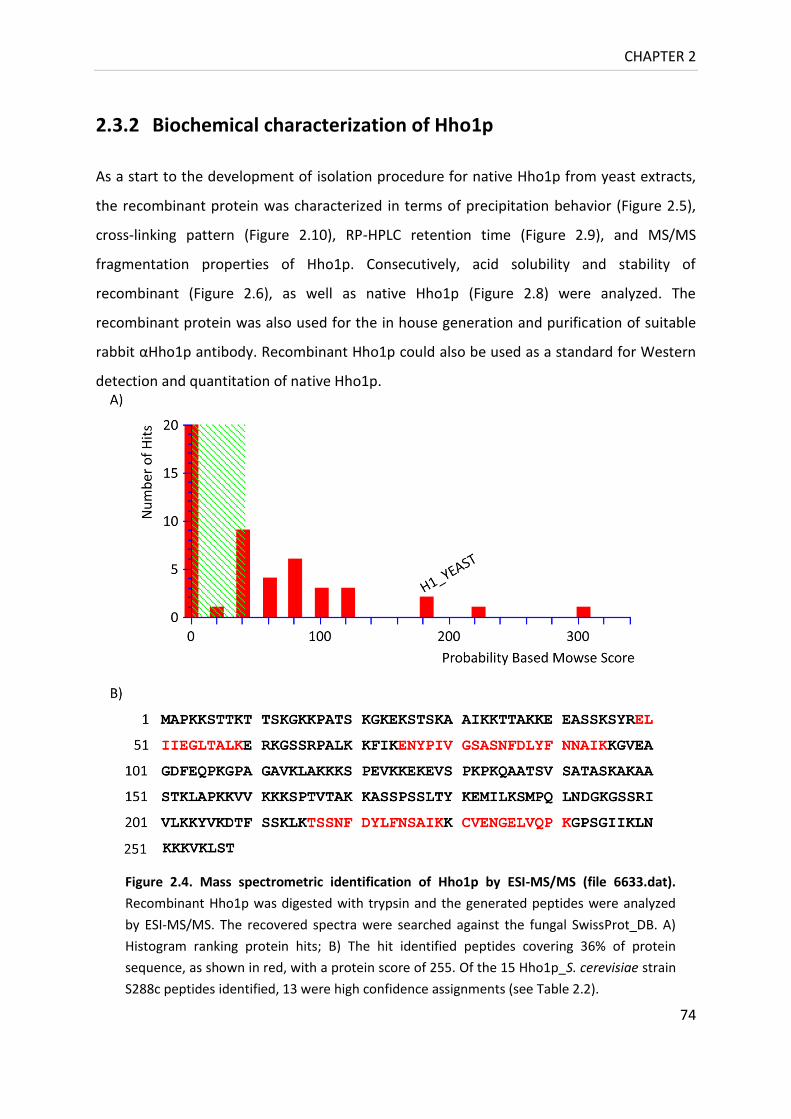
CHAPTER 2
74
2.3.2 Biochemical characterization of Hho1p
As a start to the development of isolation procedure for native Hho1p from yeast extracts,
the recombinant protein was characterized in terms of precipitation behavior (Figure 2.5),
cross-linking pattern (Figure 2.10), RP-HPLC retention time (Figure 2.9), and MS/MS
fragmentation properties of Hho1p. Consecutively, acid solubility and stability of
recombinant (Figure 2.6), as well as native Hho1p (Figure 2.8) were analyzed. The
recombinant protein was also used for the in house generation and purification of suitable
rabbit αHho1p antibody. Recombinant Hho1p could also be used as a standard for Western
detection and quantitation of native Hho1p.
Figure 2.4. Mass spectrometric identification of Hho1p by ESI-MS/MS (file 6633.dat).
Recombinant Hho1p was digested with trypsin and the generated peptides were analyzed
by ESI-MS/MS. The recovered spectra were searched against the fungal SwissProt_DB. A)
Histogram ranking protein hits; B) The hit identified peptides covering 36% of protein
sequence, as shown in red, with a protein score of 255. Of the 15 Hho1p_S. cerevisiae strain
S288c peptides identified, 13 were high confidence assignments (see Table 2.2).
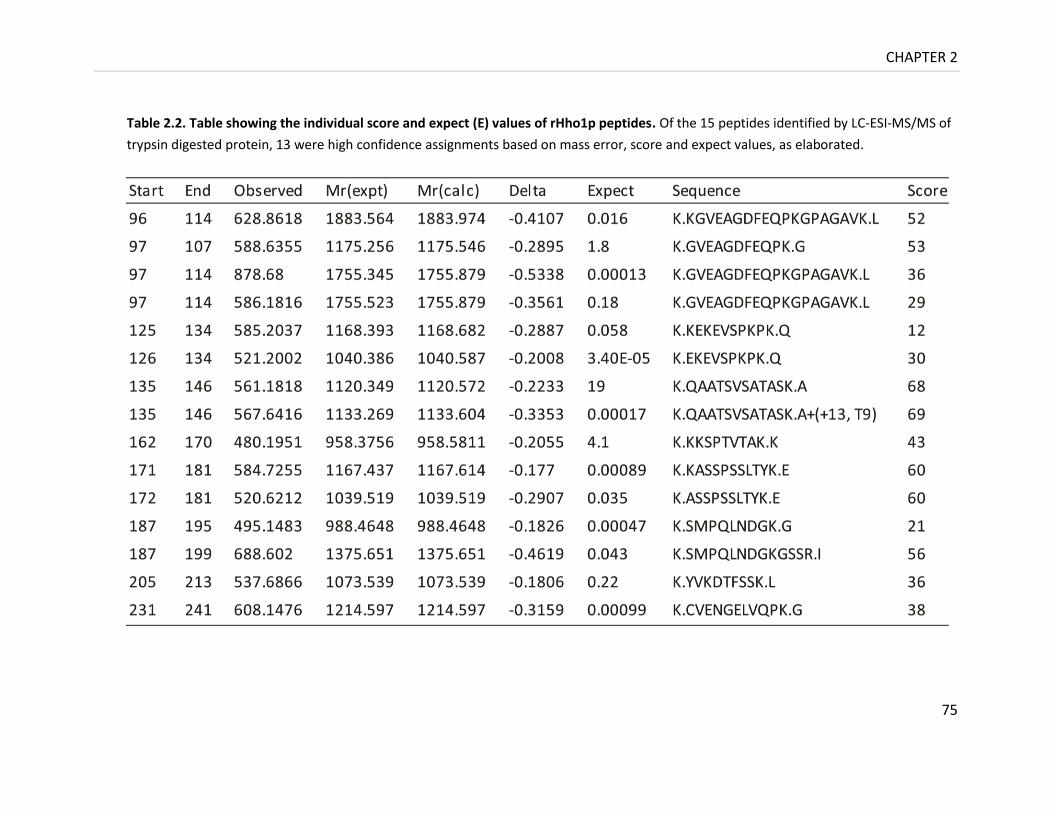
CHAPTER 2
75
Table 2.2. Table showing the individual score and expect (E) values of rHho1p peptides. Of the 15 peptides identified by LC-ESI-MS/MS of
trypsin digested protein, 13 were high confidence assignments based on mass error, score and expect values, as elaborated.
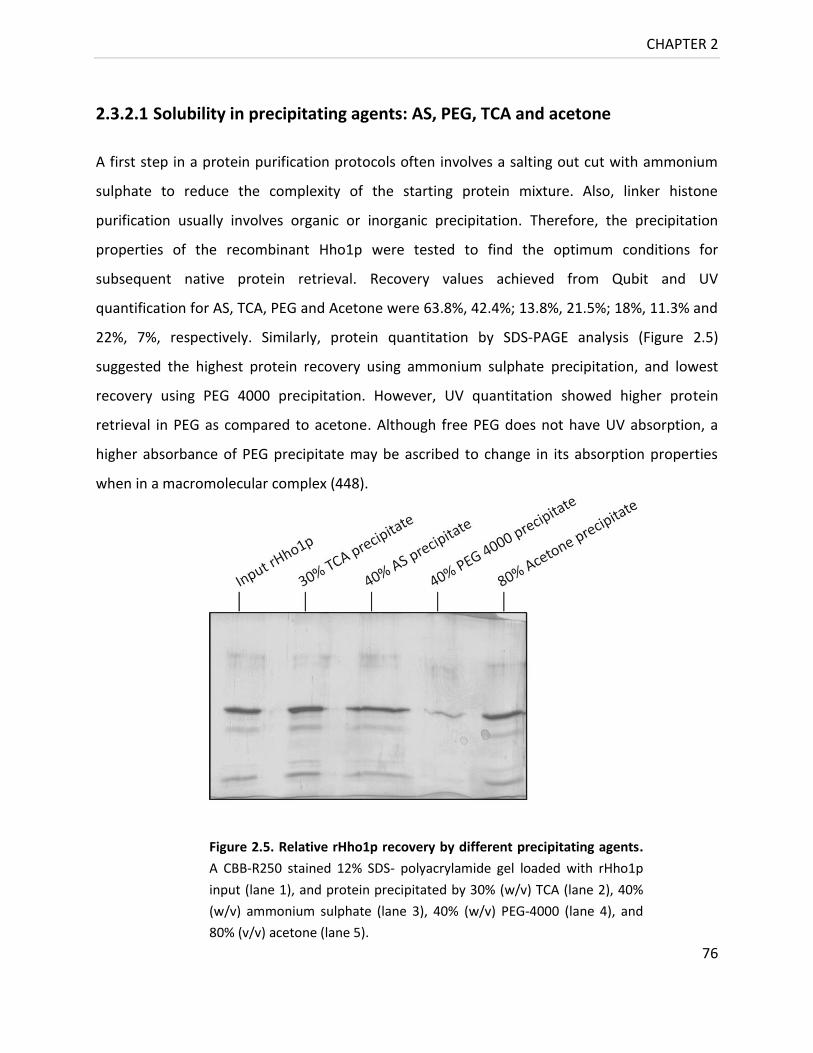
CHAPTER 2
76
2.3.2.1 Solubility in precipitating agents: AS, PEG, TCA and acetone
A first step in a protein purification protocols often involves a salting out cut with ammonium
sulphate to reduce the complexity of the starting protein mixture. Also, linker histone
purification usually involves organic or inorganic precipitation. Therefore, the precipitation
properties of the recombinant Hho1p were tested to find the optimum conditions for
subsequent native protein retrieval. Recovery values achieved from Qubit and UV
quantification for AS, TCA, PEG and Acetone were 63.8%, 42.4%; 13.8%, 21.5%; 18%, 11.3% and
22%, 7%, respectively. Similarly, protein quantitation by SDS-PAGE analysis (Figure 2.5)
suggested the highest protein recovery using ammonium sulphate precipitation, and lowest
recovery using PEG 4000 precipitation. However, UV quantitation showed higher protein
retrieval in PEG as compared to acetone. Although free PEG does not have UV absorption, a
higher absorbance of PEG precipitate may be ascribed to change in its absorption properties
when in a macromolecular complex (448).
Figure 2.5. Relative rHho1p recovery by different precipitating agents.
A CBB-R250 stained 12% SDS- polyacrylamide gel loaded with rHho1p
input (lane 1), and protein precipitated by 30% (w/v) TCA (lane 2), 40%
(w/v) ammonium sulphate (lane 3), 40% (w/v) PEG-4000 (lane 4), and
80% (v/v) acetone (lane 5).
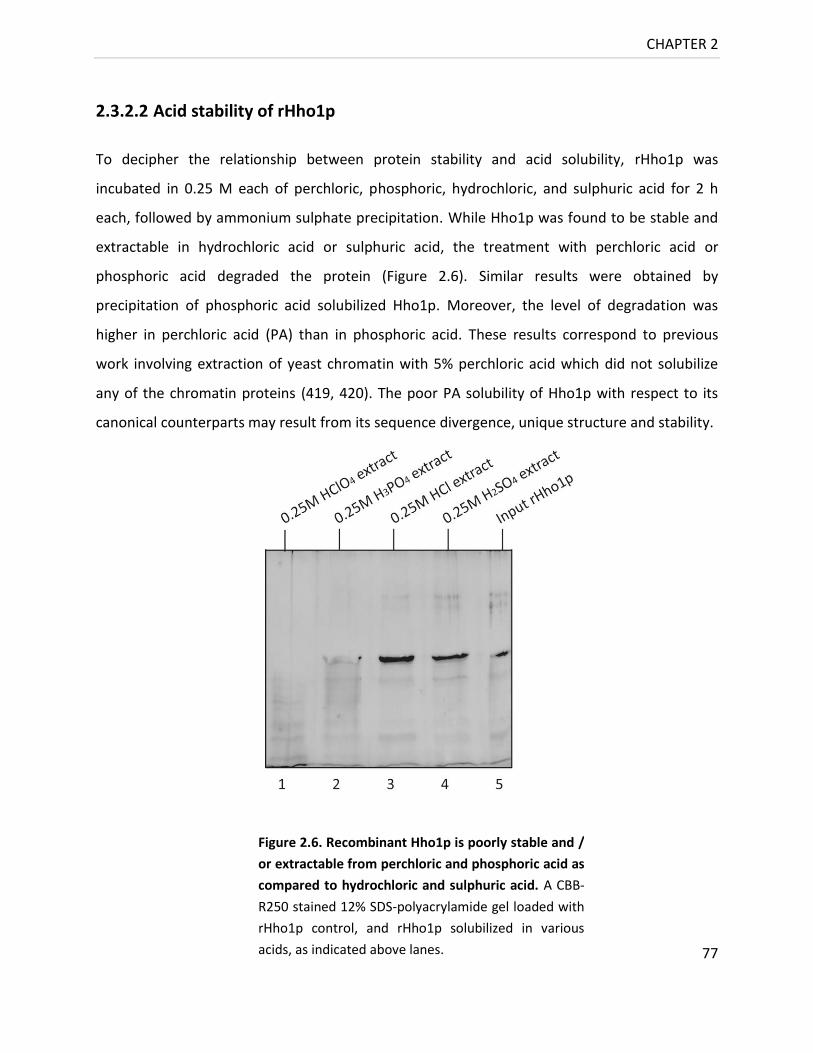
CHAPTER 2
77
2.3.2.2 Acid stability of rHho1p
To decipher the relationship between protein stability and acid solubility, rHho1p was
incubated in 0.25 M each of perchloric, phosphoric, hydrochloric, and sulphuric acid for 2 h
each, followed by ammonium sulphate precipitation. While Hho1p was found to be stable and
extractable in hydrochloric acid or sulphuric acid, the treatment with perchloric acid or
phosphoric acid degraded the protein (Figure 2.6). Similar results were obtained by
precipitation of phosphoric acid solubilized Hho1p. Moreover, the level of degradation was
higher in perchloric acid (PA) than in phosphoric acid. These results correspond to previous
work involving extraction of yeast chromatin with 5% perchloric acid which did not solubilize
any of the chromatin proteins (419, 420). The poor PA solubility of Hho1p with respect to its
canonical counterparts may result from its sequence divergence, unique structure and stability.
Figure 2.6. Recombinant Hho1p is poorly stable and /
or extractable from perchloric and phosphoric acid as
compared to hydrochloric and sulphuric acid. A CBB-
R250 stained 12% SDS-polyacrylamide gel loaded with
rHho1p control, and rHho1p solubilized in various
acids, as indicated above lanes.

CHAPTER 2
78
2.3.2.3 Western blot analysis
Preliminary results pointed towards the oligomeric nature of yeast linker histone, Hho1p
(Figure 2.7). Besides the ~33 kDa band corresponding to Hho1p, one or two higher molecular
weight bands were frequently observed in the Western blots on cell lysate of S. cerevisiae
without any induced cross-linking (Figure 2.8). Although not recognized by CBB staining in most
rHho1p purifications, Western blot and silver staining allowed detection of the higher
molecular weight band(s), 1 and 2 (Figure 2.7). Since they are picked with high sensitivity by the
antibody as compared to stain, they might be multimers of Hho1p. Of these, band 2 might be
tight dimer formed by the natively folded fraction of protein, that persist even under the
reducing and denaturing conditions of the SDS-PAGE gel, whereas band 1 might not be a
multimer of intact Hho1p, but an internal cross-link or a degradation product of dimer?
Figure 2.7. Western to validate the specificity of αHho1p antibody recognized probable self-
association of rHho1p. A) A CBB-R250 stained 12% SDS-polyacrylamide gel loaded with increasing
quantities of rHho1p along with acid extracts of W303 cell lysate; B) An ECL-blot of a replica of the gel
in (A) probed to validate the specificity of αHho1p Ab
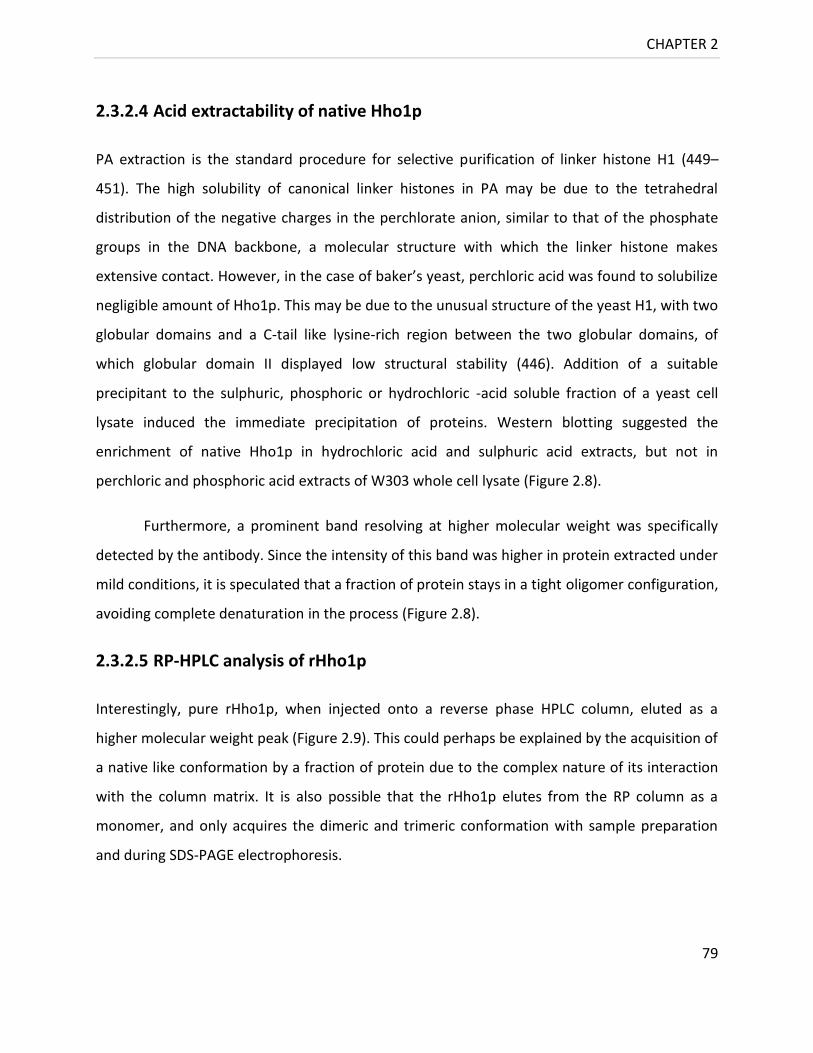
CHAPTER 2
79
2.3.2.4 Acid extractability of native Hho1p
PA extraction is the standard procedure for selective purification of linker histone H1 (449–
451). The high solubility of canonical linker histones in PA may be due to the tetrahedral
distribution of the negative charges in the perchlorate anion, similar to that of the phosphate
groups in the DNA backbone, a molecular structure with which the linker histone makes
extensive contact. However, in the case of baker’s yeast, perchloric acid was found to solubilize
negligible amount of Hho1p. This may be due to the unusual structure of the yeast H1, with two
globular domains and a C-tail like lysine-rich region between the two globular domains, of
which globular domain II displayed low structural stability (446). Addition of a suitable
precipitant to the sulphuric, phosphoric or hydrochloric -acid soluble fraction of a yeast cell
lysate induced the immediate precipitation of proteins. Western blotting suggested the
enrichment of native Hho1p in hydrochloric acid and sulphuric acid extracts, but not in
perchloric and phosphoric acid extracts of W303 whole cell lysate (Figure 2.8).
Furthermore, a prominent band resolving at higher molecular weight was specifically
detected by the antibody. Since the intensity of this band was higher in protein extracted under
mild conditions, it is speculated that a fraction of protein stays in a tight oligomer configuration,
avoiding complete denaturation in the process (Figure 2.8).
2.3.2.5 RP-HPLC analysis of rHho1p
Interestingly, pure rHho1p, when injected onto a reverse phase HPLC column, eluted as a
higher molecular weight peak (Figure 2.9). This could perhaps be explained by the acquisition of
a native like conformation by a fraction of protein due to the complex nature of its interaction
with the column matrix. It is also possible that the rHho1p elutes from the RP column as a
monomer, and only acquires the dimeric and trimeric conformation with sample preparation
and during SDS-PAGE electrophoresis.
CHAPTER 2
80
Since Hho1p has a single cysteine residue at position 231, inter-molecular disulphide
bond with adjacent Hho1p molecule could result in dimerization. However, even after 10 min of
heating at 99 °C in presence of a reducing agent, the band(s) could persist. Such a persistent
behavior of a native-like topology, even after denaturation, has been reported elsewhere (452).
Thus, the formation of self-associating multimeric forms of natively folded Hho1p, resistant to
denaturation during experimental conditions, could not be ruled out. Importantly, Western
blotting and MS/MS analysis confirmed the identity of the higher molecular band eluted from
antibody affinity column as native Hho1p (see Chapter 4). This shows unambiguously that the
yeast linker histone, when purified under mild conditions, exhibits a capability to oligomerize,
even without cross-linking and under denaturing polyacrylamide gel run coAnditions.
Figure 2.8. Native Hho1p is poorly stable in and/ or extractable from
perchloric acid as compared to hydrochloric and sulphuric acid. An ECL-
Western blot of protein extract from exponential phase W303 cells
probed with αHho1p Ab showing rHho1p (lane 1), W303 nuclear
proteome extract (NPE) (lane 2), Super signal enhanced protein
molecular weight marker 84875 (lane 3), and cellular proteome acid
extracts (CAE), i.e. protein recovered from equal quantity of total cell
lysate in either 0.25 M or 0.5 M of hydrochloric, sulphuric, or perchloric
acid in lanes 4 to 9, as indicated above lanes.

CHAPTER 2
81
A population of molecules for an intrinsically disordered protein generally contains a few
members with the folded conformation, such that their selection by a binding partner isolates
them from the pool shifting the equilibrium towards the folded conformation (453). These
Figure 2.9. Recombinant Hho1p elutes as a partial higher molecular weight band from RP-HPLC. A)
Elution profile of rHho1p from a Jupiter300 RP-HPLC column; B) An expanded view of peak 3 that shows
up on the gel; C) A silver stained 12% SDS-polyacrylamide gel with lanes 1 to 6 showing protein molecular
weight marker SM0431, and 1 μg rHho1p, followed by elution peaks 1, 2, 3 and 4, respectively, as
observed in elution profile (A).
CHAPTER 2
82
observations merit a careful investigation into the self oligomerization nature of the yeast linker
histone, since this property has important implications on the higher order chromatin structure
in yeast. As an alternative to oligomerization, the following can also be proposed. To begin
with, Hho1p was detected at approximately twice the molecular weight of untagged version of
the protein in the Western blots conducted using αmyc antibody on the whole cell lysates from
JDY43 (454). Since the molecular weight of Hho1p is 27.8 kDa, the addition of 13x c-myc tags
(13 x 1.2 kDa, EQKLISEEDL, ~15.6 kDa) in JDY-43 (J. Downs, U.K., personal communication) result
in a recombinant protein of 43.4 kDa. Anomalous migration of myc-tagged Hho1p on an SDS-
polyacrylamide gel maybe due to change in protein size because of RNA polymerase stuttering
over repeats or excess SDS-binding to protein. Apart from that, the presence of one or two
specific higher molecular weight Hho1p bands in some recombinant and native protein
preparations from either W303 or BY4741 cells could be partly explained by Hho1p complexed
to small amounts of co-purified DNA, as has been reported in case of chicken GH1 and GH5
(314).
2.3.2.6 Cross-linking analysis of rHho1p
To further study the oligomeric interactions in Hho1p, a cross-linking analysis was undertaken
using GTA and DMA. The GTA cross-linking of chicken erythrocyte histones (CEH) resulted in
diffused higher molecular weight bands, representing products of histone cross-linking.
Attempts to cross-link rHho1p using GTA or DMA cross-linkers, proved problematic. The cross-
linking of the recombinant protein with 100 μM GTA was immediate and complete, producing
diffuse bands (Figure 2.10A). Decreasing the cross-linker concentration in the reaction mixture
to 50 μM resulted in a faint band whose intensity slightly increased, with the increase in
reaction time (Figure 2.10B).
Previously, GH5 could be cross-linked with Dimethyl 3,3'-dithiobis-(propionimidate)
(DTBP), Dithiobis (succinimidyl propionate) (DSP), and 3,3'-Dithiobis (sulfosuccinimidyl
propionate) (DTSSP), but not with Disuccinimidyl tartrate (DST) which has a relatively shorter
spacer arm span (6.4 Å), while Chaetopetrus sperm H1 could be cross-linked with GTA (5 Å

CHAPTER 2
83
spacer) (455–457). Although there are sequence differences between the individual Hho1p
globular domains, the overall structure is similar to that of GH5 (112). Differential cross-linking
by amine reactive reagents may be influenced by reactive site density distribution and anion
mediated lysine-arginine interactions (458).
Hho1p has a high lysine to arginine ratio of 14.5, which corresponds to its canonical somatic but
not spermatogenic linker histone counterparts. Both DMA (8.6 Å spacer) and GTA have a short
spacer-arm. Since current cross-linking data does not provide conclusive confirmation of
controlled Hho1p dimerization, cross-linking with longer spacer arm cross-linkers could be tried.
Figure 2.10. Cross-linking analysis of recombinant Hho1p does not provide conclusive results. A) A
CBB-R250 stained 10% SDS- polyacrylamide gel loaded with 5 μg rHho1p, marker SM0431 and products
of cross-linking reaction using 5 μg rHho1p and 100 μM of glutaraldehyde (C3H8O2, GTA) for 0, 2, 15,
30, and 30 min in presence of 1% (w/v) SDS; B) A CBB-R250 stained 10% (w/v) denaturing
polyacrylamide gel shows rHho1p cross-linking with 50 μM GTA and 200 μM DMA for 0, 2, 10 min, and
10 min with 1% (w/v) SDS. Protein showed limited cross-linking to give a discretely recognizable band
at approximately 55 kDa whose intensity increased with time in GTA but not DMA cross-linking.
CHAPTER 3
84
3 Generation, Purification and Characterization of
αHho1p Antibody
3.1 Introduction and Objectives
Antibodies can be used to specifically recognize fusion tags, splice variants, cleavage sites, post
translational modifications, ligand binding, polymorphisms, isoforms and mutations. Recently,
anti-peptide and anti-protein polyclonal antibodies against Hho1p became available. However,
the lack of a commercially available αHho1p antibody at the inception of this study required the
in-house generation of an antibody. Besides, a αHho1p peptide antibody was also raised in
rabbits.
Ideally, antibodies should be defined down to DNA level and generated in engineered
cells (459). However, the choice of antibody depends on its downstream application. The best
option for immunoaffinity chromatography, when available, may be the use of pooled
monoclonals. Usually, antibodies raised against the immunogenic peptide epitope(s) are less
stable than polyclonal antibodies. However, they are highly specific to the protein of interest,
and detect it based upon native or denaturing conditions used (corresponding to whether the
epitope is exposed on the surface of the protein or hidden inside). Besides, a polyclonal
antibody specific to the antigen of interest may, consist of a mixture of different antibodies
differing in their affinity constant (Ka), specificity, and avidity for the protein ligand, such that
the antibody population has a range of dissociation constants for the antigen of interest.
Therefore, using a polyclonal serum, rather than a monoclonal antibody, is of advantage as it
enables the capture of antigen with its binding partners, using a diverse population of intrinsic
affinities to different epitopes on the antigen (460). This chapter describes development of a
polyclonal antibody raised against intact, soluble Hho1p to be utilized in preparation of an
affinity matrix that would, in principle, recognize several of the protein epitopes or domains.
CHAPTER 3
85
Rabbits have more diverse epitope recognition than mice (less immunodominance), and
an improved immune response to small sized epitopes. Rabbits also tend to generate
antibodies with higher affinity and overall avidity. Moreover, rabbits have only one IgG subclass
antibodies that show enhanced binding due to heavy glycosylation. However, polyclonal anti-
sera antibody concentrations may vary significantly from animal to animal and bleed to bleed.
This necessitates purification of antibody mono-specific to the antigen of interest from the total
antibody pool derived from rabbit serum, as followed by Western blotting and ELISA.
Protein A/G affinity purification of serum IgGs (immunoglobulins) typically enriches the
desired antibody by more than 100 fold. Excess unrelated antibody that still remains in these
preparations could be separated by affinity chromatography using a column generated by
covalently coupling corresponding antigen to a matrix like CNBr-activated sepharose. However,
the coupling reaction may result in multiple denaturing covalent bonds and the loss of antigen
binding surface required for interaction. Moreover, there is several orders of magnitude
difference in the relative size of an average agarose bead (~100 μm), an antibody (~11 nm) and a
chemical bond (C-N, 0.14 nm). So, an appropriate ratio of protein to matrix (based on the size
and active site density of protein, and coupling capacity of matrix) needs careful consideration.
Besides, several coupling reaction parameters, like reaction time, temperature, pH and salt
concentration optima, antigen orientation, partial matrix inactivation, temporal and spatial
separations, diffusion rates, equilibrium dissociation constants, matrix packing and processing
etc., affect column preparation and usage. In most cases, matrix inactivation during elution is
not an issue. The dynamic capacity of such protein purification columns may be determined by
running sample under isocratic conditions by frontal chromatography, where sample is fed
continuously into the bed without any additional mobile phase. Dynamic capacity is a function
of matrix pore structure, particle diameter, particle size distribution profile, matrix composition,
protein molecular weight and solubility, forward and backward rate constants for binding
reaction, bulk, film and pore diffusion constants of protein, pH and ionic strength of buffer,
operational temperature, and possible competitive binding of other proteins in the sample.
CHAPTER 3
86
Though CNBr coupling method typically captures >95% specific antibody, the low pH elution
may deactivate a portion of antibody, unless neutralized immediately.
3.2 Materials and Methods
3.2.1 Generation of αHho1 peptide antibody
Synthetic N- and C-terminus Hho1p peptides (APKKSTTKTTSKGKK and CVENGELVQPKGPSG)
conjugated to keyhole limpet hemocyanin carrier protein were used to raise αHho1 antibody in
two rabbits (Yorkshire Biosciences, U.K.) as per (139). IgG was purified from antiserum by
raising the ammonium sulphate concentration from 33% (w/v) to 55% (w/v) by addition of 210
μl of saturated ammonium sulphate (pH 7) to 1 ml of antiserum following (461). After 60 min
nutation at 4 °C, the protein was pelleted by a 15 min, 13,200 rpm spin at 4 °C, and suspended
in 100 μl of PBS, 50% (v/v) glycerol.
3.2.2 Generation of αHho1 protein antibody
A project (animal experiment nr 11/2011) entitled ‘Biochemical characterization of linker
histone Hho1p and its role in chromatin compaction’ was approved by the inter-faculty animal
ethics committee to raise a rabbit αHho1p antibody at Animal Facility, University of the Free
State. The antibody was initially raised by a conventional protocol, as detailed below. A quick
protocol was subsequently adopted, as described by (462). Antibody purification and storage
was adapted from (463). A daily animal well-being checklist was maintained (Coat- clean; Coat-
dry; Coat- shiny; Coat- groomed; Urine and feces: color and amount- normal; Normal rapid
breathing, 30-60 bpm; Nose- pink, dry; Mouth- teeth occlude correctly, gums pink, moist; Eyes-
bright, eyelids clean, not swollen; Ears- clean, not red, dry, smooth, no crust / mites; Tail /
Anus- clean, no mucous or feces; Genitalia- clean, (red / inflamed in estrus female); Legs- no
damage / swelling / stiffness / wetness; Claws- trimmed, hocks- not sore, full furred).
A 1 ml injection emulsion comprising equal volume of rHho1p (300 μg) in PBS, and FCA
(Sigma, F5506; a gift from B. Fischer) was prepared by repeated aspiration with 18G syringe.
CHAPTER 3
87
Two female New Zealand White rabbits, 2-2.5 kg, were chosen for injection. The site of
injection was swabbed with alcohol, and each animal was immunized by subcutaneous,
intradermal and intramuscular injections using a 1 ml syringe with 231/2G needle, while rubbing
sites gently to avoid leakage. All bleeding was done with prior anesthesia given to the animal by
intramuscular injection of the sedative (0.3 ml of 100 mg/ml ketamine mixed with 0.2 ml of 1
mg/ml dormitor; a gift from S. Lamprecht, Animal facility, UFS). After 15 min, the injection area
was gently swabbed with eucaluptus oil, rinsed with alcohol, and shaved. Approximately 2 ml of
pre-immune blood was drawn from marginal ear vein and / or the central ear artery using
253/4G butterfly wing infusion set. On day 14, the rabbits were bled again to check antibody
response to the priming immunization, and then given first booster immunization dose with the
same amount of Hho1p homogenized in FIA (Sigma, F5881; a gift from B. Fischer, Botany, UFS).
Further booster immunizations were given on day 28 and 42. Depending on the antibody titers,
5 ml of blood per animal was drawn either on day 42 or 56 in a Clot activator BD Vacutainer®
SSTTM II Advance tube (BD, 367986) each. To promote blood clotting without hemolysis, each
tube was gently inverted five times, and left for 30 min at RT, followed by a 15 min spin at 1,200
xg, as per the manufacturer’s instructions. Serum, thus retrieved from the two animals, was
processed separately. After another 5,000 rpm, 5 min spin, serum was immediately transferred
to 1.5ml tubes, and adjusted to 1x PBS. A 56 °C, 30 min incubation was used to abolish the lytic
complement activity of serum. Precipitation was induced by addition of 1: 1 (v/v) of either
100% (w/v) ammonium sulphate or sodium sulphate dissolved in PBS. The protein pellet
containing IgG was obtained by high speed centrifugation for 15 min at 4 °C. Protein was
resuspended in 1 ml of PBS, 0.02% (w/v) NaN3 with either 20% or 50% (v/v) glycerol, and stored
at -20 °C. The temperature of long term storage was found to affect the long term stability of
antibody, with antibody more stable at -20 °C than 4 °C. Moreover, the antibody stored over a
year at -20 °C with 50% (v/v) glycerol was more soluble and active than that in 20% (v/v)
glycerol.
CHAPTER 3
88
3.2.3 ELISA
ELISA was carried out to monitor the bleed antibody titer. A 96-well PolySorp® plate (Nunc) was
coated with 50 μl of 5 μg Hho1p per ml in 50 mM carbonate (pH 9), 0.5 mM magnesium
chloride buffer per well. The primary antibody dilutions (1: 1,000, 1: 5,000 and 1: 10,000), along
with pre-immune sera (1: 1,000, 1: 5,000, and 1: 25,000), and BSA (0, 5, 25, and 100 μg/ml)
negative control dilutions in PBST were also included. The plate was parafilm sealed, and placed
at 4 °C in a humid chamber comprising wet towels in a covered box. After overnight incubation,
plate was brought to RT, and the liquid was removed by slap drying. The wells were rinsed
thrice with 250 μl PBS/well, each time drawing buffer from the reagent reservoir (Eppendorf,
0030058.607) using a multichannel pipette (Eppendorf, Multichannel P30-300). After washing,
wells were blocked by adding 250 μl PBST, 1% (w/v) BSA, 0.02% (w/v) NaN3 per well, followed
by incubation in the humid chamber for 2 h at RT. Blocking agent was removed by slap drying,
and wells were washed thrice with 250 μl PBST/well. Each well was loaded with 50 μl of a
specific serial dilution of primary αHho1 antibody in PBST, 0.1% (w/v) BSA, 0.02% (w/v) NaN3 (1:
1,000, 1: 5,000, 1: 25,000, 1: 125,000, or 1: 625,000) (see Figure 3.1). Plate was incubated for 2
h at RT, followed by three washes each of 250 μl PBST/well. The wells were loaded with 50 μl of
a specific serial dilution of secondary antibody (Goat α rabbit IgG-AP conjugated; Thermo
Scientific, 31458) in PBST, 0.1% (w/v) BSA, 0.02% (w/v) sodium azide. The secondary antibody
dilutions tested for each experimental or pre-immune sera control dilution were 1: 100, 1: 500,
1: 2,500, 1: 5,000, and 1: 125,000, respectively, while a 1: 5,000 dilution was used for rest of the
controls. After 2 h incubation at RT, wells were washed thrice with PBST, followed by a single 50
mM carbonate (pH 9.0), 0.5 mM magnesium chloride buffer wash. The reaction was started by
addition of 50 μl of 1 mg/ml p-NPP (p-Nitrophenol phosphate) substrate per well, and allowed
to develop in dark for 20 min. To stop the reaction, 50 μl of 0.1 M EDTA (pH 7.5) was added per
well. The plate was shaken for 1 min, and read at A405/490 after 5 min incubation at a mean
temperature of 22.6 °C in a microplate reader (Molecular Devices, SpectraMax® M2). The
experiment was performed in duplicate, and the average A405 was plotted using SigmaPlot 11.0.

CHAPTER 3
89
3.2.4 Generation of monospecific αHho1p antibody by affinity
chromatography
The 55% (w/v) ammonium sulphate fraction of crude Hho1p antiserum was purified by affinity
chromatography on Protein A beads. Also, two chromatographic matrices comprising rHho1p
coupled to amine reactive beads were synthesized for further purification of monospecific
αHho1p antibody. A low speed centrifugation (1,000 xg) was used throughout wash steps to
avoid bead collapse. The affinity purification of αHho1p antibody was monitored by protein
quantification of eluate fractions, and Western blotting. Purification was defined by signal
intensity on X-ray (in pixels) divided by antibody protein concentration used for Western
recognition.
3.2.4.1 Crude antiserum purification on Protein A Sepharose
1 ml of Protein A Sepharose CL-4B matrix (GE Healthcare, 17-0780-01; a gift from L. Cloete,
Hematology, UFS) was equilibrated in PBS, and mixed with 2 ml of 55% (w/v) ammonium
sulphate precipitated fraction of anti-serum dialyzed to PBS. After 1 h binding at RT, beads were
given four PBS washes of 10 ml each. The pure IgG was eluted in 0.9 ml fractions of 0.1 M
glycine (pH 2.5) into tubes containing 0.1 ml of 1 M Tris-HCl (pH 9.4). Protein A column was
equilibrated to PBS immediately after use.
3.2.4.2 Generation of Affi®-gel-10 coupled rHho1p column
An antigen affinity column was prepared by coupling rHho1p to Affi®-gel-10 (Biorad, 153-6099).
Briefly, 1 ml of Affi®-Gel 10 was washed thrice in 1 ml each of cold MQ water, followed by three
equilibration washes in 1 ml coupling buffer (0.05 M MOPS, 0.4 M sodium chloride, pH 7.5). The
gel thus obtained was mixed with 8 mg of rHho1p in coupling buffer, in 9 ml reaction volume,
within 15 min of bead equilibration so as to retain matrix functionality. The coupling reaction
was allowed for 3 h at 4 °C. An aliquot of reaction mixture, before and after coupling, was
retrieved to calculate the efficiency of coupling by protein quantitation. The unreacted sites on
CHAPTER 3
90
the matrix were blocked by incubation with 2 ml of 0.1 M glycine methyl ester (Sigma, G6600)
at RT, rotating. After 2 h, beads were washed with PBS till 0D280 of eluate dropped below 0.02.
The column was washed with 5 CV of 0.1 M glycine (pH 2.5) to remove any uncrosslinked
antigen. The slurry was washed twice with 1 ml coupling buffer each, followed by twice with 1
ml PBS each before being used for antibody purification.
3.2.4.3 Generation of CNBr-activated Sepharose coupled rHho1p column
The lyophilized CNBr activated sepharose CL-4B beads (Sigma, C9142) were swollen by three 15
min washes of 1 mM HCl, using 50 ml volume per g beads each. The beads were equilibrated in
coupling buffer (0.1 M sodium carbonate, 0.5 M sodium chloride, pH 8.3), followed by an
immediate addition to rHho1p to avoid hydrolysis of reactive groups in basic solution. An
appropriate quantity and concentration of rHho1p (ideal protein concentration considering 80%
binding capacity was calculated to be 160 nmol or 4.45 mg Hho1p/g dry bead mass) buffer
exchanged to coupling buffer was used for the purpose. An aliquot was retrieved before and
after coupling for later analysis of coupling efficiency. After overnight rotation at 4 °C, the
unreacted ligand was washed away with coupling buffer. The unreacted matrix groups were
blocked by a 2 h rotation at RT with 50 ml of 1 M ethanolamine (per g dry bead mass). The
beads were washed in 0.1 M sodium acetate (pH 4.0), 0.5 M sodium chloride buffer followed by
a coupling buffer wash. The alternate low and high pH buffer washes each of 50 ml buffer per g
dry bead mass were repeated four times, and the resin was equilibrated in coupling buffer for
downstream utilization.
3.2.5 Coupling of αHho1p antibody to Dyna beads for rHho1p binding
analysis
Approximately 2 x 10⁹ of Dynabeads® M-270 Epoxy (Invitrogen, 143.01D) were equilibrated to
0.1 M sodium phosphate buffer (pH 7.4) by two washes of 10 min each, with vortex and 2 min
magnetic retrieval using Dyna MagTM2 (Life Technologies, 12321D) per wash. The beads were
raised to 0.1 ml in the same buffer and mixed with 0.7 ml of ammonium sulphate precipitated
CHAPTER 3
91
αHho1 antibody (5 mg) dialyzed to 0.1 M phosphate (pH 7.4). The pH and salt concentration
was raised by the addition of 0.1 ml of 0.1 M borate buffer (pH 9.5), and 0.35 ml of 3 M
ammonium sulphate. After 24 h at 4 °C, the beads were given four PBS washes of 1.5 ml each
followed by four PBST, 0.1% (w/v) BSA washes of 1.5 ml each, by 30 min nutation at RT per
wash. Uncrosslinked antibody was washed off with a quick 1.5 ml wash of 0.1 M glycine (pH
2.5), followed by three equilibration washes of 1.5 ml each using 10 mM Tris-HCl (pH 8.8). The
beads were washed thrice with 1.5 ml PBS each, followed by four washes of 1.5 ml PBST each.
They were mixed with 100 μg of rHho1p in 0.8 ml of the same buffer, and incubated at 4 °C,
rotating for covalent coupling. After 3 h, beads were given two 0.5 ml each washes of 10 mM
sodium phosphate (pH 7.4), followed by elution in 0.5 ml fractions of the same buffer
containing 10 mM, 100 mM, or 500 mM sodium perchlorate, respectively. The beads were
stripped with 0.5 ml of 0.1 M sodium citrate (pH 3.0). The eluted fractions were lyophilized and
resuspended in 100 μl PBS each for SDS-PAGE analysis, while beads were washed twice each in
PBS, and PBST followed by suspension in 0.8 ml PBS, 0.02% (w/v) NaN3 for storage at 4 °C.
3.3 Results and Discussion
3.3.1 ELISA
The titer and affinity of the αHho1p antibody raised in rabbit was monitored by ELISA and slot
blot analysis. A schematic for ELISA is portrayed in (Figure 3.1). Relatively low levels of antibody
were detected in the first bleed. However, the titer and specificity of antibody increased with
the progress of the immunization regime.
3.3.2 Optimization of transfer of yeast histones for Western blotting
The electro-transfer of a protein from SDS-polyacrylamide gel to nitrocellulose membrane
requires the protein to be anionic. Histones are highly cationic. So, the level of anionic
detergent in the gel was systematically raised for efficient histone electro-transfer (Figure 3.2).
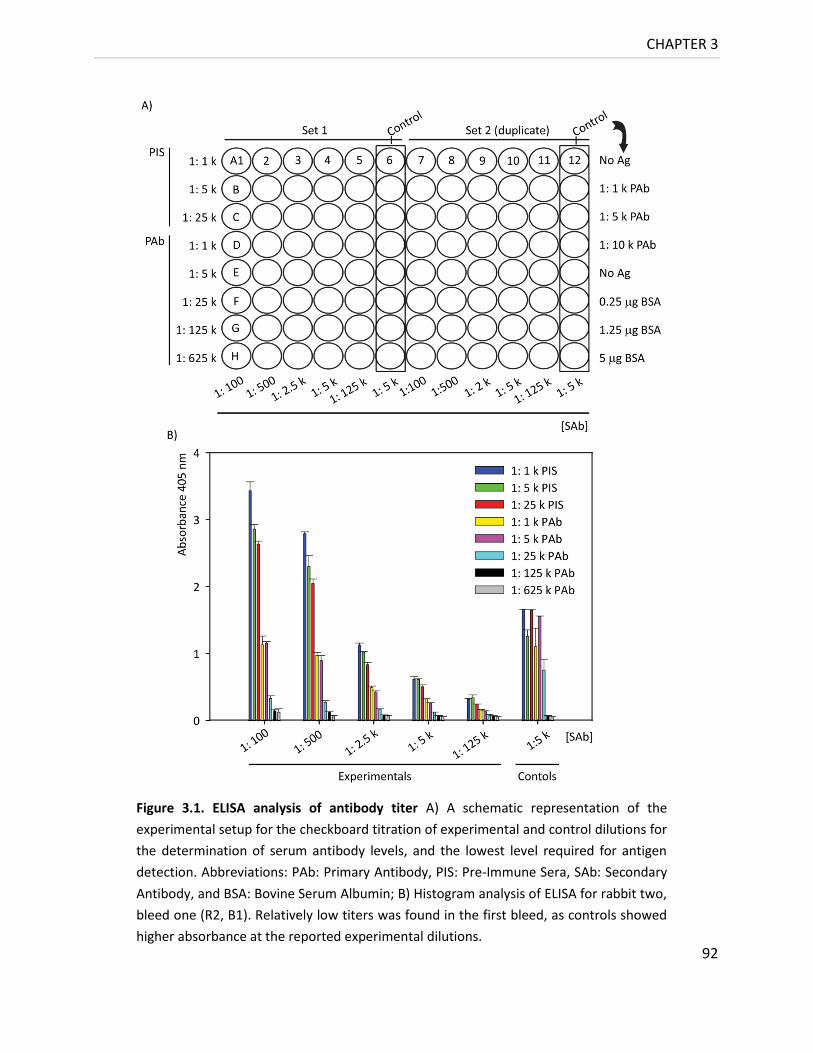
CHAPTER 3
92
Figure 3.1. ELISA analysis of antibody titer A) A schematic representation of the
experimental setup for the checkboard titration of experimental and control dilutions for
the determination of serum antibody levels, and the lowest level required for antigen
detection. Abbreviations: PAb: Primary Antibody, PIS: Pre-Immune Sera, SAb: Secondary
Antibody, and BSA: Bovine Serum Albumin; B) Histogram analysis of ELISA for rabbit two,
bleed one (R2, B1). Relatively low titers was found in the first bleed, as controls showed
higher absorbance at the reported experimental dilutions.
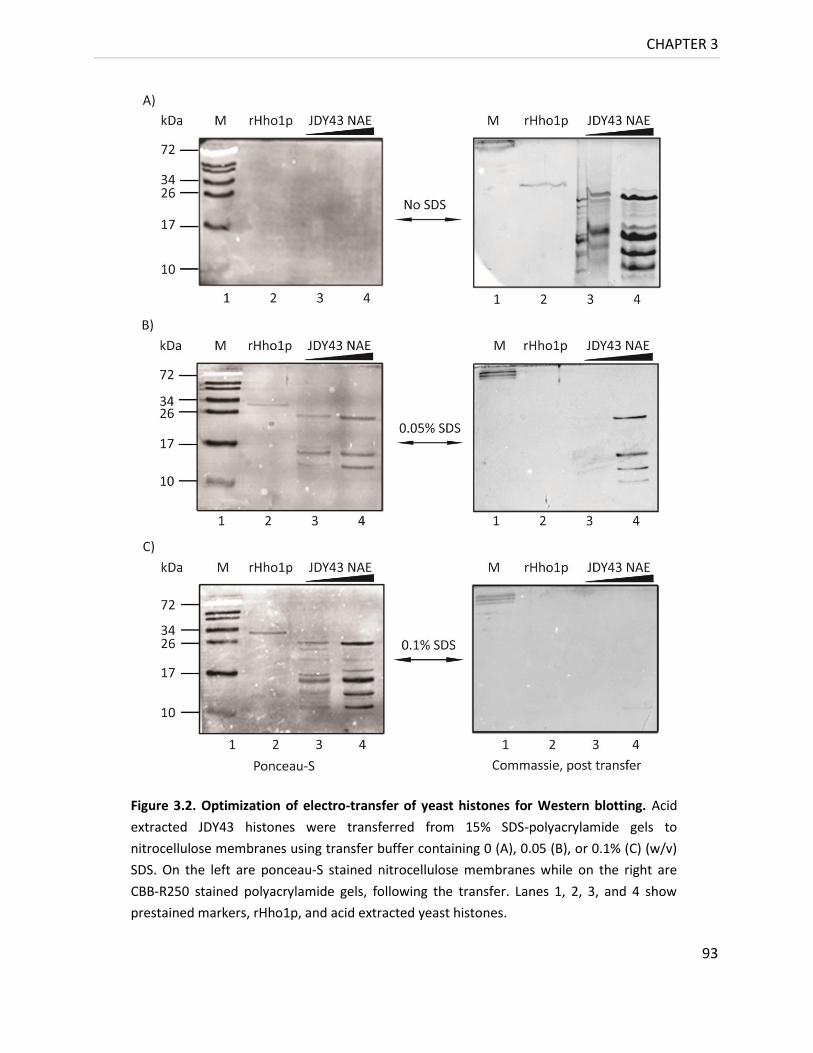
CHAPTER 3
93
Figure 3.2. Optimization of electro-transfer of yeast histones for Western blotting. Acid
extracted JDY43 histones were transferred from 15% SDS-polyacrylamide gels to
nitrocellulose membranes using transfer buffer containing 0 (A), 0.05 (B), or 0.1% (C) (w/v)
SDS. On the left are ponceau-S stained nitrocellulose membranes while on the right are
CBB-R250 stained polyacrylamide gels, following the transfer. Lanes 1, 2, 3, and 4 show
prestained markers, rHho1p, and acid extracted yeast histones.
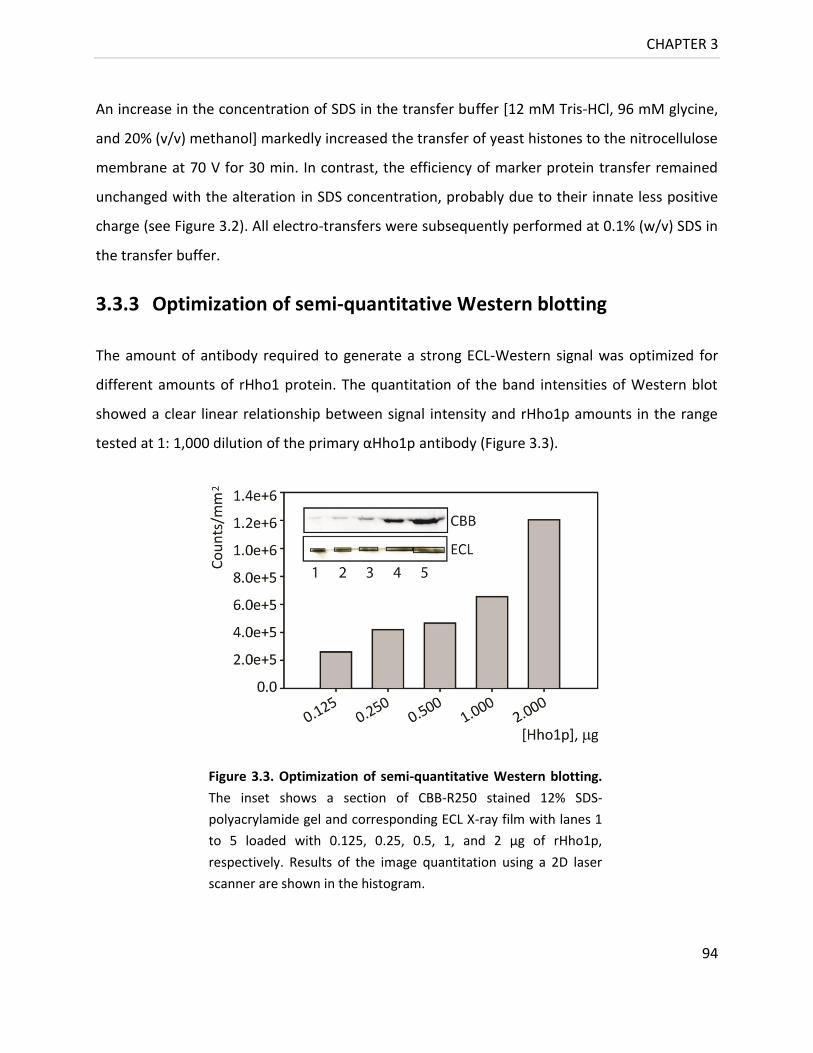
CHAPTER 3
94
An increase in the concentration of SDS in the transfer buffer [12 mM Tris-HCl, 96 mM glycine,
and 20% (v/v) methanol] markedly increased the transfer of yeast histones to the nitrocellulose
membrane at 70 V for 30 min. In contrast, the efficiency of marker protein transfer remained
unchanged with the alteration in SDS concentration, probably due to their innate less positive
charge (see Figure 3.2). All electro-transfers were subsequently performed at 0.1% (w/v) SDS in
the transfer buffer.
3.3.3 Optimization of semi-quantitative Western blotting
The amount of antibody required to generate a strong ECL-Western signal was optimized for
different amounts of rHho1 protein. The quantitation of the band intensities of Western blot
showed a clear linear relationship between signal intensity and rHho1p amounts in the range
tested at 1: 1,000 dilution of the primary αHho1p antibody (Figure 3.3).
Figure 3.3. Optimization of semi-quantitative Western blotting.
The inset shows a section of CBB-R250 stained 12% SDS-
polyacrylamide gel and corresponding ECL X-ray film with lanes 1
to 5 loaded with 0.125, 0.25, 0.5, 1, and 2 μg of rHho1p,
respectively. Results of the image quantitation using a 2D laser
scanner are shown in the histogram.
CHAPTER 3
95
3.3.4 Preparation of a chromatographic matrix for the immune-
purification of the αHho1p antibody
The crude IgG sample prepared by selective precipitation of serum using 55% (w/v) ammonium
sulphate cut was subjected to further purification using affinity chromatography. An affinity
column for the generation of mono-specific αHho1p antibody was created by cross-linking
rHho1p to either Affi®gel-10 or CNBr activated sepharose. Both these matrices are amine
reactive. They were chosen since 22.5% (58 of 258 residues) of the Hho1p sequence comprises
lysine residues which provide surface amino groups readily available for cross-linking. As
expected, a high coupling efficiency of 66% for Affi®-gel-10 and 87% for CNBr activated
sepharose was obtained (readings not shown). Prepared affinity matrices were typically stored
at 4 °C and used within 24-48 h.
3.3.5 Affinity purification of αHho1p antibody on an Affi®-gel-10
coupled rHho1p column
A monospecific fraction of antibody from the crude serum ensemble was successfully enriched
in the eluate chromatographic fraction, as confirmed by semi-quantitative Western blotting
(Figure 3.4). However, the quantity of purified protein was low. Besides, a selective elution of a
protein moving close to IgG heavy chain was observed. Thus, an additional pre-fractionation
step involving purification of crude ammonium sulphate fractionated anti-serum on
Immobilized Protein A Plus matrix was included in the protocol.

CHAPTER 3
96
3.3.6 Affinity purification of αHho1p antibody on Protein A column
An IgG fraction (Rabbit 1, bleed 4) was purified on a Protein A column to eliminate
contaminating non-IgG proteins while selectively retaining IgG fraction (Figure 3.5). Since the
binding capacity of Protein A used ranged from 5-20 mg antibody/ml resin, about 4-5 mg Ab/ml
resin should be the theoretically appropriate protein load required for 80% bead saturation.
Figure 3.4. Elution profile of αHho1p Ab from the antigen
affinity matrix. A CBB-R250 stained 10% Tris-bicine SDS-
polyacrylamide gel with lanes 1 to 6 showing marker SM0431,
load (55% (w/v) ammonium sulphate sera fraction), PBS wash,
1M Gu-HCl wash, and 20 mM glycine, pH 2.5, 10% (v/v) dioxane
eluate fractions. Fractions 2 to 6 were used as primary
antibody in the Western analysis using rHho1p. The inset
shows the semi-quantitative Western blotting results,
confirming the purification of monospecific αHho1p antibody in
the eluate 1 from Affi®-gel-10 coupled rHho1p column.

CHAPTER 3
97
However, loading the column with increasing amounts of serum showed that the performance
was best when the protein load was approximately 3 fold more than the ideal binding capacity
of the matrix. Approximately 10 mg of bead bound rHho1p was, therefore, mixed with 55 mg of
crude IgG and rotated for 1 h at 4 °C as per load suggestion (464). Beads were PBS washed till
OD280 dropped to 1/10th initial value. Specific antibody was eluted in five fractions of 0.1 M
glycine (pH 2.5), 1 CV each, into 1/20th volume of 2 M Tris base. Elution was followed by two
washes of 1 ml, 10% (v/v) dioxane in PBS, followed by two washes of 1 ml, 2 M sodium chloride
in PBS, as per (465). The column was equilibrated to PBS by a 20 CV PBS buffer wash
immediately thereafter. Antibody purification was monitored by SDS-PAGE electrophoresis, and
Western blotting, according to the protocol described in (466, 467). The selective enrichment of
the serum immunoglobulins in the eluates from the Protein A column was confirmed by an
increase in the staining intensity of the immunoglobulin light chain by SDS-PAGE (Figure 3.5).
Figure 3.5. Purification of IgG on Protein A Sepharose. Lanes 1 to 10 in a
CBB-R250 stained 10% Tris-bicine SDS polyacrylamide gel show the
resuspended 55% (w/v) ammonium sulphate precipitate fraction of
αHho1p antiserum input (lane 1), flow through (lane 2), wash (lane 3),
and eluted fractions (lanes 4-10), as in methods.
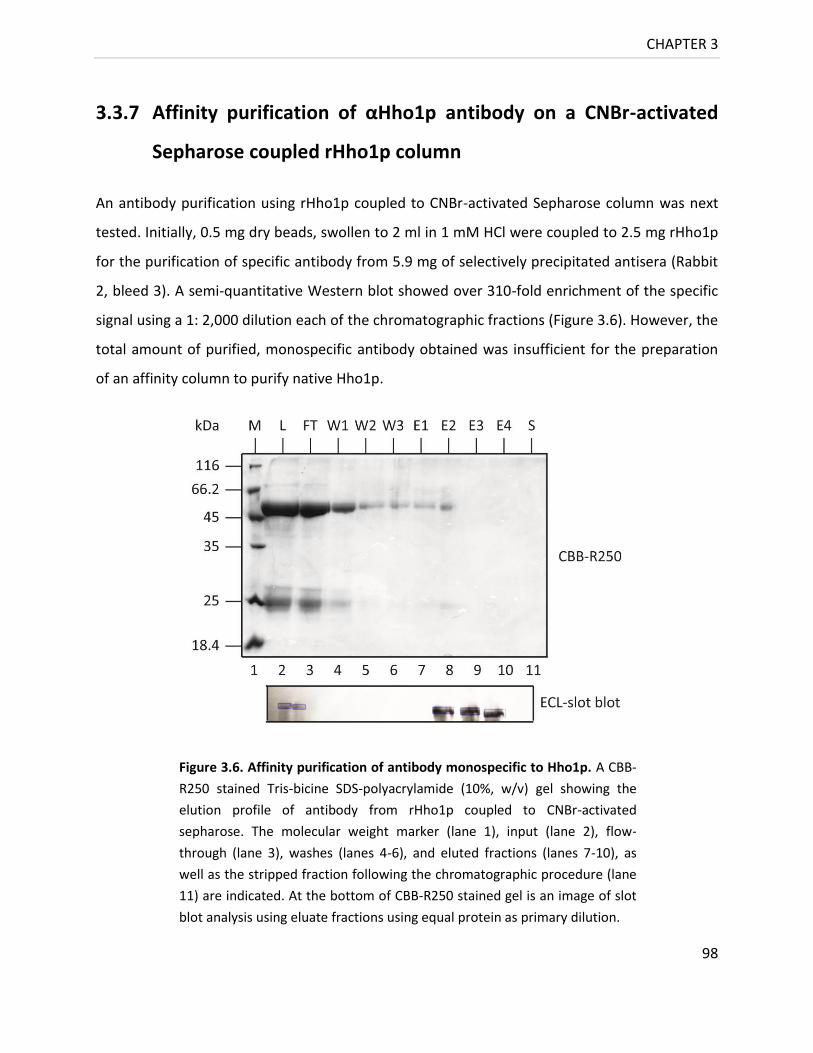
CHAPTER 3
98
3.3.7 Affinity purification of αHho1p antibody on a CNBr-activated
Sepharose coupled rHho1p column
An antibody purification using rHho1p coupled to CNBr-activated Sepharose column was next
tested. Initially, 0.5 mg dry beads, swollen to 2 ml in 1 mM HCl were coupled to 2.5 mg rHho1p
for the purification of specific antibody from 5.9 mg of selectively precipitated antisera (Rabbit
2, bleed 3). A semi-quantitative Western blot showed over 310-fold enrichment of the specific
signal using a 1: 2,000 dilution each of the chromatographic fractions (Figure 3.6). However, the
total amount of purified, monospecific antibody obtained was insufficient for the preparation
of an affinity column to purify native Hho1p.
Figure 3.6. Affinity purification of antibody monospecific to Hho1p. A CBB-
R250 stained Tris-bicine SDS-polyacrylamide (10%, w/v) gel showing the
elution profile of antibody from rHho1p coupled to CNBr-activated
sepharose. The molecular weight marker (lane 1), input (lane 2), flow-
through (lane 3), washes (lanes 4-6), and eluted fractions (lanes 7-10), as
well as the stripped fraction following the chromatographic procedure (lane
11) are indicated. At the bottom of CBB-R250 stained gel is an image of slot
blot analysis using eluate fractions using equal protein as primary dilution.
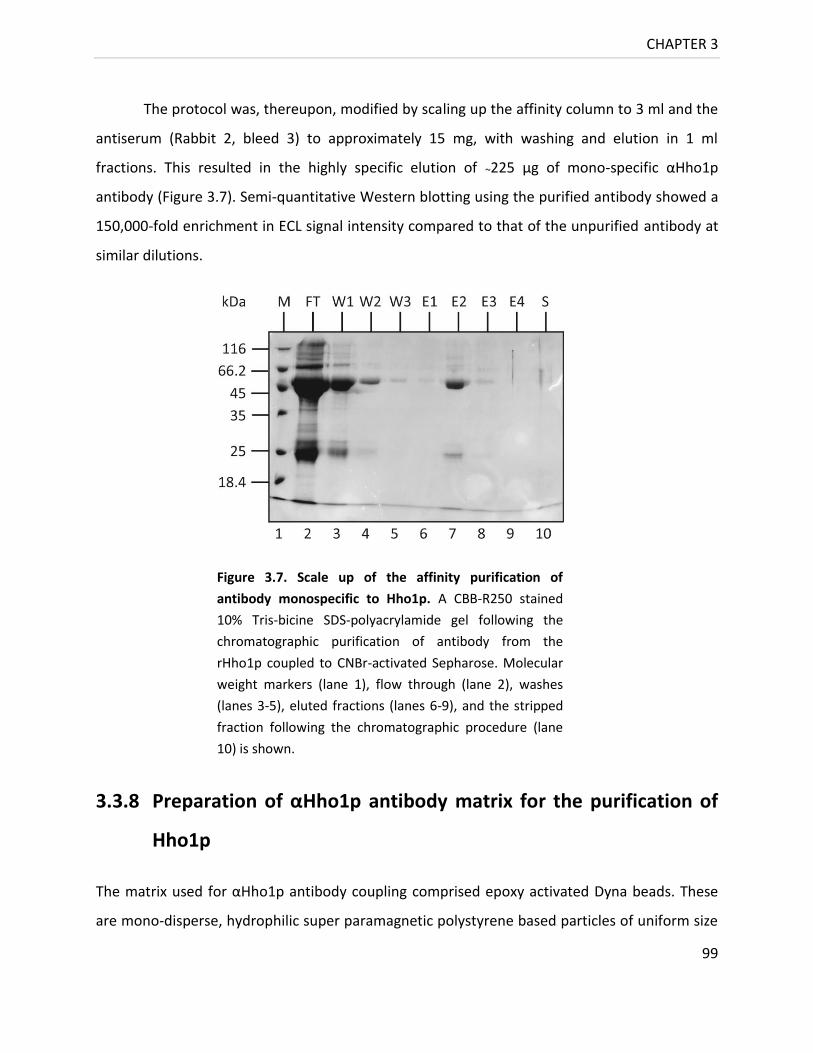
CHAPTER 3
99
The protocol was, thereupon, modified by scaling up the affinity column to 3 ml and the
antiserum (Rabbit 2, bleed 3) to approximately 15 mg, with washing and elution in 1 ml
fractions. This resulted in the highly specific elution of ~225 μg of mono-specific αHho1p
antibody (Figure 3.7). Semi-quantitative Western blotting using the purified antibody showed a
150,000-fold enrichment in ECL signal intensity compared to that of the unpurified antibody at
similar dilutions.
3.3.8 Preparation of αHho1p antibody matrix for the purification of
Hho1p
The matrix used for αHho1p antibody coupling comprised epoxy activated Dyna beads. These
are mono-disperse, hydrophilic super paramagnetic polystyrene based particles of uniform size
Figure 3.7. Scale up of the affinity purification of
antibody monospecific to Hho1p. A CBB-R250 stained
10% Tris-bicine SDS-polyacrylamide gel following the
chromatographic purification of antibody from the
rHho1p coupled to CNBr-activated Sepharose. Molecular
weight markers (lane 1), flow through (lane 2), washes
(lanes 3-5), eluted fractions (lanes 6-9), and the stripped
fraction following the chromatographic procedure (lane
10) is shown.
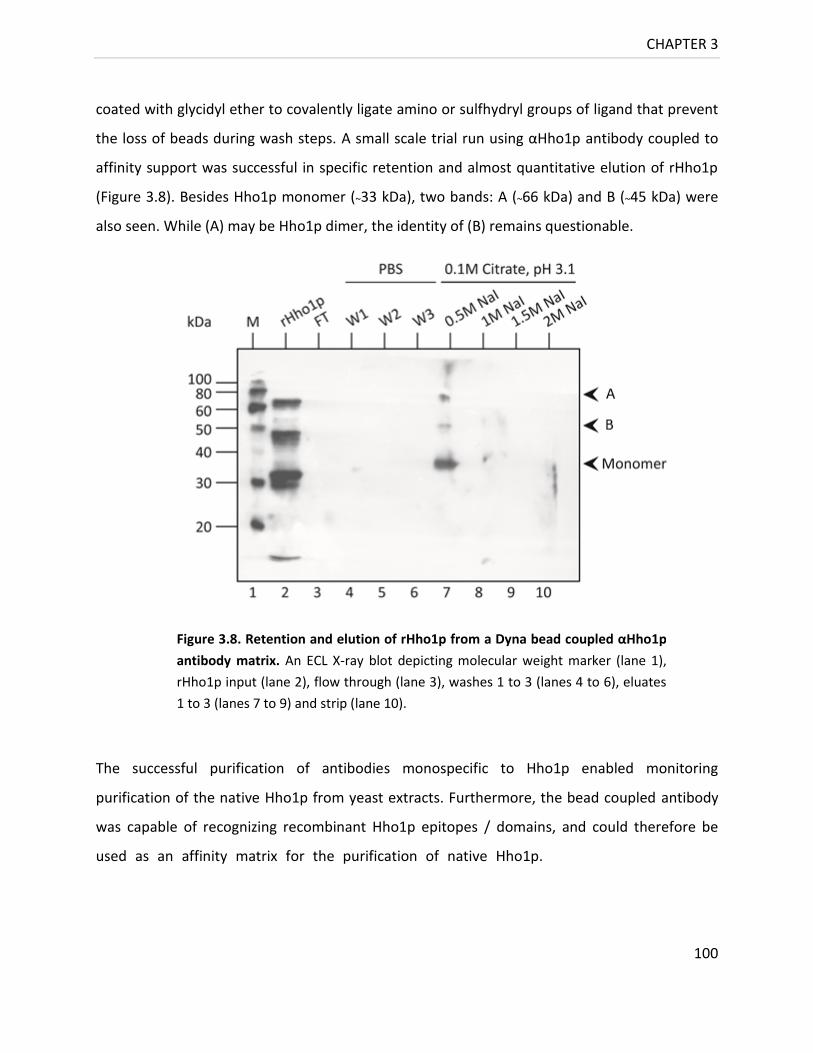
CHAPTER 3
100
coated with glycidyl ether to covalently ligate amino or sulfhydryl groups of ligand that prevent
the loss of beads during wash steps. A small scale trial run using αHho1p antibody coupled to
affinity support was successful in specific retention and almost quantitative elution of rHho1p
(Figure 3.8). Besides Hho1p monomer (~33 kDa), two bands: A (~66 kDa) and B (~45 kDa) were
also seen. While (A) may be Hho1p dimer, the identity of (B) remains questionable.
The successful purification of antibodies monospecific to Hho1p enabled monitoring
purification of the native Hho1p from yeast extracts. Furthermore, the bead coupled antibody
was capable of recognizing recombinant Hho1p epitopes / domains, and could therefore be
used as an affinity matrix for the purification of native Hho1p. …………………………..............
Figure 3.8. Retention and elution of rHho1p from a Dyna bead coupled αHho1p
antibody matrix. An ECL X-ray blot depicting molecular weight marker (lane 1),
rHho1p input (lane 2), flow through (lane 3), washes 1 to 3 (lanes 4 to 6), eluates
1 to 3 (lanes 7 to 9) and strip (lane 10).
CHAPTER 4
101
4 Purification and Characterization of Native
Hho1p
4.1 Introduction and Objectives
Although the role of linker histone phosphorylation in regulating its chromatin binding and cell
cycle has been investigated for decades, the modification status of yeast linker histone Hho1p
remains largely unknown. In this chapter, I report purification of native Hho1p using reverse
phase chromatography and immune-affinity purification. Hho1p purified from logarithmic and
stationary phase of yeast growth was subjected to MS analysis to decipher the factors
regulating its specific binding and eviction with respect chromatin.
4.2 Workflow choice
An unambiguous identification of yeast linker histone along with the number and sites of its
PTMs may require its chromatographic purification followed by Western and MS analysis.
Although RP-LC/MS forms a versatile toolset for high resolution separation and specific
detection of analytes in a complex mixture, in many situations it is necessary to provide
purification, and concentration of desired components beforehand. Such pre-fractionation may
involve depletion of higher abundance proteins to improve the possibility of the ionization and
identification of low abundance protein(s) of interest (468). The enrichment of a protein from a
complex mixture of proteins with a wide dynamic range of concentrations may require selective
solubilization, precipitation, multi-dimensional chromatography etc., or it may be achieved by a
single affinity chromatography step (469–473). Decreasing the number of processing steps
reduces the loss of precious sample (474). We sought to develop a short route to extract
sufficient amounts of purified linker histone from yeast cells to avoid any limitations related to
the scale and efficiency of downstream steps.
CHAPTER 4
102
4.2.1 Hho1p extraction and analysis from whole cells or purified
nuclei
Multiple mechanical and enzymatic interventions for the preparation of yeast nuclei or whole
cell lysate have been documented. The methods of cell rupture may vary depending on
whether the protein extracts will be used for sequence or structure-function analysis. Yeast
cells in pellet or suspension form may either be lysed mechanically or by enzymatic (Zymolyase
or Lyticase) treatment to generate spheroplasts, and extract nuclei. Broadly, the process may
involve one or more of these steps: cell wall reduction, alkali and detergent treatment with
boiling lysis (447, 475), enzymatic lysis, shearing by beating with glass beads; pressure mediated
French press lysis, sonication; osmotic shock, homogenization in a mortar and pestle, or dounce
homogenizer; grinding in a strong blender, freezing and thawing in freezer or dry ice with
ethanol or liquid nitrogen; differential centrifugation; density gradient steps; acetone, alcohol,
or TCA precipitation (476–480).
Extraction of large quantity of linker histone from cell lysate or purified nuclei is
generally accomplished by acid solubilization or elution from a matrix like CM-cellulose,
hydroxyapatite, or phenyl sepharose (481, 482). Either total cell lysate or purified nuclei, lysed
in low or high ionic strength buffer with suitable inhibitors, may be loaded onto an IEX column.
A 0.35 M sodium chloride wash removed HMGs and other non-histone proteins prior to (rat
liver) H1 elution from ion exchange column at 0.5 M sodium chloride. Similarly, sea urchin
sperm H1 eluted at 0.65 M sodium chloride and phosphorylated spermatid H1 eluted at 0.45 M
sodium chloride. The chicken erythrocyte H1 eluted at 0.4 M sodium chloride while the H5
eluted at 0.6 M sodium chloride. However, a significant level of proteolysis might occur during
salt extraction due to the release of active proteolytic enzymes by the procedure (483). In
contrast, exposure to selective linker histone solubilization in perchloric acid followed by
acetone or TCA precipitation may inactivate proteases (484). However, the procedure carries a
distinct risk of irreversible denaturation of linker histone. Even overnight exposure to pH 2 (HCl)
at 4 °C resulted in altered properties compared to salt extracted H1 (485). Acid extracted H1
CHAPTER 4
103
may, therefore, require pH neutralization that can be followed with a pH meter or spotting on a
pH paper, before binding or structural analysis. A brief perchloric acid extraction (10-15 min) at
4 °C, with immediate neutralization, and dialysis against phosphate buffer promoted globular
domain folding (486). Though longer than salt extraction, acid extraction provides higher yield
and purity of linker histone preparations that are more amenable to downstream sequence
analysis (487).
Detergents like SDS, Triton X-100 and NP-40 enjoy widespread application in plasma
membrane lysis (488). However, due to their dual charge properties, detergents bind surfaces
easily, and tend to persist despite multiple washes. They form micelles at their critical micellar
concentrations (489), thereby contaminating RP-HPLC columns. Also, being non-volatile, these
surfactants precipitate around the orifice of the mass spectrometer ionization source. In
addition, they may saturate the detector and suppress mass spectrometric ionization of
molecules of interest, resulting in diminished signal to noise ratio (490). Exceptions include
sodium deoxycholate (CMC% 0.21), an anionic detergent that can be used to extract otherwise
difficult to release nuclear proteins. Sodium deoxycholate (SDC) is MS compatible due to its
unique features like precipitation at low pH, no effect on trypsin activity up to 5%
concentration, and removal from tryptic digest by centrifugation or phase transfer (491, 492).
Besides detergents, the presence of high concentrations of salts like HEPES, Tris, phosphate,
Na+ and K+ ions, ion-pairing reagents like TFA, and plasticizers like PEGs and PPGs, often
encountered in protein chemistry, is detrimental to the ESI process (493). So, an ideal protocol
to extract sufficient quantity of yeast linker histone should not accumulate ESI contaminants.
Importantly, the activity of enzymes likes proteases, deacetylases, and phosphatases
should also be checked during extraction by incorporation of appropriate inhibitors like PMSF,
leupeptin, pepstatin, EDTA and benzamidine (protease inhibitors); p-chloromercuric phenyl
sulfonate, β-glycerophosphate, sodium vanadate, and sodium fluoride (phosphatase inhibitors);
and sodium butyrate (deacetylase inhibitor), as necessary.

CHAPTER 4
104
4.2.2 Platforms for affinity purification and interaction analysis
Physical proximity, whether of co-regulated genes or interacting proteins, contributes to
cellular homeostasis. When combined with genome-wide analysis, analysis of protein contacts
may provide greater insights into cellular processes, such as cell-cycle dependent transcription
(494, 495). For instance, a recent study to demarcate cancer proteome interactions, that used
the yeast two hybrid system to generate the largest protein interaction network available to
date, found that cancer-related proteins tend to cluster (496). Thus, interaction studies may
provide context specific details of cellular behavior, when comparing the normal versus the
altered state (497).
In vitro interaction analysis may be skewed by experimental conditions like presence,
concentration and affinity of competing partners. An ideal interaction analysis may require
providing equal opportunity to all participants to interact in their natural milieu (498);
conditions difficult to mimic in vitro. Therefore, in vitro results may be treated as general
pointers, and not confirmations of in vivo interactions. Rather, the complementation of results
from multiple experimental platforms like yeast two hybrid, mutant analysis, cross-linking, co-
immunoprecipitation, protein affinity columns, mass spectrometry, and / or co-localization,
used as per the relevance to the system, may assist in screening out false positives and
negatives.
A conventional approach to capture transient weak interactions in their physiological
environment is reversible cross-linking, preferably using a membrane permeable, photo-
activatable, and cleavable cross-linker, followed by Co-IP with a tagged version of protein (499–
501). Though such a Co-IP approach provides a handle to freeze the in vivo interactions, it may
lack sensitivity or the purification tag may hinder the establishment of suitable contacts (502).
For example, when the in vivo antigen concentration is low, a controlled addition of excess
antigen to the crude lysate may be required to drive complex formation, keeping in mind that
the antibody interaction with native antigen is not abrogated in the process. Also, depending on
the size of the cross-linker, it may detect nearest neighbors which were not in direct contact.
CHAPTER 4
105
An alternative approach, which is amenable to scaling up, involves coupling purified
protein or its subunits to a resin to prepare an affinity column to pull down the interacting
proteins from the crude extract. However, this approach also suffers from serious pitfalls. These
include necessity of protein expression in a host to allow suitable folding by chaperones and
appropriate post-translational modifications, which might promote or disrupt the
corresponding interactions (503). Such an over-expression, in-turn, might disrupt host
metabolism and physiology by altering the balance of different components of a complex
structure (504, 505). For example, over-expression of sea-urchin H1 in yeast reduces cell growth
and survival, without altering the nucleosome repeat length (291). Similarly, over-expression of
certain proteins like HER2, MYC, REL, or AKT2 is known to drive cancer progression (506).
Besides, proteins involved in multi-subunit complexes, like ribosomes, are twice as likely to be
dosage sensitive than their counterparts (507).
Another relatively mild approach to large scale purification of a native protein, with or
without its binding partners, involves the utilization of an antigen specific antibody affinity
column (508, 509). It exploits the specificity of Staphylococcus protein A derivative proteins for
Fc (fragment crystallizable) region of immunoglobulin (IgG) to generate a specific matrix with
tethered antibody poised for antigen binding. In general, a protein A based matrix can capture
twice as much active antibody as compared to chemically activated matrix with a similar
binding capacity. Further, designing interaction specificity involves optimization of several key
parameters. Firstly, a high cell lysate protein concentration (5-20 mg/ml) is suitable for
capturing low-affinity (transient), high-binding constant (specific) protein interactions in a
crowded space. Secondly, the ionic strength of buffer used, and the stringency of washes given
can be a factor to maximize the tradeoff between affinity and specificity (510). Thirdly, time of
incubation and buffer conditions for lysis may govern the protein stability, native configuration
or modification state. A drawback of this method, however, is the elution of excess antibody
from the column, which hampers the downstream sample processing by reducing the visibility
of low abundance peptides, either by masking the signal of proteins running at the same
molecular weight as antibody chains in Western blot, or by hampering their ionization and
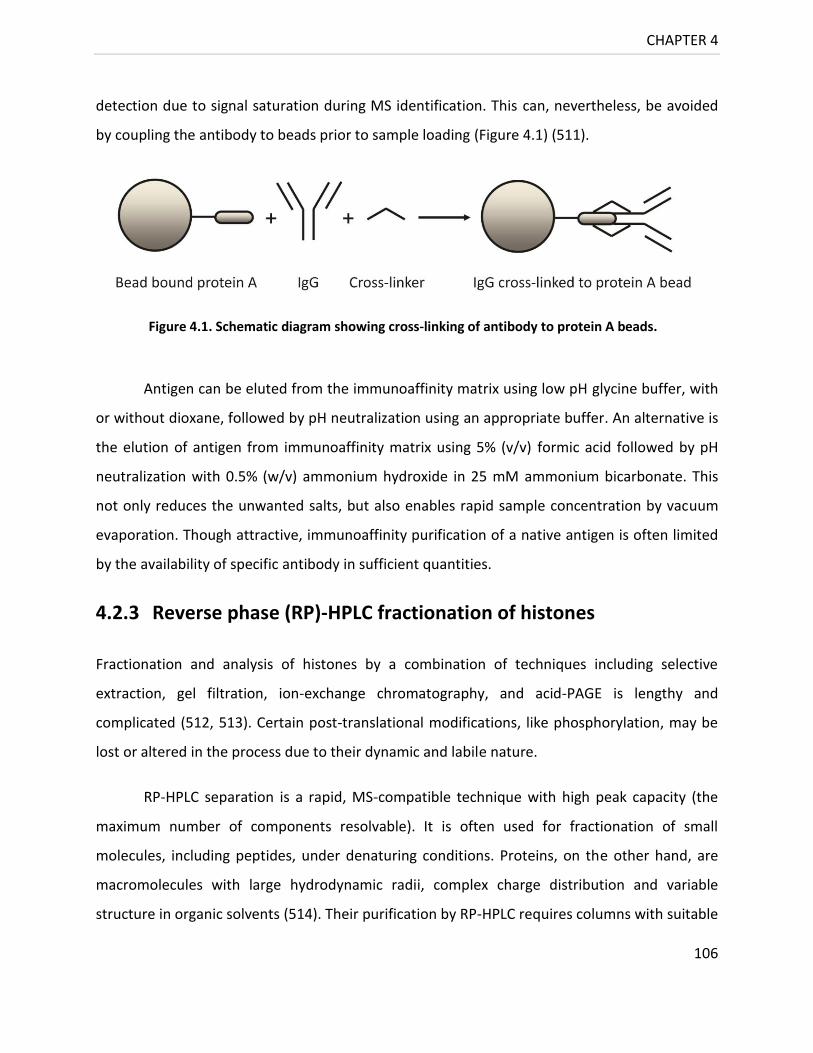
CHAPTER 4
106
detection due to signal saturation during MS identification. This can, nevertheless, be avoided
by coupling the antibody to beads prior to sample loading (Figure 4.1) (511).
Antigen can be eluted from the immunoaffinity matrix using low pH glycine buffer, with
or without dioxane, followed by pH neutralization using an appropriate buffer. An alternative is
the elution of antigen from immunoaffinity matrix using 5% (v/v) formic acid followed by pH
neutralization with 0.5% (w/v) ammonium hydroxide in 25 mM ammonium bicarbonate. This
not only reduces the unwanted salts, but also enables rapid sample concentration by vacuum
evaporation. Though attractive, immunoaffinity purification of a native antigen is often limited
by the availability of specific antibody in sufficient quantities.
4.2.3 Reverse phase (RP)-HPLC fractionation of histones
Fractionation and analysis of histones by a combination of techniques including selective
extraction, gel filtration, ion-exchange chromatography, and acid-PAGE is lengthy and
complicated (512, 513). Certain post-translational modifications, like phosphorylation, may be
lost or altered in the process due to their dynamic and labile nature.
RP-HPLC separation is a rapid, MS-compatible technique with high peak capacity (the
maximum number of components resolvable). It is often used for fractionation of small
molecules, including peptides, under denaturing conditions. Proteins, on the other hand, are
macromolecules with large hydrodynamic radii, complex charge distribution and variable
structure in organic solvents (514). Their purification by RP-HPLC requires columns with suitable
Figure 4.1. Schematic diagram showing cross-linking of antibody to protein A beads.
CHAPTER 4
107
surface modifications and pore size for mass transfer. Several brands of RP-HPLC columns with
variable performance based on mean pore-diameter, end-capping, packing density, surface
area, dimensions, and surface chemistry, like modifications, residual silanol concentration, and
reactivity are now commercially available for protein purification. This became a reality with
the preparation of uniform, spherical, metal-free, inert, wide pore silica, and its stable
modification by hydrocarbenous bonded phases. Hence, protein RP-columns with desirable
properties like suitable pore size distribution (30-100 nm), high packing density (0.5-0.6 g/ml),
and operation under a range of experimental conditions, without the loss of resolution or
surface chemistry were developed over time. Incident reduction in stationary phase particle
diameter to micron level increased the outer surface area of beads, thereby enabling
achievement of theoretical plates for a given separation in much shorter columns. However,
since pressure is inversely proportional to the square of particle size, the concomitant
improvement in speed of analysis and detection sensitivity came at the cost of pressure drops
beyond 2 MPa/cm, leading to the development of ultra-high pressure liquid chromatography
instruments for high throughput work.
The increase in C-chain-length of bonded phase from C2 to C30 increases the column
lipophilicity, thereby altering analyte retention. Generally, C4 is used for very hydrophobic
proteins, C8 for moderately hydrophobic proteins, and C18 chain length for hydrophilic
proteins. The C18-RP columns, ideal for separation of small molecular weight hydrophilic
peptides and proteins, have increasingly been used for histone purification. In comparison, the
enhanced biomolecular separations achieved by perfusion through porous rod-like monolithic
columns, attributed to higher convective mass transfer due to inter-connectivity of mesopores,
and lack of interstitial voids, has not garnered equal support from the biological chemists.
Besides, performance modulation of LC-system by temperature, internal diameter, length,
capacity and selectivity of the columns, and strength of eluting solvents, use of appropriate
buffers and ion-pairing reagents have advanced. For example, it is now understood that the
shorter (50-100 mm) columns generally avoid long transit times in harsh RP-HPLC environment
CHAPTER 4
108
that may otherwise result in peak broadening at slow flow rates, and efficiency does not
improve much with columns longer than 100 mm.
Histone fractionation by reverse phase started during the 1980s using silica bonded
cyanopropylsilane (CN), octadecylsilane (C18) and butylsilane (C4) columns, with TFA as
modifier (515, 516). The modifier acidifies the pH, preventing dissociation of surface silanol
groups, thereby facilitating separation based on hydrophobic interaction, rather than cation-
exchange; besides prolonging column shelf-life and diminishing ghost peaks. However, TFA was
found to suppress mass spectrometric ionization, and was soon replaced by formic acid in MS
coupled LC separations. Histone from HT29 cells were purified by RP-HPLC on a C4 Jupiter
column using an organic gradient with either 0.04% (v/v) heptafluoro- butyric acid (HFBA) or
0.4% (v/v) FA or 0.06% (v/v) TFA as modifier based on the adjustment of relative concentration
of acids inversely proportional to their hydrophobicity. The volatile nature of the water-ACN-
TFA eluting solvent facilitates recovery of salt-free histones from the fractions by direct
lyophilization of the column effluent.
Chicken erythrocyte H1 and H5 were separated from total chicken histones using RP-
HPLC on a Beckman Ultrapore C8 analytical column (517), while yeast core histones were
fractionated, albeit poorly, using Agilent Zorbax protein-plus analytical column under an ACN
gradient, with 0.1% (v/v) TFA (307). Similarly, Tetrahymena and Drosophila core histones were
separated on a Brownlee Aquapore RP-300 analytical column with an ACN gradient, using 0.1%
(v/v) TFA (518). Histones from HEK293 cells (487), histones H3 and H4 from yeast (519), and
the macro nuclear H1 from Tetrahymena thermophila (418) were resolved from nuclear acid
extracts on a PerkinElmer Aquapore RP-300 C8 analytical column using an ACN gradient, with
0.1% (v:v) TFA, while HeLa S3 H1 was purified using a Vydac C18 analytical column using an ACN
gradient with 0.1% (v/v) TFA (348). These studies provide a rich knowledge resource on which
to base the development of a RP-HPLC method to isolate yeast H1.

CHAPTER 4
109
4.2.4 A primer on Mass Spectrometry
4.2.4.1 MS as a tool for detection and quantitation
Until 1980s, automated Edman degradation, coupled to HPLC, was the preferred method for
protein sequencing (520). However, it did not work well on long peptides with hydrophobic
residues or blocked N-terminal amino acid. HPLC analysis improved with the introduction of MS
as a detection tool because of the sensitivity, limits of detection, resolution, mass range and
accuracy, speed of operation, flexibility and capability of analyzing complex mixtures of latter
(521–523). In gist, MS involved ionization at source, sorting (with or without fragmentation) in
the mass analyzer, and ion-detection at the detector, under high vacuum. It could be used for
qualitative or quantitative characterization of molecule(s) in gas phase, and overtime became
the workhorse for proteomics, corroborated by a concomitant increase in number of
publications regarding MS, in general, from the 1940s onwards (524–526).
4.2.4.2 MS instrumentation
The use of MS in biological sciences increased tremendously owing to the development of two
soft techniques for condensed-phase ionization of intact, large, polar molecules by desorption:
MALDI (527), and ESI (528) (Noble prize in Chemistry, 2002). In MALDI, desorption is induced by
the absorption of pulsed laser by the matrix; while in ESI (Figure 4.2), ions are produced by
columbic explosion of a pneumatically driven charged droplet due to increase in charge with
solvent evaporation when passed through a small nebulizer maintained at a high voltage and
temperature.
There are multiple advantages to the use of ESI. Firstly, it provides a convenient
interface to directly couple LC-separations with MS-characterization. Secondly, ESI enables
replication for limited sampling experiments due to less sample consumption (529). The
miniaturization of ion spray with advent of the nanoelectrospray capillary emitter orifice (id ~1-
2 μm) enabled a continuous slow plume (flow rate ~10-20 nl/min) at lower capillary voltages
(500-800 V) without pumping. The resultant increase in droplet surface to volume ratio, not
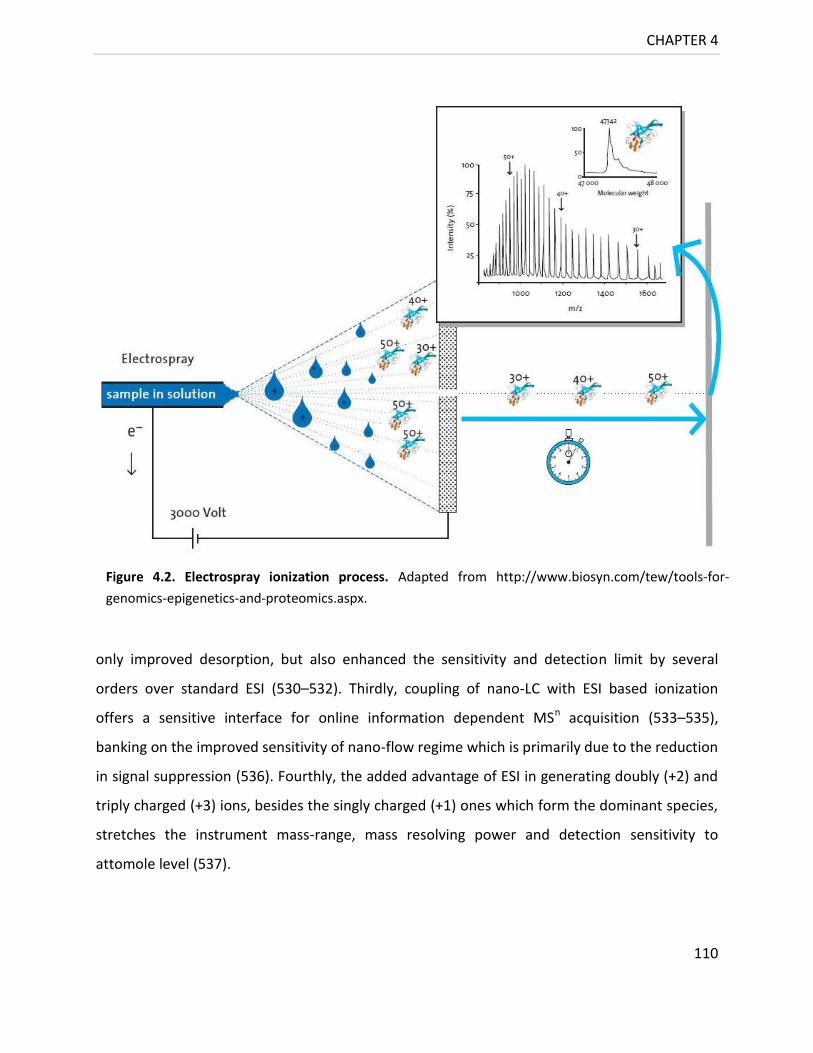
CHAPTER 4
110
only improved desorption, but also enhanced the sensitivity and detection limit by several
orders over standard ESI (530–532). Thirdly, coupling of nano-LC with ESI based ionization
offers a sensitive interface for online information dependent MSn acquisition (533–535),
banking on the improved sensitivity of nano-flow regime which is primarily due to the reduction
in signal suppression (536). Fourthly, the added advantage of ESI in generating doubly (+2) and
triply charged (+3) ions, besides the singly charged (+1) ones which form the dominant species,
stretches the instrument mass-range, mass resolving power and detection sensitivity to
attomole level (537).
Figure 4.2. Electrospray ionization process. Adapted from http://www.biosyn.com/tew/tools-for-
genomics-epigenetics-and-proteomics.aspx.
CHAPTER 4
111
Depending on the mass analyzer, ions can be separated on their m/z values utilizing
static or dynamic magnetic or electrical fields, with or without fragmentation. Analyzers used
include Q, IT, TOF, ion mobility, magnetic sector, FT-ICR, orbitrap or one of the hybrid
instrument configurations, like QIT-TOF, Qq-LIT, Q- orthogonal TOF, Qq-TOF, LIT-ICR, Qq-ICR, or
LTQ-Orbitrap interfaced with various ionization platforms, and available from a range of
manufacturers.
The separation of ions in a time-of-flight analyzer is simply based on the drift of ions in a
field free region with the kinetic energy provided at the flight path entrance. In contrast,
separation of ions in a quadrupole analyzer, discovered in 1950s (538)(Noble prize in Physics,
1989), is based on selective instability of their trajectories in an alternating direct current (DC)
and radio frequency (RF) voltage field. In an ion trap, ions of broad m/z range are periodically
gated by DC, activated by buffer gas collisions, and subsequently scanned out in a selective
sequential manner by RF (and auxiliary alternate current) ramp. A MALDI-TOF combination uses
relatively lower protein, tolerates up to 100 mM salts, and provides greater mass accuracy
compared to ESI-quadrupole instruments (539). The sample is dried onto a metal plate in the
presence of UV absorbing matrix like HCCA or cinapinic acid. Salt and buffer components are
washed away before MALDI. The highest resolving power (R ~106), or the ability to separate
peaks of given m/z values, as measured by full width at half maximum height (FWHM) is,
however, achieved by the FT-ICR (540). An FT-ICR confines ions laterally by a static magnetic
field and axially by a static electric field, and excites them by a broadband RF pulse to a
resonant orbital motion. A FT of this nondestructive image current transient provides the
frequency of ion cloud motion (ωc), which in turn is used to obtain the m/q of trapped ions. An
orbitrap also acts as an ion-trap, but instead of using a magnetic field or RF, it utilizes the
centrifugal force, arising from initial tangential momentum of ions from C-trap, to orbitally
rotate them in an electrostatic field created by a central spindle electrode and an outer barrel-
like electrode (541). While an FT-ICR offers better resolution for lower m/z ions [ωc = qB0/m], an
orbitrap [ωc = (qB0/m) 1/2] may outperform it at higher m/z values, e.g., above m/z 800 for an
FT-ICR with 7T magnet (542). Depending on the frequency of recalibration, the mass accuracy
CHAPTER 4
112
(Δm) of an analyzer generally varies from 0.5 u or 100 ppm (quadrupole) to 10-3-10-4 u or 0.5
ppm (FT-ICR). Error in mass measurement depends on factors like resolving power, scan rate,
scanning method, signal-to-noise ratio of the peaks, peak shapes, overlap of isotopic peaks at
the same nominal mass, mass difference between adjacent reference peaks, etc.
The overall sensitivity of the instrument towards abundant as well as trace analytes,
detected with a certain confidence, is governed by its efficiency. MS efficiency is equal to ion
transmission multiplied by duty cycle, i.e., the fraction of ions of interest formed for mass
analysis per ionization cycle. However, it is the sensitivity and linear dynamic range of the ion
detector (range over which the ion signal in a spectrum is linear with the analyte signal) which
sets the instruments limit of detection (LOD). The detector output current is converted to a
voltage signal, which is translated to an intensity value by analog-to-digital converter (ADC). The
speed of ADC, reported as dwell time per data point (in ns) or sampling frequency (in GHz),
determines the peak shape and intensity. Scanning mass spectrometers usually employ a
secondary electron multiplier detector, which records ion impact to generate a cascade of
secondary electrons. Traditional analog based detectors have been improved upon by novel
pulse based detection, as in Q-TRAP 5500. High mass range ions in TOF instruments may
require a post acceleration detector or a cryogenic detector. In contrast, image current
detection instruments, like the orbitrap and FT-ICR, do not use a detector. Because of their slow
scan rate, Q, Q-IT, and magnetic sector instruments can be equipped with faster ADC (16-20 bit)
to improve the linear dynamic range, thus conferring them with superior quantization ability
(535).
4.2.4.3 MS fragmentation and workflow design
The Q-TRAP 4000 (Sciex), a triple quadrupole linear-ion-trap MS, offers tandem-in-space MS. It
brings together the specificity of triple quadrupole ion detection scan modes with the
sensitivity of linear-ion-trap operational modes. Unique scan modes include triple quadrupole
precursor ion and neutral loss scans for modified peptide identification, in addition to ion-trap
scan modes like enhanced product-ion scan, where Q3 traps and selects to determine sites of

CHAPTER 4
113
modification (535). The Q1 and Q3 quadrupoles are coordinated to improve peak shape in an
enhanced resolution scan. Besides the small size, ease of operation, relatively low cost and
maintenance, makes Q-TRAP the instrument of choice for quantitative single or multiple
reaction monitoring analysis of plethora of complex mixtures (543). An MRM is a hypothesis
driven scan where both the mass analyzers (Q1 and Q3) are set to scan m/z ions of predefined
value for quantitative detection of low abundance analytes in a complex matrix (544).
MS/MS in a Q-TRAP involves fragmentation of precursor ion into product ions by
collision induced dissociation (CID) in quadrupole q2 (collision cell) (545). Low energy CID (>200
eV) is usually used in quadrupole and ion-trap based instruments, in contrast to high energy CID
(3-10 keV) utilized in TOF and magnetic sector based instruments (546). In CID, the translational
energy of excited peptide ions is converted into internal energy by inelastic collisional excitation
with an inert gas like helium or argon leading to the subsequent unimolecular decomposition,
i.e., amide bond fragmentation to produce N-terminal b and C-terminal y ions (547, 548). CID is
an ergodic ion activation technique. Therefore, neutral losses and secondary fragmentation
pathways such as water, NH4+, and CO losses, besides doubly charged y ions, are the key to
spectral interpretation (549, 550). Other modes of dissociation include surface induced
dissociation (SID), electromagnetic radiation induced dissociation (ERID), electron capture
dissociation (ECD) and electron transfer dissociation (ETD). Since ECD provides non-ergodic
fragmentation, it is ideal for de novo sequencing of modified and / or long cationic peptides.
But its use is limited to expensive FT-ICR instruments, because the hot electrons used for ECD
fragmentation are difficult to trap. ETD, on the other hand, is compatible with conventional RF
ion trap instruments as it involves collision mediated transfer of an electron from an anion to
the peptide ion leading to sequence specific amide bond cleavage to generate N-terminal c- and
C-terminal z.-series ions.
4.2.4.4 MS data analysis
Deconvolution of MS data, which may be in the form of an ion count spectrum (TIC),
representing signal intensity (relative ion-abundance on ordinate) versus m/z (mass-to-charge
CHAPTER 4
114
ratio on abscissa), may provide molecular weight, sequence, and possibly structure information
(551). A variety of tools, data repositories, de novo sequencing algorithms and statistical
validation software can be utilized for the purpose. The ion intensity for any peptide in an LC-
MS run can be integrated over time from raw data as extracted ion current (XIC), to quantify
the ionic abundance using software such as Serac Peak Extractor, ASAPratio, MSQuant, RelEx,
or XPRESS, etc. Extended data acquisition and subsequent averaging of the spectra may reduce
the background chemical or electronic noise, thereby improving the signal-to-noise ratio. The
clustering and visualization of resultant LC-MS data using programs like MSight, msInspect,
OpenMS, SpecArray, 3DSpectra, ProSight Lite, and XCMS may assist quantitative imaging (552).
For example, for HeatMap or 2D-LC MS/MS spectra, the retention time is plotted versus m/z,
with color coded signal intensities, and sharpness of spots depicting chromatographic peak
resolution achieved at a particular point in gradient (553, 554). Decoding the MS spectra may
require de novo sequencing (555, 556), or spectral matching to establish peptide identity.
Spectral matching is performed by searching standalone or online sequence databases, like nr
(NCBI), or SwissProt using various algorithms, like MASCOT or SEQUEST (commercial);
X!Tandem or InsPect (open-source); or GutenTag (free-ware). Database searches are based on a
probability scoring function, under a set of user specified constraints and results might vary
depending on database curation as well as comprehensiveness. Results thereof may be
validated by statistical tools like PeptideProphet (557).
4.2.4.5 Bottom-up histone LC-MS/MS analysis
Bottom-up proteomics uses protein digested into manageable peptides for MS-analysis.
Although it does not provide information regarding isoform or combinatorial modification
pattern of a protein, bottom-up-proteomics is a sensitive technique that simplifies analysis, and
requires relatively low expertise and budget (558).
The ionization response of ESI interface may show an inverse relationship with HPLC
retention (559). This implicates that the poor retention of hydrophilic peptides, such as histone
peptides, on reverse phase HPLC column would correspond to generation of a low ESI sample
CHAPTER 4
115
ion current. However, the addition of dilute acids and bases in the positive and negative ion
modes, respectively, could improve ionization and signal intensity.
Trypsin was the first protease to be discovered (560), and continues to be the protease
of choice for bottom-up proteomics applications (561). Under optimum conditions (562, 563),
trypsin digestion generates a complex peptide mixture with multiple overlaps in sequence by
highly efficient and specific cleavage C-terminal to lysine and arginine residues, unless they are
followed by a proline (564). However, histones are highly basic proteins with relatively small
molecular weight. Their trypsinization yields very small molecular weight peptides that show
poor retention on RP columns, especially when phosphorylated (565). NHS-propionate
derivatization of lysine residues blocks trypsin cleavage C-terminal to lysines and improves RP-
LC retention (418, 566, 567). Similarly, reductive methylation of lysine side chains limits
subsequent tryptic cleavage to arginyl bonds. Trypsin miscleavage C-terminus to a modified
residue, like trimethyl-lysine, also needs consideration during sequence analysis (568). Also, to
avoid complexity due to autolysis of trypsin, acetylated or reductively methylated trypsin may
be used. Apart from trypsin, there are many other proteases like GluC, Chymotrypsin,
Endopeptidase LysC etc. to choose from. Staphylococcal aureus V8 GluC, for example, is a
serine protease that digests glutamyl bonds (E↓) in ammonium acetate buffer (pH 4 or 7), and
both glutamyl and aspartyl bonds (D/E↓) in phosphate buffer (pH 7.8). Incubation at <25 °C
prevents GluC (molecular weight = 30 kDa) autolysis, while the presence of proline on C-
terminus inhibits cleavage.
In gel digestion is effective in protein fractionation by GeLC-MS workflow. However, it
results in biased sample loss, resulting in irreproducibility and overall lower recovery compared
to in-solution digestion and peptide fractionation methods (569–571). Further, reduction in
digestion time from the usual overnight incubation minimizes erroneous peptide deamidation
by 50% (572).
The combination of isotopic labeling with MS, may allow relative protein and PTM
quantitation, besides being used for conformation or mechanism analysis studies (573, 574).

CHAPTER 4
116
However, due to differences in cell wall porosity between logarithmic and stationary phase cell
populations, metabolic incorporation of a label, such as a dilution of a stable isotope, may not
be equal (575, 576). Also, the relative efficiency of protein extraction may vary, rendering label
free quantitation obsolete (577). Moreover, at any given time, a cycling cell population may
have cells from various stages of development with stochastic PTM levels, such that only a
subset of protein of its cellular pool may be modified at any given time point. In addition, there
may be a complex combinatorial nature of modification pattern amongst spatially localized
protein subsets. Although the co-existence of PTMs might be biologically relevant to ascertain
multiple roles of a protein within the cellular environment, it makes the proportional
comparison of modification stoichiometry under the given set of conditions tedious. Reasons
include the difficulty in detection of certain PTMs due to presence of neighboring modifications,
lack of conveniently located sites for proteolysis, variable peptide generation in individual
protease digestions, run-to-run LC retention time variation, and non-uniform (modified)
peptide ionization, thereby resulting in differential detection sensitivity. Thus, instead of
seeking to acquire unique and replicable quantitative PTM data, using label or label-free
approaches, we sought to focus our attention on recognition of qualitative differences amongst
the modification status of Hho1p using bottom up sequencing.
4.3 Materials and Methods
4.3.1 Yeast strains and growth medium
W303-1A [MATa, leu2-3, 112 trp1-1, can1-100, ura3-1, ade2-1, his3-11,15], BY 4741 [MATa,
his3Δ1, leu2Δ0, ura3Δ0, met15Δ0, YDR242w::kanMX4], BY 4742 [MATα, his3Δ1, leu2Δ0,
ura3Δ0, lys2Δ0, YDR242w::kanMX4], and ΔHHO1 strain (Open biosystems BY4741, YSC1021-
552018) were grown on YPD: 1% (w/v) yeast extract, 2% (w/v) bacto-peptone, 2% (w/v)
glucose; or YPDA- YPD with 1.5% (w/v) agar. JDY 43 [MATa, leu2-3, leu2-112, his 4-580, ura3-52,
tpl-289, genomic C-terminally myc-tagged HHO1] (a gift from J. Downs) was grown on 6.7%
(w/v) YNB without amino acids [0.1% (w/v) potassium dihydrogen phosphate, 0.5% (w/v)
ammonium sulphate, 0.05% (w/v) magnesium sulphate, 0.01% (w/v) sodium chloride, 0.01%
CHAPTER 4
117
(w/v) calcium chloride, 0.0002% (w/v) inositol), 0.2% (w/v) CSM –trp, 1% (w/v) glucose]; YNBA-
YNB with 1.5% (w/v) agar. Glycerol stocks were maintained in 15% (v/v) glycerol: YPD at -80 °C.
4.3.2 Cell counting
Cells were counted in disposable cell counting slides (Fastread, BVS100) with Petroff Hausser
type counting chambers. Each plate had 10 of 4 x 4 grids, each of which measured 1 x 1 mm,
and held 0.1 μl sample. Total cells per ml were calculated as total cell counts multiplied by
sample dilution, if any, and a factor of 104 (0.1 μl sample) divided by number of total 4 x 4 grids
counted. A haploid cell density of A660 0.7 in YPD from mid-logarithmic phase cells was
considered approximately 107 cells/ml, while that of A660 6.6, approximately, 2 X 10⁸ cells/ml for
stationary phase cells.
4.3.3 DAPI Staining and Microscopy
Protocol for staining yeast nuclei using DAPI was adapted from (578). For Elieen’s DAPI
mounting media preparation, 50 mg p-phenylenediamine was dissolved in 5 ml PBS, and the pH
was adjusted to 9.0 using NaOH. The solution was stirred to homogeneity with 45 ml glycerol,
followed by addition of 2.25 μl of 1 mg/ml DAPI in water, aliquoted and froze in the dark (579).
For fixing, 1ml of yeast cells was incubated with 0.1 ml of 36% formaldehyde at RT for 1-2 h.
The cell pellet was washed twice with 1 ml of water each and resuspended in 1 ml of 70% (v/v)
aqueous ethanol. After 30 min of fixing at RT, cells were spun down, resuspended in 0.5 ml
water, and sonicated for 5 s. Cells were spun down at 10,000 rpm for 5 min, and the pellet was
resuspended in 0.2 ml of 1% (v/v) aqueous Triton X-100 by vortexing. For staining, an aliquot (4
μl) of Eileen’s premade DAPI was mixed with equal volume (4 μl), either of cells, cell lysate or
purified nuclei. The sample was placed on a microscopy slide, sealed with nail polish around
cover-slip, and kept in the dark till imaging. Images were captured at the Centre for Microscopy
on a confocal laser scanning microscope (Nikon, E2000), with UV and white light filters at 100x
optical resolution, followed by digital zoom to 1000x magnification (P. W. J. van Wyk, Center for
Microscopy, UFS).
CHAPTER 4
118
4.3.4 Preparation of yeast protein extracts by mechanochemical lysis
Single yeast colonies were inoculated into 5-10 ml media, and grown at 30 °C for 12-16 h, with
rotation. For secondary cultures, 1-2 l media was used, and cultures were grown to an OD600 of
0.8-1.2 (mid-logarithmic phase) or for six days (stationary phase). Cells were harvested by
centrifugation, water washed, weighed, and used immediately or frozen in liquid nitrogen, and
kept at -80 °C until lysed by a method of choice (Table 4.1).
A dehydration mediated yeast cell rupture using denaturing agents was adapted from
(580–582). Briefly, 0.8 g yeast cells were mixed with 10 ml of ethanol, 20 g glass beads and
vortexed at RT. Alcohol was removed by aspiration, and 10 ml of extraction buffer (0.1 N NaOH,
6 M Gu-HCl, 20 mM EDTA, 10 mM DTT, 1.5% (w/v) SDS, 1 mM PMSF) was added. The
suspension was incubated at 70 °C for 10 min with intermittent vortexing (three times of 30 s
each with 1 min resting on ice). Alkali was neutralized by addition of 0.4 ml of acetic acid. The
suspension was incubated at 70 °C for 10 min with intermittent vortex as above. To remove SDS,
the sample was brought to RT and methanol, followed by 10 ml chloroform, and 30 ml water,
with vortexing after each addition. The aqueous layer was removed after a 13,000 rpm, 5 min
spin at RT, and 30 ml of methanol was added. The sample was vortexed, and spun down at
13,000 rpm for 5 min at RT. The supernatant was discarded and the pellet was dried, and
resuspended in 5 ml water with 250 μg RNase.
4.3.5 Preparation of yeast nuclear extracts by mechanochemical lysis
To standardize pressure mediated release of S. cerevisiae nuclei, 1 ml each of yeast cells
resuspended in 1:2 (w/v) PBS were subjected to 25, 30, 35, and 40 kpsi pressure with single or
double French press passes. An aliquot (4 μl) of cells or lysate was mixed with 0.5 μl of DAPI,
and 1 μl of fixative for confocal imaging. The efficiency of lysis was calculated from the number
of cells without cell wall damage before and after pressure treatment. The nuclei thus released
were resuspended in lysis buffer [0.8 M sodium perchlorate, 1 mM DTT, 40 mM Tris-HCl (pH
6.8), 1 mM PMSF, 0.1 mM EDTA], and sonicated ten times with 30 s pulse each.
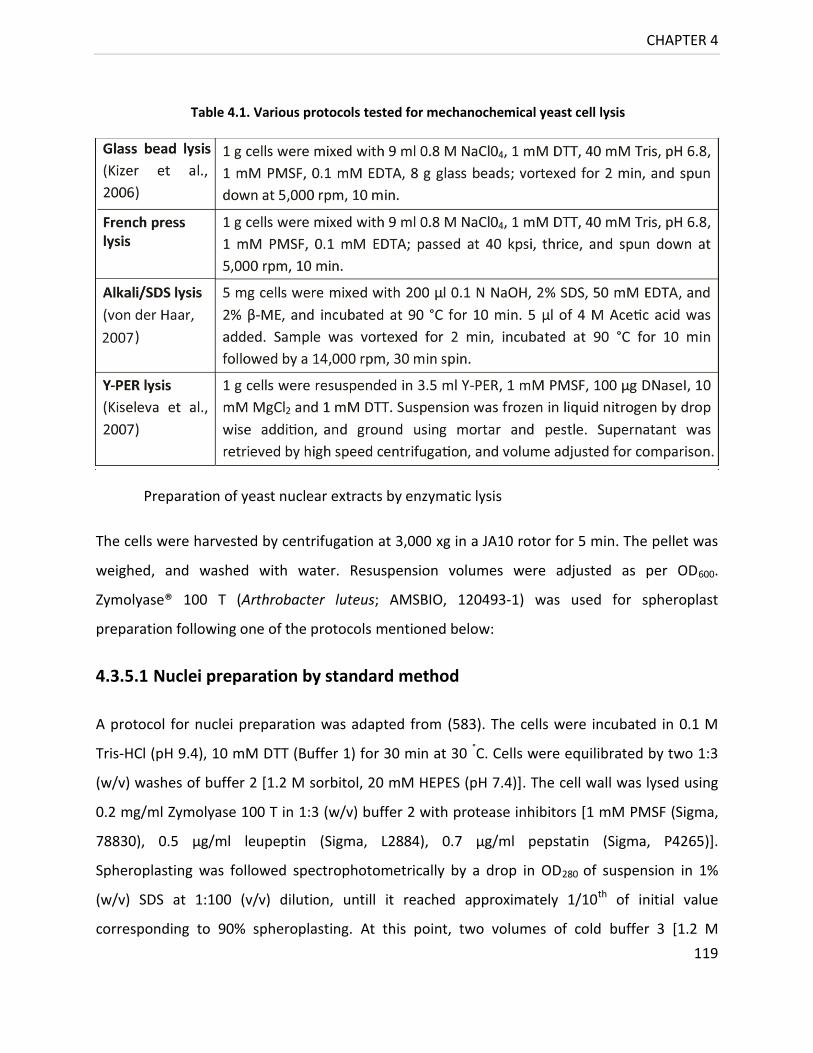
CHAPTER 4
119
Preparation of yeast nuclear extracts by enzymatic lysis
The cells were harvested by centrifugation at 3,000 xg in a JA10 rotor for 5 min. The pellet was
weighed, and washed with water. Resuspension volumes were adjusted as per OD600.
Zymolyase® 100 T (Arthrobacter luteus; AMSBIO, 120493-1) was used for spheroplast
preparation following one of the protocols mentioned below:
4.3.5.1 Nuclei preparation by standard method
A protocol for nuclei preparation was adapted from (583). The cells were incubated in 0.1 M
Tris-HCl (pH 9.4), 10 mM DTT (Buffer 1) for 30 min at 30 °C. Cells were equilibrated by two 1:3
(w/v) washes of buffer 2 [1.2 M sorbitol, 20 mM HEPES (pH 7.4)]. The cell wall was lysed using
0.2 mg/ml Zymolyase 100 T in 1:3 (w/v) buffer 2 with protease inhibitors [1 mM PMSF (Sigma,
78830), 0.5 μg/ml leupeptin (Sigma, L2884), 0.7 μg/ml pepstatin (Sigma, P4265)].
Spheroplasting was followed spectrophotometrically by a drop in OD280 of suspension in 1%
(w/v) SDS at 1:100 (v/v) dilution, untill it reached approximately 1/10th of initial value
corresponding to 90% spheroplasting. At this point, two volumes of cold buffer 3 [1.2 M
Table 4.1. Various protocols tested for mechanochemical yeast cell lysis
CHAPTER 4
120
sorbitol, 20 mM PIPES (pH 6.8), 1 mM magnesium chloride, 1 mM PMSF, 0.5 μg/ml leupeptin,
0.7 μg/ml pepstatin] was added. The cells were spun down to limit Zymolyase activity, and
pellet was resuspended in 1:3 (w/v) cold NIB [0.25 M sucrose, 60 mM potassium chloride, 14
mM sodium chloride, 5 mM magnesium chloride, 1m M calcium chloride, 15 mM MES (pH 6.6),
0.8% (v/v) Triton X-100, 0.7 μg/ml pepstatin, 1 mM PMSF, 0.5 μg/ml leupeptin]. The suspension
was incubated on ice for 20 min, and the procedure was repeated thrice. The nuclear pellet,
thus obtained, was permeablized with detergent by three 1:3 (w/v) buffer A [10 mM Tris-HCl
(pH 8.0), 0.5% (v/v) NP-40, 75 mM sodium chloride, 30 mM sodium butyrate (from solid stock),
1 mM PMSF, 0.5 μg/ml leupeptin, 0.7 μg/ml pepstatin] washes, with 15 min hold on ice for first
two washes. This was followed by 1:3 (w/v), and a 1:1.5 (w/v) buffer B [10 mM Tris-HCl (pH 8),
0.4 M sodium chloride, 30 mM sodium butyrate, 1 mM PMSF, 0.5 μg/ml leupeptin, 0.7 μg/ml
pepstatin] washes with 5 min periods on ice for the first wash, to get rid of loosely bound
chromatin proteins.
4.3.5.2 Nuclei preparation by high speed centrifugation
Using a protocol adapted from (584–586), 10 g yeast cells was washed with 50 ml S buffer [1.4
M sorbitol, 20 mM HEPES (pH 7.5), 0.5 mM magnesium chloride] twice and incubated for 30
min at 30 °C with S buffer containing 10 mM DTT. The pellet was resuspended in 40 ml S buffer
containing protease and phosphatase inhibitors (0.5 μg/ml leupeptin, 0.5 μg/ml pepstatin, 1
mM PMSF, 1x phosphatase inhibitor cocktail) and 10 mg Zymolyase 100 T. Suspension was
incubated at 30 °C, 100 rpm and OD280 was taken in 1% (w/v) SDS (10 μl sample/ml) at 15 min
interval each until 80% lysis was achieved (~30 min for logarithmic phase cells). At that point, 80
ml cold S buffer with inhibitors was added, and the suspension was pelleted by 3,000 xg, 5 min
centrifugation. Two 50 ml S-inhibitor washes were given, and the pellet was resuspended in 30
ml F buffer [18% (w/v) Ficoll 400 (Sigma, F4375), 20 mM PIPES (pH 6.5), 0.5 mM magnesium
chloride, suitable inhibitors)]. Spheroplasts were lysed with ten to twenty gentle up and down
strokes of a dounce homogenizer. The lysate was layered over an equal volume of GF buffer
[20% (v/v) glycerol, 7% (w/v) Ficoll 400, 20 mM PIPES (pH 6.5), 0.5 mM magnesium chloride
with suitable inhibitors] and spun at 20,000 xg for 30 min at 4 °C. The pellet was washed twice
CHAPTER 4
121
with 30 ml GF buffer with inhibitors, spinning at 20,000 xg for 30 min, 4 °C each time. The pellet
was resuspended in 30 ml F buffer with inhibitors and spun at 3,000 xg for 15 min. The
supernatant was spun at 20,000 xg for 30 min at 4 °C and pellet resuspended in D buffer [0.5
mM HEPES (pH 7.5), 5 mM magnesium chloride, 1 mM calcium chloride, suitable inhibitors] to
an OD280 of 0.5.
4.3.5.3 Nuclei preparation by slow speed centrifugation
A gentle yeast nuclei preparation protocol by spheroplast centrifugation from (478) was also
utilized.
4.3.5.4 Rapid nuclei preparation by dry ice homogenization
In a protocol adapted from (587, 588), cells were resuspended in NIB after reduction, and
enzymatic treatment. The suspension was frozen in methanol / dry-ice and homogenized in a
blender with glass beads. The suspension was decanted through two layers of miracloth into
centrifugation tubes, followed by acid extraction of histones from supernatant.
4.3.6 Acid extraction of histones
4.3.6.1 By resuspension
The acid extraction efficiency of histone Hho1p was analyzed using resuspension in different
strengths of sulphuric, hydrochloric, perchloric, or phosphoric acid for variable time periods at 4
°C, with occasional vortex mixing. The insoluble material was removed by a 10,000 rpm, 10 min
spin, and the soluble protein was precipitated by 20% (w/v) TCA for 1 h at 4 °C. The protein
pellet was obtained by a 15,000 xg, 30 min spin, and washed with acidified acetone [containing
0.1% (v/v) hydrochloric acid] followed by two acetone only washes. The pellet was vacuum
lyophilized and stored at -20 °C until further needed.
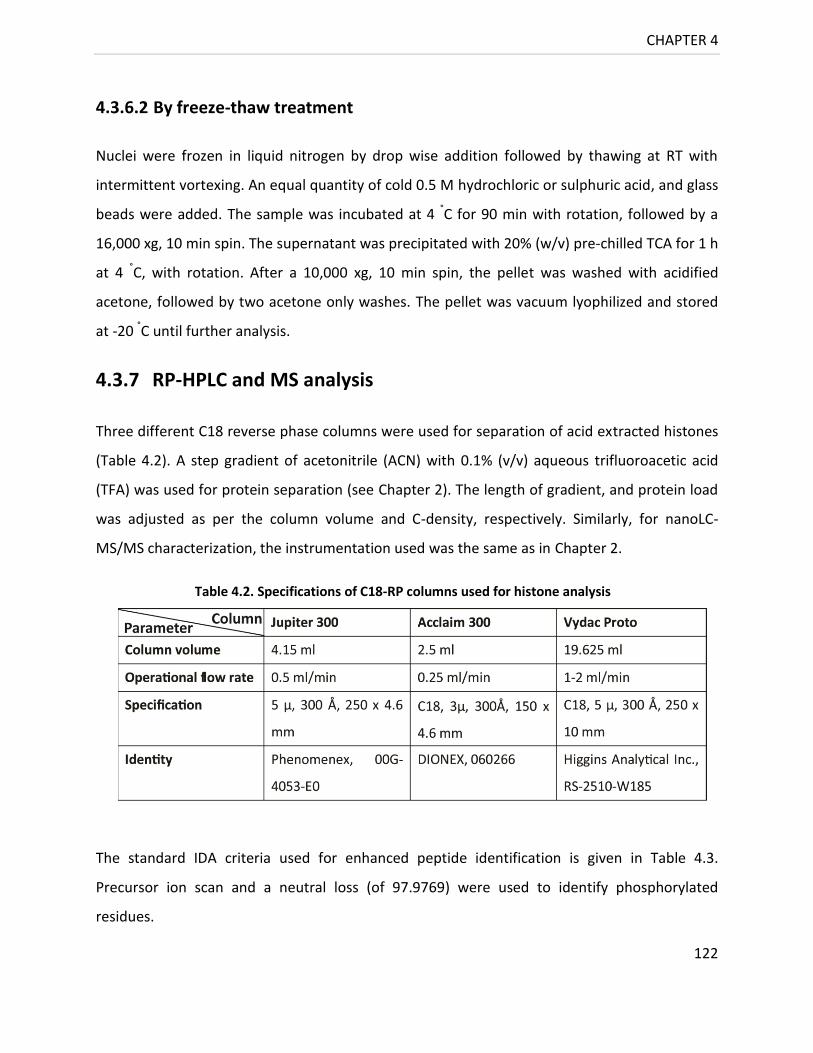
CHAPTER 4
122
4.3.6.2 By freeze-thaw treatment
Nuclei were frozen in liquid nitrogen by drop wise addition followed by thawing at RT with
intermittent vortexing. An equal quantity of cold 0.5 M hydrochloric or sulphuric acid, and glass
beads were added. The sample was incubated at 4 °C for 90 min with rotation, followed by a
16,000 xg, 10 min spin. The supernatant was precipitated with 20% (w/v) pre-chilled TCA for 1 h
at 4 °C, with rotation. After a 10,000 xg, 10 min spin, the pellet was washed with acidified
acetone, followed by two acetone only washes. The pellet was vacuum lyophilized and stored
at -20 °C until further analysis.
4.3.7 RP-HPLC and MS analysis
Three different C18 reverse phase columns were used for separation of acid extracted histones
(Table 4.2). A step gradient of acetonitrile (ACN) with 0.1% (v/v) aqueous trifluoroacetic acid
(TFA) was used for protein separation (see Chapter 2). The length of gradient, and protein load
was adjusted as per the column volume and C-density, respectively. Similarly, for nanoLC-
MS/MS characterization, the instrumentation used was the same as in Chapter 2.
The standard IDA criteria used for enhanced peptide identification is given in Table 4.3.
Precursor ion scan and a neutral loss (of 97.9769) were used to identify phosphorylated
residues.
Table 4.2. Specifications of C18-RP columns used for histone analysis
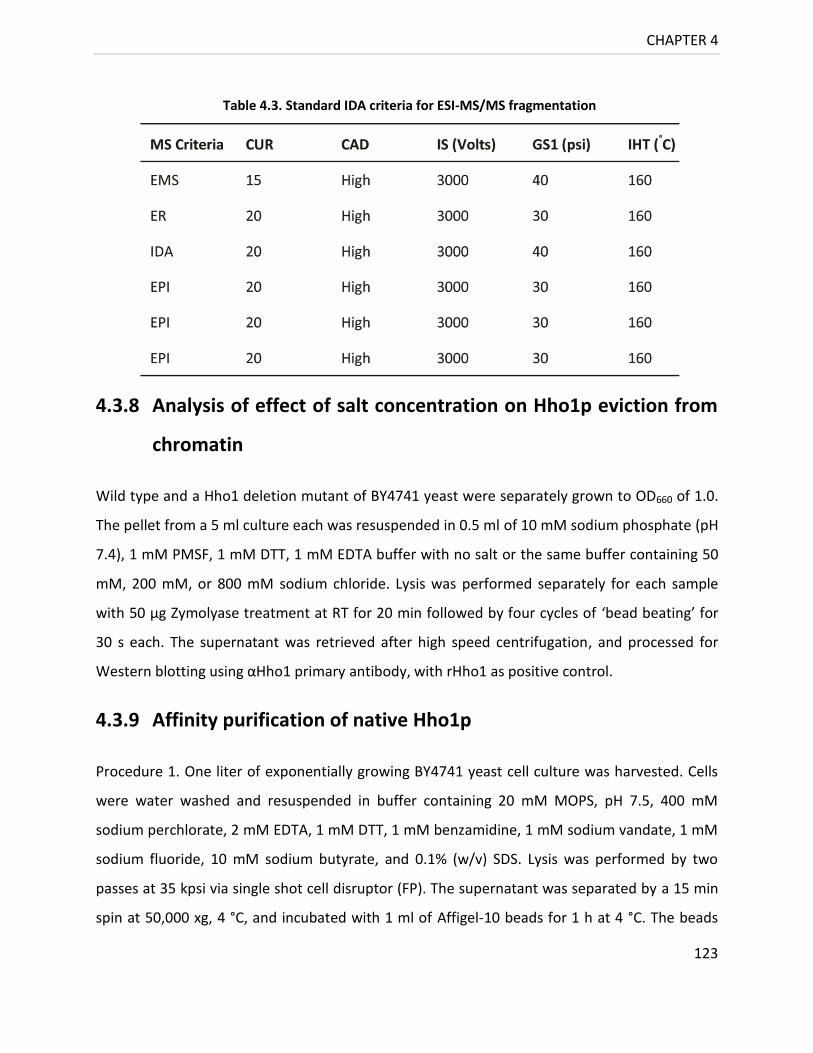
CHAPTER 4
123
4.3.8 Analysis of effect of salt concentration on Hho1p eviction from
chromatin
Wild type and a Hho1 deletion mutant of BY4741 yeast were separately grown to OD660 of 1.0.
The pellet from a 5 ml culture each was resuspended in 0.5 ml of 10 mM sodium phosphate (pH
7.4), 1 mM PMSF, 1 mM DTT, 1 mM EDTA buffer with no salt or the same buffer containing 50
mM, 200 mM, or 800 mM sodium chloride. Lysis was performed separately for each sample
with 50 μg Zymolyase treatment at RT for 20 min followed by four cycles of ‘bead beating’ for
30 s each. The supernatant was retrieved after high speed centrifugation, and processed for
Western blotting using αHho1 primary antibody, with rHho1 as positive control.
4.3.9 Affinity purification of native Hho1p
Procedure 1. One liter of exponentially growing BY4741 yeast cell culture was harvested. Cells
were water washed and resuspended in buffer containing 20 mM MOPS, pH 7.5, 400 mM
sodium perchlorate, 2 mM EDTA, 1 mM DTT, 1 mM benzamidine, 1 mM sodium vandate, 1 mM
sodium fluoride, 10 mM sodium butyrate, and 0.1% (w/v) SDS. Lysis was performed by two
passes at 35 kpsi via single shot cell disruptor (FP). The supernatant was separated by a 15 min
spin at 50,000 xg, 4 °C, and incubated with 1 ml of Affigel-10 beads for 1 h at 4 °C. The beads
Table 4.3. Standard IDA criteria for ESI-MS/MS fragmentation

CHAPTER 4
124
were separated by slow speed centrifugation, and supernatant was incubated at 4 °C with
Affigel-10 bead bound αHho1p ab. After overnight binding, beads were washed with two cycles
of alternate 1 CV of binding buffer followed by 1 CV of 0.1% (w/v) aqueous SDS washes. After a
final 1 CV lysis buffer wash, the bead bound protein was eluted in 3 CV of 0.1 M glycine (pH 3),
and equilibrated to neutral pH immediately.
Procedure 2. One liter each of mid-logarithmic (OD600 of 0.6-0.7) and stationary phase (6 d)
BY4741 growth was harvested, water washed and equilibrated in 250 ml each of cold buffer 1
[20 mM HEPES (pH 7.5), 0.3 M sodium chloride, 1 mM EDTA]. The cells were resuspended in 5
ml or 10 ml of buffer 2 (buffer 1 with protease inhibitors, 1 mM DTT, 1x phosphatase inhibitor
cocktail, and 30 mM sodium butyrate) for logarithmic or stationary phase samples, respectively.
The suspension was passed through a French press twice at 35 kpsi. The lysate was frozen by
dropwise addition into liquid nitrogen with a 22G syringe needle. The solid mass was ground to
fine powder, thawed to liquid, and the process repeated thrice. After thawing, the lysate was
resuspended to twice its initial volume in buffer 2 with 5 mM SDC, and subjected to ten strokes
of dounce homogenizer as described in (589). The supernatant was recovered after a 3,000
rpm, 10 min spin at 4 °C, and incubated with 0.1 ml of monospecific or polyclonal αHho1
antibody coupled immobilized protein A plus (Thermo Scientific, 22810) beads at 4 °C for 3 h.
The beads were washed five times with 1 ml of extraction buffer each. The bead bound protein
was eluted in 0.1 M glycine (pH 2.5), 10% (v/v) dioxane, and 0.1 ml fractions were collected in
tubes containing 25 μl of 2 M Tris base. The column was stripped by 5 column volumes (CV) of 2
M Gu-HCl in PBS, followed by PBS equilibration. Fractions were analyzed by SDS-PAGE, and
Western blotting using αHho1p antibody.
4.4 Results and Discussion
4.4.1 Assessment of protocol efficiency for the extraction of Hho1p
Since histones are highly basic in nature, Hho1p extraction in various acids was analyzed.
Different protocols were tested for the relative efficiency of Hho1p extraction. These included
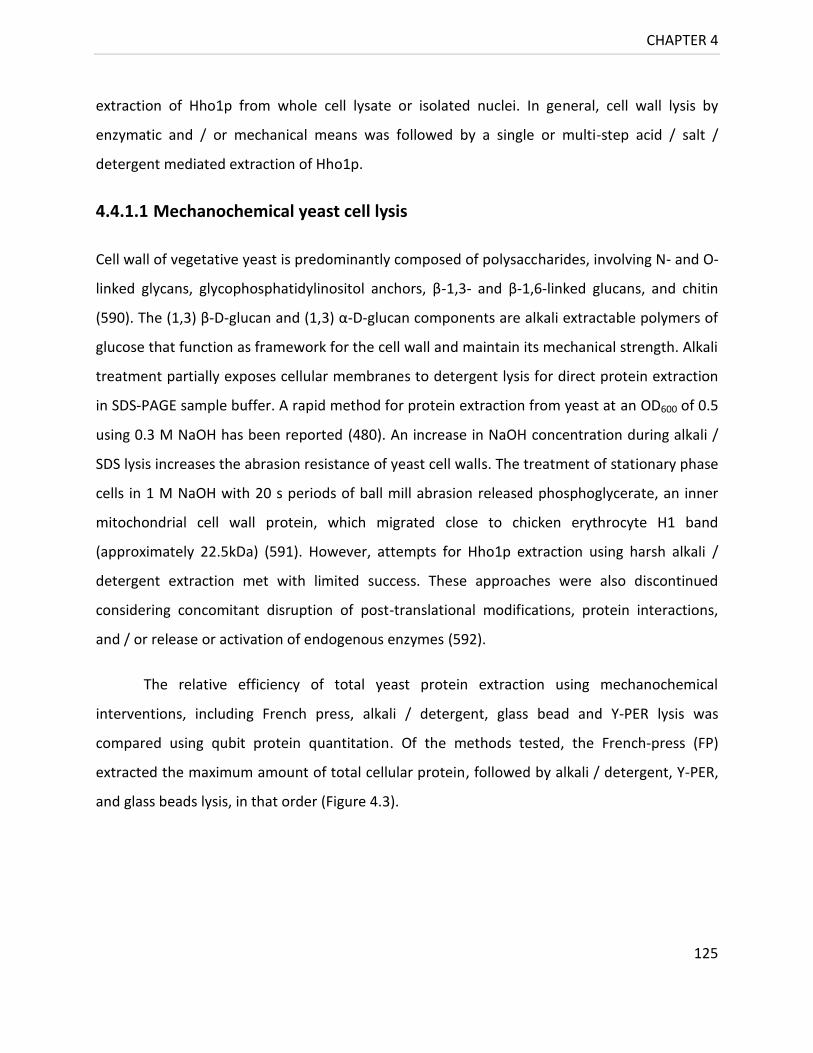
CHAPTER 4
125
extraction of Hho1p from whole cell lysate or isolated nuclei. In general, cell wall lysis by
enzymatic and / or mechanical means was followed by a single or multi-step acid / salt /
detergent mediated extraction of Hho1p.
4.4.1.1 Mechanochemical yeast cell lysis
Cell wall of vegetative yeast is predominantly composed of polysaccharides, involving N- and O-
linked glycans, glycophosphatidylinositol anchors, β-1,3- and β-1,6-linked glucans, and chitin
(590). The (1,3) β-D-glucan and (1,3) α-D-glucan components are alkali extractable polymers of
glucose that function as framework for the cell wall and maintain its mechanical strength. Alkali
treatment partially exposes cellular membranes to detergent lysis for direct protein extraction
in SDS-PAGE sample buffer. A rapid method for protein extraction from yeast at an OD600 of 0.5
using 0.3 M NaOH has been reported (480). An increase in NaOH concentration during alkali /
SDS lysis increases the abrasion resistance of yeast cell walls. The treatment of stationary phase
cells in 1 M NaOH with 20 s periods of ball mill abrasion released phosphoglycerate, an inner
mitochondrial cell wall protein, which migrated close to chicken erythrocyte H1 band
(approximately 22.5kDa) (591). However, attempts for Hho1p extraction using harsh alkali /
detergent extraction met with limited success. These approaches were also discontinued
considering concomitant disruption of post-translational modifications, protein interactions,
and / or release or activation of endogenous enzymes (592).
The relative efficiency of total yeast protein extraction using mechanochemical
interventions, including French press, alkali / detergent, glass bead and Y-PER lysis was
compared using qubit protein quantitation. Of the methods tested, the French-press (FP)
extracted the maximum amount of total cellular protein, followed by alkali / detergent, Y-PER,
and glass beads lysis, in that order (Figure 4.3).

CHAPTER 4
126
Dehydration of yeast in absolute ethanol renders the cell wall scaffold stiffer (580). A decrease
in elasticity lowers the dampening of mechanical impulses by deformation, rendering cells
vulnerable to mechanical disruption. However, dehydration mediated lysis gave a pellet with
rubbery consistency that was difficult to solubilize. Problems in pellet resuspension might have
resulted from irreversible denaturation and aggregation of protein.
4.4.1.2 Pressure mediated nuclei isolation
Since Hho1p is nuclear localized, a protocol for isolation of nuclei by pressure mediated cell lysis
was adapted from (593). The micron sized yeast nuclei released by French press lysis were
visualized microscopically by DAPI staining. Increase in cell wall damage, and release of nuclei
correlated well with increase in the instrument pressure and sample pass settings (Figure 4.4).
Figure 4.3. Relative efficiency of yeast protein extraction by mechanochemicallysis. Histogram analysis to compare protein extraction using various mechanochemical methods for yeast cell disruption.

CHAPTER 4
127
Yeast nuclei isolated by FP were lysed by sonication to facilitate the release of Hho1p.
Western blotting with polyclonal αHho1p antibody suggested selective extraction of Hho1p in
nuclear acid extracts (NAE) as compared to nuclear extracts alone (NE) (Figure 4.5).
Figure 4.4. Optimization of release of yeast nuclei by French press lysis. DAPI staining and
confocal visualization. A) No pass (intact cells); B) 30 kpsi, single pass; C) 35 kpsi, single
pass; D) 40 kpsi, double pass.

CHAPTER 4
128
4.4.1.3 Enzymatic yeast cell wall lysis for nuclei isolation
Zymolyase 100 T is a yeast cell wall lytic enzyme complex from an actinomycete
Cellulosimicrobium cellulans containing β-1,3-glucan laminaripentaohydrolase as key
constituent, along with endo β-1,3-glucanase, mannase, and protease activities. The starting
culture density and the quality of spheroplasts prepared using Zymolyase 100 T was found to be
critical to the quality of nuclei obtained. For exponentially growing cells, harvested in mid-log
phase, 90% spheroplasting was readily achieved within 45 min on incubation with the enzyme
(results not shown). The stationary phase culture was relatively recalcitrant to enzymatic
manipulation. However, careful modulation of incubation time with the relative concentration
and frequency of Zymolyase addition, as followed by spectrophotometry, was the key to cure
the problem to a considerable extent.
Figure 4.5. Detection of native Hho1p in yeast nuclear extract. A) A CBB-R250
stained 12% SDS polyacrylamide gel loaded in lanes 1 to 4 with marker
SM0431, 60 ng of rHho1p, and 13 μg each of total nuclear protein extract (NE)
and W303 nuclear acid extract (NAE), respectively; B) An ECL- Western blot of
gel (A) probed with αHho1p ab.

CHAPTER 4
129
4.4.1.4 Reverse phase purification of SNAE
Histones were extracted from yeast nuclei prepared by the standard method. The efficiency of
Acclaim, Jupiter and Vydac columns for fractionation of the same batch of total histones was
analyzed (Figure 4.6). Conditions were individually optimized for the three columns using
chicken erythrocyte histones (CEH), taking column configuration into account. As per standard
guidelines, a 4.6 mm id column can accommodate a low mg protein load; but in practice, only
10-20% of maximum column capacity may be used for optimum resolution. In the beginning, an
acetonitrile gradient elution of 50 μg CEH on the Jupiter column gave broad peaks with little
resolution. Follow-up improvisation in flow rate, protein quantity, loading buffer, and the slope
and concentration of gradient improved the peak resolution. Similarly, 15 μg of yeast histones
were loaded onto the Jupiter column and peak shape optimized by tinkering run conditions.
Sharp, well resolved yeast histone peaks eluted between 18 to 36% (v/v) aqueous acetonitrile.
Depending upon the eluate fraction size, column capacity, and column age, the peak
capacity of the three columns matched closely. However, elution did not show one protein per
peak, either due to bleed over, fraction size or similar protein retention properties. Canonical
H1 elutes before core histones on a RP column (594). The elution profile showed a band at
approximately 25 kDa that eluted just after core histones. However, this protein did not cross-
react with the αHho1p antibody (Ab) (results not shown). Further gel elution and mass
spectrometric identification of this protein should be conducted in future. In contrast, the SDS-
PAGE mobility of native Hho1p was found to mirror that of its recombinant counterpart by
Western blotting (Figure 4.6B). However, the concentration of native Hho1p in acid extracts
was too low for analytical HPLC. Though Western blotting of two low peaks eluting at 96 and 98
min from a Vydac semi-preparative HPLC column confirmed Hho1p purification, precursor ion
and neutral loss scan could not pick any Hho1p phosphopeptides. This might have been due to
low concentration of phosphorylated protein or loss of modification during processing
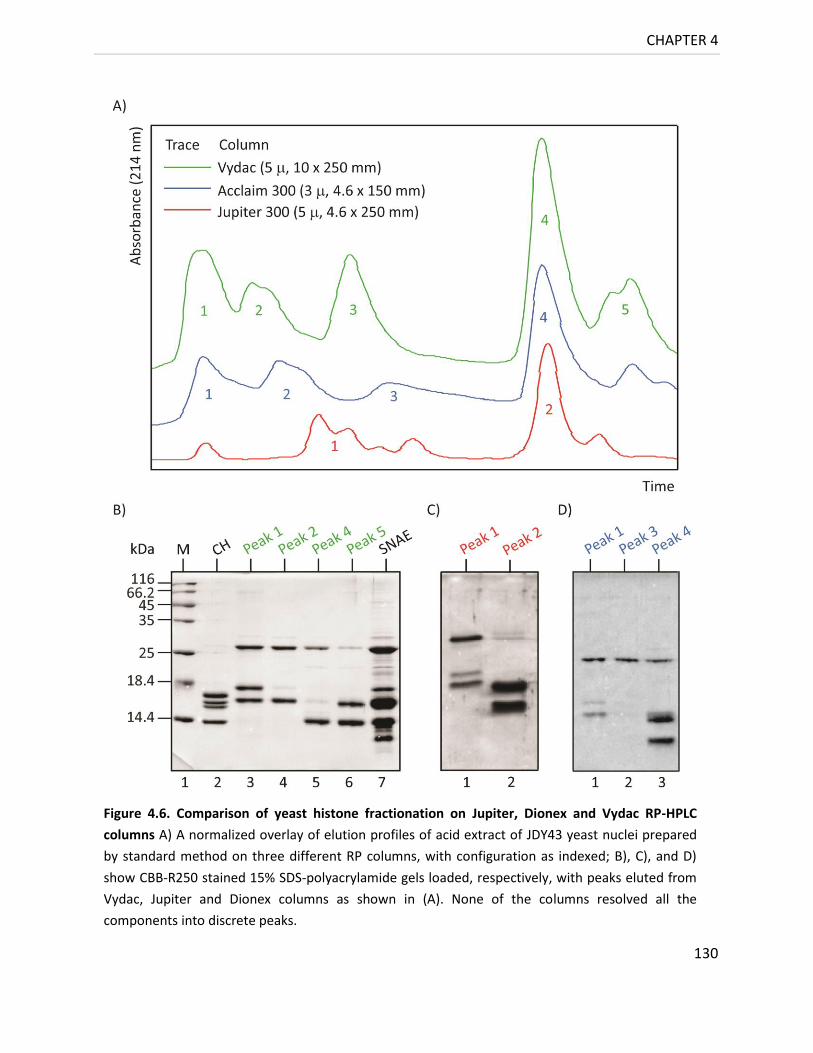
CHAPTER 4
130
Figure 4.6. Comparison of yeast histone fractionation on Jupiter, Dionex and Vydac RP-HPLC
columns A) A normalized overlay of elution profiles of acid extract of JDY43 yeast nuclei prepared
by standard method on three different RP columns, with configuration as indexed; B), C), and D)
show CBB-R250 stained 15% SDS-polyacrylamide gels loaded, respectively, with peaks eluted from
Vydac, Jupiter and Dionex columns as shown in (A). None of the columns resolved all the
components into discrete peaks.
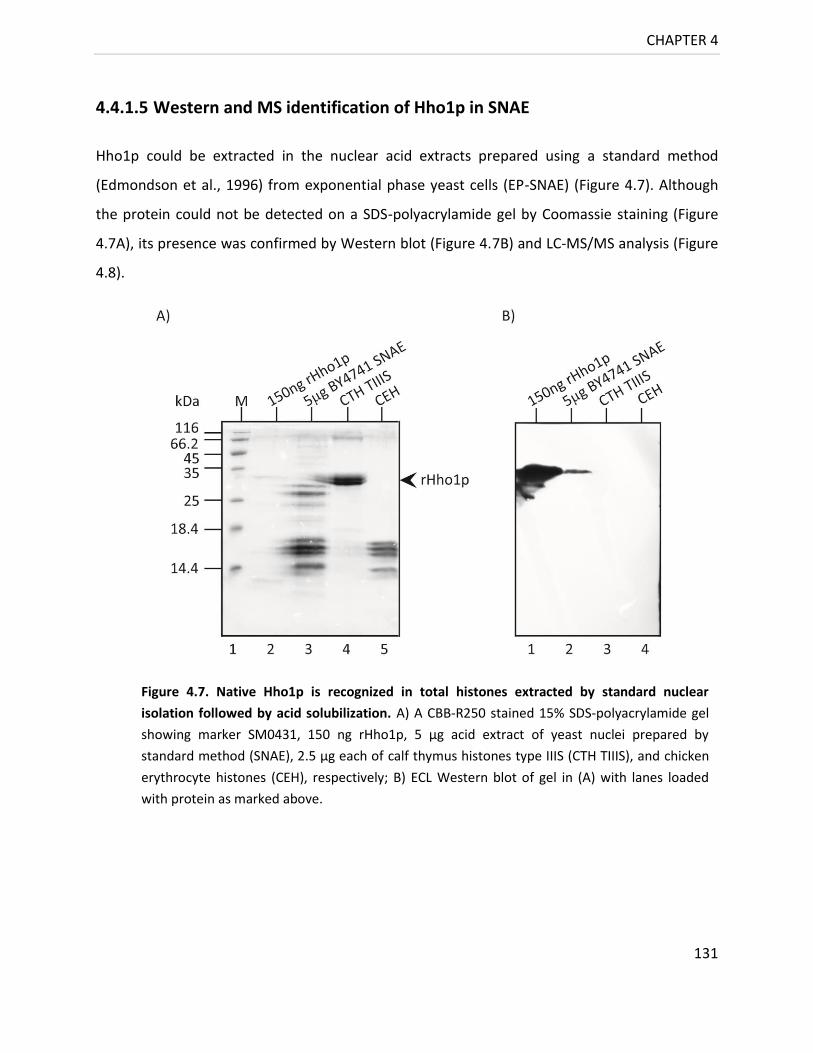
CHAPTER 4
131
4.4.1.5 Western and MS identification of Hho1p in SNAE
Hho1p could be extracted in the nuclear acid extracts prepared using a standard method
(Edmondson et al., 1996) from exponential phase yeast cells (EP-SNAE) (Figure 4.7). Although
the protein could not be detected on a SDS-polyacrylamide gel by Coomassie staining (Figure
4.7A), its presence was confirmed by Western blot (Figure 4.7B) and LC-MS/MS analysis (Figure
4.8).
Figure 4.7. Native Hho1p is recognized in total histones extracted by standard nuclear
isolation followed by acid solubilization. A) A CBB-R250 stained 15% SDS-polyacrylamide gel
showing marker SM0431, 150 ng rHho1p, 5 μg acid extract of yeast nuclei prepared by
standard method (SNAE), 2.5 μg each of calf thymus histones type IIIS (CTH TIIIS), and chicken
erythrocyte histones (CEH), respectively; B) ECL Western blot of gel in (A) with lanes loaded
with protein as marked above.
CHAPTER 4
132
The low concentrations of Hho1p present in acid extract may either be due to its poor
extraction or protein degradation during isolation and storage. Western analysis of native
Hho1p extracted in acid revealed that the protein degrades with time upon storage at low
temperature (Figure 4.9).
Figure 4.8. Identification of native Hho1p in EP SNAE (file 1454.dat). A) Histogram ranking
protein hits. 16 of 19 Hho1p_S. cerevisiae strain S288c peptides identified in this run were
high confidence assignments (Table 4.4); B) A sequence coverage of 22%, as shown in red,
with a protein score of 190 was obtained.
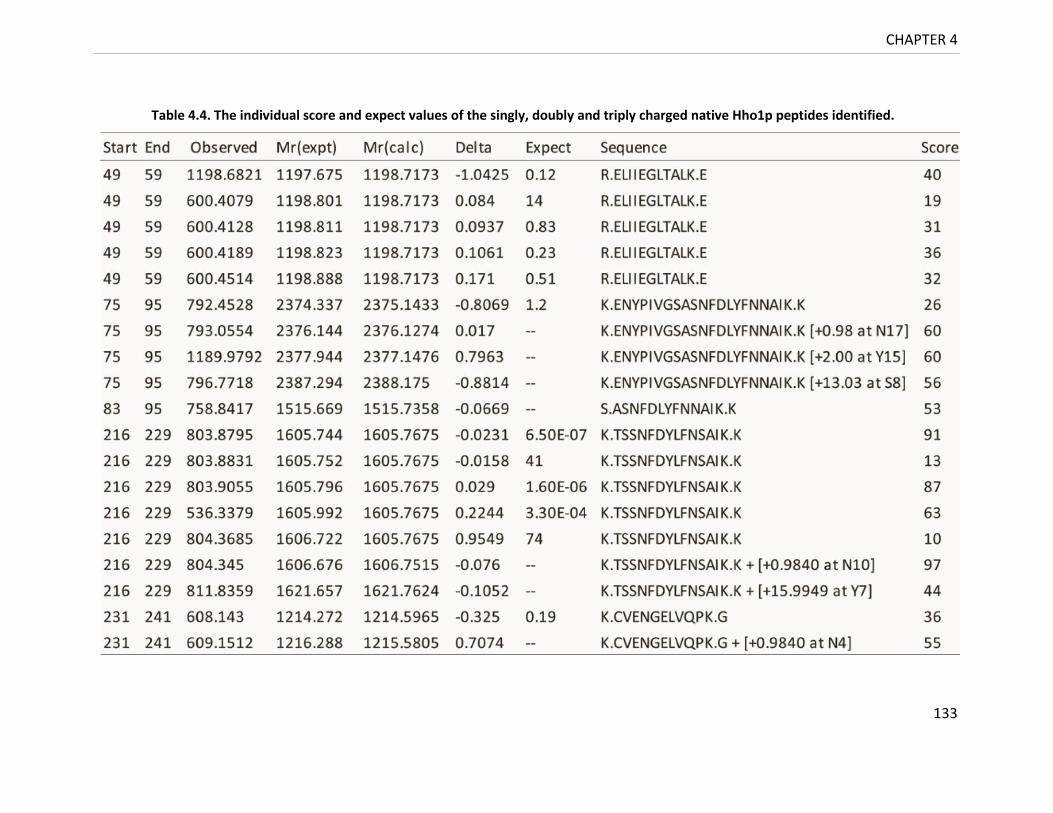
CHAPTER 4
133
Table 4.4. The individual score and expect values of the singly, doubly and triply charged native Hho1p peptides identified.
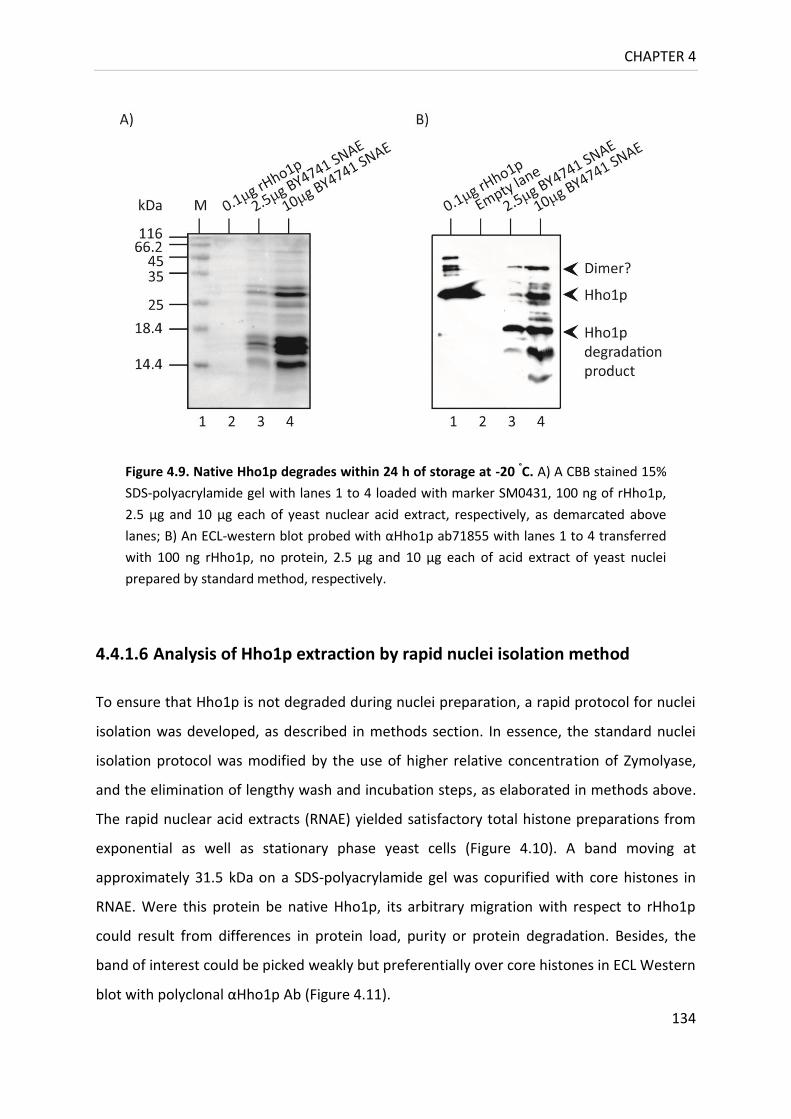
CHAPTER 4
134
4.4.1.6 Analysis of Hho1p extraction by rapid nuclei isolation method
To ensure that Hho1p is not degraded during nuclei preparation, a rapid protocol for nuclei
isolation was developed, as described in methods section. In essence, the standard nuclei
isolation protocol was modified by the use of higher relative concentration of Zymolyase,
and the elimination of lengthy wash and incubation steps, as elaborated in methods above.
The rapid nuclear acid extracts (RNAE) yielded satisfactory total histone preparations from
exponential as well as stationary phase yeast cells (Figure 4.10). A band moving at
approximately 31.5 kDa on a SDS-polyacrylamide gel was copurified with core histones in
RNAE. Were this protein be native Hho1p, its arbitrary migration with respect to rHho1p
could result from differences in protein load, purity or protein degradation. Besides, the
band of interest could be picked weakly but preferentially over core histones in ECL Western
blot with polyclonal αHho1p Ab (Figure 4.11).
Figure 4.9. Native Hho1p degrades within 24 h of storage at -20 °C. A) A CBB stained 15%
SDS-polyacrylamide gel with lanes 1 to 4 loaded with marker SM0431, 100 ng of rHho1p,
2.5 μg and 10 μg each of yeast nuclear acid extract, respectively, as demarcated above
lanes; B) An ECL-western blot probed with αHho1p ab71855 with lanes 1 to 4 transferred
with 100 ng rHho1p, no protein, 2.5 μg and 10 μg each of acid extract of yeast nuclei
prepared by standard method, respectively.

CHAPTER 4
135
The fractionation of rapid nuclear acid extract using a Jupiter300 RP-HPLC column could not
capture the protein into homogeneous fraction(s) (Figure 4.12).
Figure 4.10. Rapid histone isolation
protocol produced clean yeast histone
preparation. A CBB-R250 stained 15% SDS-
polyacrylamide gel with lanes 1 to 6 loaded
with marker, acid extract of exponential
phase nuclei (EP RNAE) prepared by rapid
method, and acid extract of stationary
phase nuclei prepared by rapid method (SP
RNAE), rHho1p, calf thymus histone type
IIIS (CTH TIIIS) and chicken RBC histones
(CH), respectively.
Figure 4.11. Band moving just below rHho1p was weakly detected by
αHho1p antibody. A) A silver stained 15% SDS-polyacrylamide gel showing
protein molecular weight marker SM0431, rHho1p, and Rapid NAE in lanes
1, 2, and 3, respectively; B) An ECL-western blot of gel in (A), with a western
blotting specific molecular weight marker 84786 in lane 1, probed by
αHho1p Ab.
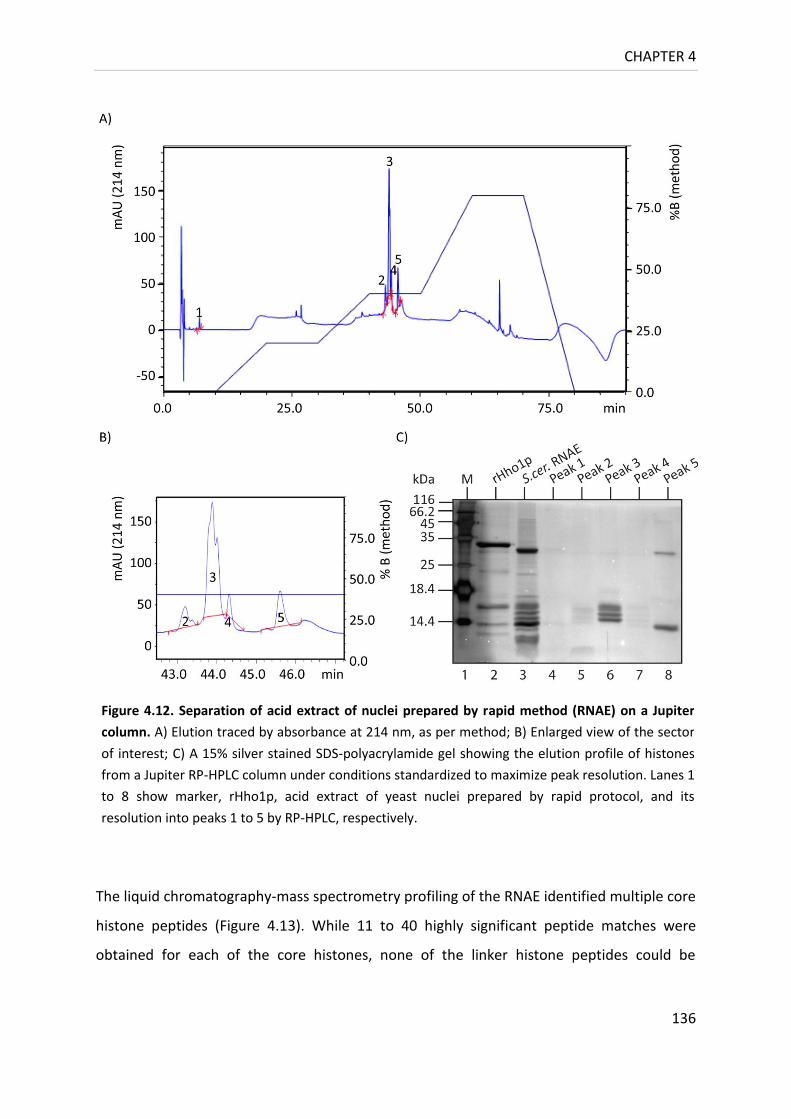
CHAPTER 4
136
The liquid chromatography-mass spectrometry profiling of the RNAE identified multiple core
histone peptides (Figure 4.13). While 11 to 40 highly significant peptide matches were
obtained for each of the core histones, none of the linker histone peptides could be
Figure 4.12. Separation of acid extract of nuclei prepared by rapid method (RNAE) on a Jupiter
column. A) Elution traced by absorbance at 214 nm, as per method; B) Enlarged view of the sector
of interest; C) A 15% silver stained SDS-polyacrylamide gel showing the elution profile of histones
from a Jupiter RP-HPLC column under conditions standardized to maximize peak resolution. Lanes 1
to 8 show marker, rHho1p, acid extract of yeast nuclei prepared by rapid protocol, and its
resolution into peaks 1 to 5 by RP-HPLC, respectively.
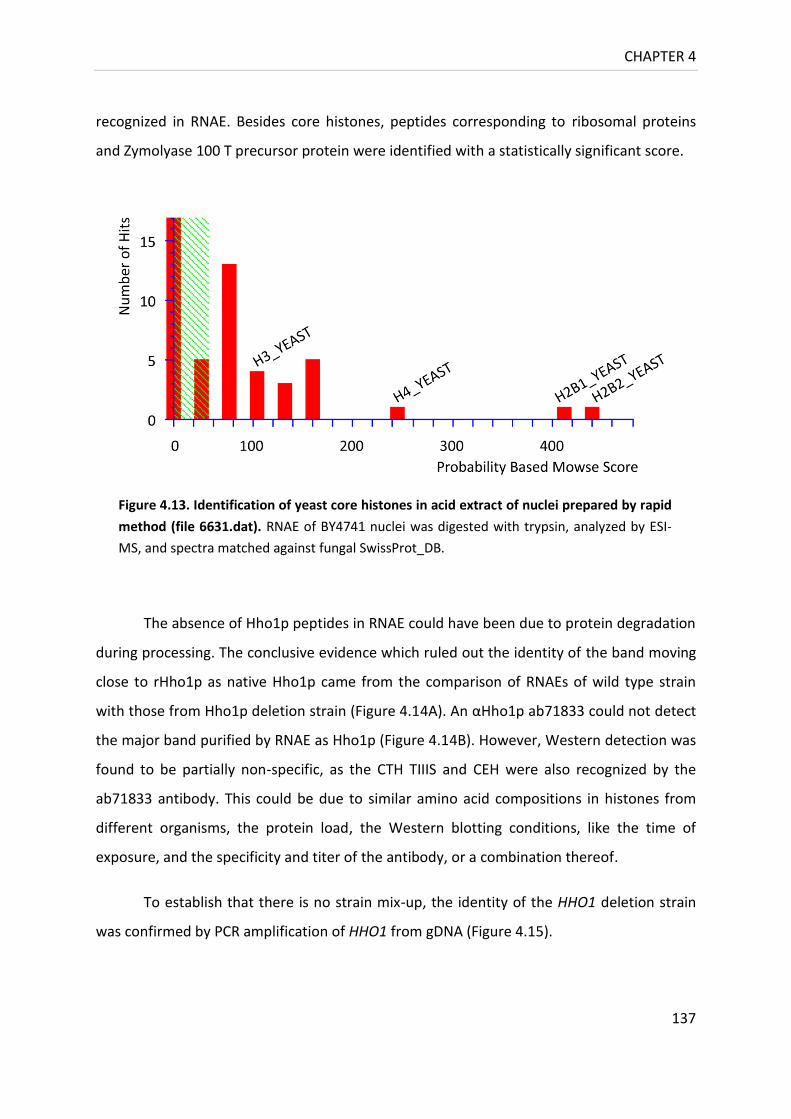
CHAPTER 4
137
recognized in RNAE. Besides core histones, peptides corresponding to ribosomal proteins
and Zymolyase 100 T precursor protein were identified with a statistically significant score.
The absence of Hho1p peptides in RNAE could have been due to protein degradation
during processing. The conclusive evidence which ruled out the identity of the band moving
close to rHho1p as native Hho1p came from the comparison of RNAEs of wild type strain
with those from Hho1p deletion strain (Figure 4.14A). An αHho1p ab71833 could not detect
the major band purified by RNAE as Hho1p (Figure 4.14B). However, Western detection was
found to be partially non-specific, as the CTH TIIIS and CEH were also recognized by the
ab71833 antibody. This could be due to similar amino acid compositions in histones from
different organisms, the protein load, the Western blotting conditions, like the time of
exposure, and the specificity and titer of the antibody, or a combination thereof.
To establish that there is no strain mix-up, the identity of the HHO1 deletion strain
was confirmed by PCR amplification of HHO1 from gDNA (Figure 4.15).
Figure 4.13. Identification of yeast core histones in acid extract of nuclei prepared by rapid
method (file 6631.dat). RNAE of BY4741 nuclei was digested with trypsin, analyzed by ESI-
MS, and spectra matched against fungal SwissProt_DB.

CHAPTER 4
138
Figure 4.15. PCR confirmation of HHO1 deletion
mutant. An ethidium bromide stained 1.2%
agarose gel showing products of PCR reaction
using pUC19 vector (lane 2), HHO1 PCR product
(lane 3) and gDNA from HHO1 deletion strain (lane
4), and wild type strain (lane 5) as DNA templates.
Figure 4.14. Band moving just below rHho1p in nuclear extract is not Hho1p. A) A CBB-R250
stained 15% SDS- polyacrylamide gel showing protein molecular weight marker, rHho1p, and 2.5μg
each of total histones extracted in acid by rapid protocol from BY4741 and BY4741 HHO1Δ strain,
calf thymus histones type IIIS (CTH TIIIS), and chicken RBC histones, as indicated above lanes. The
band moving close to rHho1p is also present in Hho1p deletion strain RNAE; B) An ECL- western
blot of gel in (A) using αHho1p ab71833 did not pick the thick band moving just below rHho1p in
RNAE as Hho1p, even after prolonged exposure.

CHAPTER 4
139
To conclude this section, the development of an in solution digestion protocol facilitated the
identification of Hho1p in the acid soluble fraction of yeast nuclei prepared by standard
method. While upto 40% coverage could be achieved for core histones, success in Hho1p
identification was low, with upto 25% sequence coverage for native linker histone in a single
run. The stark nature of near equimolar signal response for core histone peptides, with
frequent absence of linker histone in MS spectra pointed towards either low levels of
protein in the cell, its poor extraction, and / or unstable nature. Since, Hho1p shows
immunoprecipitation similar to four core histones (595, 596), it could be speculated that the
unstable character, rather than the cellular concentration limits analysis. In addition, protein
degraded upon long term low temperature storage.
4.4.2 Affinity purification of native Hho1p
Though Hho1p could be identified in acid extracts of nuclei by Western blotting and MS, the
maximum protein extractable was insufficient to introduce extended coverage and
reproducibility in analysis. Therefore, a chromatographic approach using an antibody based
affinity column was generated to purify native Hho1p from yeast whole cell lysate. This
enabled purification of native Hho1p, and acquisition of peptide rich MS spectra. Invariably,
however, it was found to be simpler to extract Hho1p from logarithmic phase as compared
to stationary phase cell lysate. The analysis was thus constrained by variation in the
efficiency of protein extraction, and / or cell viability of exponential as compared to
stationary phase yeast cells.
4.4.2.1 Effect of salt concentration on Hho1p extraction
A tight nuclear affinity of histones within the chromatin context might be responsible for
their poor extraction at low salt concentration. Indeed, increasing salt in yeast nuclei wash
buffer selectively removes contaminating proteins, and improves the quality of histone
preparation (583). Chromatin binding affinity of Hho1p may, therefore, govern the protein
concentration extracted. Previously, a significant decrease of in vitro binding of Hho1p to
four-way-junction DNA in presence of 100 mM phosphate has been reported (204). Besides,
Hho1p dissociation from DNA cellulose was found to commence at 200 mM sodium
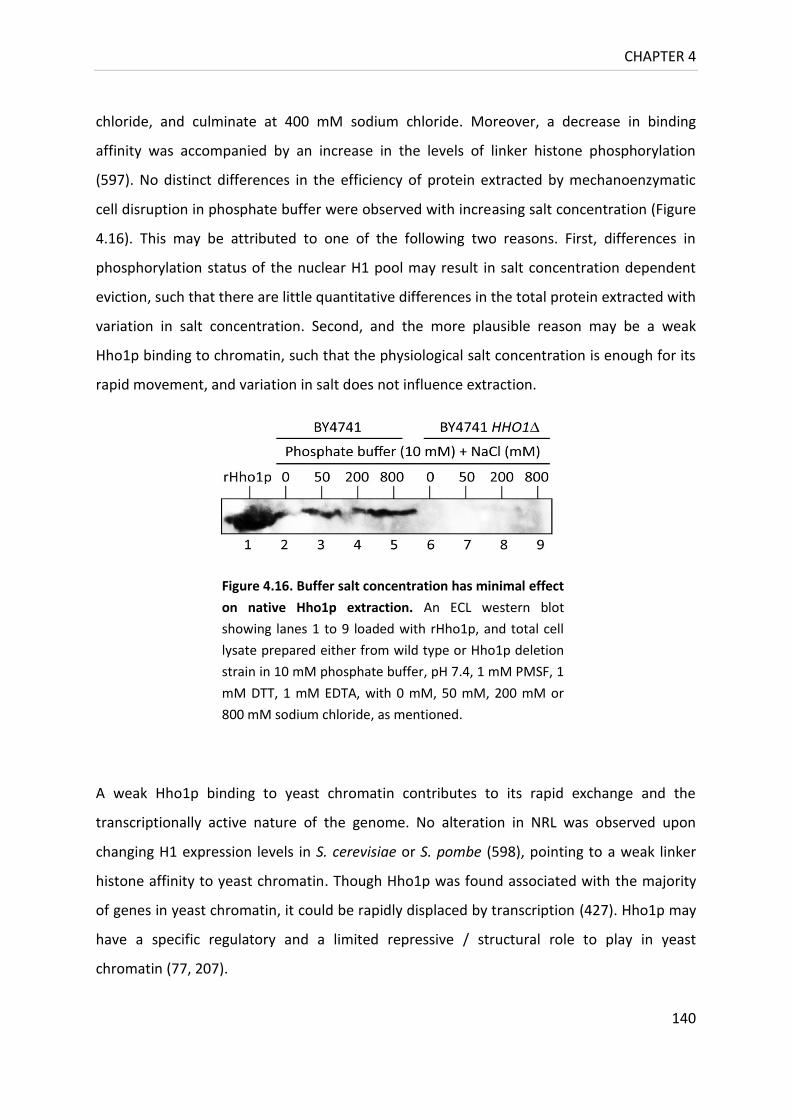
CHAPTER 4
140
chloride, and culminate at 400 mM sodium chloride. Moreover, a decrease in binding
affinity was accompanied by an increase in the levels of linker histone phosphorylation
(597). No distinct differences in the efficiency of protein extracted by mechanoenzymatic
cell disruption in phosphate buffer were observed with increasing salt concentration (Figure
4.16). This may be attributed to one of the following two reasons. First, differences in
phosphorylation status of the nuclear H1 pool may result in salt concentration dependent
eviction, such that there are little quantitative differences in the total protein extracted with
variation in salt concentration. Second, and the more plausible reason may be a weak
Hho1p binding to chromatin, such that the physiological salt concentration is enough for its
rapid movement, and variation in salt does not influence extraction.
A weak Hho1p binding to yeast chromatin contributes to its rapid exchange and the
transcriptionally active nature of the genome. No alteration in NRL was observed upon
changing H1 expression levels in S. cerevisiae or S. pombe (598), pointing to a weak linker
histone affinity to yeast chromatin. Though Hho1p was found associated with the majority
of genes in yeast chromatin, it could be rapidly displaced by transcription (427). Hho1p may
have a specific regulatory and a limited repressive / structural role to play in yeast
chromatin (77, 207).
Figure 4.16. Buffer salt concentration has minimal effect
on native Hho1p extraction. An ECL western blot
showing lanes 1 to 9 loaded with rHho1p, and total cell
lysate prepared either from wild type or Hho1p deletion
strain in 10 mM phosphate buffer, pH 7.4, 1 mM PMSF, 1
mM DTT, 1 mM EDTA, with 0 mM, 50 mM, 200 mM or
800 mM sodium chloride, as mentioned.
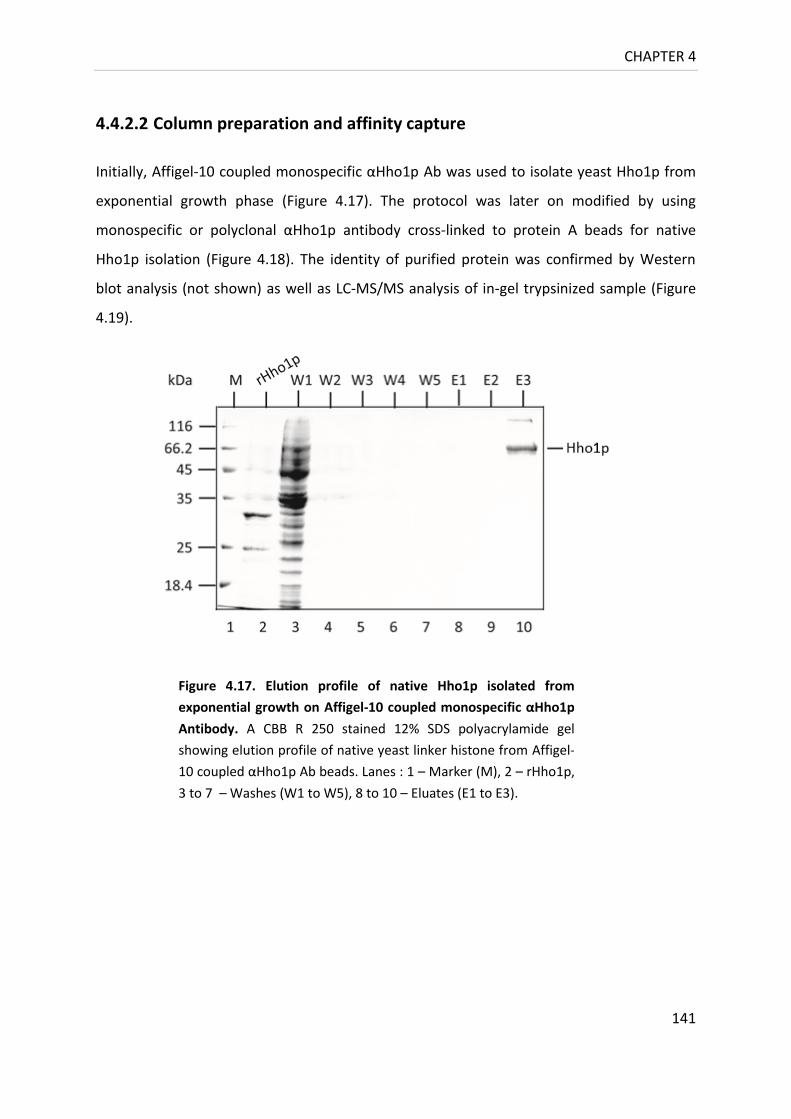
CHAPTER 4
141
4.4.2.2 Column preparation and affinity capture
Initially, Affigel-10 coupled monospecific αHho1p Ab was used to isolate yeast Hho1p from
exponential growth phase (Figure 4.17). The protocol was later on modified by using
monospecific or polyclonal αHho1p antibody cross-linked to protein A beads for native
Hho1p isolation (Figure 4.18). The identity of purified protein was confirmed by Western
blot analysis (not shown) as well as LC-MS/MS analysis of in-gel trypsinized sample (Figure
4.19).
Figure 4.17. Elution profile of native Hho1p isolated from
exponential growth on Affigel-10 coupled monospecific αHho1p
Antibody. A CBB R 250 stained 12% SDS polyacrylamide gel
showing elution profile of native yeast linker histone from Affigel-
10 coupled αHho1p Ab beads. Lanes : 1 – Marker (M), 2 – rHho1p,
3 to 7 – Washes (W1 to W5), 8 to 10 – Eluates (E1 to E3).
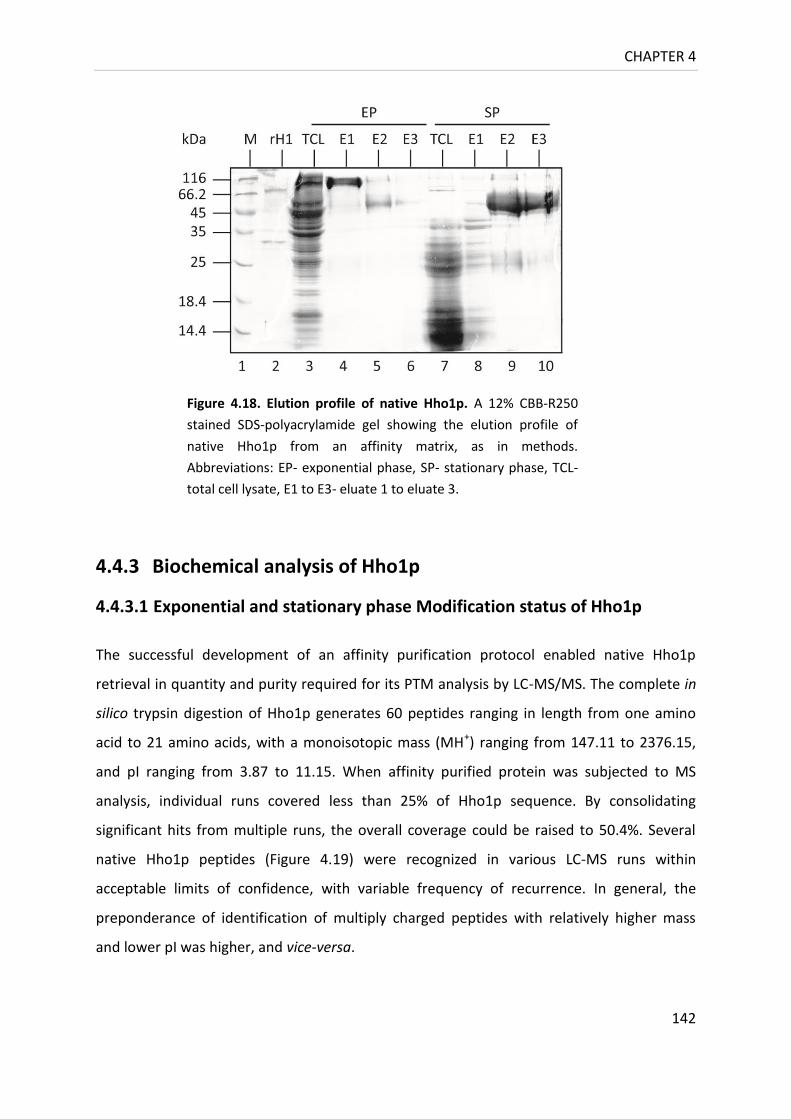
CHAPTER 4
142
4.4.3 Biochemical analysis of Hho1p
4.4.3.1 Exponential and stationary phase Modification status of Hho1p
The successful development of an affinity purification protocol enabled native Hho1p
retrieval in quantity and purity required for its PTM analysis by LC-MS/MS. The complete in
silico trypsin digestion of Hho1p generates 60 peptides ranging in length from one amino
acid to 21 amino acids, with a monoisotopic mass (MH+) ranging from 147.11 to 2376.15,
and pI ranging from 3.87 to 11.15. When affinity purified protein was subjected to MS
analysis, individual runs covered less than 25% of Hho1p sequence. By consolidating
significant hits from multiple runs, the overall coverage could be raised to 50.4%. Several
native Hho1p peptides (Figure 4.19) were recognized in various LC-MS runs within
acceptable limits of confidence, with variable frequency of recurrence. In general, the
preponderance of identification of multiply charged peptides with relatively higher mass
and lower pI was higher, and vice-versa.
Figure 4.18. Elution profile of native Hho1p. A 12% CBB-R250
stained SDS-polyacrylamide gel showing the elution profile of
native Hho1p from an affinity matrix, as in methods.
Abbreviations: EP- exponential phase, SP- stationary phase, TCL-
total cell lysate, E1 to E3- eluate 1 to eluate 3.
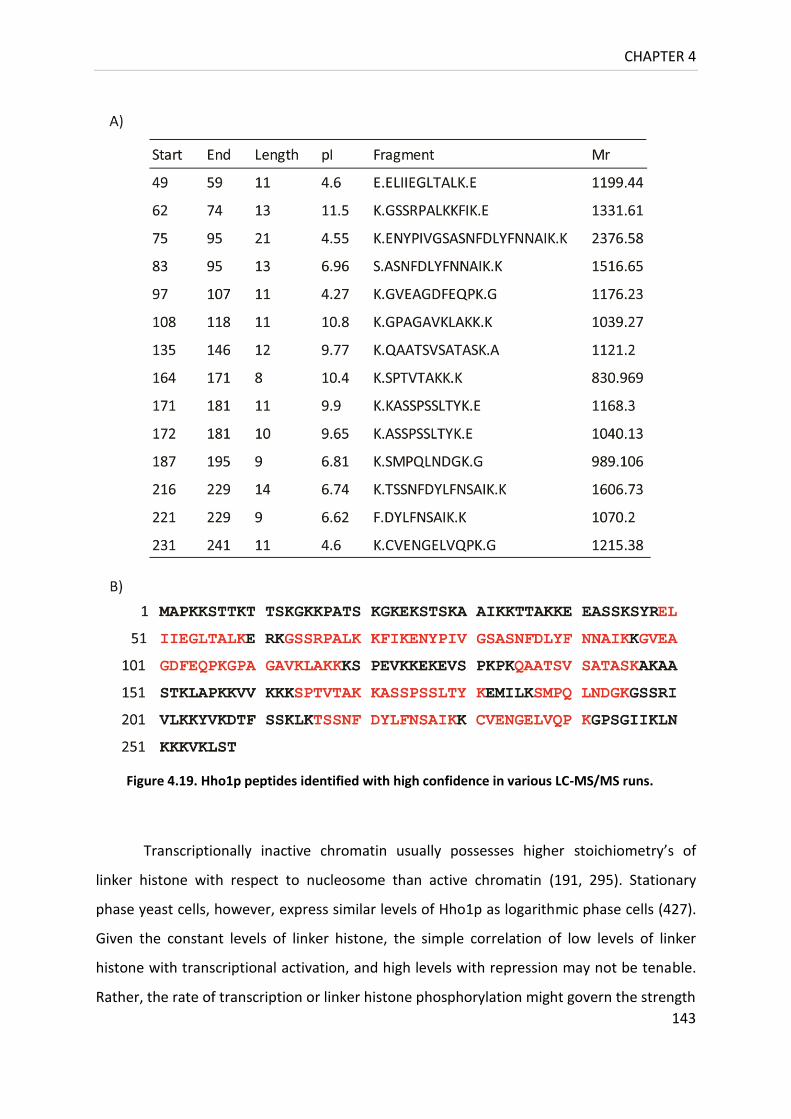
CHAPTER 4
143
Transcriptionally inactive chromatin usually possesses higher stoichiometry’s of
linker histone with respect to nucleosome than active chromatin (191, 295). Stationary
phase yeast cells, however, express similar levels of Hho1p as logarithmic phase cells (427).
Given the constant levels of linker histone, the simple correlation of low levels of linker
histone with transcriptional activation, and high levels with repression may not be tenable.
Rather, the rate of transcription or linker histone phosphorylation might govern the strength
Figure 4.19. Hho1p peptides identified with high confidence in various LC-MS/MS runs.
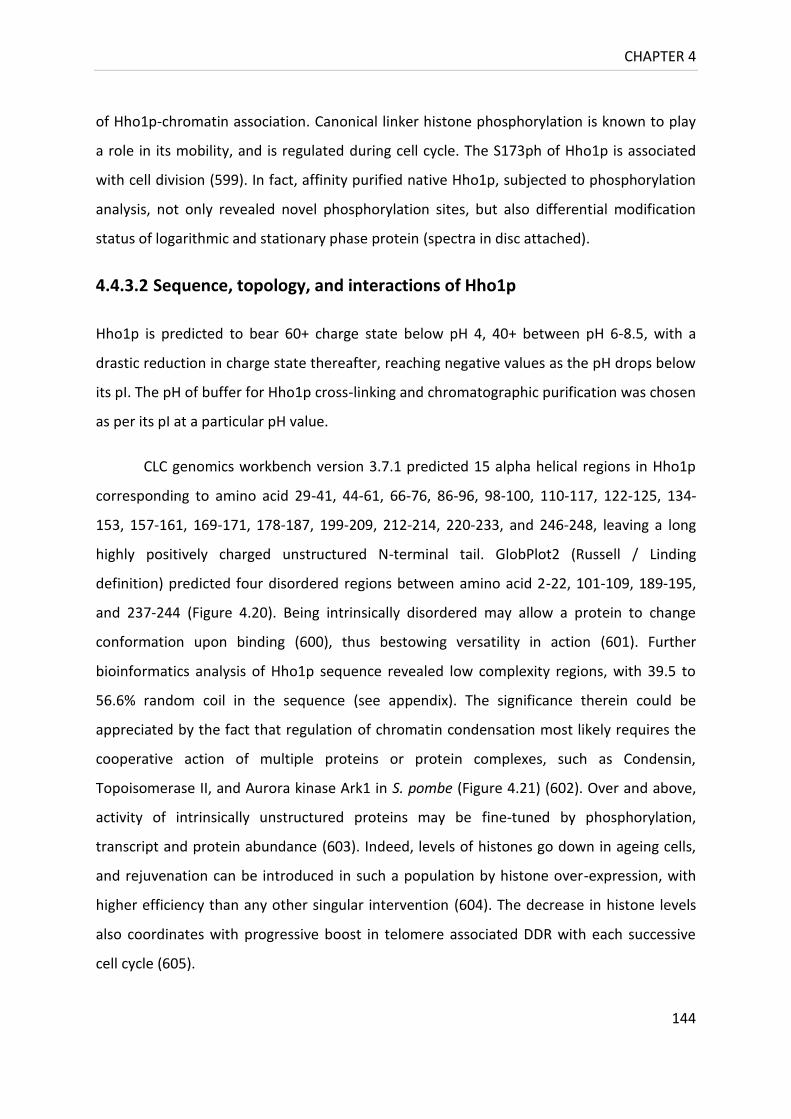
CHAPTER 4
144
of Hho1p-chromatin association. Canonical linker histone phosphorylation is known to play
a role in its mobility, and is regulated during cell cycle. The S173ph of Hho1p is associated
with cell division (599). In fact, affinity purified native Hho1p, subjected to phosphorylation
analysis, not only revealed novel phosphorylation sites, but also differential modification
status of logarithmic and stationary phase protein (spectra in disc attached).
4.4.3.2 Sequence, topology, and interactions of Hho1p
Hho1p is predicted to bear 60+ charge state below pH 4, 40+ between pH 6-8.5, with a
drastic reduction in charge state thereafter, reaching negative values as the pH drops below
its pI. The pH of buffer for Hho1p cross-linking and chromatographic purification was chosen
as per its pI at a particular pH value.
CLC genomics workbench version 3.7.1 predicted 15 alpha helical regions in Hho1p
corresponding to amino acid 29-41, 44-61, 66-76, 86-96, 98-100, 110-117, 122-125, 134-
153, 157-161, 169-171, 178-187, 199-209, 212-214, 220-233, and 246-248, leaving a long
highly positively charged unstructured N-terminal tail. GlobPlot2 (Russell / Linding
definition) predicted four disordered regions between amino acid 2-22, 101-109, 189-195,
and 237-244 (Figure 4.20). Being intrinsically disordered may allow a protein to change
conformation upon binding (600), thus bestowing versatility in action (601). Further
bioinformatics analysis of Hho1p sequence revealed low complexity regions, with 39.5 to
56.6% random coil in the sequence (see appendix). The significance therein could be
appreciated by the fact that regulation of chromatin condensation most likely requires the
cooperative action of multiple proteins or protein complexes, such as Condensin,
Topoisomerase II, and Aurora kinase Ark1 in S. pombe (Figure 4.21) (602). Over and above,
activity of intrinsically unstructured proteins may be fine-tuned by phosphorylation,
transcript and protein abundance (603). Indeed, levels of histones go down in ageing cells,
and rejuvenation can be introduced in such a population by histone over-expression, with
higher efficiency than any other singular intervention (604). The decrease in histone levels
also coordinates with progressive boost in telomere associated DDR with each successive
cell cycle (605).
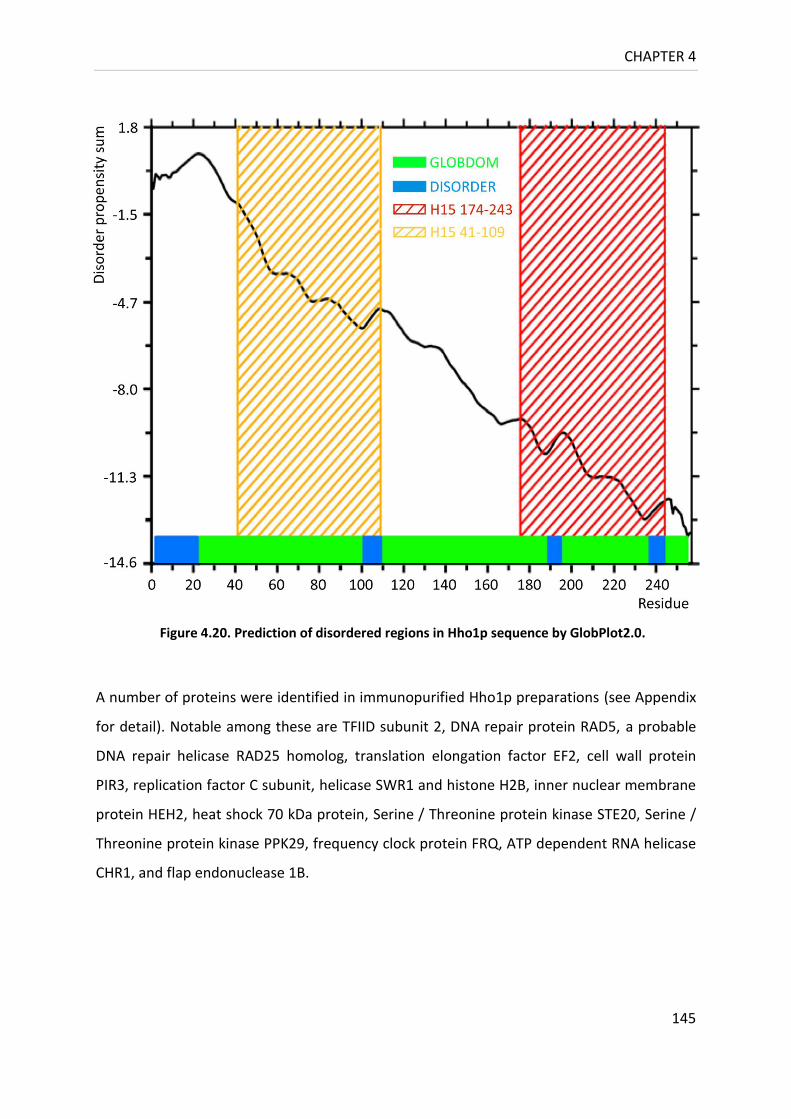
CHAPTER 4
145
A number of proteins were identified in immunopurified Hho1p preparations (see Appendix
for detail). Notable among these are TFIID subunit 2, DNA repair protein RAD5, a probable
DNA repair helicase RAD25 homolog, translation elongation factor EF2, cell wall protein
PIR3, replication factor C subunit, helicase SWR1 and histone H2B, inner nuclear membrane
protein HEH2, heat shock 70 kDa protein, Serine / Threonine protein kinase STE20, Serine /
Threonine protein kinase PPK29, frequency clock protein FRQ, ATP dependent RNA helicase
CHR1, and flap endonuclease 1B.
Figure 4.20. Prediction of disordered regions in Hho1p sequence by GlobPlot2.0.
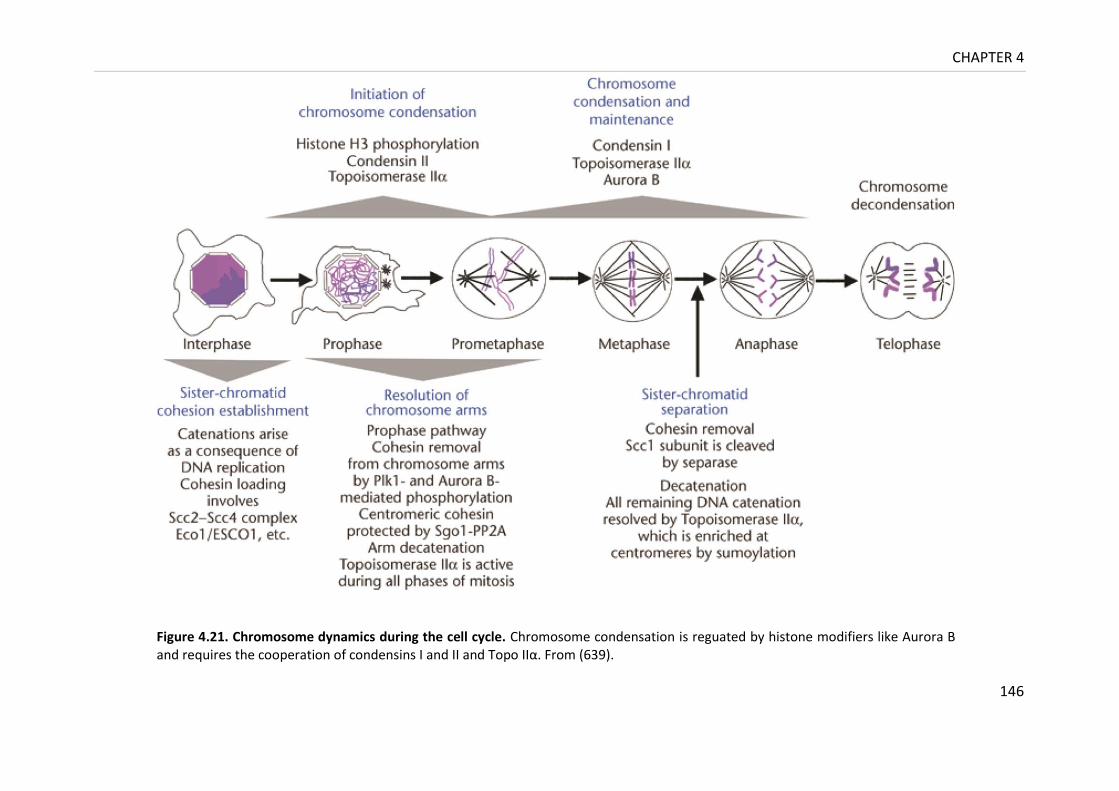
CHAPTER 4
146
Figure 4.21. Chromosome dynamics during the cell cycle. Chromosome condensation is reguated by histone modifiers like Aurora B and requires the cooperation of condensins I and II and Topo IIα. From (639).

CHAPTER 4
147
A simple search of Saccharomyces genome database depicts that Hho1p shows weak
physical as well as genetic interaction with two proteins, Histone H4 and Cyclin dependent
kinase catalytic subunit CDC28 (77, 606). Besides these, 36 unique physical and 32 unique
genetic H1 interactions, with a total of 70 genes, are known to exist. Of these, the physical
interactions with HTZ1 (607), Rtt109-Vps75 (608)and ORC1_BAH domain (609); and genetic
interactions with Rad52, Yku70:80 complex (201), and Sir1 (77) are particularly interesting.
They suggest in vivo Hho1p phosphorylation, and acetylation, as well as responsiveness to
DNA damage and replication fork progression. Besides, quantitative displacement of H2A.Z
nucleosome with transcriptionally active polymerase II promoter recruitment as well as
Hho1p - H2A.Z interaction has also been demonstrated (596). Although Hho1p chromatin
binding might be weaker than that of H2A.Z, given the abundance and frequency
distribution of H2A.Z nucleosomes in the yeast genome, eviction could result from
association. Limited corroboration of results presented here (see appendix and disc
attached) from previous interactions studies could perhaps be due to stringency of affinity
pull down conditions used, lack of strongly binding Hho1p partner proteins, or absence of
dedicated Hho1p binding partner analysis by immuno-affinity chromatography in literature.
NetPhos2.0 predicted potential phosphorylation of 24 out of 33 serine, 7 out of 18
threonine and 4 out of 6 tyrosine residues in Hho1p sequence to different levels (Figure
4.22). As Hho1p lacks the mammalian kinase recognition motif S/TPXK, such a high number
of phosphorylation sites might be an over-estimate. Though the degree of confidence for
modification site assignment varies, our data along with that from others suggests that
Hho1p may be phosphorylated at atleast seven sites distributed on the N-terminus and
within the two globular domains (see disc attached). In fact, bulk linker histone
phosphorylation is a mechanism of cell cycle regulated chromatin compaction common to
multiple eukaryotes. For example, Tetrahymena thermophila has a unique linker histone
that lacks structure, but acts to limit the nuclear volume. To explain its mode of action, a
synergistic propagation model involving a clustered positively charge patch(residue 35 to
54) containing five phosphorylation sites has been proposed (610).…………………………………
CHAPTER 4
148
Though the movement of positively charged patch within the sequence generated
the same pattern of specific gene regulation, when a similar number of phosphorylation
sites were dispersed throughout the protein sequence, the effects could not be
recapitulated. Therefore, it is not only the number but also the exact location of
phosphorylation sites within the linker histone protein sequence which modulates its stage
specific chromatin binding. Previous studies localized Hho1p phosphorylation sites (S130,
S173, S174, and S177) predominantly to the GII domain. We discovered novel
phosphorylation localized within the NTD (S6, T8, T10, T11, S12, T19, S20), the linker region
(T166) as well as the globular domain two (S197) (Figure 4.23) (see disc attached for
spectra).
Figure 4.22. NetPhos prediction of phosphorylation potential of Hho1p.
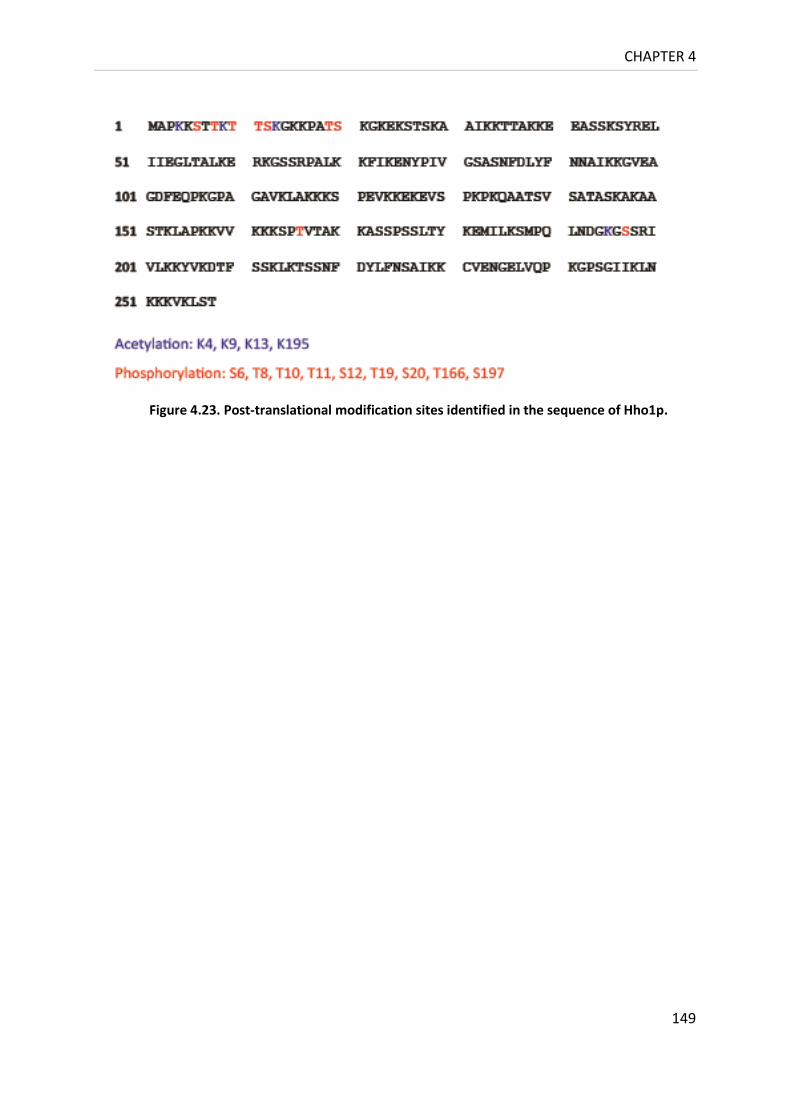
CHAPTER 4
149
Figure 4.23. Post-translational modification sites identified in the sequence of Hho1p.
CONCLUDING REMARKS
150
Concluding remarks
Atypical linker histone has a central globular domain flanked by variable terminal domains.
The role of these domains in the specific modulation of protein chromatin binding has been
characterized (93, 232). The canonical H5 globular domain contains two nucleosome binding
sites, and can provide chromatosome protection on its own. The N- terminus may play a
role in positioning the globular domain at the Holliday junction while the highly basic C-
terminus may improve the binding affinity by partially neutralizing the linker DNA charge.
Eukaryotic gene organization is transcriptionally constrained, with chromosome
specific gene clustering (611). The phosphorylation, acetylation and methylation of histones
play a role in regulation of RNA synthesis. Unicellular eukaryotes, such as Saccharomyces
cerevisiae and Tetrahymena thermophila contain more activation than silencing marks on
H3 and H4, as compared to mammalian cells, like mouse and human, which are generally
enriched in PTMs more often associated with gene silencing (612).
A versatile mechanism for transcriptional regulation is constituted by the chromatin
binding and displacement of linker histone (613). Chromatin compaction and transcription is
modulated by the cell cycle regulated phosphorylation of histones H1 and H3. Since partial
displacement of H1 from chromatin is required before it can be phosphorylated by mitotic
H1 kinase, transcriptional elongation in coordination with the kinases may play an important
role for H1 eviction from chromatin (614). Also, CDC28 mediated phosphorylation of the
iterated C-terminus heptad repeats of RNA polymerase II reverses its binding to active genes
and vice-versa.
Yeast, a model organism for the study of chromatin compaction, has an unique
chromatin architecture. The DNA of many unicellular types of yeast, including S. cerevisiae is
rich in genes, has relatively short NRL and lacks CpG methylation (615). These aspects of the
yeast genome have implications on transposition, DNA stability, and chromatin compaction.
The majority of yeast chromatin is in a transcriptionally competent conformation (293).
Many NDRs contain transcription factor binding sites, a significant subset of whom may
have preloaded RNAPII in higher eukaryotic cells. However, gene expression may require
CONCLUDING REMARKS
151
additional modifications like histone acetylation and nucleosome loss around the TSS and
enhancer regions. Remodelers that organize chromatin work antagonistically to those that
eject nucleosomes. Gene repression involves collaboration between HDACs and assembly
remodelers. For example, the association of HDACs with Ssn6-Tup1 and yISW2 remodelers
in budding yeast explains a portion of their repressive activity.
Liner histone has a winged helix motif characteristic of may DA binding proteins.
Linker histone binding compacts chromatin, and short NRL is usually associated with active
chromatin that shows low linker histone levels. In general, an increase in NRL with cell
differentiation inversely coincides with the cellular content of linker histone: nucleosome
core ratio. Since yeast chromatin has essentially zero inter-nucleosomal length, a more
labile binding of Hho1p to chromatin as compared to canonical H1 histones was anticipated
(616).
Hho1p differs from canonical lysine rich histones in having two globular domains,
and the absence of a highly basic C- terminal tail. Although the linker region between the
two globular domains of Hho1p is similar in composition to the C- terminal tail of canonical
linker histone, the lack of a dedicated CTD in Hho1p may have co-evolved with the linker
DNA length in yeast chromatin. Moreover, since the linker length is long enough to reach
the adjacent nucleosomes, and because both the globular domains can independently form
stable binary complexes with four way junction DNA, it was hypothesized that each Hho1p
molecule may bind two nucleosomes simultaneously (204).
The GII is less stable and intrinsically unstructured and acquires structure in presence
of DNA, or very high concentration of tetrahedral ions like phosphate and perchlorate. We
previously suggested that the induction of secondary structure in presence of DNA is much
more significant that increase in tetrahedral ion concentration. In accordance, it is found
that there is relatively little difference in extraction of Hho1p from cells with increase in salt
concentration. GII is also relatively more basic than GI and binds DNA tighter than GI, but
unlike latter does not provide the chromatosome protection ability (446, 617). This suggests
domain specific regulation of phosphorylation mediated Hho1p binding to chromatin. We
found linker histone phosphorylation sites within the NTD and GI domain, besides the GII

CONCLUDING REMARKS
152
domain, that was previously known. This suggests a new model for the regulation of Hho1p
binding to chromatin by phosphorylation wherein not just GII but chromatin binding of full
length protein is regulated by phosphorylation. The hierarchical nature of linker histone
phosphorylation with respect to its binding to condensed or decondensed chromatin has
been elucidated. Based on the context of its neighboring modifications, the phosphorylation
of a particular Hho1p residue could be associated with bound or free linker histone. Given
the limited coverage of Hho1p purified from exponential and stationary phase yeast growth,
a direct comparison of the role of a particular modification site in the chromatin binding of
Hho1p is difficult to ascertain.
Chromatin compaction in H1 deletion strain may be regulated to certain extent by
HMG proteins, which weaken the binding of H1 to chromatin by dynamically competing for
nucleosome binding sites (618). Besides, local concentration of topoisomerase II, ATP
dependent chromatin remodelers, silent information regulator proteins, heterochromatin
associated protein 1, histone acetylases and histone deacetylases may play a critical role in
modulating the chromatin architecture. Deletion of Hho1p does not alter cellular
phenotype, but delays ageing in certain yeast strains. Amongst the proteins identified in
affinity purification of Hho1p were Isw2, TFIID subunit 2, DNA repair protein RAD5, a
probable DNA repair helicase RAD25 homolog, Translation elongation factor EF2, Cell wall
protein PIR3, Replication factor C subunit, Helicase SWR1 and histone H2B, inner nuclear
membrane protein HEH2, Heat shock 70 kDa protein, Serine / Threonine protein kinase
STE20, Serine / Threonine protein kinase PPK29, Frequency clock protein FRQ, ATP
dependent RNA helicase CHR1, and Flap Endonuclease 1B. This suggests an active
involvement of Hho1p in regulation of DNA repair and cellular ageing.
FUTURE ASPECTS
153
Future aspects
1. Hydroxyapatite / phenyl sepharose binding to rHho1p should be analyzed so as to look
into the native protein purification by incubation of total cell lysate or nuclei with matrix.
2. Chromosome condensation in actively growing S. cerevisiae is a transient phenomenon
occurring before anaphase. Loss of condensation in pre-anaphase arrested cells could be
reversed by overproduction of aurora B kinase, Lpl1 (619). The in vitro activity of aurora B
kinase on rHho1p could be investigated to determine the role of Hho1p in the spindle
assembly process (620). Furthermore, Hho1p could be purified from logarithmic and
stationary phase of YGP1Δ strain, phosphopeptides enriched using a Phospho catch
phosphopeptide purification system (TiO2 / ZrO2 resin) for MS analysis with a
phosphopeptide standard and an in vitro cyclin / CDK1 phosphorylated Hho1p as control.
Subsequent Ala and Glu scanning of phosphorylation sites may reveal phosphorylation
correspondence to Hho1p eviction.
3. To detect the interaction between Hho1p and heterochromatin associated proteins,
cross-linking followed by reverse Western blotting of rHho1p with potential target proteins
may be undertaken. Similarly, cooperative transitions in linker histone interactions could be
analyzed by Hho1p protein characterization and its reverse Co-IP with purified
heterochromatin associated candidate proteins.
4. Since higher order chromatin structure cannot be reconstituted in vitro, an in vivo cross-
linking, and affinity MS study may be considered, preferably by linker histone addition to
Xenopus mitotic extracts or its oocyte injection, as the B4 native has minimal effect on
chromatin condensation (621), nuclear assembly and DNA replication (270).
5. MS instrument choice / availability is critical to experimental design decisions like label or
label-free quantitation, mode of fragmentation, dynamic range and speed of analysis on LC-
time-scale. Though widely used for its scan rate, detection sensitivity and quantitative
capabilities, a Q-TRAP is limited to unit resolution, nominal mass accuracy, and low mass
range detection ability due to its quadrupole component. Also, there is a trade-off related to

FUTURE ASPECTS
154
pressure settings of an LIT, as the operation under high buffer gas pressure improves
trapping efficiency, and fragmentation, at the cost of decrease in scan rate and resolving
power. Using ETD, authors of a global phosphoproteome profiling study, for instance,
detected 60% more phosphopeptides than CID (622), available in the Q-TRAP. Besides, the
dynamic range of linear ion trap MS can also be compromised by space-charge effects due
to increased proportion of multiply charged (peptide / protein) ions. Bearing in mind a trend
towards the use of hybrid MS configurations with improved depth and throughput in
discovery and quantitation based proteomics (623–625), an accurate top-down instrument
with higher duty cycle might also be utilized in combination with bottom-up sequencing for
stoichiometric PTM analysis (626).
6. It might be of interest to do partial a MNase digestion of nuclei for centrifugation,
electrophoretic mobility and ChIP analysis in HHO1 deletion strain from a mutant chromatin
remodeler (like RISC, NAP1, ASF, SWR or SWI/SNF) background to establish linker histone
dependent or independent remodeling in vivo.
7. The effect of Hho1p binding in α-factor arrested G1 phase cells, hydroxyurea arrested S-
phase cells and nocodazole arrested M-phase yeast cells with respect to chromatin
compaction and polymerase II transcription may be studied in a cdc14 temperature-
sensitive mutant strain or in rpb1, a RNA polymerase II temperature sensitive strain, using
the RNA polymerase II inhibitor α-amanitin (596).
8. Whole proteome quantitative comparison of wild type and Hho1p deletion strain might
reveal linker histone functional substitutes or overlaps, if any (HMGs?).
9. While chicken H1 and H5 can be dialyzed to 0.1% (w/v) ammonium bicarbonate for
lyophilization and storage, Hho1p precipitated upon dialysis against low strength buffer
bicarbonate buffer. It may be worth considering low salt crystallization screen of
recombinant Hho1p with unstable loop of GII swapped with that of GI.
10. Effect of Hho1p phosphorylation on replication may be studied as in (337).
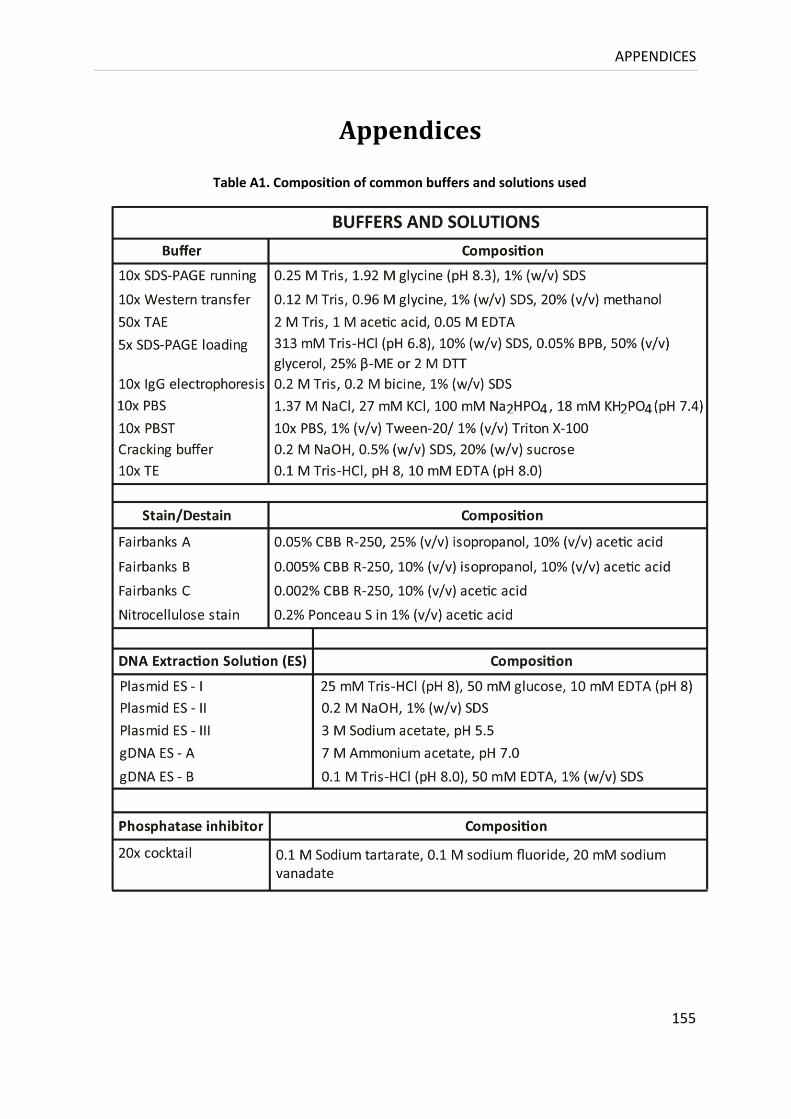
APPENDICES
155
Appendices
Table A1. Composition of common buffers and solutions used

APPENDICES
156
Table A2. List of four and more amino acid peptides generated by trypsin digestion of Hho1p
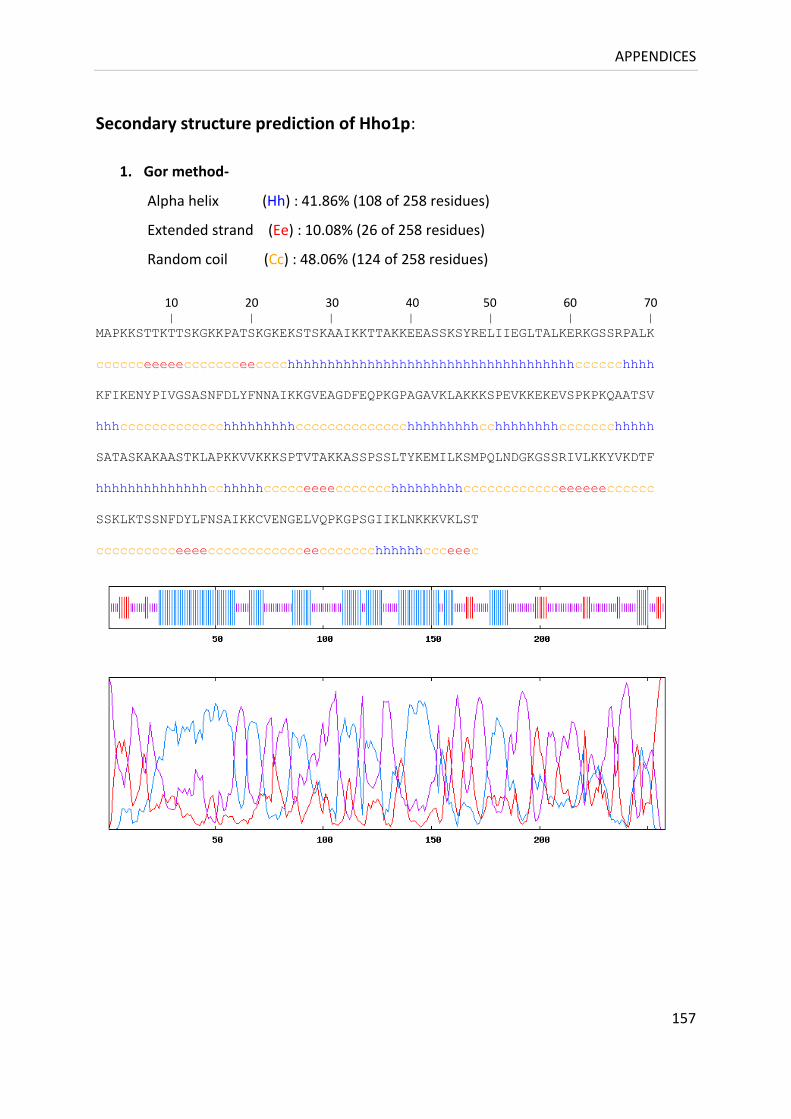
APPENDICES
157
Secondary structure prediction of Hho1p:
1. Gor method-
Alpha helix (Hh) : 41.86% (108 of 258 residues)
Extended strand (Ee) : 10.08% (26 of 258 residues)
Random coil (Cc) : 48.06% (124 of 258 residues)
10 20 30 40 50 60 70 | | | | | | |
MAPKKSTTKTTSKGKKPATSKGKEKSTSKAAIKKTTAKKEEASSKSYRELIIEGLTALKERKGSSRPALK
cccccceeeeeccccccceecccchhhhhhhhhhhhhhhhhhhhhhhhhhhhhhhhhhhhcccccchhhh
KFIKENYPIVGSASNFDLYFNNAIKKGVEAGDFEQPKGPAGAVKLAKKKSPEVKKEKEVSPKPKQAATSV
hhhccccccccccccchhhhhhhhhcccccccccccccchhhhhhhhhcchhhhhhhhccccccchhhhh
SATASKAKAASTKLAPKKVVKKKSPTVTAKKASSPSSLTYKEMILKSMPQLNDGKGSSRIVLKKYVKDTF
hhhhhhhhhhhhhhcchhhhhccccceeeeccccccchhhhhhhhhcccccccccccceeeeeecccccc
SSKLKTSSNFDYLFNSAIKKCVENGELVQPKGPSGIIKLNKKKVKLST
cccccccccceeeecccccccccccceeccccccchhhhhhccceeec

APPENDICES
158
2. HNN method
Alpha helix (Hh) : 33.72% (87 of 258 residues)
Extended strand (Ee) : 9.69% (25 of 258 residues)
Random coil (Cc) : 56.59% (146 of 258 residues)
10 20 30 40 50 60 70 | | | | | | |
MAPKKSTTKTTSKGKKPATSKGKEKSTSKAAIKKTTAKKEEASSKSYRELIIEGLTALKERKGSSRPALK
ccccccccccccccccccccccccccchhhhhhhcccccccccchhhhhhhhhhhhhhhhcccccchhhh
KFIKENYPIVGSASNFDLYFNNAIKKGVEAGDFEQPKGPAGAVKLAKKKSPEVKKEKEVSPKPKQAATSV
hhhhhccceeccccchhhhhhhhhhcccccccccccccccchhhhhhcccccccccccccccccccchhh
SATASKAKAASTKLAPKKVVKKKSPTVTAKKASSPSSLTYKEMILKSMPQLNDGKGSSRIVLKKYVKDTF
hhhhhhhhhhhhccccceeeecccceeeecccccccccchhhhhhhhccccccccccceeeeeeeechhh
SSKLKTSSNFDYLFNSAIKKCVENGELVQPKGPSGIIKLNKKKVKLST
ccccccccchhhhhhhhhhhhhccccccccccccceeeecccceeecc
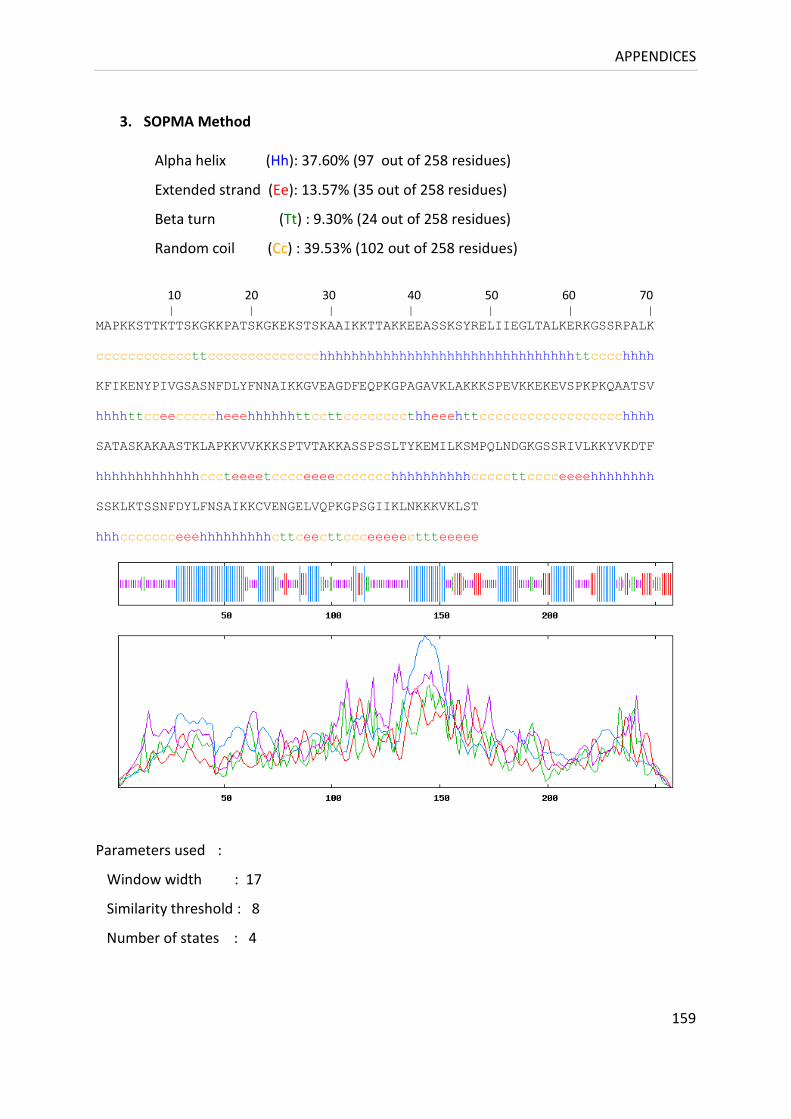
APPENDICES
159
3. SOPMA Method Alpha helix (Hh): 37.60% (97 out of 258 residues)
Extended strand (Ee): 13.57% (35 out of 258 residues)
Beta turn (Tt) : 9.30% (24 out of 258 residues)
Random coil (Cc) : 39.53% (102 out of 258 residues)
10 20 30 40 50 60 70 | | | | | | |
MAPKKSTTKTTSKGKKPATSKGKEKSTSKAAIKKTTAKKEEASSKSYRELIIEGLTALKERKGSSRPALK
ccccccccccccttcccccccccccccchhhhhhhhhhhhhhhhhhhhhhhhhhhhhhhhttcccchhhh
KFIKENYPIVGSASNFDLYFNNAIKKGVEAGDFEQPKGPAGAVKLAKKKSPEVKKEKEVSPKPKQAATSV
hhhhttcceecccccheeehhhhhhttccttccccccccthheeehttcccccccccccccccccchhhh
SATASKAKAASTKLAPKKVVKKKSPTVTAKKASSPSSLTYKEMILKSMPQLNDGKGSSRIVLKKYVKDTF
hhhhhhhhhhhhhcccteeeetcccceeeeccccccchhhhhhhhhhcccccttcccceeeehhhhhhhh
SSKLKTSSNFDYLFNSAIKKCVENGELVQPKGPSGIIKLNKKKVKLST
hhhccccccceeehhhhhhhhhcttceecttccceeeeecttteeeee
Parameters used :
Window width : 17
Similarity threshold : 8
Number of states : 4

APPENDICES
160
Figure A1. Prominent bands
seen on CBB stained
polyacrylamide gels from
various rHho1p preparations.
Figure A2. CEH separated by RP-
HPLC.
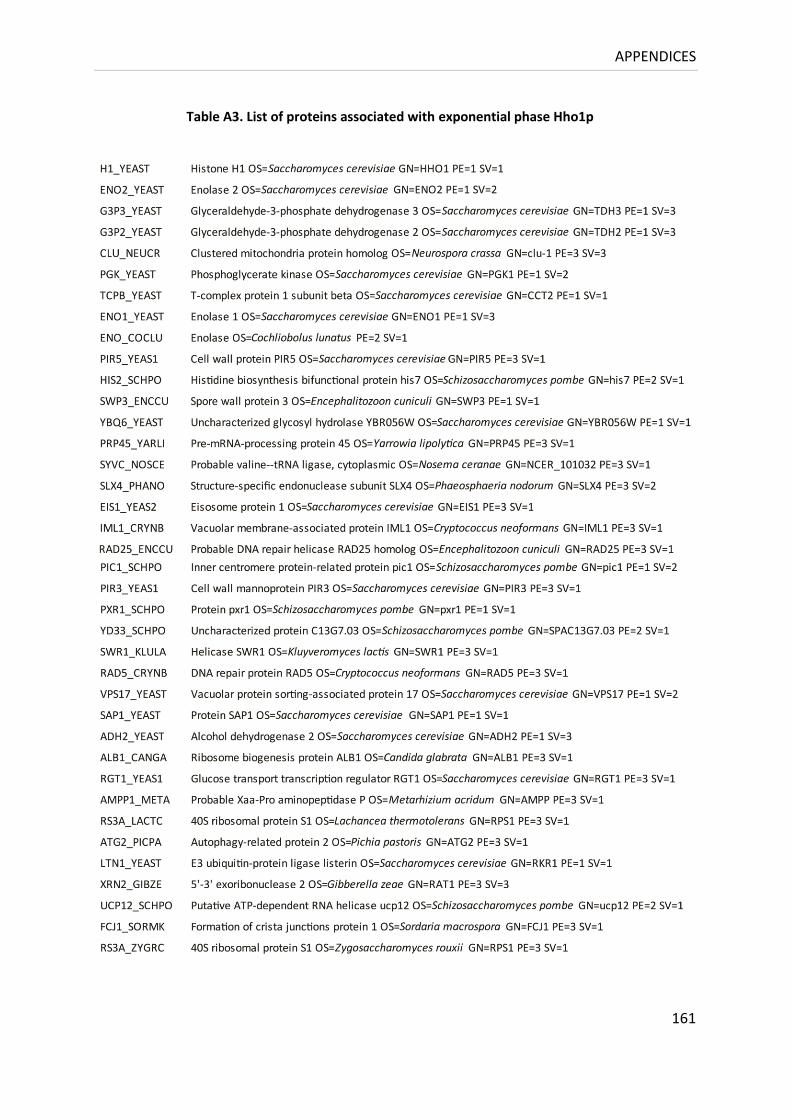
APPENDICES
161
Table A3. List of proteins associated with exponential phase Hho1p
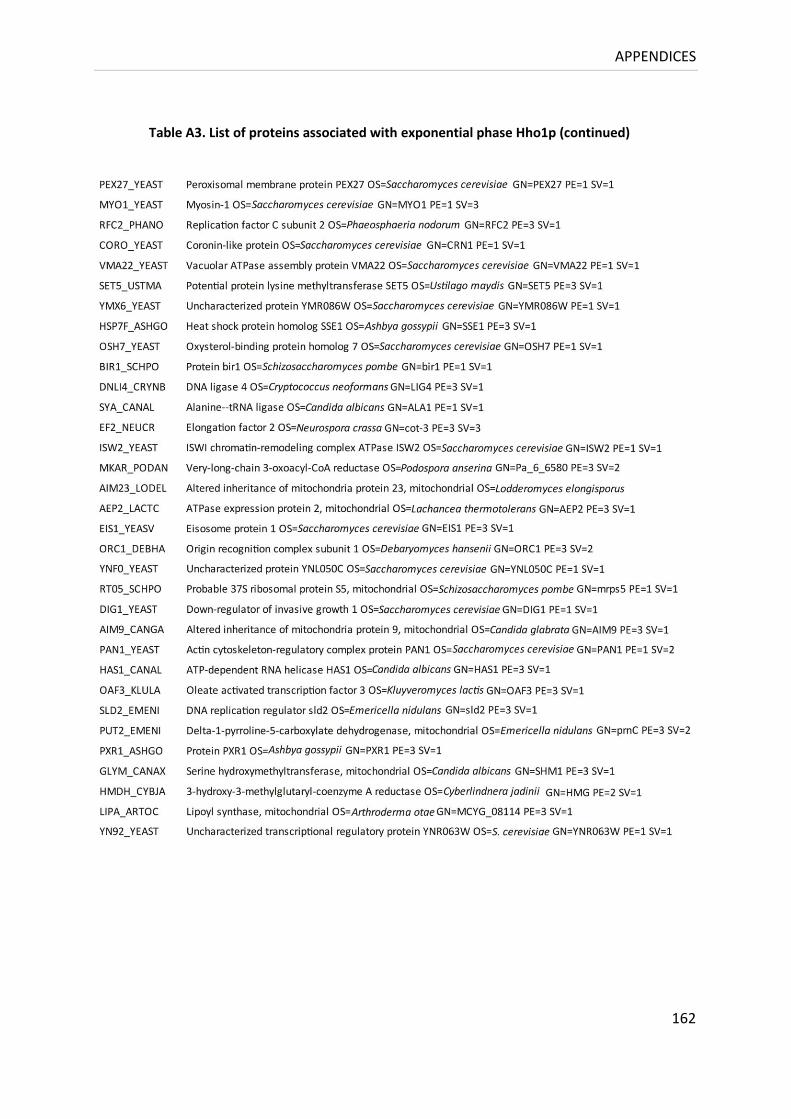
APPENDICES
162
Table A3. List of proteins associated with exponential phase Hho1p (continued)
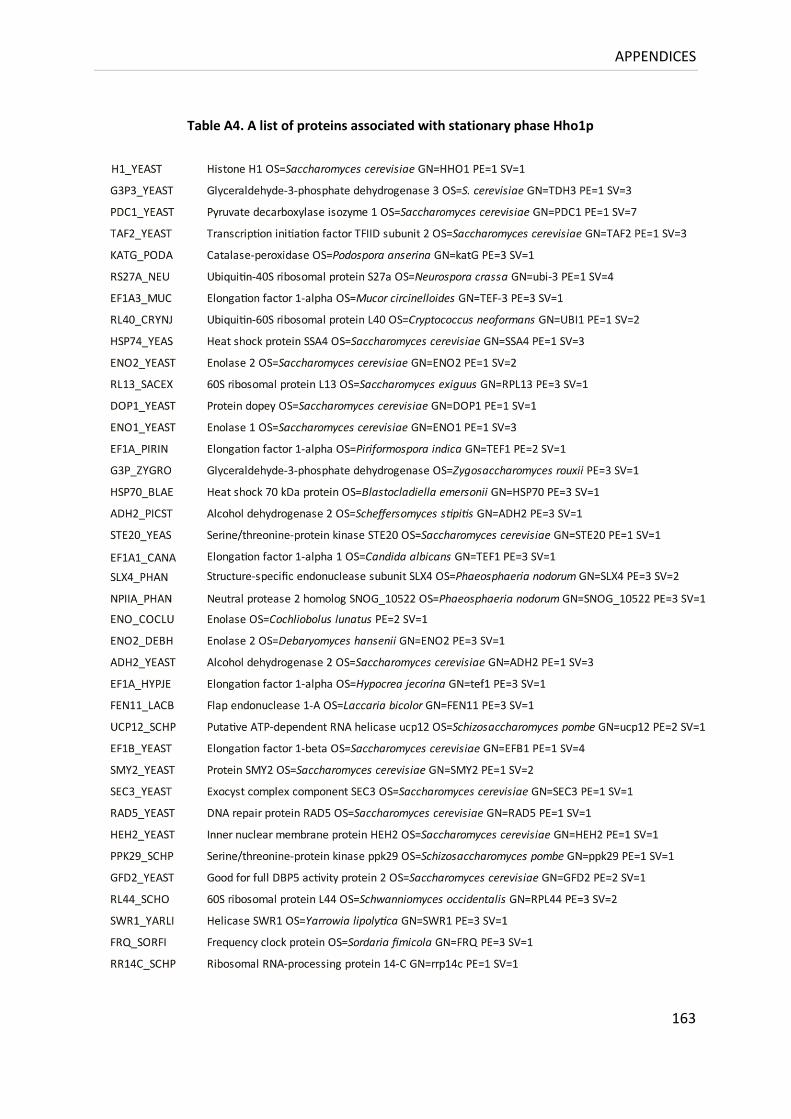
APPENDICES
163
Table A4. A list of proteins associated with stationary phase Hho1p
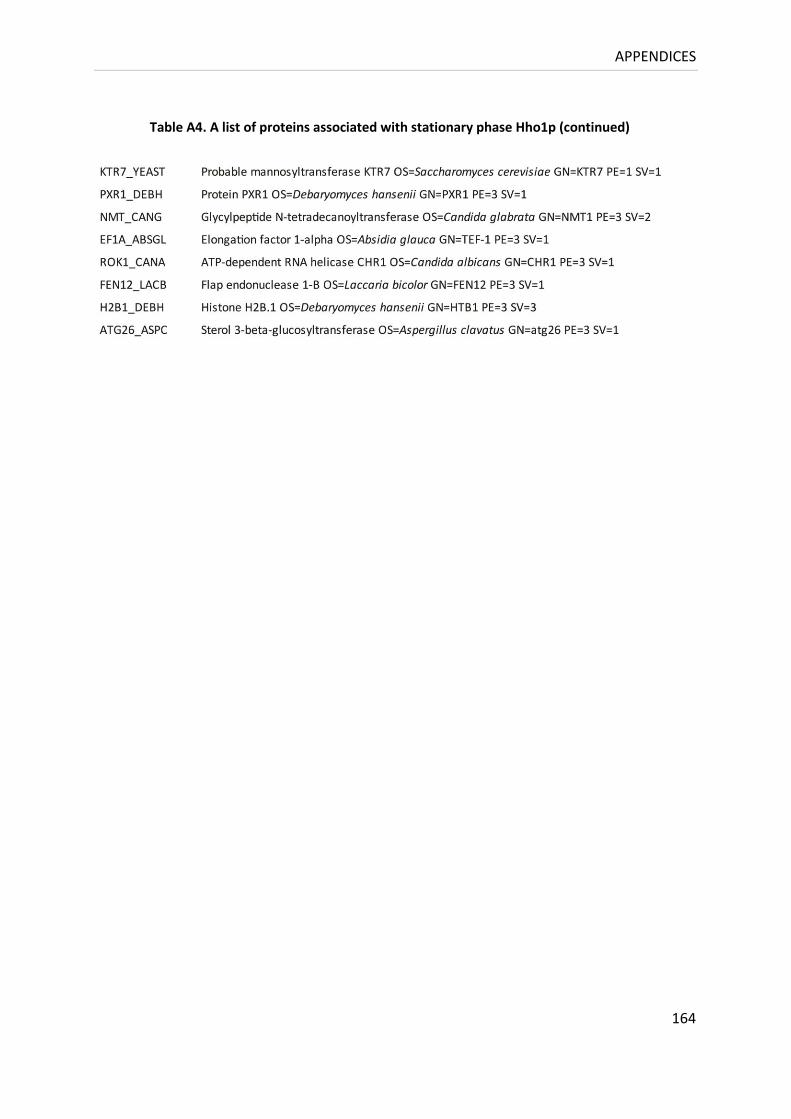
APPENDICES
164
Table A4. A list of proteins associated with stationary phase Hho1p (continued)
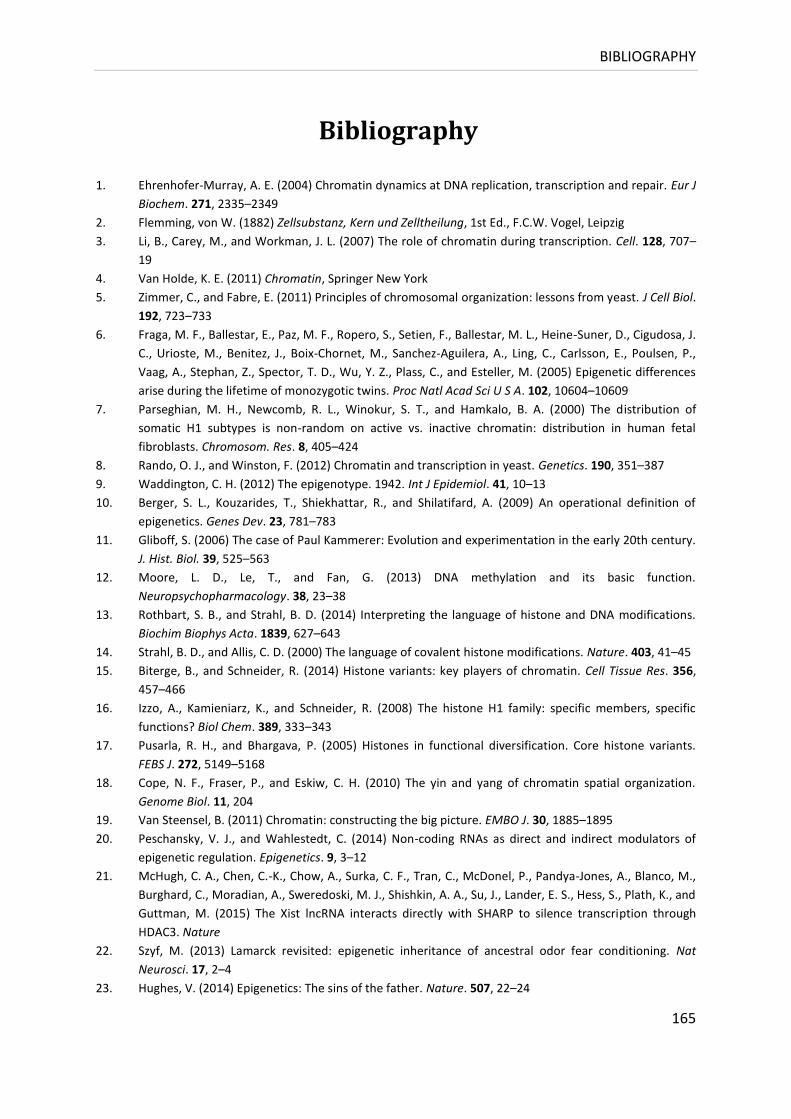
BIBLIOGRAPHY
165
Bibliography
1. Ehrenhofer-Murray, A. E. (2004) Chromatin dynamics at DNA replication, transcription and repair. Eur J
Biochem. 271, 2335–2349
2. Flemming, von W. (1882) Zellsubstanz, Kern und Zelltheilung, 1st Ed., F.C.W. Vogel, Leipzig
3. Li, B., Carey, M., and Workman, J. L. (2007) The role of chromatin during transcription. Cell. 128, 707–
19
4. Van Holde, K. E. (2011) Chromatin, Springer New York
5. Zimmer, C., and Fabre, E. (2011) Principles of chromosomal organization: lessons from yeast. J Cell Biol.
192, 723–733
6. Fraga, M. F., Ballestar, E., Paz, M. F., Ropero, S., Setien, F., Ballestar, M. L., Heine-Suner, D., Cigudosa, J.
C., Urioste, M., Benitez, J., Boix-Chornet, M., Sanchez-Aguilera, A., Ling, C., Carlsson, E., Poulsen, P.,
Vaag, A., Stephan, Z., Spector, T. D., Wu, Y. Z., Plass, C., and Esteller, M. (2005) Epigenetic differences
arise during the lifetime of monozygotic twins. Proc Natl Acad Sci U S A. 102, 10604–10609
7. Parseghian, M. H., Newcomb, R. L., Winokur, S. T., and Hamkalo, B. A. (2000) The distribution of
somatic H1 subtypes is non-random on active vs. inactive chromatin: distribution in human fetal
fibroblasts. Chromosom. Res. 8, 405–424
8. Rando, O. J., and Winston, F. (2012) Chromatin and transcription in yeast. Genetics. 190, 351–387
9. Waddington, C. H. (2012) The epigenotype. 1942. Int J Epidemiol. 41, 10–13
10. Berger, S. L., Kouzarides, T., Shiekhattar, R., and Shilatifard, A. (2009) An operational definition of
epigenetics. Genes Dev. 23, 781–783
11. Gliboff, S. (2006) The case of Paul Kammerer: Evolution and experimentation in the early 20th century.
J. Hist. Biol. 39, 525–563
12. Moore, L. D., Le, T., and Fan, G. (2013) DNA methylation and its basic function.
Neuropsychopharmacology. 38, 23–38
13. Rothbart, S. B., and Strahl, B. D. (2014) Interpreting the language of histone and DNA modifications.
Biochim Biophys Acta. 1839, 627–643
14. Strahl, B. D., and Allis, C. D. (2000) The language of covalent histone modifications. Nature. 403, 41–45
15. Biterge, B., and Schneider, R. (2014) Histone variants: key players of chromatin. Cell Tissue Res. 356,
457–466
16. Izzo, A., Kamieniarz, K., and Schneider, R. (2008) The histone H1 family: specific members, specific
functions? Biol Chem. 389, 333–343
17. Pusarla, R. H., and Bhargava, P. (2005) Histones in functional diversification. Core histone variants.
FEBS J. 272, 5149–5168
18. Cope, N. F., Fraser, P., and Eskiw, C. H. (2010) The yin and yang of chromatin spatial organization.
Genome Biol. 11, 204
19. Van Steensel, B. (2011) Chromatin: constructing the big picture. EMBO J. 30, 1885–1895
20. Peschansky, V. J., and Wahlestedt, C. (2014) Non-coding RNAs as direct and indirect modulators of
epigenetic regulation. Epigenetics. 9, 3–12
21. McHugh, C. A., Chen, C.-K., Chow, A., Surka, C. F., Tran, C., McDonel, P., Pandya-Jones, A., Blanco, M.,
Burghard, C., Moradian, A., Sweredoski, M. J., Shishkin, A. A., Su, J., Lander, E. S., Hess, S., Plath, K., and
Guttman, M. (2015) The Xist lncRNA interacts directly with SHARP to silence transcription through
HDAC3. Nature
22. Szyf, M. (2013) Lamarck revisited: epigenetic inheritance of ancestral odor fear conditioning. Nat
Neurosci. 17, 2–4
23. Hughes, V. (2014) Epigenetics: The sins of the father. Nature. 507, 22–24
BIBLIOGRAPHY
166
24. Kundu, S., and Peterson, C. L. (2009) Role of chromatin states in transcriptional memory. Biochim
Biophys Acta. 1790, 445–455
25. Mitchell, C., Hobcraft, J., McLanahan, S. S., Siegel, S. R., Berg, A., Brooks-Gunn, J., Garfinkel, I., and
Notterman, D. (2014) Social disadvantage, genetic sensitivity, and children’s telomere length. Proc Natl
Acad Sci U S A. 111, 5944–5949
26. Skinner, M. K. (2011) Environmental epigenomics and disease susceptibility. EMBO Rep. 12, 620–622
27. Daigle, S. R., Olhava, E. J., Therkelsen, C. A., Majer, C. R., Sneeringer, C. J., Song, J., Johnston, L. D.,
Scott, M. P., Smith, J. J., Xiao, Y., Jin, L., Kuntz, K. W., Chesworth, R., Moyer, M. P., Bernt, K. M., Tseng,
J. C., Kung, A. L., Armstrong, S. A., Copeland, R. A., Richon, V. M., and Pollock, R. M. (2011) Selective
killing of mixed lineage leukemia cells by a potent small-molecule DOT1L inhibitor. Cancer Cell. 20, 53–
65
28. Yang, X.-J. J., and Seto, E. (2007) HATs and HDACs: from structure, function and regulation to novel
strategies for therapy and prevention. Oncogene. 26, 5310–5318
29. Watson, J. D., and Crick, F. H. (1953) Molecular structure of nucleic acids; a structure for deoxyribose
nucleic acid. Nature. 171, 737–738
30. Arents, G., and Moudrianakis, E. N. (1995) The histone fold: a ubiquitous architectural motif utilized in
DNA compaction and protein dimerization. Proc Natl Acad Sci U S A. 92, 11170–11174
31. Arents, G., Burlingame, R. W., Wang, B. C., Love, W. E., and Moudrianakis, E. N. (1991) The
nucleosomal core histone octamer at 3.1 A resolution: a tripartite protein assembly and a left-handed
superhelix. Proc Natl Acad Sci U S A. 88, 10148–10152
32. Cutter, A. R., and Hayes, J. J. (2015) A brief review of nucleosome structure. FEBS Lett.
10.1016/j.febslet.2015.05.016
33. Burton, D. R., Butler, M. J., Hyde, J. E., Phillips, D., Skidmore, C. J., and Walker, I. O. (1978) The
interaction of core histones with DNA: equilibrium binding studies. Nucleic Acids Res. 5, 3643–3663
34. Kornberg, R. D., and Thomas, J. O. (1974) Chromatin structure; oligomers of the histones. Science. 184,
865–868
35. Luger, K., Mäder, a W., Richmond, R. K., Sargent, D. F., and Richmond, T. J. (1997) Crystal structure of
the nucleosome core particle at 2.8 A resolution. Nature. 389, 251–60
36. Li, Q., Burgess, R., and Zhang, Z. (2013) All roads lead to chromatin: multiple pathways for histone
deposition. Biochim Biophys Acta. 1819, 238–246
37. Finch, J. T., Lutter, L. C., Rhodes, D., Brown, R. S., Rushton, B., Levitt, M., and Klug, A. (1977) Structure
of nucleosome core particles of chromatin. Nature. 269, 29–36
38. Richmond, T. J., and Davey, C. A. (2003) The structure of DNA in the nucleosome core. Nature. 423,
145–150
39. Zlatanova, J., Bishop, T. C., Victor, J.-M., Jackson, V., and van Holde, K. (2009) The nucleosome family:
dynamic and growing. Structure. 17, 160–71
40. Olins, A. L., Olins, D. E., Zentgraf, H., and Franke, W. W. (1980) Visualization of nucleosomes in thin
sections by stereo electron microscopy. J Cell Biol. 87, 833–836
41. Oudet, P., Gross-Bellard, M., and Chambon, P. (1975) Electron microscopic and biochemical evidence
that chromatin structure is a repeating unit. Cell. 4, 281–300
42. Hansen, J. C., Ausio, J., Stanik, V. H., and van Holde, K. E. (1989) Homogeneous reconstituted
oligonucleosomes, evidence for salt-dependent folding in the absence of histone H1. Biochemistry. 28,
9129–9136
43. Routh, A., Sandin, S., and Rhodes, D. (2008) Nucleosome repeat length and linker histone
stoichiometry determine chromatin fiber structure. Proc Natl Acad Sci U S A. 105, 8872–8877
44. Tremethick, D. J. (2007) Higher-order structures of chromatin: the elusive 30 nm fiber. Cell. 128, 651–
654
BIBLIOGRAPHY
167
45. Finch, J. T., and Klug, A. (1976) Solenoidal model for superstructure in chromatin. Proc Natl Acad Sci U
S A. 73, 1897–1901
46. Kruithof, M., Chien, F. T., Routh, A., Logie, C., Rhodes, D., and van Noort, J. (2009) Single-molecule
force spectroscopy reveals a highly compliant helical folding for the 30-nm chromatin fiber. Nat Struct
Mol Biol. 16, 534–540
47. Dorigo, B., Schalch, T., Kulangara, A., Duda, S., Schroeder, R. R., and Richmond, T. J. (2004) Nucleosome
arrays reveal the two-start organization of the chromatin fiber. Science. 306, 1571–1573
48. Schalch, T., Duda, S., Sargent, D. F., and Richmond, T. J. (2005) X-ray structure of a tetranucleosome
and its implications for the chromatin fibre. Nature. 436, 138–141
49. Collepardo-Guevara, R., and Schlick, T. (2014) Chromatin fiber polymorphism triggered by variations of
DNA linker lengths. Proc Natl Acad Sci U S A. 111, 8061–8066
50. Van Holde, K., and Zlatanova, J. (1995) Chromatin higher order structure: chasing a mirage? J Biol
Chem. 270, 8373–8376
51. Li, G., Sudlow, G., and Belmont, A. S. (1998) Interphase cell cycle dynamics of a late-replicating,
heterochromatic homogeneously staining region: Precise choreography of
condensation/decondensation and nuclear positioning. J. Cell Biol. 140, 975–989
52. Gasser, S. M., Laroche, T., Falquet, J., Boy de la Tour, E., and Laemmli, U. K. (1986) Metaphase
chromosome structure. Involvement of topoisomerase II. J Mol Biol. 188, 613–629
53. Hirano, T. (2006) At the heart of the chromosome: SMC proteins in action. Nat Rev Mol Cell Biol. 7,
311–322
54. Mehta, G. D., Rizvi, S. M., and Ghosh, S. K. (2012) Cohesin: a guardian of genome integrity. Biochim
Biophys Acta. 1823, 1324–1342
55. Paulson, J. R., and Laemmli, U. K. (1977) The structure of histone-depleted metaphase chromosomes.
Cell. 12, 817–828
56. Daly, M. M., and Mirsky, A. E. (1955) Histones with high lysine content. J Gen Physiol. 38, 405–413
57. Johns, E. W. (1964) Studies on histones. 8. A degradation product of lysine-rich histone. Biochem J. 93,
161–163
58. Kasinsky, H. E., Lewis, J. D., Dacks, J. B., Ausio, J., and Ausió, J. (2001) Origin of H1 linker histones.
FASEB J. 15, 34–42
59. Thoma, F., Koller, T., and Klug, A. (1979) Involvement of histone H1 in the organization of the
nucleosome and of the salt-dependent superstructures of chromatin. J Cell Biol. 83, 403–427
60. Van Holde, K., and Zlatanova, J. (1996) What determines the folding of the chromatin fiber? Proc Natl
Acad Sci U S A. 93, 10548–10555
61. Varshavsky, A. J., Bakayev, V. V, and Georgiev, G. P. (1976) Heterogeneity of chromatin subunits in
vitro and location of histone H1. Nucleic Acids Res. 3, 477–492
62. Allan, J., Hartman, P. G., Crane-Robinson, C., and Aviles, F. X. (1980) The structure of histone H1 and its
location in chromatin. Nature. 288, 675–679
63. Carruthers, L. M., Bednar, J., Woodcock, C. L., and Hansen, J. C. (1998) Linker histones stabilize the
intrinsic salt-dependent folding of nucleosomal arrays: mechanistic ramifications for higher-order
chromatin folding. Biochemistry. 37, 14776–14787
64. Grigoryev, S. A., Arya, G., Correll, S., Woodcock, C. L., and Schlick, T. (2009) Evidence for heteromorphic
chromatin fibers from analysis of nucleosome interactions. Proc Natl Acad Sci U S A. 106, 13317–13322
65. Bharath, M. M., Chandra, N. R., and Rao, M. R. (2003) Molecular modeling of the chromatosome
particle. Nucleic Acids Res. 31, 4264–4274
66. Noll, M., and Kornberg, R. D. (1977) Action of micrococcal nuclease on chromatin and the location of
histone H1. J Mol Biol. 109, 393–404
67. Simpson, R. T. (1978) Structure of the chromatosome, a chromatin particle containing 160 base pairs of
DNA and all the histones. Biochemistry. 17, 5524–5531
BIBLIOGRAPHY
168
68. Hayes, J. J., and Wolffe, A. P. (1993) Preferential and asymmetric interaction of linker histones with 5S
DNA in the nucleosome. Proc Natl Acad Sci U S A. 90, 6415–6419
69. Travers, A. (1999) The location of the linker histone on the nucleosome. Trends Biochem Sci. 24, 4–7
70. Hussain, S. S., and Dimitrov, D. S. (2009) One base pair resolution histone H1- nucleosomal DNA
interaction mapping and 3D organization of H1 containing nucleosome. Ph.D. thesis, Universite Joseph
Fourier-Grenoble 1, France
71. Zhou, Y. B., Gerchman, S. E., Ramakrishnan, V., Travers, A., and Muyldermans, S. (1998) Position and
orientation of the globular domain of linker histone H5 on the nucleosome. Nature. 395, 402–405
72. Song, F., Chen, P., Sun, D., Wang, M., Dong, L., Liang, D., Xu, R. M., Zhu, P., and Li, G. (2014) Cryo-EM
study of the chromatin fiber reveals a double helix twisted by tetranucleosomal units. Science. 344,
376–380
73. Zhou, B. R., Feng, H., Kato, H., Dai, L., Yang, Y., Zhou, Y., and Bai, Y. (2013) Structural insights into the
histone H1-nucleosome complex. Proc Natl Acad Sci U S A. 110, 19390–19395
74. George, E. M., Izard, T., Anderson, S. D., and Brown, D. T. (2010) Nucleosome interaction surface of
linker histone H1c is distinct from that of H10. J. Biol. Chem. 285, 20891–20896
75. Brown, D. T., Izard, T., and Misteli, T. (2006) Mapping the interaction surface of linker histone H1(0)
with the nucleosome of native chromatin in vivo. Nat Struct Mol Biol. 13, 250–255
76. Fan, L., and Roberts, V. A. (2006) Complex of linker histone H5 with the nucleosome and its
implications for chromatin packing. Proc Natl Acad Sci U S A. 103, 8384–8389
77. Yu, Q., Kuzmiak, H., Zou, Y., Olsen, L., Defossez, P.-A. A., and Bi, X. (2009) Saccharomyces cerevisiae
linker histone Hho1p functionally interacts with core histone H4 and negatively regulates the
establishment of transcriptionally silent chromatin. J. Biol. Chem. 284, 740–50
78. Santisteban, M. S., Arents, G., Moudrianakis, E. N., and Smith, M. M. (1997) Histone octamer function
in vivo: mutations in the dimer-tetramer interfaces disrupt both gene activation and repression. EMBO
J. 16, 2493–2506
79. Altaf, M., Utley, R. T., Lacoste, N., Tan, S., Briggs, S. D., and Cote, J. (2007) Interplay of chromatin
modifiers on a short basic patch of histone H4 tail defines the boundary of telomeric heterochromatin.
Mol Cell. 28, 1002–1014
80. Fry, C. J., Norris, A., Cosgrove, M., Boeke, J. D., and Peterson, C. L. (2006) The LRS and SIN domains: two
structurally equivalent but functionally distinct nucleosomal surfaces required for transcriptional
silencing. Mol Cell Biol. 26, 9045–9059
81. Kruger, W., Peterson, C. L., Sil, A., Coburn, C., Arents, G., Moudrianakis, E. N., and Herskowitz, I. (1995)
Amino acid substitutions in the structured domains of histones H3 and H4 partially relieve the
requirement of the yeast SWI/SNF complex for transcription. Genes Dev. 9, 2770–2779
82. Park, J. H., Cosgrove, M. S., Youngman, E., Wolberger, C., and Boeke, J. D. (2002) A core nucleosome
surface crucial for transcriptional silencing. Nat Genet. 32, 273–279
83. Dobzhansky, T. (1973) Nothing in Biology Makes Sense Except in the Light of Evolution. Am. Biol.
Teach. 35, 5
84. Graeber, T. G., Osmanian, C., Jacks, T., Housman, D. E., Koch, C. J., Lowe, S. W., and Giaccia, A. J. (1996)
Hypoxia-mediated selection of cells with diminished apoptotic potential in solid tumours. Nature. 379,
88–91
85. Cole, R. D. (1984) A minireview of microheterogeneity in H1 histone and its possible significance. Anal
Biochem. 136, 24–30
86. Hartman, P. G., Chapman, G. E., Moss, T., and Bradbury, E. M. (1977) Studies on the role and mode of
operation of the very-lysine-rich histone H1 in eukaryote chromatin. The three structural regions of the
histone H1 molecule. Eur J Biochem. 77, 45–51
BIBLIOGRAPHY
169
87. Bradbury, E. M., Inglis, R. J., Matthews, H. R., and Sarner, N. (1973) Phosphorylation of very-lysine-rich
histone in Physarum polycephalum. Correlation with chromosome condensation. Eur J Biochem. 33,
131–139
88. Ramakrishnan, V., Finch, J. T., Graziano, V., Lee, P. L., and Sweet, R. M. (1993) Crystal structure of
globular domain of histone H5 and its implications for nucleosome binding. Nature. 362, 219–223
89. Gajiwala, K. S., and Burley, S. K. (2000) Winged helix proteins. Curr Opin Struct Biol. 10, 110–116
90. Varga-Weisz, P., van Holde, K., and Zlatanova, J. (1993) Preferential binding of histone H1 to four-way
helical junction DNA. J Biol Chem. 268, 20699–20700
91. Caterino, T. L., and Hayes, J. J. (2011) Structure of the H1 C-terminal domain and function in chromatin
condensation. Biochem Cell Biol. 89, 35–44
92. Allan, J., Mitchell, T., Harborne, N., Bohm, L., and Crane-Robinson, C. (1986) Roles of H1 domains in
determining higher order chromatin structure and H1 location. J Mol Biol. 187, 591–601
93. Vyas, P., and Brown, D. T. (2012) N- and C-terminal domains determine differential nucleosomal
binding geometry and affinity of linker histone isotypes H1(0) and H1c. J Biol Chem. 287, 11778–11787
94. Bradbury, E. M., Cary, P. D., Chapman, G. E., Crane-Robinson, C., Danby, S. E., Rattle, H. W., Boublik,
M., Palau, J., and Aviles, F. J. (1975) Studies on the role and mode of operation of the very-lysine-rich
histone H1 (F1) in eukaryote chromatin. The conformation of histone H1. Eur J Biochem. 52, 605–613
95. Hansen, J. C., Lu, X., Ross, E. D., and Woody, R. W. (2006) Intrinsic protein disorder, amino acid
composition, and histone terminal domains. J. Biol. Chem. 281, 1853–1856
96. Caterino, T. L., Fang, H., and Hayes, J. J. (2011) Nucleosome linker DNA contacts and induces specific
folding of the intrinsically disordered H1 carboxyl-terminal domain. Mol Cell Biol. 31, 2341–2348
97. Clark, D. J., Hill, C. S., Martin, S. R., and Thomas, J. O. (1988) Alpha-helix in the carboxy-terminal
domains of histones H1 and H5. EMBO J. 7, 69–75
98. Lu, X., and Hansen, J. C. (2004) Identification of specific functional subdomains within the linker
histone H10 C-terminal domain. J. Biol. Chem. 279, 8701–7
99. Vila, R., Ponte, I., Collado, M., Arrondo, J. L., and Suau, P. (2001) Induction of secondary structure in a
COOH-terminal peptide of histone H1 by interaction with the DNA: an infrared spectroscopy study. J
Biol Chem. 276, 30898–30903
100. Vila, R., Ponte, I., Jimenez, M. A., Rico, M., and Suau, P. (2000) A helix-turn motif in the C-terminal
domain of histone H1. Protein Sci. 9, 627–636
101. Subirana, J. A. (1990) Analysis of the charge distribution in the C-terminal region of histone H1 as
related to its interaction with DNA. Biopolymers. 29, 1351–1357
102. Khadake, J. R., and Rao, M. R. (1995) DNA- and chromatin-condensing properties of rat testes H1a and
H1t compared to those of rat liver H1bdec; H1t is a poor condenser of chromatin. Biochemistry. 34,
15792–15801
103. Bharath, M. M. S., Chandra, N. R., and Rao, M. R. S. (2002) Prediction of an HMG-box fold in the C-
terminal domain of histone H1: insights into its role in DNA condensation. Proteins. 49, 71–81
104. Mirzabekov, A. D., San’ko, D. F., Kolchinsky, A. M., and Melnikova, A. F. (1977) Protein arrangement in
the DNA grooves in chromatin and nucleoprotamine in vitro and in vivo revealed by methylation. Eur.
J. Biochem. 75, 379–389
105. Vila, R., Ponte, I., Collado, M., Arrondo, J. L., Jimenez, M. A., Rico, M., and Suau, P. (2001) DNA-induced
alpha-helical structure in the NH2-terminal domain of histone H1. J Biol Chem. 276, 46429–46435
106. Syed, S. H., Goutte-Gattat, D., Becker, N., Meyer, S., Shukla, M. S., Hayes, J. J., Everaers, R., Angelov, D.,
Bednar, J., and Dimitrov, S. (2010) Single-base resolution mapping of H1-nucleosome interactions and
3D organization of the nucleosome. Proc Natl Acad Sci U S A. 107, 9620–9625
107. Hendzel, M. J., Lever, M. A., Crawford, E., and Th’ng, J. P. (2004) The C-terminal domain is the primary
determinant of histone H1 binding to chromatin in vivo. J Biol Chem. 279, 20028–20034
BIBLIOGRAPHY
170
108. Oberg, C., and Belikov, S. (2012) The N-terminal domain determines the affinity and specificity of H1
binding to chromatin. Biochem Biophys Res Commun. 420, 321–324
109. Burri, M., Schlimme, W., Betschart, B., Kampfer, U., Schaller, J., and Hecker, H. (1993) Biochemical and
functional characterization of histone H1-like proteins in procyclic Trypanosoma brucei brucei.
Parasitol Res. 79, 649–659
110. Hayashi, T., Hayashi, H., and Iwai, K. (1987) Tetrahymena histone H1. Isolation and amino acid
sequence lacking the central hydrophobic domain conserved in other H1 histones. J Biochem. 102,
369–376
111. Landsman, D. (1996) Histone H1 in Saccharomyces cerevisiae: a double mystery solved? Trends
Biochem Sci. 21, 287–288
112. Ali, T., Coles, P., Stevens, T. J., Stott, K., and Thomas, J. O. (2004) Two homologous domains of similar
structure but different stability in the yeast linker histone, Hho1p. J. Mol. Biol. 338, 139–48
113. Ono, K., Kusano, O., Shimotakahara, S., Shimizu, M., Yamazaki, T., and Shindo, H. (2003) The linker
histone homolog Hho1p from Saccharomyces cerevisiae represents a winged helix-turn-helix fold as
determined by NMR spectroscopy. Nucleic Acids Res. 31, 7199–7207
114. Sanderson, A., Stott, K., Stevens, T. J., and Thomas, J. O. (2005) Engineering the structural stability and
functional properties of the GI domain into the intrinsically unfolded GII domain of the yeast linker
histone Hho1p. J Mol Biol. 349, 608–620
115. Polach, K. J., and Widom, J. (1995) Mechanism of protein access to specific DNA sequences in
chromatin: a dynamic equilibrium model for gene regulation. J. Mol. Biol. 254, 130–149
116. Bustin, M., Catez, F., and Lim, J. H. (2005) The dynamics of histone H1 function in chromatin. Mol Cell.
17, 617–620
117. Alberts, B., Kirschner, M. W., Tilghman, S., and Varmus, H. (2014) Rescuing US biomedical research
from its systemic flaws. Proc. Natl. Acad. Sci. U. S. A. 111, 5773–7
118. Gordon, C. N. (1977) Chromatin behaviour during the mitotic cell cycle of Saccharomyces cerevisiae. J
Cell Sci. 24, 81–93
119. Alberghina, L., Coccetti, P., and Orlandi, I. (2009) Systems biology of the cell cycle of Saccharomyces
cerevisiae: From network mining to system-level properties. Biotechnol Adv. 27, 960–978
120. Hartwell, L. H. (1974) Saccharomyces cerevisiae cell cycle. Bacteriol Rev. 38, 164–198
121. Werner-Washburne, M., Braun, E., Johnston, G. C., and Singer, R. A. (1993) Stationary phase in the
yeast Saccharomyces cerevisiae. Microbiol Rev. 57, 383–401
122. Pinon, R. (1978) Folded chromosomes in non-cycling yeast cells: evidence for a characteristic g0 form.
Chromosoma. 67, 263–274
123. Rusche, L. N., Kirchmaier, A. L., and Rine, J. (2003) The establishment, inheritance, and function of
silenced chromatin in Saccharomyces cerevisiae. Annu Rev Biochem. 72, 481–516
124. Chang, C. F., Wai, K. M., and Patterton, H. G. (2004) Calculating the statistical significance of physical
clusters of co-regulated genes in the genome: the role of chromatin in domain-wide gene regulation.
Nucleic Acids Res. 32, 1798–1807
125. Vaquero, A., Scher, M., Lee, D., Erdjument-Bromage, H., Tempst, P., and Reinberg, D. (2004) Human
SirT1 interacts with histone H1 and promotes formation of facultative heterochromatin. Mol Cell. 16,
93–105
126. Brand, A. H., Micklem, G., and Nasmyth, K. (1987) A yeast silencer contains sequences that can
promote autonomous plasmid replication and transcriptional activation. Cell. 51, 709–719
127. Imai, S., Armstrong, C. M., Kaeberlein, M., and Guarente, L. (2000) Transcriptional silencing and
longevity protein Sir2 is an NAD-dependent histone deacetylase. Nature. 403, 795–800
128. Carmen, A. A., Milne, L., and Grunstein, M. (2002) Acetylation of the yeast histone H4 N terminus
regulates its binding to heterochromatin protein SIR3. J Biol Chem. 277, 4778–4781
BIBLIOGRAPHY
171
129. Straight, a F., Shou, W., Dowd, G. J., Turck, C. W., Deshaies, R. J., Johnson, a D., and Moazed, D. (1999)
Net1, a Sir2-associated nucleolar protein required for rDNA silencing and nucleolar integrity. Cell. 97,
245–256
130. Georgel, P. T., Horowitz-Scherer, R. A., Adkins, N., Woodcock, C. L., Wade, P. A., and Hansen, J. C.
(2003) Chromatin compaction by human MeCP2. Assembly of novel secondary chromatin structures in
the absence of DNA methylation. J Biol Chem. 278, 32181–32188
131. Briggs, S. D., Bryk, M., Strahl, B. D., Cheung, W. L., Davie, J. K., Dent, S. Y., Winston, F., and Allis, C. D.
(2001) Histone H3 lysine 4 methylation is mediated by Set1 and required for cell growth and rDNA
silencing in Saccharomyces cerevisiae. Genes Dev. 15, 3286–3295
132. Bryk, M., Briggs, S. D., Strahl, B. D., Curcio, M. J., Allis, C. D., and Winston, F. (2002) Evidence that Set1,
a factor required for methylation of histone H3, regulates rDNA silencing in S. cerevisiae by a Sir2-
independent mechanism. Curr Biol. 12, 165–170
133. Boa, S., Coert, C., and Patterton, H. G. (2003) Saccharomyces cerevisiae Set1p is a methyltransferase
specific for lysine 4 of histone H3 and is required for efficient gene expression. Yeast. 20, 827–835
134. Krogan, N. J., Dover, J., Khorrami, S., Greenblatt, J. F., Schneider, J., Johnston, M., and Shilatifard, A.
(2002) COMPASS, a histone H3 (Lysine 4) methyltransferase required for telomeric silencing of gene
expression. J Biol Chem. 277, 10753–10755
135. Mueller, J. E., Canze, M., and Bryk, M. (2006) The requirements for COMPASS and Paf1 in
transcriptional silencing and methylation of histone H3 in Saccharomyces cerevisiae. Genetics. 173,
557–567
136. Cremer, T., Kurz, A., Zirbel, R., Dietzel, S., Rinke, B., Schrock, E., Speicher, M. R., Mathieu, U., Jauch, A.,
Emmerich, P., Scherthan, H., Ried, T., Cremer, C., and Lichter, P. (1993) Role of chromosome territories
in the functional compartmentalization of the cell nucleus. in Cold Spring Harbor Symposia on
Quantitative Biology, pp. 777–792, 58, 777–792
137. Gottschling, D. E., Aparicio, O. M., Billington, B. L., and Zakian, V. A. (1990) Position effect at S.
cerevisiae telomeres: reversible repression of Pol II transcription. Cell. 63, 751–762
138. Shogren-Knaak, M., Ishii, H., Sun, J. M., Pazin, M. J., Davie, J. R., and Peterson, C. L. (2006) Histone H4-
K16 acetylation controls chromatin structure and protein interactions. Science. 311, 844–847
139. Veron, M., Zou, Y., Yu, Q., Bi, X., Selmi, A., Gilson, E., and Defossez, P. A. (2006) Histone H1 of
Saccharomyces cerevisiae inhibits transcriptional silencing. Genetics. 173, 579–587
140. Barski, A., Cuddapah, S., Cui, K., Roh, T. Y., Schones, D. E., Wang, Z., Wei, G., Chepelev, I., and Zhao, K.
(2007) High-resolution profiling of histone methylations in the human genome. Cell. 129, 823–837
141. Noma, K., Allis, C. D., and Grewal, S. I. (2001) Transitions in distinct histone H3 methylation patterns at
the heterochromatin domain boundaries. Science. 293, 1150–1155
142. Meneghini, M. D., Wu, M., and Madhani, H. D. (2003) Conserved histone variant H2A.Z protects
euchromatin from the ectopic spread of silent heterochromatin. Cell. 112, 725–736
143. Altaf, M., Auger, A., Monnet-Saksouk, J., Brodeur, J., Piquet, S., Cramet, M., Bouchard, N., Lacoste, N.,
Utley, R. T., Gaudreau, L., and Cote, J. (2010) NuA4-dependent acetylation of nucleosomal histones H4
and H2A directly stimulates incorporation of H2A.Z by the SWR1 complex. J Biol Chem. 285, 15966–
15977
144. Papamichos-Chronakis, M., Watanabe, S., Rando, O. J., and Peterson, C. L. (2011) Global regulation of
H2A.Z localization by the INO80 chromatin-remodeling enzyme is essential for genome integrity. Cell.
144, 200–213
145. Simpson, R. T., Roth, S. Y., Morse, R. H., Patterton, H. G., Cooper, J. P., Murphy, M., Kladde, M. P., and
Shimizu, M. (1993) Nucleosome positioning and transcription. Cold Spring Harb Symp Quant Biol. 58,
237–245
146. Belch, Y., Yang, J., Liu, Y., Malkaram, S. a, Liu, R., Riethoven, J.-J. M., and Ladunga, I. (2010) Weakly
positioned nucleosomes enhance the transcriptional competency of chromatin. PLoS One. 5, e12984
BIBLIOGRAPHY
172
147. Durrin, L. K., Mann, R. K., and Grunstein, M. (1992) Nucleosome loss activates CUP1 and HIS3
promoters to fully induced levels in the yeast Saccharomyces cerevisiae. Mol Cell Biol. 12, 1621–1629
148. Hu, Z., Chen, K., Xia, Z., Chavez, M., Pal, S., Seol, J. H., Chen, C. C., Li, W., and Tyler, J. K. (2014)
Nucleosome loss leads to global transcriptional up-regulation and genomic instability during yeast
aging. Genes Dev. 28, 396–408
149. Weiner, A., Hughes, A., Yassour, M., Rando, O. J., and Friedman, N. (2010) High-resolution nucleosome
mapping reveals transcription-dependent promoter packaging. Genome Res. 20, 90–100
150. Deal, R. B., Henikoff, J. G., and Henikoff, S. (2010) Genome-wide kinetics of nucleosome turnover
determined by metabolic labeling of histones. Science. 328, 1161–1164
151. Schwartz, S., and Ast, G. (2010) Chromatin density and splicing destiny: on the cross-talk between
chromatin structure and splicing. EMBO J. 29, 1629–1636
152. Luco, R. F., Pan, Q., Tominaga, K., Blencowe, B. J., Pereira-Smith, O. M., and Misteli, T. (2010)
Regulation of alternative splicing by histone modifications. Sci. 327, 996–1000
153. Valouev, A., Ichikawa, J., Tonthat, T., Stuart, J., Ranade, S., Peckham, H., Zeng, K., Malek, J. A., Costa,
G., McKernan, K., Sidow, A., Fire, A., and Johnson, S. M. (2008) A high-resolution, nucleosome position
map of C. elegans reveals a lack of universal sequence-dictated positioning. Genome Res. 18, 1051–
1063
154. Van Bakel, H., Tsui, K., Gebbia, M., Mnaimneh, S., Hughes, T. R., and Nislow, C. (2013) A compendium
of nucleosome and transcript profiles reveals determinants of chromatin architecture and
transcription. PLoS Genet. 9, e1003479
155. Segal, E., Fondufe-Mittendorf, Y., Chen, L., Thastrom, A., Field, Y., Moore, I. K., Wang, J. P., and Widom,
J. (2006) A genomic code for nucleosome positioning. Nature. 442, 772–778
156. Mavrich, T. N., Ioshikhes, I. P., Venters, B. J., Jiang, C., Tomsho, L. P., Qi, J., Schuster, S. C., Albert, I., and
Pugh, B. F. (2008) A barrier nucleosome model for statistical positioning of nucleosomes throughout
the yeast genome. Genome Res. 18, 1073–1083
157. Lee, W., Tillo, D., Bray, N., Morse, R. H., Davis, R. W., Hughes, T. R., and Nislow, C. (2007) A high-
resolution atlas of nucleosome occupancy in yeast. Nat. Genet. 39, 1235–1244
158. Spies, N., Nielsen, C. B., Padgett, R. A., and Burge, C. B. (2009) Biased Chromatin Signatures around
Polyadenylation Sites and Exons. Mol. Cell. 36, 245–254
159. Tillo, D., and Hughes, T. R. (2009) G+C content dominates intrinsic nucleosome occupancy. BMC
Bioinformatics. 10, 442
160. Sekinger, E. a, Moqtaderi, Z., and Struhl, K. (2005) Intrinsic histone-DNA interactions and low
nucleosome density are important for preferential accessibility of promoter regions in yeast. Mol. Cell.
18, 735–48
161. Jiang, C., and Pugh, B. F. (2009) Nucleosome positioning and gene regulation: advances through
genomics. Nat. Rev. Genet. 10, 161–172
162. Dubarry, M., Loiodice, I., Chen, C. L., Thermes, C., and Taddei, A. (2011) Tight protein-DNA interactions
favor gene silencing. Genes Dev. 25, 1365–1370
163. Lowary, P. T., and Widom, J. (1998) New DNA sequence rules for high affinity binding to histone
octamer and sequence-directed nucleosome positioning. J Mol Biol. 276, 19–42
164. Brogaard, K., Xi, L., Wang, J. P., and Widom, J. (2012) A map of nucleosome positions in yeast at base-
pair resolution. Nature. 486, 496–501
165. Cui, F., and Zhurkin, V. B. (2009) Distinctive sequence patterns in metazoan and yeast nucleosomes:
implications for linker histone binding to AT-rich and methylated DNA. Nucleic Acids Res. 37, 2818–
2829
166. Yuan, G. C., Liu, Y. J., Dion, M. F., Slack, M. D., Wu, L. F., Altschuler, S. J., and Rando, O. J. (2005)
Genome-scale identification of nucleosome positions in S. cerevisiae. Science. 309, 626–630
BIBLIOGRAPHY
173
167. Ganguli, D., Chereji, R. V, Iben, J. R., Cole, H. a, and Clark, D. J. (2014) RSC-dependent constructive and
destructive interference between opposing arrays of phased nucleosomes in yeast. Genome Res.
10.1101/gr.177014.114
168. Raisner, R. M., Hartley, P. D., Meneghini, M. D., Bao, M. Z., Liu, C. L., Schreiber, S. L., Rando, O. J., and
Madhani, H. D. (2005) Histone variant H2A.Z marks the 5’ ends of both active and inactive genes in
euchromatin. Cell. 123, 233–248
169. Kobor, M. S., Venkatasubrahmanyam, S., Meneghini, M. D., Gin, J. W., Jennings, J. L., Link, A. J.,
Madhani, H. D., and Rine, J. (2004) A protein complex containing the conserved Swi2/Snf2-related
ATPase Swr1p deposits histone variant H2A.Z into euchromatin. PLoS Biol.
10.1371/journal.pbio.0020131
170. Koerber, R. T., Rhee, H. S., Jiang, C., and Pugh, B. F. (2009) Interaction of Transcriptional Regulators
with Specific Nucleosomes across the Saccharomyces Genome. Mol. Cell. 35, 889–902
171. Xiao, B., Freedman, B. S., Miller, K. E., Heald, R., and Marko, J. F. (2012) Histone H1 compacts DNA
under force and during chromatin assembly. Mol Biol Cell. 23, 4864–4871
172. Schultz, T. F., Spiker, S., and Quatrano, R. S. (1996) Histone H1 enhances the DNA binding activity of the
transcription factor EmBP-1. J Biol Chem. 271, 25742–25745
173. Karrer, K. M., and VanNuland, T. A. (1999) Nucleosome positioning is independent of histone H1 in
vivo. J Biol Chem. 274, 33020–33024
174. Widom, J. (1992) A relationship between the helical twist of DNA and the ordered positioning of
nucleosomes in all eukaryotic cells. Proc Natl Acad Sci U S A. 89, 1095–1099
175. Gilbert, N., and Allan, J. (2014) Supercoiling in DNA and chromatin. Curr Opin Genet Dev. 25, 15–21
176. Luger, K., Mader, A. W., Richmond, R. K., Sargent, D. F., and Richmond, T. J. (1997) Crystal structure of
the nucleosome core particle at 2.8 A resolution. Nature. 389, 251–260
177. Davey, C. A., Sargent, D. F., Luger, K., Maeder, A. W., and Richmond, T. J. (2002) Solvent mediated
interactions in the structure of the nucleosome core particle at 1.9 ?? resolution. J. Mol. Biol. 319,
1097–1113
178. Schwabish, M. A., and Struhl, K. (2006) Asf1 mediates histone eviction and deposition during
elongation by RNA polymerase II. Mol Cell. 22, 415–422
179. Furuyama, T., and Henikoff, S. (2009) Centromeric nucleosomes induce positive DNA supercoils. Cell.
138, 104–113
180. Takeuchi, K., Nishino, T., Mayanagi, K., Horikoshi, N., Osakabe, A., Tachiwana, H., Hori, T., Kurumizaka,
H., and Fukagawa, T. (2014) The centromeric nucleosome-like CENP-T-W-S-X complex induces positive
supercoils into DNA. Nucleic Acids Res. 42, 1644–1655
181. Greaves, I. K., Rangasamy, D., Ridgway, P., and Tremethick, D. J. (2007) H2A.Z contributes to the
unique 3D structure of the centromere. Proc Natl Acad Sci U S A. 104, 525–530
182. Henikoff, S., and Dalal, Y. (2005) Centromeric chromatin: what makes it unique? Curr Opin Genet Dev.
15, 177–184
183. Muller, U., Zentgraf, H., Eicken, I., and Keller, W. (1978) Higher order structure of simian virus 40
chromatin. Science. 201, 406–415
184. Fan, Y., Nikitina, T., Zhao, J., Fleury, T. J., Bhattacharyya, R., Bouhassira, E. E., Stein, A., Woodcock, C. L.,
and Skoultchi, A. I. (2005) Histone H1 depletion in mammals alters global chromatin structure but
causes specific changes in gene regulation. Cell. 123, 1199–1212
185. Georgieva, M., Roguev, A., Balashev, K., Zlatanova, J., and Miloshev, G. (2012) Hho1p, the linker
histone of Saccharomyces cerevisiae, is important for the proper chromatin organization in vivo.
Biochim Biophys Acta. 1819, 366–374
186. Maresca, T. J., and Heald, R. (2006) The long and the short of it: linker histone H1 is required for
metaphase chromosome compaction. Cell Cycle. 5, 589–591
BIBLIOGRAPHY
174
187. Maresca, T. J., Freedman, B. S., and Heald, R. (2005) Histone H1 is essential for mitotic chromosome
architecture and segregation in Xenopus laevis egg extracts. J Cell Biol. 169, 859–869
188. Laybourn, P. J., and Kadonaga, J. T. (1991) Role of nucleosomal cores and histone H1 in regulation of
transcription by RNA polymerase II. Science. 254, 238–245
189. Lu, X., Wontakal, S. N., Emelyanov, A. V, Morcillo, P., Konev, A. Y., Fyodorov, D. V, and Skoultchi, A. I.
(2009) Linker histone H1 is essential for Drosophila development, the establishment of pericentric
heterochromatin, and a normal polytene chromosome structure. Genes Dev. 23, 452–465
190. Shen, X., Yu, L., Weir, J. W., and Gorovsky, M. A. (1995) Linker histones are not essential and affect
chromatin condensation in vivo. Cell. 82, 47–56
191. Bryant, J. M., Govin, J., Zhang, L., Donahue, G., Pugh, B. F., and Berger, S. L. (2012) The linker histone
plays a dual role during gametogenesis in Saccharomyces cerevisiae. Mol Cell Biol. 32, 2771–2783
192. Zhang, Y., Cooke, M., Panjwani, S., Cao, K., Krauth, B., Ho, P. Y., Medrzycki, M., Berhe, D. T., Pan, C.,
McDevitt, T. C., and Fan, Y. (2012) Histone h1 depletion impairs embryonic stem cell differentiation.
PLoS Genet. 8, e1002691
193. Lu, X., Wontakal, S. N., Kavi, H., Kim, B. J., Guzzardo, P. M., Emelyanov, A. V, Xu, N., Hannon, G. J.,
Zavadil, J., Fyodorov, D. V, and Skoultchi, A. I. (2013) Drosophila H1 regulates the genetic activity of
heterochromatin by recruitment of Su(var)3-9. Science. 340, 78–81
194. Fan, Y., Nikitina, T., Morin-Kensicki, E. M., Zhao, J., Magnuson, T. R., Woodcock, C. L., and Skoultchi, A.
I. (2003) H1 linker histones are essential for mouse development and affect nucleosome spacing in
vivo. Mol Cell Biol. 23, 4559–4572
195. Lin, Q., Inselman, A., Han, X., Xu, H., Zhang, W., Handel, M. A., and Skoultchi, A. I. (2004) Reductions in
linker histone levels are tolerated in developing spermatocytes but cause changes in specific gene
expression. J Biol Chem. 279, 23525–23535
196. Patterton, H. G., Landel, C. C., Landsman, D., Peterson, C. L., and Simpson, R. T. (1998) The biochemical
and phenotypic characterization of Hho1p, the putative linker histone H1 of Saccharomyces cerevisiae.
J Biol Chem. 273, 7268–7276
197. Wierzbicki, A. T., and Jerzmanowski, A. (2005) Suppression of histone H1 genes in Arabidopsis results in
heritable developmental defects and stochastic changes in DNA methylation. Genetics. 169, 997–1008
198. Jedrusik, M. A., and Schulze, E. (2001) A single histone H1 isoform (H1.1) is essential for chromatin
silencing and germline development in Caenorhabditis elegans. Development. 128, 1069–1080
199. Barra, J. L., Rhounim, L., Rossignol, J. L., and Faugeron, G. (2000) Histone H1 is dispensable for
methylation-associated gene silencing in Ascobolus immersus and essential for long life span. Mol Cell
Biol. 20, 61–69
200. Ausio, J. (2000) Are linker histones (histone H1) dispensable for survival? Bioessays. 22, 873–877
201. Downs, J. A., Kosmidou, E., Morgan, A., and Jackson, S. P. (2003) Suppression of homologous
recombination by the Saccharomyces cerevisiae linker histone. Mol Cell. 11, 1685–1692
202. McArthur, M., and Thomas, J. O. (1996) A preference of histone H1 for methylated DNA. EMBO J. 15,
1705–1714
203. Krylov, D., Leuba, S., van Holde, K., and Zlatanova, J. (1993) Histones H1 and H5 interact preferentially
with crossovers of double-helical DNA. Proc Natl Acad Sci U S A. 90, 5052–5056
204. Schäfer, G., Smith, E. M., and Patterton, H. G. (2005) The Saccharomyces cerevisiae linker histone
Hho1p, with two globular domains, can simultaneously bind to two four-way junction DNA molecules.
Biochemistry. 44, 16766–16775
205. Zlatanova, J., and van Holde, K. (1998) Binding to four-way junction DNA: a common property of
architectural proteins? FASEB J. 12, 421–431
206. Levine, A., Yeivin, A., Ben-Asher, E., Aloni, Y., and Razin, A. (1993) Histone H1-mediated inhibition of
transcription initiation of methylated templates in vitro. J Biol Chem. 268, 21754–21759
BIBLIOGRAPHY
175
207. Ushinsky, S. C., Bussey, H., Ahmed, A. A., Wang, Y., Friesen, J., Williams, B. A., and Storms, R. K. (1997)
Histone H1 in Saccharomyces cerevisiae. Yeast. 13, 151–161
208. Freidkin, I., and Katcoff, D. J. (2001) Specific distribution of the Saccharomyces cerevisiae linker histone
homolog HHO1p in the chromatin. Nucleic Acids Res. 29, 4043–4051
209. Li, C., Mueller, J. E., Elfline, M., and Bryk, M. (2008) Linker histone H1 represses recombination at the
ribosomal DNA locus in the budding yeast Saccharomyces cerevisiae. Mol. Microbiol. 67, 906–19
210. Sinclair, D. A., and Guarente, L. (1997) Extrachromosomal rDNA circles--a cause of aging in yeast. Cell.
91, 1033–1042
211. Escher, D., and Schaffner, W. (1997) Gene activation at a distance and telomeric silencing are not
affected by yeast histone H1. Mol Gen Genet. 256, 456–461
212. Hellauer, K., Sirard, E., and Turcotte, B. (2001) Decreased expression of specific genes in yeast cells
lacking histone H1. J Biol Chem. 276, 13587–13592
213. Schäfer, G., McEvoy, C. R., and Patterton, H. G. (2008) The Saccharomyces cerevisiae linker histone
Hho1p is essential for chromatin compaction in stationary phase and is displaced by transcription. Proc
Natl Acad Sci U S A. 105, 14838–14843
214. Uzunova, K., Georgieva, M., and Miloshev, G. (2013) Saccharomyces cerevisiae linker histone-Hho1p
maintains chromatin loop organization during ageing. Oxid Med Cell Longev. 2013, 437146
215. Glikin, G. C., Ruberti, I., and Worcel, A. (1984) Chromatin assembly in Xenopus oocytes: in vitro studies.
Cell. 37, 33–41
216. Gurard-Levin, Z. A., Quivy, J. P., and Almouzni, G. (2014) Histone chaperones: assisting histone traffic
and nucleosome dynamics. Annu Rev Biochem. 83, 487–517
217. Swygert, S. G., and Peterson, C. L. (2014) Chromatin dynamics: interplay between remodeling enzymes
and histone modifications. Biochim Biophys Acta. 1839, 728–736
218. Freedman, B. S., Miller, K. E., and Heald, R. (2010) Xenopus egg extracts increase dynamics of histone
H1 on sperm chromatin. PLoS One. 10.1371/journal.pone.0013111
219. Shukla, M. S., Syed, S. H., Montel, F., Faivre-Moskalenko, C., Bednar, J., Travers, A., Angelov, D., and
Dimitrov, S. (2010) Remosomes: RSC generated non-mobilized particles with approximately 180 bp
DNA loosely associated with the histone octamer. Proc. Natl. Acad. Sci. U. S. A. 107, 1936–41
220. Eberharter, A., and Becker, P. B. (2004) ATP-dependent nucleosome remodelling: factors and
functions. J Cell Sci. 117, 3707–3711
221. Ganapathi, M., Palumbo, M. J., Ansari, S. A., He, Q., Tsui, K., Nislow, C., and Morse, R. H. (2011)
Extensive role of the general regulatory factors, Abf1 and Rap1, in determining genome-wide
chromatin structure in budding yeast. Nucleic Acids Res. 39, 2032–2044
222. Carrozza, M. J., Li, B., Florens, L., Suganuma, T., Swanson, S. K., Lee, K. K., Shia, W. J., Anderson, S.,
Yates, J., Washburn, M. P., and Workman, J. L. (2005) Histone H3 methylation by Set2 directs
deacetylation of coding regions by Rpd3S to suppress spurious intragenic transcription. Cell. 123, 581–
592
223. Kaplan, C. D., Laprade, L., and Winston, F. (2003) Transcription elongation factors repress transcription
initiation from cryptic sites. Science. 301, 1096–1099
224. Mason, P. B., and Struhl, K. (2003) The FACT complex travels with elongating RNA polymerase II and is
important for the fidelity of transcriptional initiation in vivo. Mol Cell Biol. 23, 8323–8333
225. Dang, W., Sutphin, G. L., Dorsey, J. A., Otte, G. L., Cao, K., Perry, R. M., Wanat, J. J., Saviolaki, D.,
Murakami, C. J., Tsuchiyama, S., Robison, B., Gregory, B. D., Vermeulen, M., Shiekhattar, R., Johnson, F.
B., Kennedy, B. K., Kaeberlein, M., and Berger, S. L. (2014) Inactivation of yeast Isw2 chromatin
remodeling enzyme mimics longevity effect of calorie restriction via induction of genotoxic stress
response. Cell Metab. 19, 952–966
BIBLIOGRAPHY
176
226. Corona, D. F., Siriaco, G., Armstrong, J. A., Snarskaya, N., McClymont, S. A., Scott, M. P., and Tamkun, J.
W. (2007) ISWI regulates higher-order chromatin structure and histone H1 assembly in vivo. PLoS Biol.
5, e232
227. Siriaco, G., Deuring, R., Chioda, M., Becker, P. B., and Tamkun, J. W. (2009) Drosophila ISWI regulates
the association of histone H1 with interphase chromosomes in vivo. Genetics. 182, 661–669
228. Hill, D. A., and Imbalzano, A. N. (2000) Human SWI/SNF nucleosome remodeling activity is partially
inhibited by linker histone H1. Biochemistry. 39, 11649–11656
229. Ramachandran, A., Omar, M., Cheslock, P., and Schnitzler, G. R. (2003) Linker histone H1 modulates
nucleosome remodeling by human SWI/SNF. J Biol Chem. 278, 48590–48601
230. Shimamura, A., Sapp, M., Rodriguez-Campos, A., and Worcel, A. (1989) Histone H1 represses
transcription from minichromosomes assembled in vitro. Mol Cell Biol. 9, 5573–5584
231. Horn, P. J., Carruthers, L. M., Logie, C., Hill, D. A., Solomon, M. J., Wade, P. A., Imbalzano, A. N., Hansen,
J. C., and Peterson, C. L. (2002) Phosphorylation of linker histones regulates ATP-dependent chromatin
remodeling enzymes. Nat Struct Biol. 9, 263–267
232. Clausell, J., Happel, N., Hale, T. K., Doenecke, D., and Beato, M. (2009) Histone H1 subtypes
differentially modulate chromatin condensation without preventing ATP-dependent remodeling by
SWI/SNF or NURF. PLoS One. 4, e0007243
233. Maier, V. K., Chioda, M., Rhodes, D., and Becker, P. B. (2008) ACF catalyses chromatosome movements
in chromatin fibres. EMBO J. 27, 817–826
234. De Koning, L., Corpet, A., Haber, J. E., and Almouzni, G. (2007) Histone chaperones: an escort network
regulating histone traffic. Nat. Struct. Mol. Biol. 14, 997–1007
235. Lorch, Y., Maier-Davis, B., and Kornberg, R. D. (2006) Chromatin remodeling by nucleosome
disassembly in vitro. Proc. Natl. Acad. Sci. U. S. A. 103, 3090–3093
236. D’Arcy, S., Martin, K., Panchenko, T., Chen, X., Bergeron, S., Stargell, L., Black, B., and Luger, K. (2013)
Chaperone Nap1 Shields Histone Surfaces Used in a Nucleosome and Can Put H2A-H2B in an
Unconventional Tetrameric Form. Mol. Cell. 51, 662–677
237. Akey, C. W., and Luger, K. (2003) Histone chaperones and nucleosome assembly. Curr Opin Struct Biol.
13, 6–14
238. Venkatesh, S., and Workman, J. L. (2015) Histone exchange, chromatin structure and the regulation of
transcription. Nat. Rev. Mol. Cell Biol. 16, 178–189
239. Kuryan, B. G., Kim, J., Tran, N. N., Lombardo, S. R., Venkatesh, S., Workman, J. L., and Carey, M. (2012)
Histone density is maintained during transcription mediated by the chromatin remodeler RSC and
histone chaperone NAP1 in vitro. Proc Natl Acad Sci U S A. 109, 1931–1936
240. Yoh, S. M., Cho, H., Pickle, L., Evans, R. M., and Jones, K. A. (2007) The Spt6 SH2 domain binds Ser2-P
RNAPII to direct Iws1-dependent mRNA splicing and export. Genes Dev. 21, 160–174
241. Kulaeva, O. I., Hsieh, F.-K., and Studitsky, V. M. (2010) RNA polymerase complexes cooperate to relieve
the nucleosomal barrier and evict histones. Proc. Natl. Acad. Sci. U. S. A. 107, 11325–11330
242. Ivanovska, I., Jacques, P. E., Rando, O. J., Robert, F., and Winston, F. (2011) Control of chromatin
structure by spt6: different consequences in coding and regulatory regions. Mol Cell Biol. 31, 531–541
243. Bavykin, S., Srebreva, L., Banchev, T., Tsanev, R., Zlatanova, J., and Mirzabekov, A. (1993) Histone H1
deposition and histone-DNA interactions in replicating chromatin. Proc Natl Acad Sci U S A. 90, 3918–
3922
244. McBryant, S. J., Park, Y. J., Abernathy, S. M., Laybourn, P. J., Nyborg, J. K., and Luger, K. (2003)
Preferential binding of the histone (H3-H4)2 tetramer by NAP1 is mediated by the amino-terminal
histone tails. J Biol Chem. 278, 44574–44583
245. Park, Y. J., Chodaparambil, J. V, Bao, Y., McBryant, S. J., and Luger, K. (2005) Nucleosome assembly
protein 1 exchanges histone H2A-H2B dimers and assists nucleosome sliding. J Biol Chem. 280, 1817–
1825
BIBLIOGRAPHY
177
246. Shintomi, K., Iwabuchi, M., Saeki, H., Ura, K., Kishimoto, T., and Ohsumi, K. (2005) Nucleosome
assembly protein-1 is a linker histone chaperone in Xenopus eggs. Proc Natl Acad Sci U S A. 102, 8210–
8215
247. Machida, S., Takaku, M., Ikura, M., Sun, J., Suzuki, H., Kobayashi, W., Kinomura, A., Osakabe, A.,
Tachiwana, H., Horikoshi, Y., Fukuto, A., Matsuda, R., Ura, K., Tashiro, S., Ikura, T., and Kurumizaka, H.
(2014) Nap1 stimulates homologous recombination by RAD51 and RAD54 in higher-ordered chromatin
containing histone H1. Sci Rep. 4, 4863
248. Finn, R. M., Browne, K., Hodgson, K. C., and Ausio, J. (2008) sNASP, a histone H1-specific eukaryotic
chaperone dimer that facilitates chromatin assembly. Biophys J. 95, 1314–1325
249. Wang, H., Walsh, S. T., and Parthun, M. R. (2008) Expanded binding specificity of the human histone
chaperone NASP. Nucleic Acids Res. 36, 5763–5772
250. Richardson, R. T., Alekseev, O. M., Grossman, G., Widgren, E. E., Thresher, R., Wagner, E. J., Sullivan, K.
D., Marzluff, W. F., and O’Rand, M. G. (2006) Nuclear autoantigenic sperm protein (NASP), a linker
histone chaperone that is required for cell proliferation. J Biol Chem. 281, 21526–21534
251. Ramos, I., Prado, A., Finn, R. M., Muga, A., and Ausio, J. (2005) Nucleoplasmin-mediated unfolding of
chromatin involves the displacement of linker-associated chromatin proteins. Biochemistry. 44, 8274–
8281
252. Boulard, M., Bouvet, P., Kundu, T. K., and Dimitrov, S. (2007) Histone variant nucleosomes: structure,
function and implication in disease. Subcell Biochem. 41, 71–89
253. Ahmad, K., and Henikoff, S. (2002) The histone variant H3.3 marks active chromatin by replication-
independent nucleosome assembly. Mol. Cell. 9, 1191–1200
254. Spellman, P. T., Sherlock, G., Zhang, M. Q., Iyer, V. R., Anders, K., Eisen, M. B., Brown, P. O., Botstein,
D., and Futcher, B. (1998) Comprehensive identification of cell cycle-regulated genes of the yeast
Saccharomyces cerevisiae by microarray hybridization. Mol Biol Cell. 9, 3273–3297
255. Lewis, P. W., Elsaesser, S. J., Noh, K.-M., Stadler, S. C., and Allis, C. D. (2010) Daxx is an H3.3-specific
histone chaperone and cooperates with ATRX in replication-independent chromatin assembly at
telomeres. Proc. Natl. Acad. Sci. U. S. A. 107, 14075–14080
256. Weber, C. M., and Henikoff, S. (2014) Histone variants: dynamic punctuation in transcription. Genes
Dev. 28, 672–82
257. Guillemette, B., Bataille, A. R., Gevry, N., Adam, M., Blanchette, M., Robert, F., and Gaudreau, L. (2005)
Variant histone H2A.Z is globally localized to the promoters of inactive yeast genes and regulates
nucleosome positioning. PLoS Biol. 3, e384
258. Zhang, H., Roberts, D. N., and Cairns, B. R. (2005) Genome-wide dynamics of Htz1, a histone H2A
variant that poises repressed/basal promoters for activation through histone loss. Cell. 123, 219–231
259. Santisteban, M. S., Hang, M., and Smith, M. M. (2011) Histone variant H2A.Z and RNA polymerase II
transcription elongation. Mol Cell Biol. 31, 1848–1860
260. Thakar, A., Gupta, P., Ishibashi, T., Finn, R., Silva-Moreno, B., Uchiyama, S., Fukui, K., Tomschik, M.,
Ausio, J., and Zlatanova, J. (2009) H2A.Z and H3.3 histone variants affect nucleosome structure:
biochemical and biophysical studies. Biochemistry. 48, 10852–10857
261. Braunschweig, U., Hogan, G. J., Pagie, L., and van Steensel, B. (2009) Histone H1 binding is inhibited by
histone variant H3.3. EMBO J. 28, 3635–3645
262. Chen, P., Zhao, J., Wang, Y., Wang, M., Long, H., Liang, D., Huang, L., Wen, Z., Li, W., Li, X., Feng, H.,
Zhao, H., Zhu, P., Li, M., Wang, Q. F., and Li, G. (2013) H3.3 actively marks enhancers and primes gene
transcription via opening higher-ordered chromatin. Genes Dev. 27, 2109–2124
263. Khochbin, S. (2001) Histone H1 diversity: bridging regulatory signals to linker histone function. Gene.
271, 1–12
264. Sekeri-Pataryas, K. E., and Sourlingas, T. G. (2007) The differentiation-associated linker histone, H1.0,
during the in vitro aging and senescence of human diploid fibroblasts. Ann N Y Acad Sci. 1100, 361–367
BIBLIOGRAPHY
178
265. Takata, H., Matsunaga, S., Morimoto, A., Ono-Maniwa, R., Uchiyama, S., and Fukui, K. (2007) H1.X with
different properties from other linker histones is required for mitotic progression. FEBS Lett. 581,
3783–3788
266. Carozzi, N., Marashi, F., Plumb, M., Zimmerman, S., Zimmerman, A., Coles, L. S., Wells, J. R., Stein, G.,
and Stein, J. (1984) Clustering of human H1 and core histone genes. Science. 224, 1115–1117
267. Eick, S., Nicolai, M., Mumberg, D., and Doenecke, D. (1989) Human H1 histones: conserved and varied
sequence elements in two H1 subtype genes. Eur J Cell Biol. 49, 110–115
268. Tanaka, M., Hennebold, J. D., Macfarlane, J., and Adashi, E. Y. (2001) A mammalian oocyte-specific
linker histone gene H1oo: homology with the genes for the oocyte-specific cleavage stage histone (cs-
H1) of sea urchin and the B4/H1M histone of the frog. Development. 128, 655–664
269. Hnilica, L. S. (1964) The specificity of histones in chicken erythrocytes. Experientia. 20, 13–14
270. Dimitrov, S., Dasso, M. C., and Wolffe, A. P. (1994) Remodeling sperm chromatin in Xenopus laevis egg
extracts: the role of core histone phosphorylation and linker histone B4 in chromatin assembly. J Cell
Biol. 126, 591–601
271. Sera, T., and Wolffe, A. P. (1998) Role of histone H1 as an architectural determinant of chromatin
structure and as a specific repressor of transcription on Xenopus oocyte 5S rRNA genes. Mol Cell Biol.
18, 3668–3680
272. Harris, M. E., Bohni, R., Schneiderman, M. H., Ramamurthy, L., Schumperli, D., and Marzluff, W. F.
(1991) Regulation of histone mRNA in the unperturbed cell cycle: evidence suggesting control at two
posttranscriptional steps. Mol Cell Biol. 11, 2416–2424
273. Dominski, Z., and Marzluff, W. F. (1999) Formation of the 3’ end of histone mRNA. Gene. 239, 1–14
274. Gurley, L. R., Walters, R. A., and Tobey, R. A. (1972) The metabolism of histone fractions. IV. Synthesis
of histones during the G1-phase of the mammalian life cycle. Arch Biochem Biophys. 148, 633–641
275. Cao, K., Lailler, N., Zhang, Y., Kumar, A., Uppal, K., Liu, Z., Lee, E. K., Wu, H., Medrzycki, M., Pan, C., Ho,
P. Y., Cooper Jr., G. P., Dong, X., Bock, C., Bouhassira, E. E., and Fan, Y. (2013) High-resolution mapping
of h1 linker histone variants in embryonic stem cells. PLoS Genet. 9, e1003417
276. Sarg, B., Helliger, W., Talasz, H., Forg, B., and Lindner, H. H. (2006) Histone H1 phosphorylation occurs
site-specifically during interphase and mitosis: identification of a novel phosphorylation site on histone
H1. J Biol Chem. 281, 6573–6580
277. Parseghian, M. H., Clark, R. F., Hauser, L. J., Dvorkin, N., Harris, D. A., and Hamkalo, B. A. (1993)
Fractionation of human H1 subtypes and characterization of a subtype-specific antibody exhibiting
non-uniform nuclear staining. Chromosom. Res. 1, 127–139
278. Parseghian, M. H., Newcomb, R. L., and Hamkalo, B. A. (2001) Distribution of somatic H1 subtypes is
non-random on active vs. inactive chromatin II: distribution in human adult fibroblasts. J Cell Biochem.
83, 643–659
279. Th’ng, J. P., Sung, R., Ye, M., and Hendzel, M. J. (2005) H1 family histones in the nucleus. Control of
binding and localization by the C-terminal domain. J Biol Chem. 280, 27809–27814
280. Konishi, A., Shimizu, S., Hirota, J., Takao, T., Fan, Y., Matsuoka, Y., Zhang, L., Yoneda, Y., Fujii, Y.,
Skoultchi, A. I., and Tsujimoto, Y. (2003) Involvement of histone H1.2 in apoptosis induced by DNA
double-strand breaks. Cell. 114, 673–688
281. Sancho, M., Diani, E., Beato, M., and Jordan, A. (2008) Depletion of human histone H1 variants
uncovers specific roles in gene expression and cell growth. PLoS Genet. 4, e1000227
282. Canzio, D., Liao, M., Naber, N., Pate, E., Larson, A., Wu, S., Marina, D. B., Garcia, J. F., Madhani, H. D.,
Cooke, R., Schuck, P., Cheng, Y., and Narlikar, G. J. (2013) A conformational switch in HP1 releases
auto-inhibition to drive heterochromatin assembly. Nature. 496, 377–381
283. Jedrusik-Bode, M. (2013) Histone H1 and heterochromatin protein 1 (HP1) regulate specific gene
expression and not global transcription. Worm. 2, e23703

BIBLIOGRAPHY
179
284. Woodcock, C. L., Skoultchi, A. I., and Fan, Y. (2006) Role of linker histone in chromatin structure and
function: H1 stoichiometry and nucleosome repeat length. Chromosom. Res. 14, 17–25
285. Weintraub, H. (1978) The nucleosome repeat length increases during erythropoiesis in the chick.
Nucleic Acids Res. 5, 1179–1188
286. Gunjan, A., Alexander, B. T., Sittman, D. B., and Brown, D. T. (1999) Effects of H1 histone variant
overexpression on chromatin structure. J Biol Chem. 274, 37950–37956
287. Becker, P. B., and Wu, C. (1992) Cell-free system for assembly of transcriptionally repressed chromatin
from Drosophila embryos. Mol. Cell. Biol. 12, 2241–2249
288. Oberg, C., Izzo, A., Schneider, R., Wrange, O., and Belikov, S. (2012) Linker histone subtypes differ in
their effect on nucleosomal spacing in vivo. J Mol Biol. 419, 183–197
289. Lohr, D., Corden, J., Tatchell, K., Kovacic, R. T., and Van Holde, K. E. (1977) Comparative subunit
structure of HeLa, yeast, and chicken erythrocyte chromatin. Proc Natl Acad Sci U S A. 74, 79–83
290. Nelson, R. G., and Fangman, W. L. (1979) Nucleosome organization of the yeast 2-micrometer DNA
plasmid: a eukaryotic minichromosome. Proc Natl Acad Sci U S A. 76, 6515–6519
291. Linder, C., and Thoma, F. (1994) Histone H1 expressed in Saccharomyces cerevisiae binds to chromatin
and affects survival, growth, transcription, and plasmid stability but does not change nucleosomal
spacing. Mol Cell Biol. 14, 2822–2835
292. Puig, S., Matallana, E., and Perez-Ortin, J. E. (1999) Stochastic nucleosome positioning in a yeast
chromatin region is not dependent on histone H1. Curr Microbiol. 39, 168–172
293. Lohr, D., and Hereford, L. (1979) Yeast chromatin is uniformly digested by DNase-I. Proc Natl Acad Sci U
S A. 76, 4285–4288
294. Pearson, E. C., Bates, D. L., Prospero, T. D., and Thomas, J. O. (1984) Neuronal nuclei and glial nuclei
from mammalian cerebral cortex. Nucleosome repeat lengths, DNA contents and H1 contents. Eur J
Biochem. 144, 353–360
295. Bates, D. L., Butler, P. J., Pearson, E. C., and Thomas, J. O. (1981) Stability of the higher-order structure
of chicken-erythrocyte chromatin in solution. Eur J Biochem. 119, 469–476
296. Grigoryev, S. A. (2012) Nucleosome spacing and chromatin higher-order folding. Nucleus. 3, 493–499
297. Ilyin, Y. V, Varshavsky, A. Y., Mickelsaar, U. N., and Georgiev, G. P. (1971) Studies on
deoxyribonucleoprotein structure. Redistribution of proteins in mixtures of deoxyribonucleoproteins,
DNA and RNA. Eur J Biochem. 22, 235–245
298. Lever, M. A., Th’ng, J. P., Sun, X., and Hendzel, M. J. (2000) Rapid exchange of histone H1.1 on
chromatin in living human cells. Nature. 408, 873–876
299. Misteli, T., Gunjan, A., Hock, R., Bustin, M., and Brown, D. T. (2000) Dynamic binding of histone H1 to
chromatin in living cells. Nature. 408, 877–881
300. Chen, D., Dundr, M., Wang, C., Leung, A., Lamond, A., Misteli, T., and Huang, S. (2005) Condensed
mitotic chromatin is accessible to transcription factors and chromatin structural proteins. J Cell Biol.
168, 41–54
301. Kimura, H., and Cook, P. R. (2001) Kinetics of core histones in living human cells: little exchange of H3
and H4 and some rapid exchange of H2B. J Cell Biol. 153, 1341–1353
302. Travers, a a (1994) Chromatin structure and dynamics. (Zlatanova, J., and Leuba, S. H. eds), Elsevier
303. Contreras, A., Hale, T. K., Stenoien, D. L., Rosen, J. M., Mancini, M. A., and Herrera, R. E. (2003) The
dynamic mobility of histone H1 is regulated by cyclin/CDK phosphorylation. Mol Cell Biol. 23, 8626–
8636
304. Catez, F., Brown, D. T., Misteli, T., and Bustin, M. (2002) Competition between histone H1 and HMGN
proteins for chromatin binding sites. EMBO Rep. 3, 760–766
305. Perry, C. A., and Annunziato, A. T. (1991) Histone acetylation reduces H1-mediated nucleosome
interactions during chromatin assembly. Exp Cell Res. 196, 337–345
BIBLIOGRAPHY
180
306. Raghuram, N., Carrero, G., Stasevich, T. J., McNally, J. G., Th’ng, J., and Hendzel, M. J. (2010) Core
histone hyperacetylation impacts cooperative behavior and high-affinity binding of histone H1 to
chromatin. Biochemistry. 49, 4420–4431
307. Waterborg, J. H. (2000) Steady-state levels of histone acetylation in Saccharomyces cerevisiae. J. Biol.
Chem. 275, 13007–11
308. Yang, S. M., Kim, B. J., Norwood Toro, L., and Skoultchi, A. I. (2013) H1 linker histone promotes
epigenetic silencing by regulating both DNA methylation and histone H3 methylation. Proc Natl Acad
Sci U S A. 110, 1708–1713
309. Gunjan, A., Sittman, D. B., and Brown, D. T. (2001) Core histone acetylation is regulated by linker
histone stoichiometry in vivo. J Biol Chem. 276, 3635–3640
310. Herrera, J. E., West, K. L., Schiltz, R. L., Nakatani, Y., and Bustin, M. (2000) Histone H1 is a specific
repressor of core histone acetylation in chromatin. Mol Cell Biol. 20, 523–529
311. McBryant, S. J., and Hansen, J. C. (2012) Dynamic fuzziness during linker histone action. Adv Exp Med
Biol. 725, 15–26
312. Catez, F., Yang, H., Tracey, K. J., Reeves, R., Misteli, T., and Bustin, M. (2004) Network of dynamic
interactions between histone H1 and high-mobility-group proteins in chromatin. Mol Cell Biol. 24,
4321–4328
313. Ghosh, R. P., Horowitz-Scherer, R. A., Nikitina, T., Shlyakhtenko, L. S., and Woodcock, C. L. (2010)
MeCP2 binds cooperatively to its substrate and competes with histone H1 for chromatin binding sites.
Mol Cell Biol. 30, 4656–4670
314. Thomas, J. O., Rees, C., and Finch, J. T. (1992) Cooperative binding of the globular domains of histones
H1 and H5 to DNA. Nucleic Acids Res. 20, 187–194
315. Allfrey, V. G., Faulkner, R., and Mirsky, A. E. (1964) Acetylation and Methylation of Histones and Their
Possible Role in the Regulation of Rna Synthesis. Proc Natl Acad Sci U S A. 51, 786–794
316. Kouzarides, T. (2007) Chromatin modifications and their function. Cell. 128, 693–705
317. Du Preez, L. L., and Patterton, H. G. (2013) Secondary structures of the core histone N-terminal tails:
their role in regulating chromatin structure. Subcell Biochem. 61, 37–55
318. Lee, K. M., and Hayes, J. J. (1997) The N-terminal tail of histone H2A binds to two distinct sites within
the nucleosome core. Proc. Natl. Acad. Sci. U. S. A. 94, 8959–8964
319. Wang, X., Moore, S. C., Laszckzak, M., and Ausió, J. (2000) Acetylation increases the α-helical content
of the histone tails of the nucleosome. J. Biol. Chem. 275, 35013–35020
320. Tropberger, P., and Schneider, R. (2013) Scratching the (lateral) surface of chromatin regulation by
histone modifications. Nat. Struct. Mol. Biol. 20, 657–61
321. Feng, D., Liu, T., Sun, Z., Bugge, A., Mullican, S. E., Alenghat, T., Liu, X. S., and Lazar, M. a. (2011) A
circadian rhythm orchestrated by histone deacetylase 3 controls hepatic lipid metabolism. Science.
331, 1315–1319
322. Hebbes, T. R., Clayton, A. L., Thorne, A. W., and Crane-Robinson, C. (1994) Core histone
hyperacetylation co-maps with generalized DNase I sensitivity in the chicken beta-globin chromosomal
domain. EMBO J. 13, 1823–1830
323. LeRoy, G., Rickards, B., and Flint, S. J. (2008) The double bromodomain proteins Brd2 and Brd3 couple
histone acetylation to transcription. Mol Cell. 30, 51–60
324. Perry, C. A., and Annunziato, A. T. (1989) Influence of histone acetylation on the solubility, H1 content
and DNase I sensitivity of newly assembled chromatin. Nucleic Acids Res. 17, 4275–4291
325. Struhl, K. (1998) Histone acetylation and transcriptional regulatory mechanisms. Genes Dev. 12, 599–
606
326. Ng, S. S., Yue, W. W., Oppermann, U., and Klose, R. J. (2009) Dynamic protein methylation in chromatin
biology. Cell Mol Life Sci. 66, 407–422
BIBLIOGRAPHY
181
327. Rice, J. C., Briggs, S. D., Ueberheide, B., Barber, C. M., Shabanowitz, J., Hunt, D. F., Shinkai, Y., and Allis,
C. D. (2003) Histone methyltransferases direct different degrees of methylation to define distinct
chromatin domains. Mol Cell. 12, 1591–1598
328. Allis, C. D., Berger, S. L., Cote, J., Dent, S., Jenuwien, T., Kouzarides, T., Pillus, L., Reinberg, D., Shi, Y.,
Shiekhattar, R., Shilatifard, A., Workman, J., and Zhang, Y. (2007) New nomenclature for chromatin-
modifying enzymes. Cell. 131, 633–636
329. Wisniewski, J. R., Zougman, A., Kruger, S., and Mann, M. (2007) Mass spectrometric mapping of linker
histone H1 variants reveals multiple acetylations, methylations, and phosphorylation as well as
differences between cell culture and tissue. Mol Cell Proteomics. 6, 72–87
330. Thiriet, C., and Hayes, J. J. (2009) Linker histone phosphorylation regulates global timing of replication
origin firing. J. Biol. Chem. 284, 2823–9
331. Raghuram, N., Strickfaden, H., McDonald, D., Williams, K., Fang, H., Mizzen, C., Hayes, J. J., Th’ng, J.,
and Hendzel, M. J. (2013) Pin1 promotes histone H1 dephosphorylation and stabilizes its binding to
chromatin. J Cell Biol. 203, 57–71
332. Bouchoux, C., and Uhlmann, F. (2011) A quantitative model for ordered Cdk substrate
dephosphorylation during mitotic exit. Cell. 147, 803–814
333. Chadee, D. N., Taylor, W. R., Hurta, R. A., Allis, C. D., Wright, J. A., and Davie, J. R. (1995) Increased
phosphorylation of histone H1 in mouse fibroblasts transformed with oncogenes or constitutively
active mitogen-activated protein kinase kinase. J Biol Chem. 270, 20098–20105
334. Matsumoto, Y., Yasuda, H., Mita, S., Marunouchi, T., and Yamada, M. (1980) Evidence for the
involvement of H1 histone phosphorylation in chromosome condensation. Nature. 284, 181–183
335. Gautier, J., Matsukawa, T., Nurse, P., and Maller, J. (1989) Dephosphorylation and activation of
Xenopus p34cdc2 protein kinase during the cell cycle. Nature. 339, 626–629
336. Roth, S. Y., and Allis, C. D. (1992) Chromatin condensation: does histone H1 dephosphorylation play a
role? Trends Biochem Sci. 17, 93–98
337. Thiriet, C., and Hayes, J. J. (2009) Linker histone phosphorylation regulates global timing of replication
origin firing. J Biol Chem. 284, 2823–2829
338. Dou, Y., Mizzen, C. A., Abrams, M., Allis, C. D., and Gorovsky, M. A. (1999) Phosphorylation of linker
histone H1 regulates gene expression in vivo by mimicking H1 removal. Mol Cell. 4, 641–647
339. Lu, M. J., Dadd, C. A., Mizzen, C. A., Perry, C. A., McLachlan, D. R., Annunziato, A. T., and Allis, C. D.
(1994) Generation and characterization of novel antibodies highly selective for phosphorylated linker
histone H1 in Tetrahymena and HeLa cells. Chromosoma. 103, 111–121
340. Dou, Y., Bowen, J., Liu, Y., and Gorovsky, M. A. (2002) Phosphorylation and an ATP-dependent process
increase the dynamic exchange of H1 in chromatin. J Cell Biol. 158, 1161–1170
341. Roque, A., Ponte, I., Arrondo, J. L., and Suau, P. (2008) Phosphorylation of the carboxy-terminal domain
of histone H1: effects on secondary structure and DNA condensation. Nucleic Acids Res. 36, 4719–4726
342. Nurse, P. (1990) Universal control mechanism regulating onset of M-phase. Nature. 344, 503–508
343. Loog, M., and Morgan, D. O. (2005) Cyclin specificity in the phosphorylation of cyclin-dependent kinase
substrates. Nature. 434, 104–108
344. Paulson, J. R., Patzlaff, J. S., and Vallis, A. J. (1996) Evidence that the endogenous histone H1
phosphatase in HeLa mitotic chromosomes is protein phosphatase 1, not protein phosphatase 2A. J
Cell Sci. 109, 1437–1447
345. Paulson, J. R., and Taylor, S. S. (1982) Phosphorylation of histones 1 and 3 and nonhistone high
mobility group 14 by an endogenous kinase in HeLa metaphase chromosomes. J Biol Chem. 257, 6064–
6072
346. Gurley, L. R., D’Anna, J. A., Barham, S. S., Deaven, L. L., and Tobey, R. A. (1978) Histone
phosphorylation and chromatin structure during mitosis in Chinese hamster cells. Eur J Biochem. 84, 1–
15
BIBLIOGRAPHY
182
347. Hale, T. K., Contreras, A., Morrison, A. J., and Herrera, R. E. (2006) Phosphorylation of the linker histone
H1 by CDK regulates its binding to HP1alpha. Mol Cell. 22, 693–699
348. Zheng, Y., John, S., Pesavento, J. J., Schultz-Norton, J. R., Schiltz, R. L., Baek, S., Nardulli, A. M., Hager, G.
L., Kelleher, N. L., and Mizzen, C. a (2010) Histone H1 phosphorylation is associated with transcription
by RNA polymerases I and II. J. Cell Biol. 189, 407–15
349. Ajiro, K., Borun, T. W., and Cohen, L. H. (1981) Phosphorylation states of different histone 1 subtypes
and their relationship to chromatin functions during the HeLa S-3 cell cycle. Biochemistry. 20, 1445–
1454
350. Kaygun, H., and Marzluff, W. F. (2005) Translation termination is involved in histone mRNA
degradation when DNA replication is inhibited. Mol Cell Biol. 25, 6879–6888
351. Halmer, L., and Gruss, C. (1995) Influence of histone H1 on the in vitro replication of DNA and
chromatin. Nucleic Acids Res. 23, 773–778
352. Yasuda, H., Matsumoto, Y., Mita, S., Marunouchi, T., and Yamada, M. (1981) A mouse temperature-
sensitive mutant defective in H1 histone phosphorylation is defective in deoxyribonucleic acid
synthesis and chromosome condensation. Biochemistry. 20, 4414–4419
353. Green, G. R., and Poccia, D. L. (1985) Phosphorylation of sea urchin sperm H1 and H2B histones
precedes chromatin decondensation and H1 exchange during pronuclear formation. Dev Biol. 108,
235–245
354. Lin, R., Cook, R. G., and Allis, C. D. (1991) Proteolytic removal of core histone amino termini and
dephosphorylation of histone H1 correlate with the formation of condensed chromatin and
transcriptional silencing during Tetrahymena macronuclear development. Genes Dev. 5, 1601–1610
355. Wagner, T. E., Hartford, J. B., Serra, M., Vandegrift, V., and Sung, M. T. (1977) Phosphorylation and
dephosphorylation of histone (V/H5): controlled condensation of avian erythrocyte chromatin.
Appendix: Phosphorylation and dephosphorylation of histone H5. II. Circular dichroic studies.
Biochemistry. 16, 286–290
356. Ajiro, K., Nishimoto, T., and Takahashi, T. (1983) Histone H1 and H3 phosphorylation during premature
chromosome condensation in a temperature-sensitive mutant (tsBN2) of baby hamster kidney cells. J
Biol Chem. 258, 4534–4538
357. Roberge, M., Th’ng, J., Hamaguchi, J., and Bradbury, E. M. (1990) The topoisomerase II inhibitor VM-26
induces marked changes in histone H1 kinase activity, histones H1 and H3 phosphorylation, and
chromosome condensation in G2 phase and mitotic BHK cells. J Cell Biol. 111, 1753–1762
358. Th’ng, J. P., Guo, X. W., Swank, R. A., Crissman, H. A., and Bradbury, E. M. (1994) Inhibition of histone
phosphorylation by staurosporine leads to chromosome decondensation. J Biol Chem. 269, 9568–9573
359. Roberge, M., Tudan, C., Hung, S. M., Harder, K. W., Jirik, F. R., and Anderson, H. (1994) Antitumor drug
fostriecin inhibits the mitotic entry checkpoint and protein phosphatases 1 and 2A. Cancer Res. 54,
6115–6121
360. Tosuji, H., Mabuchi, I., Fusetani, N., and Nakazawa, T. (1992) Calyculin A induces contractile ring-like
apparatus formation and condensation of chromosomes in unfertilized sea urchin eggs. Proc Natl Acad
Sci U S A. 89, 10613–10617
361. Yamashita, K., Yasuda, H., Pines, J., Yasumoto, K., Nishitani, H., Ohtsubo, M., Hunter, T., Sugimura, T.,
and Nishimoto, T. (1990) Okadaic acid, a potent inhibitor of type 1 and type 2A protein phosphatases,
activates cdc2/H1 kinase and transiently induces a premature mitosis-like state in BHK21 cells. EMBO J.
9, 4331–4338
362. Guo, X. W., Th’ng, J. P., Swank, R. A., Anderson, H. J., Tudan, C., Bradbury, E. M., and Roberge, M.
(1995) Chromosome condensation induced by fostriecin does not require p34cdc2 kinase activity and
histone H1 hyperphosphorylation, but is associated with enhanced histone H2A and H3
phosphorylation. EMBO J. 14, 976–985

BIBLIOGRAPHY
183
363. Freitas, M. A., Sklenar, A. R., and Parthun, M. R. (2004) Application of mass spectrometry to the
identification and quantification of histone post-translational modifications. J Cell Biochem. 92, 691–
700
364. Kamieniarz, K., Izzo, A., Dundr, M., Tropberger, P., Ozretic, L., Kirfel, J., Scheer, E., Tropel, P.,
Wisniewski, J. R., Tora, L., Viville, S., Buettner, R., and Schneider, R. (2012) A dual role of linker histone
H1.4 Lys 34 acetylation in transcriptional activation. Genes Dev. 26, 797–802
365. Kuzmichev, A., Jenuwein, T., Tempst, P., and Reinberg, D. (2004) Different EZH2-containing complexes
target methylation of histone H1 or nucleosomal histone H3. Mol Cell. 14, 183–193
366. Groves, J. A., Lee, A., Yildirir, G., and Zachara, N. E. (2013) Dynamic O-GlcNAcylation and its roles in the
cellular stress response and homeostasis. Cell Stress Chaperones. 18, 535–558
367. Zachara, N. E., and Hart, G. W. (2002) The emerging significance of O-GlcNAc in cellular regulation.
Chem Rev. 102, 431–438
368. Berger, S. L. (2007) The complex language of chromatin regulation during transcription. Nature. 447,
407–412
369. Jenuwein, T., and Allis, C. D. (2001) Translating the histone code. Sci. 293, 1074–80
370. Zhong, X. Y., Wang, P., Han, J., Rosenfeld, M. G., and Fu, X. D. (2009) SR proteins in vertical integration
of gene expression from transcription to RNA processing to translation. Mol Cell. 35, 1–10
371. Govin, J., Dorsey, J., Gaucher, J., Rousseaux, S., Khochbin, S., and Berger, S. L. (2010) Systematic screen
reveals new functional dynamics of histones H3 and H4 during gametogenesis. Genes Dev. 24, 1772–
1786
372. Zippo, A., Serafini, R., Rocchigiani, M., Pennacchini, S., Krepelova, A., and Oliviero, S. (2009) Histone
crosstalk between H3S10ph and H4K16ac generates a histone code that mediates transcription
elongation. Cell. 138, 1122–1136
373. Duan, Q., Chen, H., Costa, M., and Dai, W. (2008) Phosphorylation of H3S10 blocks the access of H3K9
by specific antibodies and histone methyltransferase. Implication in regulating chromatin dynamics
and epigenetic inheritance during mitosis. J Biol Chem. 283, 33585–33590
374. Fischle, W., Tseng, B. S., Dormann, H. L., Ueberheide, B. M., Garcia, B. A., Shabanowitz, J., Hunt, D. F.,
Funabiki, H., and Allis, C. D. (2005) Regulation of HP1-chromatin binding by histone H3 methylation and
phosphorylation. Nature. 438, 1116–1122
375. Nelson, C. J., Santos-Rosa, H., and Kouzarides, T. (2006) Proline isomerization of histone H3 regulates
lysine methylation and gene expression. Cell. 126, 905–916
376. Morrison, A. J., Highland, J., Krogan, N. J., Arbel-Eden, A., Greenblatt, J. F., Haber, J. E., and Shen, X.
(2004) INO80 and gamma-H2AX interaction links ATP-dependent chromatin remodeling to DNA
damage repair. Cell. 119, 767–775
377. Daujat, S., Zeissler, U., Waldmann, T., Happel, N., and Schneider, R. (2005) HP1 binds specifically to
Lys26-methylated histone H1.4, whereas simultaneous Ser27 phosphorylation blocks HP1 binding. J
Biol Chem. 280, 38090–38095
378. Hergeth, S. P., Dundr, M., Tropberger, P., Zee, B. M., Garcia, B. A., Daujat, S., and Schneider, R. (2011)
Isoform-specific phosphorylation of human linker histone H1.4 in mitosis by the kinase Aurora B. J Cell
Sci. 124, 1623–1628
379. Pyne, A., Thompson, R., Leung, C., Roy, D., and Hoogenboom, B. W. (2014) Single-molecule
reconstruction of oligonucleotide secondary structure by atomic force microscopy. Small. 10, 3257–
3261
380. Deal, R. B., and Henikoff, S. (2010) Capturing the dynamic epigenome. Genome Biol. 11, 218
381. Clark, D. J. (2010) Nucleosome positioning, nucleosome spacing and the nucleosome code. J Biomol
Struct Dyn. 27, 781–793
BIBLIOGRAPHY
184
382. Chen, Z. A., Jawhari, A., Fischer, L., Buchen, C., Tahir, S., Kamenski, T., Rasmussen, M., Lariviere, L.,
Bukowski-Wills, J. C., Nilges, M., Cramer, P., and Rappsilber, J. (2010) Architecture of the RNA
polymerase II-TFIIF complex revealed by cross-linking and mass spectrometry. EMBO J. 29, 717–726
383. Creasy, D. M., and Cottrell, J. S. (2002) Error tolerant searching of uninterpreted tandem mass
spectrometry data. Proteomics. 2, 1426–1434
384. Elias, J. E., and Gygi, S. P. (2007) Target-decoy search strategy for increased confidence in large-scale
protein identifications by mass spectrometry. Nat Methods. 4, 207–214
385. Williamson, B. L., Marchese, J., and Morrice, N. a (2006) Automated identification and quantification of
protein phosphorylation sites by LC/MS on a hybrid triple quadrupole linear ion trap mass
spectrometer. Mol. Cell. Proteomics. 5, 337–46
386. Li, C., Dong, X., Fan, H., Wang, C., Ding, G., and Li, Y. (2014) The 3DGD: a database of genome 3D
structure. Bioinformatics. 30, 1640–1642
387. Duan, Z., Andronescu, M., Schutz, K., McIlwain, S., Kim, Y. J., Lee, C., Shendure, J., Fields, S., Blau, C. A.,
and Noble, W. S. (2010) A three-dimensional model of the yeast genome. Nature. 465, 363–367
388. Bolzer, A., Kreth, G., Solovei, I., Koehler, D., Saracoglu, K., Fauth, C., Muller, S., Eils, R., Cremer, C.,
Speicher, M. R., and Cremer, T. (2005) Three-dimensional maps of all chromosomes in human male
fibroblast nuclei and prometaphase rosettes. PLoS Biol. 3, e157
389. Buckley, M. S., and Lis, J. T. (2014) Imaging RNA Polymerase II transcription sites in living cells. Curr
Opin Genet Dev. 25, 126–130
390. Rousseau, M., Ferraiuolo, M. A., Crutchley, J. L., Wang, X. Q., Miura, H., Blanchette, M., and Dostie, J.
(2014) Classifying leukemia types with chromatin conformation data. Genome Biol. 15, R60
391. Capell, B. C., and Berger, S. L. (2013) Genome-wide epigenetics. J Invest Dermatol. 133, e9
392. Shen, S., Qu, Y., and Zhang, J. (2014) [The application of next generation sequencing on epigenetic
study]. Yi Chuan. 36, 256–275
393. Chong, Y. T., Koh, J. L. Y., Friesen, H., Duffy, K., Cox, M. J., Moses, A., Moffat, J., Boone, C., and
Andrews, B. J. (2015) Yeast Proteome Dynamics from Single Cell Imaging and Automated Analysis. Cell.
161, 1413–1424
394. Noble, D. (2012) Why integration? Integr. Med. Res. 1, 2–4
395. Huang, J. Y., Huang, C. W., Kao, K. C., and Lai, P. Y. (2013) Robustness and adaptation reveal plausible
cell cycle controlling subnetwork in Saccharomyces cerevisiae. Gene. 518, 35–41
396. Kaltashov, I. A., Bobst, C. E., and Abzalimov, R. R. (2009) H/D exchange and mass spectrometry in the
studies of protein conformation and dynamics: is there a need for a top-down approach? Anal Chem.
81, 7892–7899
397. Dunham, W. H., Larsen, B., Tate, S., Badillo, B. G., Goudreault, M., Tehami, Y., Kislinger, T., and Gingras,
A. C. (2011) A cost-benefit analysis of multidimensional fractionation of affinity purification-mass
spectrometry samples. Proteomics. 11, 2603–2612
398. Demers, A. G., and Wong, S. S. (1985) Increased stability of galactosyltransferase on immobilization. J
Appl Biochem. 7, 122–125
399. Hermanson, G. T., Mallia, A. K., and Smith, P. K. (1992) Immobilized Affinity Ligand Techniques,
Academic Press
400. Moser, A. C., and Hage, D. S. (2010) Immunoaffinity chromatography: an introduction to applications
and recent developments. Bioanalysis. 2, 769–790
401. Brizzard, B. (2008) Epitope tagging. Biotechniques. 44, 693–695
402. Lal, A., Haynes, S. R., and Gorospe, M. (2005) Clean Western blot signals from immunoprecipitated
samples. Mol Cell Probes. 19, 385–388
403. Wykoff, D. D., and O’Shea, E. K. (2005) Identification of sumoylated proteins by systematic
immunoprecipitation of the budding yeast proteome. Mol Cell Proteomics. 4, 73–83
BIBLIOGRAPHY
185
404. Huang, J., Brito, I. L., Villen, J., Gygi, S. P., Amon, A., and Moazed, D. (2006) Inhibition of homologous
recombination by a cohesin-associated clamp complex recruited to the rDNA recombination enhancer.
Genes Dev. 20, 2887–2901
405. Johzuka, K., Terasawa, M., Ogawa, H., Ogawa, T., and Horiuchi, T. (2006) Condensin loaded onto the
replication fork barrier site in the rRNA gene repeats during S phase in a FOB1-dependent fashion to
prevent contraction of a long repetitive array in Saccharomyces cerevisiae. Mol Cell Biol. 26, 2226–
2236
406. Lee, H., Habas, R., and Abate-Shen, C. (2004) MSX1 cooperates with histone H1b for inhibition of
transcription and myogenesis. Science. 304, 1675–1678
407. Maiolica, A., Cittaro, D., Borsotti, D., Sennels, L., Ciferri, C., Tarricone, C., Musacchio, A., and
Rappsilber, J. (2007) Structural analysis of multiprotein complexes by cross-linking, mass spectrometry,
and database searching. Mol Cell Proteomics. 6, 2200–2211
408. Mayne, S. L., and Patterton, H. G. (2011) Bioinformatics tools for the structural elucidation of multi-
subunit protein complexes by mass spectrometric analysis of protein-protein cross-links. Br. Bioinform.
12, 660–671
409. Strahl, B. D., Briggs, S. D., Brame, C. J., Caldwell, J. A., Koh, S. S., Ma, H., Cook, R. G., Shabanowitz, J.,
Hunt, D. F., Stallcup, M. R., and Allis, C. D. (2001) Methylation of histone H4 at arginine 3 occurs in vivo
and is mediated by the nuclear receptor coactivator PRMT1. Curr Biol. 11, 996–1000
410. Zhang, K., Williams, K. E., Huang, L., Yau, P., Siino, J. S., Bradbury, E. M., Jones, P. R., Minch, M. J., and
Burlingame, A. L. (2002) Histone acetylation and deacetylation: identification of acetylation and
methylation sites of HeLa histone H4 by mass spectrometry. Mol Cell Proteomics. 1, 500–508
411. Zhang, K., Tang, H., Huang, L., Blankenship, J. W., Jones, P. R., Xiang, F., Yau, P. M., and Burlingame, A.
L. (2002) Identification of acetylation and methylation sites of histone H3 from chicken erythrocytes by
high-accuracy matrix-assisted laser desorption ionization-time-of-flight, matrix-assisted laser
desorption ionization-postsource decay, and nanoelectrospray ion. Anal Biochem. 306, 259–269
412. Kim, M. S., Pinto, S. M., Getnet, D., Nirujogi, R. S., Manda, S. S., Chaerkady, R., Madugundu, A. K.,
Kelkar, D. S., Isserlin, R., Jain, S., Thomas, J. K., Muthusamy, B., Leal-Rojas, P., Kumar, P.,
Sahasrabuddhe, N. A., Balakrishnan, L., Advani, J., George, B., Renuse, S., Selvan, L. D., Patil, A. H.,
Nanjappa, V., Radhakrishnan, A., Prasad, S., Subbannayya, T., Raju, R., Kumar, M., Sreenivasamurthy, S.
K., Marimuthu, A., Sathe, G. J., Chavan, S., Datta, K. K., Subbannayya, Y., Sahu, A., Yelamanchi, S. D.,
Jayaram, S., Rajagopalan, P., Sharma, J., Murthy, K. R., Syed, N., Goel, R., Khan, A. A., Ahmad, S., Dey,
G., Mudgal, K., Chatterjee, A., Huang, T. C., Zhong, J., Wu, X., Shaw, P. G., Freed, D., Zahari, M. S.,
Mukherjee, K. K., Shankar, S., Mahadevan, A., Lam, H., Mitchell, C. J., Shankar, S. K., Satishchandra, P.,
Schroeder, J. T., Sirdeshmukh, R., Maitra, A., Leach, S. D., Drake, C. G., Halushka, M. K., Prasad, T. S.,
Hruban, R. H., Kerr, C. L., Bader, G. D., Iacobuzio-Donahue, C. A., Gowda, H., and Pandey, A. (2014) A
draft map of the human proteome. Nature. 509, 575–581
413. Picotti, P., Bodenmiller, B., Mueller, L. N., Domon, B., and Aebersold, R. (2009) Full dynamic range
proteome analysis of S. cerevisiae by targeted proteomics. Cell. 138, 795–806
414. Wilhelm, M., Schlegl, J., Hahne, H., Moghaddas Gholami, A., Lieberenz, M., Savitski, M. M., Ziegler, E.,
Butzmann, L., Gessulat, S., Marx, H., Mathieson, T., Lemeer, S., Schnatbaum, K., Reimer, U., Wenschuh,
H., Mollenhauer, M., Slotta-Huspenina, J., Boese, J. H., Bantscheff, M., Gerstmair, A., Faerber, F., and
Kuster, B. (2014) Mass-spectrometry-based draft of the human proteome. Nature. 509, 582–587
415. Boersema, P. J., Mohammed, S., and Heck, A. J. (2009) Phosphopeptide fragmentation and analysis by
mass spectrometry. J Mass Spectrom. 44, 861–878
416. Savitski, M. M., Lemeer, S., Boesche, M., Lang, M., Mathieson, T., Bantscheff, M., and Kuster, B. (2011)
Confident phosphorylation site localization using the Mascot Delta Score. Mol Cell Proteomics. 10,
M110 003830

BIBLIOGRAPHY
186
417. Banks, G. C., Deterding, L. J., Tomer, K. B., and Archer, T. K. (2001) Hormone-mediated
dephosphorylation of specific histone H1 isoforms. J Biol Chem. 276, 36467–36473
418. Garcia, B. A., Joshi, S., Thomas, C. E., Chitta, R. K., Diaz, R. L., Busby, S. A., Andrews, P. C., Ogorzalek
Loo, R. R., Shabanowitz, J., Kelleher, N. L., Mizzen, C. A., Allis, C. D., and Hunt, D. F. (2006)
Comprehensive phosphoprotein analysis of linker histone H1 from Tetrahymena thermophila. Mol Cell
Proteomics. 5, 1593–1609
419. Sommer (1978) Yeast chromatin: search for histone H1. Mol Gen Genet. 161, 323–331
420. Albig, W., Runge, D. M., Kratzmeier, M., and Doenecke, D. (1998) Heterologous expression of human
H1 histones in yeast. FEBS Lett. 435, 245–250
421. Pastink, A., Berkhout, T. A., Mager, W. H., and Planta, R. J. (1979) Analysis of histones from the yeast
Saccharomyces carlsbergensis. Biochem J. 177, 917–923
422. Suchiliene, S. P., and Gineitis, A. A. (1978) Histones from Saccharomyces cerevisiae. Exp Cell Res. 114,
454–458
423. Gottesfeld, J. M. (1977) Methods for fractionation of chromatin into transcriptionally active and
inactive segments. Methods Cell Biol. 16, 421–436
424. Weber, S., and Isenberg, I. (1980) High mobility group proteins of Saccharomyces cerevisiae.
Biochemistry. 19, 2236–2240
425. Srebreva, L., Zlatanova, J., Miloshev, G., and Tsanev, R. (1987) Immunological evidence for the
existence of H1-like histone in yeast. Eur J Biochem. 165, 449–454
426. Patterton, H. G., Landel, C. C., Landsman, D., Peterson, C. L., and Simpson, R. T. (1998) The biochemical
and phenotypic characterization of Hho1p, the putative linker histone H1 of Saccharomyces cerevisiae.
J. Biol. Chem. 273, 7268–76
427. Schäfer, G., McEvoy, C. R. E., and Patterton, H.-G. (2008) The Saccharomyces cerevisiae linker histone
Hho1p is essential for chromatin compaction in stationary phase and is displaced by transcription.
Proc. Natl. Acad. Sci. U. S. A. 105, 14838–43
428. Bussey, H., Storms, R. K., Ahmed, A., Albermann, K., Allen, E., Ansorge, W., Araujo, R., Aparicio, A.,
Barrell, B., Badcock, K., Benes, V., Botstein, D., Bowman, S., Bruckner, M., Carpenter, J., Cherry, J. M.,
Chung, E., Churcher, C., Coster, F., Davis, K., Davis, R. W., Dietrich, F. S., Delius, H., DiPaolo, T., Hani, J.,
and et al. (1997) The nucleotide sequence of Saccharomyces cerevisiae chromosome XVI. Nature. 387,
103–105
429. Labuschagne, M., and Albertyn, J. (2007) Cloning of an epoxide hydrolase-encoding gene from
Rhodotorula mucilaginosa and functional expression in Yarrowia lipolytica. Yeast. 24, 69–78
430. Green, M. R., and Sambrook, J. (2012) Molecular cloning : a laboratory manual. 1, Cold Spring Harbor
Laboratory Press
431. Patterton, H. G., and Graves, S. (2000) DNAssist: the integrated editing and analysis of molecular
biology sequences in windows. Bioinformatics. 16, 652–653
432. Inoue, H., Nojima, H., and Okayama, H. (1990) High efficiency transformation of Escherichia coli with
plasmids. Gene. 96, 23–28
433. Bradford, M. M. (1976) A rapid and sensitive method for the quantitation of microgram quantities of
protein utilizing the principle of protein-dye binding. Anal Biochem. 72, 248–254
434. Gill, S. C., and von Hippel, P. H. (1989) Calculation of protein extinction coefficients from amino acid
sequence data. Anal Biochem. 182, 319–326
435. Pace, C. N., Vajdos, F., Fee, L., Grimsley, G., and Gray, T. (1995) How to measure and predict the molar
absorption coefficient of a protein. Protein Sci. 4, 2411–2423
436. Camerini-Otero, R. D., Sollner-Webb, B., and Felsenfeld, G. (1976) The organization of histones and
DNA in chromatin: evidence for an arginine-rich histone kernel. Cell. 8, 333–347
437. Wells, D., and Brown, D. (1991) Histone and histone gene compilation and alignment update. Nucleic
Acids Res. 19 Suppl, 2173–2188
BIBLIOGRAPHY
187
438. Laemmli, U. K. (1970) Cleavage of structural proteins during the assembly of the head of bacteriophage
T4. Nature. 227, 680–685
439. Lill, J. R., and Nesatyy, V. J. (2012) Microwave-assisted protein staining, destaining, and in-gel/in-
solution digestion of proteins. Methods Mol Biol. 869, 521–532
440. Zhao, L., Liu, C., Sun, Y., and Ban, L. (2012) A rapid and simplified method for protein silver staining in
polyacrylamide gels. Electrophoresis. 33, 2143–2144
441. Shevchenko, A., Tomas, H., Havlis, J., Olsen, J. V, and Mann, M. (2006) In-gel digestion for mass
spectrometric characterization of proteins and proteomes. Nat. Protoc. 1, 2856–60
442. Dai, Y., Whittal, R. M., and Li, L. (1999) Two-layer sample preparation: a method for MALDI-MS analysis
of complex peptide and protein mixtures. Anal Chem. 71, 1087–1091
443. Miloshev, G., Venkov, P., van Holde, K., and Zlatanova, J. (1994) Low levels of exogenous histone H1 in
yeast cause cell death. Proc Natl Acad Sci U S A. 91, 11567–11570
444. Gsponer, J., and Babu, M. M. (2012) Cellular strategies for regulating functional and nonfunctional
protein aggregation. Cell Rep. 2, 1425–1437
445. Mierendorf, R. C., Morris, B. B., Hammer, B., and Novy, R. E. (1998) Expression and Purification of
Recombinant Proteins Using the pET System. Methods Mol Med. 13, 257–292
446. Ali, T., and Thomas, J. O. (2004) Distinct properties of the two putative “globular domains” of the yeast
linker histone, Hho1p. J Mol Biol. 337, 1123–1135
447. Kushnirov, V. V (2000) Rapid and reliable protein extraction from yeast. Yeast. 16, 857–860
448. Adali, T., Bentaleb, A., Elmarzugi, N., and Hamza, A. M. (2013) PEG-calf thymus DNA interactions:
conformational, morphological and spectroscopic thermal studies. Int J Biol Macromol. 61, 373–378
449. Harshman, S. W., Chen, M. M., Branson, O. E., Jacob, N. K., Johnson, A. J., Byrd, J. C., and Freitas, M. A.
(2013) Isolation and analysis of linker histones across cellular compartments. J Proteomics. 91, 595–
604
450. Telu, K. H., Abbaoui, B., Thomas-Ahner, J. M., Zynger, D. L., Clinton, S. K., Freitas, M. A., and Mortazavi,
A. (2013) Alterations of histone H1 phosphorylation during bladder carcinogenesis. J Proteome Res. 12,
3317–3326
451. Zougman, A., and Wisniewski, J. R. (2006) Beyond linker histones and high mobility group proteins:
global profiling of perchloric acid soluble proteins. J Proteome Res. 5, 925–934
452. Shortle, D., and Ackerman, M. S. (2001) Persistence of native-like topology in a denatured protein in 8
M urea. Science. 293, 487–489
453. Tsai, C. D., Ma, B., Kumar, S., Wolfson, H., and Nussinov, R. (2001) Protein folding: binding of
conformationally fluctuating building blocks via population selection. Crit Rev Biochem Mol Biol. 36,
399–433
454. Downs, J. a, Kosmidou, E., Morgan, A., and Jackson, S. P. (2003) Suppression of homologous
recombination by the Saccharomyces cerevisiae linker histone. Mol. Cell. 11, 1685–92
455. Salvati, D., Conforti, S., Conte, M., Matassa, D. S., Fucci, L., and Piscopo, M. (2008) Self-association of
Chaetopterus variopedatus sperm histone H1-like. Relevance of arginine content and possible
physiological role. Acta Biochim Pol. 55, 701–706
456. Maman, J. D., Yager, T. D., and Allan, J. (1994) Self-association of the globular domain of histone H5.
Biochemistry. 33, 1300–1310
457. Carter, G. J., and van Holde, K. (1998) Self-association of linker histone H5 and of its globular domain:
evidence for specific self-contacts. Biochemistry. 37, 12477–12488
458. Piscopo, M., De Petrocellis, L., Conte, M., Pulcrano, G., and Geraci, G. (2006) On the possibility that H1
histone interaction with DNA occurs through phosphates connecting lysine and arginine side chain
groups. Acta Biochim Pol. 53, 507–513
459. Bradbury, A., and Pluckthun, A. (2015) Reproducibility: Standardize antibodies used in research.
Nature. 518, 27–29

BIBLIOGRAPHY
188
460. Burry, R. W. (2010) Antibodies. in Immunocytochemistry, pp. 7–16, Springer-Verlag , New York,
10.1007/978-1-4419-1304-3
461. Andrew, S. M., and Titus, J. A. (2001) Purification of Immunoglobulin G. in Current Protocols in Cell
Biology, John Wiley & Sons, Inc., 10.1002/0471143030.cb1603s05
462. Hu, Y. X., Guo, J. Y., Shen, L., Chen, Y., Zhang, Z. C., and Zhang, Y. L. (2002) Get effective polyclonal
antisera in one month. Cell Res. 12, 157–160
463. Harlow, E., and Lane, D. (1998) Using antibodies : a laboratory manual, Cold Spring Harbor Laboratory
(NY), United States
464. Kennedy, J. F., and Barnes, J. A. (1980) Assessment of the use of cyanogen bromide-activated
Sepharose in analytical and preparative immunoadsorption. Int J Biol Macromol. 2, 289–296
465. Hill, R. J. (1972) Elution of antibodies from immunoadsorbents: effect of dioxane in promoting release
of antibody. J Immunol Methods. 1, 231–245
466. Page, M., and Thorpe, R. (2002) Purification of IgG Using Affinity Chromatography on Antigen-Ligand
Columns. in The Protein Protocols Handbook (Walker, J. ed), pp. 999–1001, Humana Press, Totowa, NJ,
10.1385/1-59259-169-8:999
467. Page, M., and Thorpe, R. (2002) Analysis of IgG Fractions by Electrophoresis. in The Protein Protocols
Handbook (Walker, J. ed), pp. 1005–1007, Humana Press, 10.1385/1-59259-169-8:1005
468. Chandramouli, K., and Qian, P. Y. (2009) Proteomics: challenges, techniques and possibilities to
overcome biological sample complexity. Hum Genomics Proteomics. 10.4061/2009/239204
469. Beeckmans, S., and Kanarek, L. (1983) Purification and physicochemical characterization of chicken
heart citrate synthase. Int J Biochem. 15, 469–478
470. Kaiser, P., Meierhofer, D., Wang, X., and Huang, L. (2008) Tandem affinity purification combined with
mass spectrometry to identify components of protein complexes. Methods Mol Biol. 439, 309–326
471. Lindner, H., Sarg, B., and Helliger, W. (1997) Application of hydrophilic-interaction liquid
chromatography to the separation of phosphorylated H1 histones. J Chromatogr A. 782, 55–62
472. Pinkse, M. W., Uitto, P. M., Hilhorst, M. J., Ooms, B., and Heck, A. J. (2004) Selective isolation at the
femtomole level of phosphopeptides from proteolytic digests using 2D-NanoLC-ESI-MS/MS and
titanium oxide precolumns. Anal Chem. 76, 3935–3943
473. Thomas, A., Schanzer, W., Delahaut, P., and Thevis, M. (2012) Immunoaffinity purification of peptide
hormones prior to liquid chromatography-mass spectrometry in doping controls. Methods. 56, 230–
235
474. Cappellini, E., Jensen, L. J., Szklarczyk, D., Ginolhac, A., da Fonseca, R. A., Stafford, T. W., Holen, S. R.,
Collins, M. J., Orlando, L., Willerslev, E., Gilbert, M. T., and Olsen, J. V (2012) Proteomic analysis of a
pleistocene mammoth femur reveals more than one hundred ancient bone proteins. J Proteome Res.
11, 917–926
475. Horvath, A., and Riezman, H. (1994) Rapid protein extraction from Saccharomyces cerevisiae. Yeast.
10, 1305–1310
476. Davie, J. R., Saunders, C. A., Walsh, J. M., and Weber, S. C. (1981) Nucleic Acids Research Nucleic Acids
Research. 9, 3205–3216
477. Dunn, B., and Wobbe, C. R. (2001) Preparation of protein extracts from yeast. Curr Protoc Mol Biol.
Chapter 13, Unit13.13
478. Kiseleva, E., Allen, T. D., Rutherford, S. A., Murray, S., Morozova, K., Gardiner, F., Goldberg, M. W., and
Drummond, S. P. (2007) A protocol for isolation and visualization of yeast nuclei by scanning electron
microscopy (SEM). Nat Protoc. 2, 1943–1953
479. Kizer, K. O., Xiao, T., and Strahl, B. D. (2006) Accelerated nuclei preparation and methods for analysis of
histone modifications in yeast. Methods. 40, 296–302
480. Matsuo, Y., Asakawa, K., Toda, T., and Katayama, S. (2006) A rapid method for protein extraction from
fission yeast. Biosci Biotechnol Biochem. 70, 1992–1994
BIBLIOGRAPHY
189
481. Croston, G. E., Lira, L. M., and Kadonaga, J. T. (1991) A general method for purification of H1 histones
that are active for repression of basal RNA polymerase II transcription. Protein Expr Purif. 2, 162–169
482. Garcia-Ramirez, M., Leuba, S. H., and Ausio, J. (1990) One-step fractionation method for isolating H1
histones from chromatin under nondenaturing conditions. Protein Expr Purif. 1, 40–44
483. Clark, D. J., and Thomas, J. O. (1986) Salt-dependent co-operative interaction of histone H1 with linear
DNA. J Mol Biol. 187, 569–580
484. Johns, E. W. (1964) Studies on histones. 7. Preparative methods for histone fractions from calf thymus.
Biochem J. 92, 55–59
485. Brand, S. H., Kumar, N. M., and Walker, I. O. (1981) The properties of salt-extracted histone H1. FEBS
Lett. 133, 63–66
486. De Petrocellis, L., Quagliarotti, G., Tomei, L., and Geraci, G. (1986) Structuring of H1 histone. Evidence
of high-affinity binding sites for phosphate ions. Eur J Biochem. 156, 143–148
487. Shechter, D., Dormann, H. L., Allis, C. D., and Hake, S. B. (2007) Extraction, purification and analysis of
histones. Nat. Protoc. 2, 1445–57
488. Tao, H., Liu, W., Simmons, B. N., Harris, H. K., Cox, T. C., and Massiah, M. A. (2010) Purifying natively
folded proteins from inclusion bodies using sarkosyl, Triton X-100, and CHAPS. Biotechniques. 48, 61–
64
489. Coligan, J. E. (2001) Commonly used detergents. Curr Protoc Protein Sci. Appendix 1, 1B
490. Katayama, H., Tabata, T., Ishihama, Y., Sato, T., Oda, Y., and Nagasu, T. (2004) Efficient in-gel digestion
procedure using 5-cyclohexyl-1-pentyl-beta-D-maltoside as an additive for gel-based membrane
proteomics. Rapid Commun Mass Spectrom. 18, 2388–2394
491. Lin, Y., Zhou, J., Bi, D., Chen, P., Wang, X., and Liang, S. (2008) Sodium-deoxycholate-assisted tryptic
digestion and identification of proteolytically resistant proteins. Anal Biochem. 377, 259–266
492. Yeung, Y. G., and Stanley, E. R. (2010) Rapid detergent removal from peptide samples with ethyl
acetate for mass spectrometry analysis. Curr Protoc Protein Sci. Chapter 16, Unit 16.12
493. Siuzdak, G. (2015) Sample Preparation: Salt Tolerance Table. Scripps Cent. Metabolomics Mass
Spectrom.
494. Nesvizhskii, A. I. (2014) Proteogenomics: concepts, applications and computational strategies. Nat
Methods. 11, 1114–1125
495. Wittenberg, C., and Reed, S. I. (2005) Cell cycle-dependent transcription in yeast: promoters,
transcription factors, and transcriptomes. Oncogene. 24, 2746–2755
496. Rolland, T., Tasan, M., Charloteaux, B., Pevzner, S. J., Zhong, Q., Sahni, N., Yi, S., Lemmens, I.,
Fontanillo, C., Mosca, R., Kamburov, A., Ghiassian, S. D., Yang, X., Ghamsari, L., Balcha, D., Begg, B. E.,
Braun, P., Brehme, M., Broly, M. P., Carvunis, A. R., Convery-Zupan, D., Corominas, R., Coulombe-
Huntington, J., Dann, E., Dreze, M., Dricot, A., Fan, C., Franzosa, E., Gebreab, F., Gutierrez, B. J., Hardy,
M. F., Jin, M., Kang, S., Kiros, R., Lin, G. N., Luck, K., MacWilliams, A., Menche, J., Murray, R. R., Palagi,
A., Poulin, M. M., Rambout, X., Rasla, J., Reichert, P., Romero, V., Ruyssinck, E., Sahalie, J. M., Scholz,
A., Shah, A. A., Sharma, A., Shen, Y., Spirohn, K., Tam, S., Tejeda, A. O., Trigg, S. A., Twizere, J. C., Vega,
K., Walsh, J., Cusick, M. E., Xia, Y., Barabasi, A. L., Iakoucheva, L. M., Aloy, P., De Las Rivas, J., Tavernier,
J., Calderwood, M. A., Hill, D. E., Hao, T., Roth, F. P., and Vidal, M. (2014) A proteome-scale map of the
human interactome network. Cell. 159, 1212–1226
497. Young, K. H. (1998) Yeast two-hybrid: so many interactions, (in) so little time. Biol Reprod. 58, 302–311
498. Lowder, M. A., Appelbaum, J. S., Hobert, E. M., and Schepartz, A. (2011) Visualizing protein
partnerships in living cells and organisms. Curr Opin Chem Biol. 15, 781–788
499. Hu, P., Janga, S. C., Babu, M., Diaz-Mejia, J. J., Butland, G., Yang, W., Pogoutse, O., Guo, X., Phanse, S.,
Wong, P., Chandran, S., Christopoulos, C., Nazarians-Armavil, A., Nasseri, N. K., Musso, G., Ali, M.,
Nazemof, N., Eroukova, V., Golshani, A., Paccanaro, A., Greenblatt, J. F., Moreno-Hagelsieb, G., and

BIBLIOGRAPHY
190
Emili, A. (2009) Global functional atlas of Escherichia coli encompassing previously uncharacterized
proteins. PLoS Biol. 7, e96
500. Sutherland, B. W., Toews, J., and Kast, J. (2008) Utility of formaldehyde cross-linking and mass
spectrometry in the study of protein-protein interactions. J Mass Spectrom. 43, 699–715
501. Yakovlev, A. A. (2009) Crosslinkers and their utilization for studies of intermolecular interactions.
Neurochem. J. 3, 139–144
502. Markham, K., Bai, Y., and Schmitt-Ulms, G. (2007) Co-immunoprecipitations revisited: an update on
experimental concepts and their implementation for sensitive interactome investigations of
endogenous proteins. Anal Bioanal Chem. 389, 461–473
503. Rine, J. (1991) Gene overexpression in studies of Saccharomyces cerevisiae. Methods Enzym. 194, 239–
251
504. Abruzzi, K. C., Smith, A., Chen, W., and Solomon, F. (2002) Protection from free beta-tubulin by the
beta-tubulin binding protein Rbl2p. Mol Cell Biol. 22, 138–147
505. Meeks-Wagner, D., and Hartwell, L. H. (1986) Normal stoichiometry of histone dimer sets is necessary
for high fidelity of mitotic chromosome transmission. Cell. 44, 43–52
506. Shastry, B. S. (1995) Overexpression of genes in health and sickness. A bird’s eye view. Comp Biochem
Physiol B Biochem Mol Biol. 112, 1–13
507. Papp, B., Pal, C., and Hurst, L. D. (2003) Dosage sensitivity and the evolution of gene families in yeast.
Nature. 424, 194–197
508. Sharp, A. H., and Campbell, K. P. (1987) Affinity purification of antibodies specific for 1,4-
dihydropyridine Ca2+ channel blockers. Circ Res. 61, I37–45
509. Wilson, I. D., and Stevenson, D. (2000) AFFINITY SEPARATION | Immunoaffinity Chromatography. in
Encyclopedia of Separation Science (Wilson, I. D. ed), pp. 283–288, Academic Press, Oxford,
http://dx.doi.org/10.1016/B0-12-226770-2/07111-8
510. Grigoryan, G., Reinke, A. W., and Keating, A. E. (2009) Design of protein-interaction specificity gives
selective bZIP-binding peptides. Nature. 458, 859–864
511. Sisson, T. H., and Castor, C. W. (1990) An improved method for immobilizing IgG antibodies on protein
A-agarose. J Immunol Methods. 127, 215–220
512. Panyim, S., and Chalkley, R. (1969) High resolution acrylamide gel electrophoresis of histones. Arch
Biochem Biophys. 130, 337–346
513. Sanders, L. A., and McCarty, K. S. (1972) Isolation and purification of histones from avian erythrocytes.
Biochemistry. 11, 4216–4222
514. Mattos, C., and Ringe, D. (2001) Proteins in organic solvents. Curr Opin Struct Biol. 11, 761–764
515. Gurley, L. R., Prentice, D. A., Valdez, J. G., and Spall, W. D. (1983) High-performance liquid
chromatography of chromatin histones. J Chromatogr. 266, 609–627
516. Lindner, H., Helliger, W., and Puschendorf, B. (1986) Histone separation by high-performance liquid
chromatography on C4 reverse-phase columns. Anal Biochem. 158, 424–430
517. Helliger, W., and Histones, I. (1988) erythrocyte histones goose. 255, 23–27
518. Sobel, R. E., Cook, R. G., and Allis, C. D. (1994) Non-random acetylation of histone H4 by a cytoplasmic
histone acetyltransferase as determined by novel methodology. J Biol Chem. 269, 18576–18582
519. Recht, J., Tsubota, T., Tanny, J. C., Diaz, R. L., Berger, J. M., Zhang, X., Garcia, B. A., Shabanowitz, J.,
Burlingame, A. L., Hunt, D. F., Kaufman, P. D., and Allis, C. D. (2006) Histone chaperone Asf1 is required
for histone H3 lysine 56 acetylation, a modification associated with S phase in mitosis and meiosis. Proc
Natl Acad Sci U S A. 103, 6988–6993
520. Zimmerman, C. L., Pisano, J. J., and Appella, E. (1973) Analysis of amino acid phenylthiohydantoins by
high speed liquid chromatography. Biochem Biophys Res Commun. 55, 1220–1224
521. Conlan, X. (2011) Mass Spectrometry and Separation Science. in Hyphenated and alternative methods
of detection in chromatography (Shalliker, R. A. ed), Taylor & Francis
BIBLIOGRAPHY
191
522. Whitehouse, C. M., Dreyer, R. N., Yamashita, M., and Fenn, J. B. (1985) Electrospray interface for liquid
chromatographs and mass spectrometers. Anal Chem. 57, 675–679
523. Wibf, H. K., Irving, P., McCamish, M., Venkataraghavan, R., and McLafferty, F. W. (1973) Mass
spectrometric studies of peptides. V. Determination of amino acid sequences in peptide mixtures by
mass spectrometry. J Am Chem Soc. 95, 3369–3375
524. Bantscheff, M., Lemeer, S., Savitski, M. M., and Kuster, B. (2012) Quantitative mass spectrometry in
proteomics: critical review update from 2007 to the present. Anal Bioanal Chem. 404, 939–965
525. Gelpi, E. (2008) From large analogical instruments to small digital black boxes: 40 years of progress in
mass spectrometry and its role in proteomics. Part I 1965-1984. J Mass Spectrom. 43, 419–435
526. Gelpi, E. (2009) From large analogical instruments to small digital black boxes: 40 years of progress in
mass spectrometry and its role in proteomics. Part II 1985-2000. J Mass Spectrom. 44, 1137–1161
527. Tanaka, K., Waki, H., Ido, Y., Akita, S., Yoshida, Y., Yoshida, T., and Matsuo, T. (1988) Protein and
polymer analyses up to m/z 100 000 by laser ionization time-of-flight mass spectrometry. Rapid
Commun. Mass Spectrom. 42, 1644–1655
528. Fenn, J. B., Mann, M., Meng, C. K., Wong, S. F., and Whitehouse, C. M. (1989) Electrospray ionization
for mass spectrometry of large biomolecules. Science. 246, 64–71
529. Juraschek, R., Dulcks, T., and Karas, M. (1999) Nanoelectrospray--more than just a minimized-flow
electrospray ionization source. J Am Soc Mass Spectrom. 10, 300–308
530. Emmett, M. R., and Caprioli, R. M. (1994) Micro-electrospray mass spectrometry: Ultra-high-sensitivity
analysis of peptides and proteins. J Am Soc Mass Spectrom. 5, 605–613
531. Raida, M. (2002) Hyphenated Techniques . in Mass Spectrometry and Hyphenated Techniques in
Neuropeptide Research (Jerzy Silberring, R. E. ed), pp. 109–134, Wiley-Interscience, New York
532. Wilm, M., and Mann, M. (1996) Analytical properties of the nanoelectrospray ion source. Anal Chem.
68, 1–8
533. Abian, J. (1999) The coupling of gas and liquid chromatography with mass spectrometry †. J. Mass
Spectrom. 34, 157–168
534. Gatlin, C. L., Eng, J. K., Cross, S. T., Detter, J. C., and Yates 3rd, J. R. (2000) Automated identification of
amino acid sequence variations in proteins by HPLC/microspray tandem mass spectrometry. Anal
Chem. 72, 757–763
535. Hopfgartner, G., Varesio, E., Tschappat, V., Grivet, C., Bourgogne, E., and Leuthold, L. A. (2004) Triple
quadrupole linear ion trap mass spectrometer for the analysis of small molecules and macromolecules.
J Mass Spectrom. 39, 845–855
536. Gangl, E. T., Annan, M. M., Spooner, N., and Vouros, P. (2001) Reduction of signal suppression effects
in ESI-MS using a nanosplitting device. Anal Chem. 73, 5635–5644
537. Wong, S. F., Meng, C. K., and Fenn, J. B. (1988) Multiple charging in electrospray ionization of
poly(ethylene glycols). J. Phys. Chem. 92, 546–550
538. Paul, W. (1990) Electromagnetic traps for charged and neutral particles. Rev. Mod. Phys. 62, 531–540
539. Jonsson, A. P. (2001) Mass spectrometry for protein and peptide characterisation. Cell Mol Life Sci. 58,
868–884
540. Bossio, R. E., and Marshall, A. G. (2002) Baseline resolution of isobaric phosphorylated and sulfated
peptides and nucleotides by electrospray ionization FTICR ms: another step toward mass
spectrometry-based proteomics. Anal Chem. 74, 1674–1679
541. Hu, Q., Noll, R. J., Li, H., Makarov, A., Hardman, M., and Graham Cooks, R. (2005) The Orbitrap: a new
mass spectrometer. J Mass Spectrom. 40, 430–443
542. Perry, R. H., Cooks, R. G., and Noll, R. J. (2008) Orbitrap mass spectrometry: instrumentation, ion
motion and applications. Mass Spectrom Rev. 27, 661–699

BIBLIOGRAPHY
192
543. Eissler, C. L., Bremmer, S. C., Martinez, J. S., Parker, L. L., Charbonneau, H., and Hall, M. C. (2011) A
general strategy for studying multisite protein phosphorylation using label-free selected reaction
monitoring mass spectrometry. Anal Biochem. 418, 267–275
544. Picotti, P., Bodenmiller, B., and Aebersold, R. (2013) Proteomics meets the scientific method. Nat
Methods. 10, 24–27
545. Yost, R. A., and Boyd, R. K. (1990) Tandem mass spectrometry: quadrupole and hybrid instruments.
Methods Enzym. 193, 154–200
546. Hayes, R. N., and Gross, M. L. (1990) Collision-induced dissociation. Methods Enzym. 193, 237–263
547. Hunt, D. F., Yates 3rd, J. R., Shabanowitz, J., Winston, S., and Hauer, C. R. (1986) Protein sequencing by
tandem mass spectrometry. Proc Natl Acad Sci U S A. 83, 6233–6237
548. Steen, H., and Mann, M. (2004) The ABC’s (and XYZ's) of peptide sequencing. Nat Rev Mol Cell Biol. 5,
699–711
549. Paizs, B., and Suhai, S. (2005) Fragmentation pathways of protonated peptides. Mass Spectrom Rev.
24, 508–548
550. Trelle, M. B., and Jensen, O. N. (2008) Utility of immonium ions for assignment of epsilon-N-
acetyllysine-containing peptides by tandem mass spectrometry. Anal. Chem. 80, 3422–30
551. Mann, M., Meng, C. K., and Fenn, J. B. (1989) Interpreting mass spectra of multiply charged ions. Anal
Chem. 61, 1702–1708
552. Oveland, E., Muth, T., Rapp, E., Martens, L., Berven, F. S., and Barsnes, H. (2015) Viewing the
proteome: How to visualize proteomics data? Proteomics. 15, 1341–1355
553. Key, M. (2012) A tutorial in displaying mass spectrometry-based proteomic data using heat maps. BMC
Bioinformatics. 13 Suppl 1, S10
554. Young, N. L., DiMaggio, P. A., Plazas-Mayorca, M. D., Baliban, R. C., Floudas, C. A., and Garcia, B. A.
(2009) High throughput characterization of combinatorial histone codes. Mol Cell Proteomics. 8, 2266–
2284
555. Ma, B., Zhang, K., Hendrie, C., Liang, C., Li, M., Doherty-Kirby, A., and Lajoie, G. (2003) PEAKS: powerful
software for peptide de novo sequencing by tandem mass spectrometry. Rapid Commun Mass
Spectrom. 17, 2337–2342
556. Mo, L., Dutta, D., Wan, Y., and Chen, T. (2007) MSNovo: a dynamic programming algorithm for de novo
peptide sequencing via tandem mass spectrometry. Anal Chem. 79, 4870–4878
557. Keller, A., Nesvizhskii, A. I., Kolker, E., and Aebersold, R. (2002) Empirical statistical model to estimate
the accuracy of peptide identifications made by MS/MS and database search. Anal Chem. 74, 5383–
5392
558. Karch, K. R., Denizio, J. E., Black, B. E., and Garcia, B. A. (2013) Identification and interrogation of
combinatorial histone modifications. Front Genet. 4, 264
559. Cech, N. B., Krone, J. R., and Enke, C. G. (2001) Predicting electrospray response from chromatographic
retention time. Anal Chem. 73, 208–213
560. Kuhne, W. (1886) Verhandlung des Naturhist.-Med., pp. 463–466, Vereins zu Heidelberg
561. Hustoft, H. K., Malerod, H., Wilson, R. S., Reubsaet, L., Lundanes, E., and Greibrokk, T. (2012) Critical
Review of Trypsin Digestion for LC-MS Based Proteomics. in Integrative Proteomics (Leung, D. H.-C. ed)
562. Castaneda-Agullo, M., Del Castillo, L. M., Whitaker, J. R., and Tappel, A. L. (1961) Effect of ionic
strength on the kinetics of trypsin and alpha chymotrypsin. J Gen Physiol. 44, 1103–1120
563. Yu, Y. Q., Gilar, M., Lee, P. J., Bouvier, E. S., and Gebler, J. C. (2003) Enzyme-friendly, mass
spectrometry-compatible surfactant for in-solution enzymatic digestion of proteins. Anal Chem. 75,
6023–6028
564. Olsen, J. V, Ong, S. E., and Mann, M. (2004) Trypsin cleaves exclusively C-terminal to arginine and lysine
residues. Mol Cell Proteomics. 3, 608–614

BIBLIOGRAPHY
193
565. Previs, M. J., VanBuren, P., Begin, K. J., Vigoreaux, J. O., LeWinter, M. M., and Matthews, D. E. (2008)
Quantification of protein phosphorylation by liquid chromatography-mass spectrometry. Anal Chem.
80, 5864–5872
566. Liao, R., Wu, H., Deng, H., Yu, Y., Hu, M., Zhai, H., Yang, P., Zhou, S., and Yi, W. (2013) Specific and
efficient N-propionylation of histones with propionic acid N-hydroxysuccinimide ester for histone
marks characterization by LC-MS. Anal Chem. 85, 2253–2259
567. Syka, J. E. P., Marto, J. A., Bai, D. L., Horning, S., Senko, M. W., Schwartz, J. C., Ueberheide, B., Garcia,
B., Busby, S., Muratore, T., Shabanowitz, J., and Hunt, D. F. (2004) Novel linear quadrupole ion trap/FT
mass spectrometer: Performance characterization and use in the comparative analysis of histone H3
post-translational modifications. J. Proteome Res. 3, 621–626
568. Bloxham, D. P., Parmelee, D. C., Kumar, S., Wade, R. D., Ericsson, L. H., Neurath, H., Walsh, K. A., and
Titani, K. (1981) Primary structure of porcine heart citrate synthase. Proc Natl Acad Sci U S A. 78, 5381–
5385
569. Fang, Y., Robinson, D. P., and Foster, L. J. (2010) Quantitative analysis of proteome coverage and
recovery rates for upstream fractionation methods in proteomics. J Proteome Res. 9, 1902–1912
570. Havlis, J., and Shevchenko, A. (2004) Absolute quantification of proteins in solutions and in
polyacrylamide gels by mass spectrometry. Anal Chem. 76, 3029–3036
571. Speicher, K. D., Kolbas, O., Harper, S., and Speicher, D. W. (2000) Systematic analysis of peptide
recoveries from in-gel digestions for protein identifications in proteome studies. J Biomol Tech. 11, 74–
86
572. Hao, P., Ren, Y., Alpert, A. J., and Sze, S. K. (2011) Detection, evaluation and minimization of
nonenzymatic deamidation in proteomic sample preparation. Mol Cell Proteomics. 10, O111.009381
573. Knapp, A. R., Ren, C., Su, X., Lucas, D. M., Byrd, J. C., Freitas, M. A., and Parthun, M. R. (2007)
Quantitative profiling of histone post-translational modifications by stable isotope labeling. Methods.
41, 312–319
574. Kumar, C., and Mann, M. (2009) Bioinformatics analysis of mass spectrometry-based proteomics data
sets. FEBS Lett. 583, 1703–1712
575. De Nobel, J. G., Klis, F. M., Priem, J., Munnik, T., and van den Ende, H. (1990) The glucanase-soluble
mannoproteins limit cell wall porosity in Saccharomyces cerevisiae. Yeast. 6, 491–499
576. Kuranda, M. J., and Robbins, P. W. (1991) Chitinase is required for cell separation during growth of
Saccharomyces cerevisiae. J Biol Chem. 266, 19758–19767
577. Thompson, A. J., Abu, M., and Hanger, D. P. (2012) Key issues in the acquisition and analysis of
qualitative and quantitative mass spectrometry data for peptide-centric proteomic experiments.
Amino Acids. 43, 1075–1085
578. Slater, M. L. (1976) Rapid nuclear staining method for Saccharomyces cerevisiae. J Bacteriol. 126,
1339–1341
579. Amberg, D. C., Burke, D. J., and Strathern, J. N. (2006) Yeast Vital Stains: DAPI Stain of Nuclear and
Mitochondrial DNA. CSH Protoc. 10.1101/pdb.prot4163
580. Linke, B., Schroder, K., Arter, J., Gasperazzo, T., Woehlecke, H., and Ehwald, R. (2010) Extraction of
nucleic acids from yeast cells and plant tissues using ethanol as medium for sample preservation and
cell disruption. Biotechniques. 49, 655–657
581. Rodriguez-Collazo, P., Leuba, S. H., and Zlatanova, J. (2009) Robust methods for purification of histones
from cultured mammalian cells with the preservation of their native modifications. Nucleic Acids Res.
37, e81
582. Von der Haar, T. (2007) Optimized protein extraction for quantitative proteomics of yeasts. PLoS One.
2, e1078
583. Edmondson, D. G., Smith, M. M., and Roth, S. Y. (1996) Repression domain of the yeast global
repressor Tup1 interacts directly with histones H3 and H4. Genes Dev. 10, 1247–1259
BIBLIOGRAPHY
194
584. Davie, J. R., Saunders, C. A., Walsh, J. M., and Weber, S. C. (1981) Histone modifications in the yeast S.
Cerevisiae. Nucleic Acids Res. 9, 3205–3216
585. Ide, G. J., and Saunders, C. a. (1981) Rapid isolation of yeast nuclei. Curr. Genet. 4, 85–90
586. Shimizu, M., Roth, S. Y., Szent-Gyorgyi, C., and Simpson, R. T. (1991) Nucleosomes are positioned with
base pair precision adjacent to the alpha 2 operator in Saccharomyces cerevisiae. EMBO J. 10, 3033–
3041
587. Waterborg, J. H. (2000) Steady-state levels of histone acetylation in Saccharomyces cerevisiae. J Biol
Chem. 275, 13007–13011
588. Ngubo, M. (2011) Chemical modifications of core histones during exit of stationary phase in
Saccharomyces cerevisae. Ph.D. thesis, University of the Free State, South Africa
589. Leon, I. R., Schwammle, V., Jensen, O. N., and Sprenger, R. R. (2013) Quantitative assessment of in-
solution digestion efficiency identifies optimal protocols for unbiased protein analysis. Mol Cell
Proteomics. 12, 2992–3005
590. Orlean, P. (2012) Architecture and biosynthesis of the Saccharomyces cerevisiae cell wall. Genetics.
192, 775–818
591. Motshwene, P., Brandt, W., and Lindsey, G. (2003) Significant quantities of the glycolytic enzyme
phosphoglycerate mutase are present in the cell wall of yeast Saccharomyces cerevisiae. Biochem J.
369, 357–362
592. Mason, J. A., and Mellor, J. (1997) Isolation of nuclei for chromatin analysis in fission yeast. Nucleic
Acids Res. 25, 4700–4701
593. Bhargava, M. M., and Halvorson, H. O. (1971) Isolation of nuclei from yeast. J Cell Biol. 49, 423–429
594. Shechter, D., Dormann, H. L., Allis, C. D., and Hake, S. B. (2007) Extraction, purification and analysis of
histones. Nat Protoc. 2, 1445–1457
595. Levy, A., Eyal, M., Hershkovits, G., Salmon-Divon, M., Klutstein, M., and Katcoff, D. J. (2008) Yeast linker
histone Hho1p is required for efficient RNA polymerase I processivity and transcriptional silencing at
the ribosomal DNA. Proc. Natl. Acad. Sci. U. S. A. 105, 11703–8
596. Zanton, S. J., and Pugh, B. F. (2006) Full and partial genome-wide assembly and disassembly of the
yeast transcription machinery in response to heat shock. Genes Dev. 20, 2250–2265
597. Osmotherly, L. M., and Thomas, P. D. J. (2010) Structural and biochemical studies of the yeast linker
histone, Hho1p. Ph.D. thesis, University of Cambridge, U.K.
598. Prieto, E., Hizume, K., Kobori, T., Yoshimura, S. H., and Takeyasu, K. (2012) Core histone charge and
linker histone H1 effects on the chromatin structure of Schizosaccharomyces pombe. Biosci Biotechnol
Biochem. 76, 2261–2266
599. Bodenmiller, B., Wanka, S., Kraft, C., Urban, J., Campbell, D., Pedrioli, P. G., Gerrits, B., Picotti, P., Lam,
H., Vitek, O., Brusniak, M.-Y., Roschitzki, B., Zhang, C., Shokat, K. M., Schlapbach, R., Colman-Lerner, A.,
Nolan, G. P., Nesvizhskii, A. I., Peter, M., Loewith, R., von Mering, C., and Aebersold, R. (2010)
Phosphoproteomic analysis reveals interconnected system-wide responses to perturbations of kinases
and phosphatases in yeast. Sci. Signal. 3, rs4
600. Uversky, V. N. (2013) Disorder in the lifetime of a protein. Intrinsically Disord. Proteins. 1, e26782
601. Babu, M. M., Kriwacki, R. W., and Pappu, R. V (2012) Structural biology. Versatility from protein
disorder. Science. 337, 1460–1461
602. Petrova, B., Dehler, S., Kruitwagen, T., Heriche, J. K., Miura, K., and Haering, C. H. (2013) Quantitative
analysis of chromosome condensation in fission yeast. Mol Cell Biol. 33, 984–998
603. Gsponer, J., Futschik, M. E., Teichmann, S. A., and Babu, M. M. (2008) Tight regulation of unstructured
proteins: from transcript synthesis to protein degradation. Science. 322, 1365–1368
604. Feser, J., Truong, D., Das, C., Carson, J. J., Kieft, J., Harkness, T., and Tyler, J. K. (2010) Elevated histone
expression promotes life span extension. Mol Cell. 39, 724–735
BIBLIOGRAPHY
195
605. O’Sullivan, R. J., Kubicek, S., Schreiber, S. L., and Karlseder, J. (2010) Reduced histone biosynthesis and
chromatin changes arising from a damage signal at telomeres. Nat Struct Mol Biol. 17, 1218–1225
606. Chymkowitch, P., Eldholm, V., Lorenz, S., Zimmermann, C., Lindvall, J. M., Bjoras, M., Meza-Zepeda, L.
A., and Enserink, J. M. (2012) Cdc28 kinase activity regulates the basal transcription machinery at a
subset of genes. Proc Natl Acad Sci U S A. 109, 10450–10455
607. Tian, R., Hoa, X. D., Lambert, J. P., Pezacki, J. P., Veres, T., and Figeys, D. (2011) Development of a
multiplexed microfluidic proteomic reactor and its application for studying protein-protein
interactions. Anal Chem. 83, 4095–4102
608. Radovani, E., Cadorin, M., Shams, T., El-Rass, S., Karsou, A. R., Kim, H. S., Kurat, C. F., Keogh, M. C.,
Greenblatt, J. F., and Fillingham, J. S. (2013) The carboxyl terminus of Rtt109 functions in chaperone
control of histone acetylation. Eukaryot Cell. 12, 654–664
609. Muller, P., Park, S., Shor, E., Huebert, D. J., Warren, C. L., Ansari, A. Z., Weinreich, M., Eaton, M. L.,
MacAlpine, D. M., and Fox, C. A. (2010) The conserved bromo-adjacent homology domain of yeast
Orc1 functions in the selection of DNA replication origins within chromatin. Genes Dev. 24, 1418–1433
610. Dou, Y., and Gorovsky, M. A. (2002) Regulation of transcription by H1 phosphorylation in Tetrahymena
is position independent and requires clustered sites. Proc Natl Acad Sci U S A. 99, 6142–6146
611. Janga, S. C., Collado-Vides, J., and Babu, M. M. (2008) Transcriptional regulation constrains the
organization of genes on eukaryotic chromosomes. Proc Natl Acad Sci U S A. 105, 15761–15766
612. Garcia, B. A., Hake, S. B., Diaz, R. L., Kauer, M., Morris, S. A., Recht, J., Shabanowitz, J., Mishra, N.,
Strahl, B. D., Allis, C. D., and Hunt, D. F. (2007) Organismal differences in post-translational
modifications in histones H3 and H4. J Biol Chem. 282, 7641–7655
613. Zlatanova, J., Caiafa, P., and Van Holde, K. (2000) Linker histone binding and displacement: versatile
mechanism for transcriptional regulation. FASEB J. 14, 1697–1704
614. Jerzmanowski, A., and Cole, R. D. (1992) Partial displacement of histone H1 from chromatin is required
before it can be phosphorylated by mitotic H1 kinase in vitro. J Biol Chem. 267, 8514–8520
615. Binz, T., D’Mello, N., and Horgen, P. A. (1998) A comparison of DNA methylation levels in selected
isolates of higher fungi. Mycologia. 90, 785–790
616. Wang, X., and Simpson, R. T. (2001) Chromatin structure mapping in Saccharomyces cerevisiae in vivo
with DNase I. Nucleic Acids Res. 29, 1943–1950
617. Ali, T., Coles, P., Stevens, T. J., Stott, K., and Thomas, J. O. (2004) Two homologous domains of similar
structure but different stability in the yeast linker histone, Hho1p. J Mol Biol. 338, 139–148
618. Catez, F., Ueda, T., and Bustin, M. (2006) Determinants of histone H1 mobility and chromatin binding in
living cells. Nat Struct Mol Biol. 13, 305–310
619. Vas, A. C., Andrews, C. A., Kirkland Matesky, K., and Clarke, D. J. (2007) In vivo analysis of chromosome
condensation in Saccharomyces cerevisiae. Mol Biol Cell. 18, 557–568
620. Li, X., Gerber, S. A., Rudner, A. D., Beausoleil, S. A., Haas, W., Villen, J., Elias, J. E., and Gygi, S. P. (2007)
Large-scale phosphorylation analysis of alpha-factor-arrested Saccharomyces cerevisiae. J Proteome
Res. 6, 1190–1197
621. Ohsumi, K., Katagiri, C., and Kishimoto, T. (1993) Chromosome condensation in Xenopus mitotic
extracts without histone H1. Science. 262, 2033–2035
622. Molina, H., Horn, D. M., Tang, N., Mathivanan, S., and Pandey, A. (2007) Global proteomic profiling of
phosphopeptides using electron transfer dissociation tandem mass spectrometry. Proc Natl Acad Sci U
S A. 104, 2199–2204
623. Beck, H. C., Nielsen, E. C., Matthiesen, R., Jensen, L. H., Sehested, M., Finn, P., Grauslund, M., Hansen,
A. M., and Jensen, O. N. (2006) Quantitative proteomic analysis of post-translational modifications of
human histones. Mol Cell Proteomics. 5, 1314–1325
BIBLIOGRAPHY
196
624. Erickson, B. K., Jedrychowski, M. P., McAlister, G. C., Everley, R. A., Kunz, R., and Gygi, S. P. (2015)
Evaluating multiplexed quantitative phosphopeptide analysis on a hybrid quadrupole mass filter/linear
ion trap/orbitrap mass spectrometer. Anal Chem. 87, 1241–1249
625. Jung, H. R., Pasini, D., Helin, K., and Jensen, O. N. (2010) Quantitative mass spectrometry of histones
H3.2 and H3.3 in Suz12-deficient mouse embryonic stem cells reveals distinct, dynamic post-
translational modifications at Lys-27 and Lys-36. Mol Cell Proteomics. 9, 838–850
626. Bonet-Costa, C., Vilaseca, M., Diema, C., Vujatovic, O., Vaquero, A., Omenaca, N., Castejon, L., Bernues,
J., Giralt, E., and Azorin, F. (2012) Combined bottom-up and top-down mass spectrometry analyses of
the pattern of post-translational modifications of Drosophila melanogaster linker histone H1. J
Proteomics. 75, 4124–4138
627. Oppikofer, M., Kueng, S., and Gasser, S. M. (2013) SIR-nucleosome interactions: structure-function
relationships in yeast silent chromatin. Gene. 527, 10–25
628. Wendt, K. S., and Grosveld, F. G. (2014) Transcription in the context of the 3D nucleus. Curr Opin Genet
Dev. 25, 62–67
629. Ganai, N., Sengupta, S., and Menon, G. I. (2014) Chromosome positioning from activity-based
segregation. Nucleic Acids Res. 42, 4145–4159
630. Struhl, K., and Segal, E. (2013) Determinants of nucleosome positioning. Nat Struct Mol Biol. 20, 267–
273
631. Jansen, A., and Verstrepen, K. J. (2011) Nucleosome positioning in Saccharomyces cerevisiae. Microbiol
Mol Biol Rev. 75, 301–320
632. McBryant, S. J., Lu, X., and Hansen, J. C. (2010) Multifunctionality of the linker histones: an emerging
role for protein-protein interactions. Cell Res. 20, 519–528
633. Hansen, J. C., Nyborg, J. K., Luger, K., and Stargell, L. A. (2010) Histone chaperones, histone acetylation,
and the fluidity of the chromogenome. J Cell Physiol. 224, 289–299
634. Musselman, C. A., Lalonde, M. E., Cote, J., and Kutateladze, T. G. (2012) Perceiving the epigenetic
landscape through histone readers. Nat Struct Mol Biol. 19, 1218–1227
635. Harshman, S. W., Young, N. L., Parthun, M. R., and Freitas, M. A. (2013) H1 histones: current
perspectives and challenges. Nucleic Acids Res. 41, 9593–9609
636. Krebs, J. E. (2007) Moving marks: dynamic histone modifications in yeast. Mol Biosyst. 3, 590–597
637. Bannister, A. J., and Kouzarides, T. (2011) Regulation of chromatin by histone modifications. Cell Res.
21, 381–395
638. Olins, D. E., and Olins, A. L. (2003) Chromatin history: our view from the bridge. Nat Rev Mol Cell Biol.
4, 809–814
639. Díaz‐Martínez, Angélica, L., and Hongtao, Y. (2010) Chromosome Condensation and Cohesion. eLS.
10.1002/9780470015902.a0022534
Related Documents