FEBRUARY 2016 Sharing the Wealth: A Roadmap for Distributing Myanmar’s Natural Resource Revenues Andrew Bauer, Paul Shortell and Lorenzo Delesgues

Sharing the Wealth: A Roadmap for Distributing Myanmar’s Natural Resource Revenues
Feb 20, 2017
Welcome message from author
This document is posted to help you gain knowledge. Please leave a comment to let me know what you think about it! Share it to your friends and learn new things together.
Transcript
FEBRUARY 2016
Sharing the Wealth: A Roadmap for
Distributing Myanmar’s Natural Resource Revenues
Andrew Bauer, Paul Shortell
and Lorenzo Delesgues
Contents
Cover photo by Minzayar for NRGI
Executive summary ....................................................................................................................................................................... 1
Introduction .............................................................................................................................................................................................. 4
Decentralization, deconcentration and natural resource revenues in Myanmar .......................................................................................................... 8
FISCAL DECENTRALIZATION AND SUBNATIONAL FINANCES IN MYANMAR ................................................................................. 8
DECENTRALIZATION AND DEVOLUTION PROCESS IN MYANMAR ..................................................................................................15
LOCATION OF NON-RENEWABLE NATURAL RESOURCES AND SCALE OF RESOURCE REVENUES .....................................18
Eight principles for resource revenue transfers ...............................................................................22
Designing a revenue sharing regime ................................................................................................................30
AGREEING ON REVENUE SHARING OBJECTIVES .....................................................................................................................................30
DECIDING THE VERTICAL ALLOCATION ......................................................................................................................................................34
DECIDING WHICH REVENUE STREAMS TO SHARE .................................................................................................................................35
DECIDING ON A RESOURCE REVENUE SHARING PRINCIPLE AND FORMULA (HORIZONTAL ALLOCATION) ..................37
DECIDING ON RECIPIENTS ...............................................................................................................................................................................46
STABILIZING RESOURCE REVENUE TRANSFERS .....................................................................................................................................50
EARMARKING RESOURCE REVENUES .........................................................................................................................................................51
TRANSPARENCY AND OVERSIGHT MECHANISMS ..................................................................................................................................52
NEGOTIATION PROCESS AND VENUE FOR IMPLEMENTATION ..........................................................................................................55
Conclusion ................................................................................................................................................................................................57
Key questions for consideration by policymakers ........................................................................58
Bibliography ............................................................................................................................................................................................59
Boxes: REVENUE SHARING VS. BENEFIT SHARING ................................................................................................................................................. 7
OIL, GAS AND MINERAL TAX ASSIGNMENTS .............................................................................................................................................16
MONGOLIA REVENUE SHARING CASE STUDY .........................................................................................................................................28
BOLIVIA REVENUE SHARING CASE STUDY ................................................................................................................................................44
PHILIPPINES REVENUE SHARING CASE STUDY ......................................................................................................................................47
1
SHARING THE WEALTH: A ROADMAP FOR DISTRIBUTING MYANMAR’S NATURAL RESOURCE REVENUES
Oil, natural gas and mineral revenues are generated
in nearly every state and region in Myanmar,
with the most important onshore interests lying
in Bago, Kachin, Magway, Mandalay, Sagaing,
Shan and Tanintharyi. In these areas and others,
extractive activities have significantly impacted
livelihoods and the local environment. Populations
in affected areas also assert a lack of direct benefits
from the extractive industry.
In response, the newly elected National League
for Democracy (NLD) has committed to “work
to ensure a fair distribution across the country of
the profits from natural resource extraction, in
accordance with the principles of a federal union.”
Furthermore, regional and state leaders and several
ethnic armed groups have pointed to natural
resource revenue sharing as a key component in
national reform, fiscal decentralization and peace
processes. As such, distribution of natural resource
revenues to subnational authorities will be a central
component of any decentralization effort and could
even feature in discussions around the creation of a
new Myanmar federation.
Depending on how any prospective system
is designed, resource revenue sharing can
help address three separate issues: improving
development outcomes and the quality of public
investment; attracting high quality private
investors to the sector; and securing a lasting peace.
Many countries have designed revenue sharing
regimes to enhance public service delivery,
improve inter-regional equity, and strengthen
national unity. Success is dependent on having
revenues reflect expenditure responsibilities,
ensuring predictability and stability of revenue
flows, and the ability of all levels of government
and relevant stakeholders to reach a consensus on
a formula that can survive political transitions. In
other words, any revenue sharing system must be
efficient, fair and transparent.
FISCAL DECENTRALIZATION, SUBNATIONAL FINANCES AND EXTRACTIVE ACTIVITIES IN MYANMAR
Excluding illegal activities and payments to ethnic
armed groups, almost all public oil, gas and mining
tax and non-tax revenues are collected directly by
the Union government or state-owned entities, as
prescribed by the 2008 Constitution. Transfers of
these resource revenues and general revenues to
subnational governments are made on an ad hoc basis. They are disproportionately large on a per
capita basis in conflict-prone areas and states and
regions with more activist politicians, though there
is also evidence that states and regions with greater
development needs are receiving a higher share of
revenues. As Myanmar decentralizes and devolves
power to subnational authorities, the overall size of
transfers is also increasing year-on-year.
As of 2013, there were large-scale mines operating
in all but two states and regions and active legal
mines in all but Chin state. Among the most
important of these are the Letpadaung copper
mine in Sagaing region; jade mines in and around
Hpakant township in Kachin state; ruby and
sapphire mines in Mandalay region (Mogok) and
Shan state (Mong Hsu); and the Kyaukpahto and
Modi Taung gold mines in Sagaing and Mandalay
regions, respectively.
Mineral exploration activities are also underway
in nearly every state or region. Among the most
promising deposits are iron ore in Kachin, Bago
and Shan states, lead and zinc in Shan, and gold
in Mandalay and Sagaing. The Ministry of Mines
has plans to expand copper, nickel and chromite
production at a minimum.
Executive summary
2
SHARING THE WEALTH: A ROADMAP FOR DISTRIBUTING MYANMAR’S NATURAL RESOURCE REVENUES
Foreign and independent sources place the value
of mineral exports and production much higher
than the officially reported USD 1.15 billion in
exports in 2013/14. According to UN trade data,
nearly USD 12.3 billion in precious stones were
exported from Myanmar to China alone in 2014.
An independent assessment by Global Witness
valued gross jade production in Myanmar at
roughly USD 31 billion in the same year. Despite
the methodological challenges associated with
calculating the value of mineral production—
especially given the scale of smuggling activities
and underreporting and the difficulty in accurately
pricing precious stones such as jade—by these
estimates, actual mineral exports were more than
10 times more valuable than what was reported by
the government.
According to Myanmar’s first Extractive Industries
Transparency Initiative (EITI) report, published
in January 2016, the Union government
collected MMK 442 billion (approximately USD
460 million) in mineral revenues in 2013/14.
Gems and jade represented 88 percent of this
amount. Mineral sector payments contributed
approximately 7 percent of Union government
non-state-owned economic enterprise (non-SEE)
fiscal revenues in 2013/14.
While most oil and gas production is currently
off-shore, pipelines run through many states. The
older gas network serving the Yadana and Yetagun
fields runs through Yangon, Bago, Mon and
Tanintharyi. The new Shwe oil and gas pipeline
passes through Rakhine, Magway, Mandalay and
Shan. As of April 2014, there were also 17 on-
shore blocks producing oil or gas. On-shore oil
and gas companies are active in nearly every state,
especially in Bago and Magway. They are noticeably
less active in Chin, Shan, Kachin and Tanintharyi.
The oil and gas sector generates more revenue
than the mineral sector for the government. The
Union government collected MMK 2,569 billion
(approximately USD 2.7 billion) in oil and gas
taxes, equity returns, signature bonuses, custom
duties, royalties and in-kind production in FY
2013/14. Oil and gas sector payments contributed
approximately 40.5 percent of estimated Union
government fiscal revenues in 2013/14, excluding
payments from SEEs.
While publication of extractive sector payments
is a good first step, project-by-project production
and payments data—preferably disaggregated by
revenue stream—would be needed to implement
a resource revenue sharing system that benefits
producing regions in Myanmar. The first Myanmar
EITI report does not provide this information, nor
is it publicly available elsewhere.
EIGHT STEPS TO DESIGNING A RESOURCE REVENUE SHARING SYSTEM
Our paper outlines eight considerations for natural
resource revenue sharing in Myanmar:
• Agreeing on revenue sharing objectives. Extractive-specific revenue sharing systems
are usually established to achieve one or
more of the following goals: (i) compensate
local communities for the negative impacts
of extraction; (ii) mitigate or prevent violent
conflict; (iii) respond to local claims for
benefits, based on ideas of local ownership; and
(iv) promote regional income equality between
resource and non-resource rich regions.
Achieving consensus on the objective(s) is
essential since any resource revenue sharing
system ought to be designed to reflect the
objectives.
3
SHARING THE WEALTH: A ROADMAP FOR DISTRIBUTING MYANMAR’S NATURAL RESOURCE REVENUES
• Deciding on vertical distribution. Vertical
distribution refers to the split in revenue
shares between the national and all subnational
entities. To prevent wasteful spending or poor
service delivery, transferred revenues ought to
match expenditures over the medium-term.
While there is no one-size-fits-all system for
vertical distribution, subnational expenditure
responsibilities must be taken into account.
• Deciding on which revenue streams to share. Any revenue sharing formula must
consider whether to cover all revenue streams
or only some (e.g., royalties). It must also
consider whether to cover only onshore or
both onshore and offshore activities.
• Deciding on horizontal distribution. Resource revenues can be distributed
between subnational entities according to
two principles: a derivation-based principle,
whereby a higher proportion accrues to
the producing area; or an indicator-based
principle, whereby revenues are allocated
according to needs (e.g., poverty rates;
education outcomes) or revenue generating
capacity (e.g., population; regional GDP).
Currently, Myanmar does not publish enough
accurate project-level data to implement
a derivation-based formula and does not
disclose enough data to even model such a
formula. For these reasons, our report only
models four indicator-based formulas using
census data.
• Deciding on recipients. While region- and
state-level authorities might be the most
obvious recipients of resource revenue shares,
governments in other countries make transfers
to traditional authorities, municipalities,
landowners and even directly to residents.
These are all possible considerations in
Myanmar.
• Improving incentives for efficient spending (stabilization and earmarking). The manner in which resource revenues are
transferred—for instance if they are transferred
in lump-sum or smoothed, or if they are
earmarked for specific expenditure items like
education—will help determine whether or
not they contribute to improving development
outcomes.
• Transparency and oversight mechanisms. One challenge many countries face is that local
governments cannot verify whether they are
receiving their resource revenue entitlements
under the law. Transparency and oversight
mechanisms can improve the chances that
resource revenue sharing will reduce conflict
rather than exacerbate it.
• Negotiation process and venue for implementation. Other countries’
experiences indicate that a fair, stable
and efficient system requires stakeholder
consensus on any revenue sharing formula, as
well as codification in law.
4
SHARING THE WEALTH: A ROADMAP FOR DISTRIBUTING MYANMAR’S NATURAL RESOURCE REVENUES
1 National League for Democracy (2015) 2015 Election Manifesto.2 Lynn, Thet Aung, and Mari Oye (2014) Natural Resources and Subnational Governments in Myanmar: Key Considerations for Wealth
Sharing. IGC-MDRI-The Asia Foundation. Discussion Paper No. 4; Transnational Institute (2015) Political Reform and Ethnic Peace in Burma/Myanmar: The Need for Clarity and Achievement. Myanmar Policy Briefing No. 14, April 2015.
3 Fiscal federalism is a system where certain functions and instruments of government are decentralized to state or regional bodies.
A historic transition in natural resource
governance is underway in Myanmar.
Notable developments include new standardized
contract terms for oil and gas licenses, the release of
Myanmar’s first Extractive Industries Transparency
Initiative (EITI) report, and the formation of a
Ministry of Finance committee chaired to establish
a sovereign wealth fund that would save a share
of oil and gas revenues. However an important
reform—with implications for peace and
security, growth, investment, and development
of the peripheral regions and states—is still in a
preparatory stage: the decentralization of natural
resource revenues.
In its 2015 post-election manifesto, the National
League for Democracy (NLD) committed to “work
to ensure a fair distribution across the country of
the profits from natural resource extraction, in
accordance with the principles of a federal union.”
Along with sovereignty over education, this is
one of the only mentions of federalism in the
manifesto. Both reforms are expected to contribute
to peace and security.1
Even prior to the 2015 election, leaders from
several ethnic minority parties—namely from
Chin, Kachin, Rakhine and Shan states—openly
called for greater resource revenue sharing. Ethnic
armed organizations have also made statements
that natural resources must be included as a
topic “for further negotiations” with the Union
government. As the process advances, this issue
will become ever more crucial to satisfying
demands for greater autonomy from the central
government. Still today, combatants in areas of
active conflict claim control over “natural resource
development” as a shared goal.2
Without a doubt, distribution of natural resource
revenues to subnational authorities will be a major
target of any decentralization effort. An immense
political transformation, requiring modifications
to the 2008 Constitution, would be needed to
create a true federal state in which sovereignty
would be shared by national and subnational
governments. In the meantime, much can be done
without constitutional change if the government
wishes to introduce a degree of “fiscal federalism”
in Myanmar.3
This discussion paper outlines options available
under the current legal structure to help the new
leadership fulfill its commitment to decentralize
natural resource revenues. It is also meant to
inform Myanmar’s broader discourse on how
best to distribute these revenues. First, it briefly
outlines the current state of fiscal decentralization
in Myanmar. Second, it describes the size and
location of extractive activities given the limited
information currently available. Third, it aims
to share good practices for revenue distribution
and international experiences. Fourth, it outlines
policy options and considerations for policymakers
on intergovernmental transfers and addresses the
debate on tax assignments.
We recognize that a large number of resource
revenues are de facto collected by state-owned
economic enterprises (SEEs) and military-affiliated
companies. We also note that in the Union Peace
Conference and in the public discourse different
options ranging from true federalism to fiscal
Introduction
5
SHARING THE WEALTH: A ROADMAP FOR DISTRIBUTING MYANMAR’S NATURAL RESOURCE REVENUES
4 Myanmar Peace Monitor (2015) Background on Economic and Political Stakes. Online: http://mmpeacemonitor.org/. 5 BMI Research (2015) Myanmar Operational Risk Report. BMI Research / Fitch Group. Online: http://store.bmiresearch.com/
myanmar-operational-risk-report.html.
decentralization are being considered. Keeping
all of that in mind, this paper assumes that the
vast majority of natural resource revenues will be
continue to be collected by the Union and its SEEs
as prescribed in the constitution and that, should
the government choose to transfer a portion to
subnational entities, transfers would be made from
this pool of funds. In other words, we assume that
the central government will continue to collect
nearly all revenues from natural resources. It
also takes current administrative divisions and
expenditure responsibilities as provided in the
2008 constitution.
This paper does not consider in-kind revenue
sharing whereby a portion of tax obligations can
be spent on local infrastructure or social programs
rather than paid in currency, such as is the case in
Papua New Guinea.
WHY IS IT IMPORTANT TO GET RESOURCE REVENUE SHARING RIGHT?
Oil, gas and mineral revenues are generated in
nearly every state and region in Myanmar, with the
most important interests lying in Bago, Kachin,
Magway, Mandalay, Sagaing, Shan and Tanintharyi.
Myanmar also has significant offshore gas
production. In response to the significant impacts
petroleum and mining activities have on local
livelihoods, as well as a perceived lack of control and
benefits accruing to local populations, distribution
of natural resource revenue has been raised a main
demand by several ethnic armed groups.4
Getting resource revenue sharing right in
Myanmar is not just important for peace and
security; it is also a key component of economic
reform and growth. High quality investors—
reliable businesses that use the latest technologies
in their commercial activities and best practices
in their corporate social responsibility (CSR)
actions—are attracted by administrative stability
and predictability. These firms also seek to work
in business environments where they are able
to secure a robust social license to operate. They
seek a clear understanding of their relationships
with different levels of government and how
payments are meant to flow. Their experience
tells them that uncertainty of administrative
control, along with low public service provision,
often leads to local residents near mine sites or
petroleum fields demanding greater benefits from
extractive companies. Stability, predictability
and transparency of resource revenue flows are
more likely to attract the “right kind” of foreign
direct investment (FDI) and new technologies,
which in turn can improve local skills and business
development.
At the moment, investors view Myanmar,
particularly its resource sector, as a high-
risk proposition due to ongoing conflicts and
administrative uncertainty. BMI Research, one
of the world’s leading risk analysis companies,
highlights the “severe operational risks” generated
in part by “numerous layers of red tape” and
slow improvements to political stability and
security.5 NRGI’s own report on SEEs in the
extractive sector, Gilded Gatekeepers: Myanmar’s State-Owned Enterprises in Oil, Gas and Mining, reinforces this finding, as the mining sector in
particular is characterized by a complex regulatory
6
SHARING THE WEALTH: A ROADMAP FOR DISTRIBUTING MYANMAR’S NATURAL RESOURCE REVENUES
6 Fund for Peace (2015) Fragile States Index 2015. Online: http://fsi.fundforpeace.org/ 7 Government of Myanmar (2014) The 2014 Myanmar Population and Housing Census. Online: http://countryoffice.unfpa.org/
myanmar/census/; World Bank (2013) Worldwide Governance Indicators. Online: http://info.worldbank.org/governance/wgi/index.aspx#home
regime dominated by both official state-owned
companies (e.g., No. 1 Mining Enterprise) and
military-affiliated quasi-state-owned companies
(e.g., MEC, UMEHL). In 2014, Myanmar was
ranked the world’s 24th most fragile country by the
Fragile States Index, just behind North Korea and
Cameroon, mostly because of regional conflicts,
uneven development across regions and the
challenges of state legitimacy.6
Equally important as mid-term goals of peace,
stability and economic growth are improving
development outcomes and the quality of public
investment in Myanmar. The 2014 census
indicates that Myanmar has one of the shortest life
expectancies (66.8 years) and the lowest levels of
access to clean water (70 percent) in Asia. Only 32
percent of households use electricity for lighting.
More than 25 percent of households do not use
toilets. Ayeyarwady, Rakhine, Shan, Magway and
Tanintharyi in particular have been left behind.
Moreover, according to the World Bank, Myanmar
places in the bottom five percent worldwide in
terms of government effectiveness at delivering
services.7
Natural resource revenues can be used to both
drive economic development and to help close
the development gap between regions. If designed
correctly, a revenue sharing system could improve
the public sector’s delivery of social services, both
by providing financing for capital projects and
creating the right incentives for spending money in
the public interest.
Success or failure—in generating a lasting peace,
improving the investment climate and improving
the quality of public spending—depends on the
details. The design of revenue sharing regimes
can enhance public service delivery or harm it,
improve inter-regional equity or exacerbate it, and
strengthen a national union or weaken it. Success
is dependent on limiting imbalances between
revenues and expenditure responsibilities,
predictability and stability of revenue flows, and
the ability of all levels of government and relevant
stakeholders to reach a consensus on a formula that
can survive political transitions. In other words,
any revenue sharing system must be efficient, fair
and transparent.
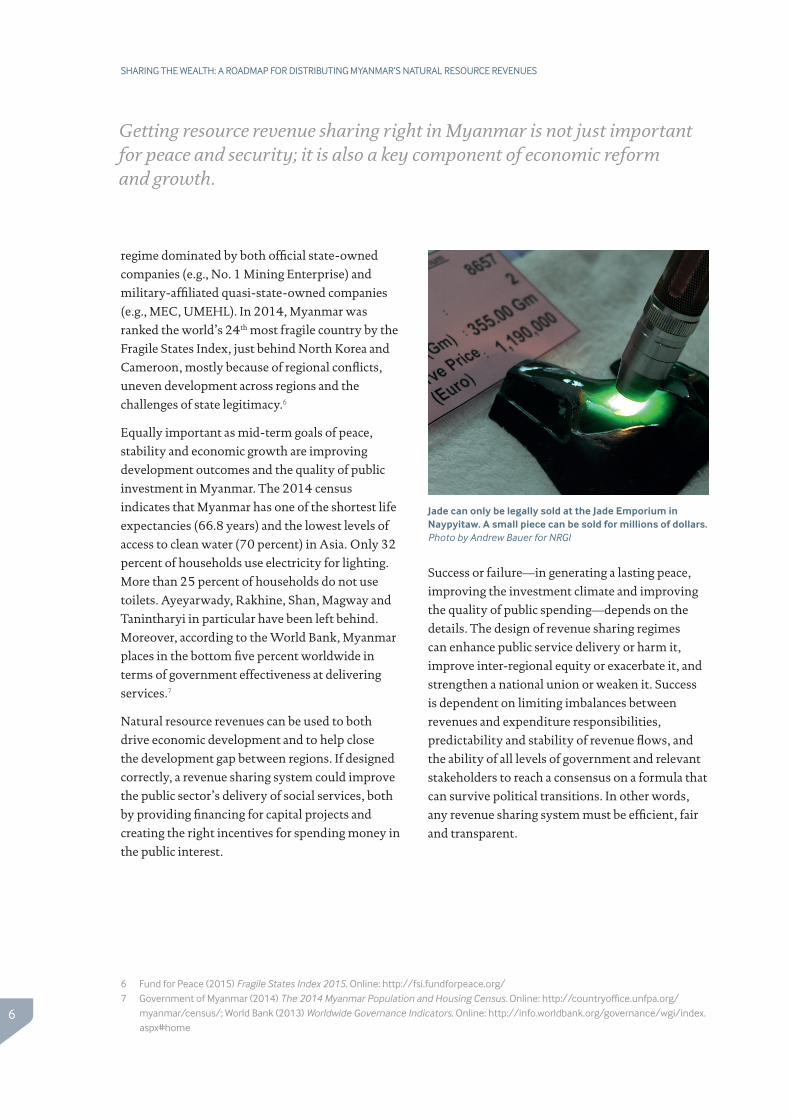
Jade can only be legally sold at the Jade Emporium in Naypyitaw. A small piece can be sold for millions of dollars. Photo by Andrew Bauer for NRGI
Getting resource revenue sharing right in Myanmar is not just important for peace and security; it is also a key component of economic reform and growth.
7
SHARING THE WEALTH: A ROADMAP FOR DISTRIBUTING MYANMAR’S NATURAL RESOURCE REVENUES
8 Bird, Richard M. and Robert D. Ebel (2006) “Fiscal federalism and national unity” in Handbook of Fiscal Federalism (eds. Ehtisham Ahmad and Giorgio Brosio). Cheltenham: Edward Elgar Publishing Ltd.
9 Wall, Elizabeth and Remi Pelon (2011) Sharing Mining Benefits in Developing Countries: The Experience with Foundations, Trusts and Funds. World Bank. Extractive Industries Development Series #21.
10 For more details, see Toledano, Perrine et al. (2014) A Framework to Approach Shared Use of Mining-Related Infrastructure. Vale Columbia Center for Sustainable International Investment. Online: http://www.vcc.columbia.edu/files/vale/content/A_Framework_for_Shared_use_Jan_2014.pdf
11 Grupo Propuesta Ciudadana (2012) El Programa minero de Solidaridad con el Pueblo: Evaluacion de Transparencia. Reporte de vigilancia No. 5; Lopez, Rocio Moreno (2013) Corporate Direct Social Expenditures: A Monitoring Guide for Civil Society Organizations. Online: http://www.resourcegovernance.org/sites/default/files/Subnational-SocialExpenditures20151125.pdf
12 For more details, see Esteves, Ana Maria, Bruce Coyne and Ana Moreno (2013) Local Content Initiatives: Enhancing the substantial benefits of the oil, gas and mining sectors. Revenue Watch Institute. Online at: http://www.resourcegovernance.org/sites/default/files/RWI_Sub_Enhance_Benefits_EN_20131118.pdf
Box 1. Revenue sharing vs. benefit sharing
Natural resource revenue sharing—whether through intergovernmental transfers or direct taxation by subnational authorities—is not the only way that producing states and regions or affected communities can capture a share of the benefits from extraction. Indeed, resource revenue sharing should be viewed within the broader concept of “benefit sharing” in the extractive sector.
In addition to financial income being shared with subnational authorities, who in turn finance public services, there are five ways residents affected by oil, gas or mining activities can benefit. First, national governments can target services directly to producing areas or affected communities. This can be done by prioritizing service delivery and infrastructure projects to these parts of the country or through a more formal process of fiscal decentralization. Fiscal decentralization does not imply that political decision making is placed in the hands of locally representative bodies or that government officials responsible for these public services are physically located in the community. It only implies that money is placed in the hands of those officials responsible for a specific geographic area.8
Second, companies can be required to make in-kind payments in the form of infrastructure or public services. For example, in Kyrgyzstan, Liberia, Nigeria, Sierra Leone and Yemen, national mining laws require extractive companies to spend a certain percentage of their gross revenue on local development.9 In the Liberian case, company payments to local projects are tax deductible, which means companies can reduce the amount of tax they have to pay to governments for each dollar spent on local development. This represents a shift of benefits from the national government to the company and local community. In other cases, extractive companies can be required to provide additional infrastructure such as communication technologies, power stations, water systems, roads, rails and ports, or share access to this infrastructure with local residents or businesses. In Mozambique, for example, Vale is being required to share its railroad from the Moatize coal mine to the Nacala port with freight and passenger cars.10
Third, companies can make voluntary payments to communities in the form of infrastructure, services or cash, usually as part of their corporate social responsibility (CSR) package. For example, in Peru, some large mining companies agreed to spend 3.75 percent of after-tax profits on a “Voluntary Support Fund” to be used for special development spending in resource rich areas. The Voluntary Support Fund mechanism was agreed with the central government in exchange for the repeal of a windfall profits tax. The loss in fiscal revenues cost the government about USD 500 million.11
Fourth, local citizens can receive a share of the resource in-kind. For instance, citizens in producing areas or affected communities can be offered a share of coal production or provided low-cost access to oil or natural gas. While citizens may benefit directly from extraction, any in-kind distribution would likely lead to less income for governments and possible abuse of the natural resource distribution system, as we have seen in Libya and Nigeria where subsidized gas is smuggled in mass quantities.
Finally, producing areas or affected communities can benefit from ‘local content’ policies that require operating companies to develop local employment targets, give preference to local suppliers in the procurement of goods and services, develop local skills, improve local technologies, or invest in downstream value-added industries, such as processing plants or refineries.12
8
SHARING THE WEALTH: A ROADMAP FOR DISTRIBUTING MYANMAR’S NATURAL RESOURCE REVENUES
13 World Bank (2015) Myanmar Public Expenditure Review 2015. World Bank Group, September 2015.14 Nixon, Hamish et al. (2013) State and Region Governments in Myanmar. MDRI and The Asia Foundation.
FISCAL DECENTRALIZATION AND SUBNATIONAL FINANCES IN MYANMAR
Myanmar is subdivided into seven states,
seven regions, five self-administered zones,
one self-administered division and one union
territory. Below regions and states are several
layers of subnational authorities, including
districts, townships, towns, villages and urban
wards. These lower layers of administration
have vague mandates and are controlled by the
central government’s General Administration
Department (GAD) of the Ministry of Home
Affairs (MOHA).13
Under Schedule I of the 2008 Constitution, the
Union government has exclusive or primary
responsibility over the most costly public services,
namely education, public health, defense, large
infrastructure projects such as national railroads
and large-scale energy production and distribution,
social welfare and large-scale natural resource
extraction and processing. That said, the Union
government has the authority to deconcentrate
authority over any of these public services should
it so wish.
States and regions each host a partially elected
hluttaw (local parliament) and are led by a chief
minister appointed by the President from among
hluttaw members, who include members of the
armed forces. Under Schedule II of the 2008
Constitution, states and regions are responsible
for legislating and administering a wide variety of
activities. Among the most significant potential
expenditure responsibilities are:
• Small and medium-sized electric power
production and distribution
• Local ports
• Local roads and bridges
• Local housing and urban planning
• Agriculture, including pest control and water
management infrastructure
• Recreation centers, museums, libraries,
cultural heritage protection, and gardens
• Environmental crisis response
• Cutting and polishing gemstones
• Salt and salt products
While these responsibilities are nominally under
local government control, in practice government
officials administering them usually still work in
union ministries. For instance, within the Ministry
of Construction, the Department of Housing
Development and the Department of Maintenance
of Roads, Buildings and Bridges are under regional
or state control, while all other departments are
under union control. Similarly, at the Ministry
of Agriculture and Irrigation, the Agriculture
Department is under regional or state control while
the Irrigation Department is under union control.
Even more confusing, a state or regional minister
is in charge of regulating bamboo, charcoal and
small forestry production, yet the union Ministry
of Environmental Conservation and Forestry
(MOECAF) is in charge of implementing these
regulations. In short, there is confusion over which
level of government regulates and administers
certain activities.14
Decentralization, deconcentration and natural resource revenues in Myanmar
9
SHARING THE WEALTH: A ROADMAP FOR DISTRIBUTING MYANMAR’S NATURAL RESOURCE REVENUES
15 World Bank (2015) Myanmar Public Expenditure Review 2015. World Bank Group, September 2015.16 Nixon, Hamish, and Cindy Joelene (2014) Fiscal Decentralization in Myanmar: Towards a Roadmap for Reform. MDRI and The Asia
Foundation. Discussion Paper No. 5.17 Xinhua (2013) “Myanmar parliament approves 2013-14 re-drawn state budget” at http://news.xinhuanet.com/english/world/2013-
03/21/c_132252445.htm; Lwin, Ei Ei Toe (2014) “Military spending still dwarfs education and health” in Myanmar Times at http://www.mmtimes.com/index.php/national-news/10000-military-spending-still-dwarfs-education-and-health.html; Thant, Htoo (2015) “U Thein Sein govt’s last budget approved” in Myanmar Times at http://www.mmtimes.com/index.php/national-news/13864-u-thein-sein-govt-s-last-budget-approved.html.
Furthermore, government officials under the
authority of state or regional cabinet members
are accountable to MOHA rather than state or
regional administrations, which in most cases do
not yet exist. Therefore, while state and regional
cabinet members yield de jure power over the
public services listed above, government officials
responsible for delivering them recognize that their
career prospects depend on satisfying their MOHA
superiors, who are in turn accountable to the union
government.15
State and regional governments may levy excise
taxes, land taxes, water taxes, road tolls and taxes,
and royalties on fisheries. In the extractive sector,
they may only collect mineral taxes from gravel
and sand producers. They may also sell or lease
state or regional government property and make
profits on state or regional government-owned
enterprises.
Self-administered zones and divisions function
differently according to Schedule III of the 2008
Constitution. Legislative and executive powers
are held by “leading bodies” and chairpersons
are appointed or indirectly elected by the Union
government from among regional or state hluttaws and the Armed Forces. Their legislative and
administrative responsibilities include:
• Roads and bridges
• Public health
• Fire prevention
• Maintenance of pasture lands
• Environmental conservation and preservation,
including forests
• Local water and electricity
Revenues for self-administered zones and division
are drawn from Union, regional and state budgets.
Naypyitaw is the one union territory. Since there
are few extractive activities in Naypyitaw, we will
not cover its administration.
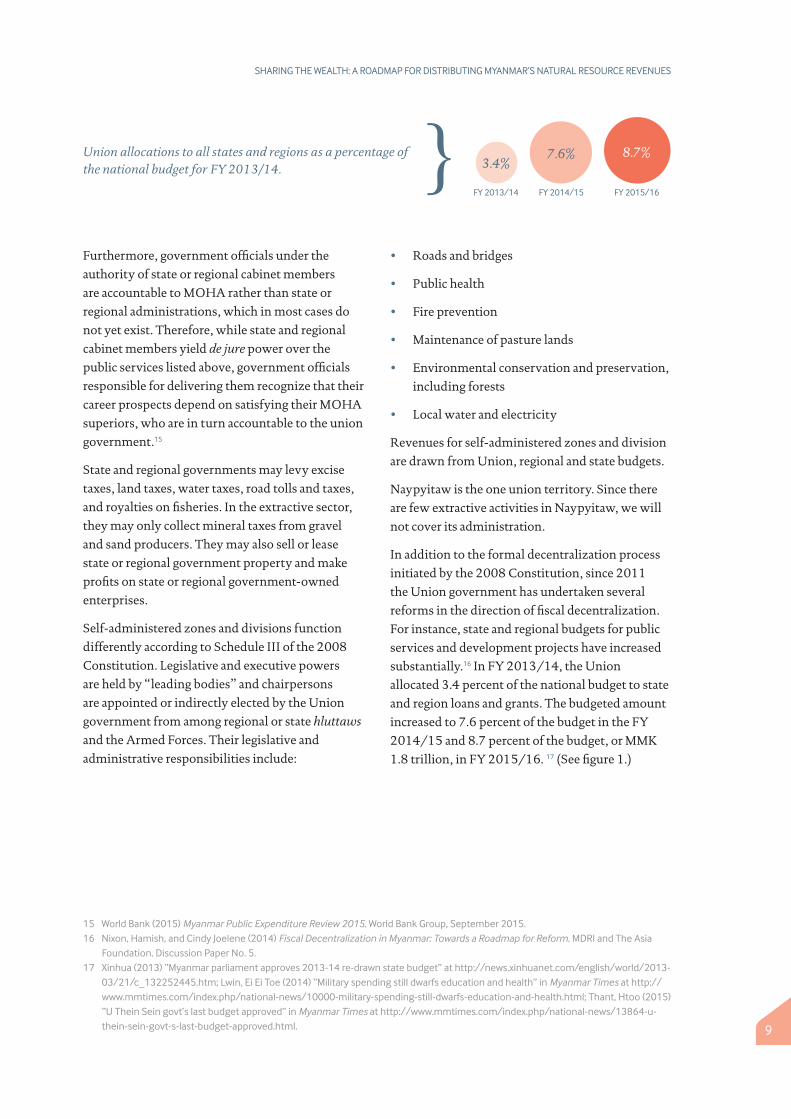
In addition to the formal decentralization process
initiated by the 2008 Constitution, since 2011
the Union government has undertaken several
reforms in the direction of fiscal decentralization.
For instance, state and regional budgets for public
services and development projects have increased
substantially.16 In FY 2013/14, the Union
allocated 3.4 percent of the national budget to state
and region loans and grants. The budgeted amount
increased to 7.6 percent of the budget in the FY
2014/15 and 8.7 percent of the budget, or MMK
1.8 trillion, in FY 2015/16. 17 (See figure 1.)
Union allocations to all states and regions as a percentage of the national budget for FY 2013/14.
FY 2013/14 FY 2014/15 FY 2015/16
3.4%7.6% 8.7%
10
SHARING THE WEALTH: A ROADMAP FOR DISTRIBUTING MYANMAR’S NATURAL RESOURCE REVENUES
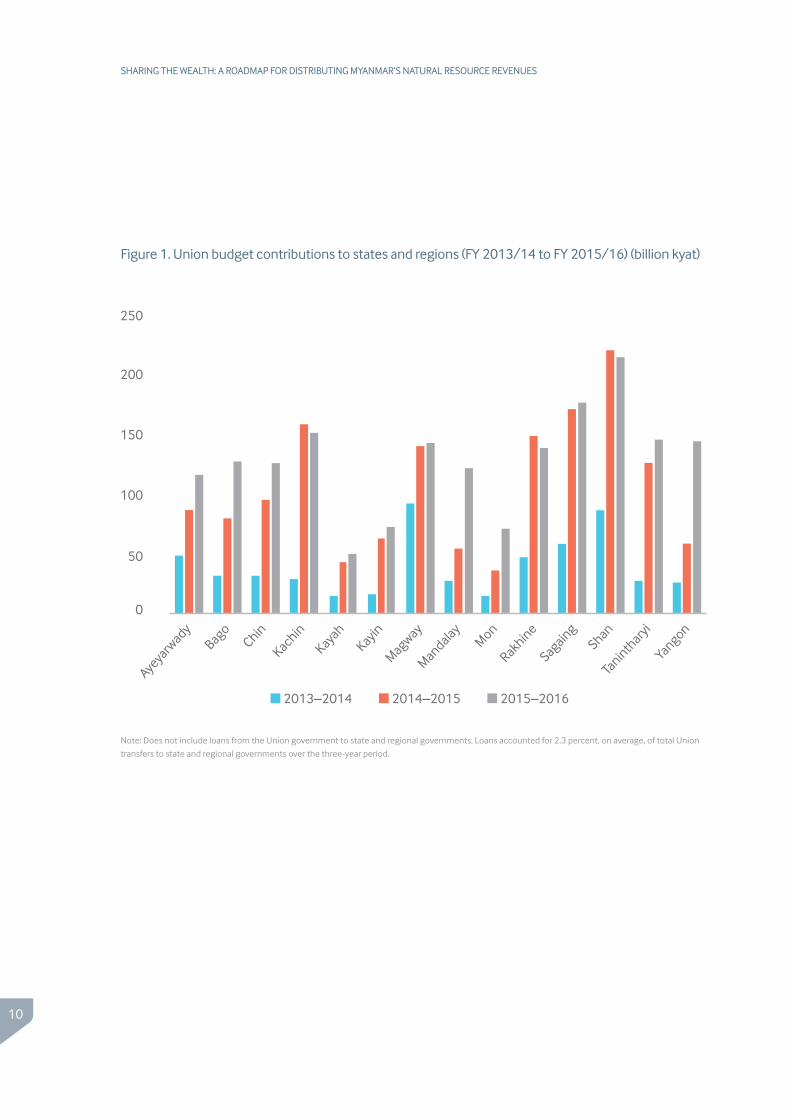
Figure 1. Union budget contributions to states and regions (FY 2013/14 to FY 2015/16) (billion kyat)
Ayeyarwady
Bago
ChinKachin
Kayah
KayinMagway
Mandalay
MonRakhineSagaing
ShanTa
ninthary
iYangon
■ 2013–2014 ■ 2014–2015 ■ 2015–2016
250
200
150
100
50
0
Note: Does not include loans from the Union government to state and regional governments. Loans accounted for 2.3 percent, on average, of total Union
transfers to state and regional governments over the three-year period.
11
SHARING THE WEALTH: A ROADMAP FOR DISTRIBUTING MYANMAR’S NATURAL RESOURCE REVENUES
18 SEEs must pay 20 percent of after tax profits to the state or region where they operate.19 Lynn, Thet Aung, and Mari Oye (2014) Natural Resources and Subnational Governments in Myanmar: Key Considerations for Wealth
Sharing. IGC-MDRI-The Asia Foundation. Discussion Paper No. 4; World Bank (2015) Myanmar Public Expenditure Review 2015. World Bank Group, September 2015.
20 World Bank (2015) Myanmar Public Expenditure Review 2015. World Bank Group, September 2015.21 Local development funds typically fund small-scale infrastructure projects such as small bridges, roads between villages and
drainage and irrigation projects. They are usually managed under the supervision of both local government and a locally elected fund management committee. For more information see Robertson, Bart et al. (2015) Local Development Funds in Myanmar: An Initial Review. MDRI-Action Aid-Asia Foundation. Online: http://asiafoundation.org/publications/pdf/1548.
22 Interviews with Kachin government representative on 02/05/2014 and Ministry of Finance on 09/07/2015.23 Exchange rate from January 1, 2016. USD 1 = MMK 1,285
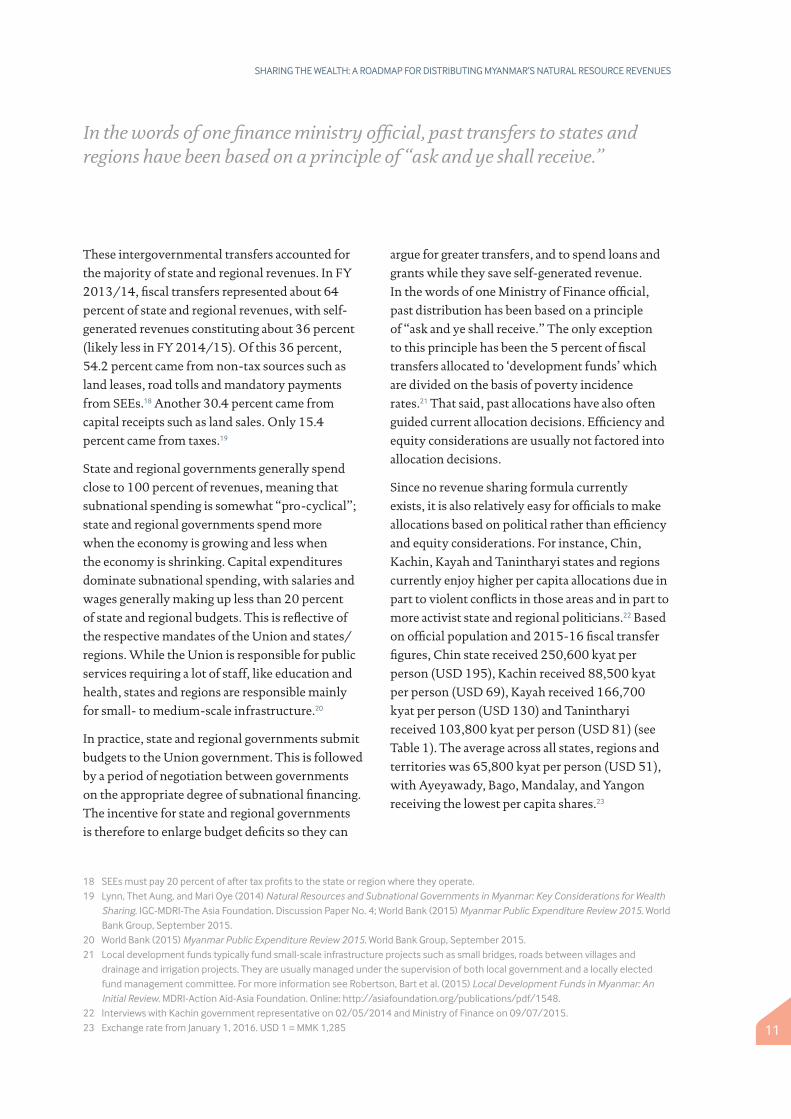
These intergovernmental transfers accounted for
the majority of state and regional revenues. In FY
2013/14, fiscal transfers represented about 64
percent of state and regional revenues, with self-
generated revenues constituting about 36 percent
(likely less in FY 2014/15). Of this 36 percent,
54.2 percent came from non-tax sources such as
land leases, road tolls and mandatory payments
from SEEs.18 Another 30.4 percent came from
capital receipts such as land sales. Only 15.4
percent came from taxes.19
State and regional governments generally spend
close to 100 percent of revenues, meaning that
subnational spending is somewhat “pro-cyclical”;
state and regional governments spend more
when the economy is growing and less when
the economy is shrinking. Capital expenditures
dominate subnational spending, with salaries and
wages generally making up less than 20 percent
of state and regional budgets. This is reflective of
the respective mandates of the Union and states/
regions. While the Union is responsible for public
services requiring a lot of staff, like education and
health, states and regions are responsible mainly
for small- to medium-scale infrastructure.20
In practice, state and regional governments submit
budgets to the Union government. This is followed
by a period of negotiation between governments
on the appropriate degree of subnational financing.
The incentive for state and regional governments
is therefore to enlarge budget deficits so they can
argue for greater transfers, and to spend loans and
grants while they save self-generated revenue.
In the words of one Ministry of Finance official,
past distribution has been based on a principle
of “ask and ye shall receive.” The only exception
to this principle has been the 5 percent of fiscal
transfers allocated to ‘development funds’ which
are divided on the basis of poverty incidence
rates.21 That said, past allocations have also often
guided current allocation decisions. Efficiency and
equity considerations are usually not factored into
allocation decisions.
Since no revenue sharing formula currently
exists, it is also relatively easy for officials to make
allocations based on political rather than efficiency
and equity considerations. For instance, Chin,
Kachin, Kayah and Tanintharyi states and regions
currently enjoy higher per capita allocations due in
part to violent conflicts in those areas and in part to
more activist state and regional politicians.22 Based
on official population and 2015-16 fiscal transfer
figures, Chin state received 250,600 kyat per
person (USD 195), Kachin received 88,500 kyat
per person (USD 69), Kayah received 166,700
kyat per person (USD 130) and Tanintharyi
received 103,800 kyat per person (USD 81) (see
Table 1). The average across all states, regions and
territories was 65,800 kyat per person (USD 51),
with Ayeyawady, Bago, Mandalay, and Yangon
receiving the lowest per capita shares.23
In the words of one finance ministry official, past transfers to states and regions have been based on a principle of “ask and ye shall receive.”
12
SHARING THE WEALTH: A ROADMAP FOR DISTRIBUTING MYANMAR’S NATURAL RESOURCE REVENUES
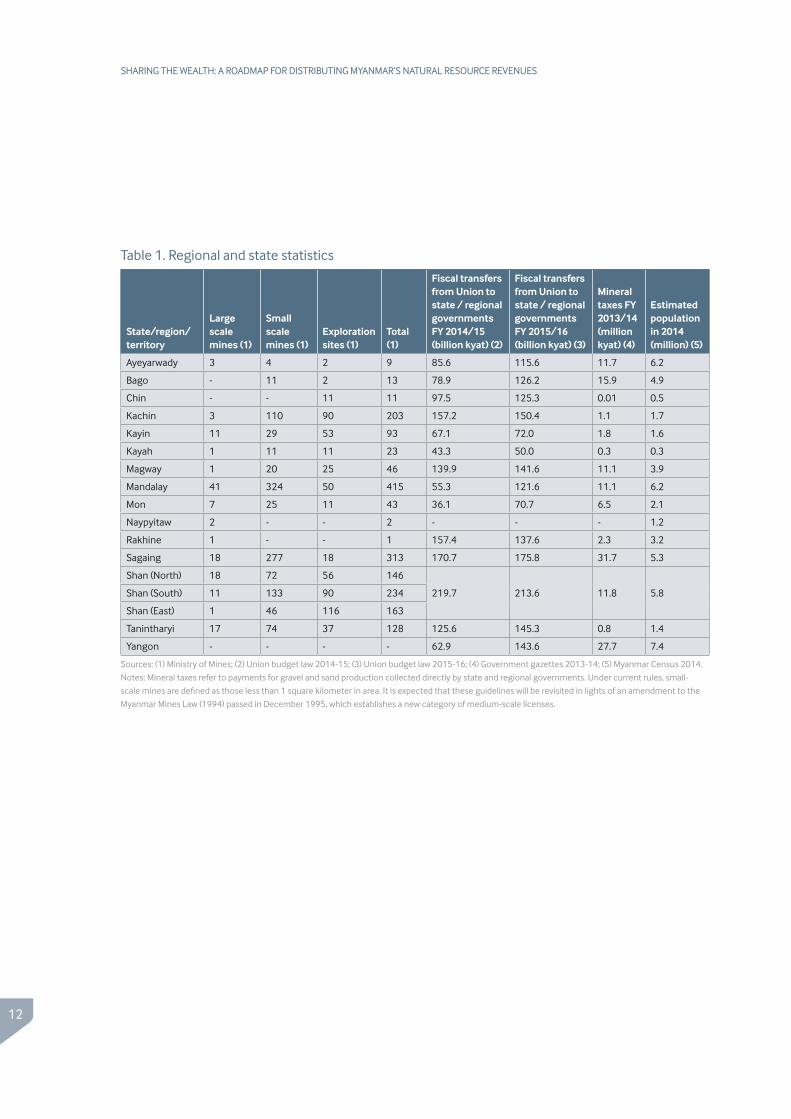
Table 1. Regional and state statistics
State/region/territory
Large scale mines (1)
Small scale mines (1)
Exploration sites (1)
Total (1)
Fiscal transfers from Union to state / regional governments FY 2014/15 (billion kyat) (2)
Fiscal transfers from Union to state / regional governments FY 2015/16 (billion kyat) (3)
Mineral taxes FY 2013/14 (million kyat) (4)
Estimated population in 2014 (million) (5)
Ayeyarwady 3 4 2 9 85.6 115.6 11.7 6.2
Bago - 11 2 13 78.9 126.2 15.9 4.9
Chin - - 11 11 97.5 125.3 0.01 0.5
Kachin 3 110 90 203 157.2 150.4 1.1 1.7
Kayin 11 29 53 93 67.1 72.0 1.8 1.6
Kayah 1 11 11 23 43.3 50.0 0.3 0.3
Magway 1 20 25 46 139.9 141.6 11.1 3.9
Mandalay 41 324 50 415 55.3 121.6 11.1 6.2
Mon 7 25 11 43 36.1 70.7 6.5 2.1
Naypyitaw 2 - - 2 - - - 1.2
Rakhine 1 - - 1 157.4 137.6 2.3 3.2
Sagaing 18 277 18 313 170.7 175.8 31.7 5.3
Shan (North) 18 72 56 146
219.7 213.6 11.8 5.8Shan (South) 11 133 90 234
Shan (East) 1 46 116 163
Tanintharyi 17 74 37 128 125.6 145.3 0.8 1.4
Yangon - - - - 62.9 143.6 27.7 7.4
Sources: (1) Ministry of Mines; (2) Union budget law 2014-15; (3) Union budget law 2015-16; (4) Government gazettes 2013-14; (5) Myanmar Census 2014.
Notes: Mineral taxes refer to payments for gravel and sand production collected directly by state and regional governments. Under current rules, small-
scale mines are defined as those less than 1 square kilometer in area. It is expected that these guidelines will be revisited in lights of an amendment to the
Myanmar Mines Law (1994) passed in December 1995, which establishes a new category of medium-scale licenses.
13
SHARING THE WEALTH: A ROADMAP FOR DISTRIBUTING MYANMAR’S NATURAL RESOURCE REVENUES
24 According to poverty indicators and the 2014 Myanmar census, Ayayarwady, Chin, Magway, Shan, Rakhine and Tanintharyi are the least developed states and regions in Myanmar.
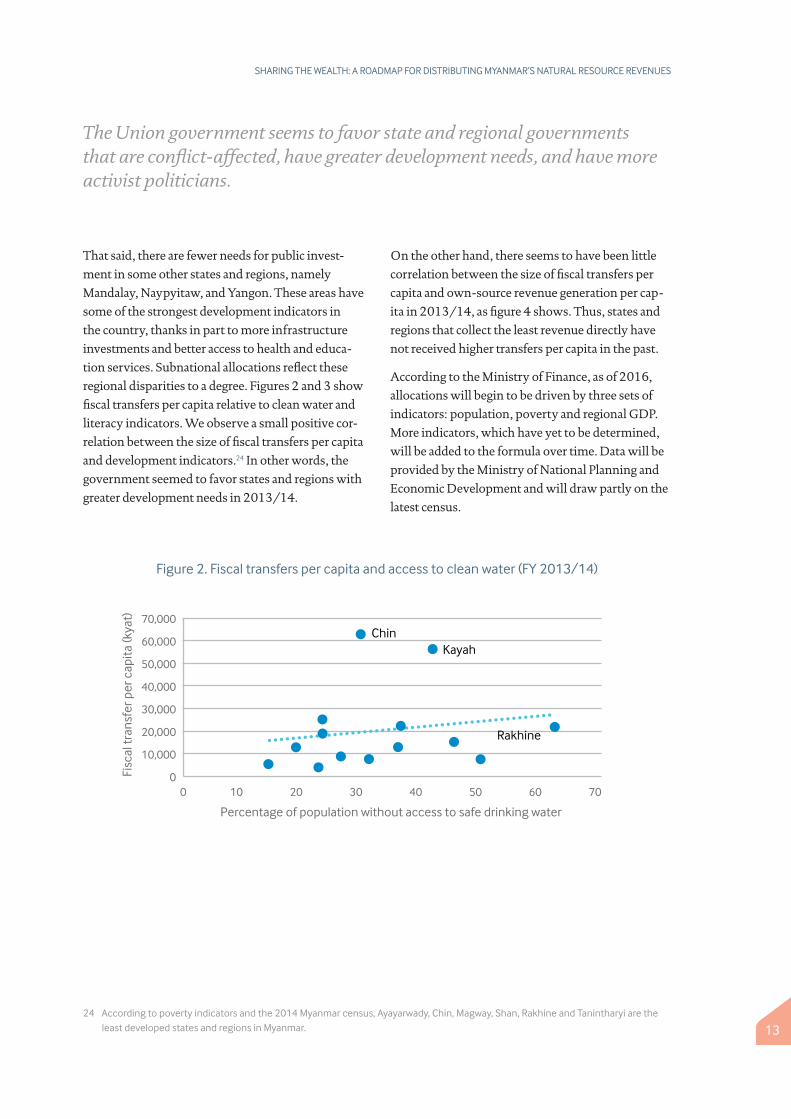
That said, there are fewer needs for public invest-
ment in some other states and regions, namely
Mandalay, Naypyitaw, and Yangon. These areas have
some of the strongest development indicators in
the country, thanks in part to more infrastructure
investments and better access to health and educa-
tion services. Subnational allocations reflect these
regional disparities to a degree. Figures 2 and 3 show
fiscal transfers per capita relative to clean water and
literacy indicators. We observe a small positive cor-
relation between the size of fiscal transfers per capita
and development indicators.24 In other words, the
government seemed to favor states and regions with
greater development needs in 2013/14.
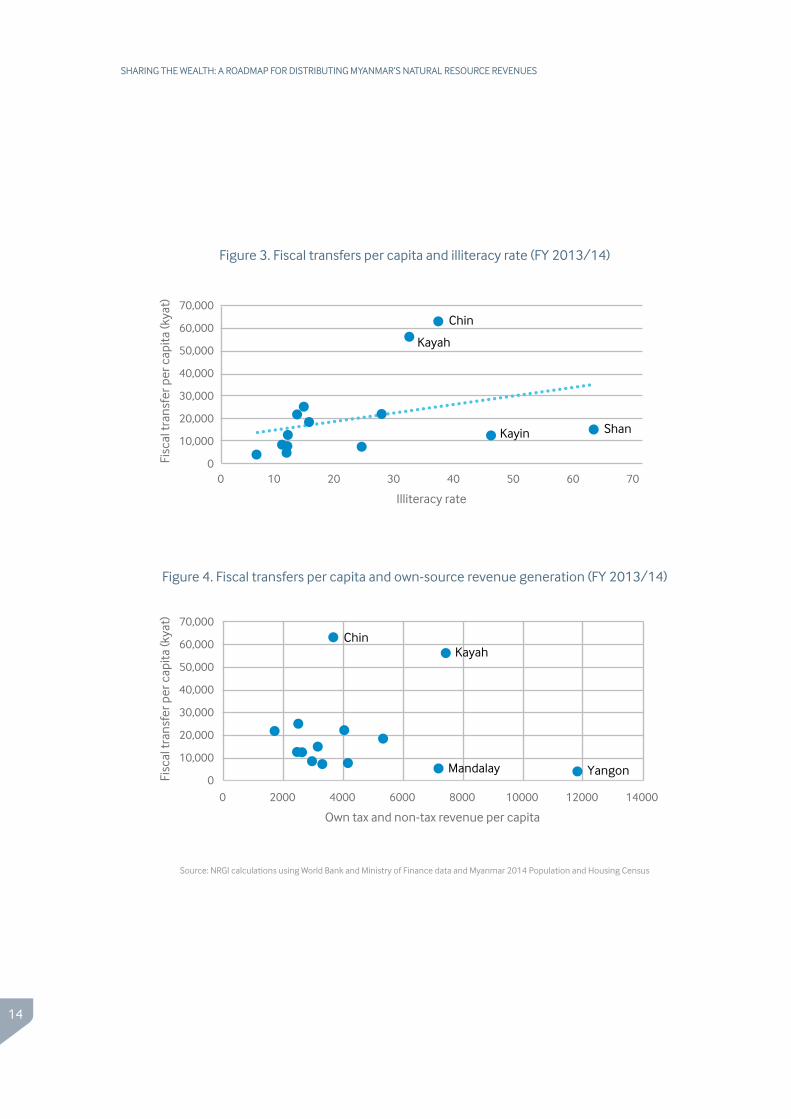
On the other hand, there seems to have been little
correlation between the size of fiscal transfers per
capita and own-source revenue generation per cap-
ita in 2013/14, as figure 4 shows. Thus, states and
regions that collect the least revenue directly have
not received higher transfers per capita in the past.
According to the Ministry of Finance, as of 2016,
allocations will begin to be driven by three sets of
indicators: population, poverty and regional GDP.
More indicators, which have yet to be determined,
will be added to the formula over time. Data will be
provided by the Ministry of National Planning and
Economic Development and will draw partly on the
latest census.
0
10,000
20,000
30,000
40,000
50,000
60,000
70,000
0 10 20 30 40 50 60 70
Fisc
al tr
ansf
er p
er c
apita
(kya
t)
Percentage of population without access to safe drinking water
Rakhine
KayahChin
Figure 2. Fiscal transfers per capita and access to clean water (FY 2013/14)
The Union government seems to favor state and regional governments that are conflict-affected, have greater development needs, and have more activist politicians.
14
SHARING THE WEALTH: A ROADMAP FOR DISTRIBUTING MYANMAR’S NATURAL RESOURCE REVENUES
Chin
Shan
Kayah
Kayin
0
10,000
20,000
30,000
40,000
50,000
60,000
70,000
Fisc
al tr
ansf
er p
er c
apita
(kya
t)
0 10 20 30 40 50 60 70
Illiteracy rate
KayahChin
YangonMandalay0
10,000
20,000
30,000
40,000
50,000
60,000
70,000
Fisc
al tr
ansf
er p
er c
apita
(kya
t)
0 2000 4000 6000 8000 10000 12000 14000
Own tax and non-tax revenue per capita
Figure 3. Fiscal transfers per capita and illiteracy rate (FY 2013/14)
Figure 4. Fiscal transfers per capita and own-source revenue generation (FY 2013/14)
Source: NRGI calculations using World Bank and Ministry of Finance data and Myanmar 2014 Population and Housing Census
15
SHARING THE WEALTH: A ROADMAP FOR DISTRIBUTING MYANMAR’S NATURAL RESOURCE REVENUES
25 Garcia, Jacobo G. (2015) Oil boom’s end threatens pain for much of Latin America, Associated Press, Feb 25. http://bigstory.ap.org/article/d5dbf417515e42fdb464b0706fa5b043/oil-booms-end-threatens-pain-much-latin-america.
26 See Bauer (2013) for more information on subnational resource revenue management.
DECENTRALIZATION AND DEVOLUTION PROCESS IN MYANMAR
A process of decentralization and devolution is
currently underway in Myanmar. In the education
and health sectors, both Union responsibilities,
some hiring and capital spending decisions have
been devolved to Union government staff based in
the states and regions. And in the housing, small
infrastructure, forest management and agriculture
sectors, for instance, state and regional governments
have direct responsibilities to legislate and
implement certain activities.
Fiscal decentralization has followed administrative
decentralization. Even as general fiscal revenues
have grown, the government has allocated a greater
percentage of the budget to the states and regions
each year over the past three years. Yet larger fiscal
transfers bring risks. As Nixon and Joelene (2014)
note, “given the limited expenditure responsibilities
currently devolved to state and region control,
further increases in the state and region budgets
may in fact take resources away from essential social
and economic services that are in the Union budget
– for example by overfunding local services at the
cost of education or health. […] Such a situation in
which local governments were able to overspend
while central government became cash-strapped
occurred in China in the mid-1990s, during a
similar ‘revenue-led’ fiscal decentralization.” Since
education, health and large infrastructure projects
are still under Union jurisdiction (even if health
and education sector implementation is carried out
mostly at the state and regional level by national
authorities), significantly large supplementary
subnational transfers could starve these key growth-
generating sectors of financing.
Additionally, an increase in subnational trans-
fers without a corresponding increase in fiscal
responsibilities could lead to wasteful spending.
Resource-rich regions are particularly susceptible
to this problem, especially in countries that have
a resource-specific revenue sharing system. In
Colombia, for instance, the municipality of Puerto
Gaitán saw its local budget balloon by a factor of 100
as a result of increased oil revenue transfers. While
some useful infrastructure was built, such as state-
of-the-art schools, much of the “windfall” revenue
was wasted. For example, the town built an expen-
sive amphitheater and a concrete arch monument.
Today, as oil prices have plummeted, the town is
in depression.25 A wiser course of action may have
been to “park” some revenues for use when oil pric-
es declined and prioritize immediate spending on
education, health and growth-enhancing infrastruc-
ture (e.g., roads, water), preferably aligned with a
costed multi-year local development plan.26
Subnational government capacity to spend is a
major challenge in Myanmar. This problem is likely
to become more acute as the government further
devolves powers to the states and regions. On the
other hand, should greater expenditure responsibil-
ities be assigned to subnational jurisdictions in the
future without adequate revenue transfers or reve-
nue generating capacity allocations, there is a risk of
creating unfunded liabilities.
In short, in order to have maximum impact, the
on-going reform effort would need to link new
sources of revenue with expenditure responsibil-
ities and be linked to local administrative capacity
building. This would require costing fiscal needs per
area of responsibility, clarifying the service delivery
responsibilities of each level of government and pro-
viding spending guidelines and training to subna-
tional governments.
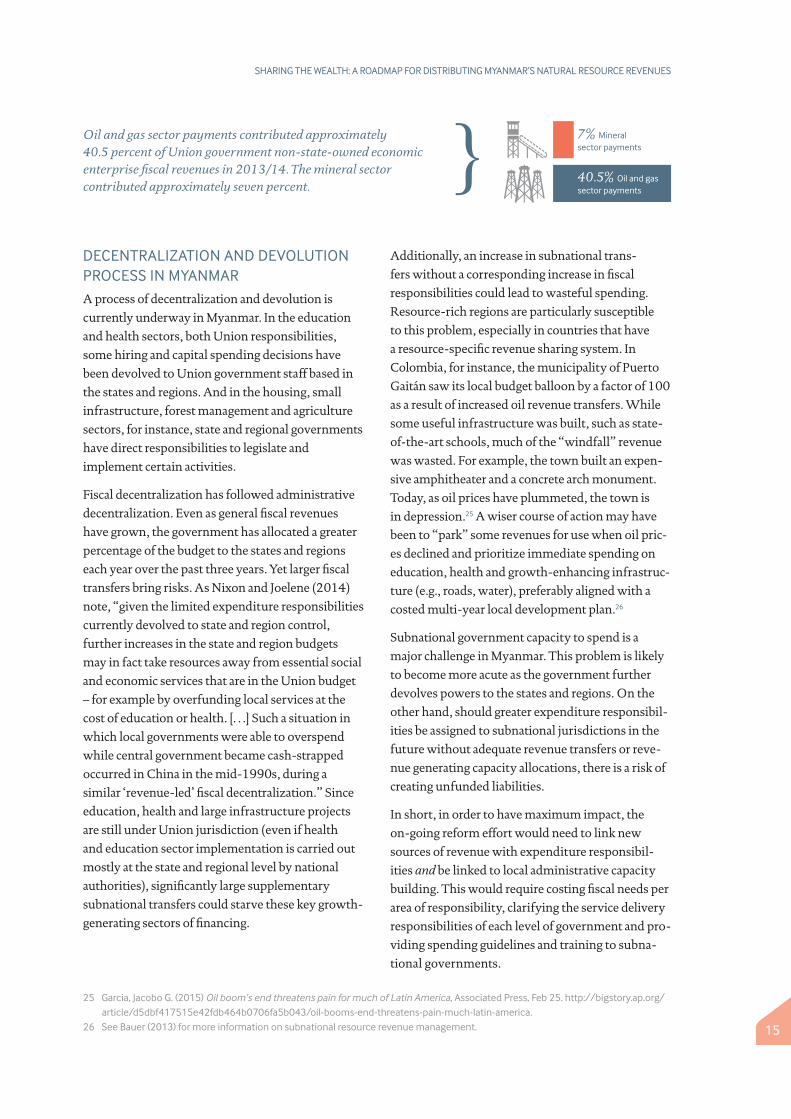
Oil and gas sector payments contributed approximately 40.5 percent of Union government non-state-owned economic enterprise fiscal revenues in 2013/14. The mineral sector contributed approximately seven percent.
7% Mineral sector payments
40.5% Oil and gas sector payments
16
SHARING THE WEALTH: A ROADMAP FOR DISTRIBUTING MYANMAR’S NATURAL RESOURCE REVENUES
27 World Bank (2015) Myanmar Public Expenditure Review 2015. World Bank Group, September 2015.28 Venugopal, Varsha (2014) Assessing Mineral Licensing in a Decentralized Context: The Case of Indonesia. Natural Resource
Governance Institute. Online: http://www.resourcegovernance.org/publications/assessing-mineral-licensing-decentralized-context-case-indonesia.
Box 2. Oil, gas and mineral tax assignments
The 2008 constitution allocates the vast majority of oil, gas and mineral taxation rights to the Union government. Within the extractive sector, states and regions may only tax gravel and sand producers. On more valuable oil, gas and mineral extraction they may only levy excise and land taxes.
Some groups in Myanmar have advanced the idea of direct taxation by subnational jurisdictions as a means for local governments to gain more control over revenues. In many countries, revenue allocations from the central government to local governments are delayed or uncertain. In response, a few countries have assigned significant extractive taxation authority or full or partial ownership to subnational jurisdictions (e.g., Argentina, Australia, Canada, India, United Arab Emirates). See the table opposite for more examples.
Some of the main arguments against significant tax assignments to subnational entities have to do with local governments’ capacities to manage revenue collection, negotiate contracts, enforce contracts, and manage volatile revenues. Sophisticated tax administrations and negotiation capacity are required when dealing with large oil and mining companies. Furthermore, resource taxes are fairly volatile and uncertain, which can destabilize resource-dependent local governments. National governments are usually better equipped to negotiate and enforce contracts, collect resource revenues and smooth fiscal transfers than subnational governments.
Myanmar’s tax administration is already fragmented and lacking capacity. At least seven different ministries collect taxes and fees. Taxpayer identification numbers do not yet exist. Data management systems are outdated and the Internal Revenue Department (IRD) is understaffed.
This has led to significant tax arrears, a high degree of tax avoidance, and an inability to properly account for all government revenues, issues the IRD is currently addressing. While these challenges might warrant the decentralization of tax collection to subnational governments—linking regional and state politicians to local citizens and in doing so improving subnational government accountability—such a policy would further fragment tax administration. It would also transfer these powers to bodies with weak capacity to manage tax collection.27
Dual licensing when tax assignments are shared presents an additional challenge. Where both national and local governments are allowed to license mines, we often witness over-licensing by local authorities eager for additional sources of revenue. We also see a lack of coordination between the national and local governments. This can lead to overlapping claims, environmental degradation and loss of resource revenues over the long-term, as we have seen in Indonesia.28
17
SHARING THE WEALTH: A ROADMAP FOR DISTRIBUTING MYANMAR’S NATURAL RESOURCE REVENUES
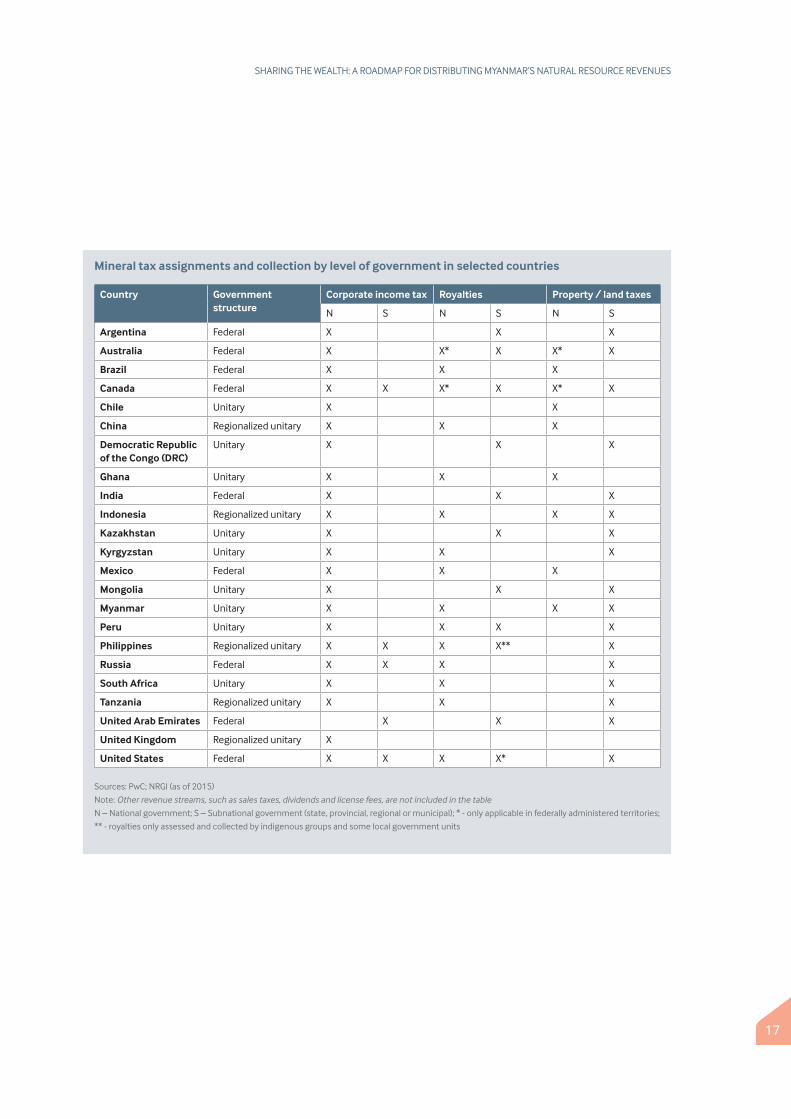
Mineral tax assignments and collection by level of government in selected countries
Country Government structure
Corporate income tax Royalties Property / land taxes
N S N S N S
Argentina Federal X X X
Australia Federal X X* X X* X
Brazil Federal X X X
Canada Federal X X X* X X* X
Chile Unitary X X
China Regionalized unitary X X X
Democratic Republic of the Congo (DRC)
Unitary X X X
Ghana Unitary X X X
India Federal X X X
Indonesia Regionalized unitary X X X X
Kazakhstan Unitary X X X
Kyrgyzstan Unitary X X X
Mexico Federal X X X
Mongolia Unitary X X X
Myanmar Unitary X X X X
Peru Unitary X X X X
Philippines Regionalized unitary X X X X** X
Russia Federal X X X X
South Africa Unitary X X X
Tanzania Regionalized unitary X X X
United Arab Emirates Federal X X X
United Kingdom Regionalized unitary X
United States Federal X X X X* X
Sources: PwC; NRGI (as of 2015)
Note: Other revenue streams, such as sales taxes, dividends and license fees, are not included in the table
N – National government; S – Subnational government (state, provincial, regional or municipal); * - only applicable in federally administered territories;
** - royalties only assessed and collected by indigenous groups and some local government units
18
SHARING THE WEALTH: A ROADMAP FOR DISTRIBUTING MYANMAR’S NATURAL RESOURCE REVENUES
29 British Petroleum Statistical Review of World Energy – June 2015, accessed on November 15, 2015, https://www.bp.com/content/dam/bp/pdf/energy-economics/statistical-review-2015/bp-statistical-review-of-world-energy-2015-full-report.pdf; Fong-Sam, Yolanda (2014) “The Mineral Industry of Burma” in 2012 Minerals Yearbook: Burma (ed. U.S. Geological Survey) Washington DC: U.S. Department of the Interior. Online: http://minerals.usgs.gov/minerals/pubs/country/2012/myb3-2012-bm.pdf.
30 Moore Stephens (2015) MEITI Reconciliation Scoping Study MSG – meeting, 17 September 2015, powerpoint presentation.31 United Nations International Trade Statistics Database, accessed November 15, 2015. http://comtrade.un.org/db/default.aspx 32 Global Witness (2015) Jade: Myanmar’s “Big State Secret”. October 2015. Online: https://www.globalwitness.org/en-gb/campaigns/
oil-gas-and-mining/myanmarjade/.
LOCATION OF NON-RENEWABLE NATURAL RESOURCES AND SCALE OF RESOURCE REVENUES
Minerals
As of 2013, there were large-scale mines operating
in all but two states and regions (not including
Yangon) and there were active legal mines in all but
Chin state. Among the most important of these
are the Letpudaung copper mine in Sagaing region;
Tagaung Taung nickel mine in Sagaing region;
jade mines around Hpakant township in Kachin
state; ruby and sapphire mines in Mandalay region
(Mogok) and Shan state (Mong Hsu); and the
Kyaukpahto and Modi Taung gold mines in Sagaing
and Mandalay regions, respectively.
Exploration activities are also underway in nearly
every state or region (see Table 1). Among the most
promising deposits are iron ore in Kachin, Bago
and Shan states, lead and zinc in Shan, and gold in
Mandalay and Sagaing. The government has plans
to expand copper, nickel and chromite production
at a minimum.29 The map in Figure 5 shows the
location of several large mines and the extent of
mineral occurrences.
Jade, rubies, sapphires, gold, nickel, copper and
limestone represent Myanmar’s most significant
mineral and quarrying exports. According to the
GOUM Central Statistics Office, the estimated
export value of Myanmar’s mineral resources in
2013/14 was USD 1.15 billion, not including
rubies, sapphires or coal. Jade represented over
USD 1 billion of the USD 1.15 billion. The
government officially collected at least USD
854.7 million in taxes, royalties and production
entitlements from all minerals in the same year.30
It is likely that the true value of exports and
production is much higher. The 2014 Myanmar
Gem Emporium alone generated USD 3.4 billion
in sales, while gold exports in 2012/13 were
valued at over USD 400 million. Foreign and
independent sources provide even larger estimates.
For instance, according to U.N. trade data, nearly
USD 12.3 billion in precious stones were exported
to China alone in 2014.31 Furthermore, an
independent assessment by Global Witness valued
gross jade production in Myanmar at roughly USD
31 billion in the same year.32 Accurately pricing
precious stones such as jade and our inability
to measure the scale of smuggling activities and
underreporting present methodological challenges
to calculating the value of mineral production. By
these estimates, however, actual mineral exports
were more than 10 times more valuable than what
was reported by the government.
19
SHARING THE WEALTH: A ROADMAP FOR DISTRIBUTING MYANMAR’S NATURAL RESOURCE REVENUES
33 Exchange rate is nominal 2013/14 dollars, same as that used in the MEITI report, which is based on an annual average exchange rate from FY 2013/14.
34 Myanmar Extractive Industries Transparency Initiative (2015) EITI Report for the Period April 2013-March 2014: Oil, Gas and Mineral Sectors. December 2015.
35 IMF data in World Bank (2015) Myanmar Public Expenditure Review 2015. World Bank Group, September 2015.36 Mang, Lun Min (2015) “Tensions rise in jade-rich Hpakant” The Myanmar Times, July 3, 201537 Government of Myanmar – Central Statistical Organization, accessed November 22, 2015, http://www.csostat.gov.mm/38 Chandler, Albert T. and Daw Khin Cho Kyi (2014) Myanmar Upstream Oil and Gas Sector. Presentation by Chandler & Thong-ek
Law Offices. Online: http://www.myanmarlegalservices.com/wp-content/uploads/2014/04/Myanmar-Upstream-Oil-Gas-Sector-7_280414_1255300_1.pdf
39 Myanmar Extractive Industries Transparency Initiative (2015) EITI Report for the Period April 2013-March 2014: Oil, Gas and Mineral Sectors. December 2015.
40 IMF data in World Bank (2015) Myanmar Public Expenditure Review 2015. World Bank Group, September 2015.
According to Myanmar’s Extractive Industries
Transparency Initiative (EITI) report, the
Union government collected MMK 442
billion (approximately USD 460 million) in
mineral revenues in 2013/14.33 Gems and jade
represented 88 percent of this amount. Great
Genesis Gems Company, Wai Aung Ka Bar and
Richest Gems Company were some of the largest
taxpayers.34 Mineral sector payments represented
approximately 7 percent of Union government
non-SEE fiscal revenues in 2013/14.35
It bears mentioning that Myanmar governments
are not the only tax collectors in the country.
Several ethnic armed groups also collect taxes
from mining companies. For instance, the Kachin
Independence Army (KIA) has established a fairly
formalized tax collection system in the Hpakant
jade mines. “There are about 40 to 50 joint venture
companies from China and Myanmar,” KIA Major
Teng Seng said. “We regularly take tax from them.
We have a good relationship.”36
Oil and gas
The sale value of oil and gas in 2012/13 was
estimated around USD 5 billion, with gas exports
alone accounting for nearly USD 3.7 billion.37
While most oil and gas production is currently
off-shore, pipelines run through many states. The
older gas network serving the Yadana and Yetagun
fields runs through Yangon, Bago, Mon and
Tanintharyi. The new Shwe oil and gas pipeline
passes through Rakhine, Magway, Mandalay and
Shan. (See figure 2.) As of April 2014, there were
also 17 onshore blocks producing oil or gas.38
Myanmar has not reached its full oil and gas
potential. The country has 10 trillion cubic feet
of proven natural gas reserves and significant
oil prospects—exploration and production
are ramping up. While much of the activity is
occurring offshore, there are at least 49 onshore
blocks in different phases of auction, exploration
or production. On-shore oil and gas companies
are active in nearly every state, especially Bago and
Magway. They are noticeably less active in Chin,
Shan, Kachin and Tanintharyi.
At present, the oil and gas sector generates
significantly more revenue for the government
than the mineral sector. According to Myanmar’s
first EITI report, published in January 2016, MMK
2,569 billion (approximately USD 2.7 billion)
was collected in oil and gas taxes, equity returns,
signature bonuses, custom duties, royalties and
in-kind production in FY 2013/14.39 Petronas
and TOTAL were by far the largest taxpayers in
the oil and gas sector. Oil and gas sector payments
represented approximately 40.5 percent of
estimated Union government non-SEE fiscal
revenues in 2013/14.40
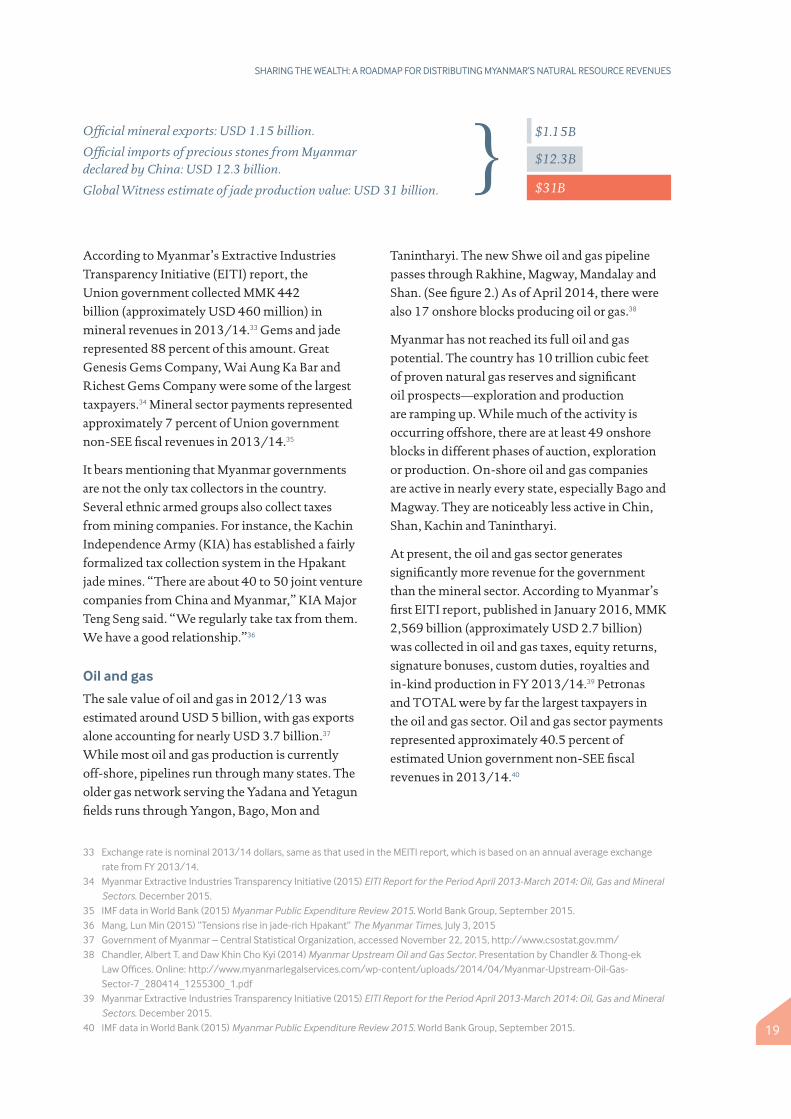
Official mineral exports: USD 1.15 billion.
Official imports of precious stones from Myanmar declared by China: USD 12.3 billion.
Global Witness estimate of jade production value: USD 31 billion. $31B
$12.3B
$1.15B

20
SHARING THE WEALTH: A ROADMAP FOR DISTRIBUTING MYANMAR’S NATURAL RESOURCE REVENUES
Figure 5. Map of extractive activities in Myanmar
Mapmaker: Thet Naing Oo
21
SHARING THE WEALTH: A ROADMAP FOR DISTRIBUTING MYANMAR’S NATURAL RESOURCE REVENUES
41 Interview with Ministry of Finance (24/06/2014)42 Interviews on 18/03/2014, 26/03/2014; Dickenson-Jones, Giles et al. (2015) State and Region Public Finances in Myanmar. MDRI-
IGC-The Asia Foundation. Discussion Paper No. 8. Online: http://asiafoundation.org/resources/pdfs/SRPublicFinancesENG.pdf.
Subnational extractive revenues
According to an interview with government
officials, the administration is not able to provide
comprehensive data on the breakdown of
extractive industry revenues flows by state or
region due to the inadequacy of the current public
financial management information system as well
as a lack of sector oversight.41 The only resource
revenue flows disaggregated by state or region are
mineral taxes, which are essentially surface taxes
for quarrying, sand extraction and production of
bricks, and represent less than 0.001 percent of
state and regional fiscal revenues. Consequently
we are only able to produce state and region budget
revenues and expenditures in the aggregate.
In addition to mineral taxes, state and regional
governments collect land taxes (5 kyat per acre)
and license fees from extractive companies.
According to the 2008 constitution, license fees
may not be collected by these governments.
However interviews with officials indicate that
they are nonetheless collected from small-scale
miners.42 Regional or state officials informally
allocate extraction licenses and the revenues they
generate go directly to subnational governments.
It is unclear whether or not they are recorded on
government balance sheets. Notwithstanding their
legality, combined these mining revenues usually
represent less than 1 percent of state or regional
government fiscal revenues.
As previously mentioned, Myanmar’s first EITI
report does not identify revenues on a state
or regional basis, though a list of licenses and
concessions by location is provided. The report also
does not cover self-administered zones, does not
provide project-by-project payment information,
and does not break down payments by company
and revenue stream—all necessary information
for implementation of a derivation-based natural
resource revenue sharing regime.
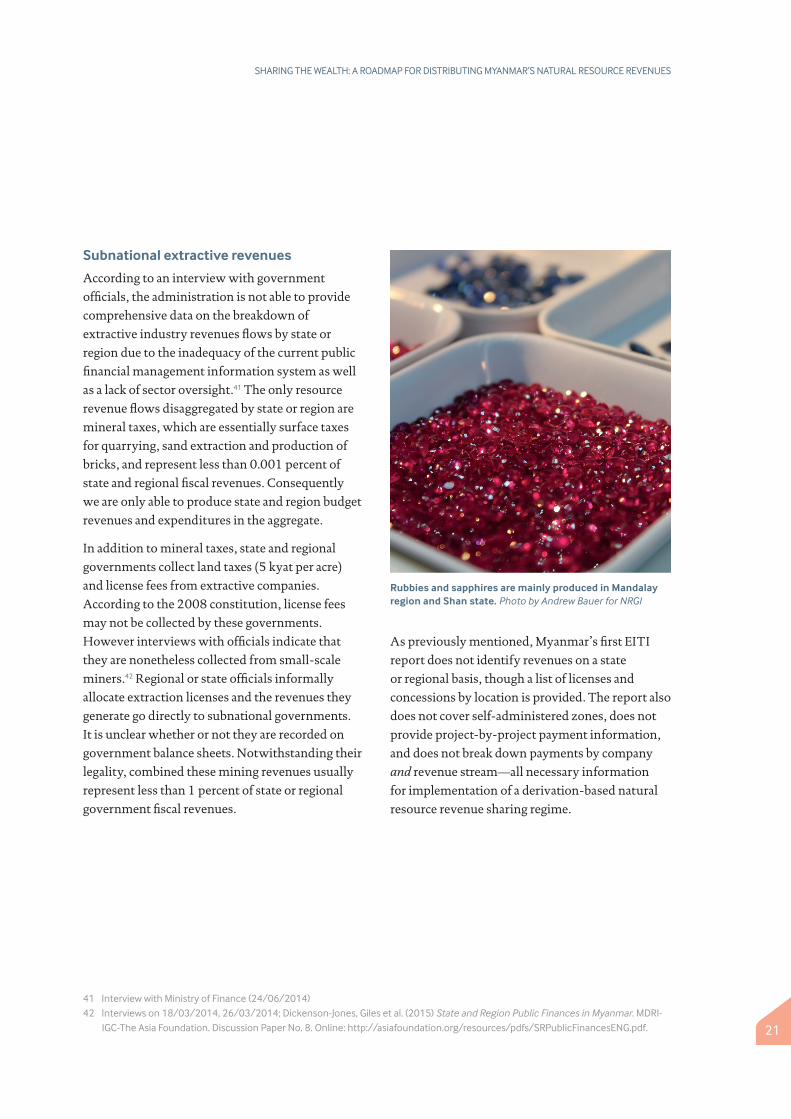
Rubbies and sapphires are mainly produced in Mandalay region and Shan state. Photo by Andrew Bauer for NRGI
22
SHARING THE WEALTH: A ROADMAP FOR DISTRIBUTING MYANMAR’S NATURAL RESOURCE REVENUES
43 Viale, Claudia (2011) Paradox in Peru: The Challenges of Mining Revenue in Ite. RWI Blog, 3 October 2011. http://www.resourcegovernance.org/news/blog/paradox-peru-challenges-mining-revenue-ite
44 Bauer, Andrew (2013) Subnational Oil, Gas and Mineral Revenue Management. Revenue Watch Institute. Online: http://www.resourcegovernance.org/sites/default/files/RWI_Sub_Oil_Gas_Mgmt_EN_rev1.pdf
The unique characteristics of oil, gas and minerals
pose a number of challenges for governments
establishing a resource-specific intergovernmental
transfer system. Non-renewable resources
are finite and revenues generated from them
are notoriously volatile, responding sharply
to fluctuations in commodity prices. These
characteristics imply that any large transfer linked
to these revenues could exacerbate the boom-bust
cycle in a producing region.
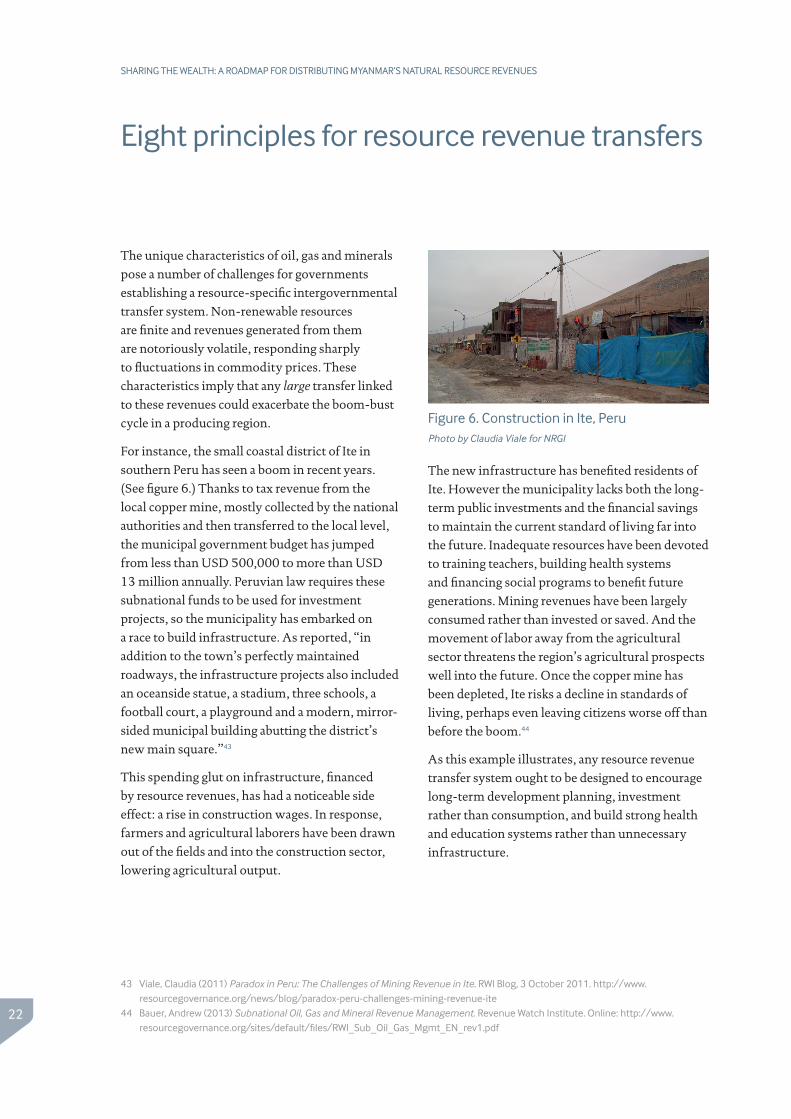
For instance, the small coastal district of Ite in
southern Peru has seen a boom in recent years.
(See figure 6.) Thanks to tax revenue from the
local copper mine, mostly collected by the national
authorities and then transferred to the local level,
the municipal government budget has jumped
from less than USD 500,000 to more than USD
13 million annually. Peruvian law requires these
subnational funds to be used for investment
projects, so the municipality has embarked on
a race to build infrastructure. As reported, “in
addition to the town’s perfectly maintained
roadways, the infrastructure projects also included
an oceanside statue, a stadium, three schools, a
football court, a playground and a modern, mirror-
sided municipal building abutting the district’s
new main square.”43
This spending glut on infrastructure, financed
by resource revenues, has had a noticeable side
effect: a rise in construction wages. In response,
farmers and agricultural laborers have been drawn
out of the fields and into the construction sector,
lowering agricultural output.
The new infrastructure has benefited residents of
Ite. However the municipality lacks both the long-
term public investments and the financial savings
to maintain the current standard of living far into
the future. Inadequate resources have been devoted
to training teachers, building health systems
and financing social programs to benefit future
generations. Mining revenues have been largely
consumed rather than invested or saved. And the
movement of labor away from the agricultural
sector threatens the region’s agricultural prospects
well into the future. Once the copper mine has
been depleted, Ite risks a decline in standards of
living, perhaps even leaving citizens worse off than
before the boom.44
As this example illustrates, any resource revenue
transfer system ought to be designed to encourage
long-term development planning, investment
rather than consumption, and build strong health
and education systems rather than unnecessary
infrastructure.
Eight principles for resource revenue transfers
Figure 6. Construction in Ite, PeruPhoto by Claudia Viale for NRGI
23
SHARING THE WEALTH: A ROADMAP FOR DISTRIBUTING MYANMAR’S NATURAL RESOURCE REVENUES
45 Kurlyandskaya, Galine et al. (2010) Oil and Gas in the Russian Federation. Conference on Oil and Gas in Federal Systems, March 3-4, 2010. Online: http://siteresources.worldbank.org/EXTOGMC/Resources/336929-1266445624608/Framework_Paper_Russian_Federation2.pdf
However there is no one-size-fits-all system
for revenue sharing; global practices governing
intergovernmental transfers vary widely. At one
extreme, in unitary states like Afghanistan, Algeria,
and Saudi Arabia, the national government collects
all resource revenues and manages most subnational
authorities directly. At the opposite extreme, the
United Arab Emirates is completely decentralized.
Each emirate collects taxes and royalties directly
from extractive companies and shares a portion of
these revenues with the central government.
Between these extremes are federal and fiscally
decentralized unitary states. In most federal
states, like Argentina, Australia, Canada, India
and the United States, taxation is shared between
the national and subnational governments and
there is some degree of revenue transfer between
regions. By and large, general taxes like corporate
income taxes and withholding taxes are paid to the
national government while mineral-specific taxes
such as royalties are paid to the state or provincial
government, though details vary (see Box 1). In
fiscally decentralized unitary states like Bolivia,
Indonesia, Norway, Peru and the Philippines, most
resource revenues are collected by the national
government and there are significant transfers to
subnational governments to provide public services.
Exceptions do exist. Iraq, for instance, is officially
a federal state. Yet in practice resource revenue
management is fairly centralized, with the national
government collecting nearly all resource revenues
and redistributing them to subnational authorities
on a near ad hoc basis. Analogously, the Russian
Federation has full control over natural resource
revenues except in the case of three production
sharing agreements (PSAs) that require companies
to make direct transfers to the oblasts (provincial
administrative divisions) of Sakhalin and Nenets.
Until 2002, of the oil revenues collected by the
national government, 60 percent were transferred
directly to subnational authorities where
production was taking place. Since then, revenues
have slowly been centralized. Today, only property
taxes and 60 percent of rental fees are collected by
the oblasts; all other fiscal transfers are made at the
discretion of the federal government.45 In Brazil,
another federal state, all major sources of revenue
from the mineral sector are collected by the
national government and redistributed based on a
formula. In contrast, mineral royalties are collected
by the states in Kazakhstan, a unitary country.
In both federal and unitary states, direct tax
collection from extractive activities can constitute
a significant proportion of local budgets. From
2012-14, over 25 percent of all fiscal revenues
collected in Alberta, Canada came from direct
petroleum taxation. In Ghana, property rates
collected from a single mining company, Anglo
Gold Ashanti, have constituted on average 17
percent of Obuasi district’s fiscal revenues over the
last five years.
Countries that distribute natural resource revenues
to subnational authorities via an intergovernmental
transfer system can be grouped according to the
degree of de jure derivation, meaning what is
written in law. In one group are countries where
24
SHARING THE WEALTH: A ROADMAP FOR DISTRIBUTING MYANMAR’S NATURAL RESOURCE REVENUES
46 In public finance, a clawback provision refers to an increase in subnational revenues leading to a proportionate or disproportionate decrease in fiscal transfers from the central government.
all resource revenues are pooled centrally with
revenue from other sources and form part of
regular transfers to subnational governments that
do not treat resource revenues any differently from
non-resource revenues, such as Algeria, Chile,
Norway or Vietnam. General intergovernmental
transfers constitute the majority of subnational
financing around the world.
In a second group are countries that have created
a unique intergovernmental transfer system for
natural resource revenues without allocating a
significantly larger portion to producing regions,
such as Mexico.
In a third group are countries that separate out
natural resource revenues and make allocations
from this pool to producing regions or
communities using a legislated derivation-based
formula. This list includes Brazil, Colombia,
Democratic Republic of the Congo (DRC),
Ecuador, Ghana, Indonesia, Iraq, Mongolia,
Nigeria, Papua New Guinea, the Philippines,
South Sudan, Uganda, and Venezuela. Malaysia
has a similar system whereby a fixed 5 percent
royalty is given to producing states according
to an agreement with Petronas, the national
oil company. Bolivia, Peru and the Canadian
territories (treated differently than the provinces)
would also fit into this category, though significant
“clawback” provisions generally leave producing
regions without significantly larger transfers than
non-producing regions.46
Many resource-rich subnational governments in
countries with derivation-based formulas are fairly
dependent on these resource revenue transfers.
In 2014, oil, gas and mining revenue transfers
constituted 27 percent of fiscal revenues in the oil-
rich Indonesian regency of Bojonegoro. Revenue
projections indicate that once oil production peaks
in 2017, more than 50 percent of fiscal revenues
will come from extractive-related transfers. In
Nigeria and Peru, more than 80 percent of some
regional governments’ budgets depend on resource
revenue transfers from central governments.
Countries can have mixed systems. Nigeria, for
instance, allocates no less than 13 percent of oil
revenues to states according to each state’s level
of production. The remaining 87 percent of oil
revenues is then pooled with other fiscal revenues.
Of this new general pool, about 47 percent is
allocated to states and municipalities according
to a formula which includes population, social
development and revenue generation effort
indicators. The remaining 53 percent is allocated to
the central government. Thus, the system is a mix
of a general intergovernmental transfer system and
a derivation-based system (groups 1 and 3).
Mongolia also has a mixed system whereby
5 percent of mining royalties and 30 percent
of petroleum royalties are pooled and then
redistributed to aimags (provinces) and the
capital city according to a formula that includes
population, population density, remoteness, size
of the territory, development indicators, and tax
generating capacity. Additionally, 30 percent of
mining royalties go directly to mining aimags.
What’s more, 50 percent of license fees will go
directly to the mining aimag’s local development
fund. Thus, the Mongolian system is a mix
between a special transfer system for natural
resource revenues and a derivation-based system
(groups 2 and 3).
25
SHARING THE WEALTH: A ROADMAP FOR DISTRIBUTING MYANMAR’S NATURAL RESOURCE REVENUES
47 Vinuela, Lorena et al. (2014) Intergovernmental Fiscal Management in Natural Resource-Rich Settings. World Bank Report No. 91343-GLB. Online: http://documents.worldbank.org/curated/en/2014/01/20302404/intergovernmental-fiscal-management-natural-resource-rich-settings
48 The Natural Resource Charter (NRC) is a set of principles for governments and societies on how to best harness the opportunities created by extractive resources for development. The Charter and other information can be found at www.naturalresourcecharter.org. A NRC benchmarking exercise has been carried out in Myanmar.
49 Bahl, Roy (2004). Revenue Sharing in Petroleum States. Petroleum Revenue Management Workshop Proceedings (p. 162). Washington: ESMAP; ESMAP (2005) Comparative Study on the Distribution of Oil Rents in Bolivia, Colombia, Ecuador, and Peru. Washington, DC, ESMAP (Joint UNDP/World Bank Energy Sector Management Assistance Programme: 142); Morgandi, Matteo (2008) Extractive Industries Revenues Distribution at the Sub-National Level. Revenue Watch Institute. Online: http://www.resourcegovernance.org/publications/extractive-industries-revenues-distribution-subnational-level; Qiao, Baoyun and Anwar Shah (2008) Natural Resource Revenue Sharing: Principles and Practices. Working Paper.
Similarly, Iraq has a legislated derivation-based
“petrodollar” system that allocates at least 1 USD
per barrel produced to the governorates. However
it also allocates 17 percent of all oil revenues (minus
5 percent to Kuwait for reparations and the cost of
exports to Turkey) to the oil-producing Kurdish
Regional Government (KRG), regardless of level
of production or revenues generated in that region.
Thus, the Iraqi system is a mix between a special
transfer system for natural resource revenues and a
derivation-based system (groups 2 and 3).
The KRG allocation in Iraq is also an example
of an ad hoc revenue sharing system. The fiscal
arrangement between the national and subnational
authorities is a product of a political agreement
which set a precedent rather than a law. Kazakhstan
has a similar ad hoc arrangement: the oil-rich (and
conflict-affected) regions of Atyrau and Mangistau
have usually received higher per capita transfers
than other oblasts. The United Arab Emirates, in
contrast, is the sole example of an upward revenue
sharing arrangement. In this case, fiscal transfers
from the oil-producing emirates to the center are
made on an ad hoc basis.47
While in most cases legislation improves stability
and predictability of these intergovernmental
transfers, fostering good subnational budget
planning, legal requirements do not always ensure
that local governments receive their entitlements.
The DRC mining code, for instance, states that
producing provinces should retain 40 percent
of the royalties derived from minerals extracted
from their territory. Compliance with the rule is
weak. Additionally, the lack of information on
fiscal transfers from either central or provincial
government authorities prevents verification.
Each of these cases differs in terms of tax
assignments and the formula for sharing resource
revenues. What links them is that they each have
a special system to distribute oil, gas or mineral
revenues.
Debates in several countries on resource
ownership, local rights and the role of the state
highlight the need for a framework to develop
revenue sharing arrangements or reform existing
ones. While we have examined policies and
practices in several countries, decisions on revenue
sharing are extremely context specific, limiting
our ability to provide generic advice. That said, we
can enumerate eight principles for efficient, fair,
stable and transparent resource revenue sharing
in Myanmar. These principles are extrapolated
from case studies and grounded in the Natural
Resource Charter, which emphasizes investing
resource revenues to achieve optimal and equitable
outcomes, for present and future generations.48 49
26
SHARING THE WEALTH: A ROADMAP FOR DISTRIBUTING MYANMAR’S NATURAL RESOURCE REVENUES
50 Bauer, Andrew (2013) Subnational Oil, Gas and Mineral Revenue Management. Revenue Watch Institute. Online: http://www.resourcegovernance.org/sites/default/files/RWI_Sub_Oil_Gas_Mgmt_EN_rev1.pdf
Principle 1. Clarify objectives. Resource
revenue sharing regimes are often created without
agreement on why they are being created. As
a result, their design often fails to meet any
specific objective, whether it be compensation
for extractive activities, regional equalization or
conflict prevention or mitigation. A regime need
not have a single objective, but each objective
ought to be clarified in policy or legislation.
Principle 2. Balance revenue and expenditure assignments. Decentralization of fiscal revenues
should be linked to the costs of public service deliv-
ery given subnational expenditure responsibilities.
If revenues are much greater than what is required,
the incentive for the local government will be to
build conspicuous and potentially wasteful infra-
structure, such as monuments, and not necessari-
ly plan for operations and maintenance expenses.
Costs of construction may also rise, meaning that
construction company owners will reap the ben-
efits of higher fiscal transfers rather than the local
residents. On the other hand, if revenues to local
governments are inadequate to finance local govern-
ment expenditures, essential public services, such as
education, health or infrastructure, might be under-
funded. In Brazil, the Philippines and South Africa,
subnational governments have been allocated key
expenditure responsibilities, such as education,
public order and safety, social protection and trans-
portation. In these countries, resource revenues
simply add to the fiscal space available to provide
these services. In other countries, like Kazakhstan
and Uganda, subnational governments have very
few direct responsibilities. In these cases, wind-
fall resource revenues are in a sense “extra” money
for local authorities to allocate.50 The decision on
expenditure responsibilities assigned to different
levels of government should be agreed upon before
any decision is made on revenue sharing.
Principle 3. Promote fiscal responsibility. Local
government bankruptcies or wasteful spending
can lead to crises at the local level or national gov-
ernment bailouts. Thus the design of any revenue
sharing formula ought to create incentives for
subnational governments to spend fiscal transfers
efficiently. Options for promoting fiscal responsi-
bility include limiting subnational governments’
abilities to borrow; saving a portion of windfall re-
source revenues in a sovereign wealth fund; national
approval of subnational budgets; conditional grants;
consultations between national and subnational
authorities on the budget; or simply moral suasion
to control spending. No matter which option is cho-
sen, a balance needs to be found between allowing
local government flexibility to spend according to
their needs and promoting fiscal responsibility.
Principle 4. Smooth fiscal expenditures and make spending predictable. Large and
unpredictable transfers of natural resource
revenues can destabilize a local economy and
generate the wrong incentives for making quality
public investments. It is incumbent on the central
government to either provide a predictable and
smooth source of financing to local governments or
provide them the tools to smooth transfers. This can
mean smoothing revenue transfers on behalf of local
governments or allowing them to address resource
volatility autonomously through debt management
or saving in a sovereign wealth fund.
Principle 5. Simplicity and enforceability. Any
revenue sharing formula must be simple enough for
low-capacity local government authorities or civil
society groups to verify the information in order to
build trust between governments as well as with
citizens. Simplicity also helps prevent corruption:
transfers are more easily verified under a simple
system. In practice, this means setting a single or
maximum two objectives for the transfer regime
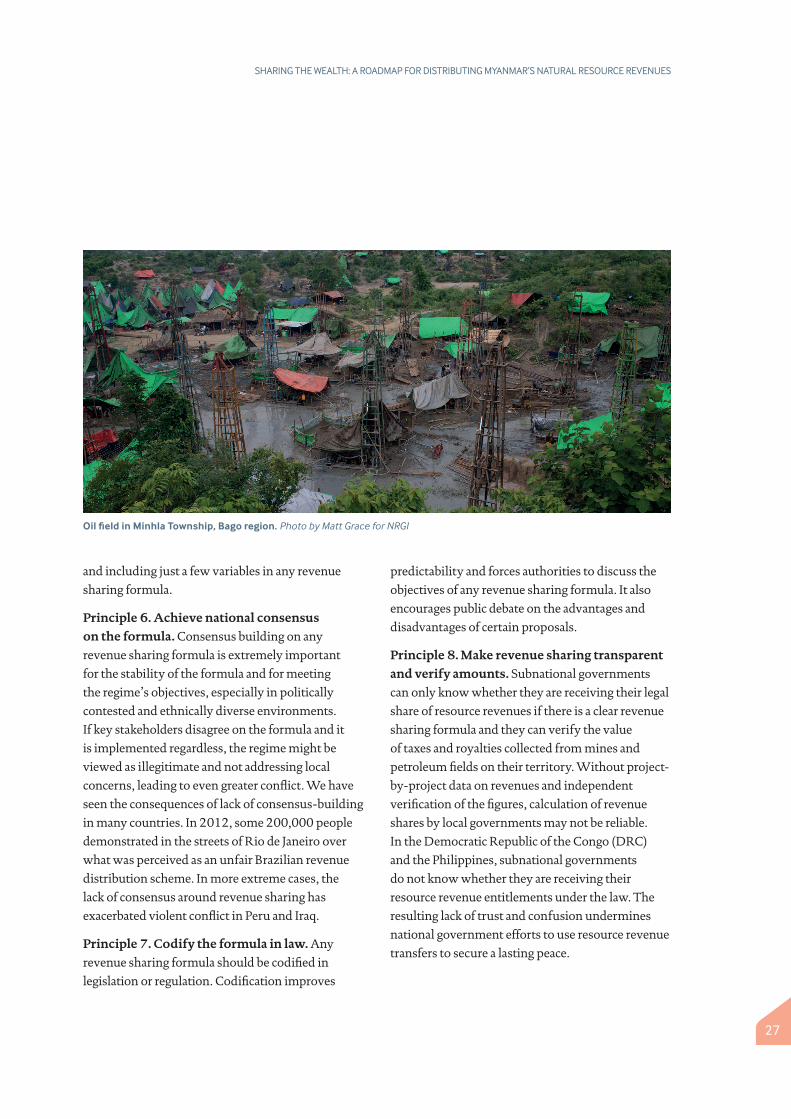
27
SHARING THE WEALTH: A ROADMAP FOR DISTRIBUTING MYANMAR’S NATURAL RESOURCE REVENUES
and including just a few variables in any revenue
sharing formula.
Principle 6. Achieve national consensus on the formula. Consensus building on any
revenue sharing formula is extremely important
for the stability of the formula and for meeting
the regime’s objectives, especially in politically
contested and ethnically diverse environments.
If key stakeholders disagree on the formula and it
is implemented regardless, the regime might be
viewed as illegitimate and not addressing local
concerns, leading to even greater conflict. We have
seen the consequences of lack of consensus-building
in many countries. In 2012, some 200,000 people
demonstrated in the streets of Rio de Janeiro over
what was perceived as an unfair Brazilian revenue
distribution scheme. In more extreme cases, the
lack of consensus around revenue sharing has
exacerbated violent conflict in Peru and Iraq.
Principle 7. Codify the formula in law. Any
revenue sharing formula should be codified in
legislation or regulation. Codification improves
predictability and forces authorities to discuss the
objectives of any revenue sharing formula. It also
encourages public debate on the advantages and
disadvantages of certain proposals.
Principle 8. Make revenue sharing transparent and verify amounts. Subnational governments
can only know whether they are receiving their legal
share of resource revenues if there is a clear revenue
sharing formula and they can verify the value
of taxes and royalties collected from mines and
petroleum fields on their territory. Without project-
by-project data on revenues and independent
verification of the figures, calculation of revenue
shares by local governments may not be reliable.
In the Democratic Republic of the Congo (DRC)
and the Philippines, subnational governments
do not know whether they are receiving their
resource revenue entitlements under the law. The
resulting lack of trust and confusion undermines
national government efforts to use resource revenue
transfers to secure a lasting peace.
Oil field in Minhla Township, Bago region. Photo by Matt Grace for NRGI
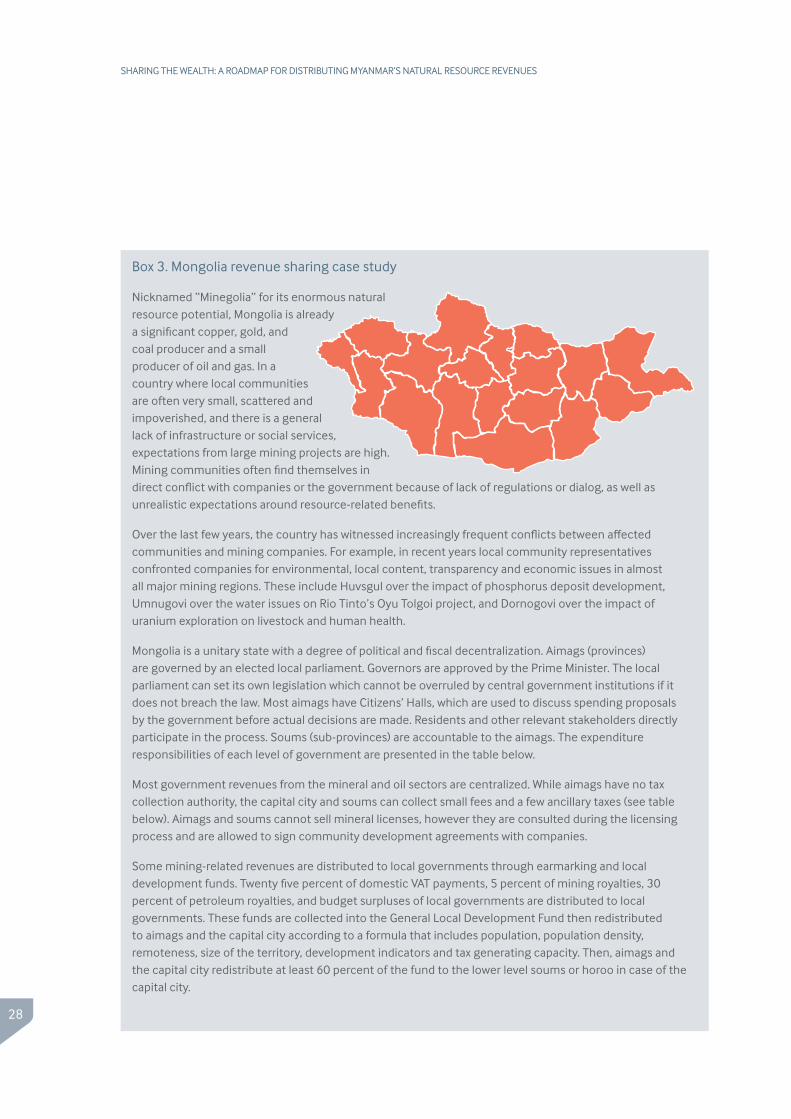
28
SHARING THE WEALTH: A ROADMAP FOR DISTRIBUTING MYANMAR’S NATURAL RESOURCE REVENUES
Box 3. Mongolia revenue sharing case study
Nicknamed “Minegolia” for its enormous natural resource potential, Mongolia is already a significant copper, gold, and coal producer and a small producer of oil and gas. In a country where local communities are often very small, scattered and impoverished, and there is a general lack of infrastructure or social services, expectations from large mining projects are high. Mining communities often find themselves in direct conflict with companies or the government because of lack of regulations or dialog, as well as unrealistic expectations around resource-related benefits.
Over the last few years, the country has witnessed increasingly frequent conflicts between affected communities and mining companies. For example, in recent years local community representatives confronted companies for environmental, local content, transparency and economic issues in almost all major mining regions. These include Huvsgul over the impact of phosphorus deposit development, Umnugovi over the water issues on Rio Tinto’s Oyu Tolgoi project, and Dornogovi over the impact of uranium exploration on livestock and human health.
Mongolia is a unitary state with a degree of political and fiscal decentralization. Aimags (provinces) are governed by an elected local parliament. Governors are approved by the Prime Minister. The local parliament can set its own legislation which cannot be overruled by central government institutions if it does not breach the law. Most aimags have Citizens’ Halls, which are used to discuss spending proposals by the government before actual decisions are made. Residents and other relevant stakeholders directly participate in the process. Soums (sub-provinces) are accountable to the aimags. The expenditure responsibilities of each level of government are presented in the table below.
Most government revenues from the mineral and oil sectors are centralized. While aimags have no tax collection authority, the capital city and soums can collect small fees and a few ancillary taxes (see table below). Aimags and soums cannot sell mineral licenses, however they are consulted during the licensing process and are allowed to sign community development agreements with companies.
Some mining-related revenues are distributed to local governments through earmarking and local development funds. Twenty five percent of domestic VAT payments, 5 percent of mining royalties, 30 percent of petroleum royalties, and budget surpluses of local governments are distributed to local governments. These funds are collected into the General Local Development Fund then redistributed to aimags and the capital city according to a formula that includes population, population density, remoteness, size of the territory, development indicators and tax generating capacity. Then, aimags and the capital city redistribute at least 60 percent of the fund to the lower level soums or horoo in case of the capital city.
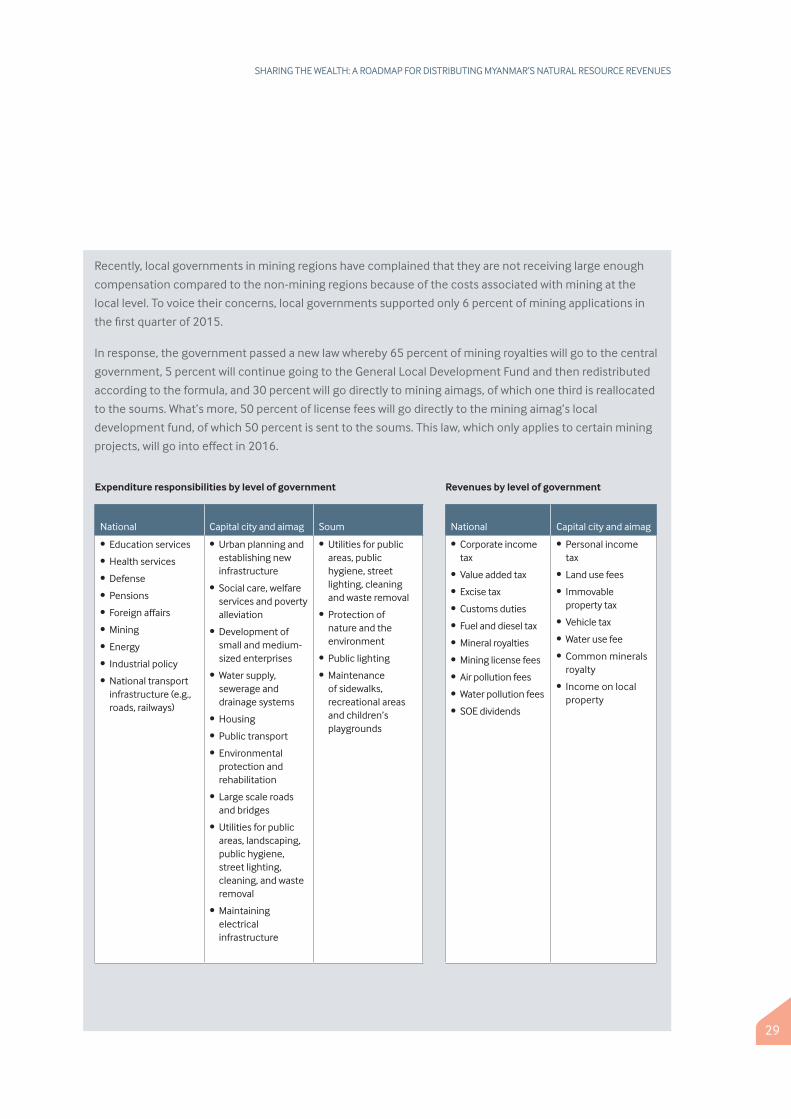
29
SHARING THE WEALTH: A ROADMAP FOR DISTRIBUTING MYANMAR’S NATURAL RESOURCE REVENUES
Recently, local governments in mining regions have complained that they are not receiving large enough
compensation compared to the non-mining regions because of the costs associated with mining at the
local level. To voice their concerns, local governments supported only 6 percent of mining applications in
the first quarter of 2015.
In response, the government passed a new law whereby 65 percent of mining royalties will go to the central
government, 5 percent will continue going to the General Local Development Fund and then redistributed
according to the formula, and 30 percent will go directly to mining aimags, of which one third is reallocated
to the soums. What’s more, 50 percent of license fees will go directly to the mining aimag’s local
development fund, of which 50 percent is sent to the soums. This law, which only applies to certain mining
projects, will go into effect in 2016.
Expenditure responsibilities by level of government Revenues by level of government
National Capital city and aimag Soum National Capital city and aimag
• Education services
• Health services
• Defense
• Pensions
• Foreign affairs
• Mining
• Energy
• Industrial policy
• National transport infrastructure (e.g., roads, railways)
• Urban planning and establishing new infrastructure
• Social care, welfare services and poverty alleviation
• Development of small and medium-sized enterprises
• Water supply, sewerage and drainage systems
• Housing
• Public transport
• Environmental protection and rehabilitation
• Large scale roads and bridges
• Utilities for public areas, landscaping, public hygiene, street lighting, cleaning, and waste removal
• Maintaining electrical infrastructure
• Utilities for public areas, public hygiene, street lighting, cleaning and waste removal
• Protection of nature and the environment
• Public lighting
• Maintenance of sidewalks, recreational areas and children’s playgrounds
• Corporate income tax
• Value added tax
• Excise tax
• Customs duties
• Fuel and diesel tax
• Mineral royalties
• Mining license fees
• Air pollution fees
• Water pollution fees
• SOE dividends
• Personal income tax
• Land use fees
• Immovable property tax
• Vehicle tax
• Water use fee
• Common minerals royalty
• Income on local property
30
SHARING THE WEALTH: A ROADMAP FOR DISTRIBUTING MYANMAR’S NATURAL RESOURCE REVENUES
51 The design of a general revenues sharing regime would require additional considerations. For instance, deciding whether to allocate block grants or matching grants. This paper is focused only on revenues derived from natural resource extraction. See Nixon and Joelene (2014) for general revenue sharing issues.
Given the importance of enacting an efficient,
stable, predictable, transparent, fair and effective
revenue sharing regime, below are some key
considerations for policymakers in agreeing to a
formula or regime.51
AGREEING ON REVENUE SHARING OBJECTIVES
Without knowing why a country is sharing
revenues between national and subnational
jurisdictions, it might be impossible to reach a
stable agreement on a revenue sharing formula.
In general, there are five possible reasons why
national governments might share general
revenues with local governments:
• Covering expenditure responsibilities. Subnational governments are often allocated
expenditure responsibilities—for instance
over health, education or local roads—yet may
not have the revenue-generating capacity to
fulfill their mandates. National governments
can make grants to local governments to fill the
financing gap.
• Improved public service delivery. Some
academics have long argued that local
governments can provide some public services
more efficiently than national governments.
Local governments may have greater access
to information on local needs than national
governments. Fiscal decentralization can also
generate positive competition between regions
leading to better service provision for all.
Finally, if they can be voted out of power, local
government officials can sometimes be more
accountable to citizen demands than national
authorities. That said, the empirical evidence
on efficient service provision is mixed.
Corruption and mismanagement is often
decentralized along with revenues, especially
where there is a lack of local government
accountability and low administrative capacity.
• Equalization between regions. Certain
regions may have less revenue generating
capacity than others, either because they
have smaller tax bases or weaker public
administration. Furthermore, the costs of
providing public services may be higher in
certain regions than others—especially in
rural areas. National governments sometimes
transfer a greater proportion of revenue per
capita to these poorer regions to equalize
opportunities and income levels across the
country.
• National government control. The national
government may want to promote national
standards in health, education and other social
services. Besides regulating local government
behavior, national governments can incentivize
local governments to adhere to national
standards by making conditional grants.
• Risk-sharing and fiscal stabilization. Certain regions may experience
environmental, social or economic crises.
This is certainly the case in natural resource-
dependent regions. Resource-rich regions
regularly experience large positive and negative
shocks to employment levels, inflation and
economic growth in response to rising or
Designing a revenue sharing regime
31
SHARING THE WEALTH: A ROADMAP FOR DISTRIBUTING MYANMAR’S NATURAL RESOURCE REVENUES
52 Aroca, Patricio and Miguel Atienza (2008) La conmutación regional en Chile y su impacto en la Región de Antofagasta. Departamento de Economía, Instituto de Economía Aplicada Regional (IDEAR), Universidad Católica del Norte.
53 Viale, Claudia and Edgardo Cruzado (2012) Distribution of Revenue from the Extractive Industries to Sub-national Governments in Latin America. Revenue Watch Institute.
falling commodity prices and production.
However subnational governments usually
do not have the tools to manage these
shocks as well as national governments.
First, they are often constrained by a lack
of access to financing; local governments
often have trouble borrowing money to
help smooth these shocks, either because
the national government limits borrowing
to prevent over-indebtedness or because
banks do not have adequate information
on their creditworthiness. Second, since
they do not have their own currency, the
exchange rate cannot adjust to a large inflow
or outflow of capital. Thus, if a new mine
opens, wages and prices usually increase,
harming competitiveness in other sectors
of the economy, especially agriculture and
manufacturing (this is called localized ‘Dutch
disease’). National governments can help
smooth local public expenditures and insure
against shocks by transferring more revenues
to poorer or crisis-affected regions.
More than 20 countries not only share general
revenues but also have a specific revenue sharing
scheme for revenues derived from sales of oil, gas or minerals. Four often unstated typical
objectives that appear to drive the establishment
of sharing arrangements explicitly focused on
natural resource revenues are: (i) compensating
local communities for the negative impacts of
extraction; (ii) mitigating or preventing violent
conflict; (iii) responding to local claims for
benefits based on ideas of local ownership; and
(iv) promoting regional income equality between
resource and non-resource rich regions.
Compensation for the negative impacts from extraction. Oil, gas and mining activities
can cause damage to the environment or public
health, for instance as a result of gas flaring or acid
mine drainage. Indeed, pollution from extraction
can contaminate rivers downstream from a site
and the entire watershed over hundreds of square
kilometers, not only the immediate vicinity of the
mine site or oil field. New production can also lead
to the loss of livelihoods, especially for farmers and
others who are displaced or relocated in favor of
extractive activities. Furthermore, the presence of oil
or mining companies in a region may raise rents and
costs of everyday non-tradeable services like taxis
and restaurants. This can harm people who continue
to live in the area but do not directly benefit from
increased wages or economic opportunities. Finally,
extractive industries may attract migrants to the
region, adding congestion to public utilities (such
as clogging transportation networks like roads and
railroads or straining water delivery systems). For
example, mining in Antofagasta region in Chile
has attracted a large inflow of workers from other
parts of the country, resulting in negative effects on
income and employment for people originally from
that region.52
Local governments can use resource revenue shares
as compensation, or to fund efforts to mitigate the
social and environmental losses associated with
extraction at the production site and across all
affected areas. Ecuador, for instance, levies a USD
1 fee per barrel of oil produced in Amazon region,
the implicit assumption being that environmental
damage is directly linked to the barrels of oil that a
company produces.53 In the United States, the state
of California levies a fixed rate on each barrel of oil
32
SHARING THE WEALTH: A ROADMAP FOR DISTRIBUTING MYANMAR’S NATURAL RESOURCE REVENUES
54 The rate as of June 2013 was $0.1406207 on each barrel of oil and 10,000 cubic feet of natural gas produced. Brown, Cassandra (2013) State Revenues and the Natural Gas Boom: An Assessment of State Oil and Gas Production in Texas. National Conference of State Legislatures. Online: http://www.ncsl.org/research/energy/state-revenues-and-the-natural-gas-boom.aspx.
55 Bailey, Rob et al. (2015) Investing in Stability: Can Extractive-Sector Development Help Build Peace? Chatham House Research Paper.56 Javier Arellano-Yanguas (2010) Local politics, conflict and development in Peruvian mining regions. Institute of Development
Studies, University of Sussex.57 David, Rachel and Daniel Franks (2014) Costs of Company-Community Conflict in the Extractive Sector. Harvard Kennedy School.
Online: http://www.hks.harvard.edu/m-rcbg/CSRI/research/Costs%20of%20Conflict_Davis%20%20Franks.pdf 58 Haysom, Nicholas and Sean Kane (2009) Negotiating natural resources for peace: Ownership, control and wealth-sharing. Center for
Humanitarian Dialogue. October 2009.
or 10,000 cubic feet of natural gas produced that
is remitted to the Department of Conservation’s
Division of Oil, Gas and Geothermal Resources.
This rate is established each June based on the
department’s needs.54
Conflict mitigation and prevention. Since
oil, gas and minerals are point-source resources,
a single violent conflict can cause harm to
local residents and bring production to a halt,
jeopardizing revenues for the entire country.
Local leaders can therefore extract concessions
in the form of resource revenues in exchange
for peace and security around the field or mine.
Resource revenue sharing can help build peace by
encouraging dialogue between national authorities
and local leaders and generating a “peace dividend”
for locals.55 National governments will sometimes
transfer a share of resource revenues to local
governments in resource-rich regions to preserve
or create harmony between the central government
and the regions, as has been the case in Indonesia,
southern Iraq, Kazakhstan, Mongolia, Nigeria and
Papua New Guinea.
That said, resource revenue sharing does not
always prevent conflict—it can exacerbate it. The
prospect of extra income can create incentives for
new political groups to claim ownership, and to
use resource revenues to finance violent actions.
For example, between 2005 and 2008, the increase
in global mineral prices and the consequent
increase in fiscal transfers to mining regions
incentivized local leaders in Peru to instigate
violent protests in order to extract additional
transfers from the central government and gain
jurisdiction over mine sites.56
Local claims for benefits based on ideas of local ownership. Affected communities’ claims
often originate from a sense of ownership over
resources, especially if the same ethnic group
occupied the land before the contemporary state
was established. Where these claims have been
ignored, companies have sometimes been violently
targeted by local populations, as in the case of
the Conga project which was suspended at the
request of the Peruvian government following
community conflict.57 In the extreme, when a
claim is not satisfied or where there is a sense of
injustice or dearth of benefits for locals, central
governments have sometimes faced the threat
of secession or violence against the state. In
Indonesia, for instance, oil and gas production
in the impoverished region of Aceh led to
grievances that fueled a pre-existing conflict for
self-determination.58 As a result, a local ‘right’ to
a share of resource revenues has been codified in
some countries’ constitutions and legislation (e.g.,
Argentina, Colombia). In others, such as Aceh
and West Papua, Indonesia, local governments in
conflict affected areas have been allocated a larger
share of resource revenues than in other parts of
the country.
33
SHARING THE WEALTH: A ROADMAP FOR DISTRIBUTING MYANMAR’S NATURAL RESOURCE REVENUES
59 Najman, Boris et al. (2004) “Redistribution of oil revenues in Kazakhstan” in The Economics and Politics of Oil in the Caspian Basin (eds. Boris Najman, Richard Pomfret and Gael Raballand). Abingdon: Routledge.
Regional income equality between resource and non-resource rich regions. In some
countries where natural resource-rich regions are
some of the poorest, resource revenue sharing
has been used to reduce regional inequalities. The
government of Bolivia, for example, transfers one
percent of national gross value of petroleum sales
to Beni and Pando, as they were originally the two
poorest departments in the country. Peru transfers
additional mineral revenue shares to producing
municipalities that have low social and economic
indicators. Mexico makes oil revenue transfers to
the states based on population, fiscal capacity and
equalization indicators. And Kazakhstan transfers
a disproportionate share of resource revenues to
Atyrau and Mangistau, two of the poorest and
most-resource rich oblasts.59
A large number of countries also redistribute the
revenue from resource extraction to poorer regions
and those without resource production. Mongolia,
for instance, allocates five percent of mining
royalties and 30 percent of petroleum royalties
according to a formula that includes remoteness
and development indicators.
On the other hand, resource revenue sharing
based on a derivation principle can also exacerbate
inequality. For example, the Brazilian state of
Rio de Janeiro is the nation’s third wealthiest in
terms of GDP per capita. Still, the revenue sharing
formula—which allocates 52.5 percent of royalties
and 40 percent of “special participation” earnings
to the state—exacerbates regional inequality
by allocating a disproportionately large share
of resource revenues to this wealthy region.
In response, some governments have enacted
equalization mechanisms to address inter-regional
inequalities. For example, Australia, Canada
and Mexico have each introduced an explicit
equalization transfer payment scheme to offset
differences in natural endowments between
regions, though a few, like Canada, specifically
exclude some natural resource revenues from their
formulas.
Relevant stakeholders in Myanmar may wish to
agree on the goals of any revenue sharing regime
before proceeding to negotiate any details.
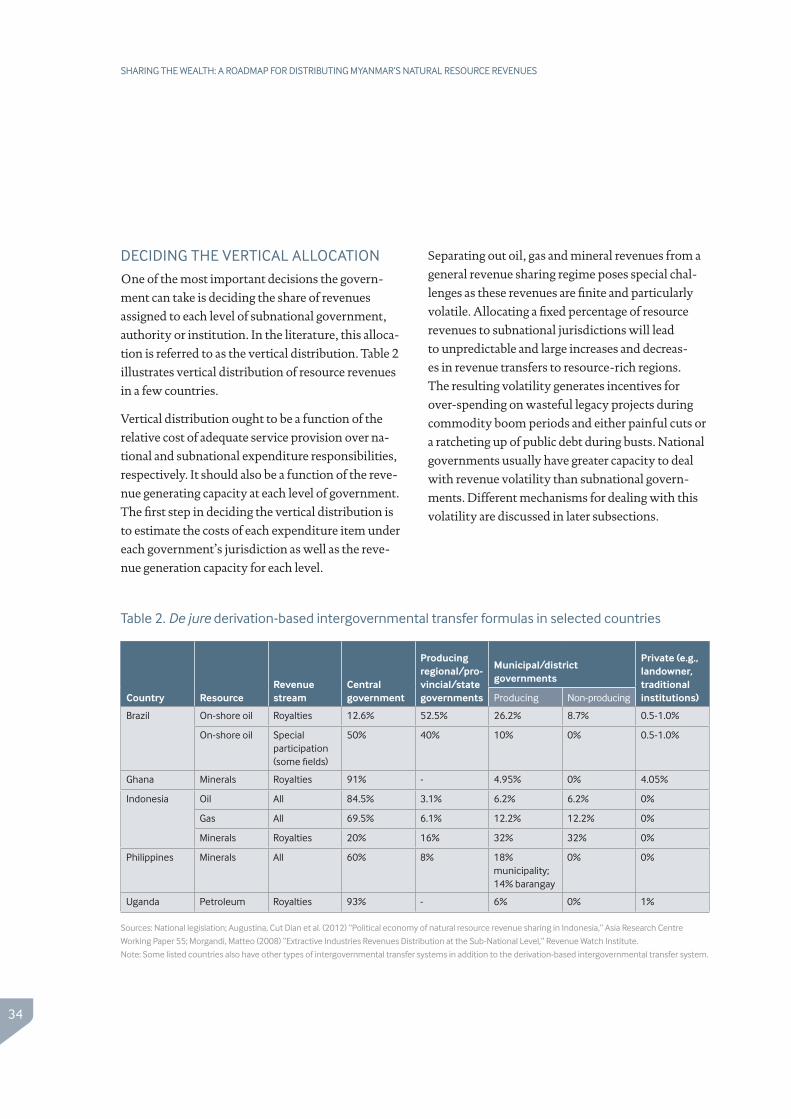
34
SHARING THE WEALTH: A ROADMAP FOR DISTRIBUTING MYANMAR’S NATURAL RESOURCE REVENUES
DECIDING THE VERTICAL ALLOCATION
One of the most important decisions the govern-
ment can take is deciding the share of revenues
assigned to each level of subnational government,
authority or institution. In the literature, this alloca-
tion is referred to as the vertical distribution. Table 2
illustrates vertical distribution of resource revenues
in a few countries.
Vertical distribution ought to be a function of the
relative cost of adequate service provision over na-
tional and subnational expenditure responsibilities,
respectively. It should also be a function of the reve-
nue generating capacity at each level of government.
The first step in deciding the vertical distribution is
to estimate the costs of each expenditure item under
each government’s jurisdiction as well as the reve-
nue generation capacity for each level.
Separating out oil, gas and mineral revenues from a
general revenue sharing regime poses special chal-
lenges as these revenues are finite and particularly
volatile. Allocating a fixed percentage of resource
revenues to subnational jurisdictions will lead
to unpredictable and large increases and decreas-
es in revenue transfers to resource-rich regions.
The resulting volatility generates incentives for
over-spending on wasteful legacy projects during
commodity boom periods and either painful cuts or
a ratcheting up of public debt during busts. National
governments usually have greater capacity to deal
with revenue volatility than subnational govern-
ments. Different mechanisms for dealing with this
volatility are discussed in later subsections.
Country ResourceRevenue stream
Central government
Producing regional/pro-vincial/state governments
Municipal/district governments
Private (e.g., landowner, traditional institutions)Producing Non-producing
Brazil On-shore oil Royalties 12.6% 52.5% 26.2% 8.7% 0.5-1.0%
On-shore oil Special participation (some fields)
50% 40% 10% 0% 0.5-1.0%
Ghana Minerals Royalties 91% - 4.95% 0% 4.05%
Indonesia Oil All 84.5% 3.1% 6.2% 6.2% 0%
Gas All 69.5% 6.1% 12.2% 12.2% 0%
Minerals Royalties 20% 16% 32% 32% 0%
Philippines Minerals All 60% 8% 18% municipality; 14% barangay
0% 0%
Uganda Petroleum Royalties 93% - 6% 0% 1%
Table 2. De jure derivation-based intergovernmental transfer formulas in selected countries
Sources: National legislation; Augustina, Cut Dian et al. (2012) “Political economy of natural resource revenue sharing in Indonesia,” Asia Research Centre
Working Paper 55; Morgandi, Matteo (2008) “Extractive Industries Revenues Distribution at the Sub-National Level,” Revenue Watch Institute.
Note: Some listed countries also have other types of intergovernmental transfer systems in addition to the derivation-based intergovernmental transfer system.
35
SHARING THE WEALTH: A ROADMAP FOR DISTRIBUTING MYANMAR’S NATURAL RESOURCE REVENUES
60 IMF (2014) Government Finance Statistics Manual 2014. Washington D.C.: IMF.61 In a typical extraction project, gross sales will become greater than zero before taxable profits, often many years before. Therefore
the tax collecting authority will receive revenues from gross sales taxes before profit taxes. Additionally, if there is a fall in commodity prices, it is likely that gross sales will be positive more often than profits.
DECIDING WHICH REVENUES STREAMS TO SHARE
While some countries choose to share all revenue
streams between levels of government, others opt
to transfer only certain streams. The most common
revenue streams include royalties, signature
bonuses, profit taxes, property taxes, goods
and service taxes, border taxes, dividends from
government equity, production entitlements, and
fines and penalties.60
Uganda’s parliament recently struggled with this
issue during debates on the 2015 Public Finance
Management bill. The final version includes a
provision that six percent of petroleum royalties
will be “shared among the local governments
located within the petroleum exploration and
production areas”. Half of this amount is allocated
between local governments based on level of
production or impact, where production is where
extraction takes place or where oil is uploaded
onto any transport platform. The remaining half
is shared based on “population size, geographic
area and terrain.” Resource-related grants
are unconditional. An additional one percent
royalty will be allocated to a “gazetted cultural or
traditional institution.” Ghana (mining) and Papua
New Guinea (oil and gas) also only share royalties.
Ecuador, Mexico and Nigeria, on the other hand,
are examples of countries that share all revenue
streams with local governments. In other cases,
countries may choose to share some streams
but not others, or may vary the regime based
on the commodity. In Canada, both national
and provincial governments collect their own
corporate income taxes, while royalties are only
collected by the provincial governments. In
Indonesia, all oil and gas revenue streams are
shared with local governments, however only
mineral royalties are shared.
Considerations for including certain revenue streams
The reasons for sharing only some but not all
streams are both practical and political. First, from
a practical perspective, not all revenue streams can
be easily linked to a given project in a given state
or region. For instance, companies with multiple
operations in a country may aggregate profits taxes
over several projects. In such a circumstance, it
would be largely arbitrary to assess what share of
corporate income tax is associated with a given
mineral project or oil field. Royalties, on the other
hand, are based on volume or value of production.
As such, they can be easily linked to a mine or
petroleum field in a specific location.
Second, royalties and signature bonuses are easier
to calculate than, say, profits taxes—all one needs
is production volume, quality of the product and
market prices in order to estimate royalty revenues.
License fees are even easier to calculate. These
streams thus lend themselves more naturally
to collection or verification by subnational
governments. Other revenue streams, especially
profits taxes, require much more information to
estimate, such as costs.61 Profits taxes or dividends
from government equity may also not be collected
in certain years due to cost recovery or tax
incentives. Linking subnational payments to these
difficult-to-estimate revenue streams may generate
confusion in years when production is high but
payments are low.
36
SHARING THE WEALTH: A ROADMAP FOR DISTRIBUTING MYANMAR’S NATURAL RESOURCE REVENUES
62 Deep-sea mining is expected to begin off the coast of Papua New Guinea soon.63 Brosio, Giorgio (2006) “The Assignment of Revenue from Natural Resources” in Handbook of Fiscal Federalism (eds. Ehtisham
Ahmed and Giorgio Brosio), Cheltenham: Edward Elgar Publishing.
Third, royalties are more predictable and less
volatile than other revenue streams. Given the
difficulties inherent in managing year-to-year
revenue volatility—and the deleterious impact of
volatility on the quality of public investment—it
may be easier to manage large royalty payments
than other revenue streams.
These three points may suggest that subnational
governments would be well served to collect a
share of royalties, property taxes and license fees
rather than profits taxes, dividends on government
equity or production entitlements. However
any revenue sharing regime that covers only
some streams might be considered “cheating”
subnational governments out of their fair share
since natural resource revenues consist of the sum
of all streams.
Furthermore, different revenue streams start
flowing at different times in the extractive life-
cycle. For instance corporate income tax only starts
being collected once costs have been recovered,
while royalties are collected as soon as production
begins. Also, the magnitude of different streams
varies significantly. In general, after the onset of
production, royalties, profits taxes and goods and
services taxes are much larger than, say, property
taxes or license fees. Distributing different revenue
streams, therefore, has implications for both
national and subnational budgets. Ultimately,
the allocation of revenue streams ought to
be a function of the respective expenditure
responsibilities of national and subnational
governments.
A final consideration—particularly important
in Myanmar given specific claims by groups in
Rakhine and elsewhere—is whether any revenue
sharing regime will include both onshore and
offshore oil, gas and even mining activities.62
While in general offshore resources are the
exclusive jurisdiction of the central government,
in Australia, Brazil, Canada and Italy, revenues
from these sources are shared with the closest
neighboring subnational governments.63
Each of these four countries has a specific history
that explains why offshore resource revenues are
shared. For example, despite a Supreme Court
ruling in 1984 that offshore oil and its proceeds
are under federal jurisdiction, the Canadian
government negotiated an accord with the oil-
rich province of Newfoundland in 1985 which
splits the benefits evenly between both levels
of government. This deal was the product of an
election promise by a political party eager to win
parliamentary seats in Newfoundland.
Notwithstanding these experiences, offshore
resource revenue sharing remains rare. Offshore
production generates fewer direct negative
impacts on adjacent populations—for instance
on the natural environment and on livelihoods—
notwithstanding disruptions to fisheries and the
potential for oil spills. Offshore resources are also
more difficult for local leaders to occupy. Therefore
offshore production is less susceptible to extortion
in exchange for peace and security.
37
SHARING THE WEALTH: A ROADMAP FOR DISTRIBUTING MYANMAR’S NATURAL RESOURCE REVENUES
64 Agustina, Cut Dian et al. (2012) Political economy of natural resource revenue sharing in Indonesia. Asia Research Centre Working Paper 55.
DECIDING ON A RESOURCE REVENUE SHARING PRINCIPLE AND FORMULA (HORIZONTAL ALLOCATION)
Horizontal distribution describes the distribution of
resource revenue among subnational jurisdictions
at the same level of authority. Excluding direct
resource tax collection, there are two channels that
are commonly used to transfer natural resource
revenues to local governments: A derivation-
based transfer from the central government that is
a defined share of resource revenues generated in
that region, usually measured by production value,
or an indicator-based transfer whereby the amount
transferred is calculated using a formula consisting
of objective and measurable indicators, such as
population, poverty rates, or regional GDP. Within
indicator-based transfer systems, all revenues can
be pooled and then redistributed, or natural
resource revenues can be separated from other
types of revenue.
The majority of resource revenue sharing
systems—especially in emerging economies—are
derivation-based. The reasons are that they are
often simpler to explain to the population and
key stakeholders, easier to calculate, and require
less data than indicator-based transfer systems.
However they are also generally pro-cyclical:
governments in resource-rich regions receive more
revenues just as extractive activities are ramping
up in the region, and transfers decline when
production slows. Derivation-based transfers
generally exacerbate boom-bust cycles.
As mentioned, Brazil, Democratic Republic of the
Congo, Ghana, Indonesia, Iraq, Mongolia, Nigeria,
Papua New Guinea, the Philippines, Uganda,
and South Sudan are among the countries with
derivation-based formulas for all or certain revenue
streams, though some of these countries also have
additional indicator-based systems. The Indonesian
case provides a useful illustration. The Indonesian
government distributes 3.1 percent of total oil
revenue to the producing province, 6.2 percent to
the producing regency, and 6.2 percent is equally
distributed to all other regencies in the producing
province. Gas is distributed 6.1 percent to the
producing province, 12.2 percent to the producing
regency, and 12.2 percent distributed equally to all
other regencies in the producing province.
The regions of Aceh, Papua and West Papua are sub-
ject to special arrangements with the central govern-
ment whereby Aceh received 70 percent of oil and
gas revenues from 2002-2011 and Papua and West
Papua receive 70 percent from 2002-2027. After
these periods, their shares will be reduced to a max-
imum of 50 percent each.64 This has meant massive
oil and gas revenue windfalls for certain regions,
such as a USD 1.2 billion windfall distribution to
Riau (pop. 6.4 million) and a USD 280 million dis-
tribution to North Kalimantan (pop. 628,000)
in 2014. One weakness is that it has resulted in large
inflows of revenues into oil- and gas-rich regions
during boom years, followed by drastic falls in
revenue during periods of price declines or once re-
sources are depleted. Since many local jurisdictions
do not have the absorptive capacity to manage large
windfalls, soaring government expenditures have
often led to local inflation—especially for rents,
construction and local services—or profligate
spending on government employee bonuses and
glamour projects.
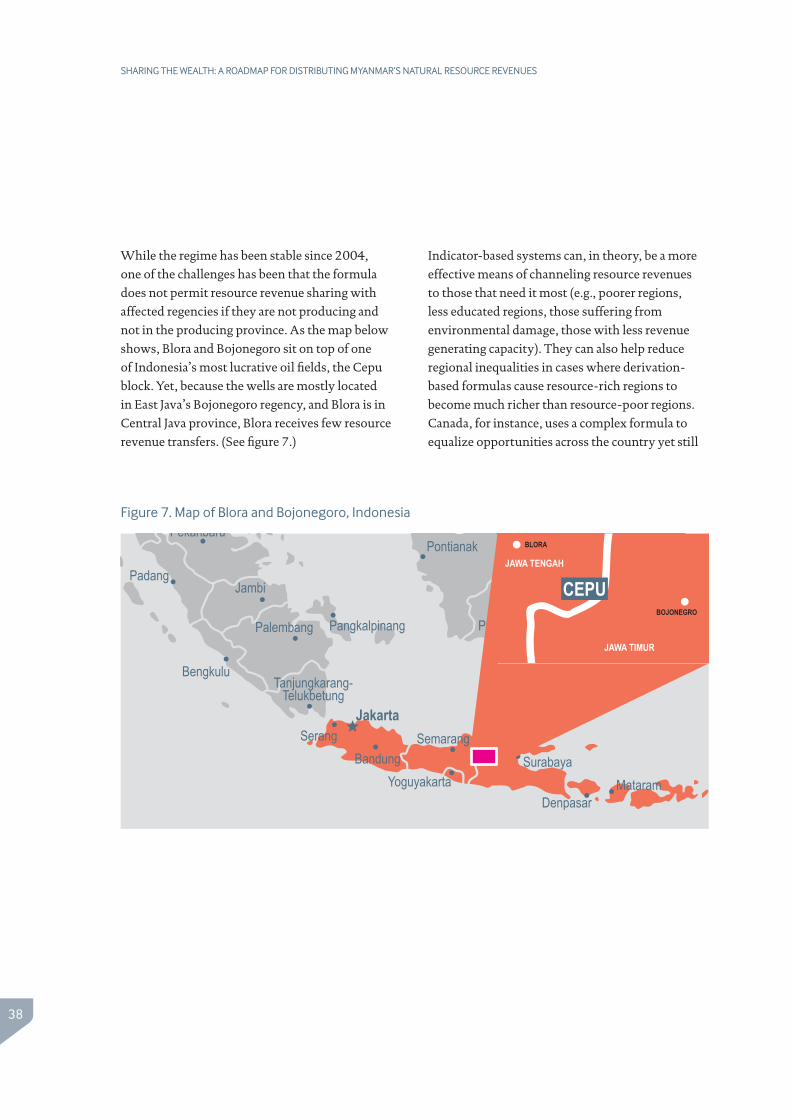
38
SHARING THE WEALTH: A ROADMAP FOR DISTRIBUTING MYANMAR’S NATURAL RESOURCE REVENUES
While the regime has been stable since 2004,
one of the challenges has been that the formula
does not permit resource revenue sharing with
affected regencies if they are not producing and
not in the producing province. As the map below
shows, Blora and Bojonegoro sit on top of one
of Indonesia’s most lucrative oil fields, the Cepu
block. Yet, because the wells are mostly located
in East Java’s Bojonegoro regency, and Blora is in
Central Java province, Blora receives few resource
revenue transfers. (See figure 7.)
Indicator-based systems can, in theory, be a more
effective means of channeling resource revenues
to those that need it most (e.g., poorer regions,
less educated regions, those suffering from
environmental damage, those with less revenue
generating capacity). They can also help reduce
regional inequalities in cases where derivation-
based formulas cause resource-rich regions to
become much richer than resource-poor regions.
Canada, for instance, uses a complex formula to
equalize opportunities across the country yet still
CEPUBOJONEGRO
BLORA
JAWA TIMUR
JAWA TENGAH
Figure 7. Map of Blora and Bojonegoro, Indonesia
39
SHARING THE WEALTH: A ROADMAP FOR DISTRIBUTING MYANMAR’S NATURAL RESOURCE REVENUES
65 Roy-César, Edison (2013) Canada’s Equalization Formula. Library of Parliament Research Publications, Government of Canada. Online: http://www.parl.gc.ca/Content/LOP/ResearchPublications/2008-20-e.htm#a3
66 Shah, Anwar (2007) “A Practitioner’s Guide to Intergovernmental Fiscal Transfers” in Intergovernmental Fiscal Transfers: Principles and Practice (eds. Robin Boadway and Anwar Shah). World Bank: Washington DC.
67 Castanada, Luis Cesar and Juan E. Pardinas (2012) Sub-national Revenue Mobilization in Mexico. IDB Working Paper Series No. IDB-WP-354; Courchene, Thomas and Alberto Diaz-Cayeros (2004) “Transfers and the Nature of the Mexican Federation”, Achievements and Challenges of Fiscal Decentralization: Lessons from Mexico (eds. Marcelo M. Guigale and Steven B. Webb), Washington DC: World Bank.
68 Wilson, Leonard S. (2007) “Macro Formulas for Equalization” in Intergovernmental Fiscal Transfers: Principles and Practice (eds. Robin Boadway and Anwar Shah). World Bank: Washington DC.
provide preferential treatment for resource-rich
regions. In brief, Canadian provinces collect
royalties and provincial corporate income tax,
while the national government collects national
corporate income tax. This has contributed to a
situation where income in oil-rich provinces is
much higher per capita than in non-resource-
rich provinces. Canada’s provincial “equalization
formula” helps rectify this situation by calculating
the revenue generating capacity of each province on
a per capita basis. If, according to an agreed formula,
a province has below-average ability to generate
own-source revenues, then it is eligible for an
equalization payment.65 Natural resource royalties
are excluded from this formula, which allows
resource-rich provinces like Alberta, Newfoundland
and Saskatchewan to keep a larger share of their
revenues. (Transfers to Canada’s Northern
territories are managed somewhat differently.)
South Africa employs a similar principle, except that
instead of measuring revenue generating capacity
using a complex multi-indicator formula, it uses
regional GDP as a proxy for fiscal capacity.66
While Canada’s system focuses on supplementing
provincial budgets for those provinces that have
difficulty raising revenue, some indicator-based
systems also use measures of expenditure needs,
such as population, poverty rates or a wage index.
Mexico allocates its petroleum revenue according
to a formula that consists of population and
revenue generation, as well as a third variable,
weighted less than the others, that benefits
states with low populations and high revenue
generation.67 Australia’s equalization formula uses
a combination of revenue capacity and expenditure
needs indicators. Needs indicators include
population density and level of urbanization. An
independent Commonwealth Grants Commission
makes an assessment of how revenues should be
distributed to the states and territories.68
The advantage of an indicator-based system is
that it tends to depoliticize the revenue sharing
issue by shifting disagreements over the formula
into technocratic hands. Instead of arguing over
greater revenue shares, the debate becomes about
appropriate indicators and data accuracy. That
said, the Australian and Canadian systems have
come under criticism for the same characteristic
that causes them to be lauded: their complexity,
which makes them relatively non-transparent.
Indicator-based formulas also require enormous
amounts of detailed regional-level data to be able to
calculate revenue allocations effectively, a serious
disadvantage for implementation in Myanmar.
Some relevant data is currently available via the
Integrated Household Living Conditions Survey 2009-10 or The 2014 Myanmar Population and Housing Census. However any indicator-based
formula would need to be developed around
existing data sources. In Myanmar, these may
not be updated regularly and are limited in scope,
coverage and accuracy.
40
SHARING THE WEALTH: A ROADMAP FOR DISTRIBUTING MYANMAR’S NATURAL RESOURCE REVENUES
69 Bauer, Andrew (2014) All That Glitters is Not Gold: Will Expectations be Dashed in Canada’s North? Natural Resource Governance Institute, 30 June 2014. Online: http://www.resourcegovernance.org/news/blog/all-glitters-not-gold-will-expectations-be-dashed-canadas-north
Bolivia, Canada (territories only) and Peru are
examples of countries that utilize both derivation-
based and indicator-based approaches, distributing
resource revenues horizontally according to
both production and population. They are also
examples of countries with clawback provisions
on their derivation-based transfers. In Peru,
transfers from the Canon Minero and mineral
royalties disproportionately benefit mineral-
producing regions. In an attempt to address
this inequality, the central government tries to
equalize payments by allocating higher amounts
of general intergovernmental transfers to non-
producing local and regional governments.
Local governments of the regions of Amazonas,
Huánuco and San Martín, which receive few
mineral revenue transfers, receive significantly
greater intergovernmental transfers per capita
from the non-resource based pool of funds.
Similarly, the ten regional governments whose
intergovernmental transfers were above the
national average receive relatively fewer royalty
and Canon Minero payments.
Similarly, in Canada, the Northwest Territories
are allowed to retain the lesser of 50 percent of
mineral, oil, gas and water-related revenues, or five
percent of an amount called the Gross Expenditure
Base, calculated at between CAD 70 million to
CAD 100 million per year over the coming decade.
Of this amount, 25 percent is passed onto some
aboriginal governments. However, under the
formula that determines the annual unconditional
transfer from the Government of Canada to the
Northwest Territories, for each dollar the territory
raises itself in taxes, approximately 70 cents are
removed from the federal transfer. In other words,
even if resource taxes rose significantly, much of
the revenue would be clawed back.69
Any agreed formula ought to be derived from the
objective(s) of the transfer system. For instance,
if a derivation-based system is developed and the
goal of the transfer system is compensating regions
for loss of livelihoods and environmental damage,
then it would make sense to define “affected areas”
and transfer revenues to these areas. Similarly, if
an indicator-based system is selected and the goal
of the transfer system is also compensating regions
for loss of livelihoods and environmental damage,
then appropriate indicators might be the numbers
of jobs lost or a measure of environmental damage
in the affected area. (See table 3 for more examples
of this principle.)
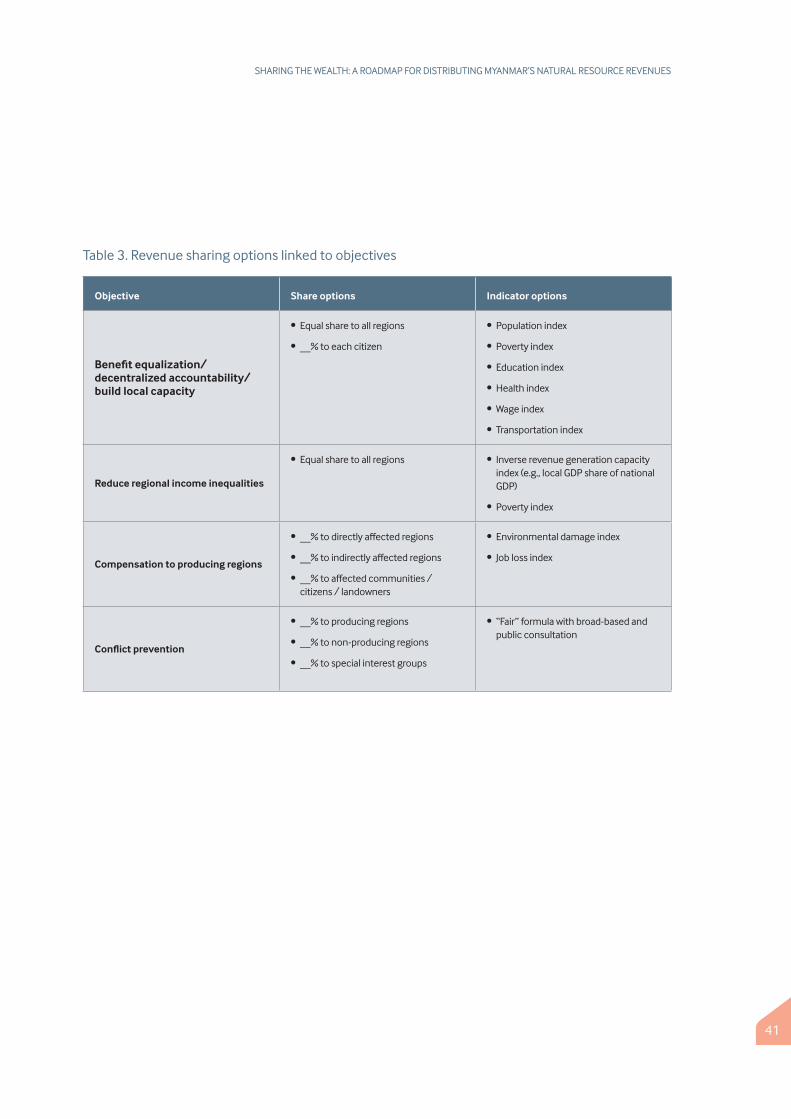
41
SHARING THE WEALTH: A ROADMAP FOR DISTRIBUTING MYANMAR’S NATURAL RESOURCE REVENUES
Table 3. Revenue sharing options linked to objectives
Objective Share options Indicator options
Benefit equalization/ decentralized accountability/ build local capacity
• Equal share to all regions
• __% to each citizen
• Population index
• Poverty index
• Education index
• Health index
• Wage index
• Transportation index
Reduce regional income inequalities
• Equal share to all regions • Inverse revenue generation capacity index (e.g., local GDP share of national GDP)
• Poverty index
Compensation to producing regions
• __% to directly affected regions
• __% to indirectly affected regions
• __% to affected communities / citizens / landowners
• Environmental damage index
• Job loss index
Conflict prevention
• __% to producing regions
• __% to non-producing regions
• __% to special interest groups
• “Fair” formula with broad-based and public consultation
42
SHARING THE WEALTH: A ROADMAP FOR DISTRIBUTING MYANMAR’S NATURAL RESOURCE REVENUES
For illustrative purposes, we modelled a set of
indicator-based revenue sharing formulas based
on 2014 Myanmar Population and Housing Census
data. Assuming a given vertical allocation to all
states or regions, we compared the current system
of ad hoc horizontal allocation to four indicator-
based formulas:
1 A population-based formula
2 A pure needs-based formula using an average
of three indicators weighted equally: literacy
rates, percentage of households without
electricity for lighting, and percentage of
individuals without access to “improved”
drinking water
3 A needs-based formula stressing access to
education and educational opportunities
using access to internet at home and literacy as
proxies, weighted equally
4 A weighted formula: population (40 percent),
literacy (20 percent), electricity (20 percent),
water (20 percent)
As table 4 shows, an allocation based on either
population or development needs would suggest
a significantly higher proportion of fiscal transfers
to Ayeyarwady, Bago, Mandalay and Yangon. The
development needs approach would also suggest
a higher proportion of transfers to Shan state. The
analysis also suggests a smaller relative share to
Chin, Kachin, Kayah and Tanintharyi.
Our analysis must be caveated in at least three
ways. First, we emphasize that these formulas
are not meant as recommendations. They are
only illustrative of the consequences of different
formulas on horizontal revenue allocation.
Second, none of the formulas include oil, gas
or mineral production or revenue figures, nor
environmental or livelihood indicators that could
be used in an extractive-based revenue sharing
formula. This is due to the lack of available data,
notwithstanding the release of Myanmar’s first
EITI report. Unfortunately, project-by-project
payments or production data was excluded from
the report, prohibiting the information from
being used for this purpose. Were the information
available, several of the models could have
incorporated state-level production or resource
revenue indicators. If we had been able to develop
formulas incorporating mining production or
revenues, Kachin, Sagaing, Shan and Mandalay,
for instance, might have received a higher share
of revenues compared to our models in Table 4.
If onshore oil production or revenues were to be
included, Bago and Magway, for example, might
have received a higher share.
Third, we only model horizontal allocation. The
figures say nothing about the vertical allocation of
resource revenues (the split between the national
government and all subnational governments);
they refer strictly to the respective allocation to
different states and regions given a specific pool
of funds for all subnational governments. The
pool itself can be enlarged either by reallocating
revenues from the national government to
subnational governments or by growing the pool
for all by generating more resource revenues.
Beyond the scope of this paper, we refer to the
literature on fiscal regimes, revenue collection and
state-owned company reform, including NRGI’s
report Gilded Gatekeepers: Myanmar’s State-Owned Oil, Gas and Mining Enterprises.
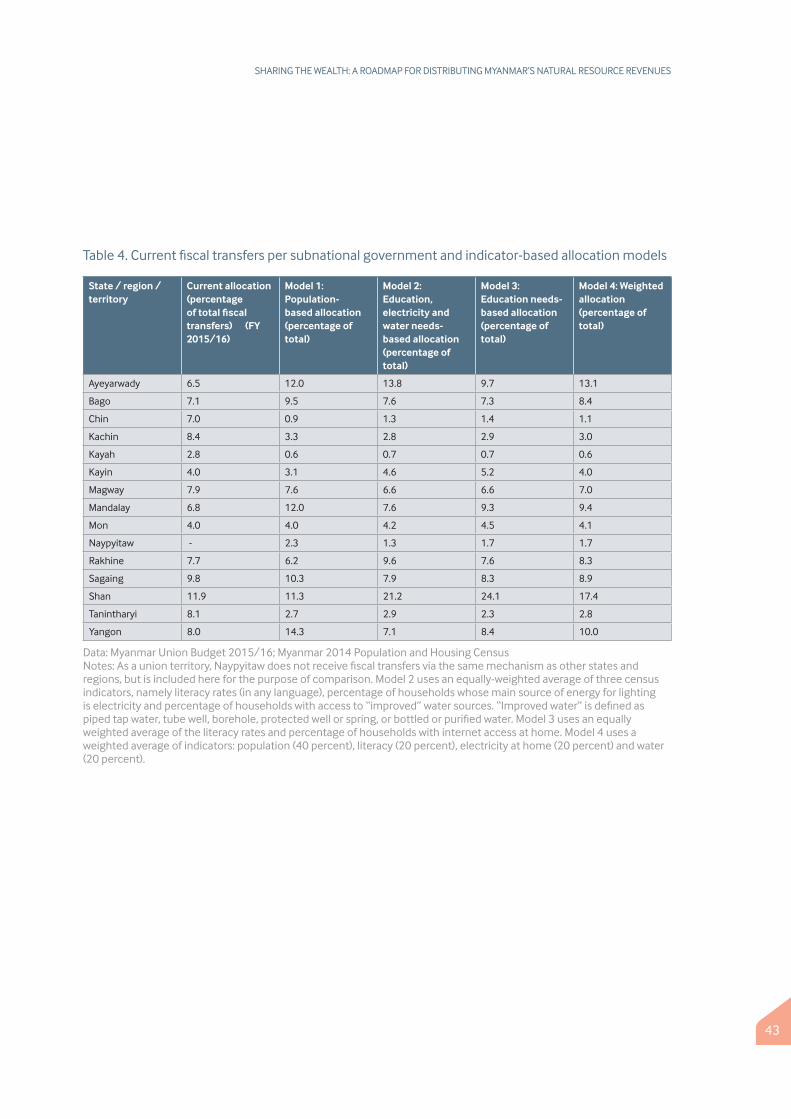
43
SHARING THE WEALTH: A ROADMAP FOR DISTRIBUTING MYANMAR’S NATURAL RESOURCE REVENUES
Table 4. Current fiscal transfers per subnational government and indicator-based allocation models
State / region / territory
Current allocation (percentage of total fiscal transfers) (FY 2015/16)
Model 1: Population-based allocation (percentage of total)
Model 2: Education, electricity and water needs-based allocation (percentage of total)
Model 3: Education needs-based allocation (percentage of total)
Model 4: Weighted allocation (percentage of total)
Ayeyarwady 6.5 12.0 13.8 9.7 13.1
Bago 7.1 9.5 7.6 7.3 8.4
Chin 7.0 0.9 1.3 1.4 1.1
Kachin 8.4 3.3 2.8 2.9 3.0
Kayah 2.8 0.6 0.7 0.7 0.6
Kayin 4.0 3.1 4.6 5.2 4.0
Magway 7.9 7.6 6.6 6.6 7.0
Mandalay 6.8 12.0 7.6 9.3 9.4
Mon 4.0 4.0 4.2 4.5 4.1
Naypyitaw - 2.3 1.3 1.7 1.7
Rakhine 7.7 6.2 9.6 7.6 8.3
Sagaing 9.8 10.3 7.9 8.3 8.9
Shan 11.9 11.3 21.2 24.1 17.4
Tanintharyi 8.1 2.7 2.9 2.3 2.8
Yangon 8.0 14.3 7.1 8.4 10.0
Data: Myanmar Union Budget 2015/16; Myanmar 2014 Population and Housing CensusNotes: As a union territory, Naypyitaw does not receive fiscal transfers via the same mechanism as other states and regions, but is included here for the purpose of comparison. Model 2 uses an equally-weighted average of three census indicators, namely literacy rates (in any language), percentage of households whose main source of energy for lighting is electricity and percentage of households with access to “improved” water sources. “Improved water” is defined as piped tap water, tube well, borehole, protected well or spring, or bottled or purified water. Model 3 uses an equally weighted average of the literacy rates and percentage of households with internet access at home. Model 4 uses a weighted average of indicators: population (40 percent), literacy (20 percent), electricity at home (20 percent) and water (20 percent).
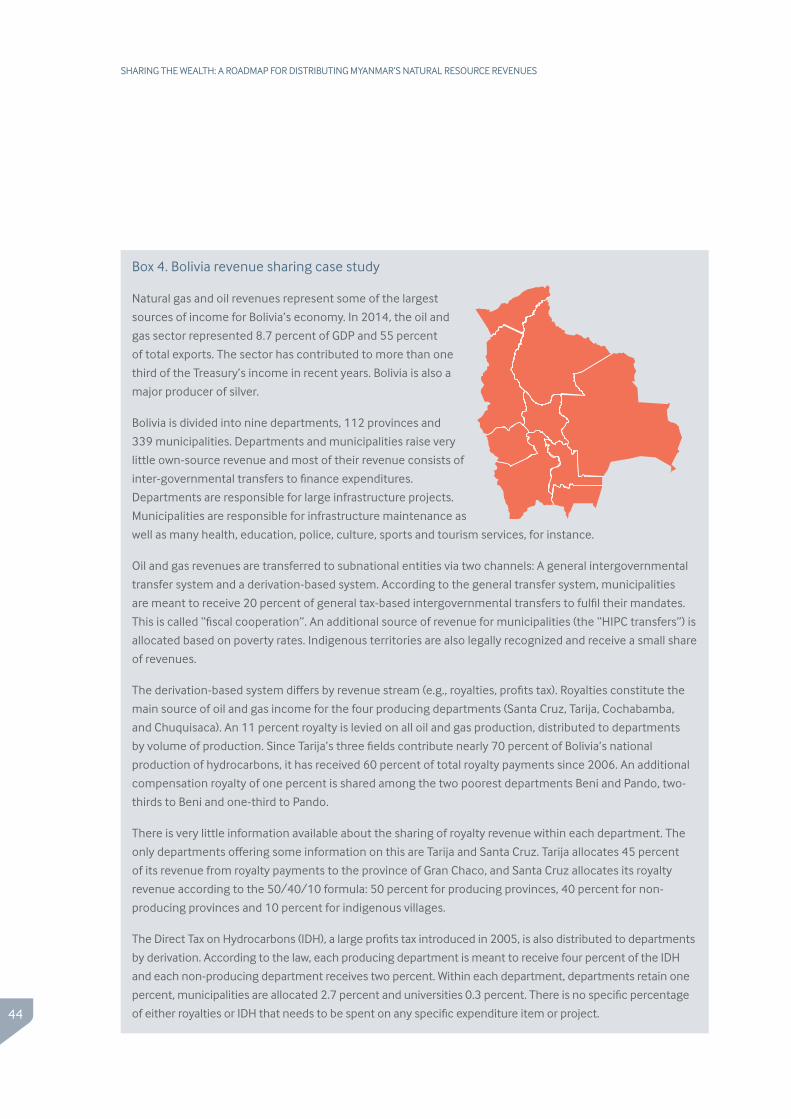
44
SHARING THE WEALTH: A ROADMAP FOR DISTRIBUTING MYANMAR’S NATURAL RESOURCE REVENUES
Box 4. Bolivia revenue sharing case study
Natural gas and oil revenues represent some of the largest
sources of income for Bolivia’s economy. In 2014, the oil and
gas sector represented 8.7 percent of GDP and 55 percent
of total exports. The sector has contributed to more than one
third of the Treasury’s income in recent years. Bolivia is also a
major producer of silver.
Bolivia is divided into nine departments, 112 provinces and
339 municipalities. Departments and municipalities raise very
little own-source revenue and most of their revenue consists of
inter-governmental transfers to finance expenditures.
Departments are responsible for large infrastructure projects.
Municipalities are responsible for infrastructure maintenance as
well as many health, education, police, culture, sports and tourism services, for instance.
Oil and gas revenues are transferred to subnational entities via two channels: A general intergovernmental
transfer system and a derivation-based system. According to the general transfer system, municipalities
are meant to receive 20 percent of general tax-based intergovernmental transfers to fulfil their mandates.
This is called “fiscal cooperation”. An additional source of revenue for municipalities (the “HIPC transfers”) is
allocated based on poverty rates. Indigenous territories are also legally recognized and receive a small share
of revenues.
The derivation-based system differs by revenue stream (e.g., royalties, profits tax). Royalties constitute the
main source of oil and gas income for the four producing departments (Santa Cruz, Tarija, Cochabamba,
and Chuquisaca). An 11 percent royalty is levied on all oil and gas production, distributed to departments
by volume of production. Since Tarija’s three fields contribute nearly 70 percent of Bolivia’s national
production of hydrocarbons, it has received 60 percent of total royalty payments since 2006. An additional
compensation royalty of one percent is shared among the two poorest departments Beni and Pando, two-
thirds to Beni and one-third to Pando.
There is very little information available about the sharing of royalty revenue within each department. The
only departments offering some information on this are Tarija and Santa Cruz. Tarija allocates 45 percent
of its revenue from royalty payments to the province of Gran Chaco, and Santa Cruz allocates its royalty
revenue according to the 50/40/10 formula: 50 percent for producing provinces, 40 percent for non-
producing provinces and 10 percent for indigenous villages.
The Direct Tax on Hydrocarbons (IDH), a large profits tax introduced in 2005, is also distributed to departments
by derivation. According to the law, each producing department is meant to receive four percent of the IDH
and each non-producing department receives two percent. Within each department, departments retain one
percent, municipalities are allocated 2.7 percent and universities 0.3 percent. There is no specific percentage
of either royalties or IDH that needs to be spent on any specific expenditure item or project.
45
SHARING THE WEALTH: A ROADMAP FOR DISTRIBUTING MYANMAR’S NATURAL RESOURCE REVENUES
70 The Bono Juancito Pinto is a cash transfer in Bolivia whose beneficiaries are children going to public schools. It was established in 2006 with the aim of reducing dropout rates. It is paid through two installments, one at the beginning of the academic year and one at the end of it, each of USD 14.50 per student.
71 See reports: http://www.economiayfinanzas.gob.bo/?opcion=com_contenido&ver=contenido&id=2885&id_item=646&seccion=269&categoria=1523 and http://www.economiayfinanzas.gob.bo/viceministerio-de-presupuesto-y-contabilidad-fiscal.html
72 See report: http://www.udape.gob.bo/portales_html/dossierweb2012/doss0308.htm.73 See data: http://www2.hidrocarburos.gob.bo/index.php/viceministerios/97-viceministerio-de-exploracion-y-expltacion-de-
hidrocarburos/liquidaci%C3%B3n-de-regalias-y-participaci%C3%B3n-al-tgn.html
In October 2007, President Evo Morales changed the internal distribution of IDH revenue inside
departments: the share accruing to municipal governments would increase from 34 percent to 67 percent,
while transfers made to departments would diminish from 57 percent to 24 percent. This change was part
of the country’s fiscal decentralization process. Municipalities today receive more than one third of their
revenue from the IDH. In 2012, 47 percent of total revenue received by municipalities came from the IDH.
The rest largely came from their participation in revenue received from the application of the general fiscal
regime (fiscal co-participation), most of which does not necessarily come from the oil and gas sector.
The revenue from the IDH also allows the government to finance a universal old-age pension scheme,
Renta Dignidad (formerly known as Bonosol) as well as other conditional cash transfers programs, such as
the Bono Juancito Pinto.70 While the distribution of revenue from the IDH has been modified several times
by the current President, the 11 percent royalty has been unaltered since its creation, and it constitutes a
critical source of income for Bolivia’s four producing departments. Bolivia’s 2009 Constitution turned this
royalty into a legal right, making it even more difficult to change.
The national government discloses a large amount of disaggregated information on oil, gas and mineral
revenues and fiscal transfers. This allows local governments to verify they are receiving their entitlements.
For example, the Ministry of Finance releases all data on transfers made to departments, municipalities and
universities, as well as on cash transfers made to private beneficiaries (Renta Dignidad and Bono Juancito
Pinto). The report provides the beneficiaries for each transfer and the amount. Intergovernmental transfers
made to departments, municipalities, and universities—including IDH transfers but not royalties—are
available in the Ministry of Economy and Finance webpage.71
The Analysis Unit of Social and Economic Policy, an executive branch research unit, also offers
disaggregated information on revenues transfer to and between departments, provinces and municipalities,
including royalties.72 Additionally, a breakdown by type of revenue is available for each municipality:
revenue from fiscal co-participation, HIPC flows, as well as IDH transfers. The information is presented in a
clear and understandable way.
Finally, the website of the Ministry of Hydrocarbons and Energy contains a Royalty Information System,
which shows information about the hydrocarbon production by department, field and company, as well
as the value of the produced hydrocarbons and the amounts in dollars received by every departmental
government. The data is available on a monthly basis.73
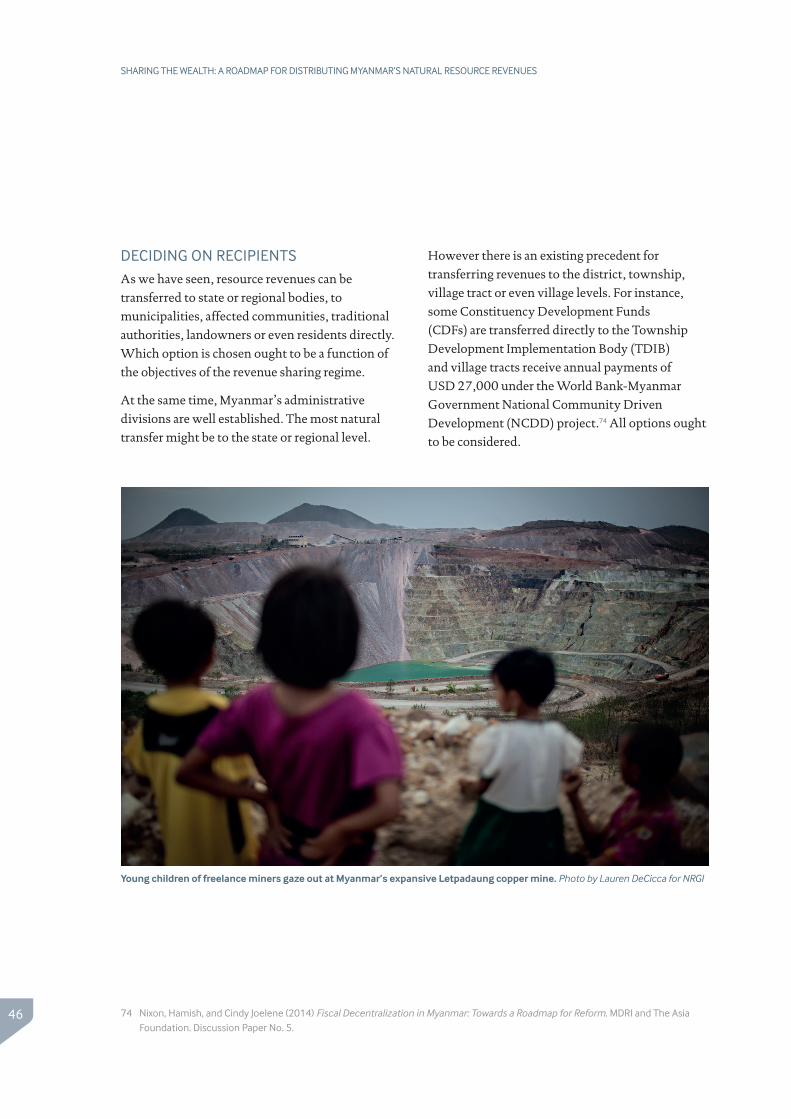
46
SHARING THE WEALTH: A ROADMAP FOR DISTRIBUTING MYANMAR’S NATURAL RESOURCE REVENUES
74 Nixon, Hamish, and Cindy Joelene (2014) Fiscal Decentralization in Myanmar: Towards a Roadmap for Reform. MDRI and The Asia Foundation. Discussion Paper No. 5.
DECIDING ON RECIPIENTS
As we have seen, resource revenues can be
transferred to state or regional bodies, to
municipalities, affected communities, traditional
authorities, landowners or even residents directly.
Which option is chosen ought to be a function of
the objectives of the revenue sharing regime.
At the same time, Myanmar’s administrative
divisions are well established. The most natural
transfer might be to the state or regional level.
However there is an existing precedent for
transferring revenues to the district, township,
village tract or even village levels. For instance,
some Constituency Development Funds
(CDFs) are transferred directly to the Township
Development Implementation Body (TDIB)
and village tracts receive annual payments of
USD 27,000 under the World Bank-Myanmar
Government National Community Driven
Development (NCDD) project.74 All options ought
to be considered.
Young children of freelance miners gaze out at Myanmar’s expansive Letpadaung copper mine. Photo by Lauren DeCicca for NRGI
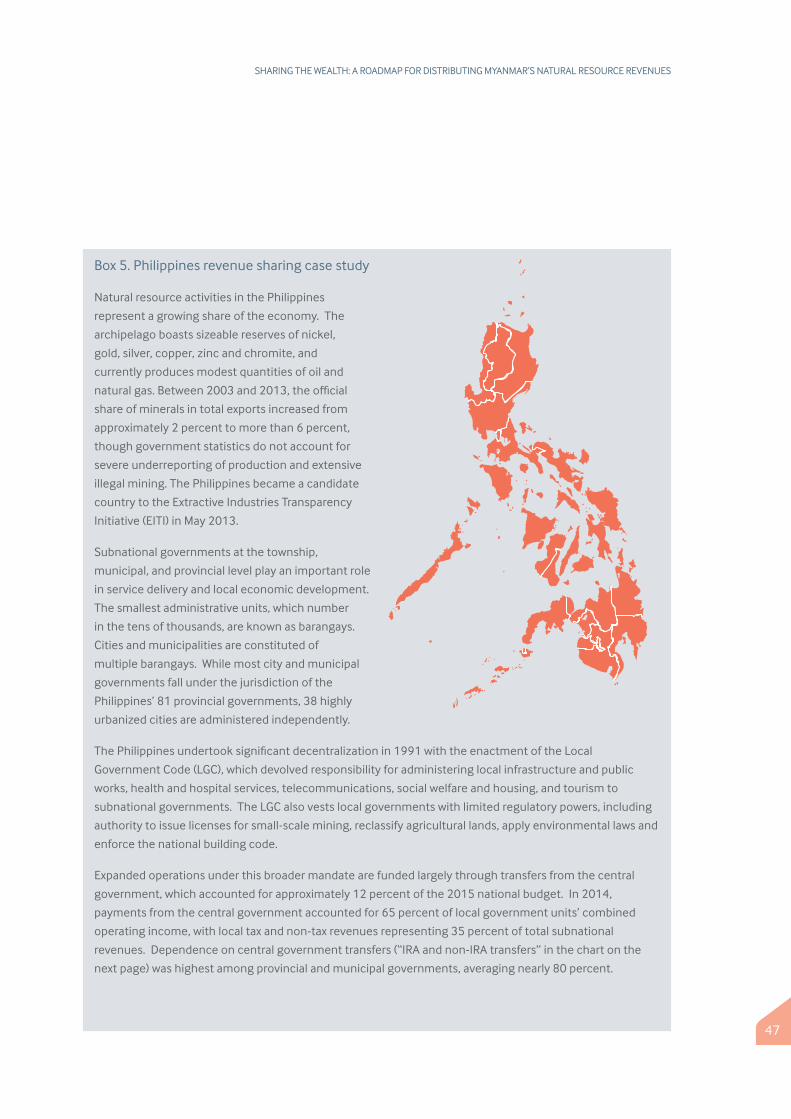
47
SHARING THE WEALTH: A ROADMAP FOR DISTRIBUTING MYANMAR’S NATURAL RESOURCE REVENUES
Box 5. Philippines revenue sharing case study
Natural resource activities in the Philippines
represent a growing share of the economy. The
archipelago boasts sizeable reserves of nickel,
gold, silver, copper, zinc and chromite, and
currently produces modest quantities of oil and
natural gas. Between 2003 and 2013, the official
share of minerals in total exports increased from
approximately 2 percent to more than 6 percent,
though government statistics do not account for
severe underreporting of production and extensive
illegal mining. The Philippines became a candidate
country to the Extractive Industries Transparency
Initiative (EITI) in May 2013.
Subnational governments at the township,
municipal, and provincial level play an important role
in service delivery and local economic development.
The smallest administrative units, which number
in the tens of thousands, are known as barangays.
Cities and municipalities are constituted of
multiple barangays. While most city and municipal
governments fall under the jurisdiction of the
Philippines’ 81 provincial governments, 38 highly
urbanized cities are administered independently.
The Philippines undertook significant decentralization in 1991 with the enactment of the Local
Government Code (LGC), which devolved responsibility for administering local infrastructure and public
works, health and hospital services, telecommunications, social welfare and housing, and tourism to
subnational governments. The LGC also vests local governments with limited regulatory powers, including
authority to issue licenses for small-scale mining, reclassify agricultural lands, apply environmental laws and
enforce the national building code.
Expanded operations under this broader mandate are funded largely through transfers from the central
government, which accounted for approximately 12 percent of the 2015 national budget. In 2014,
payments from the central government accounted for 65 percent of local government units’ combined
operating income, with local tax and non-tax revenues representing 35 percent of total subnational
revenues. Dependence on central government transfers (“IRA and non-IRA transfers” in the chart on the
next page) was highest among provincial and municipal governments, averaging nearly 80 percent.
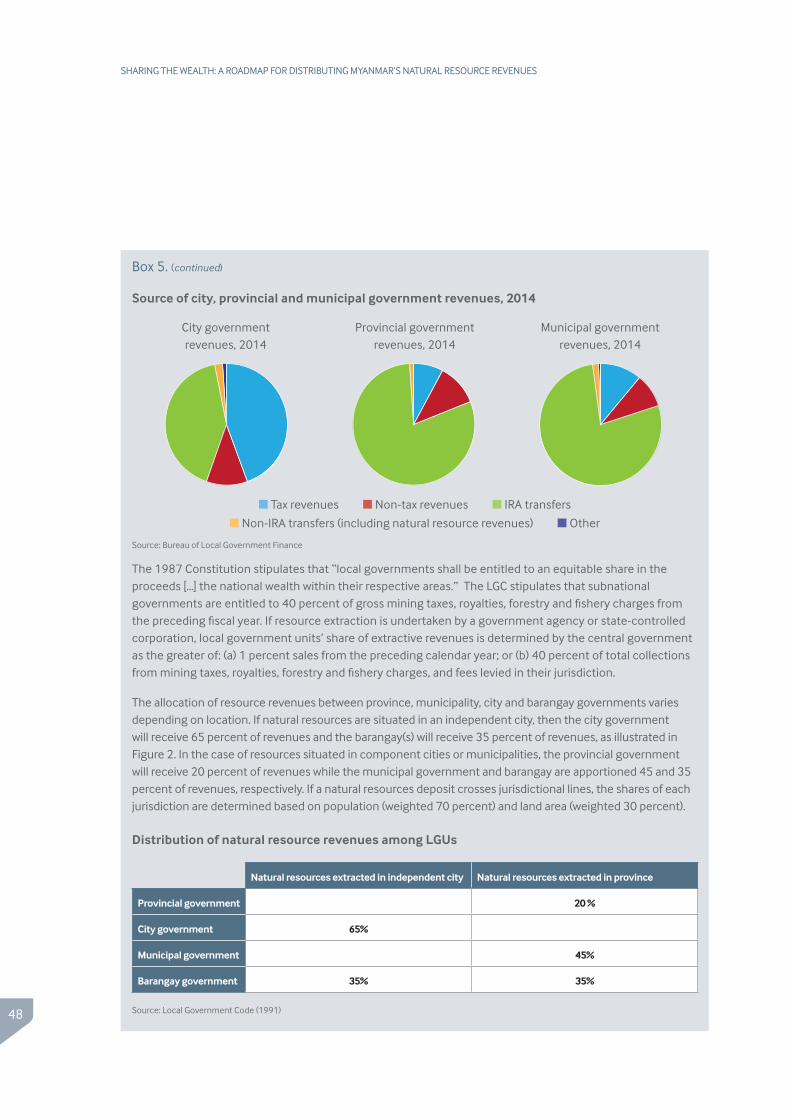
48
SHARING THE WEALTH: A ROADMAP FOR DISTRIBUTING MYANMAR’S NATURAL RESOURCE REVENUES
Box 5. (continued)
Source of city, provincial and municipal government revenues, 2014
n Tax revenues n Non-tax revenues n IRA transfers
n Non-IRA transfers (including natural resource revenues) n Other
Source: Bureau of Local Government Finance
The 1987 Constitution stipulates that “local governments shall be entitled to an equitable share in the proceeds […] the national wealth within their respective areas.” The LGC stipulates that subnational governments are entitled to 40 percent of gross mining taxes, royalties, forestry and fishery charges from the preceding fiscal year. If resource extraction is undertaken by a government agency or state-controlled corporation, local government units’ share of extractive revenues is determined by the central government as the greater of: (a) 1 percent sales from the preceding calendar year; or (b) 40 percent of total collections from mining taxes, royalties, forestry and fishery charges, and fees levied in their jurisdiction.
The allocation of resource revenues between province, municipality, city and barangay governments varies depending on location. If natural resources are situated in an independent city, then the city government will receive 65 percent of revenues and the barangay(s) will receive 35 percent of revenues, as illustrated in Figure 2. In the case of resources situated in component cities or municipalities, the provincial government will receive 20 percent of revenues while the municipal government and barangay are apportioned 45 and 35 percent of revenues, respectively. If a natural resources deposit crosses jurisdictional lines, the shares of each jurisdiction are determined based on population (weighted 70 percent) and land area (weighted 30 percent).
Distribution of natural resource revenues among LGUs
Natural resources extracted in independent city Natural resources extracted in province
Provincial government 20 %
City government 65%
Municipal government 45%
Barangay government 35% 35%
Source: Local Government Code (1991)
City government revenues, 2014
Provincial government revenues, 2014
Municipal government revenues, 2014
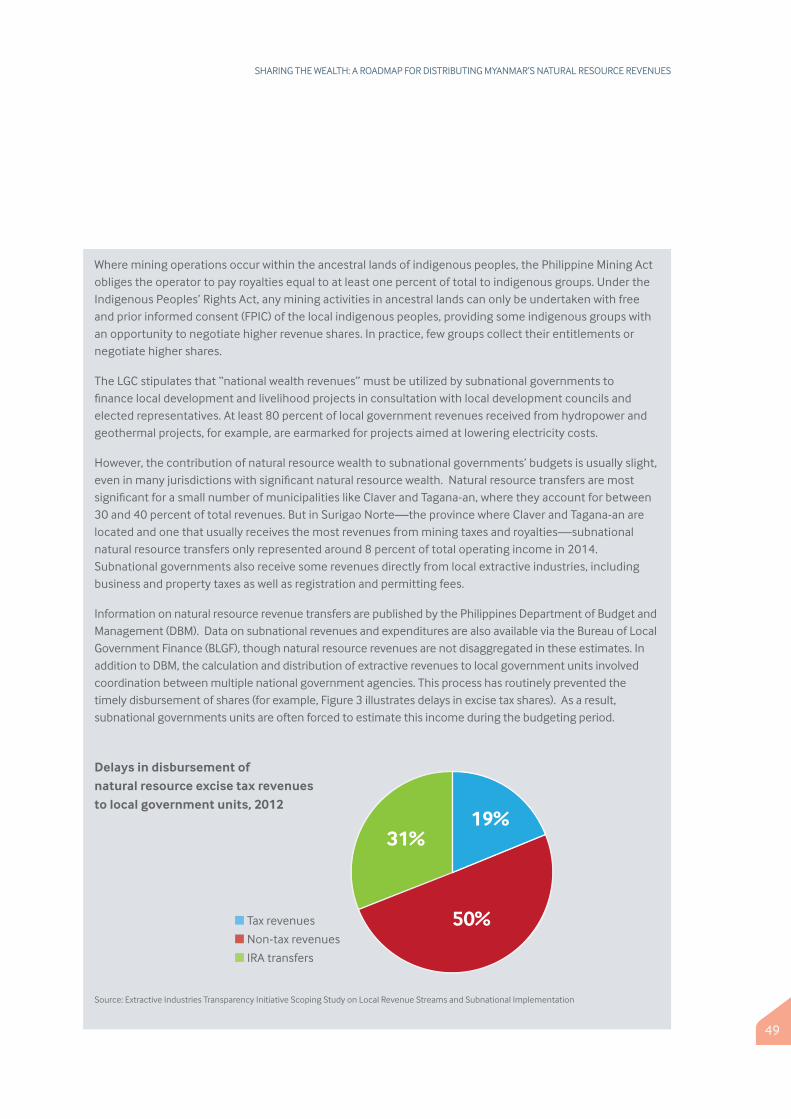
49
SHARING THE WEALTH: A ROADMAP FOR DISTRIBUTING MYANMAR’S NATURAL RESOURCE REVENUES
Where mining operations occur within the ancestral lands of indigenous peoples, the Philippine Mining Act obliges the operator to pay royalties equal to at least one percent of total to indigenous groups. Under the Indigenous Peoples’ Rights Act, any mining activities in ancestral lands can only be undertaken with free and prior informed consent (FPIC) of the local indigenous peoples, providing some indigenous groups with an opportunity to negotiate higher revenue shares. In practice, few groups collect their entitlements or negotiate higher shares.
The LGC stipulates that “national wealth revenues” must be utilized by subnational governments to finance local development and livelihood projects in consultation with local development councils and elected representatives. At least 80 percent of local government revenues received from hydropower and geothermal projects, for example, are earmarked for projects aimed at lowering electricity costs.
However, the contribution of natural resource wealth to subnational governments’ budgets is usually slight, even in many jurisdictions with significant natural resource wealth. Natural resource transfers are most significant for a small number of municipalities like Claver and Tagana-an, where they account for between 30 and 40 percent of total revenues. But in Surigao Norte—the province where Claver and Tagana-an are located and one that usually receives the most revenues from mining taxes and royalties—subnational natural resource transfers only represented around 8 percent of total operating income in 2014. Subnational governments also receive some revenues directly from local extractive industries, including business and property taxes as well as registration and permitting fees.
Information on natural resource revenue transfers are published by the Philippines Department of Budget and Management (DBM). Data on subnational revenues and expenditures are also available via the Bureau of Local Government Finance (BLGF), though natural resource revenues are not disaggregated in these estimates. In addition to DBM, the calculation and distribution of extractive revenues to local government units involved coordination between multiple national government agencies. This process has routinely prevented the timely disbursement of shares (for example, Figure 3 illustrates delays in excise tax shares). As a result, subnational governments units are often forced to estimate this income during the budgeting period.
Delays in disbursement of natural resource excise tax revenues to local government units, 2012
Source: Extractive Industries Transparency Initiative Scoping Study on Local Revenue Streams and Subnational Implementation
31%19%
50%n Tax revenues
n Non-tax revenues
n IRA transfers
50
SHARING THE WEALTH: A ROADMAP FOR DISTRIBUTING MYANMAR’S NATURAL RESOURCE REVENUES
75 Bauer, Andrew (2013) Subnational Oil, Gas and Mineral Revenue Management. Revenue Watch Institute. Online: http://www.resourcegovernance.org/sites/default/files/RWI_Sub_Oil_Gas_Mgmt_EN_rev1.pdf
STABILIZING RESOURCE REVENUE TRANSFERS
Derivation-based transfers, as previously
mentioned, are usually extremely ‘pro-cyclical’.
Under these systems, when resource revenues
increase, resource-rich regions receive more
revenues. Since economic activity is strongly
correlated with resource revenues in resource-
rich regions, government spending increases
just as the local economy booms. The problem
is that when spending increases too quickly, a
bureaucracy will likely find it difficult to adjust,
which can lead to poorly conceived, designed
and executed projects. In these situations, there
is a tendency for the government to spend on
conspicuous infrastructure projects like fountains
and expensive government buildings (e.g.,
Kazakhstan’s new presidential palace; Ite’s new
municipal building in Peru). When revenues
decline unexpectedly, the usual consequence is
an increase in public debt or expenditure cuts.
Roads are left half-finished and buildings go
unmaintained.
How difficult the adjustment will be depends
on the so-called “absorptive capacity” of the
government and the economy. Absorptive capacity
is a government’s ability to transform financial
resources into concrete infrastructure and social
services efficiently. It also encompasses the ability
of the domestic private sector to provide the
goods and services contracted by the government.
Absorptive capacity depends on the domestic
supply of qualified labor, speed at which people
can be trained, ease of access to inputs, ease of
access to credit for businesses, and the presence
of management systems and institutions that can
cope with an increase in spending.
If there is adequate supply of capital (financing and
equipment) and local labor to meet the demand
generated by an inflow of resource revenues into
the local economy, then local businesses will thrive
and employment will increase. On the other hand,
if local businesses cannot absorb these revenue
inflows, for instance because there is not enough
skilled labor, then the inflow of money into the
local economy may cause a sudden influx of foreign
workers or contractors. It can also lead to super-
profits for existing construction companies as they
raise they prices, generating local inflation rather
than more infrastructure.
The problem can be worse and spread to the private
sector when government spending declines after
a sudden drop in oil or mining revenues. When
businesses grow and proliferate when government
expenditures are high, they become particularly
vulnerable to government spending cuts, since
the government is often the main source of large
contracts in resource-rich regions. In this way,
government expenditure volatility can lead to
bankruptcies in the wider economy.75
There are at least four possible ways to address this
challenge.
First, subnational governments can be allowed
to save resource revenue windfalls for when
revenues decline unexpectedly, for example in a
natural resource fund. This way they can smooth
spending rather than succumb to boom-bust

51
SHARING THE WEALTH: A ROADMAP FOR DISTRIBUTING MYANMAR’S NATURAL RESOURCE REVENUES
76 Natural Resource Governance Institute-Columbia Center on Sustainable Investment (2014) “Natural Resource Fund Governance: The Essentials” in Managing the public trust: How to make natural resource funds work for citizens. Online: http://www.resourcegovernance.org/sites/default/files/NRF_Complete_Report_EN.pdf
77 Bauer, Andrew (2013) Subnational Oil, Gas and Mineral Revenue Management. Revenue Watch Institute. Online: http://www.resourcegovernance.org/sites/default/files/RWI_Sub_Oil_Gas_Mgmt_EN_rev1.pdf
cycles. However subnational governments may
have trouble managing these savings; local natural
resource funds are often used as channels for
patronage and corruption. Several North American
states, provinces and territories have created
such funds (e.g., Alberta, Northwest Territories,
Wyoming) and the oil-rich Indonesian regency of
Bojonegoro is currently establishing one.76
Second, subnational governments can borrow
when revenues decline and pay down that debt
when there is a large resource revenue windfall.
While this option circumvents the governance
challenges associated with natural resource funds,
they pose their own challenges. Most important is
a tendency to over-borrow and eventually default,
particularly where the national government
provides an implicit guarantee on subnational debt.
Chile, Colombia, Indonesia, Mexico and Russia
all bailed out local governments between 1982
and 2000. However, other national governments,
like those in Bolivia, Nigeria and Peru, have either
made policy decisions or have legal frameworks in
place that have allowed subnational government
defaults to happen. Subnational debt crises in these
countries have often led to a severe contraction of
local services, cuts in wages and social conflict. For
these reasons, many countries prevent subnational
governments from borrowing.77
Third, the Union government could smooth
transfers on behalf of subnational governments.
For example, the government could establish a
subnational transfer fund and make allocations not
on an annual basis but based on a seven- to eleven-
year moving average of resource revenues. The U.S.
state of Alaska employs such a fund (the Alaska
Permanent Fund) to smooth resource revenue
transfers to households. While this model may be
attractive in theory, it may be politically unfeasible.
Subnational governments often seek control over
their own resource revenue management and could
be opposed to complex management by the central
government, even if it’s in the public interest.
Four, rather than a derivation-based formula, an
indicator-based formula could be used, one that
is designed to be “counter-cyclical.” For example,
resource revenues can be distributed based on fiscal
gap or unemployment indicators.
Whichever option might be chosen, any revenue
sharing system ought to consider its implications
on subnational expenditure volatility.
EARMARKING RESOURCE REVENUES
Certain countries earmark resource revenue
transfers to certain expenditure items. In Bolivia,
Brazil, Colombia, Papua New Guinea and Peru, the
law or the central government require earmarking
resource revenue transfers to specific investment
projects, limiting subnational government
discretion in planning how such revenues might be
spent. These earmarks can either be to agencies or
by sector.
In Indonesia, 0.5 percent of resource revenues
must be allocated to education by the provinces
and regencies. In Bolivia, 70 percent of transfers
to regions and municipalities must be spent on
health insurance and productive investments. The
52
SHARING THE WEALTH: A ROADMAP FOR DISTRIBUTING MYANMAR’S NATURAL RESOURCE REVENUES
78 Morgandi, Matteo (2008) Extractive Industries Revenues Distribution at the Sub-National Level. Revenue Watch Institute. Online: http://www.resourcegovernance.org/publications/extractive-industries-revenues-distribution-subnational-level.
79 Shah, Anwar (2007) “A Practitioner’s Guide to Intergovernmental Fiscal Transfers” in Intergovernmental Fiscal Transfers: Principles and Practice (eds. Robin Boadway and Anwar Shah). World Bank: Washington DC.
remaining 30 percent must be spent on pensions.
In Papua New Guinea, communal landowners
must save 30 percent of their resource revenue
share for future generations, spend 30 percent on
local health, education and social development
programs, and can retain the remainder in cash.78
Conditional grants can be helpful in guaranteeing
financing for chronically underfunded expenditure
items, like environmental protection or education.
They can also be politically useful in messaging a
government’s commitment to development and in
demonstrating benefits from resource extraction.
On the other hand, they can undermine budgetary
autonomy and flexibility without guaranteeing
improved results. They may also be ineffective,
as resource revenues are fungible and therefore
interchangeable with non-resource revenues.
Governments can simply shift revenues around to
make it seem like resource revenues are being spent
on a given expenditure item.79
What’s more, resource revenues are not an ideal
source of earmarked funds since they are volatile
and unpredictable. Earmarking resource revenues
for a local education program, for example, could
force a government to cancel planned scholarships
if commodity prices drop unexpectedly, harming
students’ future prospects.
One alternative to earmarking might be
performance-based grants, whereby transfers
from the central government are only made
if certain local targets are met, like a school
attendance target. However this would undermine
any derivation principle and subnational fiscal
independence.
TRANSPARENCY AND OVERSIGHT MECHANISMS
Transparency
A resource revenue sharing regime can only help
to build trust between levels of government
if revenues and flows are verifiable. What
information is necessary to verify that the correct
amounts are being transferred depends on the
revenue sharing formula.
In general, derivation-based formulas require at
the least project-by-project stream-by-stream
payments information, in addition to the formula
itself. For instance, the formula might require
information on royalties, fees and bonuses paid
on a specific mine or oil field. It may therefore be
important to include this level of disaggregation
in Myanmar’s future EITI reporting and in the
Auditor-General’s report on SEEs to the Pyithu
Hltuttaw’s Public Accounts Committee. However,
if subnational governments wish to verify
that companies are in fact paying the required
amount on the projects in their territory, they
may also need information on costs, profits, price
assumptions, volume of production, quality of
ore/oil, and even contracts. Given the complexity
inherent in resource contracts and tax regimes,
subnational governments may wish to consider
hiring independent auditors to verify any fiscal
entitlements.
Indicator-based formulas necessitate a much
higher degree of data transparency. What
information ought to be made public is clearly
dependent on the formula. However, in general,
the basis for making any assessment and the
53
SHARING THE WEALTH: A ROADMAP FOR DISTRIBUTING MYANMAR’S NATURAL RESOURCE REVENUES
80 “Commonwealth Grants Commission,” Australian Government, accessed January 21, 2016, https://www.cgc.gov.au/81 For more information on the new EITI standard, please see http://www.resourcegovernance.org/eitiguide/ or https://eiti.org/
document/standard. 82 See reports: http://www.economiayfinanzas.gob.bo/?opcion=com_contenido&ver=contenido&id=2885&id_
item=646&seccion=269&categoria=1523 and http://www.economiayfinanzas.gob.bo/viceministerio-de-presupuesto-y-contabilidad-fiscal.html
83 See report: http://www.udape.gob.bo/portales_html/dossierweb2012/doss0308.htm.84 See data: http://www2.hidrocarburos.gob.bo/index.php/viceministerios/97-viceministerio-de-exploracion-y-expltacion-de-
hidrocarburos/liquidaci%C3%B3n-de-regalias-y-participaci%C3%B3n-al-tgn.html
underlying calculations should be publicly
disclosed. The Australian Commonwealth Grants
Commission, for example, makes its assessment
criteria available on its website along with detailed
annual calculations per region.80
Under the newly adopted 2013 standard,
Extractive Industries Transparency Initiative
(EITI) reports may include much of the required
data.81 For example, Ghana’s latest EITI
report discloses the revenue sharing formula,
discrepancies between the amount calculated and
transferred by central government to subnational
authorities, and amounts received by subnational
authorities. The report also discloses direct
payments made by companies to subnational
government and amounts received by subnational
governments. The new EITI standard requires
countries to disclose the amount of resource
revenues transferred to subnational governments.
This includes the formula used and certain
resource rents collected directly by subnational
governments. However it does not require that
these figures be compared to what subnational
governments should be receiving under any
transfer formula.
Bolivia provides a good model of resource revenue
transparency. The Ministry of Finance releases
all data on transfers made to departments,
municipalities and universities, as well as on cash
transfers made to private beneficiaries (Renta Dignidad and Bono Juancito Pinto). The report
provides the beneficiaries for each transfer and
the amount. Intergovernmental transfers made to
departments, municipalities, and universities—
including IDH transfers but not royalties—are
available in the Ministry of Economy and Finance
webpage.82
The Analysis Unit of Social and Economic Policy,
an executive branch research unit, also offers
disaggregated information on revenues transfer
to and between departments, provinces and
municipalities, including royalties.83 Additionally,
a breakdown by revenue stream is available for each
municipality. The information is presented in a
clear and understandable way.
Finally, the website of the Ministry of
Hydrocarbons and Energy contains a Royalty
Information System, which shows information
about the hydrocarbon production by department,
field and company, as well as the value of the
produced hydrocarbons and the amounts in dollars
received by every departmental government. The
data is available on a monthly basis.84
Revenue transparency at the subnational level
has already proven effective in Peru, where public
disclosures have led to improved public spending.
As a result of the availability of project-level data,
some regions managed to forecast what they are
owed in resource revenue transfers and use the
data to improve their strategic planning. Revenue
transparency also encouraged producing and
Revenue transparency at the subnational level has already proven effective in Peru, where public disclosures have led to improved public spending.
54
SHARING THE WEALTH: A ROADMAP FOR DISTRIBUTING MYANMAR’S NATURAL RESOURCE REVENUES
85 Jungbluth, Werner (2012) Spending Wisely: Helping Peruvians Manage Resource Wealth. Revenue Watch Institute. Online: http://www.resourcegovernance.org/publications/spending-wisely-helping-peruvians-manage-resource-wealth
86 Morgandi, Matteo (2008) Extractive Industries Revenues Distribution at the Sub-National Level. Revenue Watch Institute. Online: http://www.resourcegovernance.org/publications/extractive-industries-revenues-distribution-subnational-level.
87 Shah, Anwar (2007) “Institutional Arrangements for Intergovernmental Fiscal Transfers and a Framework for Evaluation” in Intergovernmental Fiscal Transfers: Principles and Practice (eds. Robin Boadway and Anwar Shah), Washington DC: World Bank.
non-producing subnational governments to debate
policy options for sharing revenue. Together, they
formulated a proposal to create a more transparent,
rules-based revenue transfer system that informed
congressional debates on reforming revenue
sharing laws.85
Oversight
The capacity and incentives of actors to monitor
their revenue sharing systems is often inadequate.
This is particularly the case for actors further
down the government hierarchy, specifically
municipalities and indigenous groups who are
entitled to a share of resource revenues. The
distribution of revenues through a chain of
beneficiaries—such as regional governments
paying municipal governments out of private
accounts rather than through designated
accounts—also seems to hinder monitoring. The
same problem may be faced by local governments
or private beneficiaries when regional branches
of central revenue agencies are in charge of
local payments.86 As a result, revenues often go
uncollected, as in the case of most indigenous
groups in the Philippines, traditional authorities in
Ghana, or municipalities in Nigeria.
In response, in some countries, special bodies—
either administered by the central government
or intergovernmentally—have been established
to review or create the revenue sharing formula,
monitor compliance or solve disputes between
levels of government. In Canada the system
is relatively informal. National and provincial
ministers and officials meet regularly to monitor
and review the fiscal equalization program. They
also conduct intensive reviews every five years.
Similarly, in Indonesia, the Regional Autonomy
Advisory Board—chaired by the minister of home
affairs, co-chaired by the minister of finance, and
with regional and local representation—advises
the president on all aspects of local government
organization and finance issues. In Nigeria, the
Revenue Mobilization, Allocation and Fiscal
Commission—chaired by the minister of finance
and that includes finance commissioners from each
state—monitors disbursements to the states and
reviews the subnational allocation formula.
Other countries have established more formal
independent agencies. Australia’s independent
Commonwealth Grants Commission calculates
how the revenues raised from the Goods and
Services Tax (GST) should be distributed to the
states and territories to achieve horizontal fiscal
equalization. It submits its recommendations to all
finance ministers for review and implementation.
In India, every five years the Finance Commissions
are constituted to make recommendations
to the president on subnational transfers and
how to improve revenue generation at the local
level. Under the Indian constitution, the report
must be presented to both houses of parliament
and the government must respond to each
recommendation.87
While the more data-driven formal independent
agencies can help support government decision-
making on intergovernmental transfers, they
are no substitute for a venue where politicians or
technocrats from the regions can discuss revenue
sharing with national authorities. These forums
are also particularly useful for discussing any
55
SHARING THE WEALTH: A ROADMAP FOR DISTRIBUTING MYANMAR’S NATURAL RESOURCE REVENUES
88 Haysom, Nicholas and Sean Kane. (2009) Negotiating natural resources for peace: Ownership, control and wealth-sharing. Center for Humanitarian Dialogue.
potential modifications of the intergovernmental
transfer system. Should Myanmar establish a
resource revenue sharing scheme, it may be worth
considering establishing such a body, along with a
secretariat that could make resource revenue flows
publicly available online at a minimum. Making
these flows publicly available could also be done
through the EITI reporting.
NEGOTIATION PROCESS AND VENUE FOR IMPLEMENTATION
One way of ensuring that any revenue sharing
legislation is clear, stable over time, promotes
spending efficiency and achieves its objectives is
to obtain consensus among all key stakeholders.
As a vital first step, it is important that the parties
have conceptual clarity of the different issues,
especially the difference between ownership
issues, regulatory-authority control issues, and
issues relating to the treatment of natural resource
revenues.88
Haysom and Kane (2009) outline a few major
considerations in negotiating a revenue sharing
formula, including:
1 Transforming a political debate into a technical discussion. Discussions around
natural resource wealth distribution are often
emotionally charged and highly political.
Focusing on technical issues such as common
objectives, formula indicators and stabilization
mechanisms can help transform an emotional
debate into a rational discussion on the merits
of different policy options. It can also can help
manage expectations of what revenue sharing
can accomplish. Bringing in technical experts
can help stakeholders better understand the
trade-offs between different policy options and
draw them together around a common cause.
2 Sharing knowledge. In most negotiations,
parties are generally unequally informed on
how revenue sharing systems work. Equalizing
the knowledge base will not only help smooth
the negotiations, but will also prevent a
situation where one party feels tricked after the
agreement is signed.
3 Identifying stakeholders. The principal
protagonists in a resource wealth conflict—
in Myanmar’s case the central government
and state and regional leaders—may wish to
include representatives of all groups affected
by a resource revenue regime, otherwise
these groups may undermine any agreement.
Key stakeholders may include parliamentary
leaders, representatives from ethnic armed
groups, local community representative, civil
society and religious leaders. Oil, gas and
mining companies, international bodies (e.g.,
ASEAN, IMF, UN, World Bank) and experts
could also be invited as advisors or observers.
These groups can be involved in any stage of a
multi-stage process as long as their views are
reflected in the final outcome.
The venue for a final agreement is equally
important. Most revenue sharing rules, and
sometimes even the formulas themselves,
are codified in law. In rare instances, revenue
allocation mechanisms are referenced in national
constitutions (e.g., Brazil, Canada, Iraq, Nigeria,
South Sudan, United Arab Emirates, Venezuela).
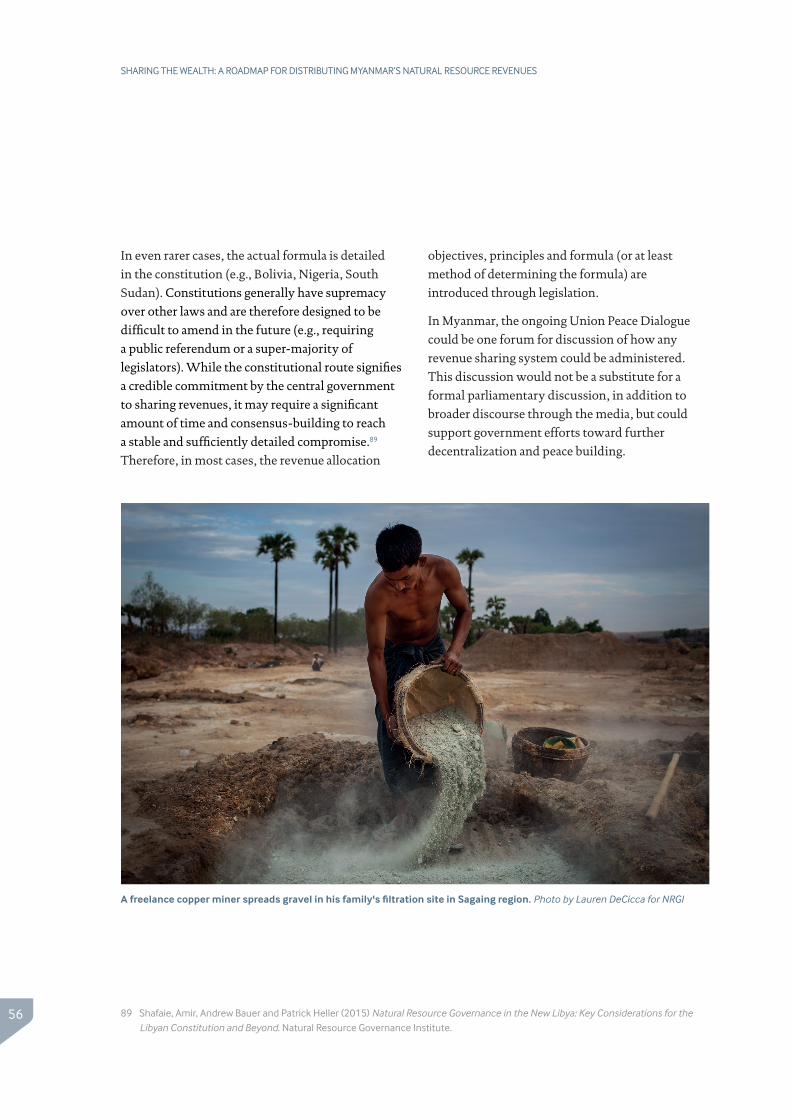
56
SHARING THE WEALTH: A ROADMAP FOR DISTRIBUTING MYANMAR’S NATURAL RESOURCE REVENUES
89 Shafaie, Amir, Andrew Bauer and Patrick Heller (2015) Natural Resource Governance in the New Libya: Key Considerations for the Libyan Constitution and Beyond. Natural Resource Governance Institute.
In even rarer cases, the actual formula is detailed
in the constitution (e.g., Bolivia, Nigeria, South
Sudan). Constitutions generally have supremacy
over other laws and are therefore designed to be
difficult to amend in the future (e.g., requiring
a public referendum or a super-majority of
legislators). While the constitutional route signifies
a credible commitment by the central government
to sharing revenues, it may require a significant
amount of time and consensus-building to reach
a stable and sufficiently detailed compromise.89
Therefore, in most cases, the revenue allocation
objectives, principles and formula (or at least
method of determining the formula) are
introduced through legislation.
In Myanmar, the ongoing Union Peace Dialogue
could be one forum for discussion of how any
revenue sharing system could be administered.
This discussion would not be a substitute for a
formal parliamentary discussion, in addition to
broader discourse through the media, but could
support government efforts toward further
decentralization and peace building.
A freelance copper miner spreads gravel in his family's filtration site in Sagaing region. Photo by Lauren DeCicca for NRGI
57
SHARING THE WEALTH: A ROADMAP FOR DISTRIBUTING MYANMAR’S NATURAL RESOURCE REVENUES
As Myanmar makes its first transition to majority
civilian rule in 53 years, calls for greater fiscal
decentralization and even the creation of a truly
federal system will continue to grow. Given
subnational actors’ demands for greater autonomy
over their natural resource wealth and NLD
commitments to distribute natural resource profits
fairly across the country, resource revenue sharing
will undoubtedly form a key component of this
decentralization discussion.
However, as we have seen in other countries, these
systems come with considerable risks. In the most
extreme cases, such as Peru, they can actually
exacerbate conflict, encouraging local leaders to use
violence to extract additional transfers from the
central government or gain jurisdiction over mine
sites. While Peru’s experience is atypical, natural
resource revenue sharing often leads to money
being wasted, local inflation, boom-bust cycles and
poor public investment decisions at the local level.
Equally common are cases where natural resource
revenue sharing does not achieve its intended
purpose, whether to compensate affected
communities for the damage caused by extraction,
develop poorer resource-rich regions, or help
bring peace. Unmet expectations can be just as
damaging to national unity as outright failure.
Myanmar is particularly susceptible to this risk
as overall resource revenues officially recorded
in the budget remain small—due to smuggling,
underreporting, weak tax collection, and revenue
retention by state-owned economic enterprises,
among other factors. This means that any resource
revenue sharing agreement would only generate
marginal benefits for subnational authorities unless
serious efforts were put into capturing a greater
share of resource rents. Furthermore, resource
revenue sharing—or for that matter any revenue
sharing or fiscal decentralization system—is
unlikely to achieve its objectives without adequate
consultation, conceptual clarity and consensus
from subnational leaders and other relevant
stakeholders, such as ethnic armed groups.
This report has endeavored to highlight steps
Myanmar policymakers may wish to take to
successfully implement a resource revenue sharing
system. The eight considerations and policy options
found here can help the new leadership fulfill its
commitment to decentralize natural resource
revenues while improving the quality of public
spending and strengthening the peace process. Our
hope is that these international experiences and
lessons will assist Myanmar in establishing a system
that works well for all its citizens.
Conclusion
58
SHARING THE WEALTH: A ROADMAP FOR DISTRIBUTING MYANMAR’S NATURAL RESOURCE REVENUES
• What would be the objectives of any resource
revenue sharing regime in Myanmar?
• Which regions, states, self-administered zones
or divisions, or territories would be most
affected by any resource revenues sharing
regime?
• How could any resource revenue sharing
regime be aligned with the current fiscal
decentralization and deconcentration
processes?
• If a resource revenue sharing system is
established:
° How would vertical distribution be
determined?
° Which revenue streams would be shared?
° Would Myanmar employ a derivation-
based formula or an indicator-based
formula? If an indicator-based formula,
what might some of the indicators be?
° To which level of government would
revenues flow?
° Would revenues be transferred to non-
state actors, such as traditional authorities?
° How could the regime help subnational
governments smooth year-to-year budget
volatility and longer-term boom-bust
cycles?
° Should resource revenue transfers be
earmarked for specific expenditure items?
° What transparency and oversight
mechanisms to verify accurate resource
revenue transfers may be appropriate in
Myanmar?
° What would be the venue for
implementation?
° How could key stakeholders negotiate a
stable, long-term formula?
Key questions for consideration by policymakers
59
SHARING THE WEALTH: A ROADMAP FOR DISTRIBUTING MYANMAR’S NATURAL RESOURCE REVENUES
Adam Smith International (ASI) – Myanmar Development
Resources Institute (MDRI) (2015) Institutional and
Regulatory Assessment of the Extractive Industries in
Myanmar.
Arellano-Yanguas, Javier, and A. Mejía-Acosta (2014)
“Distributing the Wealth from the Earth”, IDS Bulletin,
45(5): 58-68. Online: http://onlinelibrary.wiley.
com/doi/10.1111/1759-5436.12104/abstract.
Bahl, Roy (2004). Revenue Sharing in Petroleum States.
Petroleum Revenue Management Workshop Proceedings
(p. 162). Washington: ESMAP.
Bauer, Andrew (2013) Subnational Oil, Gas and Mineral
Revenue Management. Revenue Watch Institute. Online:
http://www.resourcegovernance.org/sites/default/files/
RWI_Sub_Oil_Gas_Mgmt_EN_rev1.pdf
Brosio, Giorgio (2003) “Oil Revenue and Fiscal Federalism”
in Fiscal Policy Formulation and Implementation in Oil-
Producing Countries (eds. J.M. Davis, R. Ossowski and A.
Fedelino). IMF: Washington DC.
Brosio, Giorgio (2006) “The Assignment of Revenue from
Natural Resources” in Handbook of Fiscal Federalism (eds.
Ehtisham Ahmed and Giorgio Brosio), Cheltenham: Edward
Elgar Publishing.
ESMAP (2005) Comparative Study on the Distribution of Oil
Rents in Bolivia, Colombia, Ecuador, and Peru. Washington,
DC, ESMAP (Joint UNDP/World Bank Energy Sector
Management Assistance Programme: 142).
Haysom, Nicholas and Sean Kane (2009) Negotiating
natural resources for peace: Ownership, control and wealth-
sharing. Center for Humanitarian Dialogue. October 2009.
Lynn, Thet Aung, and Mari Oye (2014) Natural Resources
and Subnational Governments in Myanmar: Key
Considerations for Wealth Sharing. IGC-MDRI-The Asia
Foundation. Discussion Paper No. 4.
Morgandi, Matteo (2008) Extractive Industries Revenues
Distribution at the Sub-National Level. Revenue Watch
Institute. Online: http://www.resourcegovernance.org/
publications/extractive-industries-revenues-distribution-
subnational-level.
Myanmar Extractive Industries Transparency Initiative
(2015) EITI Report for the Period April 2013-March 2014:
Oil, Gas and Mineral Sectors. December 2015.
Natural Resource Governance Institute-Columbia Center
on Sustainable Investment (2014) “Natural Resource
Fund Governance: The Essentials” in Managing the public
trust: How to make natural resource funds work for citizens.
Online: http://www.resourcegovernance.org/sites/
default/files/NRF_Complete_Report_EN.pdf
Nixon, Hamish, and Cindy Joelene (2014) Fiscal
Decentralization in Myanmar: Towards a Roadmap for
Reform. MDRI and The Asia Foundation. Discussion
Paper No. 5.
Nixon, Hamish et al. (2013) State and Region Governments
in Myanmar. MDRI and The Asia Foundation.
Qiao, Baoyun and Anwar Shah (2008) Natural Resource
Revenue Sharing: Principles and Practices. Working Paper.
Shah, Anwar (2007) “A Practitioner’s Guide to
Intergovernmental Fiscal Transfers” in Intergovernmental
Fiscal Transfers: Principles and Practice (eds. Robin Boadway
and Anwar Shah). World Bank: Washington DC.
Venugopal, Varsha (2014) Assessing Mineral Licensing in
a Decentralized Context: The Case of Indonesia. Natural
Resource Governance Institute. Online: http://www.
resourcegovernance.org/publications/assessing-mineral-
licensing-decentralized-context-case-indonesia.
Viale, Claudia and Edgardo Cruzado (2012) Distribution
of Revenue from the Extractive Industries to Sub-national
Governments in Latin America. Revenue Watch Institute.
Vinuela, Lorena et al. (2014) Intergovernmental Fiscal
Management in Natural Resource-Rich Settings. World
Bank Report No. 91343-GLB. Online: http://documents.
worldbank.org/curated/en/2014/01/20302404/
intergovernmental-fiscal-management-natural-resource-
rich-settings.
Wilson, Leonard S. (2007) “Macro Formulas for
Equalization” in Intergovernmental Fiscal Transfers:
Principles and Practice (eds. Robin Boadway and Anwar
Shah). World Bank: Washington DC.
World Bank (2015) Myanmar Public Expenditure Review
2015. World Bank Group, September 2015.
Bibliography
60
SHARING THE WEALTH: A ROADMAP FOR DISTRIBUTING MYANMAR’S NATURAL RESOURCE REVENUES
AUTHORS
Andrew Bauer is senior economic analyst at the Natural Resource Governance Institute.
Paul Shortell is a visiting fellow at Natural Resource Governance Institute and a Luce Scholar.
Lorenzo Delesgues is a professor at Sciences Po Paris teaching accountability and transparency in
post-conflict environments.
ACKNOWLEDGEMENTS
The authors wish to thank Douglas Addison (World Bank), Maw Htun Aung (NRGI), Rob Boothe
(World Bank), Edith Bowles (World Bank), Patrick Heller (NRGI), Ko Ko Lwin (NRGI), Soe Nandar
Linn (MDRI / World Bank), Vidar Oveson (NORAD), Habib Rab (World Bank), Matthieu Salomon
(NRGI), Joost Sneller (IDEA) and Varsha Venugopal (NRGI).
This report was made possible by support from the UK Department for International Development and the Australian Department of Foreign Affairs and Trade.
DFAT

The Natural Resource Governance Institute (NRGI) helps people to realize the benefits of their countries’ endowments of oil, gas and minerals. We do this through technical advice, advocacy, applied research, policy analysis, and capacity development. We work with innovative agents of change within government ministries, civil society, the media, legislatures, the private sector, and international institutions to promote accountable and effective governance in the extractive industries.
www.resourcegovernance.org
Related Documents