Psychology and Aging Copyright 1998 by the American Psychological Association, Inc. 1998, Vol. 13, No. 3, 486-500 0882-7974/98/$3.00 Shared Age-Related Influences on Cognitive and Noncognitive Variables Timothy A. Salthouse, David Z. Hambrick, and Katheryn E. McGuthry Georgia Institute of Technology Analyses of new data and of previously published data were conducted to examine the degree to which age-related variance was shared across cognitive and noncognitive variables and to investigate possible alterations in the composition of a factor common to all variables as a function of age. The results indicated that measures of visual acuity, grip strength, and blood pressure shared age-related variance with measures of perceptual speed, episodic memory, spatial visualization, and inductive reasoning. However, although the cognitive variables shared similar amounts of variance in age- restricted and age-partialed analyses, the variance shared between cognitive and noncognitive vari- ables was substantially reduced after controlling the influence of age. There have been many reports of correlations between cogni- tive variables and physical variables such as blood pressure, grip strength, and peak expiratory volume in samples of older adults (e.g., Cook et al., 1995; Elias, D'Agostino, Elias, & Wolf, 1995). However, recently there have also been several reports that moderate to large proportions of the age-related variance in assorted cognitive variables are shared with noncognitive variables such as visual acuity, propioceptive sensitivity, and lower limb strength (e.g., Anstey, Stankov, & Lord, 1993; An- stey, Lord, & Williams, 1997), and measures of vision, hearing, and balance (e.g., Baltes & Lindenberger, 1997; Lindenberger & Baltes, 1994; Salthouse, Hancock, Meinz, & Hambrick, 1996). These latter findings are intriguing in part because the mea- surement of the noncognitive variables in these studies was often not very sophisticated, and thus the sensitivity may have been low. To illustrate, in the Baltes and Lindenberger (1997), Lin- denberger and Baltes (1994), and Salthouse et al. (1996) studies visual acuity was assessed with a near vision chart under ambi- ent light conditions and while the individual was wearing his or her corrective lenses. This type of measure might not be expected to have strong relations with age or with other variables because of the crude manner of assessment. Nevertheless, these measures have been found to be significantly correlated with age (reflecting lower acuity or strength with increasing age) and with measures of cognitive functioning (in the direction of higher cognitive scores when acuity and strength are high). This combination suggests that there may be what Baltes and Lindenberger refer to as a common cause contributing to the age- related differences in both cognitive and noncognitive variables. Timothy A. Salthouse, David Z. Hambrick, and Katheryn E. McGuthry, School of Psychology, Georgia Institute of Technology. This research was supported by National Institute on Aging Grant R37 AG06826. We would like to acknowledge the valuable assistance in testing participants and scoring of data of Nate Fristoe, Holly Han- cock, Kellie Hocking, Stephanie Sherwood, and Michelle Wolbrette. Correspondence concerning this article should be addressed to Timo- thy A. Salthouse, School of Psychology, Georgia Institute of Technology, Atlanta, Georgia 30332-0170. Electronic mail may be sent to [email protected]. One way in which the common cause hypothesis can be inves- tigated is with an analytical model in which the variance that all variables have in common is determined first, and then an estimate of that common factor is controlled when examining relations of age to individual variables (see McArdle & Prescott, 1992). This procedure is conceptually analogous to determining the first principal component in a principal-components analysis based on all variables, and then controlling that component when examining the relations of age to each variable. Although the analyses are conducted within a structural equation framework, the method is probably best viewed as an exploratory technique for distinguishing between shared and unique age-related influ- ences because there is no attempt to account for the interrela- tions among variables except those involving age. This latter feature also means that the overall fit statistics for the model are not particularly informative because they reflect the degree to which the model represents all of the relations among vari- ables and not simply those involving age. The top panel of Figure 1 illustrates this model in structural equation terms. The solid lines represent relations that are esti- mated and are then fixed when examining relations correspond- ing to the dotted lines. All variables included in the analysis are expected to be related to age, but within this type of model there are three interesting possibilities for individual variables. One possibility is that the variable has a moderate to high load- ing on the common factor, and no independent age-related ef- fects. An outcome such as this would suggest that all of the age-related influences on the variable are shared with other vari- ables. A second possibility is that the variable has a significant loading on the common factor, and also has independent (direct) age-related influences. This type of outcome would suggest that there is a mixture of both common and unique age-related effects on the variable. Finally, a third possibility is that the variable does not have a significant loading on the common factor, and all of the age-related effects on the variable are direct, and independent of the effects on other variables. If this type of outcome were to be found it would imply that there are no shared age-related influences between that variable and other variables. Because noncognitive variables have seldom been included 486

Welcome message from author
This document is posted to help you gain knowledge. Please leave a comment to let me know what you think about it! Share it to your friends and learn new things together.
Transcript
Psychology and Aging Copyright 1998 by the American Psychological Association, Inc. 1998, Vol. 13, No. 3, 486-500 0882-7974/98/$3.00
Shared Age-Related Influences on Cognitive and Noncognitive Variables
Timothy A. Salthouse, David Z. Hambrick, and Katheryn E. McGuthry Georgia Institute of Technology
Analyses of new data and of previously published data were conducted to examine the degree to which age-related variance was shared across cognitive and noncognitive variables and to investigate possible alterations in the composition of a factor common to all variables as a function of age. The results indicated that measures of visual acuity, grip strength, and blood pressure shared age-related variance with measures of perceptual speed, episodic memory, spatial visualization, and inductive reasoning. However, although the cognitive variables shared similar amounts of variance in age- restricted and age-partialed analyses, the variance shared between cognitive and noncognitive vari- ables was substantially reduced after controlling the influence of age.
There have been many reports of correlations between cogni- tive variables and physical variables such as blood pressure, grip strength, and peak expiratory volume in samples of older adults (e.g., Cook et al., 1995; Elias, D'Agostino, Elias, & Wolf, 1995). However, recently there have also been several reports that moderate to large proportions of the age-related variance in assorted cognitive variables are shared with noncognitive variables such as visual acuity, propioceptive sensitivity, and lower limb strength (e.g., Anstey, Stankov, & Lord, 1993; An- stey, Lord, & Williams, 1997), and measures of vision, hearing, and balance (e.g., Baltes & Lindenberger, 1997; Lindenberger & Baltes, 1994; Salthouse, Hancock, Meinz, & Hambrick, 1996).
These latter findings are intriguing in part because the mea- surement of the noncognitive variables in these studies was often not very sophisticated, and thus the sensitivity may have been low. To illustrate, in the Baltes and Lindenberger (1997), Lin- denberger and Baltes (1994), and Salthouse et al. (1996) studies visual acuity was assessed with a near vision chart under ambi- ent light conditions and while the individual was wearing his or her corrective lenses. This type of measure might not be expected to have strong relations with age or with other variables because of the crude manner of assessment. Nevertheless, these measures have been found to be significantly correlated with age (reflecting lower acuity or strength with increasing age) and with measures of cognitive functioning (in the direction of higher cognitive scores when acuity and strength are high). This combination suggests that there may be what Baltes and Lindenberger refer to as a common cause contributing to the age- related differences in both cognitive and noncognitive variables.
Timothy A. Salthouse, David Z. Hambrick, and Katheryn E. McGuthry, School of Psychology, Georgia Institute of Technology.
This research was supported by National Institute on Aging Grant R37 AG06826. We would like to acknowledge the valuable assistance in testing participants and scoring of data of Nate Fristoe, Holly Han- cock, Kellie Hocking, Stephanie Sherwood, and Michelle Wolbrette.
Correspondence concerning this article should be addressed to Timo- thy A. Salthouse, School of Psychology, Georgia Institute of Technology, Atlanta, Georgia 30332-0170. Electronic mail may be sent to [email protected].
One way in which the common cause hypothesis can be inves- tigated is with an analytical model in which the variance that all variables have in common is determined first, and then an estimate of that common factor is controlled when examining relations of age to individual variables (see McArdle & Prescott, 1992). This procedure is conceptually analogous to determining the first principal component in a principal-components analysis based on all variables, and then controlling that component when examining the relations of age to each variable. Although the analyses are conducted within a structural equation framework, the method is probably best viewed as an exploratory technique for distinguishing between shared and unique age-related influ- ences because there is no attempt to account for the interrela- tions among variables except those involving age. This latter feature also means that the overall fit statistics for the model are not particularly informative because they reflect the degree to which the model represents all of the relations among vari- ables and not simply those involving age.
The top panel of Figure 1 illustrates this model in structural equation terms. The solid lines represent relations that are esti- mated and are then fixed when examining relations correspond- ing to the dotted lines. All variables included in the analysis are expected to be related to age, but within this type of model there are three interesting possibilities for individual variables. One possibility is that the variable has a moderate to high load- ing on the common factor, and no independent age-related ef- fects. An outcome such as this would suggest that all of the age-related influences on the variable are shared with other vari- ables. A second possibility is that the variable has a significant loading on the common factor, and also has independent (direct) age-related influences. This type of outcome would suggest that there is a mixture of both common and unique age-related effects on the variable. Finally, a third possibility is that the variable does not have a significant loading on the common factor, and all of the age-related effects on the variable are direct, and independent of the effects on other variables. If this type of outcome were to be found it would imply that there are no shared age-related influences between that variable and other variables.
Because noncognitive variables have seldom been included
486

SHARED AGE-RELATED INFLUENCES 487
A
f* i" "~ " 'h
C
Figure 1. Schematic illustration of a single common factor model (A), a model with only a common factor ignoring age (B), and a model with a common factor after influences of age are partialed out (C). V = variable.
in studies of cognitive aging, many cognitive aging researchers seem to have assumed that separate and independent age-related influences are operating across cognitive and noncognitive vari- ables. In other words, on the basis of the current research prac- tices, it appears that a majority of researchers are operating as though the factors responsible for age-related effects on visual acuity or grip strength are distinct from those responsible for age-related effects on memory, reasoning, and spatial abilities. However, results from several recent studies seem more consis- tent with the second alternative described previously in that a number of noncognitive variables have been found to share age- related variance with cognitive variables. This phenomenon has recently been reported by Anstey et al. (1993, 1997), Baltes and Lindenberger (1997), and Lindenberger and Baltes (1994). An example within the single common factor analytical frame- work just described is a study by Salthouse et al. (1996) in
which measures of visual acuity were found to share age-related variance with several different types of cognitive variables.
Because it is not logically necessary that any variable related to age must share age-related variance with other variables that are also related to age, determining which combinations of vari- ables have age-related variance in common is likely to be infor- mative about the primary determinants of age-related effects on many types of variables. Baltes and Lindenberger (1997; Lindenberger & Baltes, 1994) suggested that sensory variables shared age-related variance with cognitive variables because they were additional indicators of brain integrity. Anstey et al. (1997) suggested that strength variables were related to cogni- tive variables because they also have central nervous system involvement. However, both the sensory and motor assessments used in those studies involve some cognitive aspects in order to comprehend and comply with the instructions and produce an appropriate response. It is therefore possible that at least some of the relations that have been reported are attributable to a cognitive component in all of the variables.
One manner in which this possibility can be investigated is to examine other noncognitive variables, such as blood pressure, that are both age-related, and which can be assessed without any effort on the part of the individual. If cognitive effort or conscious attention is an important factor contributing to the shared age-related effects, then these variables should not be expected to share as nmch variance with the cognitive measures as sensory and strength variables. A major purpose of the analy- ses reported here was to explore the range of noncognitive vari- ables that share age-related variance with cognitive variables, and to examine the magnitude of the shared and unique age- related effects in a variety of different variables.
Another goal of the current project was to investigate possible shifts in the composition of the common factor as a function of age. Because the initial studies in which correlations were found between cognitive and noncognitive variables consisted of sam- pies of adults 60 years and older, it is possible that this phenome- non is limited to the period of older adulthood. Indeed, Lin- denberger and Baltes (1994) speculated that the connection be- tween sensory and cognitive variables might emerge only in late adulthood.
There are at least two different ways in which possible shifts in the nature of the common factor across age might be investi- gated. One way is indirect and involves comparing the com- mon-variable relations when age is ignored and also when age is partialed from all variables. These two situations are por- trayed in the bottom two panels of Figure 1, with the former in Figure 1B and the latter in Figure 1C. The rationale for this method is that if some of the variables are associated with the common factor merely because of the relation that they and the other variables all have with age, then that association should be greatly reduced by partialing age from each variable. In a sense, then, this method can be viewed as a means of examining the extent to which the common factor might be a third-variable artifact in that the variables are related to one another only because each is related to age.
The second method of investigating possible shifts in the common factor across age consists of directly comparing the coefficients of structural models based on data from groups of

4 8 8 SALTHOUSE, HAMBRICK, AND McGUTHRY
adults of different ages. That is, when the total sample is large enough it can be divided into subsamples on the basis of age and then the magnitudes of the a g e - c o m m o n , c o m m o n - v a r i - able, and age -va r i ab le relations can be compared to determine which are significantly different f rom one another. Lindenberger and Baltes (1994) found that the relations were very similar in adults f rom 70 to 84 and from 85 to 103, but no younger adults were available in that study to examine the comparabil i ty of the relations across earlier portions of adulthood.
A two-group comparison of the fit of single common factor structural models for adults under and over the age of 50 was recently reported by Verhaeghen and Salthouse (1997). The data used in those analyses were based on meta-analytically derived correlations extracted from prior studies. The only significant differences in the structural coefficients between the under-50 and 50-and-over groups were: (a ) a larger a g e - c o m m o n path in the older group, (b ) a stronger c o m m o n - s p e e d path in the older group, and (c) a direct age - speed relation only in the group of younger adults. These results suggest that Whatever is contributing to the common factor is operating throughout most of the adult years, and not merely during the period of late adulthood. This is a rather surprising conclusion, and thus another aim of the current project was to attempt to replicate these results with a new sample and different combinations of variables.
Analyses f rom a number of different data sets are reported in this article. The primary data to be analyzed were obtained from two recent studies primarily designed for other purposes. In addition to the tasks specific to each study, the participants performed four paper-and-pencil speed tests, and tests of matrix reasoning, cube assembly, and free recall. Measures of systolic and diastolic blood pressure were also obtained at both the beginning and end of the testing session, and measures of grip strength in each hand, and near visual acuity in each eye, were collected at the end of the session.
Because several sets of previously published data can be ana- lyzed in a similar manner, the results of those analyses are also reported. One of the data sets was from a study conducted by Salthouse et al. (1996) , and four are f rom studies by Clark (1960) , Dirken (1972) , and Heron and Chown (1967).
M e t h o d
P a r t i c i p a n t s
A total of 380 adults between 18 and 87 years of age served as participants. Their descriptive characteristics are summarized in Table 1. It can be seen that there was little age-related variation in self-reported health or educational level, but that scores on the vocabulary tests were higher with increased age. Most of these individuals also performed several computer-administered tasks that are described in two other re- ports (i.e., Salthouse, Fristoe, McGuthry, & Hambrick, 1998; Salthouse, McGuthry, & Hambrick, 1998).
P r o c e d u r e
Each participant had his or her blood pressure assessed before per- forming the paper-and-pencil tests. After completing the paper-and-pencil tests and some computer-administered tests not described here, blood pressure was assessed again, followed by a test of grip strength and an assessment of visual acuity.
The blood pressure measurements were obtained with a Lumiscope (Model 1090; available from The Lumiscope Company, Edison, NJ) electronic automatic wrist monitor while the participant was seated with his or her left arm resting on a table. The cuff was placed on the left wrist so that it fit snugly, and the air tube was positioned so that it was over the participant's middle finger. After automatically inflating the cuff, the monitor registered heart rate, and systolic blood pressure and diastolic blood pressure in units of mmHg.
The paper-and-pencil tasks were administered in the same order to all participants: background health and education questionnaire, synonym and antonym vocabulary, pattern comparison, letter comparison, number matching, pattern matching, free recall, matrix reasoning, and cube as- sembly. All but the free-recall test were developed locally. The vocabu- lary tests consisted of synonym and antonym multiple-choice questions (10 each) with 5 alternatives for every question. A total of 5 min was allowed to complete both tests.
The perceptual speed tests (i.e., pattern comparison, letter compari- son, number matching, and pattern matching) all consisted of an instruc- tion page with several examples, and two test pages for each test. A time limit of 30 s was used for each page. The pattern comparison test consisted of 30 pairs of patterns composed of 3-to-9 line segments, and the letter comparison test consisted of 21 pairs of letters with 3-to-9 letters in each member of the pair. Approximately one-half of the pairs
Table 1 Descriptive Characteristics o f Research Participants
Age range (years)
18-29 30-39 40-49 5 0 - 5 9 6 0 - 6 9 70-87 (N = 60) (N = 75) (N = 77) (N = 67) (N = 62) (N = 39)
Variable M SD M SD M SD M SD M SD M SD
Age (years) 23.4 3.2 34.5 3.0 44.4 2.8 54.1 2.7 65.2 2.7 74.6 4.1 Percentage females 71.7 - - 56.0 - - 66.2 - - 68.7 - - 50.0 - - 61.5 - - Self-rated health 2.3 0.8 2.2 0.7 2.4 0.8 2.3 0.9 2.2 0.8 2.3 0.8 Educational level 3.5 0.9 3.5 1.1 3.5 1.1 3.6 1.1 3.6 1.1 3.3 1.4 Synonym vocabulary 4.9 2.6 4.8 2.8 6.1 2.8 6.7 2.9 7.2 2.5 7.7 2.7 Antonym vocabulary 4.4 2.5 4.4 3.0 5.4 3.1 5.7 3.4 6.3 3.1 6.2 3.2
Note. Health ratings were made "on a 5-point scale where 1 = excellent and 5 = poor. Educational level was reported on a 5-point scale where 1 refers to less than 12 years of education, 2 refers to a high school graduate, 3 refers to 1 to 3 years of college or vocational school, 4 refers to a college graduate, and 5 refers to a graduate degree. Dashes indicate data were not reported.

SHARED AGE-RELATED INFLUENCES 4 8 9
on each test page were identical, and one-half differed by a single element. The participants were asked to write an S on the line between the pairs that were the same, and to write a D on the line if the paired items were different. They were instructed to perform the tasks as rapidly and as accurately as possible. The number-matching and pattern-match- ing tests both consisted of 30 items with a single target and five alterna- fives. The participants were required to scan the choices, and mark the matching two-digit number or pattern as rapidly and as accurately as possible.
The free-recall test was based on the Rey Auditory Verbal Learning Test (Schmidt, 1996). The test consisted of five study-test trials of a list of 15 words (i.e., drum, curtain, bell coffee, school, parent, moon, garden, hat, farmer, nose, turkey, color, house, river). The words were read by the examiner, in the same order on each trial, at a rate of one word every 2 s. A total of 45 s was allowed for each recall attempt, which was written on a separate page in a booklet.
The matrix reasoning test was similar to the Raven's Progressive Matrices Test (Raven, 1962), and has been described in several earlier articles (i.e., Salthouse, 1993, 1994). Each of the 20 test problems contained a 3 × 3 matrix with geometric patterns in all but the lower right cell, which was blank. Immediately below the matrix was a set of eight response alternatives. The task for the participant was to select the best completion of the matrix from the set of alternatives. Two practice problems were provided with answers, and then 10 rain was allowed to complete as many of the 20 problems as possible.
The cube-assembly test consisted of a set of six connected squares that could be assembled into a cube, and was based on a test originally described by Shepard and Feng (1972). One of the six unfolded squares was shaded to represent the base of the cube, and two of the remaining squares contained arrows. The participants were required to decide whether the arrows would point at one another after mentally assembling the cube, and to indicate their decision by marking Y for yes and N for no. After completing the two illustrated practice problems, 10 min was allowed to complete the 24-item test.
Grip strength was measured using a Smedley Hand Dynamometer (available from The Stoelting Company, Wood Dale, IL). The dyna- mometer was adjusted for each participant so that the lower joint of the second phalanx of the participant's hand was resting on the edge of the inner stirrup. The participants were instructed to take the dynamometer in their designated hand, point it towards the ground, and squeeze as tightly as possible. After releasing their grip, they were asked to do the same thing with the other hand. This process was repeated for a total of three measurements, recorded in units of kg of force, with each hand.
Visual acuity was assessed using the second edition of the Lighthouse Near Visual Acuity Test, modified ETDRS with Sloan letters (available from Lighthouse Low Vision Products, Long Island City, NY). The testing distance was 40 cm and was maintained with a distance string attached to the stimulus card. The participant was instructed to hold the ball on the end of the distance string between the fingers of his or her left hand, which was also used to cover the left eye. Once the left eye had been covered, the participant was instructed to start by reading the first line of letters on chart one with his or her right eye. Reading continued until two or more errors were made on any line, and the acuity was recorded as the smallest type font (largest Snellen ratio) in which fewer than two errors were made. The card was then turned over, the right eye covered, and chart two was read with the left eye in a similar manner. The participants were also asked how long since their eyes had been checked by an optometrist. The average response was between 12 and 24 months, but this value was not significantly correlated (i.e., r = .08) with the assessed visual acuity.
Re s u l t s a n d D i s c u s s i o n
The pr imary dependent variables were the number of correct minus the number of incorrect i tems for the perceptual speed
and cube-assembly variables, the number of correct i tems in the matrix reasoning test, and the average number of correctly recalled words across the five trials in the free-recall test. Blood pressure and heart rate measures were the average of the values obtained at the beginning and end of the session. The measure of grip strength was the average strength across three measure- ments with the stronger hand, and visual acuity was assessed in terms of acuity in the better eye.
Table 2 contains a correlation matrix of all variables (wi th reliabilities in parentheses along the main diagonal) . Notice that there were significant age relations on all variables except for the heart rate variable, which consequently was not included in the subsequent analyses of these data. The age correlations were moderately large for the perceptual speed, matrix reasoning, and free-recall variables. The age relations were smaller for the cube-assembly variable, probably because many participants found this test to be quite difficult and had adjusted scores (i.e., number correct minus number incorrect) close to zero. The age correlat ion for the visual acuity variable was - . 5 8 , which is similar to the correlation of - . 6 4 in the Salthouse et al. (1996) study based on an independent sample of participants and a different vision chart.
Gender effects were also examined on all variables. Men had significantly higher systolic and diastolic blood pressure, grip strength, and cube-assembly scores than women, but women had faster heart rates and higher scores on the number-matching and free-recall tests than men. Most importantly for the current purposes, none of the interactions of age and gender were statis- tically significant, and thus the age relations can be inferred to be nearly equivalent for men and women.
Figure 2 illustrates the age relations for all variables after conversion to standard score units. The left panel portrays the four noncognit ive variables, and the r ight panel the seven cogni- tive variables. It can be seen that the age relations were very pronounced for the visual acuity variable, but were less dramatic for the blood pressure and grip strength variables. Among the cognitive variables, the cube-assembly score had smaller age relations than the speed, recall, and reasoning variables. Some of the age relations in Figure 2 appear non-linear. For example, visual acuity appears to remain stable (at a Snellen ratio of approximately .65) f rom about age 50 on. Non-l inear age rela- tions were therefore investigated by entering the age - squa red and a g e - c u b e d terms after age in regression equations pre- dicting each variable represented in Figure 2. The quadratic ( a g e - s q u a r e d ) relation was significantly different f rom zero for the systolic and diastolic blood pressure variables and the visual acuity and pat tern-matching variables. Only the cube-assembly variable had a significant cubic ( a g e - c u b e d ) age trend. How- ever, because for most variables the proportion of variance asso- ciated with the non-l inear age trends was fairly small relative to the l inear trends, only the l inear age trends were considered in the subsequent analyses.
A two-step procedure was followed in the single common factor analysis. First the c o m m o n - v a r i a b l e and a g e - c o m m o n relations were estimated, deleting any relations with coefficients differing f rom zero by less than two standard errors. Next these parameters were fixed to the estimated values and all age -va r i - able relations were examined, with the relation kept in the model

490 SALTHOUSE, HAMBRICK, AND McGUTHRY
Table 2 Correlation Matrix and Estimates of Reliability (N = 380)
Variable 1 2 3 4 5 6 7 8 9 10 11 12 13
1. Age 2. Systolic BP .23 (.73) 3. Diastolic BP .18 .93 (.77) 4. Heart rate -.03 .01 .07 (.97) 5. Grip strength - .16 .23 .19 - .17 (.59) 6. Visual acuity - .58 - .12 -.13 - .08 .22 (.65) 7. Pattern comparison - .50 - .13 -.13 .01 .13 .43 (.79) 8. Letter comparison - .48 -.11 -.13 .08 .04 .37 .58 (.80) 9. Number matching -.41 - .19 - .18 .05 - .05 .38 .58 .60
10. Pattern matching - .52 -.11 - .12 - .00 .14 .48 .74 .64 11. Matrix reasoning - .44 - .10 -.11 - .02 .12 .41 .60 .49 12. Cube assembly -.23 .02 -.03 - .06 .25 .23 .32 .20 13. Free recall - .40 - .12 - .14 .02 -.11 .33 .51 .50
M 47.3 119.7 80.3 75.4 34.8 0.85 15.7 10.1 SD 16.5 13.4 11.7 12.9 11.5 0.34 3.8 3.1
(.91) .67 (.83) .49 .68 (.86) .14 .36 .44 .54 .55 .58
26.3 14.6 8.2 3.9 4.1 4.7
(.72) .24 (.93)
4.1 10.4 6.9 2.0
Note. Correlations with an absolute magnitude greater than .13 are significantly (p < .01) different from zero. Numbers in parentheses along the diagonal are estimated reliabilities. Reliability estimates were derived by boosting the correlation between the two scores by the Spearman-Brown formula for the systolic blood pressure (BP), diastolic blood pressure, heart rate, pattern comparison, letter comparison, pattern matching, and number matching variables. Coefficient alphas were used for the cube assembly and matrix reasoning variables, and the formula n(avg, r)/(1 + [n - 1] avg. r) was used for the grip strength and free-recall variables, where n is the number of trials. The reliability estimate for visual acuity was the correlation between the two eyes.
if the coefficient differed from zero by more than two standard errors. The results of this analysis are illustrated in Figure 3 where it can be seen that all variables were related to the com- mon factor. The relations were weak for the grip strength and blood pressure variables, but all of the common-var iab le rela- tions were significantly different from zero. Only the visual
acuity and systolic blood pressure variables had age-related ef- fects that were independent of the influences through the com- mon factor. In both cases the independent age-related effects increased the magnitude of tlae age relations on the variable compared to the effect mediated through the common factor. For example, the predicted age-v i s ion relation through the common
O O
09
"O t "
Or)
1.2
0.8
0.4
0
-0.4
-0.8
-1.2
Noncognitive Variables
Systolic BP
Diastolic BP
• •, Gdp Stmnglh
1.2
0.8
Cognitive Variables
0.4
0
-0.4
-0.8
-1.2
Ga Matrix Reasoning P art e?..C~mpads~n •
~ : ' , Cube ~ b l y Letter Comparison
e. "~.':',~ Free Recall Pattern Matching ~ . ~ , , • - - ~ . - -
I I i I f I I I I I I I I 20 30 40 50 60 70 80 20 30 40 50 60 70 80
Chronological Age (years) Chronological Age (years)
Figure 2. Mean standard scores for the four noncognitive (left panel) and seven cognitive (right panel) variables as a function of age. Because blood pressure (BP) increased with age, the signs of the scores for the blood pressure measures were reversed so that the direction of the age trends would be the same for all variables.

SHARED AGE-RELATED INFLUENCES 491
AGE
.12
.51 ~ .72 ~ .75 ~ .89 ~ -.18
• 12 .81 .39 .66 .75 -.19
Figure 3. Single common factor structural model for the primary data. PatCom = pattern comparison; LetCom = letter comparison; CubeAsm = cube assembly; MatReas = matrix reasoning; NumMat = number matching; PatMat = pattern matching; SysBP = systolic blood pressure; DiasBP = diastolic blood pressure.
factor was - .32 (i.e., - .63 × .51 ), but with the addition of the direct age-vision path of - .23 the total predicted age-related effect of - .55 closely approximated the actual age-vision corre- lation of - .58.
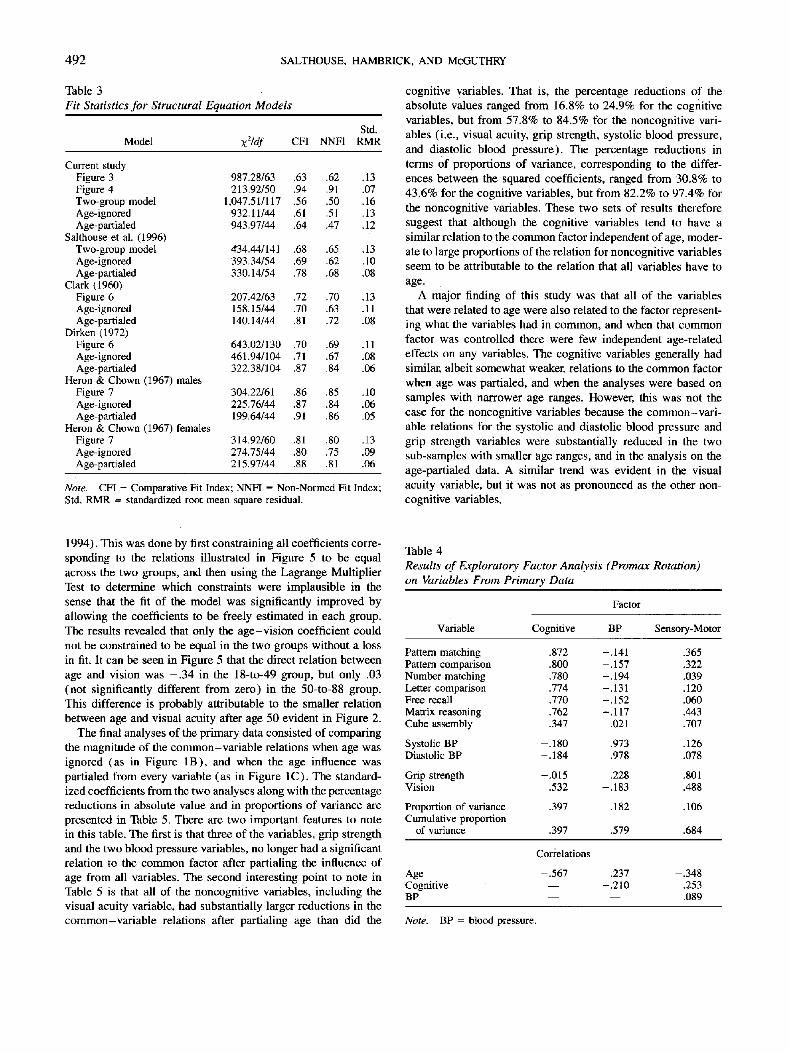
The fit statistics for the model represented in Figure 3, and all other models examined in this article, are summarized in Table 3. It can be seen that the model had a poor fit to the entire data set, which was not unexpected because all relations among variables except those involving age were ignored. In order to examine a model with a more complex structure among vari- ables an exploratory factor analysis (promax rotation) was car- ded out on the variables represented in Figure 3. The results of this analysis are summarized in Table 4, where it can be seen that three factors emerged, which can be tentatively labeled Cognitive, Blood Pressure, and Sensory-Motor. The pattern of loadings on the variables was a little surprising because the cube-assembly spatial test had a higher loading on the Sensory- Motor factor than on the Cognitive factor, and the vision variable had nearly equal loadings on the Cognitive and Sensory-Motor factors. Nevertheless, the structure seemed reasonably coherent and thus these results formed the basis for the hierarchical model illustrated in Figure 4. Note that three first-order factors are postulated to be responsible for the variation in the observed variables, and the first-order factors are in turn postulated to be influenced by the common factor. (Other relations among variables and first-order factors suggested by the results in Table 4 were tested but found not to be significant.)
Two major points should be noted about the model portrayed in Figure 4. The first is that when a greater amount of structure is allowed among the variables, the fit of the model is substan- tially better than when the models only represent relations in- volving age (cf. Table 3). As noted previously, this is not sur- prising because the fit statistics indicate the degree to which the model accounts for all of the observed covariances and not merely the subset involving age. The second important point to note about Figure 4 is that even with this elaborated structural model a very large portion of the age-related influences is shared among all of the variables. In fact, in this model none of the direct relations from age to any of the first-order factors or to any of the observed variables were significantly different from zero.
The next set of analyses compared the fit of separate single common factor models for adults between 18 and 49 years of age (n = 212) and adults between 50 and 88 years of age (N = 168). The coefficients for these models are portrayed in Figure 5, with those for the younger group to the left or above those for the older group. The models for the separate age groups differed in two respects from the model for the entire sample (portrayed in Figure 3). Neither the relation between the com- mon factor and grip strength nor that between the common factor and systolic blood pressure was significantly different from zero in the samples with a narrower age range. A simulta- neous two-group analysis was conducted to determine which coefficients differed significantly between groups (see Byrne,
492 SALTHOUSE, HAMBRICK, AND McGUTHRY
Table 3 Fit Statistics for Structural Equation Models
Std. Model x2/df CFI NNFI RMR
Current study Figure 3 987.28/63 .63 .62 .13 Figure 4 213.92/50 .94 .91 .07 Two-group model 1,047.51/117 .56 .50 .16 Age-ignored 932.11/44 .61 .51 .13 Age-partialed 943.97/44 .64 .47 .12
Salthouse et al. (1996) Two-group model ,¢34.44/141 .68 .65 .13 Age-ignored 393.34/54 .69 .62 .10 Age-partialed 330.14/54 .78 .68 .08
Clark (1960) Figure 6 207.42/63 .72 .70 .13 Age-ignored 158.15/44 .70 .63 .11 Age-partialed 140.14/44 .81 .72 .08
Dirken (1972) Figure 6 643.02/130 .70 .69 .11 Age-ignored 461.94/104 .71 .67 .08 Age-partialed 322.38/104 .87 .84 .06
Heron & Chown (1967) males Figure 7 304.22/61 .86 .85 .10 Age-ignored 225.76/44 .87 .84 .06 Age-partialed 199.64/44 .91 .86 .05
Heron & Chown (1967) females Figure 7 314.92/60 .81 .80 .13 Age-ignored 274.75/44 .80 .75 .09 Age-partialed 215.97/44 .88 .81 .06
Note. CFI = Comparative Fit Index; NNFI = Non-Normed Fit Index; Std. RMR = standardized root mean square residual.
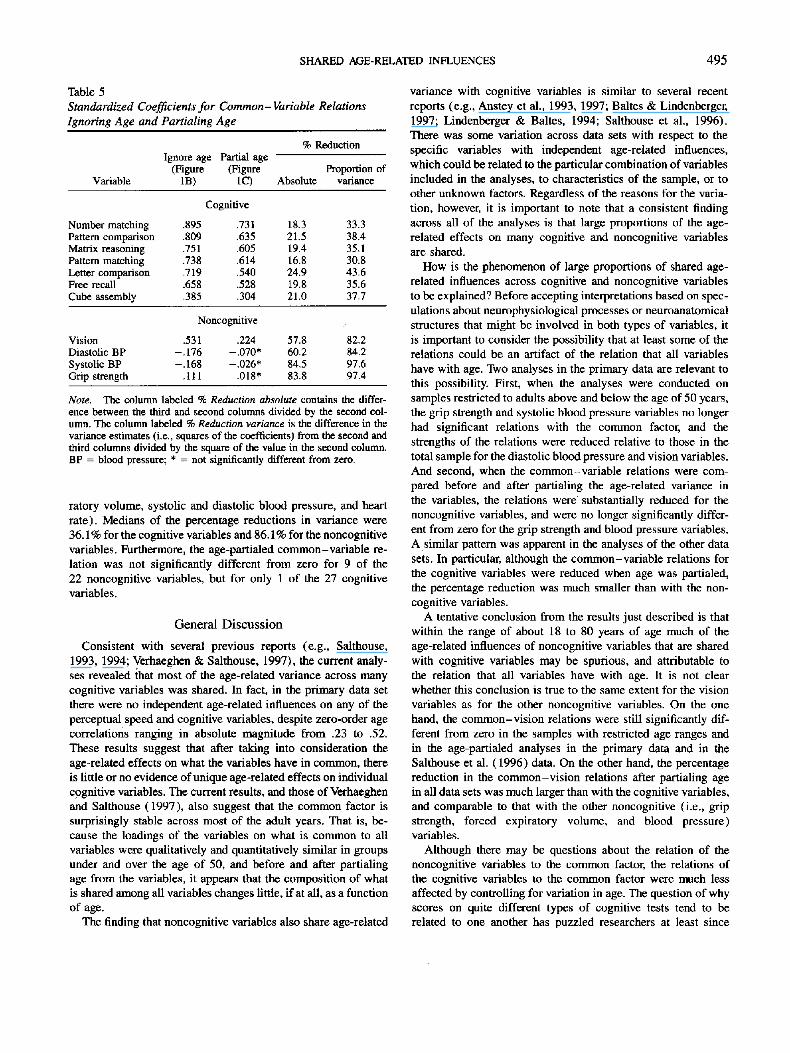
cognitive variables. That is, the percentage reductions of the absolute values ranged from 16.8% to 24.9% for the cognitive variables, but from 57.8% to 84.5% for the noncognitive vari- ables (i.e., visual acuity, grip strength, systolic blood pressure, and diastolic blood pressure). The percentage reductions in terms of proportions of variance, corresponding to the differ- ences between the squared coefficients, ranged from 30.8% to 43.6% for the cognitive variables, but from 82.2% to 97.4% for the noncognitive variables. These two sets of results therefore suggest that although the cognitive variables tend to have a similar relation to the common factor independent of age, moder- ate to large proportions of the relation for noncognitive variables seem to be attributable to the relation that all variables have to age.
A major finding of this study was that all of the variables that were related to age were also related to the factor represent- ing what the variables had in common, and when that common factor was controlled there were few independent age-related effects on any variables. The cognitive variables generally had similar, albeit somewhat weaker, relations to the common factor when age was partialed, and when the analyses were based on samples with narrower age ranges. However, this was not the case for the noncognitive variables because the common-var i - able relations for the systolic and diastolic blood pressure and grip strength variables were substantially reduced in the two sub-samples with smaller age ranges, and in the analysis on the age-partialed data. A similar trend was evident in the visual acuity variable, but it was not as pronounced as the other non- cognitive variables.
1994). This was done by first constraining all coefficients corre- sponding to the relations illustrated in Figure 5 to be equal across the two groups, and then using the Lagrange Multiplier Test to determine which constraints were implausible in the sense that the fit of the model was significantly improved by allowing the coefficients to be freely estimated in each group. The results revealed that only the age-v is ion coefficient could not be constrained to be equal in the two groups without a loss in fit. It can be seen in Figure 5 that the direct relation between age and vision was - . 3 4 in the 18-to-49 group, but only .03 (not significantly different from zero) in the 50-to-88 group. This difference is probably attributable to the smaller relation between age and visual acuity after age 50 evident in Figure 2.
The final analyses of the primary data consisted of comparing the magnitude of the common-var iab le relations when age was ignored (as in Figure 1B), and when the age influence was partialed from every variable (as in Figure IC) . The standard- ized coefficients from the two analyses along with the percentage reductions in absolute value and in proportions of variance are presented in Table 5. There are two important features to note in this table. The first is that three of the variables, grip strength and the two blood pressure variables, no longer had a significant relation to the common factor after partialing the influence of age from all variables. The second interesting point to note in Table 5 is that all of the noncognitive variables, including the visual acuity variable, had substantially larger reductions in the common-var iab le relations after partialing age than did the
Table 4 Results o f Exploratory Factor Analysis (Promax Rotation) on Variables From Primary Data
Factor
Variable Cognitive BP Sensory-Motor
Pattern matching .872 - . 141 .365 Pattern comparison .800 - . 157 .322 Number matching .780 - . 194 .039 Letter comparison .774 -.131 .120 Free recall .770 -.152 .060 Matrix reasoning .762 - . 117 .443 Cube assembly .347 -.021 .707
Systolic BP - . 180 .973 .126 Diastolic BP -.184 .978 .078
Grip strength -.015 .228 .801 Vision .532 - . 183 .488
Proportion of variance .397 .182 .106 Cumulative proportion
of variance .397 .579 .684
Correlations
Age -.567 .237 -.348 Cognitive - - -.210 .253 BP - - - - .089
Note. BP = blood pressure.

SHARED AGE-RELATED INFLUENCES 493
AGE
-1.00
Common
.60 / I ~ -.23
.60
SensMot } ( Cognitive J ( BP
.28
.70 / / / I \ \ ~ 1.00
.27 / ~ / ~ \ ~ ~ .93
.72 ~ .75 ~ .89
.81 .38 .66 .74
Figure 4. Hierarchical structural model for the primary data. SensMot = sensory-motor factor; PatCom = pattern comparison; LetCom = letter comparison; CubeAsm = cube assembly; MatReas = matrix reasoning; NumMat = number matching; PatMat = pattern matching; SysBP = systolic blood pressure; DiasBP = diastolic blood pressure.
Ana lyse s o f Other Da ta
The major goal of the analyses o f data from other projects was to determine whether the results just described would be replicated in data from different samples of individuals and variables. Specifically, would the same pattern of robust com- mon-var iab le relations for cognitive variables but attenuated relations for noncognitive variables after control of age be found in other data sets?
Salthouse et aL (1996)
The single common factor model reported in the Salthouse et al. (1996) article was based on the complete sample of parti- cipants from 18 to 87 years of age. However, because the raw data were still available it was possible to compare models based on adults under (n = 96) and over (n = 101 ) the age of 50. The two models were qualitatively similar, and in each the relations between the common factor and all variables were significantly different from zero. A simultaneous two-group
analysis following the same procedures described earlier re- vealed that the only significant difference between the models for each sample was that the direct age-v is ion relations were weaker, and not significantly different from zero, in the 50-and- over group (i.e., - . 1 2 and - . 0 7 ) than in the under-50 group (i.e., - . 3 6 and - . 3 3 ) . It should be noted that this is the same pattern observed in the analyses of the primary data reported previously.
The common-var iab le coefficients before and after partialing age are presented in Table 6. It can be seen that the absolute reductions after partialing age were 61.5% and 63.8% for the two vision variables, but the median reduction was only 20.9% for the cognitive variables. Similar discrepancies were apparent in the reductions in variance as the reductions were 86.9% and 85.1% for the two vision variables, but the median for the cogni- tive variables was only 36.8%.
Previously Published Correlation Matrices
Some of these same kinds of analyses can be conducted on data reported as correlation matrices in previously published

494 SALTHOUSE, HAMBRICK, AND McGUTHRY
AGE
-.47/-.46
'.03 / ~ .14/.14
.30 .67 .73 .90 -.03
.04 .75 .34 .62 .72 -. 13
.04 .79 .36 .60 .68 -. 13
Figure 5. Single common factor structural mode] for adults between 18 and 49 years of age (first coefficient in each pair) and for adults between 50 and 87 years of age (second coefficient in each pair) in the primary data. The dotted lines represent paths that were significantly different from zero in the overall sample but not in either of the two groups with narrower age ranges. PatCom = pattern comparison; LetCom = letter comparison; CubeAsm = cube assembly; Marinas = matrix reasoning; NumMat = number matching; PatMat = pattern matching; SysBP = systolic blood pressure; DiasBP = diastolic blood pressure.
articles. Caution is needed when interpreting the results of struc- tural equation analyses based on correlation matrices rather than on raw data or covariance matrices because the estimated rela- tions in the models may be distorted and the fit statistics can be misleading (see Cudek, 1989), but they can still be informa- tive when interpreted cautiously. Four data sets are particularly relevant for the current purposes; Clark (1960), Dirken (1972), and separate samples of men and women in Heron and Chown (1967). The samples, and variables included in the current anal- yses, are described in the Appendix.
The results of the single common factor analyses on these four data sets are portrayed in Figures 6 and 7. It can be seen that there was considerable shared age-related variance across all variables, as well as independent age-related influences on some variables. In the Clark (1960) data the measures of vi- sion, hearing, grip strength, and systolic blood pressure were all related to the common factor, but only the vision and sys- tolic blood pressure variables had independent age-related ef- fects. In the Dirken (1972) data all variables were related to the common factor, and there were independent age-related effects on several cognitive variables as well as on the heart rate variable. There were no independent age-related influences
on the vision, hearing, grip strength, or systolic or diastolic blood pressure variables in this data set. All variables were related to the common factor in both the male and female data sets from the Heron and Chown (1967) study. Independent age-related effects were evident on the systolic blood pressure and forced expiratory volume variables in both data sets, and also on the vision and hearing variables in the female data. Although the results based on separate analyses of the men and women in the Heron and Chown (1967) study were slightly different, a simultaneous two-group analysis revealed that all of the coefficients could be constrained to be equal without a significant loss in fit.
The coefficients for the common-variable relations for the analyses before and after partialing age are presented in Table 6. As in the earlier analyses, statistical control of the age-related variance resulted in a greater reduction of the common factor relations for the noncognitive variables than for the cognitive variables. Specifically, the median percentage reduction of the absolute values after partialing age for the 27 cognitive variables in the Clark (1960), Dirken (1972), and Heron and Chown (1967) analyses was 20.1%, but it was 69.4% for the 22 noncog- nitive variables (i.e., vision, hearing, grip strength, forced expi-
SHARED AGE-RELATED INFLUENCES 495
Table 5 Standardized Coefficients for Common-Variable Relations Ignoring Age and Partialing Age
%Reduction Ignore age Partial age
(Figure (Figure Proportion of Variable 1B) 1C) Absolute variance
Cognitive
Number matching .895 .731 18.3 33.3 Pattern comparison .809 .635 21.5 38.4 Matrix reasoning .751 .605 19.4 35.1 Pattern matching .738 .614 16.8 30.8 Letter comparison .719 .540 24.9 43.6 Free recall .658 .528 19.8 35.6 Cube assembly .385 .304 21.0 37.7
Noncognitive
Vision .531 .224 57.8 82.2 Diastolic BP -.176 -.070* 60.2 84.2 Systolic BP -.168 -.026* 84.5 97.6 Grip strength .111 .018" 83.8 97.4
Note. The column labeled % Reduction absolute contains the differ- ence between the third and second columns divided by the second col- umn. The column labeled % Reduction variance is the difference in the variance estimates (i.e., squares of the coefficients) from the second and third columns divided by the square of the value in the second column. BP = blood pressure; * = not significantly different from zero.
ratory volume, systolic and diastolic blood pressure, and heart rate). Medians of the percentage reductions in variance were 36.1% for the cognitive variables and 86.1% for the noncognitive variables. Furthermore, the age-partialed common-variable re- lation was not significantly different from zero for 9 of the 22 noncognitive variables, but for only 1 of the 27 cognitive variables.
General Discussion
Consistent with several previous reports (e.g., Salthouse, 1993, 1994; Verhaeghen & Salthouse, 1997), the current analy- ses revealed/hat most of the age-related variance across many cognitive variables was shared. In fact, in the primary data set there were no independent age-related influences on any of the perceptual speed and cognitive variables, despite zero-order age correlations ranging in absolute magnitude from .23 to .52. These results suggest that after taking into consideration the age-related effects on what the variables have in common, there is little or no evidence of unique age-related effects on individual cognitive variables. The current results, and those of Verhaeghen and Salthouse (1997), also suggest that the common factor is surprisingly stable across most of the adult years. That is, be- cause the loadings of the variables on what is common to all variables were qualitatively and quantitatively similar in groups under and over the age of 50, and before and after partialing age from the variables, it appears that the composition of what is shared among all variables changes little, if at all, as a function of age.
The finding that noncognitive variables also share age-related
variance with cognitive variables is similar to several recent reports (e.g., Anstey et al., 1993, 1997; Baltes & Lindenberger, 1997; Lindenberger & Baltes, 1994; Salthouse et al., 1996). There was some variation across data sets with respect to the specific variables with independent age-related influences, which could be related to the particular combination of variables included in the analyses, to characteristics of the sample, or to other unknown factors. Regardless of the reasons for the varia- tion, however, it is important to note that a consistent finding across all of the analyses is that large proportions of the age- related effects on many cognitive and noncognitive variables are shared.
How is the phenomenon of large proportions of shared age- related influences across cognitive and noncognitive variables to be explained? Before accepting interpretations based on spec- ulations about neurophysiological processes or neuroanatomical structures that might be involved in both types of variables, it is important to consider the possibility that at least some of the relations could be an artifact of the relation that all variables have with age. Two analyses in the primary data are relevant to this possibility. First, when the analyses were conducted on samples restricted to adults above and below the age of 50 years, the grip strength and systolic blood pressure variables no longer had significant relations with the common factor, and the strengths of the relations were reduced relative to those in the total sample for the diastolic blood pressure and vision variables. And second, when the common-variable relations were com- pared before and after partialing the age-related variance in the variables, the relations were substantially reduced for the noncognitive variables, and were no longer significantly differ- ent from zero for the grip strength and blood pressure variables. A similar pattern was apparent in the analyses of the other data sets. In particular, although the common-variable relations for the cognitive variables were reduced when age was partialed, the percentage reduction was much smaller than with the non- cognitive variables.
A tentative conclusion from the results just described is that within the range of about 18 to 80 years of age much of the age-related influences of noncognitive variables that are shared with cognitive variables may be spurious, and attributable to the relation that all variables have with age. It is not clear whether this conclusion is true to the same extent for the vision variables as for the other noncognitive variables. On the one hand, the common-vision relations were still significantly dif- ferent from zero in the samples with restricted age ranges and in the age-partialed analyses in the primary data and in the Salthouse et al. (1996) data. On the other hand, the percentage reduction in the common-vision relations after partialing age in all data sets was much larger than with the cognitive variables, and comparable to that with the other noncognitive (i.e., grip strength, forced expiratory volume, and blood pressure) variables.
Although there may be questions about the relation of the noncognitive variables to the common factor, the relations of the cognitive variables to the common factor were much less affected by controlling for variation in age. The question of why scores on quite different types of cognitive tests tend to be related to one another has puzzled researchers at least since

496 SALTHOUSE, HAMBRICK, AND McGUTHRY
Table 6
Standardized Coefficients for Common-Variable Relations Ignoring Age and Partialing Age
% Reduction Ignore age Partial age
(Figure (Figure Proportion Variable 1B) 1C) Absolute of variance
Salthouse et al. (1996)
Cognitive Digit symbol RT .835 .577 30.9 52.2 Pattern comparison .723 .425 41.2 65.4 Letter comparison .712 .504 29.2 49.9 N-back 1 .662 .757 -14.4 -30.8 Digit digit RT .646 .418 35.3 58.1 N-back 2 .626 .756 -20.8 -45.8 Assoc. percentage
correct .573 .501 12.6 23.6 WCST .489 .486 0.6 1.2
Noncognitive Visual acuity-left
eye .578 .209 63.8 86.9 Visual acuity-
right eye .550 .212 61.5 85.1
• Clark (1990)
Cognitive PMA reasoning .791 .610 22.9 40.5 RT -.691 -.477 31.0 52.3 PMA space .677 .580 14.3 26.6 Recall .657 .525 20.1 36.1 Letter speed .651 .433 33.5 55.8 Maze time -.585 -.546 6.7 12.9 Word latency -.439 - . 177" 59.7 83.7
Noncognitive Vision -.516 -.040* 92.2 99.4 Hearing -.486 -.048* 90.1 99.0 Systolic BP -.436 .071" 116.3 97.3 Grip strength .226 .201 * 11.1 20.9
Dirken (1972)
Variable
% Reduction Ignore age Partial age
(Figure (Figure Proportion 1B) 1C) Absolute of variance
Dirken (1972)
Noncogniti~(e ExpirVol .658 .168 74.5 93.5 Pitch .593 .169 71.5 91.9 Grip strength .576 .247 57.1 81.6 Heart rate .544 .026* 95.2 99.8 Audio -.435 -.193 55.6 80.3 Vision .411 .033* 92.0 99.4 Diastolic BP -.099 .015" 115.2 97.7 Systolic BP -.067 .072* 207.5 - 15.5
Heron and Chown (1972) men
Cognitive Matrices .883 .596 32.5 54.4 Trails .789 .597 24.3 42.7 DigCode .769 .569 26.0 45.3 Mazes .689 .425 38.3 62.0 DspanA .576 .596 -3.5 -7.1 DspanV .522 .562 -7.7 - 15.9
Noncognitive Grip strength .657 .396 39.7 63.7 ExpirVol .645 .211 67.3 89.3 Heating .513 .268 47.8 72.7 Systolic BP .435 .106 75.6 94.1 Vision .425 .176 58.6 82.9
Cognitive CatMed RT -.707 -.736 -4.1 -8.4 RT4 -.632 -.332 47.5 72.4 PictRec .617 .365 40.8 65.0 CatAcc -.509 -.772 -51.7 -130.0 Concent .508 .477 6.1 11.8 DspanD .389 .478 -22.9 -51.0 Tapping .295 .210 28.8 49.3 Position .323 .117 63.8 86.9
Heron and Chown (1972) women
Cognitive Matrices .894 .739 17.3 31.7 DigCode .841 .696 17.2 31.5 Trails .786 .604 23.2 40.9 Mazes .592 .503 10.5 19.8 DspanA .503 .515 -2.4 -4.8 DspanV .475 .538 -13.3 -28.3
Noncognitive ExpirVol .644 .272 57.8 82.2 Grip strength .601 .381 36.6 59.8 Heating .481 .214 55.5 80.2 Vision .459 .221 51.9 76.8 Systolic BP .362 .042* 88.4 98.7
Note. The columns labeled % Reduction Absolute contain the difference between the third and second columns divided by the second column. The columns labeled % Reduction Variance are the difference in the variance estimates (i.e., squares of the coefficients) from the second and third columns divided by the square of the value in the second column. RT = reaction time; N-back = report item N back in the square; Assoc. = associative memory; WCST = Wisconsin Card Sorting Test; PMA = primary mental abilities; * = not significantly different from zero; BP = blood pressure; CatMedRT = reaction time for classifying words into categories; PictRec = identification of incomplete drawings of familiar objects; Concent = seeing groups of three, four, or five dots, and instructed to do nothing with three dots, draw horizontal line with four dots, and draw vertical line with five dots (score is number completed in a fixed time); DspanD = Digit span (auditory pronunciation) with 15-s delay; ExpirVol = expiratory volume; DigCode = digit code; DspanA = digit span for auditorily presented digits; DspanV = digit span for visually presented digits.
the time of Spearman (1927). Among the possibilities for this phenomenon are that the commonality is attributable to particu- lar neurotransmitters (e.g., quantity of dopamine, on the basis of similarities between deficits associated with aging and with Parkinson's disease; cf. Gabrieli, 1991), neuroanatomical struc-
tures (e.g., the frontal lobe, cf. West, 1996), or cognitive pro- cesses (e.g., controlled attention, cf. Hasher & Zacks, 1979; Jennings & Jacoby, 1993). The analyses reported here cannot distinguish among these alternatives, but along with other recent reports they provide a strong case that the level at which many

SHARED AGE-RELATED INFLUENCES 497
C ~
-.87
E ,-I
0 9
i ~'o ~I ~
Figure 6. Single common factor structural model for data from Clark (1960; top) and Dirken (1972; bottom). PMASpa = PMA Space Test; PMAReas = PMA Reasoning Test; LetSpd = speed of letter comparison; WordLat = word association latency to 20 common words; RT = reaction time; SysBP = systolic blood pressure; IZI'4 = choice reaction time with four s t imulus-response alternatives, median of five trials; PictRec = identification of incomplete drawings of familiar objects; C o n c e n t = seeing groups of three, four, or five dots, and instructed to do nothing with three dots, draw horizontal line with four dots, and draw vertical line with five dots (score is number completed in a fixed time); CatAcc = accuracy of classifying words into categories; C a t l ~ = reaction time when classifying words into categories; DspanD = digit span (auditory pronunciation) with 15-s delay; DiasBP = diastolic blood pressure; ExpirVol =
expiratory volume; HrtRate = heart rate.

498 SALTHOUSE, HAMBRICK, AND McGUTHRY
/
15
.46
Figure Z Single common factor structural model for data from men (top) and women (bottom) in Heron and Chown (1967). Note that because Heron and Chown recoded the variables such that all correlations with age were positive, the age-common paths in these models are positive. DigCode = digit code; DSpanA = digit span for auditorily presented digits; DSpanV = digit span for visually presented digits; SysBP = systolic blood pressure; ExpirVol = expiratory volume.
age-related influences are operating appears to be considerably broader than the individual variable.
In summary, the results of these analyses indicate that the finding that most of the age-related influences on a wide range of cognitive variables is shared appears to be robust. Not only
is it evident in different samples of adults and in different combi- nations of variables, but it also occurs in samples from different portions of the adult life span. However, the results also suggest that caution needs to be exercised when interpreting age-related influences that appear to be shared across cognitive and noncog-

SHARED AGE-RELATED INFLUENCES 499
nitive variables, because the relations involving noncognit ive variables are substantially reduced by restrict ion of age and by partialing age f rom all variables.
R e f e r e n c e s
Anstey, K.J., Lord, S.R., & Williams, P. (1997). Strength in lower limbs, visual contrast sensitivity, and simple reaction time predict cognition in older women. Psychology and Aging, 12, 137-144.
Anstey, K. J., Stankov, L., & Lord, S. R. (1993). Primary aging, second- ary aging, and intelligence. Psychology and Aging, 8, 562-570.
Baltes, P.B., & Lindenberger, U. (1997). Emergence of a powerful connection between sensory and cognitive functions across the adult life span: A new window to the study of cognitive aging? Psychology and Aging, 12, 12-21.
Byrne, B. M. (1994). Structural equation modeling with EQS and EQS/ Windows. Thousand Oaks, CA: Sage.
Clark, J. W. (1960). The aging dimension: A factorial analysis of individ- ual differences with age on psychological and physiological measure- ments. Journal of Gerontology, 15, 183-187.
Cook, N. R., Albert, M. S., Berkman, L. F., Blazer, D., Taylor, J. O., & Hennekens, C. H. (1995). Interrelationships of peak expiratory flow rate with physical and cognitive function in the elderly: MacArthur Foundation Studies of Aging. Journal of Gerontology: Medical Sci- ences, 50A, 317-323.
Cudek, R. (1989). Analysis of correlation matrices using covariance structure models. Psychological Bulletin, 105, 317-327.
Dirken, J. M. (1972). Functional age of industrial workers. Groningen, The Netherlands: Wolters-Noordhof.
Elias, M.W., D'Agostino, R.B., Elias, P.K., & Wolf, P.A. (1995). Neuropsychological test performance, cognitive functioning, blood pressure, and age: The Framingham Heart Study. Experimental Aging Research, 21, 369-391.
Gabrieli, J. D. E. (1991). Differential effects of aging and age-related neurological diseases on memory subsystems of the brain. In E Boller& J. Grafman (Eds.), Handbook ofneuropsychology (Vol. 5, pp. 149-166). Amsterdam: Elsevier.
Hasher, L., & Zacks, R. T. (1979). Automatic and effortful processes in
memory. Journal of Experimental Psychology: General, 108, 256- 288.
Heron, A., & Chown, S. (1967). Age and function. London: Churchill. Jennings, J. M., & Jacoby, L.L. (1993). Automatic versus intentional
uses of memory: Attention and control. Psychology and Aging, 8, 283-292.
Lindenberger, U., & BaRes, E B. (1994). Sensory functioning and intel- ligence in old age: A strong connection. Psychology and Aging, 9, 339-355.
McArdle, J. J., & Prescott, C. A. (1992). Age-based construct validation using structural equation modeling. Experimental Aging Research, 18, 87-115.
Raven, J. (1962). Advanced Progressive Matrices, Set I1. London: H. K. Lewis.
Salthouse, T.A. (1993). Influence of working memory on adult age differences in matrix reasoning. British Journal of Psychology, 84, 171-199.
Salthouse, T. A. (1994). The nature of the influence of speed on adult age differences in cognition. Developmental Psychology, 30, 240- 259.
Salthouse, T.A., Fristoe, N., McGuthry, K.E., & Hambrick, D.Z. (1998). Relation of task switching to speed, age, and fluid intelli- gence. Psychology and Aging, 13, 445-461.
Salthouse, T.A., Hancock, H.E., Meinz, E.J., & Hambrick, D.Z. (1996). Interrelations of age, visual acuity, and cognitive functioning. Journal of Gerontology: Psychological Sciences, 51B, P317-P330.
Salthouse, T. A., McGuthry, K. E., & Hambrick, D. Z. (1998). Relations of age to three measures of implicit learning. Unpublished manuscript, Georgia Institute of Technology.
Schmidt, M. (1996). Rey Auditory Verbal Learning Test: A handbook. Los Angeles, CA: Western Psychological Services.
Shepard, R.N., & Feng, C. (1972). A chronometric study of mental paper folding. Cognitive Psychology, 3, 228-243.
Spearman, C. (1927). The abilities of man: Their nature and measure- ment. London: Macmillan.
Verhaeghen, P., & Salthouse, T A. (1997). Meta-analyses of age-cogni- tion relations in adulthood: Estimates of linear and non-linear age effects and structural models. Psychological Bulletin, 122, 231-249.
West, R. L. (1996). An application of prefrontal cortex theory to cogni- tive aging. Psychological Bulletin, 120, 272-292.
A p p e n d i x
D e s c r i p t i o n o f S a m p l e s a n d Var i ab le s in O t h e r S tud i e s
Clark (1960): 102 men and women ages 20 to 70 years PMAReas = PMA Reasoning Test PMASpa = PMA Space Test RT = 5-alternative choice reaction time with movement time LetSpd = Speed of letter comparison Recall = Number of words recalled from a set of phrases WordLat = Word association latency to 20 common words MazeTime = Time to complete 5 mazes of varying difficulty Vision = Near accommodation distance Hearing = Absolute threshold for 3000-Hz tone Grip = Hand strength with dynamometer SysBP = Systolic blood pressure
Dirken (1972): 316 men, ages 30 to 69 years Tapping = Number of taps in 5 s
Position = Inserting a pin in holes of progressively smaller diameters with touching sides, score is smallest hole without touching sides RT4 = Choice reaction time with four stimulus-response alternatives, median of five trials CatAcc = Accuracy of classifying words into categories CatMedRT = Reaction time for classifying words into categories DspanD = Digit span (auditory pronunciation) with 15-s delay Concent= See groups of three, four, or five dots, and instructed to do nothing with three dots, draw horizontal line with four dots, and draw vertical line with five dots. Score is number completed in a fixed time. PictRec = Identification of incomplete drawings of familiar objects Grip = Hand grip strength DiasBP = Diastolic blood pressure SysBP = Systolic blood pressure HeartRate = Frequency per minute

5 0 0 SALTHOUSE, HAMBRICK, AND McGUTHRY
ExpirVol = Forced expiratory volume measured by amount of air forc- ibly expelled
Vision = Visual acuity without glasses at 4 m
Audio = Speech discrimination for monosyllables Pitch = Highest detectable frequency
Heron & Chown (1967): 300 men, 240 women, ages 20 to 79 years Matrices = 40-min Ravens Progressive Matrices
Mazes = Elithorn Perceptual Mazes
Trails = Time to complete both Parts A and B in Trail Making Test
DspanA = Digit span for auditorily presented digits
DspanV = Digit span for visually presented digits DigCode = Digit coding substitution test Grip = Hand dynamometer to measure hand grip strength for stronger hand Vision = Landolt C at distance of 6 m, both eyes uncorrected Hearing = Pure tone threshold for 1000 Hz SysBP = Systolic blood pressure ExpirVol = Forced expiratory volume in 1 s, using spirometer
Rece ived O c t o b e r 8, 1997
Rev i s ion rece ived M a r c h 23, 1998
Accep t ed M a r c h 23, 1998 •
Related Documents