Shaping higher education fifty years after Robbins Tuesday 22 October 2013 London School of Economics and Political Science Shaw Library, 6th floor, Old Building, Houghton Street, London, WC2A 2AE The event is supported by The LSE Annual Fund #LSERobbins

Welcome message from author
This document is posted to help you gain knowledge. Please leave a comment to let me know what you think about it! Share it to your friends and learn new things together.
Transcript
Shaping higher education fifty years after RobbinsTuesday 22 October 2013
London School of Economics and Political ScienceShaw Library, 6th floor, Old Building, Houghton Street, London, WC2A 2AE
The event is supported by The LSE Annual Fund #LSERobbins

What happened later: the British road to mass HE
David WatsonPrincipal, Green Templeton College
Conference on “shaping higher education fifty years after Robbins”
London School of Economics22 October 2013
Outline
• Dimensions of mass higher education• Legislative hyper-activity• Fees and funding• Institutional diversity• Facing the future

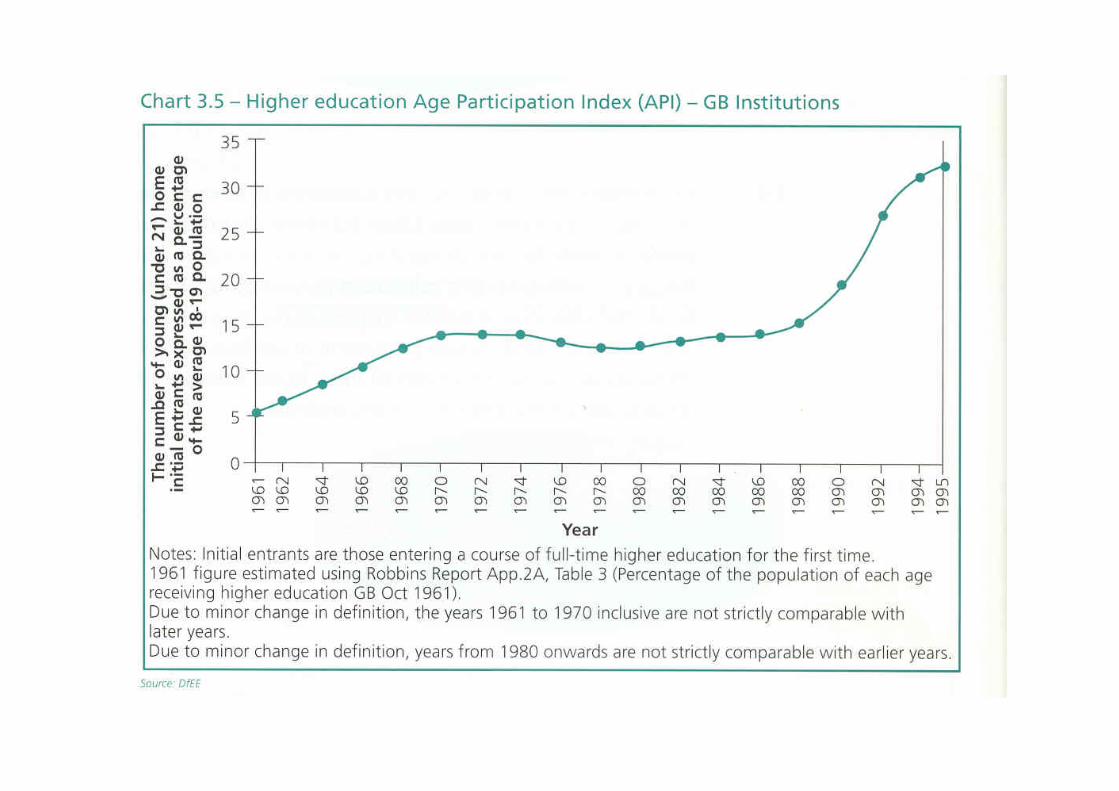
Mass HE
In theory (Martin Trow):•Below 15% - elite•15-40% - mass•40% (later 50%) + - universal.
In practice (BIS 2012):•GB - 49%•Scotland – 55%•Men – 45%•Women – 55%
5
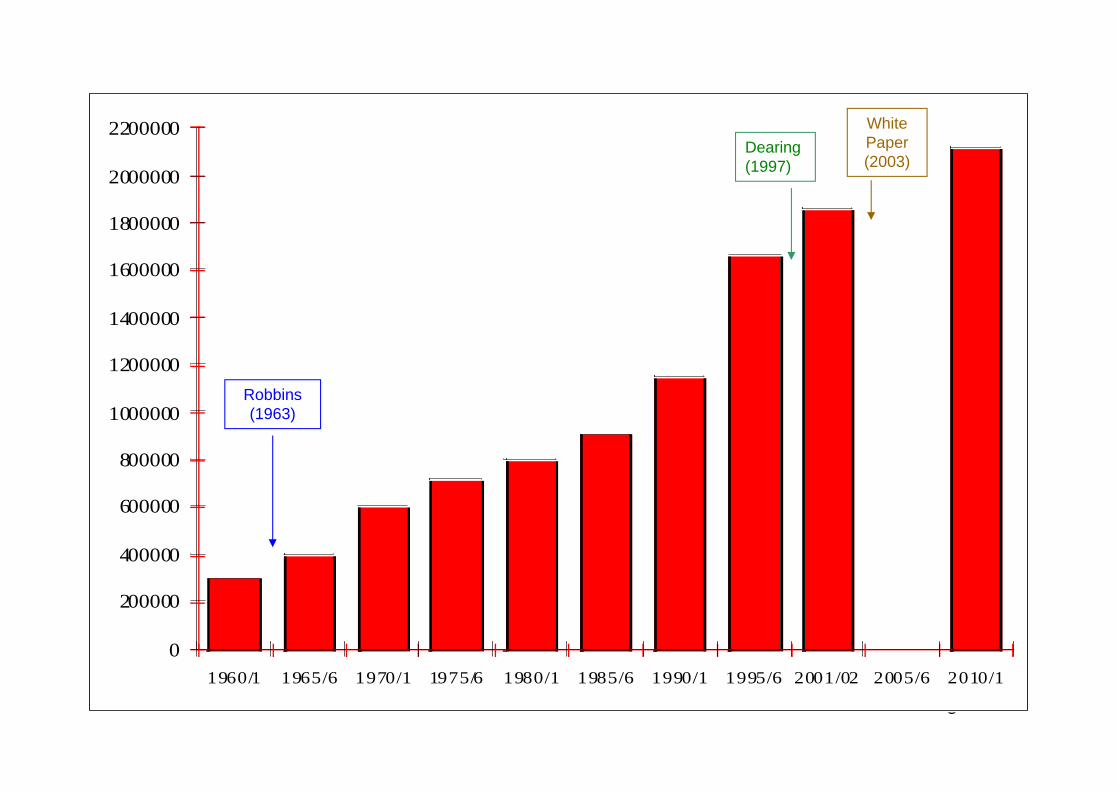
Total higher education student numbers, UK, 1960/61 – 2010/11
Source: DES 1969; HESA 1999, 2002; HEPI 2003
0
200000
400000
600000
800000
1000000
1200000
1400000
1600000
1800000
2000000
2200000
1960/1 1965/6 1970/1 1975/6 1980/1 1985/6 1990/1 1995/6 2001/02 2005/6 2010/1
Robbins (1963)
Dearing(1997)
White Paper (2003)
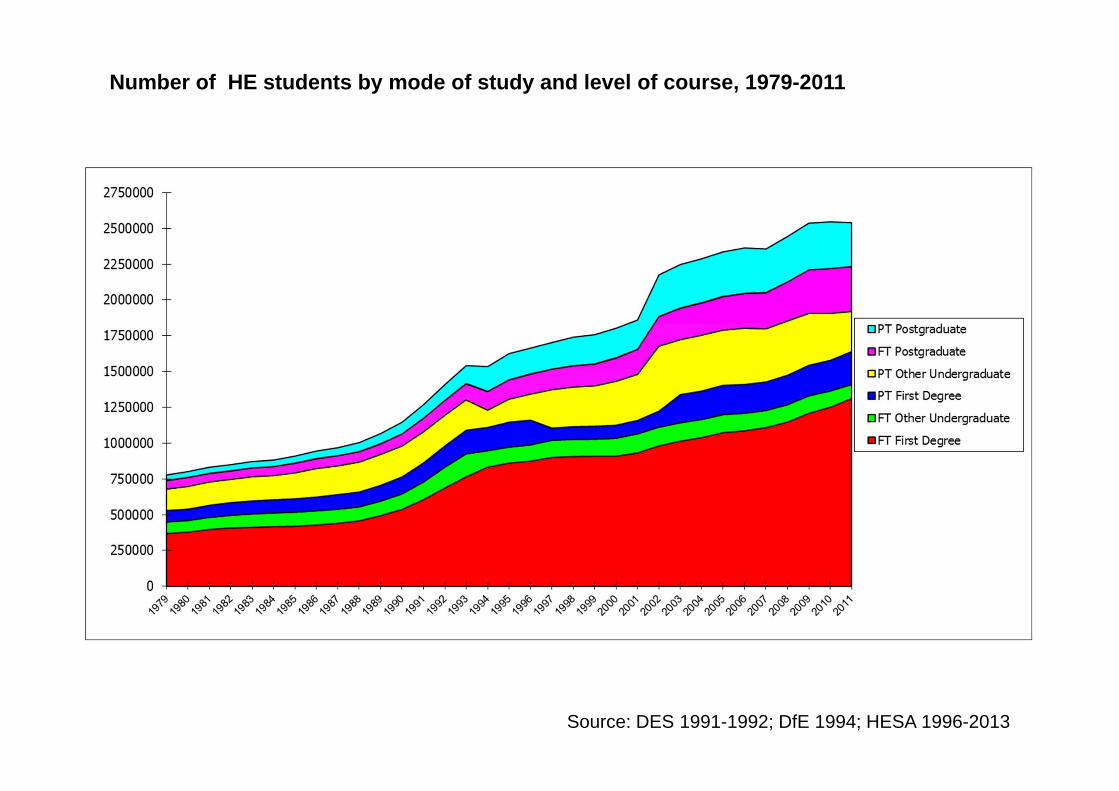
Number of HE students by mode of study and level of course, 1979-2011
Source: DES 1991-1992; DfE 1994; HESA 1996-2013
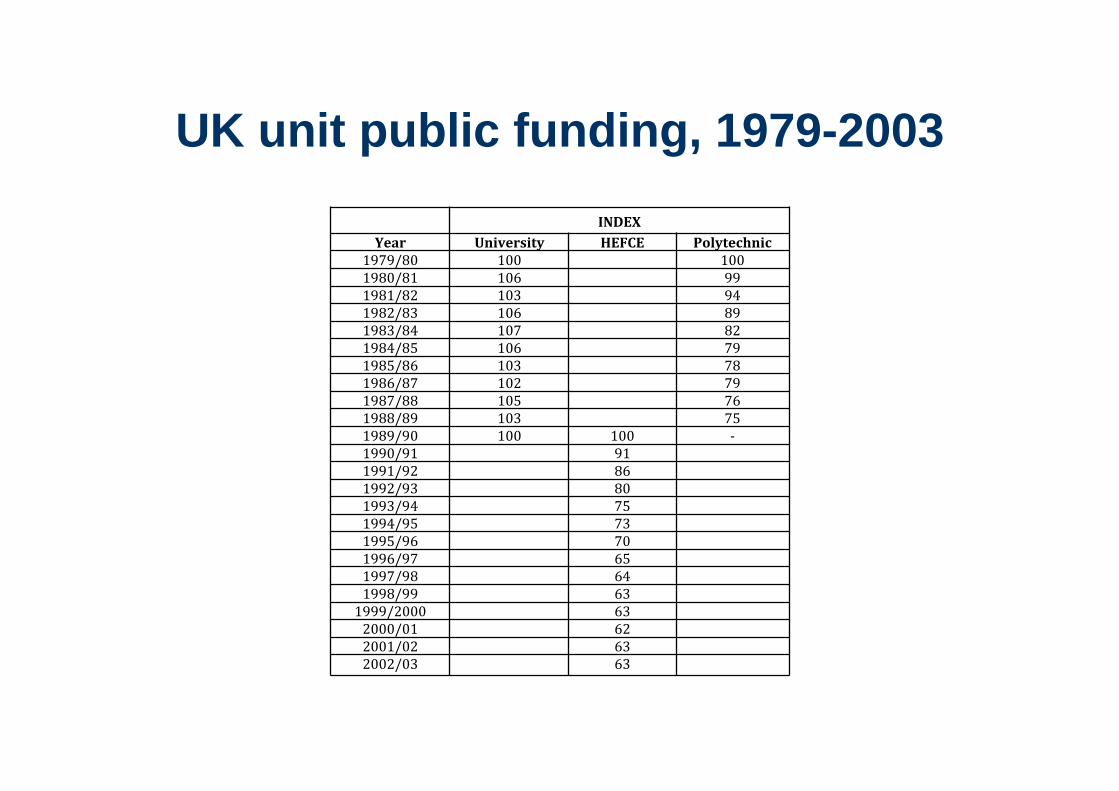
UK unit public funding, 1979-2003INDEX
Year University HEFCE Polytechnic1979/80 100 1001980/81 106 991981/82 103 941982/83 106 891983/84 107 821984/85 106 791985/86 103 781986/87 102 791987/88 105 761988/89 103 751989/90 100 100 ‐1990/91 911991/92 861992/93 801993/94 751994/95 731995/96 701996/97 651997/98 641998/99 631999/2000 632000/01 622001/02 632002/03 63


UK Government HE initiatives since 1963: twelve “frameworks
1. 1963: the Robbins report – creation of “new” universities, “ability to benefit.”2. 1965: the Woolwich speech – creation of the Polytechnics3. 1972: the James report – reorganisation of teacher training, “diversification.”4. 1980-85: the Tory cuts – withdrawal of “overseas” subsidy, White Paper on contraction
and rationalisation5. 1985: the National Advisory Body for Public Sector HE (NAB), “capping the pool,”
centralisation of local authority HE6. 1988: the Great Education Reform Act – incorporation of the Polytechnics, Central
Institutions and large Colleges7. 1992: Further & Higher Education Act – ending of the binary line, Funding Councils for
devolved administrations, creation of the “new new” universities8. 1997: the Dearing Report – fees for FT undergraduate students9. 2004: Higher Education Act – variable fees, “new new new” universities, foundation
degree awarding powers for FECs10. 2009: Higher Ambitions – New Labour’s parting shot11. 2010: the Browne Review – higher undergraduate fees, new student contribution system12. 2011: Students at the Heart of the System
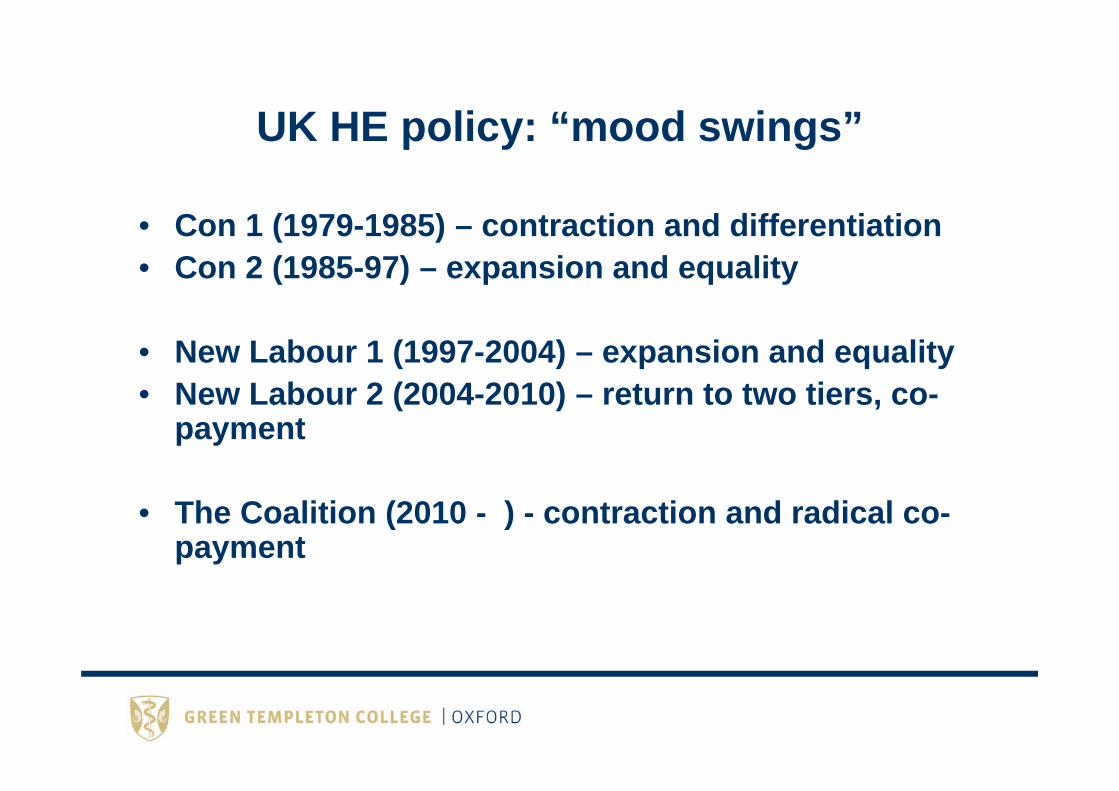
UK HE policy: “mood swings”
• Con 1 (1979-1985) – contraction and differentiation• Con 2 (1985-97) – expansion and equality
• New Labour 1 (1997-2004) – expansion and equality• New Labour 2 (2004-2010) – return to two tiers, co-
payment
• The Coalition (2010 - ) - contraction and radical co-payment

UK “types” of university (after Scott, 1995)
1. Oxford and Cambridge2. University of London3. Victorian/Edwardian Civics4. Redbricks5. Isolates: e.g. Durham and
Keele6. Technological (ex CAT)7. Open University
8. Specialised/monotechnic9. Old new (1960s)10.New new (1992)11.New new new (2004)12.Mixed economy (HE in FE)13.Private: Buckingham14.For profit

The modern university: key types
1. The international research university2. The professional formation university3. The ‘curriculum innovation” university4. The distance/open learning university5. The College6. The specialised/single subject HEI7. The “for profit” corporation
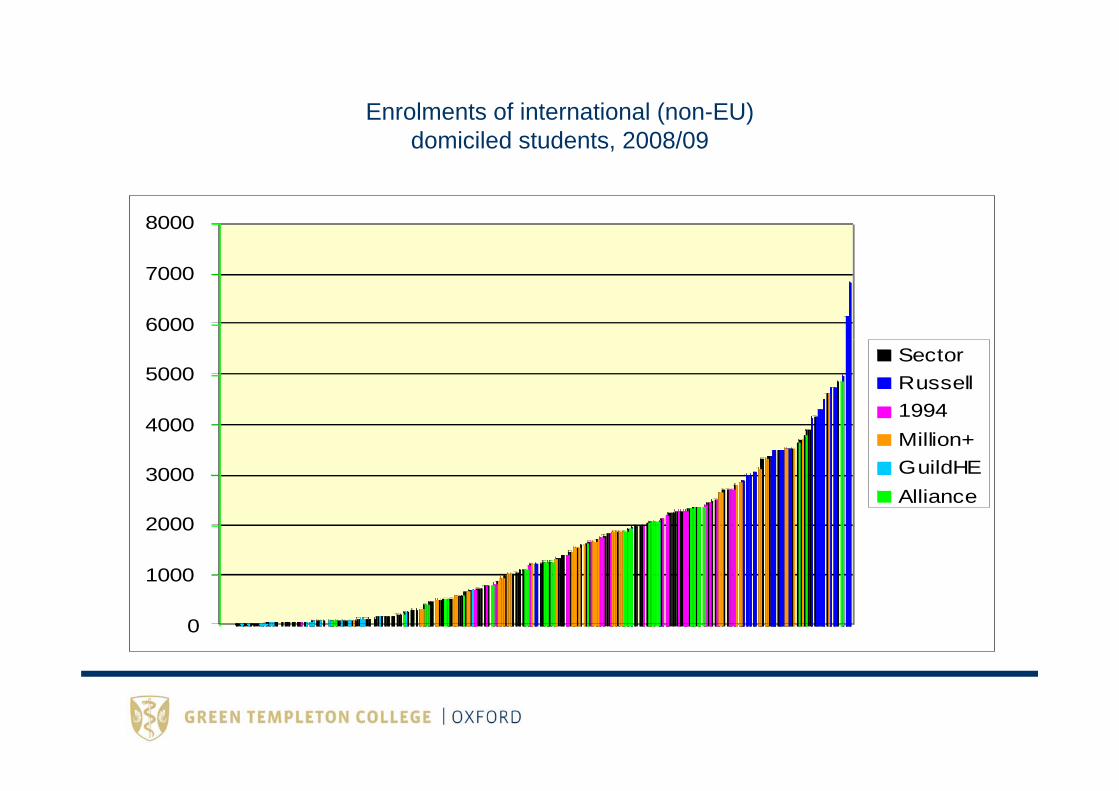
Enrolments of international (non-EU)domiciled students, 2008/09
0
1000
2000
3000
4000
5000
6000
7000
8000
SectorRussell1994Million+GuildHEAlliance

Income from international (non-EU) student fees as a percentage of total income, 2008/09

Percentage of UK-domiciled first yearstudents from minority ethnic groups, 2008/09
0%
10%
20%
30%
40%
50%
60%
70%
80%
Sector
Russell
1994
Million+
GuildHE
Alliance

Percentage of young full-time first degree entrants fromnational statistics socio-economic classification classes
4, 5, 6 and 7, 2008/09
0
10
20
30
40
50
60
70
SectorRussell1994Million+GuildHEAlliance

Percentage of first- and upper second-class degrees awarded, 2008/09, by interest groups
0%
10%
20%
30%
40%
50%
60%
70%
80%
90%
100%
SectorRussell1994Million+GuildHEAlliance

Funding of research through the dual support system as apercentage of total income, 2008/09, by interest groups
0%
5%
10%
15%
20%
25%
30%
35%
Sector
Russell
1994
Million+
GuildHE
Alliance
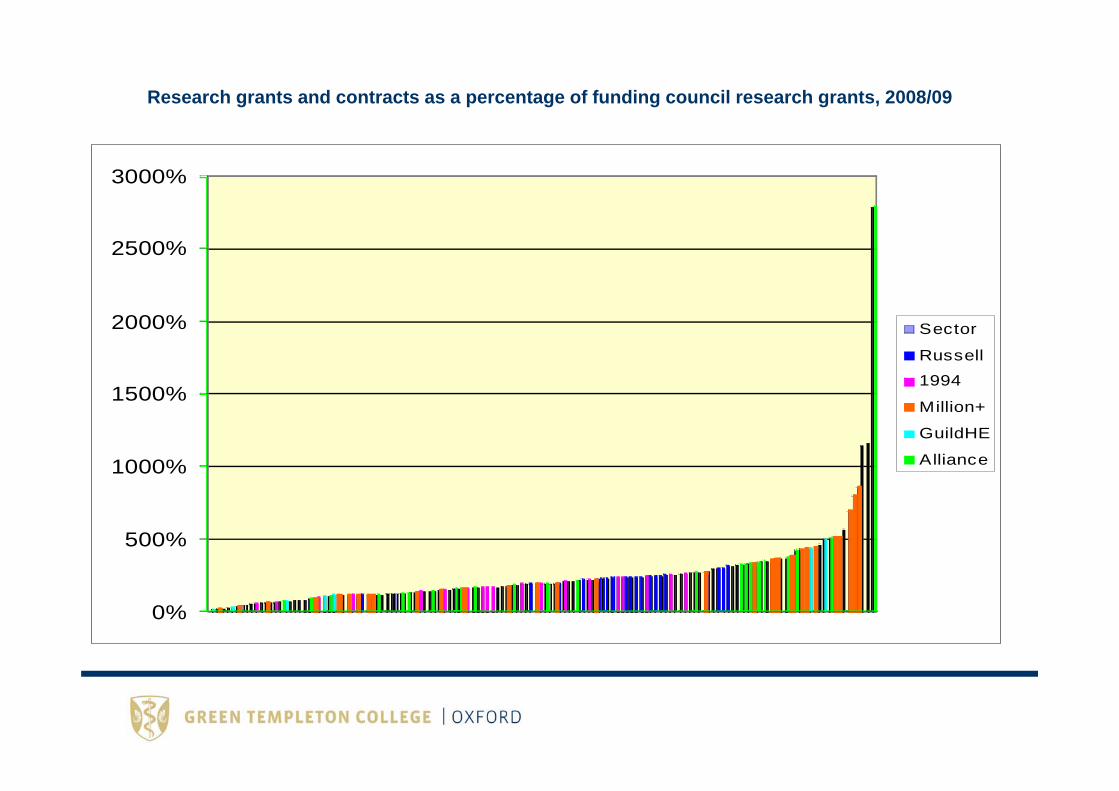
Research grants and contracts as a percentage of funding council research grants, 2008/09
0%
500%
1000%
1500%
2000%
2500%
3000%
Sector
Russell
1994
Million+
GuildHE
Alliance

Days ratio of net liquidity to total expenditure, 2008/09
-50
0
50
100
150
200
250
300
350
SectorRussell1994Million+GuildHEAlliance

Surplus/deficit as a percentage of income, 2008/09
-20
-15
-10
-5
0
5
10
15
20
25
SectorRussell1994Million+GuildHEAlliance

Percentage ratio of total long-term borrowings to total income, 2008/09
0
50
100
150
200
250
Sector
Russell
1994
Million+GuildHE
Alliance

The security index, 2008/09, by interest groups

Stage 1: Complex Transitions
Source: Furlong 2008
Discussion

Shaping higher education fifty years after RobbinsTuesday 22 October 2013
London School of Economics and Political ScienceShaw Library, 6th floor, Old Building, Houghton Street, London, WC2A 2AE
The event is supported by The LSE Annual Fund #LSERobbins
Related Documents


![[Kay a. Robbins, Steve Robbins] UNIX Systems Progr Pratica](https://static.cupdf.com/doc/110x72/552dbfcc4a795956618b4757/kay-a-robbins-steve-robbins-unix-systems-progr-pratica.jpg)


