© 2006 Progress Energy Yadkin-Pee Dee River Hydroelectric Project FERC No. 2206 SHALLOW WATER FISH, CRAYFISH, AND MUSSEL SURVEYS OF THE PEE DEE RIVER AND TRIBUTARIES Water Resources Group Issue No. 1 - Describe Current Resident River Aquatic Resources Of Project Area PROGRESS ENERGY APRIL 2006

Welcome message from author
This document is posted to help you gain knowledge. Please leave a comment to let me know what you think about it! Share it to your friends and learn new things together.
Transcript
© 2006 Progress Energy
Yadkin-Pee Dee River Hydroelectric Project FERC No. 2206
SHALLOW WATER FISH, CRAYFISH, AND MUSSEL SURVEYS OF THE PEE
DEE RIVER AND TRIBUTARIES
Water Resources Group Issue No. 1 - Describe Current Resident River Aquatic Resources Of
Project Area
PROGRESS ENERGY
APRIL 2006

ACKNOWLEDGEMENTS Progress Energy would like to acknowledge and thank several individuals and agencies who provided technical assistance during this study: Dr. Ryan Heise, Mr. Rob Nicholls, Mr. Todd Ewing, Mr. Scott Van Horn, Mr. Nolan Banish, Ms. Angie Rogers, and Mr. Jason Meador with the North Carolina. Wildlife Resources Commission; Dr. Art Bogan, Dr. John Cooper, and Ms. Jamie Smith with the North Carolina Museum of Natural Sciences; Ms. Jennifer Price with the South Carolina Department of Natural Resources; and Mr. Eric Krueger and Mr. Chris Sizells with The Nature Conservancy.
i
TABLE OF CONTENTS
Section Title Page No. ACRONYM LIST ....................................................................................................AL-1 EXECUTIVE SUMMARY ..........................................................................................ES-1 SECTION 1 - INTRODUCTION .................................................................................... 1-1 SECTION 2 - STUDY OBJECTIVES ............................................................................. 2-1 SECTION 3 - SITE DESCRIPTION ............................................................................... 3-1 3.1 Mainstem River Study Reaches..................................................................................... 3-1 3.2 Tributaries...................................................................................................................... 3-1 3.3 Reach 1 Habitat Conditions (Tillery Dam to Blewett Falls Lake, including Lake Tillery).................................................................................................................. 3-5 3.4 Reach 2 Habitat Conditions (Blewett Falls Lake to S.C. Highway 34) ........................ 3-6 3.5 Water Quality Conditions.............................................................................................. 3-9 SECTION 4 - METHODS ............................................................................................ 4-1 4.1 Fish and Crayfish Surveys............................................................................................. 4-1 4.2 Mussel Survey ............................................................................................................... 4-4 4.3 Quality Control and Assurance ..................................................................................... 4-5 SECTION 5 - RESULTS AND DISCUSSION .................................................................. 5-1 5.1 Fish Surveys .................................................................................................................. 5-1
5.1.1 Reach 1 (Tillery Dam to Blewett Falls Lake) ................................................. 5-1 5.1.2 Reach 2 (Blewett Falls Dam to S.C. Highway 34) ......................................... 5-7
5.2 Crayfish Surveys ......................................................................................................... 5-17 5.3 Mussel Surveys............................................................................................................ 5-18
5.3.1 Reach 1 (Tillery Dam to Blewett Falls Lake) ............................................... 5-21 5.3.2 Reach 2 (Blewett Falls Dam to S.C. Highway 34) ....................................... 5-23 5.3.3 Tributaries ..................................................................................................... 5-24 5.3.4 The South Carolina Nature Conservancy Mussel Survey of the Pee Dee River................................................................................................ 5-25 5.3.5 Host Fish Species for Unionid Mussel Glochidia Larvae............................. 5-27
SECTION 6 - SUMMARY ........................................................................................... 6-1 SECTION 7 - REFERENCES........................................................................................ 7-1

TABLE OF CONTENTS (Continued)
Section Title Page No.
ii
APPENDICES APPENDIX A - SUMMARY CATCH DATA BY SAMPLE LOCATION AND GEAR TYPE
FOR THE SHALLOW WATER FISH SURVEY CONDUCTED IN THE PEE DEE RIVER BELOW THE TILLERY AND BLEWETT FALLS DEVELOPMENTS DURING APRIL-JUNE 2004
APPENDIX B - LENGTH-FREQUENCY DATA FOR MUSSEL TAXA COLLECTED BY RIVER REACH FOR THE SHALLOW WATER MUSSEL SURVEY CONDUCTED IN THE PEE DEE RIVER BELOW THE TILLERY AND BLEWETT FALLS DEVELOPMENTS DURING 2004
iii
LIST OF FIGURES
Figure Title Page No. Figure 3-1 Map of Lake Tillery and the Pee Dee River below the Tillery Development
showing sampling locations in Reach 1 for the shallow water fish, crayfish and mussel study during 2004. ............................................................................ 3-3
Figure 3-2 Map of Blewett Falls Lake and the Pee Dee River below the Blewett Hydroelectric Development showing sampling locations in Reach 2 for the shallow water fish, crayfish, and mussel study during 2004. .............................. 3-4
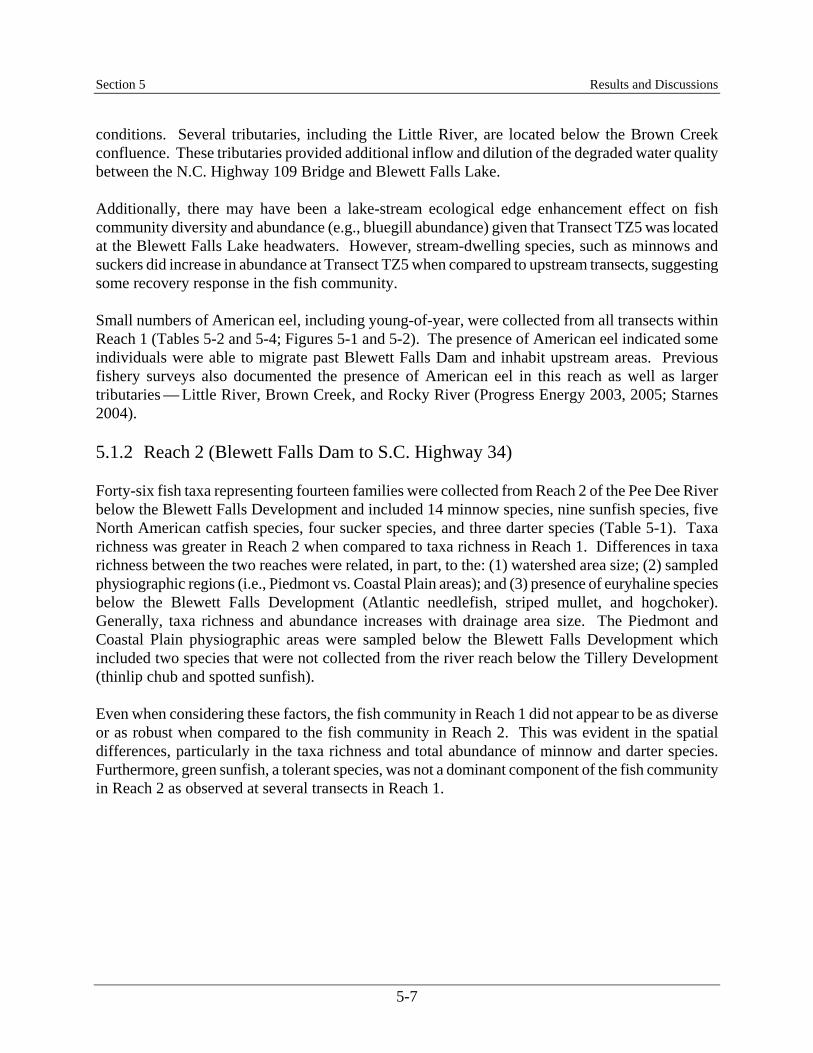
Figure 5-1 Length-frequency histograms of American eel by transect collected during the shallow water fish survey of the Pee Dee River below the Tillery Development during 2004.................................................................................... 5-8
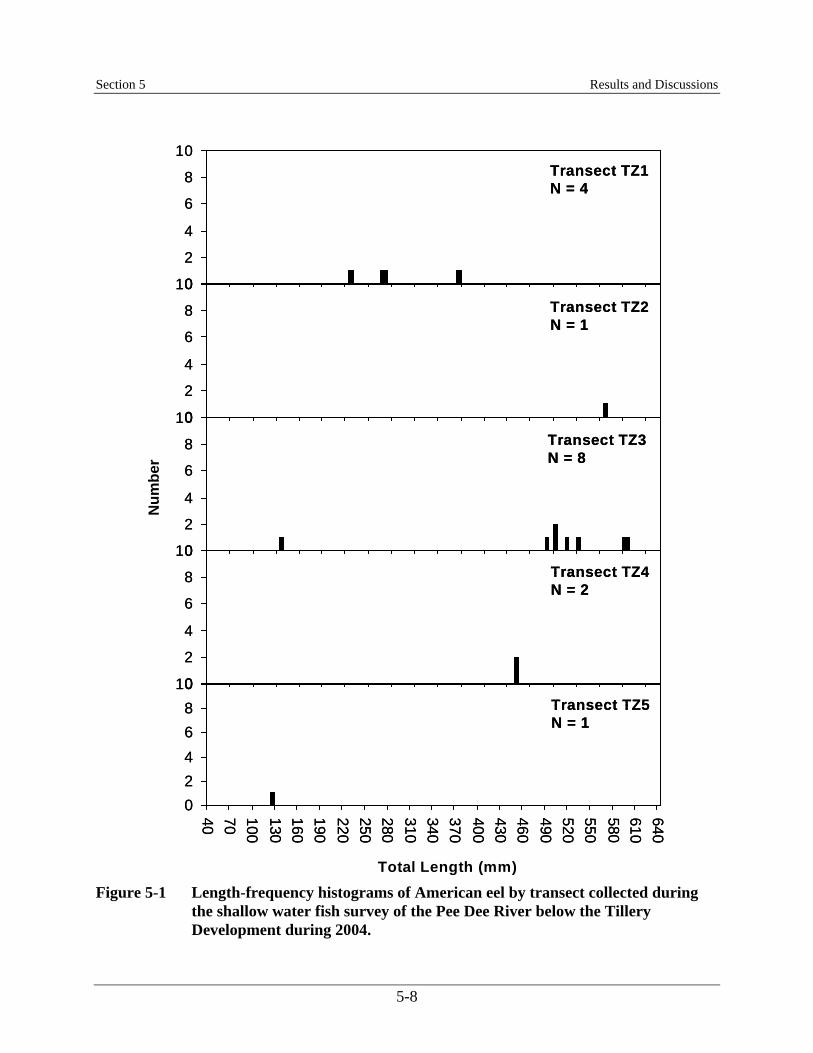
Figure 5-2 Pram electrofishing catch rates (number per hour) by transect for American eel collected from Reaches 1 and 2 of the Pee Dee River below the Tillery and Blewett Falls Hydroelectric Developments during 2004.............................. 5-9
Figure 5-3 Length-frequency histograms of American eel by transect collected during the shallow water fish survey of the Pee Dee River below the Blewett Falls Development (Reach 2) during 2004.....................................................................16
iv
LIST OF TABLES
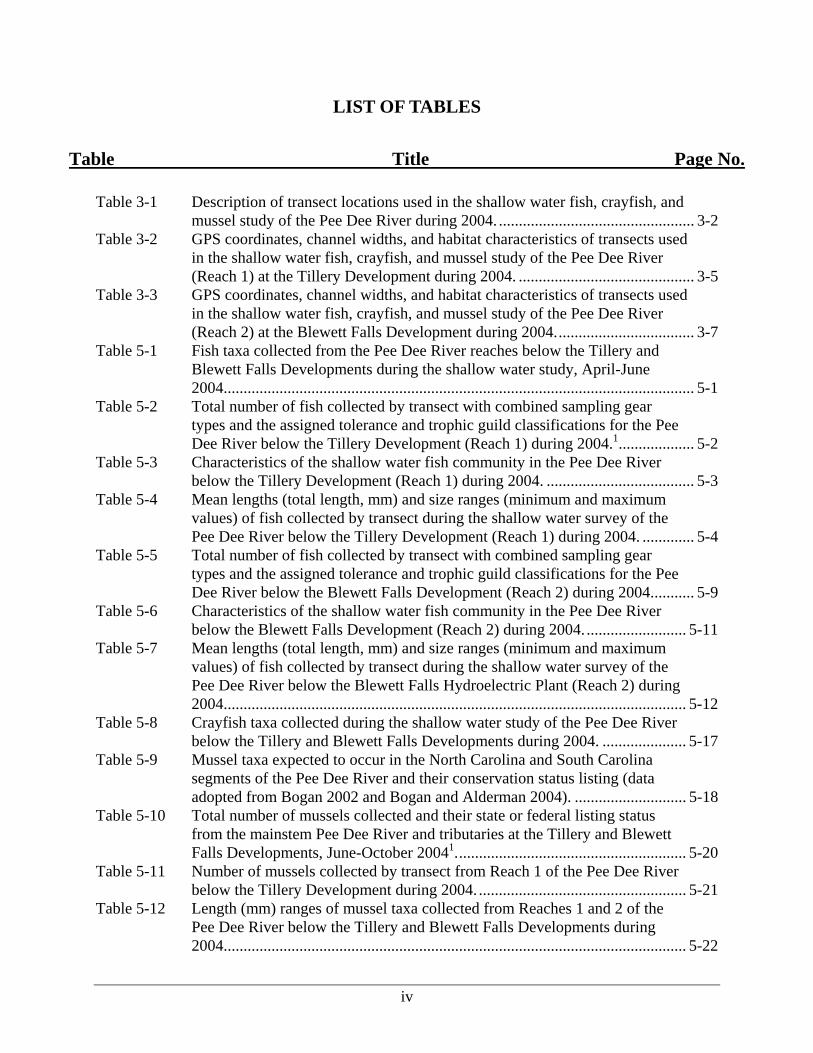
Table Title Page No. Table 3-1 Description of transect locations used in the shallow water fish, crayfish, and
mussel study of the Pee Dee River during 2004. ................................................. 3-2 Table 3-2 GPS coordinates, channel widths, and habitat characteristics of transects used
in the shallow water fish, crayfish, and mussel study of the Pee Dee River (Reach 1) at the Tillery Development during 2004. ............................................ 3-5
Table 3-3 GPS coordinates, channel widths, and habitat characteristics of transects used in the shallow water fish, crayfish, and mussel study of the Pee Dee River (Reach 2) at the Blewett Falls Development during 2004................................... 3-7
Table 5-1 Fish taxa collected from the Pee Dee River reaches below the Tillery and Blewett Falls Developments during the shallow water study, April-June 2004...................................................................................................................... 5-1
Table 5-2 Total number of fish collected by transect with combined sampling gear types and the assigned tolerance and trophic guild classifications for the Pee Dee River below the Tillery Development (Reach 1) during 2004.1................... 5-2
Table 5-3 Characteristics of the shallow water fish community in the Pee Dee River below the Tillery Development (Reach 1) during 2004. ..................................... 5-3
Table 5-4 Mean lengths (total length, mm) and size ranges (minimum and maximum values) of fish collected by transect during the shallow water survey of the Pee Dee River below the Tillery Development (Reach 1) during 2004. ............. 5-4
Table 5-5 Total number of fish collected by transect with combined sampling gear types and the assigned tolerance and trophic guild classifications for the Pee Dee River below the Blewett Falls Development (Reach 2) during 2004........... 5-9
Table 5-6 Characteristics of the shallow water fish community in the Pee Dee River below the Blewett Falls Development (Reach 2) during 2004. ......................... 5-11
Table 5-7 Mean lengths (total length, mm) and size ranges (minimum and maximum values) of fish collected by transect during the shallow water survey of the Pee Dee River below the Blewett Falls Hydroelectric Plant (Reach 2) during 2004.................................................................................................................... 5-12
Table 5-8 Crayfish taxa collected during the shallow water study of the Pee Dee River below the Tillery and Blewett Falls Developments during 2004. ..................... 5-17
Table 5-9 Mussel taxa expected to occur in the North Carolina and South Carolina segments of the Pee Dee River and their conservation status listing (data adopted from Bogan 2002 and Bogan and Alderman 2004). ............................ 5-18
Table 5-10 Total number of mussels collected and their state or federal listing status from the mainstem Pee Dee River and tributaries at the Tillery and Blewett Falls Developments, June-October 20041.......................................................... 5-20
Table 5-11 Number of mussels collected by transect from Reach 1 of the Pee Dee River below the Tillery Development during 2004. .................................................... 5-21
Table 5-12 Length (mm) ranges of mussel taxa collected from Reaches 1 and 2 of the Pee Dee River below the Tillery and Blewett Falls Developments during 2004.................................................................................................................... 5-22

LIST OF TABLES (Continued)
Table Title Page No.
v
Table 5-13 Number of mussels collected by transect from Reach 2 of the Pee Dee River below the Blewett Falls Development during 2004........................................... 5-23
Table 5-14 Number of mussels collected by transect from tributaries of the Pee Dee River at the Tillery and Blewett Falls Developments during 2004. .................. 5-24
Table 5-15 Length (mm) ranges of mussel taxa collected from tributaries of the Pee Dee River associated with the Tillery and Blewett Falls Developments during 2004.................................................................................................................... 5-25
Table 5-16 Mussel taxa collected during The Nature Conservancy of South Carolina study of the Pee Dee River, South Carolina, during 2004. Taxa are ranked in relative order of abundance from most abundant to least abundant. ................. 5-26
Table 5-17 Number of mussel taxa found by sample location during The Nature Conservancy of South Carolina mussel study of the Pee Dee River, South Carolina, during 2004. ....................................................................................... 5-26
Table 5-18 List of known fish hosts for glochidia (larvae) of mussel taxa found in the Pee Dee River, North Carolina-South Carolina (data adopted from Bogan 2002 and Bogan and Alderman 2004). .............................................................. 5-27

AL-1
Acronym List Federal/State Agencies Advisory Council on Historic Preservation (ACHP) Federal Aviation Administration (FAA) Federal Energy Regulatory Commission (FERC) National Park Service (NPS) National Marine Fisheries Service (NMFS) National Oceanic and Atmospheric Administration (NOAA) National Resource Conservation Service (NRCS) formerly known as Soil Conservation Service National Weather Service (NWS) North Carolina Department of Environment and Natural Resources (NCDENR) North Carolina Environmental Management Commission (NCEMC) North Carolina Department of Natural and Economic Resources, Division of Environmental
Management (NCDEM) North Carolina Division of Parks and Recreation (NCDPR) North Carolina Division of Water Resources (NCDWR) North Carolina Division of Water Quality (NCDWQ) North Carolina Natural Heritage Program (NCNHP) North Carolina State Historic Preservation Officer (NCSHPO) North Carolina Wildlife Resources Commission (NCWRC) South Carolina Department of Natural Resources (SCDNR) South Carolina Department of Health and Environmental Control (SCDHEC) State Historic Preservation Office (SHPO) U.S. Army Corps of Engineers (ACOE) U.S. Department of Interior (DOI) U.S. Environmental Protection Agency (USEPA) U.S. Fish and Wildlife Service (USFWS) U.S. Geological Survey (USGS) U.S. Department of Agriculture (USDA) U.S. Forest Service (USFS) Other Entities Alcoa Power Generating, Inc., Yadkin Division (APGI) Appalachian State University (ASU) Atlantic States Marine Fisheries Commission (ASMFC) Electric Power Research Institute (EPRI) Progress Energy University of North Carolina at Chapel Hill (UNCCH) Facilities/Places Yadkin - Pee Dee River Project (entire two-development project including both powerhouses, dams and impoundments) Blewett Falls Development (when referring to dam, powerhouse and impoundment) Blewett Falls Dam (when referring to the structure) Blewett Falls Hydroelectric Plant (when referring to the powerhouse) Blewett Falls Lake (when referring to the impoundment)

Acronym List
AL-2
Tillery Development (when referring to dam, powerhouse and impoundment) Tillery Dam (when referring to the structure) Tillery Hydroelectric Plant (when referring to the powerhouse) Lake Tillery (when referring to the impoundment) Documents 401 Water Quality Certification (401 WQC) Draft Environmental Assessment (DEA) Environmental Assessment (EA) Environmental Impact Statement (EIS) Final Environmental Assessment (FEA) Initial Consultation Document (ICD) Memorandum of Agreement (MOA) National Wetland Inventory (NWI) Notice of Intent (NOI) Notice of Proposed Rulemaking (NOPR) Preliminary Draft Environmental Assessment (PDEA) Programmatic Agreement (PA) Scoping Document (SD) Shoreline Management Plan (SMP) Laws/Regulations Clean Water Act (CWA) Code of Federal Regulations (CFR) Electric Consumers Protection Act (ECPA) Endangered Species Act (ESA) Federal Power Act (FPA) Fish and Wildlife Coordination Act (FWCA) National Environmental Policy Act (NEPA) National Historic Preservation Act (NHPA) Terminology Alternative Relicensing Process (ALP) Cubic feet per second (cfs) Degrees Celsius (C) Degrees Fahrenheit (F) Dissolved oxygen (DO) Feet (ft) Gallons per day (gpd) Geographic Information Systems (GIS) Gigawatt Hour (GWh) Global Positioning System (GPS) Grams (g) Horsepower (hp) Kilogram (kg) Kilowatts (kW)

Acronym List
AL-3
Kilowatt-hours (kWh) Mean Sea Level (msl) Megawatt (MW) Megawatt-hours (MWh) Meter (m) Micrograms per liter (µg/L) Milligrams per liter (mg/L) Millimeter (mm) Million gallons per day (mgd) National Geodetic Vertical Datum (NGVD) National Wetlands Inventory (NWI) Non-governmental Organizations (NGOs) Ounces (oz.) Outstanding Remarkable Value (ORV) Parts per billion (ppb) Parts per million (ppm) Pounds (lbs.) Power Factor (p.f.) Probable Maximum Flood (PMF) Programmable logic controller (PLC) Project Inflow Design Flood (IDF) Rare, Threatened, and Endangered Species (RTE) Ready for Environmental Assessment (REA) Resource Work Groups (RWG) Revolutions per Minute (rpm) Rights-of-way (ROW) River mile (RM) Stakeholders (federal and state resource agencies, NGOs, and other interested parties) Volts (V)

ES-1
Executive Summary Shallow water habitat in the Pee Dee River below the Blewett Falls and Tillery Developments, including selected major tributaries, was intensively surveyed for fish, crayfish, and mussels during 2004. The survey was conducted to fulfill study plan requirements outlined in the Water Resources Work Group Issue No. 1: Resident River Aquatic Resources of Project Area. The survey objective was to characterize the fish, crayfish, and mussel shallow water communities in the mainstem Pee Dee River and the major tributaries in the vicinity of each hydroelectric development. The shallow water fish and mussel communities in the mainstem Pee Dee River below the Tillery Development were less diverse and not as abundant as those communities observed below the Blewett Development, even when considering watershed drainage area size and physiographic regional differences. Conversely, crayfish were more abundant in the river reach below the Tillery Development. Survey results also showed possible effects to both fish and mussel communities in the river reach below the Tillery Development due to degraded water quality from the Rocky River, and to a lesser extent, Brown Creek. Approximately 7 to 12 miles of river may have been affected by the degraded water quality in this reach. These effects were manifested in lower species richness, total organism abundance, and increased abundance of certain pollution-tolerant species (mainly the fish community). The degree of effect varied between the fish, crayfish, and mussel communities. Recovery was observed in the crayfish and mussel community located downstream of the Brown Creek confluence when compared to the fish community response. The fish community characteristics below the Blewett Falls Development differed from those community characteristics below the Tillery Development by the following attributes: (1) greater total fish abundance; (2) greater number and abundance of minnow, sunfish, darter, and environmentally sensitive intolerant taxa; (3) species dominance that generally was more balanced and not restricted to just a few tolerant or habitat-generalist taxa; (4) balanced representation of the trophic feeding guilds; and (5) higher percentages of multiple size classes present. Spatially, fish taxa richness was the greatest at the transect located immediately below the Blewett Falls Development, which included the greatest number of minnow, darter, and sunfish species. The total number of collected fish did not exhibit an explicit spatial trend with increasing distance from the power plant. Total catches were greatly influenced by high catch rates of American eel or eastern silvery minnow at several transects. There were 12,512 mussels representing 18 taxa collected from the Pee Dee River reaches and tributaries associated with both hydroelectric developments. Approximately 84 percent of the total number of collected mussels were represented by two taxa — eastern elliptio and Roanoke slabshell. Thirteen of these mussel taxa had state or federal conservation listing status including five North Carolina Threatened species, two North Carolina Endangered species and Federal Species of Concern, two North Carolina Special Concern species, one North Carolina Significantly Rare species, and seven South Carolina Natural Heritage Program State Species of Concern. Three other mussel taxa — Waccamaw spike, tidewater mucket, and Southern rainbow — were also collected from Reach 2 during surveys conducted by The Nature Conservancy during 2004 and 2005. The collection of Waccamaw spike in the lower Pee Dee River represented a new range extension for this species.
Executive Summary
ES-2
The mussel community was more diverse and had a greater abundance of individuals in the Pee Dee River below the Blewett Falls Development when compared to the mussel community in the river reach below the Tillery Development. The greatest number of mussel taxa were collected at the three transects located immediately below the Blewett Falls Development. Seven of the thirteen taxa collected at these transects had a conservation listing status in North Carolina waters. These transects, located approximately 1 to 5 miles below the Blewett Falls Development, also supported a very large amount of mussel biomass and accounted for 84 percent of all collected mussels within this reach. Mussel taxa richness and abundance was greater in the mainstem Pee Dee River than the tributaries. Mussels were located in seven of the 14 transects sampled in tributaries associated with both hydroelectric developments. The Little River, Uwharrie River, and Mountain Creek (Blewett Falls Lake) supported the greatest number of mussels, including rare species. Mussels were either absent or reduced in abundance at transects sampled in Clarks Creek, Rocky River, and Cedar Creek which are tributaries within the river reach below the Tillery Development. Mussels were also absent or reduced in abundance in the major tributaries of the Pee Dee River reach immediately below the Blewett Falls Development.

1-1
Section 1 - Introduction Progress Energy is currently relicensing the Blewett Falls and Tillery hydroelectric developments (i.e., Yadkin-Pee Dee River Hydroelectric Project No. 2206) with the Federal Regulatory Commission (FERC). As part of the relicensing process, Progress Energy established Resource Work Groups (RWGs) during May 2003 to identify environmental issues associated with project operations and develop study plans, if necessary, specific to project lands and associated lakes and tailwaters. The Water RWG identified the need for additional shallow water surveys of the fish, crayfish, and mussel communities in the Pee Dee River and tributaries associated with both hydroelectric developments (Progress Energy 2004a). Progress Energy agreed to conduct a shallow water survey during 2004 as part of its relicensing process (i.e., Water RWG Issue No. 1, “Resident River Aquatic Resources of Project Area”). This shallow water survey was conducted in accordance with the study plan developed by the Water RWG during 2003 (Progress Energy 2004a).

2-1
Section 2 - Study Objectives The primary objectives of this survey were to conduct: (1) an intensive shallow water sampling for fish and crayfish fauna in shoal and gravel bar habitats in the Pee Dee River; and (2) a habitat-based survey of mussel fauna in the Pee Dee River, including major tributaries associated with the mainstem river and the Project reservoirs.
3-1
Section 3 - Site Description 3.1 Mainstem River Study Reaches This survey was conducted in two reaches of the Pee Dee River. The first reach (Reach 1), 17 miles in length, extended from the base of Tillery Dam to the headwaters of Blewett Falls Lake (Table 3-1 and Figure 3-1. Five transects were sampled in this reach (Transects TZ1 to TZ5). This reach was located entirely within the Piedmont physiographic region. Major named tributaries in this reach include Clarks Creek, Rocky River, Brown Creek, and Little River. The second reach (Reach 2), 72 miles in length, extended from the base of Blewett Falls Dam to S.C. Highway 34 Bridge at Cashua Ferry boat landing (Table 3-1 and Figure 3-2). Nine transects were sampled in this reach (Transects BZ1 to BZ8 including Transect BZ1A). This reach included the Piedmont Fall Line (23 miles of the reach) and upper Coastal Plain physiographic regions (49 miles of the reach). Transects BZ1 to BZ5 were located in the Piedmont Fall Line region of North Carolina-South Carolina while Transects BZ6 to BZ8 were located in the upper Coastal Plain region of South Carolina. Major named tributaries in this reach include Cartledge Creek, Island Creek, Hitchcock Creek, Little and Jones Creek, Westfield Creek, Thompson Creek, Crooked Creek, Spot Mill Creek, Cedar Creek, and Three Creek. 3.2 Tributaries Sampling was conducted for the mussel survey in identified tributaries of Lake Tillery, Blewett Falls Lake, and in Reaches 1 and 2 (Table 3-1 and Figures 3-1 and 3-2). Some of these tributaries were located outside of the Project boundary but potentially within the zone of influence of Project operations (i.e., flow or lake level fluctuations), and therefore, was included in the study plan design. In Reach 1, mussel surveys were conducted in Clarks Creek, Rocky River, Little River, and Cedar Creek. Savannah Creek, proposed for sampling in the study plan (Progress Energy 2004a), was dropped from the survey after field investigations indicated the creek was impacted by sedimentation from logging and agricultural practices in the surrounding watershed. Savannah Creek had extensive sedimentation, very low flow, and low dissolved oxygen concentrations (1.2 mg/L). Cedar Creek was substituted for Savannah Creek. This creek was not impacted by sedimentation. Brown Creek was not sampled due to an ongoing intensive mussel survey of creek which is being jointly funded by the U.S. Fish and Wildlife Service (USFWS), N.C. Wildlife Resources Commission (NCWRC), and Progress Energy. Results of the Brown Creek survey will be available from the USFWS during late 2005 or 2006 (personal communication with Ms. Laura Fogo, Pee Dee Nation Wildlife Refuge). Mussel surveys were conducted in Cartledge Creek, Island Creek, Hitchcock Creek, Jones Creek, and Westfield Creek within Reach 2. In addition, mussel surveys were conducted in identified major tributaries of Lake Tillery (Uwharrie River, Mountain Creek, and Jacobs Creek) and Blewett Falls Lake (Mountain Creek and Buffalo Creek). Cedar Creek, a tributary of Lake Tillery, was omitted from the mussel survey due to anthropogenic effects (i.e., stream channelization, construction debris, low flow, and storm water discharges).

Section 3 Site Description
3-2
Table 3-1 Description of transect locations used in the shallow water fish, crayfish, and mussel study of the Pee Dee River during 2004.
Tillery Development Transect Location Description (approximate river miles below power plant) TZ1 Shoal below N.C. Highway 731 Bridge (0.5 mile) TZ2 Shoal/prehistoric fish weir just above Rocky River confluence (5.0 miles) TZ3 Buzzard Island shoal and side channel complex (8.1 miles) TZ4 Shoal with boulder outcrop just below N.C. Highway 109 Bridge (12.2 miles) TZ5 Shoal just above Blewett Falls Lake (17.0 miles) TZ TRB1 Clarks Creek (1.7 miles above Pee Dee River confluence) TZ TRB2 Rocky River (9.8 miles above Pee Dee River confluence) TZ TRB3 Brown Creek (Study being conducted by U.S. Fish & Wildlife Service.) TZ TRB4 Little River (1.0 mile above Pee Dee River confluence) TZ TRB5 Cedar Creek (5.7 miles above Pee Dee River confluence) TYLAKE1 Uwharrie River (2.7 miles above Lake Tillery confluence) TYLAKE2 Mountain Creek (1.0 mile above Lake Tillery confluence) TYLAKE3 Jacobs Creek (0.25 mile above Lake Tillery confluence)
Blewett Falls Development Transect Location Description (approximate river miles below power plant) BZ1 Big Island shoal and side channel complex (N.C. waters - 1.0 mile) BZ1A Shoal just above U.S. Highway 74 Bridge (N.C. waters - 3.0 miles) BZ2 Hitchcock Creek shoal and island complex just below U.S. Highway 74 Bridge (N.C. waters - 4.1
miles) BZ3 Jones Creek shoal and island complex (N.C. waters - 11.7 miles) BZ4 Great Island shoal and side channel complex (S.C. waters - 20.2 miles) BZ5 Shoal just above U.S. Highway 1 Bridge at Cheraw, SC (S.C. waters - 23.0 miles) BZ6 Thompson Creek gravel bar shoal and island complex (S.C. waters - 26.2 miles) BZ7 Gravel and sand bar complex below Tom Blue landing (S.C. waters - 55.0 miles) BZ8 Gravel and cobble shoal just above S.C. Highway 34 Bridge at Cashua Ferry landing (S.C. waters -
72.0 miles) BZ TRB1 Cartledge Creek (4.4 miles above Pee Dee River confluence) BZ TRB2 Island Creek (2.9 miles above Pee Dee River confluence) BZ TRB3 Hitchcock Creek (18.0 miles above Pee Dee River confluence) BZ TRB4 Jones Creek (2.3 miles above Pee Dee River confluence) BZ TRB5 Westfield Creek (0.8 mile above Pee Dee River confluence) BFLAKE1 Mountain Creek (5.7 miles above Blewett Falls Lake confluence) BFLAKE2 Buffalo Creek (0.9 mile above Blewett Falls Lake confluence)

Section 3 Site Description
3-3
Figure 3-1 Map of Lake Tillery and the Pee Dee River below the Tillery Development
showing sampling locations in Reach 1 for the shallow water fish, crayfish and mussel study during 2004.
Section 3 Site Description
3-4
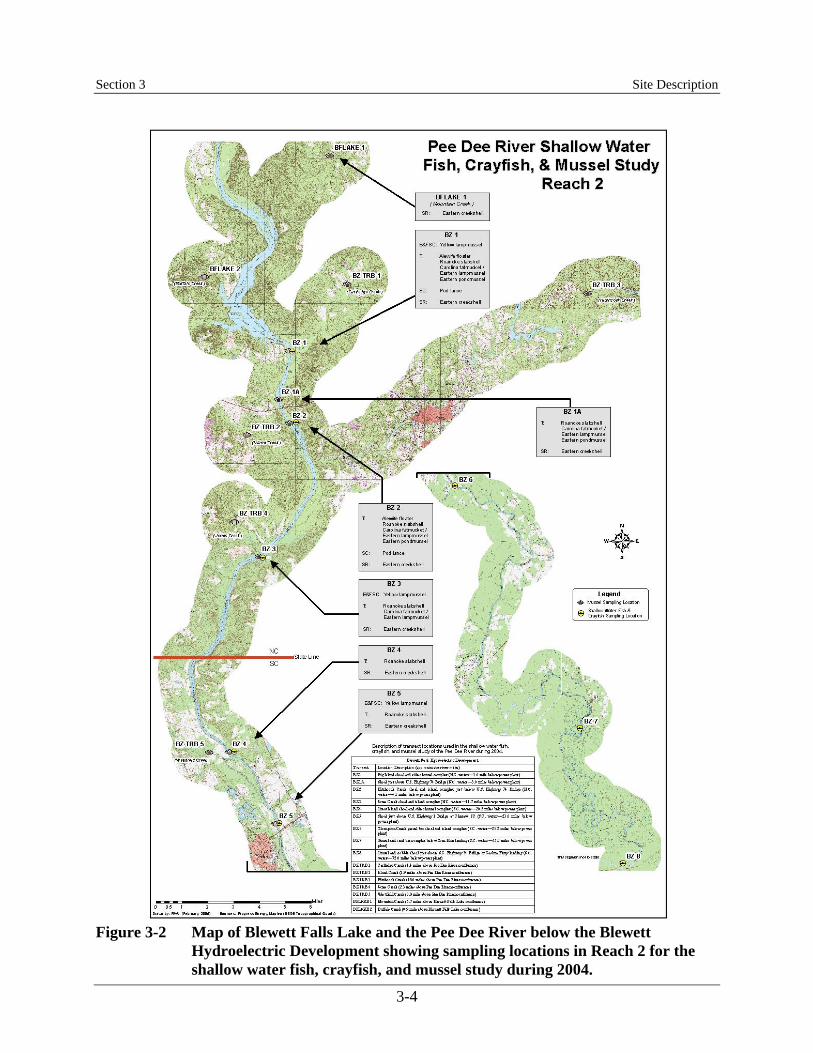
Figure 3-2 Map of Blewett Falls Lake and the Pee Dee River below the Blewett
Hydroelectric Development showing sampling locations in Reach 2 for the shallow water fish, crayfish, and mussel study during 2004.
Section 3 Site Description
3-5
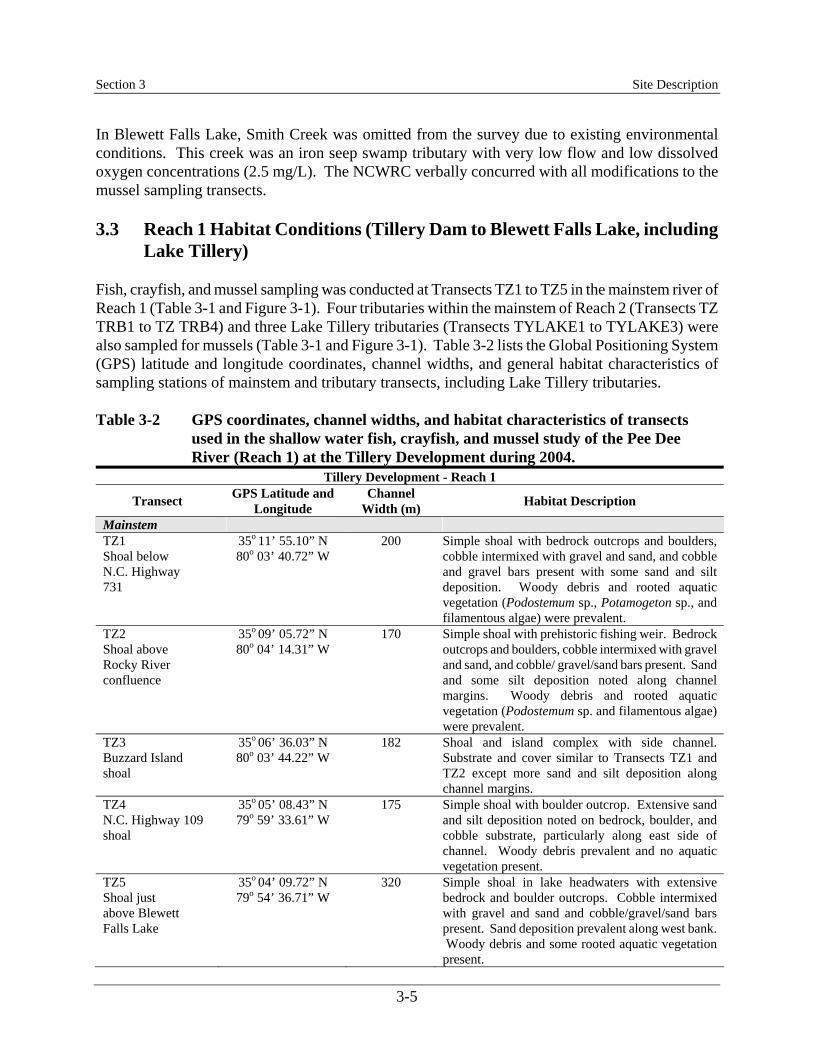
In Blewett Falls Lake, Smith Creek was omitted from the survey due to existing environmental conditions. This creek was an iron seep swamp tributary with very low flow and low dissolved oxygen concentrations (2.5 mg/L). The NCWRC verbally concurred with all modifications to the mussel sampling transects. 3.3 Reach 1 Habitat Conditions (Tillery Dam to Blewett Falls Lake, including
Lake Tillery) Fish, crayfish, and mussel sampling was conducted at Transects TZ1 to TZ5 in the mainstem river of Reach 1 (Table 3-1 and Figure 3-1). Four tributaries within the mainstem of Reach 2 (Transects TZ TRB1 to TZ TRB4) and three Lake Tillery tributaries (Transects TYLAKE1 to TYLAKE3) were also sampled for mussels (Table 3-1 and Figure 3-1). Table 3-2 lists the Global Positioning System (GPS) latitude and longitude coordinates, channel widths, and general habitat characteristics of sampling stations of mainstem and tributary transects, including Lake Tillery tributaries. Table 3-2 GPS coordinates, channel widths, and habitat characteristics of transects
used in the shallow water fish, crayfish, and mussel study of the Pee Dee River (Reach 1) at the Tillery Development during 2004.
Tillery Development - Reach 1
Transect GPS Latitude and Longitude
Channel Width (m) Habitat Description
Mainstem TZ1 Shoal below N.C. Highway 731
35o 11’ 55.10” N 80o 03’ 40.72” W
200 Simple shoal with bedrock outcrops and boulders, cobble intermixed with gravel and sand, and cobble and gravel bars present with some sand and silt deposition. Woody debris and rooted aquatic vegetation (Podostemum sp., Potamogeton sp., and filamentous algae) were prevalent.
TZ2 Shoal above Rocky River confluence
35o 09’ 05.72” N 80o 04’ 14.31” W
170 Simple shoal with prehistoric fishing weir. Bedrock outcrops and boulders, cobble intermixed with gravel and sand, and cobble/ gravel/sand bars present. Sand and some silt deposition noted along channel margins. Woody debris and rooted aquatic vegetation (Podostemum sp. and filamentous algae) were prevalent.
TZ3 Buzzard Island shoal
35o 06’ 36.03” N 80o 03’ 44.22” W
182 Shoal and island complex with side channel. Substrate and cover similar to Transects TZ1 and TZ2 except more sand and silt deposition along channel margins.
TZ4 N.C. Highway 109 shoal
35o 05’ 08.43” N 79o 59’ 33.61” W
175 Simple shoal with boulder outcrop. Extensive sand and silt deposition noted on bedrock, boulder, and cobble substrate, particularly along east side of channel. Woody debris prevalent and no aquatic vegetation present.
TZ5 Shoal just above Blewett Falls Lake
35o 04’ 09.72” N 79o 54’ 36.71” W
320 Simple shoal in lake headwaters with extensive bedrock and boulder outcrops. Cobble intermixed with gravel and sand and cobble/gravel/sand bars present. Sand deposition prevalent along west bank. Woody debris and some rooted aquatic vegetation present.

Section 3 Site Description
3-6
Tillery Development - Reach 1
Transect GPS Latitude and Longitude
Channel Width (m) Habitat Description
Tributaries TZ TRB1 Clarks Creek
35o 12’ 42.04” N 80o 02’ 28.90” W
6 Slate bedrock with cobble and gravel riffles and pools throughout transect. Transect completely enclosed with riparian tree canopy.
TZ TRB2 Rocky River
35o 09’ 40.09” N 80o 10’ 03.42” W
55 Large sand/gravel/cobble bar in the mid river at upper end of transect. West shoreline mostly sand and gravel. The middle transect area was comprised mostly of bedrock, cobble, and some sand. East shoreline with bedrock, boulders with Podostemum sp., and cobble.
TZ TRB3 Brown Creek
N/A N/A Ongoing sampling by U.S. Fish & Wildlife Service.
TZ TRB4 Little River
35o 06’ 18.43” N 79o 54’ 03.30” W
35 Boulders embedded in silt to coarse sand throughout mid transect. Lots of woody debris and clay silt on west bank of the transect. Less woody debris but more boulder, cobble and silt on the east bank of transect.
TZ TRB5 Cedar Creek
35o 01’ 47.86” N 80o 00’ 30.19” W
5 Isolated pools separated by coarse sand and gravel bars with little to no visible flow. Woody debris and clay banks bordering some pools.
TYLAKE1 Uwharrie River
35o 24’ 00.51” N 80o 01’ 57.11” W
20 Pool below small shoal. West bank mostly bedrock, boulder and large cobble extending to mid river. Some water willow and root mats present. East bank comprised of cobble, gravel, and a large amount of sand.
TYLAKE2 Mountain Creek
35o 20’ 53.46” N 80o 05’ 56.05” W
7 Small pool, riffles, and runs with large boulders, cobble, and gravel in the upper and middle portions of the transect. Large pool below a small fall at the lower end of transect. Substrate consisted of large boulders embedded in silt and sand in the middle portion of the transect. Some gravel mid channel to east bank. Large accumulations of leaves and silt on west bank.
TYLAKE3 Jacobs Creek
35o 17’ 32.04” N 80o 07’ 09.74” W
5 Large slow flowing pool with undercut clay banks on both sides at the upper end of transect. Slate bedrock with cobble and gravel riffles and pools through the lower end of transect.
3.4 Reach 2 Habitat Conditions (Blewett Falls Lake to S.C. Highway 34) Nine mainstem transects were sampled for fish, crayfish, and/or mussels (Table 3-1 and Figure 3-2). Transects BZ1 to BZ8, excluding Transect BZ1A, were sampled for fish and crayfish. Transects BZ1 to BZ5, including Transect BZ1A, were sampled for mussels. Five tributaries within the mainstem of Reach 2 (Transects BZ TRB1 to BZ TRB5) and two Blewett Falls Lake tributaries (Transects BFLAKE1 and BFLAKE2) were also sampled for mussels (Table 3-1 and Figure 3-2).

Section 3 Site Description
3-7
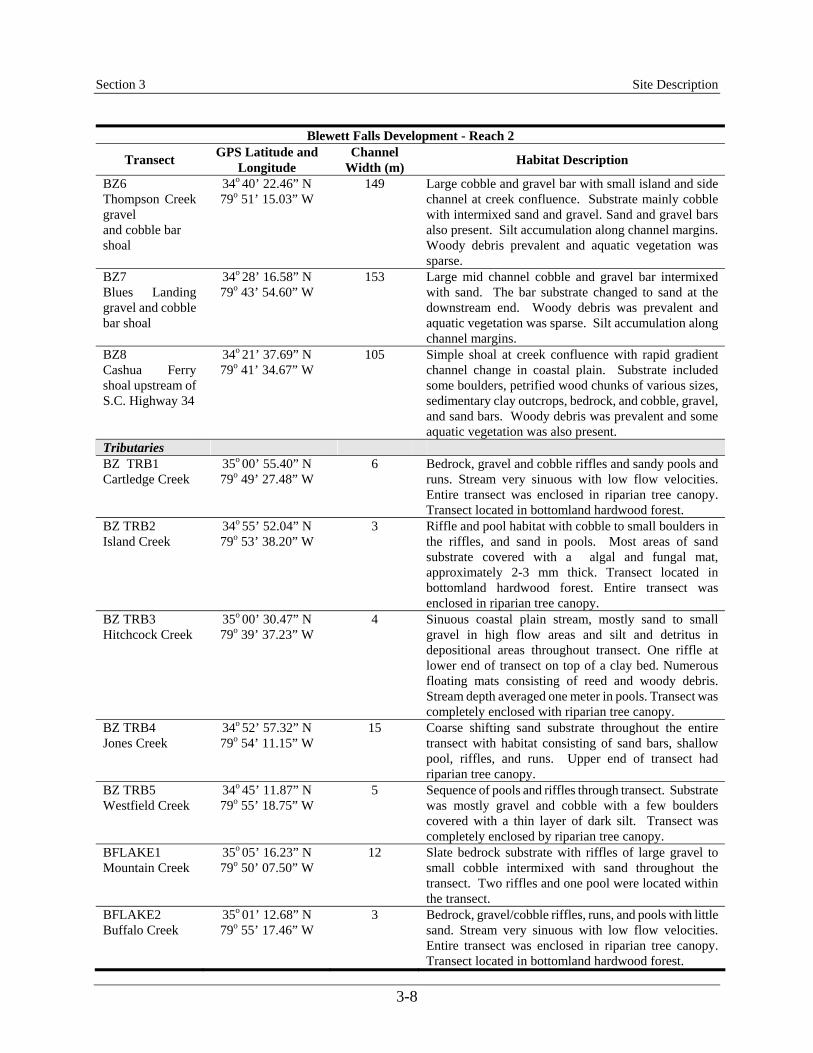
Table 3-3 lists the GPS latitude and longitude coordinates, the channel width, and general habitat characteristics of sampled mainstream and tributary transects of Reach 2, including Blewett Falls Lake tributaries. Habitat at the mainstem river Transects BZ1, BZ2, BZ3, and BZ5 were simple shoal or shoal and island side channel complexes with larger, coarser substrates present such as bedrock outcrops and boulders. Finer substrates, such as cobble, gravel, and sand, were more prevalent at the habitat sampled at the mainstem river Transects BZ4, BZ6, BZ7, and BZ8. Table 3-3 GPS coordinates, channel widths, and habitat characteristics of transects
used in the shallow water fish, crayfish, and mussel study of the Pee Dee River (Reach 2) at the Blewett Falls Development during 2004.
Blewett Falls Development - Reach 2
Transect GPS Latitude and Longitude
Channel Width (m) Habitat Description
Mainstem BZ1 Big Island Shoal (below Blewett Falls Hydroelectric Plant)
34o 58’ 43.90” N 79o 51’ 53.04” W
249 Shoal and island complex with side channel. Substrate dominated by bedrock outcrops and boulders of various sizes, cobble intermixed with gravel and sand, and cobble/gravel/sand bars. Some silt deposition also noted along channel margins. Woody debris prevalent and some rooted aquatic vegetation was present.
BZ1A U.S. Highway 74 shoal (upstream of bridge)
34o 57’ 05.10” N 79o 52’ 21.04” W
292 Simple shoal with prehistoric fishing weirs. Bedrock outcrops and boulders, cobble intermixed with gravel and sand and some cobble/gravel/sand bars present. Some silt deposition also noted along channel margin. Woody debris prevalent and some rooted aquatic vegetation was present.
BZ2 Hitchcock Creek shoal
34o 56’ 16.29” N 79o 51’ 54.51” W
207 Shoal and island complex with side channels. Substrate and cover similar to Transects BZ 1 and BZ1A except boulders and bedrock were more prevalent. Cobble intermixed with gravel and sand and gravel/cobble bars present, particularly along channel margins. Some silt deposition along channel margins. Main channel included distinct slot channels created by erosion of underlying bedrock. Woody debris and rooted aquatic vegetation present.
BZ3 Jones Creek shoal
34o 51’ 46.13” N 79o 53’ 11.19” W
307 Shoal and island complex with side channels. Substrate consisted of bedrock, boulder, cobble, and gravel. Cobble/gravel and sand bars located along channel margins and side channels. Rooted aquatic vegetation was prevalent and filamentous algal growth was extensive. Woody debris present.
BZ4 Great Island shoal
34o 45’ 12.73” N 79o 54’ 31.45” W
206 Shoal and island complex with side channels. Substrate dominated by cobble, gravel, and sand bars interspersed with boulders. Woody debris and aquatic vegetation were prevalent.
BZ5 Shoal above U.S. Highway 1
34o 42’ 45.14” N 79o 52’ 36.82” W
110 Simple shoal with bedrock outcrops, boulders, cobble intermixed with gravel and sand, and cobble/gravel/sand bars. Woody debris and rooted aquatic vegetation were prevalent.
Section 3 Site Description
3-8
Blewett Falls Development - Reach 2
Transect GPS Latitude and Longitude
Channel Width (m) Habitat Description
BZ6 Thompson Creek gravel and cobble bar shoal
34o 40’ 22.46” N 79o 51’ 15.03” W
149 Large cobble and gravel bar with small island and side channel at creek confluence. Substrate mainly cobble with intermixed sand and gravel. Sand and gravel bars also present. Silt accumulation along channel margins. Woody debris prevalent and aquatic vegetation was sparse.
BZ7 Blues Landing gravel and cobble bar shoal
34o 28’ 16.58” N 79o 43’ 54.60” W
153 Large mid channel cobble and gravel bar intermixed with sand. The bar substrate changed to sand at the downstream end. Woody debris was prevalent and aquatic vegetation was sparse. Silt accumulation along channel margins.
BZ8 Cashua Ferry shoal upstream of S.C. Highway 34
34o 21’ 37.69” N 79o 41’ 34.67” W
105 Simple shoal at creek confluence with rapid gradient channel change in coastal plain. Substrate included some boulders, petrified wood chunks of various sizes, sedimentary clay outcrops, bedrock, and cobble, gravel, and sand bars. Woody debris was prevalent and some aquatic vegetation was also present.
Tributaries BZ TRB1 Cartledge Creek
35o 00’ 55.40” N 79o 49’ 27.48” W
6 Bedrock, gravel and cobble riffles and sandy pools and runs. Stream very sinuous with low flow velocities. Entire transect was enclosed in riparian tree canopy. Transect located in bottomland hardwood forest.
BZ TRB2 Island Creek
34o 55’ 52.04” N 79o 53’ 38.20” W
3 Riffle and pool habitat with cobble to small boulders in the riffles, and sand in pools. Most areas of sand substrate covered with a algal and fungal mat, approximately 2-3 mm thick. Transect located in bottomland hardwood forest. Entire transect was enclosed in riparian tree canopy.
BZ TRB3 Hitchcock Creek
35o 00’ 30.47” N 79o 39’ 37.23” W
4 Sinuous coastal plain stream, mostly sand to small gravel in high flow areas and silt and detritus in depositional areas throughout transect. One riffle at lower end of transect on top of a clay bed. Numerous floating mats consisting of reed and woody debris. Stream depth averaged one meter in pools. Transect was completely enclosed with riparian tree canopy.
BZ TRB4 Jones Creek
34o 52’ 57.32” N 79o 54’ 11.15” W
15 Coarse shifting sand substrate throughout the entire transect with habitat consisting of sand bars, shallow pool, riffles, and runs. Upper end of transect had riparian tree canopy.
BZ TRB5 Westfield Creek
34o 45’ 11.87” N 79o 55’ 18.75” W
5 Sequence of pools and riffles through transect. Substrate was mostly gravel and cobble with a few boulders covered with a thin layer of dark silt. Transect was completely enclosed by riparian tree canopy.
BFLAKE1 Mountain Creek
35o 05’ 16.23” N 79o 50’ 07.50” W
12 Slate bedrock substrate with riffles of large gravel to small cobble intermixed with sand throughout the transect. Two riffles and one pool were located within the transect.
BFLAKE2 Buffalo Creek
35o 01’ 12.68” N 79o 55’ 17.46” W
3 Bedrock, gravel/cobble riffles, runs, and pools with little sand. Stream very sinuous with low flow velocities. Entire transect was enclosed in riparian tree canopy. Transect located in bottomland hardwood forest.
Section 3 Site Description
3-9
3.5 Water Quality Conditions Water temperatures ranged from 17.0º to 26.2ºC, and dissolved oxygen (DO) concentrations ranged from 6.7 to 13.7 mg/L during the fish and crayfish surveys of the Pee Dee River below the Tillery Development (Reach 1). Conductivity ranged from 93 to 121 µS/cm in Reach 1. Water temperatures and conductivity were greater below the Rocky River confluence while a slight DO sag was observed downstream of these tributaries. For Reach 2 below the Blewett Falls Development, water temperatures ranged from 22.9º to 26.9ºC, and DO concentrations ranged from 6.5 to 10.3 mg/L during the fish and crayfish surveys. Conductivity ranged from 92 to 142 µS/cm in Reach 2. Water quality data collected during the mussel surveys are presented in Appendix A. During mussel surveys of the Reaches 1 and 2, temperatures ranged from 21.2º to 29.2ºC; DO concentrations ranged from 4.8 to 9.6 mg/L; conductivity ranged from 89 to 124 µS/cm; pH ranged from 7.0 to 9.2 units; and turbidity ranged from 2.0 to 16 NTU. For the tributary sites, water temperatures ranged from 17.7º to 27.7ºC; DO concentrations ranged from 1.5 to 13.9 mg/L; conductivity ranged from 24 to 181 µS/cm; pH ranged from 6.1 to 7.9 units; and turbidity ranged from 1.2 to 22 NTU. The DO concentration measured at Cedar Creek (Reach 1 tributary) was below the North Carolina instantaneous water quality standard of 4 mg/L.

4-1
Section 4 - Methods 4.1 Fish and Crayfish Surveys Sampling was conducted under low flow conditions (i.e., no power plant generation or wadeable flow conditions) from April 25 through May 23, 2004, in Reach 1 and from May 14 through June 14, 2004, in Reach 2. A reach length of 366 m (1,200 ft) was established at each transect to ensure that all representative habitat types were sampled. There were some instances where 1,200 ft of wadeable stream was not present for the pram sampling. Only 450 ft was sampled at Transect TZ5 in Reach 1 below the Tillery Development due to non-wadeable conditions (i.e., depth greater than 1.2-m). One station was also truncated at Transect TZ4 (west shoreline) due to non-wadeable conditions (900 ft sampled) for a portion of the transect. A standardized approach was used to sample the fish and crayfish community at each transect. Sampling gear types used included a Smith-Root 5.0 GPP pram electrofisher, a Smith-Root Model 15 backpack electrofisher, and a 20-ft flat seine (6.1 m x 1.8 m with 0.32 cm mesh). The pram electrofisher was used to sample the channel by making three passes through the transect (i.e., each river bank and mid channel, if wadeable). The side margins of the channel, including any backwater areas, were sampled with the backpack electrofisher for 15-minute intervals. Twelve seine hauls (i.e., one haul per 100 ft of transect length) were made at sand, gravel, or cobble bars or riffles at each transect with all collected samples combined into one common sample. For electrofishing sampling, pulsed DC current was utilized for sampling with voltage adjusted to produce 3 to 4 amps in the sampling field, depending upon the water conductivity. Backpack electrofishing was conducted for 15-minute intervals along each channel margin and any associated backwater areas. Electrofishing was conducted in either an upstream or downstream fashion at each transect. Riffle areas were sampled intensively with the pram electrofisher by disturbing the substrate and holding dip nets on the downstream end of the riffle while the electrofishing was performed. Crayfish were qualitatively sampled during the backpack and pram electrofishing sampling for fish. Electrofishing for crayfish was substituted for kick net and dip net sampling techniques because electrofishing was the most effective technique to collect crayfish, particularly in backwater areas with woody debris. The total time was recorded for backpack and pram electrofishing, and the catches were adjusted to number and weight of fish per hour. At each sampling location, water temperature, dissolved oxygen, and conductivity were measured with a laboratory- and field-calibrated YSI® multi-parameter instrument (Model 650). Sample locations were recorded with a GPS unit with sub-meter accuracy. Digital photographs were also taken of each sampling site. All fish and crayfish, regardless of sampling methodology, were identified to the lowest practicable taxa level. Fish were measured for total length to the nearest millimeter and weighed to the nearest gram. Fish that could not be accurately identified in the field or large numbers of small individuals were be preserved with 10 percent buffered formalin solution and transported to the laboratory for identification and body measurements. All other collected fish were released alive at the sampling site. Crayfish were preserved in 70 percent ethanol and transported to the laboratory for identification. Crayfish were identified to the lowest practical taxa level. Identification of crayfish taxa to species level for most genera requires a breeding (Form I) male. Females could only be identified to genus level. Dr. John Cooper of the North Carolina Museum of Natural Science
Section 4 Methods
4-2
(NCMNS) provided assistance with crayfish identification for Form 11 Procambarus spp mailes. Fish and crayfish specimens were retained for voucher purposes in Progress Energy’s fish and invertebrate reference collections and in the North Carolina Museum of Natural Sciences’ collection. All electrofishing and seine samples were combined at each transect to yield the total number of fish and crayfish collected per transect within each sample reach. In addition, the summary catch-per-unit effort data were calculated for both electrofishers and seine hauls and are presented in Appendix A (Tables A-1 to A-6). Dominant species within the fish community were defined as those species or taxa comprising ≥5 percent of the total fish abundance at each transect. The fish data were assigned tolerance and trophic feeding guild classifications based on designations used by the North Carolina Division of Water Quality (NCDWQ) for its North Carolina Index of Biotic Integrity (NCIBI) methodology (NCDWQ 2001). The NCIBI is a modification of the Index of Biotic Integrity originally formulated by Karr (1981) to measure the health and structure of stream fish communities. The NCIBI fish community metrics or attributes were also applied to the data to gain insight into the fish community structure at each transect within each sampled reach. Two other attributes — the number of minnow and North American catfish species — were included in this assessment. The percentage of green sunfish replaced number of fish with disease, fin erosion, lesions, or tumors in this assessment; because, no fish were observed with disease, fin erosion, lesions, or tumors during the study. The number of minnow species was also added to evaluate the presence of this family (Cyprinidae) at the sampled transects. Young-of-year fish were excluded from the trophic feeding guild attribute and green sunfish percentage calculations. The young-of-year cut-off lengths used in the NCIBI methodology were applied to these data (Appendix A). Summary tables excluding the number of young-of-year for Reaches 1 and 2 are presented in Appendix A (Tables A-7 and A-8). Young-of-year were included in calculations of all other attributes (i.e., number of taxa or species richness, total number of individuals, number of darter, minnow, North American catfish, sucker, and sunfish species, number of intolerant species, and multiple size classes). The significance of each fish community metric or attribute is given below as defined in the NCIBI (NCDWQ 2001): 1. Number of taxa or species richness: The total number of species supported by a stream of a
given size within a given region generally decreases with environmental degradation. In addition, some streams with larger watersheds or drainage areas can be expected to support more species than stream with smaller watersheds. In other instances, the number of species and watershed size are not correlated.
2. Number of individuals: The total number of fish supported by a stream of a given size in a given region decreases with environmental degradation. However, in some instances, nutrient enrichment or degradation may actually increase the number of fish supported by a stream.
3. Number of darter species (Etheostoma and Percina species): Darters are sensitive to environmental degradation particularly as a result of their specific reproductive and habitat requirements. Darter habitats (e.g., riffle habitat) are degraded as a result of channelization, siltation, reduced oxygen levels, and fluctuating water levels. The collection of fewer than expected number of species of darters can indicate some degree of habitat degradation.
4. Number of minnow species: Many species of minnows are intolerant of habitat and chemical degradation and, because some of the species have life spans of up to six years, provide a
Section 4 Methods
4-3
multi-year integrated perspective. Because of their predominantly specialized insectivorous feeding habits, they also reflect the condition of the benthic community which may be harmed by sedimentation, sediment contamination, or varying water levels. Minnow species also typically inhabit shallow water habitats such as stream channel margins which can be affected by fluctuating water levels in regulated streams (Bain and Travnichek 1996).
5. Number of North American catfish species: The number of North American catfish species can provide insight into general environmental conditions present in a stream. Many North American catfishes are omnivorous feeding generalists tolerant of a wide range of environmental conditions. Conversely, madtom species inhabit shallow water areas and are insectivorous in feeding habits and generally reflect favorable stream environmental conditions. This attribute is not used in the NCIBI but used in this assessment to characterize the entire fish community present in the Pee Dee River.
6. Number of sucker species (includes all species within Catostomidae Family): Many suckers (especially Moxostoma or Scartomyzon species) are intolerant of habitat and chemical degradation, and because they are long-lived, provide a multiyear integrated perspective. They also reflect the condition of the benthic community which may be affected by sedimentation, sediment contamination, or flow fluctuations.
7. Number of sunfish species (includes Lepomis, Enneacanthus, Micropterus, and Pomoxis species): Sunfish species are particularly responsive to habitat degradation such as the filling in of pools with sediment and loss of stream cover (e.g., woody debris). Conversely, most sunfish species (e.g., bluegill, redbreast sunfish, and largemouth bass) are habitat and feeding generalists and show less sensitivity to flow fluctuations that other species who are more specialized in feeding or inhabit channel margin habitat (Bain and Travnichek 1996).
8. Number of intolerant species: Intolerant species are those specialized habitat and feeding species most affected by environmental perturbations, and therefore should disappear, at least as viable populations by the time a stream is rated as “Fair.” Intolerant species includes some species with a very restricted zoogeographic distribution or considered rare, threatened, or endangered (RTE). Of the 212 species of freshwater fish in North Carolina waters, only 52 species are considered intolerant. Three intolerant species — fieryblack shiner, thinlip chub, and Piedmont darter — were collected from the Pee Dee River during this study.
9. Percent tolerant individuals: Tolerant species are those which are often present in a stream in low or moderate numbers but as the stream degrades, they can become dominant (generally greater than 25 to 35 percent of the fish community). Of the approximately 211 species of freshwater fish found in North Carolina, 22 species are tolerant. The metric is calculated by the total number of individuals of tolerant species divided by the total number of collected fish (excluding young-of-year).
10. Percent omnivores and herbivores: Omnivorous feeding species generally indicate degraded environmental conditions, particularly the benthic invertebrate community. Additionally, large numbers of herbivores can indicate canopy or riparian removal or modifications and/or nutrient enrichment with subsequent increased growth of attached algae and periphyton.
11. Percent piscivores: Piscivorous feeding species represent the top of the food chain within the aquatic community and their presence usually indicates a healthy, functioning food chain. However, a very large percentage of piscivorous species or the complete absence of predators may indicate environmental perturbations or some other influencing factor.

Section 4 Methods
4-4
12. Percent insectivores: Insectivorous feeding species, particularly those that specialize on the benthic invertebrate community (i.e., many minnow, sucker, and darter taxa) generally reflect a healthy river ecosystem. The presence of a large percentage of generalist insectivorous feeding species, particularly those that can feed on a variety of aquatic and terrestrial invertebrates, (e.g., redbreast sunfish and bluegill) can indicate degraded environmental conditions and nutrient enrichment.
13. Percent green sunfish: The percentage of green sunfish, a tolerant species, typically increases with degraded environmental conditions (generally >5 percent of total fish collected would be considered unbalanced) (Karr et al. 1986). This attribute is not included in the NCIBI but used in this assessment to aid in characterization of the fish community and environmental conditions.
14. Percentage of species with multiple age groups: This metric or attribute provides an indication of reproductive success and survivability of year classes through time. It also provides an indirect indicator of suitable habitat for reproduction and rearing of young. At least three individuals per species must have been collected to determine the presence of multiple age groups within the population. In some instances, professional judgment may also be used to determine reproductive success of a particular species.
The health of the fish community at each transect was not quantitatively scored with the NCIBI (i.e., numeric score with corresponding community health rating). The scoring methodology has not been applied to large river systems, such as the Pee Dee River, with the specific array of sampling gear types used in this study (personal communication with Mr. Bryn Tracy, NCDWQ). Furthermore, the fish community characteristics changed as the river transitioned from the Piedmont physiographic region in North Carolina into the Coastal Plain physiographic region of South Carolina. These changes would influence IBI metrics and scoring expectations. 4.2 Mussel Survey Sampling was conducted from June 12, 2004 through October 11, 2004. All mainstem and most tributary transects were sampled from June through August. The Rocky River and Uwharrie River were sampled in October due to a series of hurricanes and subsequent flooding that occurred in September. A 328-ft (100 m) longitudinal transect on each river bank was established at each transect that adequately represented suitable mussel habitats. Habitats within the established transect area (from river bank to river bank) were searched longitudinally for mussels. Both river bank shorelines were surveyed for the mainstem Pee Dee River. Additionally, mid-channel surveys were conducted at Transects TZ1 and BZ5 located below the Tillery and Blewett Falls Hydroelectric Developments, respectively. The entire channel from bank to bank was sampled for the 100-m transects established at the tributary sites. Timed visual surveys, aided with snorkeling and glass-bottomed buckets in shallow water areas, were conducted to search for mussels. Tactile surveys of the substrate were also conducted to detect the presence of mussels. No surveys were conducted when underwater visibility was significantly reduced by turbidity or low light conditions. A steel quadrant frame, measuring 0.092 m2 (1 ft2) was used once at each transect to search for juvenile mussels. The quadrant frame was placed in substrate (sand and/or gravel) suitable for juvenile mussel inhabitation and the delineated area searched thoroughly. Finally, the riverbank and the sampled area were visually surveyed for relic

Section 4 Methods
4-5
mussel shells to detect the potential presence of mussel taxa for which no live specimens were collected. The number of biologists involved in the mussel surveys varied during the study. Three to nine biologists were involved in sampling mainstem transects, depending upon location. Tributary transects were surveyed with two to seven biologists. Collected mussels were kept alive in pursed, small-meshed bags suspended in the water column or water-filled buckets until identified and processed for measurements. All mussels were identified to the lowest practicable taxa level and photographed with a digital camera. Meristic measurements were obtained for total shell length, width, and height (nearest mm) for the first 100 individuals for each taxon at each transect. In the event that very large numbers of a particular taxon (e.g., Elliptio roanokensis) were encountered during sampling, 100 individuals were randomly selected for meristics measurements. All other mussels of that taxon were left in place and counted in situ at the transect. After processing, mussels were returned alive to the sampled habitat area. Some mussel specimens were retained by NCWRC biologists for voucher specimens and genetic analysis. Those specimens were preserved in 100 percent ethanol. Dr. Art Bogan, NCMNS, and Dr. Ryan Heise, NCWRC, assisted with mussel identification. Substrate at each sampling transect was qualitatively classified using the modified Wentworth scale (McMahon et al. 1996). Each transect was mapped with a GPS instrument with sub-meter accuracy. Water temperature, dissolved oxygen, conductivity, pH, and turbidity were measured at each transect with a laboratory- and field-calibrated YSI® multi-parameter instrument (Model 650) or similar equipment. 4.3 Quality Control and Assurance All survey data were collected in accordance with Progress Energy’s Quality Assurance/Quality Control (QA/QC) Program (Progress Energy 2004b, 2004c). Progress Energy is certified by the North Carolina Division of Water Quality and the South Carolina Department of Health and Environmental Control to collect water quality and biological samples through Standard Operating Procedures. Specific procedures for sample collection and data custody are detailed in Progress Energy’s QA/QC Program. Voucher specimens of identified fish and crayfish taxa were retained in Progress Energy’s voucher specimen reference collection and in the North Carolina Museum of Natural Sciences’ collection. Identified mussel taxa were documented with digital photographs.
5-1
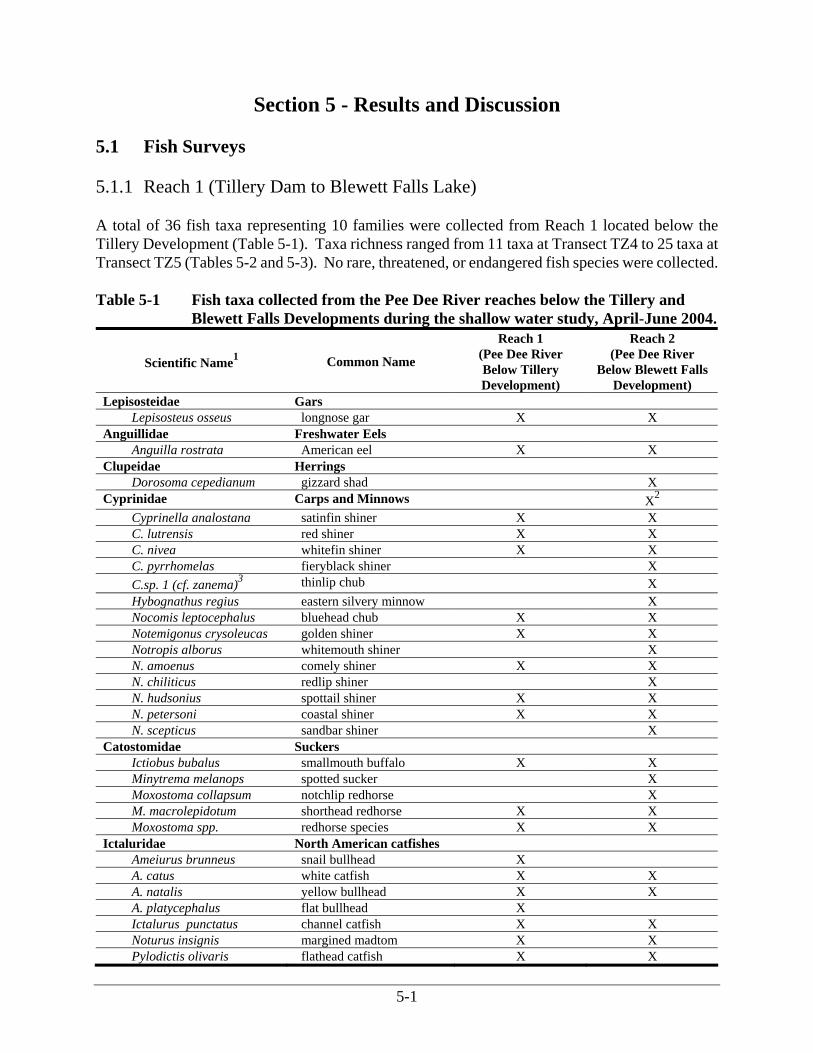
Section 5 - Results and Discussion 5.1 Fish Surveys 5.1.1 Reach 1 (Tillery Dam to Blewett Falls Lake) A total of 36 fish taxa representing 10 families were collected from Reach 1 located below the Tillery Development (Table 5-1). Taxa richness ranged from 11 taxa at Transect TZ4 to 25 taxa at Transect TZ5 (Tables 5-2 and 5-3). No rare, threatened, or endangered fish species were collected. Table 5-1 Fish taxa collected from the Pee Dee River reaches below the Tillery and
Blewett Falls Developments during the shallow water study, April-June 2004.
Scientific Name1 Common Name
Reach 1 (Pee Dee River Below Tillery Development)
Reach 2 (Pee Dee River
Below Blewett Falls Development)
Lepisosteidae Gars Lepisosteus osseus longnose gar X X
Anguillidae Freshwater Eels Anguilla rostrata American eel X X
Clupeidae Herrings Dorosoma cepedianum gizzard shad X
Cyprinidae Carps and Minnows X2
Cyprinella analostana satinfin shiner X X C. lutrensis red shiner X X C. nivea whitefin shiner X X C. pyrrhomelas fieryblack shiner X C.sp. 1 (cf. zanema)3 thinlip chub X Hybognathus regius eastern silvery minnow X Nocomis leptocephalus bluehead chub X X Notemigonus crysoleucas golden shiner X X Notropis alborus whitemouth shiner X N. amoenus comely shiner X X N. chiliticus redlip shiner X N. hudsonius spottail shiner X X N. petersoni coastal shiner X X N. scepticus sandbar shiner X
Catostomidae Suckers Ictiobus bubalus smallmouth buffalo X X Minytrema melanops spotted sucker X Moxostoma collapsum notchlip redhorse X M. macrolepidotum shorthead redhorse X X Moxostoma spp. redhorse species X X
Ictaluridae North American catfishes Ameiurus brunneus snail bullhead X A. catus white catfish X X A. natalis yellow bullhead X X A. platycephalus flat bullhead X Ictalurus punctatus channel catfish X X Noturus insignis margined madtom X X Pylodictis olivaris flathead catfish X X
Section 5 Results and Discussions
5-2
Scientific Name1 Common Name
Reach 1 (Pee Dee River Below Tillery Development)
Reach 2 (Pee Dee River
Below Blewett Falls Development)
Aphredoderidae Pirate perches Aphredoderus sayanus pirate perch X
Mugilidae Mullets Mugil cephalus striped mullet X
Atherinidae Silversides Labidesthes sicculus brook silverside X
Belonidae Needlefishes Strongylura marina Atlantic needlefish X
Poeciliidae Livebearers Gambusia holbrooki eastern mosquitofish X X
Moronidae Temperate basses Morone americana white perch X X
Centrarchidae Sunfishes Enneacanthus gloriosus bluespotted sunfish X X Lepomis auritus redbreast sunfish X X L. cyanellus green sunfish X X L. gibbosus Pumpkinseed X X L. gulosus Warmouth X X L. macrochirus Bluegill X X L. microlophus redear sunfish X X L. punctatus spotted sunfish X Micropterus salmoides largemouth bass X X Pomoxis nigromaculatus black crappie X
Percidae Perches Etheostoma flabellare fantail darter X X E. olmstedi tessellated darter X X Percina crassa Piedmont darter X X Perca flavescens yellow perch X
Soleidae Soles Trinectes maculatus Hogchoker X
Total number of taxa 36 46
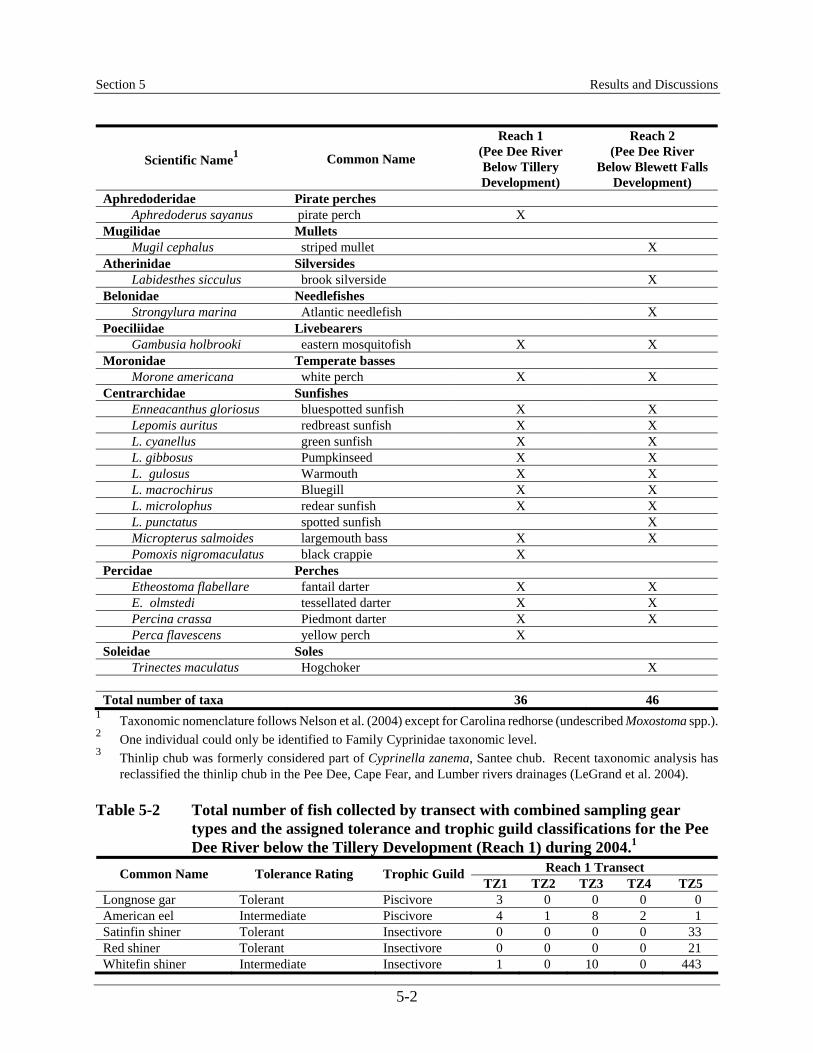
1 Taxonomic nomenclature follows Nelson et al. (2004) except for Carolina redhorse (undescribed Moxostoma spp.). 2 One individual could only be identified to Family Cyprinidae taxonomic level. 3 Thinlip chub was formerly considered part of Cyprinella zanema, Santee chub. Recent taxonomic analysis has
reclassified the thinlip chub in the Pee Dee, Cape Fear, and Lumber rivers drainages (LeGrand et al. 2004). Table 5-2 Total number of fish collected by transect with combined sampling gear
types and the assigned tolerance and trophic guild classifications for the Pee Dee River below the Tillery Development (Reach 1) during 2004.1
Reach 1 Transect Common Name Tolerance Rating Trophic Guild TZ1 TZ2 TZ3 TZ4 TZ5
Longnose gar Tolerant Piscivore 3 0 0 0 0 American eel Intermediate Piscivore 4 1 8 2 1 Satinfin shiner Tolerant Insectivore 0 0 0 0 33 Red shiner Tolerant Insectivore 0 0 0 0 21 Whitefin shiner Intermediate Insectivore 1 0 10 0 443

Section 5 Results and Discussions
5-3
Reach 1 Transect Common Name Tolerance Rating Trophic Guild TZ1 TZ2 TZ3 TZ4 TZ5
Bluehead chub Intermediate Omnivore 0 0 0 0 4 Golden shiner Tolerant Omnivore 2 0 0 0 0 Comely shiner Intermediate Insectivore 0 0 0 0 3 Spottail shiner Intermediate Omnivore 0 0 0 0 2 Coastal shiner Intermediate Insectivore 0 0 0 0 1 Smallmouth buffalo Intermediate Omnivore 2 1 0 0 5 Shorthead redhorse Intermediate Insectivore 0 0 0 0 1 Redhorse species -- Insectivore 0 0 0 0 11 Snail bullhead Intermediate Insectivore 175 3 0 0 0 White catfish Tolerant Omnivore 21 57 9 1 2 Yellow bullhead Tolerant Omnivore 0 1 2 0 0 Flat bullhead Tolerant Insectivore 8 0 0 0 0 Channel catfish Intermediate Omnivore 0 15 66 49 10 Margined madtom Intermediate Insectivore 0 30 0 0 0 Flathead catfish Intermediate Piscivore 0 0 7 7 4 Eastern mosquitofish Tolerant Insectivore 0 3 0 2 3 Pirate perch Intermediate Insectivore 0 0 0 0 1 White perch Intermediate Piscivore 0 1 0 0 0 Bluespotted sunfish Intermediate Insectivore 0 0 1 0 0 Redbreast sunfish Tolerant Insectivore 88 53 7 5 10 Green sunfish Tolerant Insectivore 0 24 40 26 12 Pumpkinseed Intermediate Insectivore 0 1 0 1 0 Warmouth Intermediate Insectivore 0 1 0 0 1 Bluegill Intermediate Insectivore 21 44 29 43 155 Redear sunfish Intermediate Insectivore 0 0 1 0 2 Largemouth bass Intermediate Piscivore 3 10 2 7 4 Black crappie Intermediate Piscivore 1 0 0 0 0 Fantail darter Intermediate Insectivore 3 7 0 0 1 Tessellated darter Intermediate Insectivore 6 64 29 7 13 Piedmont darter Intolerant Insectivore 4 41 9 0 3 Yellow perch Intermediate Piscivore 4 1 0 0 0 Total number 346 358 220 150 746
1 Tolerance and trophic guild classifications used in the North Carolina Index of Biotic Integrity by the N.C. Division of Water Quality (NCDWQ 2001).
Table 5-3 Characteristics of the shallow water fish community in the Pee Dee River
below the Tillery Development (Reach 1) during 2004. Reach 1 Transect Attribute
TZ1 TZ2 TZ3 TZ4 TZ5 1. No. of fish taxa 16 19 14 11 25 2. No. of individuals1 346
(302) 358
(284) 220
(145) 150
(100) 746
(444) 3. No. of darter species 3 3 2 1 3 4. No. of minnow species 2 0 1 0 7 5. No. of sucker species 1 1 0 0 2 6. No. of North American catfish species 3 5 4 3 3 7. No. of sunfish species 4 6 6 5 6 8. No. of intolerant species 1 1 1 0 1 9. % tolerant individuals2 34 29 32 29 16 10. % omnivores and herbivores2 2 4 8 10 3

Section 5 Results and Discussions
5-4
Reach 1 Transect Attribute TZ1 TZ2 TZ3 TZ4 TZ5
11. % piscivores2 5 2 7 11 2 12. % insectivores2 93 94 85 79 95 13. % green sunfish2 0 8 27 22 3 14. % multiple age groups 62 42 50 54 48 Water quality3 Water temperature (ºC) 17.3 17.0 26.2 24.8 18.6 Dissolved oxygen (mg/L) 13.7 12.1 9.7 6.7 9.4 Conductivity (µS/cm) 93 103 121 109 97
1 The number of individuals in parenthesis is the number of fish collected excluding young-of-year. 2 Percentage values of tolerant individuals, omnivores and herbivores, piscivores, insectivores, and green sunfish
calculated without young-of-year year (see Appendix A for adjusted number of fish without young-of-year in samples).
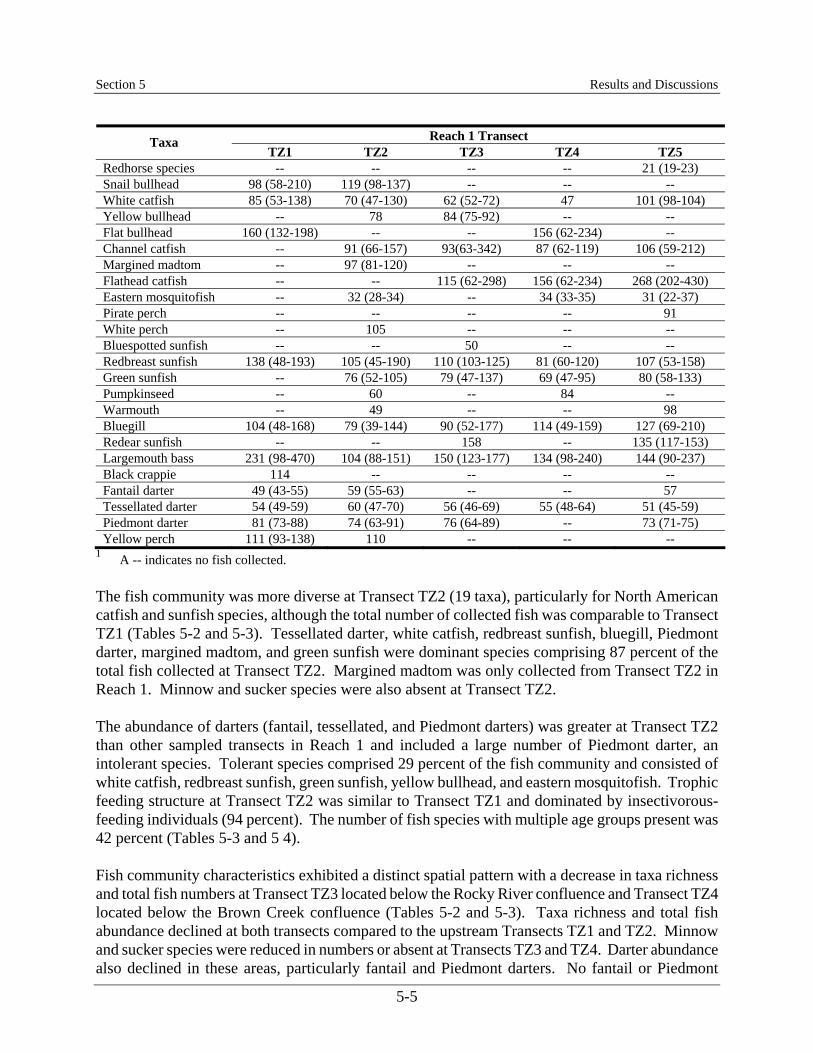
3 Water quality variable measurements made at the time of sampling at each transect. Sixteen fish taxa were collected at Transect TZ1, located just below the Tillery Development (Tables 5-2 and 5-3). Snail bullhead, redbreast sunfish, white catfish, and bluegill were the dominant species comprising 88 percent of the total catch. Tolerant species (redbreast sunfish, white catfish, flat bullhead, longnose gar, and golden shiner) comprised 34 percent of the fish community at Transect TZ1. Darter species — fantail darter, tessellated darter, and Piedmont darter — were present at Transect TZ1 in low numbers while minnow species were reduced in abundance (i.e., a few golden shiners and whitefin shiners). Suckers were also reduced in abundance. A small number of Piedmont darter, an intolerant species, was collected at Transect TZ1. North American catfishes, mainly young snail bullhead and white catfish, were prevalent at Transect TZ1 (Table 5-2). Insectivorous fish dominated the trophic feeding guilds at Transect TZ1 (93 percent) due to the large number of snail bullhead, redbreast sunfish, and bluegill. Omnivores and herbivores and piscivores comprised 2 percent and 5 percent of the trophic feeding guilds, respectively. The number of fish species with multiple age groups present was 62 percent, which was the highest of all Reach 1 transects (Tables 5-3 and 5-4). Table 5-4 Mean lengths (total length, mm) and size ranges (minimum and maximum
values) of fish collected by transect during the shallow water survey of the Pee Dee River below the Tillery Development (Reach 1) during 2004.
Reach 1 Transect Taxa TZ1 TZ2 TZ3 TZ4 TZ5
Longnose gar 900 (840-998) --1 -- -- -- American eel 283 (227-365) 555 474 (133-584) 439 123 Satinfin shiner -- -- -- -- 58 (35-84) Red shiner -- -- -- -- 59 (51-73) Whitefin shiner 89 -- 58 (36-112) -- 47 (18-106) Bluehead chub -- -- -- -- 72 (54-97) Golden shiner 76 (60-92) -- -- -- -- Comely shiner -- -- -- -- 71 (61-83) Spottail shiner -- -- -- -- 80 (77-82) Coastal shiner -- -- -- -- 57 Smallmouth buffalo 537 (526-548) 470 -- -- 507 (472-592) Notchlip redhorse -- -- -- -- -- Shorthead redhorse -- -- -- -- 445
Section 5 Results and Discussions
5-5
Reach 1 Transect Taxa TZ1 TZ2 TZ3 TZ4 TZ5
Redhorse species -- -- -- -- 21 (19-23) Snail bullhead 98 (58-210) 119 (98-137) -- -- -- White catfish 85 (53-138) 70 (47-130) 62 (52-72) 47 101 (98-104) Yellow bullhead -- 78 84 (75-92) -- -- Flat bullhead 160 (132-198) -- -- 156 (62-234) -- Channel catfish -- 91 (66-157) 93(63-342) 87 (62-119) 106 (59-212) Margined madtom -- 97 (81-120) -- -- -- Flathead catfish -- -- 115 (62-298) 156 (62-234) 268 (202-430) Eastern mosquitofish -- 32 (28-34) -- 34 (33-35) 31 (22-37) Pirate perch -- -- -- -- 91 White perch -- 105 -- -- -- Bluespotted sunfish -- -- 50 -- -- Redbreast sunfish 138 (48-193) 105 (45-190) 110 (103-125) 81 (60-120) 107 (53-158) Green sunfish -- 76 (52-105) 79 (47-137) 69 (47-95) 80 (58-133) Pumpkinseed -- 60 -- 84 -- Warmouth -- 49 -- -- 98 Bluegill 104 (48-168) 79 (39-144) 90 (52-177) 114 (49-159) 127 (69-210) Redear sunfish -- -- 158 -- 135 (117-153) Largemouth bass 231 (98-470) 104 (88-151) 150 (123-177) 134 (98-240) 144 (90-237) Black crappie 114 -- -- -- -- Fantail darter 49 (43-55) 59 (55-63) -- -- 57 Tessellated darter 54 (49-59) 60 (47-70) 56 (46-69) 55 (48-64) 51 (45-59) Piedmont darter 81 (73-88) 74 (63-91) 76 (64-89) -- 73 (71-75) Yellow perch 111 (93-138) 110 -- -- --
1 A -- indicates no fish collected. The fish community was more diverse at Transect TZ2 (19 taxa), particularly for North American catfish and sunfish species, although the total number of collected fish was comparable to Transect TZ1 (Tables 5-2 and 5-3). Tessellated darter, white catfish, redbreast sunfish, bluegill, Piedmont darter, margined madtom, and green sunfish were dominant species comprising 87 percent of the total fish collected at Transect TZ2. Margined madtom was only collected from Transect TZ2 in Reach 1. Minnow and sucker species were also absent at Transect TZ2. The abundance of darters (fantail, tessellated, and Piedmont darters) was greater at Transect TZ2 than other sampled transects in Reach 1 and included a large number of Piedmont darter, an intolerant species. Tolerant species comprised 29 percent of the fish community and consisted of white catfish, redbreast sunfish, green sunfish, yellow bullhead, and eastern mosquitofish. Trophic feeding structure at Transect TZ2 was similar to Transect TZ1 and dominated by insectivorous-feeding individuals (94 percent). The number of fish species with multiple age groups present was 42 percent (Tables 5-3 and 5 4). Fish community characteristics exhibited a distinct spatial pattern with a decrease in taxa richness and total fish numbers at Transect TZ3 located below the Rocky River confluence and Transect TZ4 located below the Brown Creek confluence (Tables 5-2 and 5-3). Taxa richness and total fish abundance declined at both transects compared to the upstream Transects TZ1 and TZ2. Minnow and sucker species were reduced in numbers or absent at Transects TZ3 and TZ4. Darter abundance also declined in these areas, particularly fantail and Piedmont darters. No fantail or Piedmont
Section 5 Results and Discussions
5-6
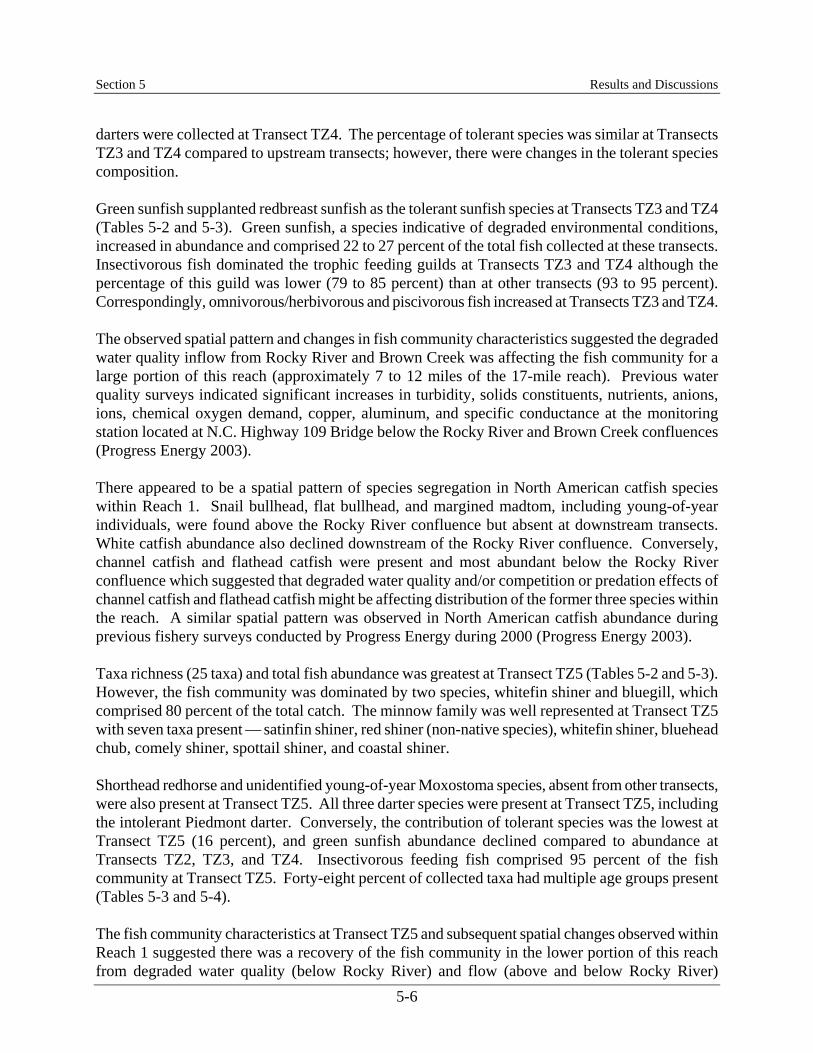
darters were collected at Transect TZ4. The percentage of tolerant species was similar at Transects TZ3 and TZ4 compared to upstream transects; however, there were changes in the tolerant species composition. Green sunfish supplanted redbreast sunfish as the tolerant sunfish species at Transects TZ3 and TZ4 (Tables 5-2 and 5-3). Green sunfish, a species indicative of degraded environmental conditions, increased in abundance and comprised 22 to 27 percent of the total fish collected at these transects. Insectivorous fish dominated the trophic feeding guilds at Transects TZ3 and TZ4 although the percentage of this guild was lower (79 to 85 percent) than at other transects (93 to 95 percent). Correspondingly, omnivorous/herbivorous and piscivorous fish increased at Transects TZ3 and TZ4. The observed spatial pattern and changes in fish community characteristics suggested the degraded water quality inflow from Rocky River and Brown Creek was affecting the fish community for a large portion of this reach (approximately 7 to 12 miles of the 17-mile reach). Previous water quality surveys indicated significant increases in turbidity, solids constituents, nutrients, anions, ions, chemical oxygen demand, copper, aluminum, and specific conductance at the monitoring station located at N.C. Highway 109 Bridge below the Rocky River and Brown Creek confluences (Progress Energy 2003). There appeared to be a spatial pattern of species segregation in North American catfish species within Reach 1. Snail bullhead, flat bullhead, and margined madtom, including young-of-year individuals, were found above the Rocky River confluence but absent at downstream transects. White catfish abundance also declined downstream of the Rocky River confluence. Conversely, channel catfish and flathead catfish were present and most abundant below the Rocky River confluence which suggested that degraded water quality and/or competition or predation effects of channel catfish and flathead catfish might be affecting distribution of the former three species within the reach. A similar spatial pattern was observed in North American catfish abundance during previous fishery surveys conducted by Progress Energy during 2000 (Progress Energy 2003). Taxa richness (25 taxa) and total fish abundance was greatest at Transect TZ5 (Tables 5-2 and 5-3). However, the fish community was dominated by two species, whitefin shiner and bluegill, which comprised 80 percent of the total catch. The minnow family was well represented at Transect TZ5 with seven taxa present — satinfin shiner, red shiner (non-native species), whitefin shiner, bluehead chub, comely shiner, spottail shiner, and coastal shiner. Shorthead redhorse and unidentified young-of-year Moxostoma species, absent from other transects, were also present at Transect TZ5. All three darter species were present at Transect TZ5, including the intolerant Piedmont darter. Conversely, the contribution of tolerant species was the lowest at Transect TZ5 (16 percent), and green sunfish abundance declined compared to abundance at Transects TZ2, TZ3, and TZ4. Insectivorous feeding fish comprised 95 percent of the fish community at Transect TZ5. Forty-eight percent of collected taxa had multiple age groups present (Tables 5-3 and 5-4). The fish community characteristics at Transect TZ5 and subsequent spatial changes observed within Reach 1 suggested there was a recovery of the fish community in the lower portion of this reach from degraded water quality (below Rocky River) and flow (above and below Rocky River)
Section 5 Results and Discussions
5-7
conditions. Several tributaries, including the Little River, are located below the Brown Creek confluence. These tributaries provided additional inflow and dilution of the degraded water quality between the N.C. Highway 109 Bridge and Blewett Falls Lake. Additionally, there may have been a lake-stream ecological edge enhancement effect on fish community diversity and abundance (e.g., bluegill abundance) given that Transect TZ5 was located at the Blewett Falls Lake headwaters. However, stream-dwelling species, such as minnows and suckers did increase in abundance at Transect TZ5 when compared to upstream transects, suggesting some recovery response in the fish community. Small numbers of American eel, including young-of-year, were collected from all transects within Reach 1 (Tables 5-2 and 5-4; Figures 5-1 and 5-2). The presence of American eel indicated some individuals were able to migrate past Blewett Falls Dam and inhabit upstream areas. Previous fishery surveys also documented the presence of American eel in this reach as well as larger tributaries — Little River, Brown Creek, and Rocky River (Progress Energy 2003, 2005; Starnes 2004). 5.1.2 Reach 2 (Blewett Falls Dam to S.C. Highway 34) Forty-six fish taxa representing fourteen families were collected from Reach 2 of the Pee Dee River below the Blewett Falls Development and included 14 minnow species, nine sunfish species, five North American catfish species, four sucker species, and three darter species (Table 5-1). Taxa richness was greater in Reach 2 when compared to taxa richness in Reach 1. Differences in taxa richness between the two reaches were related, in part, to the: (1) watershed area size; (2) sampled physiographic regions (i.e., Piedmont vs. Coastal Plain areas); and (3) presence of euryhaline species below the Blewett Falls Development (Atlantic needlefish, striped mullet, and hogchoker). Generally, taxa richness and abundance increases with drainage area size. The Piedmont and Coastal Plain physiographic areas were sampled below the Blewett Falls Development which included two species that were not collected from the river reach below the Tillery Development (thinlip chub and spotted sunfish). Even when considering these factors, the fish community in Reach 1 did not appear to be as diverse or as robust when compared to the fish community in Reach 2. This was evident in the spatial differences, particularly in the taxa richness and total abundance of minnow and darter species. Furthermore, green sunfish, a tolerant species, was not a dominant component of the fish community in Reach 2 as observed at several transects in Reach 1.
Section 5 Results and Discussions
5-8
0
2
4
6
8
10
40 70 100
130
160
190
220
250
280
310
340
370
400
430
460
490
520
550
580
610Transect TZ1N = 4
0
2
4
6
8
10
40 70 100
130
160
190
220
250
280
310
340
370
400
430
460
490
520
550
580
610
0
2
4
6
8
10
40 70 100
130
160
190
220
250
280
310
340
370
400
430
460
490
520
550
580
610
0
2
4
6
8
10
40 70 100
130
160
190
220
250
280
310
340
370
400
430
460
490
520
550
580
610
02468
10
40 70 100130160190220250280310340370400430460490520550580610640
Transect TZ2N = 1
Transect TZ3N = 8
Transect TZ4N = 2
Transect TZ5N = 1
0
2
4
6
8
10
40 70 100
130
160
190
220
250
280
310
340
370
400
430
460
490
520
550
580
610Transect TZ1N = 4
0
2
4
6
8
10
40 70 100
130
160
190
220
250
280
310
340
370
400
430
460
490
520
550
580
610
0
2
4
6
8
10
40 70 100
130
160
190
220
250
280
310
340
370
400
430
460
490
520
550
580
610
0
2
4
6
8
10
40 70 100
130
160
190
220
250
280
310
340
370
400
430
460
490
520
550
580
610
02468
10
40 70 100130160190220250280310340370400430460490520550580610640
Transect TZ2N = 1
Transect TZ3N = 8
Transect TZ4N = 2
Transect TZ5N = 1
Num
ber
Total Length (mm) Figure 5-1 Length-frequency histograms of American eel by transect collected during
the shallow water fish survey of the Pee Dee River below the Tillery Development during 2004.
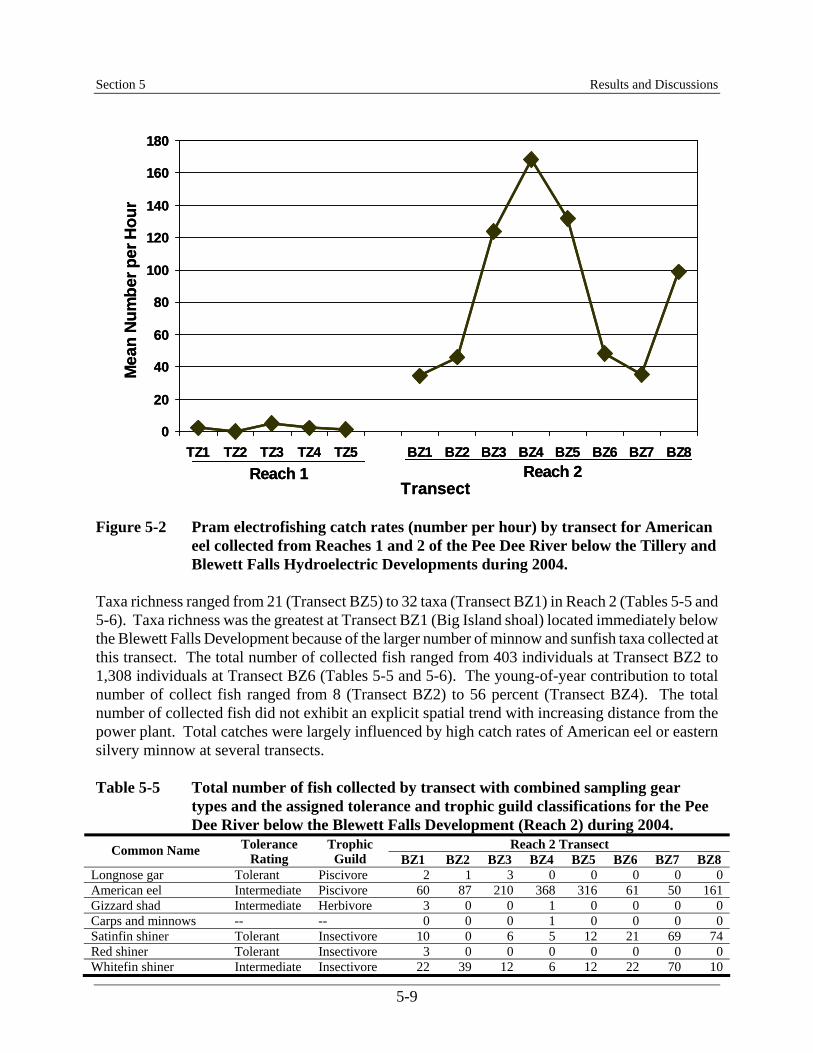
Section 5 Results and Discussions
5-9
0
20
40
60
80
100
120
140
160
180
TZ1 TZ2 TZ3 TZ4 TZ5 BZ1 BZ2 BZ3 BZ4 BZ5 BZ6 BZ7 BZ8
Transect
Mea
n N
umbe
r per
Hou
r
Reach 1 Reach 2
0
20
40
60
80
100
120
140
160
180
TZ1 TZ2 TZ3 TZ4 TZ5 BZ1 BZ2 BZ3 BZ4 BZ5 BZ6 BZ7 BZ8
Transect
Mea
n N
umbe
r per
Hou
r
Reach 1 Reach 2
Figure 5-2 Pram electrofishing catch rates (number per hour) by transect for American
eel collected from Reaches 1 and 2 of the Pee Dee River below the Tillery and Blewett Falls Hydroelectric Developments during 2004.
Taxa richness ranged from 21 (Transect BZ5) to 32 taxa (Transect BZ1) in Reach 2 (Tables 5-5 and 5-6). Taxa richness was the greatest at Transect BZ1 (Big Island shoal) located immediately below the Blewett Falls Development because of the larger number of minnow and sunfish taxa collected at this transect. The total number of collected fish ranged from 403 individuals at Transect BZ2 to 1,308 individuals at Transect BZ6 (Tables 5-5 and 5-6). The young-of-year contribution to total number of collect fish ranged from 8 (Transect BZ2) to 56 percent (Transect BZ4). The total number of collected fish did not exhibit an explicit spatial trend with increasing distance from the power plant. Total catches were largely influenced by high catch rates of American eel or eastern silvery minnow at several transects. Table 5-5 Total number of fish collected by transect with combined sampling gear
types and the assigned tolerance and trophic guild classifications for the Pee Dee River below the Blewett Falls Development (Reach 2) during 2004.
Reach 2 Transect Common Name Tolerance Rating
Trophic Guild BZ1 BZ2 BZ3 BZ4 BZ5 BZ6 BZ7 BZ8
Longnose gar Tolerant Piscivore 2 1 3 0 0 0 0 0 American eel Intermediate Piscivore 60 87 210 368 316 61 50 161 Gizzard shad Intermediate Herbivore 3 0 0 1 0 0 0 0 Carps and minnows -- -- 0 0 0 1 0 0 0 0 Satinfin shiner Tolerant Insectivore 10 0 6 5 12 21 69 74 Red shiner Tolerant Insectivore 3 0 0 0 0 0 0 0 Whitefin shiner Intermediate Insectivore 22 39 12 6 12 22 70 10

Section 5 Results and Discussions
5-10
Reach 2 Transect Common Name Tolerance Rating
Trophic Guild BZ1 BZ2 BZ3 BZ4 BZ5 BZ6 BZ7 BZ8
Fieryblack shiner Intolerant Insectivore 0 2 1 0 0 0 1 5 Thinlip chub Intolerant Insectivore 0 0 0 0 0 0 1 0 Eastern silvery minnow Intermediate Herbivore 158 37 109 13 158 778 767 113 Bluehead chub Intermediate Omnivore 0 0 0 99 1 1 1 0 Golden shiner Tolerant Omnivore 3 4 2 0 1 0 1 1 Whitemouth shiner Intermediate Insectivore 0 0 0 0 0 1 0 0 Comely shiner Intermediate Insectivore 14 2 0 0 0 0 0 0 Redlip shiner Intermediate Insectivore 0 0 0 2 0 0 0 0 Spottail shiner Intermediate Omnivore 51 14 67 148 16 43 35 9 Coastal shiner Intermediate Insectivore 1 0 0 4 1 0 1 10 Sandbar shiner Intermediate Insectivore 2 0 0 0 0 0 0 0 Smallmouth buffalo Intermediate Omnivore 0 0 0 0 0 2 0 0 Spotted sucker Intermediate Insectivore 0 0 0 0 0 0 1 1 Notchlip redhorse Intermediate Insectivore 0 0 0 9 0 0 0 0 Shorthead redhorse Intermediate Insectivore 2 1 0 1 0 0 0 0 Redhorse species -- Insectivore 0 0 0 0 0 0 15 0 White catfish Tolerant Omnivore 0 0 1 0 0 0 0 0 Yellow bullhead Tolerant Omnivore 0 1 1 0 0 0 0 0 Channel catfish Intermediate Omnivore 42 22 8 61 110 154 5 16 Margined madtom Intermediate Insectivore 0 0 4 23 4 0 0 0 Flathead catfish Intermediate Piscivore 17 33 11 2 8 2 0 11 Atlantic needlefish -- Piscivore 2 0 2 0 0 1 0 0 Eastern mosquitofish Tolerant Insectivore 41 2 0 2 4 6 33 17 Brook silverside Intermediate Insectivore 29 1 0 0 0 0 0 1 White perch Intermediate Piscivore 1 0 0 0 0 0 0 0 Bluespotted sunfish Intermediate Insectivore 1 0 0 0 0 0 0 0 Redbreast sunfish Tolerant Insectivore 82 43 51 11 81 108 11 37 Green sunfish Tolerant Insectivore 8 2 0 2 1 0 0 2 Pumpkinseed Intermediate Insectivore 1 0 0 0 0 1 3 15 Warmouth Intermediate Insectivore 7 0 0 0 0 0 0 1 Bluegill Intermediate Insectivore 70 62 19 8 14 29 7 45 Redear sunfish Intermediate Insectivore 1 0 1 0 2 10 2 7 Spotted sunfish Intermediate Insectivore 0 1 9 10 18 10 1 3 Largemouth bass Intermediate Piscivore 1 2 1 1 0 6 5 5 Fantail darter Intermediate Insectivore 3 15 47 115 27 4 0 1 Tessellated darter Intermediate Insectivore 26 7 13 183 24 24 18 25 Piedmont darter Intolerant Insectivore 29 3 1 86 13 5 0 1 Striped mullet -- Omnivore 6 21 18 1 0 0 0 6 Hogchoker -- Insectivore 3 1 2 4 26 19 39 27 Total number 701 403 599 1166 849 1308 1136 604

Section 5 Results and Discussions
5-11
Table 5-6 Characteristics of the shallow water fish community in the Pee Dee River below the Blewett Falls Development (Reach 2) during 2004.
Reach 2 Transect Attribute BZ1 BZ2 BZ3 BZ4 BZ5 BZ6 BZ7 BZ8
1. No. of fish taxa 32 24 24 26 21 22 22 26 2. No. of individuals1 701
(628) 403
(371) 599
(537) 1,166 (509)
849 (484)
1,308 (780)
1,136 (536)
604 (437)
3. No. of darter species 3 3 3 3 3 3 1 3 4. No. of minnow species 9 6 6 7 7 6 9 7 5. No. of sucker species 1 1 0 2 0 1 2 1 6. No. of North American
catfish species 2 3 5 3 3 2 1 2
7. No. of sunfish species 8 5 5 5 5 6 6 8 8. No. of intolerant species 1 2 2 1 1 1 2 2 9. % tolerant individuals2 23 14 12 4 20 17 21 29 10. % omnivores and
herbivores238 26 38 22 40 67 58 30
11. % piscivores2 9 26 32 19 16 3 2 13 12. % insectivores2 53 48 30 59 44 31 40 57 13. % green sunfish2 1 < 1 0 < 1 <1 0 0 < 1 14. % multiple age groups 56 54 50 52 67 64 50 58 Water quality3 Water temperature (ºC) 22.9 23.4 23.5 26.4 26.9 25.3 24.4 25.1 Dissolved oxygen (mg/L) 7.4 7.6 8.1 7.3 10.3 9.0 6.5 7.0 Conductivity (µS/cm) 92 93 95 107 94 142 142 135
1 The number of individuals in parenthesis is the number of fish collected excluding young-of-year. 2 Percentage values of tolerant individuals, omnivores and herbivores, piscivores, insectivores, and green sunfish
calculated without young-of-year (see Appendix A for adjusted number of fish without young-of-year in samples). 3 Water quality variable measurements made at the time of sampling at each transect. The fish community at Transect BZ1 was dominated by eastern silvery minnow, redbreast sunfish, bluegill, American eel, spottail shiner, channel catfish, and eastern mosquitofish. These taxa comprised 72 percent of the total catch. The greatest number of sunfish and minnow taxa in Reach 2 were present at this transect (8 and 9 taxa, respectively). Previous fishery surveys conducted by Progress Energy during the 1998-2001 period also documented three additional minnow species present at Transect BZ1 (fieryblack shiner — an intolerant species, highfin shiner, and bluehead chub) (Progress Energy 2003). Tolerant species comprised 23 percent of the fish community and included redbreast sunfish, eastern mosquitofish, green sunfish, satinfin shiner, and red shiner. The darter assemblage was comprised of Piedmont darter (intolerant species), tessellated darter, and fantail darter. The trophic feeding guild structure was comprised mainly of insectivorous (53 percent) and omnivorous/herbivorous species (38 percent). The percentage of fish species with multiple age groups present was 56 percent (Tables 5-6 and 5-7).
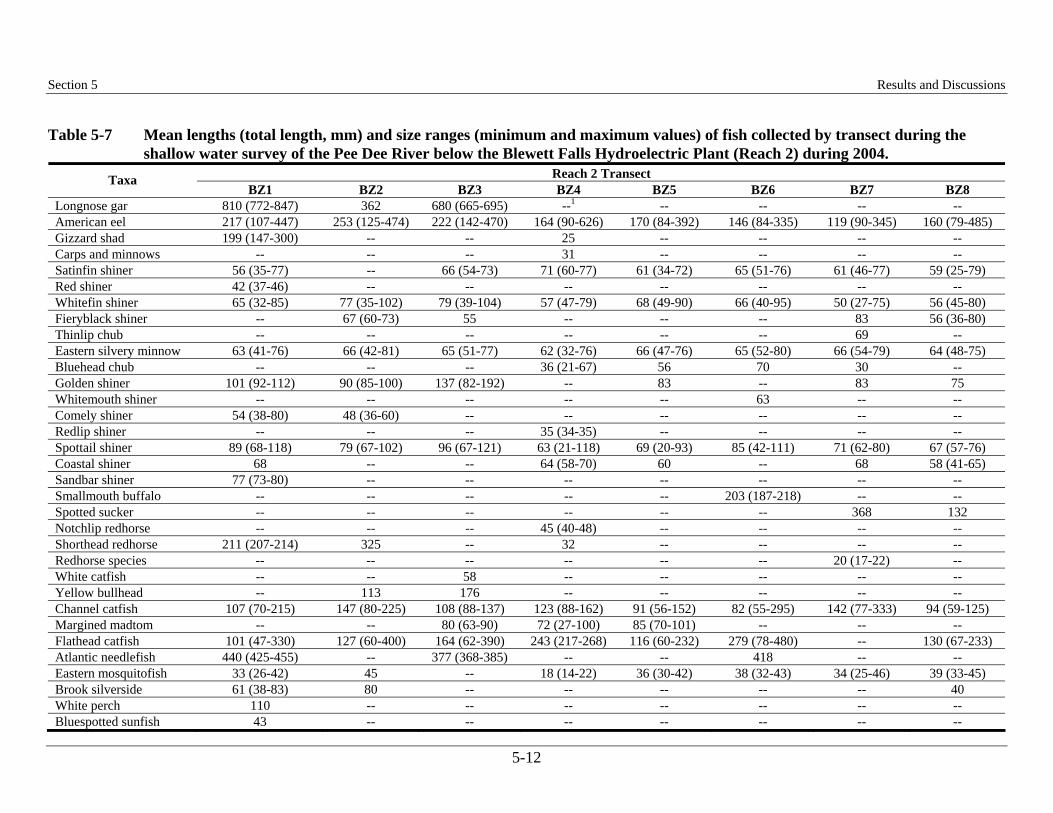
Section 5 Results and Discussions
5-12
Table 5-7 Mean lengths (total length, mm) and size ranges (minimum and maximum values) of fish collected by transect during the shallow water survey of the Pee Dee River below the Blewett Falls Hydroelectric Plant (Reach 2) during 2004.
Reach 2 Transect Taxa BZ1 BZ2 BZ3 BZ4 BZ5 BZ6 BZ7 BZ8
Longnose gar 810 (772-847) 362 680 (665-695) --1 -- -- -- -- American eel 217 (107-447) 253 (125-474) 222 (142-470) 164 (90-626) 170 (84-392) 146 (84-335) 119 (90-345) 160 (79-485) Gizzard shad 199 (147-300) -- -- 25 -- -- -- -- Carps and minnows -- -- -- 31 -- -- -- -- Satinfin shiner 56 (35-77) -- 66 (54-73) 71 (60-77) 61 (34-72) 65 (51-76) 61 (46-77) 59 (25-79) Red shiner 42 (37-46) -- -- -- -- -- -- -- Whitefin shiner 65 (32-85) 77 (35-102) 79 (39-104) 57 (47-79) 68 (49-90) 66 (40-95) 50 (27-75) 56 (45-80) Fieryblack shiner -- 67 (60-73) 55 -- -- -- 83 56 (36-80) Thinlip chub -- -- -- -- -- -- 69 -- Eastern silvery minnow 63 (41-76) 66 (42-81) 65 (51-77) 62 (32-76) 66 (47-76) 65 (52-80) 66 (54-79) 64 (48-75) Bluehead chub -- -- -- 36 (21-67) 56 70 30 -- Golden shiner 101 (92-112) 90 (85-100) 137 (82-192) -- 83 -- 83 75 Whitemouth shiner -- -- -- -- -- 63 -- -- Comely shiner 54 (38-80) 48 (36-60) -- -- -- -- -- -- Redlip shiner -- -- -- 35 (34-35) -- -- -- -- Spottail shiner 89 (68-118) 79 (67-102) 96 (67-121) 63 (21-118) 69 (20-93) 85 (42-111) 71 (62-80) 67 (57-76) Coastal shiner 68 -- -- 64 (58-70) 60 -- 68 58 (41-65) Sandbar shiner 77 (73-80) -- -- -- -- -- -- -- Smallmouth buffalo -- -- -- -- -- 203 (187-218) -- -- Spotted sucker -- -- -- -- -- -- 368 132 Notchlip redhorse -- -- -- 45 (40-48) -- -- -- -- Shorthead redhorse 211 (207-214) 325 -- 32 -- -- -- -- Redhorse species -- -- -- -- -- -- 20 (17-22) -- White catfish -- -- 58 -- -- -- -- -- Yellow bullhead -- 113 176 -- -- -- -- -- Channel catfish 107 (70-215) 147 (80-225) 108 (88-137) 123 (88-162) 91 (56-152) 82 (55-295) 142 (77-333) 94 (59-125) Margined madtom -- -- 80 (63-90) 72 (27-100) 85 (70-101) -- -- -- Flathead catfish 101 (47-330) 127 (60-400) 164 (62-390) 243 (217-268) 116 (60-232) 279 (78-480) -- 130 (67-233) Atlantic needlefish 440 (425-455) -- 377 (368-385) -- -- 418 -- -- Eastern mosquitofish 33 (26-42) 45 -- 18 (14-22) 36 (30-42) 38 (32-43) 34 (25-46) 39 (33-45) Brook silverside 61 (38-83) 80 -- -- -- -- -- 40 White perch 110 -- -- -- -- -- -- -- Bluespotted sunfish 43 -- -- -- -- -- -- --
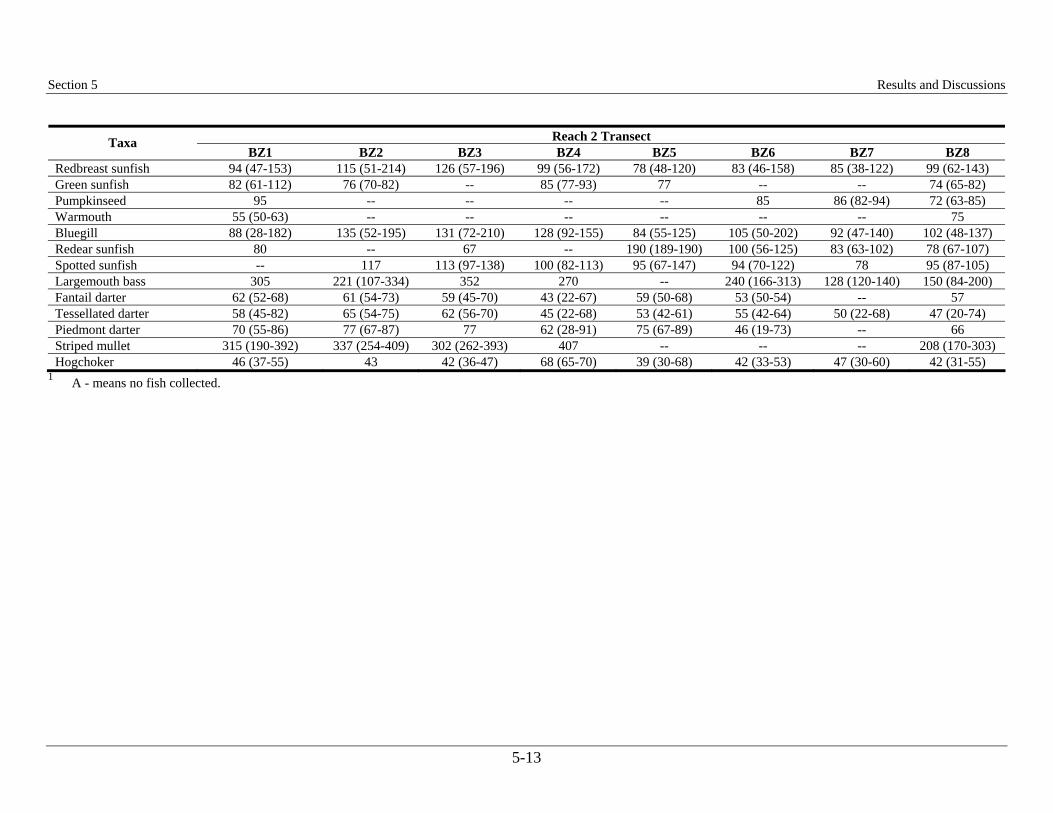
Results and Discussions
5-13
Reach 2 Transect Taxa BZ1 BZ2 BZ3 BZ4 BZ5 BZ6 BZ7 BZ8
Redbreast sunfish 94 (47-153) 115 (51-214) 126 (57-196) 99 (56-172) 78 (48-120) 83 (46-158) 85 (38-122) 99 (62-143) Green sunfish 82 (61-112) 76 (70-82) -- 85 (77-93) 77 -- -- 74 (65-82) Pumpkinseed 95 -- -- -- -- 85 86 (82-94) 72 (63-85) Warmouth 55 (50-63) -- -- -- -- -- -- 75 Bluegill 88 (28-182) 135 (52-195) 131 (72-210) 128 (92-155) 84 (55-125) 105 (50-202) 92 (47-140) 102 (48-137) Redear sunfish 80 -- 67 -- 190 (189-190) 100 (56-125) 83 (63-102) 78 (67-107) Spotted sunfish -- 117 113 (97-138) 100 (82-113) 95 (67-147) 94 (70-122) 78 95 (87-105) Largemouth bass 305 221 (107-334) 352 270 -- 240 (166-313) 128 (120-140) 150 (84-200) Fantail darter 62 (52-68) 61 (54-73) 59 (45-70) 43 (22-67) 59 (50-68) 53 (50-54) -- 57 Tessellated darter 58 (45-82) 65 (54-75) 62 (56-70) 45 (22-68) 53 (42-61) 55 (42-64) 50 (22-68) 47 (20-74) Piedmont darter 70 (55-86) 77 (67-87) 77 62 (28-91) 75 (67-89) 46 (19-73) -- 66 Striped mullet 315 (190-392) 337 (254-409) 302 (262-393) 407 -- -- -- 208 (170-303) Hogchoker 46 (37-55) 43 42 (36-47) 68 (65-70) 39 (30-68) 42 (33-53) 47 (30-60) 42 (31-55)
1 A - means no fish collected.
Section 5

Section 5 Results and Discussions
5-14
Twenty-four species were collected from Transect BZ2 (Hitchcock Creek shoal) with minnow and sunfish taxa accounting for 46 percent of the collected taxa (Tables 5-5 and 5-6). Dominant species based on abundance were American eel, bluegill, redbreast sunfish, whitefin shiner, eastern silvery minnow, flathead catfish, channel catfish, and striped mullet. These species comprised 85 percent of the total catch. Two intolerant species — fieryblack shiner and Piedmont darter — were collected at Transect BZ2. Tolerant species, mainly redbreast sunfish, comprised a small percentage of the fish community (14 percent). Insectivores comprised 48 percent of the trophic feeding guilds followed by omnivores (26 percent) and piscivores (26 percent). Piscivores contributed a fairly large percentage of the trophic feeding guilds at Transect BZ2, and this was related to the large number of American eels present at this transect. The fish community at Transect BZ3 (Jones Creek shoal) was dominated by American eel (35 percent), eastern silvery minnow (18 percent), spottail shiner (11 percent), redbreast sunfish (9 percent), and fantail darter (8 percent). The percentage of tolerant species was also relatively low at this transect (12 percent). Two intolerant species — fieryblack shiner and Piedmont darter — were also present at Transect BZ3. Five North American catfish species were present at this transect and included a small number of margined madtoms. The percentage of trophic feeding guilds was almost equal among omnivores/herbivores, piscivores, and insectivores (Table 5-6). Eastern silvery minnow and spottail shiner comprised most of the omnivorous and herbivorous feeding guild. Similar to Transect BZ2, the large number of American eels accounted for the large percentage of piscivores present at Transect BZ3. The fish community at Transect BZ4 (Great Island shoal) was robust and fairly well balanced considering the taxa richness (25 taxa excluding carps and minnows), total fish abundance, presence of two Moxostoma sucker species, and the large numbers of minnows and darters collected (Tables 5-5 and 5-6). Dominant species included American eel (32 percent), tessellated darter (16 percent), spottail shiner (13 percent), fantail darter (10 percent), bluehead chub (8 percent), Piedmont darter (7 percent), and channel catfish (5 percent). Darters and minnows as a group comprised 57 percent of the total number of collected fish (Table 5-5). The insectivorous feeding guild comprised 59 percent of the fish community followed by about equal percentage contributions of omnivores/herbivores and piscivores. The percentage of tolerant species at Transect BZ4 (4 percent) was the least of any transect sampled in Reach 2. Piedmont darter was the only intolerant species collected from Transect BZ4. Good reproductive success within the fish community was evident considering the percentage of multiple age groups for fish taxa was 52 percent, and young-of-year comprised over 56 percent of the sample (Tables 5-6 and 5-7). Twenty-one taxa were collected at Transect BZ5 which included seven minnow species, five sunfish species, and three darter species. American eel (37 percent), eastern silvery minnow (19 percent), channel catfish (13 percent), and redbreast sunfish (10 percent) were the dominant species within the fish community. Tolerant individuals comprised 20 percent of the fish community at Transect BZ5. Insectivores and omnivores/herbivores accounted for almost equal percentages (40 to 44 percent) of the trophic feeding guilds. American eel comprised most of the piscivorous feeding guild. The percentage of multiple age groups present was 67 percent, the greatest of all Reach 2 transects (Tables 5-6 and 5-7).
Section 5 Results and Discussions
5-15
Transects BZ6 (Thompson Creek) and BZ7 (Blues Landing), located within the Coastal Plain and representing primarily gravel and cobble bar habitat, had the same number of fish taxa (22) present (Tables 5-5 and 5-6). Eastern silvery minnow, an herbivore, was the dominant species at both transects contributing to 59 to 68 percent of the total fish abundance. Correspondingly, the omnivorous/herbivorous trophic feeding guild comprised 58 to 67 percent of the fish community at these transects. Insectivorous and piscivorous individuals comprised smaller percentages of the trophic feeding guilds. Channel catfish (12 percent), redbreast sunfish (8 percent), and American eel (5 percent) were other dominant species at Transect BZ6. Whitefin shiner (6 percent) and satinfin shiner (6 percent) were other dominant species at Transect BZ7. American eel catch rates were lower at these transects and most likely reflected habitat differences (less habitat complexity and absence of aquatic vegetation). Fantail darter and Piedmont darter abundance was low at these transects. This was expected because the habitat preferences and distribution of these species are primarily within the Piedmont/Fall Line regions. Piedmont darter was the only intolerant species present at Transect BZ6 while fieryblack shiner and thinlip chub were intolerant species present at Transect BZ7. Thinlip chub, a rare species endemic to the Coastal Plain, was only collected at Transect BZ7 during the study. Tolerant species (primarily satinfin shiner, eastern mosquitofish, and redbreast sunfish) comprised 17 to 21 percent of the fish communities at Transects BZ6 and BZ7, respectively. The percentage of fish taxa with multiple age groups was 64 percent at Transect BZ6 and 50 percent at Transect BZ7 (Tables 5-6 and 5-7). Twenty-six fish taxa were collected at Transect BZ8 (Cashua Ferry shoal) including three darter, seven minnow, and eight sunfish taxa (Tables 5-5 and 5-6). Dominant species were American eel (27 percent), eastern silvery minnow (19 percent), satinfin shiner (12 percent), bluegill (7 percent), and redbreast sunfish (6 percent). Tolerant species (i.e., primarily satinfin shiner, eastern mosquitofish, and redbreast sunfish) accounted for 29 percent of the fish community, the most for all Reach 2 transects. Two intolerant species — fieryblack shiner and Piedmont darter — were present at Transect BZ8. The insectivorous trophic feeding guild was predominant (57 percent) at Transect BZ8 followed by omnivores/herbivores (30 percent) and piscivores (13 percent). American eels contributed to a large percentage of the piscivorous feeding guild. The percentage of species with multiple age groups was 58 percent at Transect BZ8 (Tables 5-6 and 5-7). American eel was a dominant species within the fish community at most transects in Reach 2 which suggested a fairly robust population present in the Pee Dee River during 2004. American eel comprised 4 percent to 37 percent of the total fish abundance and was the dominant species at five of the eight transects (Table 5-5). Young-of-year were very abundant comprising 59 percent of the American eels collected from Reach 2 (Figure 5-3). Spatial differences were observed in American eel abundance within Reach 2. Pram electrofishing catch rates of American eel, including young-of-year abundance, were the greatest at Transects BZ3, BZ4, BZ5, and BZ8 (Figure 5-2). Transects BZ3, BZ4, and BZ5 were located within the Piedmont Fall Line Zone, approximately 12 to 23 miles
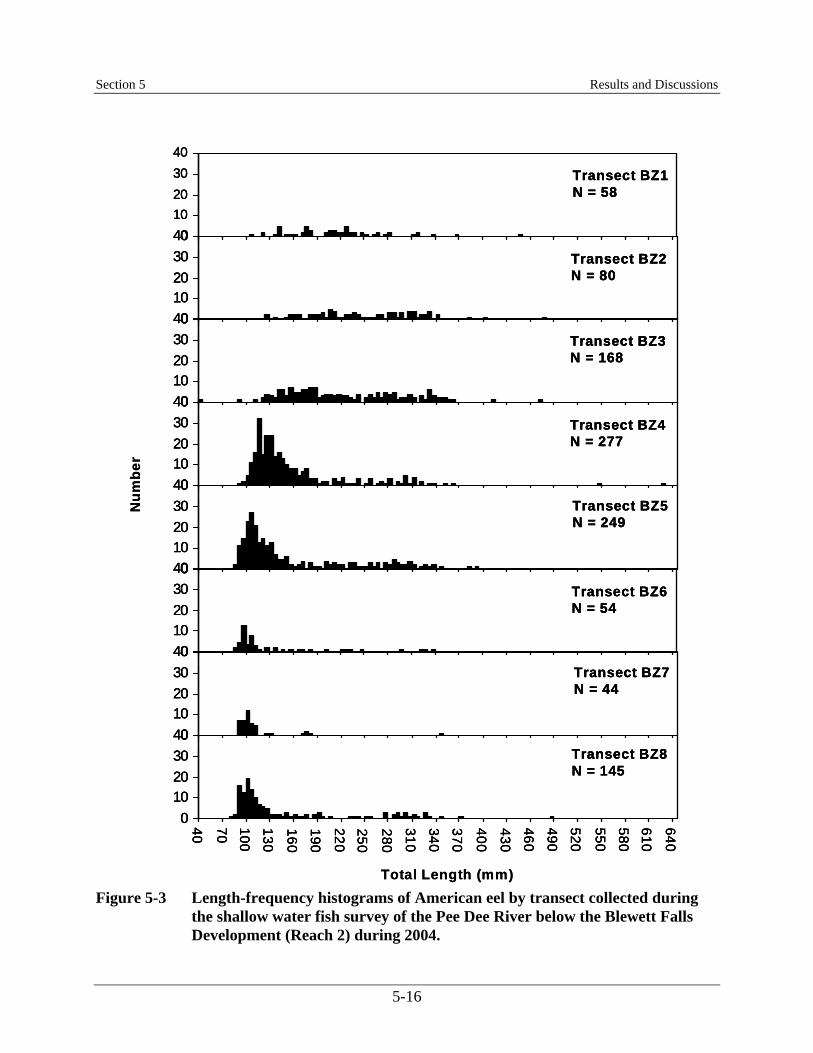
Section 5 Results and Discussions
5-16
010203040
40 70 100
130
160
190
220
250
280
310
340
370
400
430
460
490
520
550
580
610
640
Transect BZ1N = 58
010203040
40 70 100
130
160
190
220
250
280
310
340
370
400
430
460
490
520
550
580
610
640
010203040
40 70 100
130
160
190
220
250
280
310
340
370
400
430
460
490
520
550
580
610
640
010203040
40 70 100
130
160
190
220
250
280
310
340
370
400
430
460
490
520
550
580
610
640
010203040
40 70 100
130
160
190
220
250
280
310
340
370
400
430
460
490
520
550
580
610
640
010203040
40 70 100
130
160
190
220
250
280
310
340
370
400
430
460
490
520
550
580
610
640
010203040
40 70 100
130
160
190
220
250
280
310
340
370
400
430
460
490
520
550
580
610
640
Transect BZ2N = 80
Transect BZ3N = 168
Transect BZ4N = 277
Transect BZ5N = 249
Transect BZ6N = 54
Transect BZ7N = 44
Transect BZ8N = 145
010203040
40 70 100
130
160
190
220
250
280
310
340
370
400
430
460
490
520
550
580
610
640
40 70 100
130
160
190
220250
280
310
340
370
400
430
460
490
520
550
580610
640N
umbe
r
Total Length (mm)
010203040
40 70 100
130
160
190
220
250
280
310
340
370
400
430
460
490
520
550
580
610
640
Transect BZ1N = 58
010203040
40 70 100
130
160
190
220
250
280
310
340
370
400
430
460
490
520
550
580
610
640
010203040
40 70 100
130
160
190
220
250
280
310
340
370
400
430
460
490
520
550
580
610
640
010203040
40 70 100
130
160
190
220
250
280
310
340
370
400
430
460
490
520
550
580
610
640
010203040
40 70 100
130
160
190
220
250
280
310
340
370
400
430
460
490
520
550
580
610
640
010203040
40 70 100
130
160
190
220
250
280
310
340
370
400
430
460
490
520
550
580
610
640
010203040
40 70 100
130
160
190
220
250
280
310
340
370
400
430
460
490
520
550
580
610
640
Transect BZ2N = 80
Transect BZ3N = 168
Transect BZ4N = 277
Transect BZ5N = 249
Transect BZ6N = 54
Transect BZ7N = 44
Transect BZ8N = 145
010203040
40 70 100
130
160
190
220
250
280
310
340
370
400
430
460
490
520
550
580
610
640
40 70 100
130
160
190
220250
280
310
340
370
400
430
460
490
520
550
580610
640
010203040
40 70 100
130
160
190
220
250
280
310
340
370
400
430
460
490
520
550
580
610
640
Transect BZ1N = 58
010203040
40 70 100
130
160
190
220
250
280
310
340
370
400
430
460
490
520
550
580
610
640
010203040
40 70 100
130
160
190
220
250
280
310
340
370
400
430
460
490
520
550
580
610
640
010203040
40 70 100
130
160
190
220
250
280
310
340
370
400
430
460
490
520
550
580
610
640
010203040
40 70 100
130
160
190
220
250
280
310
340
370
400
430
460
490
520
550
580
610
640
010203040
40 70 100
130
160
190
220
250
280
310
340
370
400
430
460
490
520
550
580
610
640
010203040
40 70 100
130
160
190
220
250
280
310
340
370
400
430
460
490
520
550
580
610
640
Transect BZ2N = 80
Transect BZ3N = 168
Transect BZ4N = 277
Transect BZ5N = 249
Transect BZ6N = 54
Transect BZ7N = 44
Transect BZ8N = 145
010203040
40 70 100
130
160
190
220
250
280
310
340
370
400
430
460
490
520
550
580
610
640
40 70 100
130
160
190
220250
280
310
340
370
400
430
460
490
520
550
580610
640N
umbe
r
Total Length (mm) Figure 5-3 Length-frequency histograms of American eel by transect collected during
the shallow water fish survey of the Pee Dee River below the Blewett Falls Development (Reach 2) during 2004.

Section 5 Results and Discussions
5-17
downstream of the Blewett Falls Development. Transect BZ8 was located in the Coastal Plain region, approximately 72 miles downstream of the development. Spatial differences were most likely related to habitat differences and preferences of American eel. American eel catch rates were the greatest at transects with cobble, small boulders, and rooted aquatic vegetation. This habitat offered more protective cover and possibly food sources. 5.2 Crayfish Surveys A total of 380 crayfish representing two genera (Cambarus and Procambarus spp.) were collected from Reaches 1 and 2 (Table 5-8). There were 137 Form II males and 178 females of the genus Cambarus collected. Thirty-one females of the genus Procambarus were collected. The remaining crayfish (34 individuals) were identified to species level. Four species were identified during the survey including one species of Cambarus (Cambarus [P.] hobbsorum) and three species of Procambarus (Procambarus [O.] acutus, P. [O.] braswelli, P. [S.] clarkii). No threatened or endangered crayfish species were found during the study. Procambarus [O.] braswelli, the Waccamaw crayfish, is listed as a species of Special Concern in North Carolina (LeGrand et al. 2004). The Procambarus [O.] braswelli specimens were collected in the South Carolina Coastal Plain portion of the river at Transects BZ7 and BZ8. South Carolina has no conservation listing status for this species. Collection of the Waccamaw crayfish in the Pee Dee River constituted a range extension for this species from its reported historic range in the Waccamaw, Lumber and Little Pee Dee river basins. Procambarus [S.] clarkii is a nonnative introduced crayfish species in North and South Carolina. Table 5-8 Crayfish taxa collected during the shallow water study of the Pee Dee River
below the Tillery and Blewett Falls Developments during 2004. Tillery Development - Reach 1
Transect Taxa TZ1 TZ2 TZ3 TZ4 TZ5
Cambarus (P.) hobbsorum 13 7 0 0 1 Cambarus spp. 103 45 26 48 17 Procambarus (O.) acutus 0 0 0 0 1 Procambarus (S.) clarkii 0 0 0 0 2 Procambarus spp. 15 0 1 0 4 Total number of crayfish 131 52 27 48 25
Blewett Falls Development - Reach 2 Transect
Taxa BZ1 BZ2 BZ3 BZ4 BZ5 BZ6 BZ7 BZ8 Cambarus (P.) hobbsorum 1 1 1 0 0 0 0 0 Cambarus spp. 15 8 39 4 3 8 0 0 Procambarus (O.) acutus 0 0 1 0 0 0 0 0 Procambarus (S.) clarkii 2 0 0 0 0 0 0 0 Procambarus (O.) braswelli 0 0 0 0 0 0 1 2 Procambarus spp. 3 1 1 0 0 1 1 4 Total number of crayfish 21 10 42 4 3 9 2 6
There was a genus shift from Cambarus to Procambarus from the Piedmont to Coastal Plain zones. Crayfish (primarily Cambarus spp.) were more abundant in Reach 1 below the Tillery Development than in Reach 2 below the Blewett Falls Development. Crayfish were most abundant immediately

Section 5 Results and Discussions
5-18
below the Tillery Development with the greatest number of crayfish collected from Transect TZ1. Crayfish abundance generally decreased with increasing distance downstream. Crayfish abundance also decreased below the Rocky River confluence (Transect TZ3 at Buzzard Island) but, there was no discernible difference in abundance below the Brown Creek confluence. In Reach 2, crayfish were most abundant at Transects BZ1, BZ2, and BZ3. Less than 10 individuals were collected per transect from Transects BZ4 to BZ8. No Cambarus were collected from Transects BZ7 and BZ8. 5.3 Mussel Surveys The Pee Dee River drainage supports a fairly diverse mussel community for an Atlantic Slope river basin (Bogan 2002, Bogan and Alderman 2004). Thirty mussel species have been listed as expected to occur in the North Carolina or South Carolina segments of the river basin (Table 5-9). Twenty-three of the 30 expected species have special conservation status listing by the NCWRC (State Endangered, Threatened, or Special Concern), the North Carolina Natural Heritage Program (Significantly Rare), the South Carolina Natural Heritage Program (Species of Concern, State), and the USFWS (Federal Endangered or Species of Concern) (Table 5-9). Table 5-9 Mussel taxa expected to occur in the North Carolina and South Carolina
segments of the Pee Dee River and their conservation status listing (data adopted from Bogan 2002 and Bogan and Alderman 2004).
Common Name Scientific Name Listing Status Alewife floater Anodonta implicata N.C. Threatened Carolina elktoe1 Alasmidonta robusta N.C. Significantly Rare Eastern floater Pyganodon cataracta S.C. Natural Heritage Program Species of
Concern, State Paper pondshell Utterbackia imbecilis S.C. Natural Heritage Program Species of
Concern, State Creeper Strophitus undulatus N.C. Threatened and S.C. Natural Heritage
Program Species of Concern, State Triangle floater Alasmidonta undulata N.C. Threatened and S.C. Natural Heritage
Program Species of Concern, State Brook floater Alasmidonta varicosa N.C. Endangered and Federal Species of Concern Carolina heelsplitter Lasmigona decorata Federally Endangered Atlantic pigtoe Fusconaia masoni NC Endangered and Federal Species of Concern Eastern elliptio Elliptio complanata None Box spike Elliptio cistellaeformis None Cape Fear spike Elliptio marsupiobesa N.C. Special Concern Carolina slabshell Elliptio congaraea S.C. Natural Heritage Program Species of
Concern, State Carolina spike Elliptio raveneli None Variable spike Elliptio icterina None Carolina lance Elliptio angustata None Atlantic spike Elliptio producta None Pod lance Elliptio folliculata N.C. Special Concern Roanoke slabshell Elliptio roanokensis N.C. Threatened Florida pondhorn Uniomerus carolinianus None Waccamaw spike2 Elliptio waccamawensis N.C. Endangered and Federal Species of Concern Tidewater mucket2 Leptodea ochracea N.C. Threatened

Section 5 Results and Discussions
5-19
Common Name Scientific Name Listing Status Savannah lilliput Toxolasma pullus N.C. Endangered, Federal Special Concern, and
S.C. Natural Heritage Program Species of Concern, State
Eastern pondmussel Ligumia nasuta N.C. Threatened Eastern creekshell Villosa delumbis N.C. Significantly Rare and S.C. Natural
Heritage Program Species of Concern, State Notched rainbow Villosa constricta N.C. Special Concern and S.C. Natural Heritage
Program Species of Concern, State Carolina creekshell Villosa vaughaniana N.C. Endangered and Federal Special Concern
Southern rainbow3 Villosa vibex S.C. Natural Heritage Program Species of Concern, State
Carolina fatmucket/ Eastern lampmussel
Lampsilis radiata4 N.C. Threatened
Yellow lampmussel Lampsilis cariosa N.C. Endangered, Federal Special Concern, and S.C. Natural Heritage Program Species of Concern, State
Lampmussel sp. Lampsilis n.s.5 None 1 A shell of Carolina elktoe was recently found by Mr. John Alderman in Poison Fork which is a headwater stream of
the Uwharrie River in North Carolina during mussel surveys conducted in 2004. Mr. Alderman should be contacted regarding the location and status of the species.
2 The Waccamaw spike and tidewater mucket were collected by The Nature Conservancy during mussel surveys of the lower Pee Dee River during 2004 (see Section 5.3.4 for details regarding collection of this species).
3 The Southern rainbow was recently collected by The Nature Conservancy from the Pee Dee River near Cheraw during the 2004 mussel survey (see Section 5.3.4 for details regarding collection of this species).
4 A complex of two subspecies, Lampsilis radiata radiata and Lampsilis radiata conspicua. 5 An undescribed species of Lampsilis. The South Carolina Department of Natural Resources has no formal conservation listing of mussel species for waters of the State, but has proposed to adopt the North Carolina conservation status for these mussels. A total of 18 mussel taxa representing 12,512 individuals were collected during the surveys of Reaches 1 and 2 of the Pee Dee River and associated tributaries during this study (Table 5-10). Approximately 84 percent of the total number of collected mussels were comprised of two taxa —eastern elliptio and Roanoke slabshell. Thirteen of the mussel taxa had state or federal listing status including: (1) five North Carolina Threatened species (Roanoke slabshell, Carolina fatmucket/eastern lampmussel, eastern pondmussel, alewife floater, and creeper); (2) two North Carolina Endangered species and Federal Species of Concern (yellow lampmussel and Carolina creekshell); (3) two North Carolina Special Concern species (pod lance and notched rainbow); and (4) one North Carolina Significantly Rare species (eastern creekshell).
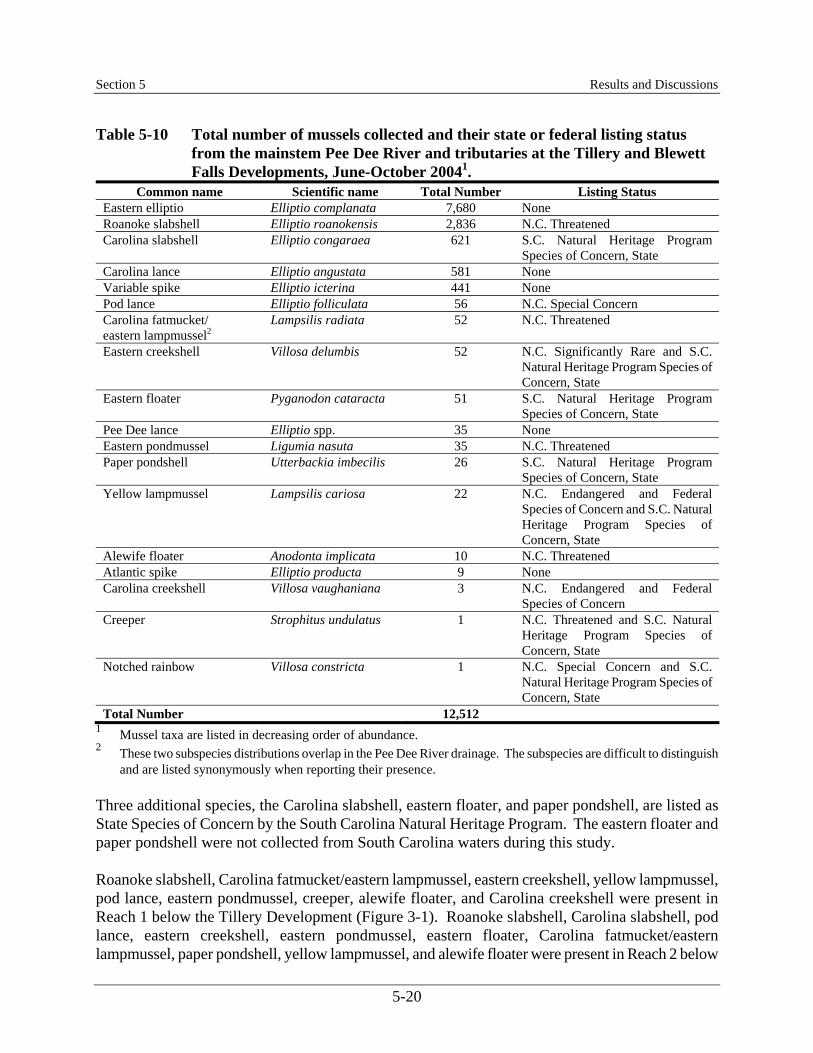
Section 5 Results and Discussions
5-20
Table 5-10 Total number of mussels collected and their state or federal listing status from the mainstem Pee Dee River and tributaries at the Tillery and Blewett Falls Developments, June-October 20041.
Common name Scientific name Total Number Listing Status Eastern elliptio Elliptio complanata 7,680 None Roanoke slabshell Elliptio roanokensis 2,836 N.C. Threatened Carolina slabshell Elliptio congaraea 621 S.C. Natural Heritage Program
Species of Concern, State Carolina lance Elliptio angustata 581 None Variable spike Elliptio icterina 441 None Pod lance Elliptio folliculata 56 N.C. Special Concern Carolina fatmucket/ eastern lampmussel2
Lampsilis radiata 52 N.C. Threatened
Eastern creekshell Villosa delumbis 52 N.C. Significantly Rare and S.C. Natural Heritage Program Species of Concern, State
Eastern floater Pyganodon cataracta 51 S.C. Natural Heritage Program Species of Concern, State
Pee Dee lance Elliptio spp. 35 None Eastern pondmussel Ligumia nasuta 35 N.C. Threatened Paper pondshell Utterbackia imbecilis 26 S.C. Natural Heritage Program
Species of Concern, State Yellow lampmussel Lampsilis cariosa 22 N.C. Endangered and Federal
Species of Concern and S.C. Natural Heritage Program Species of Concern, State
Alewife floater Anodonta implicata 10 N.C. Threatened Atlantic spike Elliptio producta 9 None Carolina creekshell Villosa vaughaniana 3 N.C. Endangered and Federal
Species of Concern Creeper Strophitus undulatus 1 N.C. Threatened and S.C. Natural
Heritage Program Species of Concern, State
Notched rainbow Villosa constricta 1 N.C. Special Concern and S.C. Natural Heritage Program Species of Concern, State
Total Number 12,512 1 Mussel taxa are listed in decreasing order of abundance. 2 These two subspecies distributions overlap in the Pee Dee River drainage. The subspecies are difficult to distinguish
and are listed synonymously when reporting their presence. Three additional species, the Carolina slabshell, eastern floater, and paper pondshell, are listed as State Species of Concern by the South Carolina Natural Heritage Program. The eastern floater and paper pondshell were not collected from South Carolina waters during this study. Roanoke slabshell, Carolina fatmucket/eastern lampmussel, eastern creekshell, yellow lampmussel, pod lance, eastern pondmussel, creeper, alewife floater, and Carolina creekshell were present in Reach 1 below the Tillery Development (Figure 3-1). Roanoke slabshell, Carolina slabshell, pod lance, eastern creekshell, eastern pondmussel, eastern floater, Carolina fatmucket/eastern lampmussel, paper pondshell, yellow lampmussel, and alewife floater were present in Reach 2 below

Section 5 Results and Discussions
5-21
the Blewett Falls Development (Figure 3-2). The notched rainbow was only found in the Uwharrie River, a tributary of Lake Tillery (Figure 3-1). 5.3.1 Reach 1 (Tillery Dam to Blewett Falls Lake) Mussel taxa richness ranged from 5 (Transects TZ2 and TZ3) to 10 (Transect TZ4) taxa, and abundance ranged from 32 to 557 individuals in Reach 1 (Table 5-11). Taxa richness was the greatest at Transect TZ4 followed by Transect TZ1. There was not an explicit spatial trend of increasing or decreasing taxa richness or abundance within the reach as observed with the fish and crayfish communities. However, mussel taxa richness and abundance were lower at Transect TZ3 located below the Rocky River confluence. The number of collected mussels was 6 to 17 times less at Transect TZ3 than mussel abundance at other transects. Table 5-11 Number of mussels collected by transect from Reach 1 of the Pee Dee River
below the Tillery Development during 2004. Reach 1 Transect
Taxa1 TZ1 TZ2 TZ3 TZ4 TZ5 Eastern elliptio 340 224 3 117 84 Roanoke slabshell-NCT 1 2 24 368 84 Carolina lance 133 124 3 48 2 Carolina fatmucket/eastern lampmussel-NCT 26 7 0 1 0 Variable spike 0 0 1 11 1 Eastern creekshell-NCSR 10 0 0 0 0 Yellow lampmussel-NCE&FSC 1 0 0 0 6 Atlantic spike 0 0 1 6 0 Pod lance-NCSC 0 0 0 0 4 Eastern floater 0 0 0 2 0 Alewife floater-NCT 3 0 0 0 0 Eastern pondmussel-NCT 0 0 0 2 1 Paper pondshell 1 0 0 1 0 Creeper-NCT 0 0 0 1 0 Carolina creekshell-NCE&FSC 1 2 0 0 0 Total Number of Mussels 516 359 32 557 182
1 Conservation status: NCSR = North Carolina Significantly Rare species, NCSC = North Carolina Special Concern species, NCT = North Carolina Threatened species, NCE = North Carolina Endangered species, FSC = and Federal Species of Concern.
Eastern elliptio, Roanoke slabshell, and Carolina lance were the most abundant mussel taxa collected in Reach 1 (Table 5-11). Eastern elliptio and Carolina lance were most abundant at Transects TZ1 and TZ2 while Roanoke slabshell was most abundant in the lower portion of the reach at Transects TZ3, TZ4, and TZ5. Nine taxa collected in Reach 1 had conservation status listing in North Carolina waters and included Roanoke slabshell, Carolina fatmucket/eastern lampmussel, eastern creekshell, yellow lampmussel, pod lance, alewife floater, eastern pondmussel, creeper, and Carolina creekshell. Transect TZ1 had the greatest number of species with a conservation status listing (six of nine taxa) followed by Transect TZ4 (4 of 10 taxa). Creeper and Carolina creekshell, species with listing status, were collected from Reach 1 but not from Reach 2 during the Progress Energy survey. The

Section 5 Results and Discussions
5-22
creeper was found in Reach 2 during previous mussel surveys conducted by North Carolina resource agencies from 1987 to 2001 (Progress Energy 2003). The creeper (one specimen) was also found in Reach 2 near Cheraw, South Carolina during the mussel survey conducted by The Nature Conservancy of South Carolina during 2004 (see Section 5.3.4). There was a wide size range of individuals collected for most mussel taxa in Reach 1 (Table 5-12 and Appendix B). While no quantitative ageing of individuals was performed during the study, the shell length ranges suggested multiple-size classes for a few mussel taxa in this reach. Four of the 15 taxa collected in the reach had multiple-size classes present at one or more surveyed transects (Appendix B). Table 5-12 Length (mm) ranges of mussel taxa collected from Reaches 1 and 2 of the Pee
Dee River below the Tillery and Blewett Falls Developments during 2004. Tillery Development - Reach 1
Transect Taxa TZ1 TZ2 TZ3 TZ4 TZ5
Eastern elliptio 33-101 53-105 72-96 68-114 56-122 Roanoke slabshell 117 58-61 82-163 88-161 85-161 Carolina lance 47-103 58-102 91-114 72-123 108-109 Eastern lampmussel 68-121 86-122 -- 118 -- Variable spike --1 -- 85 72-95 99 Eastern creekshell 42-74 -- -- -- -- Yellow lampmussel 98 -- -- -- 125-145 Atlantic spike -- -- 83 59-83 -- Pod lance -- -- -- -- 61-129 Eastern floater -- -- -- 68-110 -- Alewife floater 80-87 -- -- -- -- Eastern pondmussel -- -- -- 108-110 115 Paper pondshell 59 -- -- 59 -- Creeper -- -- -- 87 -- Carolina creekshell 67 62-63 -- -- --
Blewett Falls Development - Reach 2 Transect
Taxa BZ1 BZ1A BZ2 BZ3 BZ4 BZ5 Eastern elliptio 19-125 38-101 38-124 31-88 46-85 26-89 Roanoke slabshell 45-172 48-161 51-160 41-110 39-100 79-100 Carolina slabshell 85-133 36-108 42-112 46-92 26-79 37-87 Variable spike 77-99 48-76 52-88 33-79 -- 51-61 Carolina lance 53-167 69-119 70-137 44-92 39-86 56-92 Pod lance 84-121 -- 61-117 -- -- -- Eastern creekshell 57 36-55 42-67 27-51 37 40 Pee Dee lance -- -- -- -- -- 38-60 Eastern pondmussel 95-120 89-105 56-118 -- -- -- Eastern floater 30-120 22-86 23-98 -- -- -- Paper pondshell 49-70 39-46 51-64 -- -- -- Eastern lampmussel 116-141 96 98 39-80 -- -- Yellow lampmussel 119 -- -- 63 63-108 81-90 Alewife floater 67-104 84 61-76 -- -- -- Atlantic spike -- -- -- 44-137 -- --
1 A -- means no mussels collected.

Section 5 Results and Discussions
5-23
5.3.2 Reach 2 (Blewett Falls Dam to S.C. Highway 34) Mussel taxa richness ranged from 5 (Transect BZ4) to 13 (Transect BZ1) taxa, and abundance ranged from 455 to 3,382 individuals in Reach 2 (Table 5-13). Generally, the mussel community was more diverse and had a greater abundance of individuals in Reach 2 when compared to the mussel community in Reach 1 (Tables 5-11 and 5-13). Taxa richness and abundance were the greatest at the three transects located immediately below the Blewett Falls Development. These three transects, located from approximately 1 to 5 miles below the Blewett Falls Development, supported a very large mussel biomass and accounted for 84 percent of all mussels collected within this reach. Eastern elliptio and Roanoke slabshell were the dominant taxa at these transects. There was a general decreasing trend in taxa richness and abundance with increasing distance from the Blewett Falls Development. Table 5-13 Number of mussels collected by transect from Reach 2 of the Pee Dee River
below the Blewett Falls Development during 2004. Reach 2 Transect
Taxa1 BZ1 BZ1A BZ2 BZ3 BZ4 BZ5 Eastern elliptio 1,599 2,360 2,027 220 331 188 Roanoke slabshell-NCT 448 796 1,040 39 25 7 Carolina slabshell-SCNHPSC 52 63 40 275 85 106 Variable spike 9 25 109 257 0 4 Carolina lance 90 40 70 31 13 25 Pod lance–NCSC 24 0 28 0 0 0 Eastern creekshell-NCSR 1 7 16 14 1 1 Pee Dee lance 0 0 0 0 0 35 Eastern pondmussel-NCT 10 2 20 0 0 0 Eastern floater-SCNHPSC 22 6 21 0 0 0 Paper pondshell-SCNHPSC 14 2 8 0 0 0 Carolina fatmucket/eastern lampmussel-NCT 4 2 1 8 0 0 Yellow lampmussel-NCE, FSC, and SCNHPSC 1 0 0 8 0 3 Alewife floater-NCT 4 1 2 0 0 0 Atlantic spike 0 0 0 2 0 0 Total number of mussels 2,278 3,304 3,382 854 455 369
1 Conservation status: NCSR = North Carolina Significantly Rare species, NCSC = North Carolina Special Concern species, NCT = North Carolina Threatened species, and NCE = North Carolina Endangered species, SCNHPSC = South Carolina Natural Heritage Program, Species of Concern, State, and FSC = Federal Species of Concern.
Eastern elliptio, Roanoke slabshell, and Carolina slabshell were the most abundant mussel taxa collected in Reach 2 (Table 5-13). These three taxa accounted for 91 percent of all mussels collected in the reach. Ten taxa collected in Reach 2 had conservation listing status in North Carolina or South Carolina waters and included Roanoke slabshell, Carolina slabshell, pod lance, eastern creekshell, yellow lampmussel, eastern pondmussel, eastern floater, paper pondshell, Carolina fatmucket/eastern lampmussel, and alewife floater. Transect BZ1 had the greatest number of species with conservation listing status (7 of 13 collected taxa) followed by Transect BZ2 (6 of 12 collected taxa). The Pee Dee lance was collected from Reach 2 but not from Reach 1 during this survey.
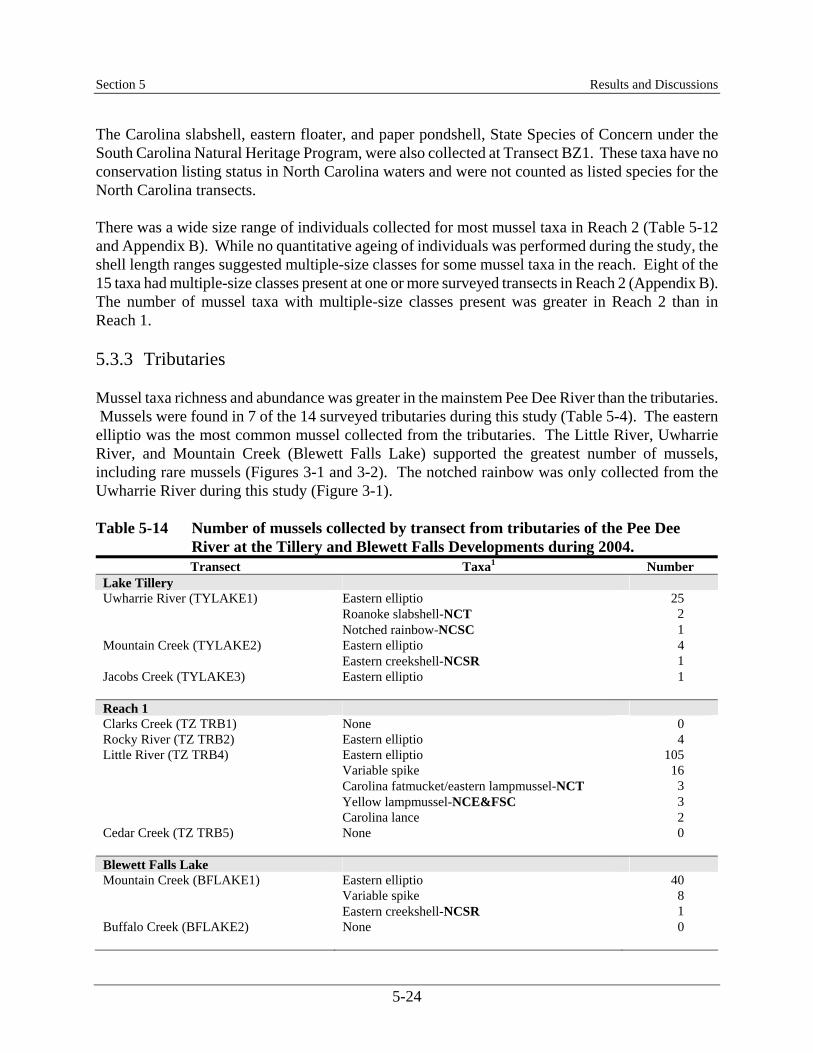
Section 5 Results and Discussions
5-24
The Carolina slabshell, eastern floater, and paper pondshell, State Species of Concern under the South Carolina Natural Heritage Program, were also collected at Transect BZ1. These taxa have no conservation listing status in North Carolina waters and were not counted as listed species for the North Carolina transects. There was a wide size range of individuals collected for most mussel taxa in Reach 2 (Table 5-12 and Appendix B). While no quantitative ageing of individuals was performed during the study, the shell length ranges suggested multiple-size classes for some mussel taxa in the reach. Eight of the 15 taxa had multiple-size classes present at one or more surveyed transects in Reach 2 (Appendix B). The number of mussel taxa with multiple-size classes present was greater in Reach 2 than in Reach 1. 5.3.3 Tributaries Mussel taxa richness and abundance was greater in the mainstem Pee Dee River than the tributaries. Mussels were found in 7 of the 14 surveyed tributaries during this study (Table 5-4). The eastern elliptio was the most common mussel collected from the tributaries. The Little River, Uwharrie River, and Mountain Creek (Blewett Falls Lake) supported the greatest number of mussels, including rare mussels (Figures 3-1 and 3-2). The notched rainbow was only collected from the Uwharrie River during this study (Figure 3-1). Table 5-14 Number of mussels collected by transect from tributaries of the Pee Dee
River at the Tillery and Blewett Falls Developments during 2004. Transect Taxa1 Number
Lake Tillery Uwharrie River (TYLAKE1) Eastern elliptio 25 Roanoke slabshell-NCT 2 Notched rainbow-NCSC 1 Mountain Creek (TYLAKE2) Eastern elliptio 4 Eastern creekshell-NCSR 1 Jacobs Creek (TYLAKE3) Eastern elliptio 1 Reach 1 Clarks Creek (TZ TRB1) None 0 Rocky River (TZ TRB2) Eastern elliptio 4 Little River (TZ TRB4) Eastern elliptio 105 Variable spike 16 Carolina fatmucket/eastern lampmussel-NCT 3 Yellow lampmussel-NCE&FSC 3 Carolina lance 2 Cedar Creek (TZ TRB5) None 0 Blewett Falls Lake Mountain Creek (BFLAKE1) Eastern elliptio 40 Variable spike 8 Eastern creekshell-NCSR 1 Buffalo Creek (BFLAKE2) None 0
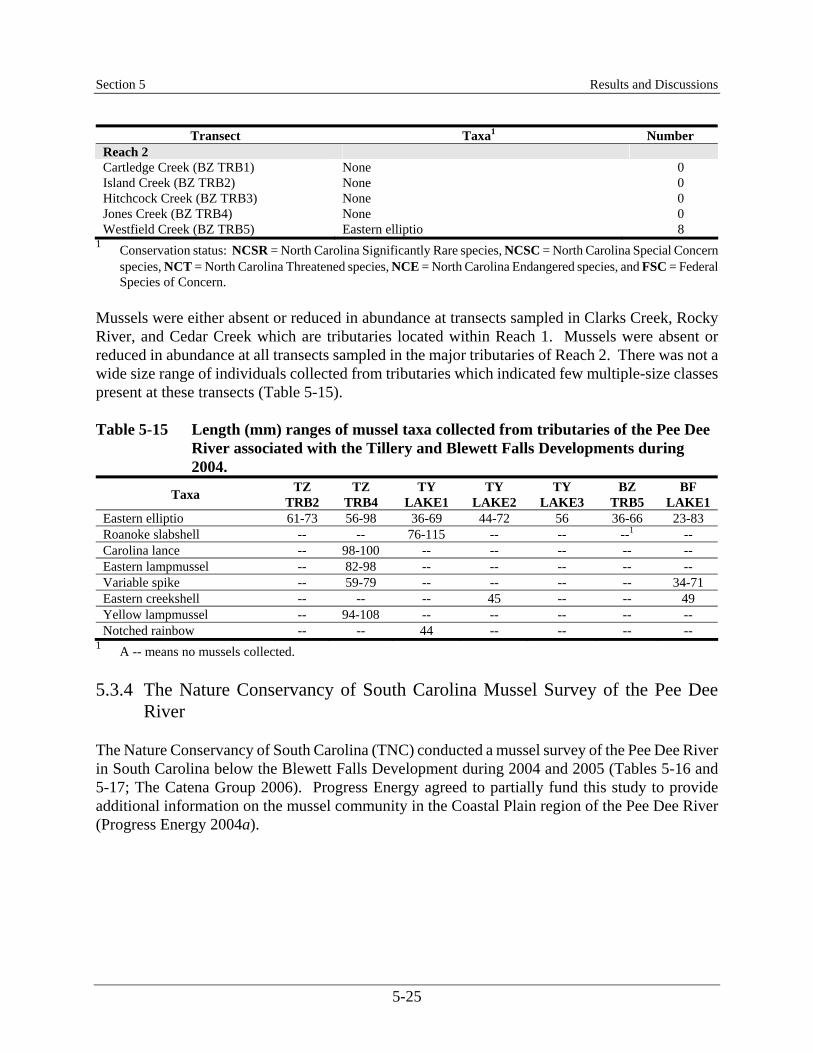
Section 5 Results and Discussions
5-25
Transect Taxa1 Number Reach 2 Cartledge Creek (BZ TRB1) None 0 Island Creek (BZ TRB2) None 0 Hitchcock Creek (BZ TRB3) None 0 Jones Creek (BZ TRB4) None 0 Westfield Creek (BZ TRB5) Eastern elliptio 8
1 Conservation status: NCSR = North Carolina Significantly Rare species, NCSC = North Carolina Special Concern species, NCT = North Carolina Threatened species, NCE = North Carolina Endangered species, and FSC = Federal Species of Concern.
Mussels were either absent or reduced in abundance at transects sampled in Clarks Creek, Rocky River, and Cedar Creek which are tributaries located within Reach 1. Mussels were absent or reduced in abundance at all transects sampled in the major tributaries of Reach 2. There was not a wide size range of individuals collected from tributaries which indicated few multiple-size classes present at these transects (Table 5-15). Table 5-15 Length (mm) ranges of mussel taxa collected from tributaries of the Pee Dee
River associated with the Tillery and Blewett Falls Developments during 2004.
Taxa TZ TRB2
TZ TRB4
TY LAKE1
TY LAKE2
TY LAKE3
BZ TRB5
BF LAKE1
Eastern elliptio 61-73 56-98 36-69 44-72 56 36-66 23-83 Roanoke slabshell -- -- 76-115 -- -- --1 -- Carolina lance -- 98-100 -- -- -- -- -- Eastern lampmussel -- 82-98 -- -- -- -- -- Variable spike -- 59-79 -- -- -- -- 34-71 Eastern creekshell -- -- -- 45 -- -- 49 Yellow lampmussel -- 94-108 -- -- -- -- -- Notched rainbow -- -- 44 -- -- -- --
1 A -- means no mussels collected. 5.3.4 The Nature Conservancy of South Carolina Mussel Survey of the Pee Dee
River The Nature Conservancy of South Carolina (TNC) conducted a mussel survey of the Pee Dee River in South Carolina below the Blewett Falls Development during 2004 and 2005 (Tables 5-16 and 5-17; The Catena Group 2006). Progress Energy agreed to partially fund this study to provide additional information on the mussel community in the Coastal Plain region of the Pee Dee River (Progress Energy 2004a).
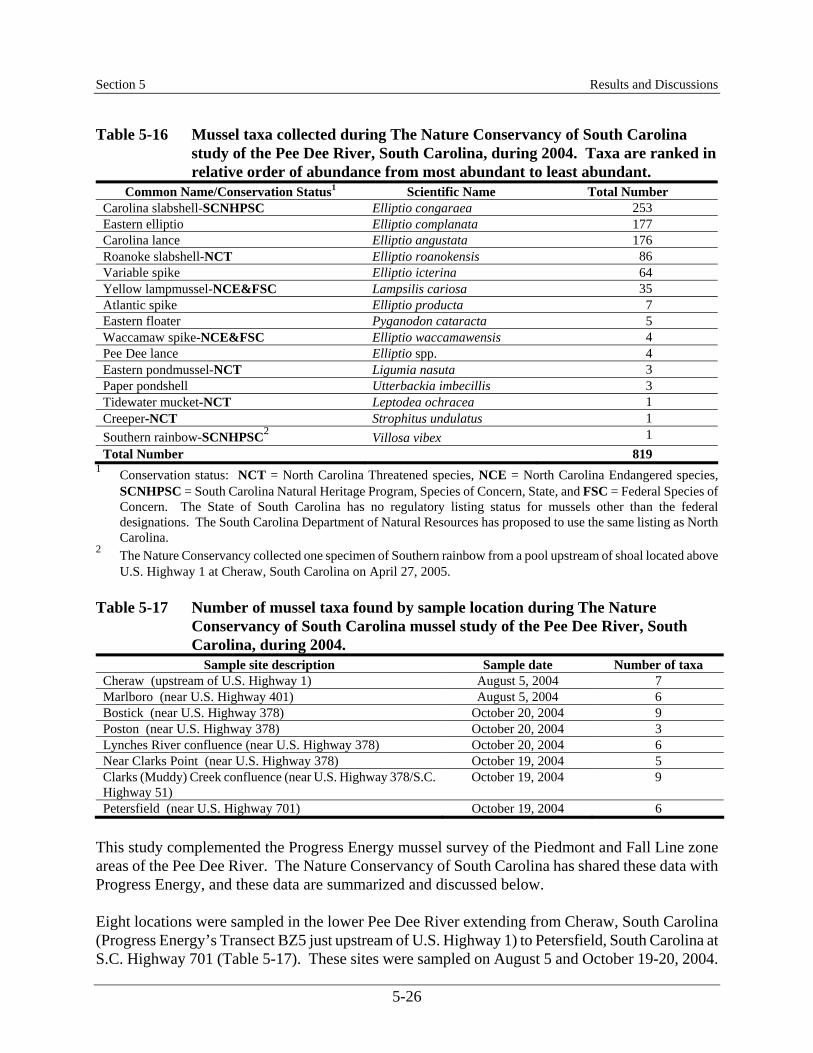
Section 5 Results and Discussions
5-26
Table 5-16 Mussel taxa collected during The Nature Conservancy of South Carolina study of the Pee Dee River, South Carolina, during 2004. Taxa are ranked in relative order of abundance from most abundant to least abundant.
Common Name/Conservation Status1 Scientific Name Total Number Carolina slabshell-SCNHPSC Elliptio congaraea 253 Eastern elliptio Elliptio complanata 177 Carolina lance Elliptio angustata 176 Roanoke slabshell-NCT Elliptio roanokensis 86 Variable spike Elliptio icterina 64 Yellow lampmussel-NCE&FSC Lampsilis cariosa 35 Atlantic spike Elliptio producta 7 Eastern floater Pyganodon cataracta 5 Waccamaw spike-NCE&FSC Elliptio waccamawensis 4 Pee Dee lance Elliptio spp. 4 Eastern pondmussel-NCT Ligumia nasuta 3 Paper pondshell Utterbackia imbecillis 3 Tidewater mucket-NCT Leptodea ochracea 1 Creeper-NCT Strophitus undulatus 1 Southern rainbow-SCNHPSC2 Villosa vibex 1 Total Number 819
1 Conservation status: NCT = North Carolina Threatened species, NCE = North Carolina Endangered species, SCNHPSC = South Carolina Natural Heritage Program, Species of Concern, State, and FSC = Federal Species of Concern. The State of South Carolina has no regulatory listing status for mussels other than the federal designations. The South Carolina Department of Natural Resources has proposed to use the same listing as North Carolina.
2 The Nature Conservancy collected one specimen of Southern rainbow from a pool upstream of shoal located above U.S. Highway 1 at Cheraw, South Carolina on April 27, 2005.
Table 5-17 Number of mussel taxa found by sample location during The Nature
Conservancy of South Carolina mussel study of the Pee Dee River, South Carolina, during 2004.
Sample site description Sample date Number of taxa Cheraw (upstream of U.S. Highway 1) August 5, 2004 7 Marlboro (near U.S. Highway 401) August 5, 2004 6 Bostick (near U.S. Highway 378) October 20, 2004 9 Poston (near U.S. Highway 378) October 20, 2004 3 Lynches River confluence (near U.S. Highway 378) October 20, 2004 6 Near Clarks Point (near U.S. Highway 378) October 19, 2004 5 Clarks (Muddy) Creek confluence (near U.S. Highway 378/S.C. Highway 51)
October 19, 2004 9
Petersfield (near U.S. Highway 701) October 19, 2004 6 This study complemented the Progress Energy mussel survey of the Piedmont and Fall Line zone areas of the Pee Dee River. The Nature Conservancy of South Carolina has shared these data with Progress Energy, and these data are summarized and discussed below. Eight locations were sampled in the lower Pee Dee River extending from Cheraw, South Carolina (Progress Energy’s Transect BZ5 just upstream of U.S. Highway 1) to Petersfield, South Carolina at S.C. Highway 701 (Table 5-17). These sites were sampled on August 5 and October 19-20, 2004.

Section 5 Results and Discussions
5-27
The sites encompassed the upper and lower Coastal Plain regions of the Pee Dee River. Snorkeling, SCUBA diving, and visual surveys were conducted to assess the mussel communities at these sample sites. A total of 819 mussels representing 14 taxa were collected from the eight sample sites during the TNC mussel survey of the lower Pee Dee River (Table 5-16). The number of taxa collected ranged from 3 taxa (Poston, South Carolina sample site) to 9 taxa (Clarks Creek confluence sample site). The number of taxa found at the Cheraw, South Carolina site (7 taxa) was comparable to the number of taxa collected by Progress Energy biologists at Transect BZ5 (8 taxa), located just upstream. Most of the species collected during the survey were also collected by Progress Energy during the survey of the upper Pee Dee River with the exception of Waccamaw spike and tidewater mucket, which are Coastal Plain species. Additionally, The Nature Conservancy recently collected one specimen of Southern rainbow from a pool located just above the shoal sampling area located above U.S. Highway 1 near Cheraw, South Carolina during April 2005. The collection of Waccamaw spike in the Pee Dee River represented a new range extension for this species. Two taxa collected in the study — yellow lampmussel and Waccamaw spike — are Federal Species of Concern. Sampling methodologies differed between the Progress Energy and TNC mussel surveys so a direct comparison of mussel abundance in different segments of the Pee Dee River was not possible (Tables 5-13 and 5-16). 5.3.5 Host Fish Species for Unionid Mussel Glochidia Larvae Freshwater unionid mussels have a parasitic glochidia larval stage that attaches to a host fish (usually fish gills, mouth or skin) as part of their life cycle prior to metamorphosis into juvenile mussels. The host fish species preference can be broad or very specific depending upon the mussel species. Table 5-18 lists some known fish hosts for mussels found in the Pee Dee River during the Progress Energy study. These data were obtained from Bogan (2002) and Bogan and Alderman (2004). Fish hosts are currently not well defined for 11 of the 18 collected mussel species. Many of the listed fish host species occur in both Reaches 1 and 2 (e.g., gar species, North American catfishes, largemouth bass, bluegill, pumpkinseed, green sunfish, sunfish species, white perch, and yellow perch). Alewife is listed as host species for alewife floater; however, alewife does not occur in the Pee Dee River due to geographical range limits. Other Alosa species (American shad, blueback herring, and hickory shad) do occur in the Pee Dee River and may be suitable host species for the alewife floater below the Blewett Falls Development. Table 5-18 List of known fish hosts for glochidia (larvae) of mussel taxa found in the Pee
Dee River, North Carolina-South Carolina (data adopted from Bogan 2002 and Bogan and Alderman 2004).
Taxa Scientific Name Glochidia (Larvae) Fish Host Eastern elliptio Elliptio complanata Banded killlifish, green sunfish, largemouth bass,
and yellow perch Roanoke slabshell Elliptio roanokensis Unknown Carolina lance Elliptio angustata Unknown Carolina slabshell Elliptio congaraea Unknown Variable spike Elliptio icterina Unknown Pod lance Elliptio folliculata Unknown Eastern creekshell Villosa delumbis Unknown
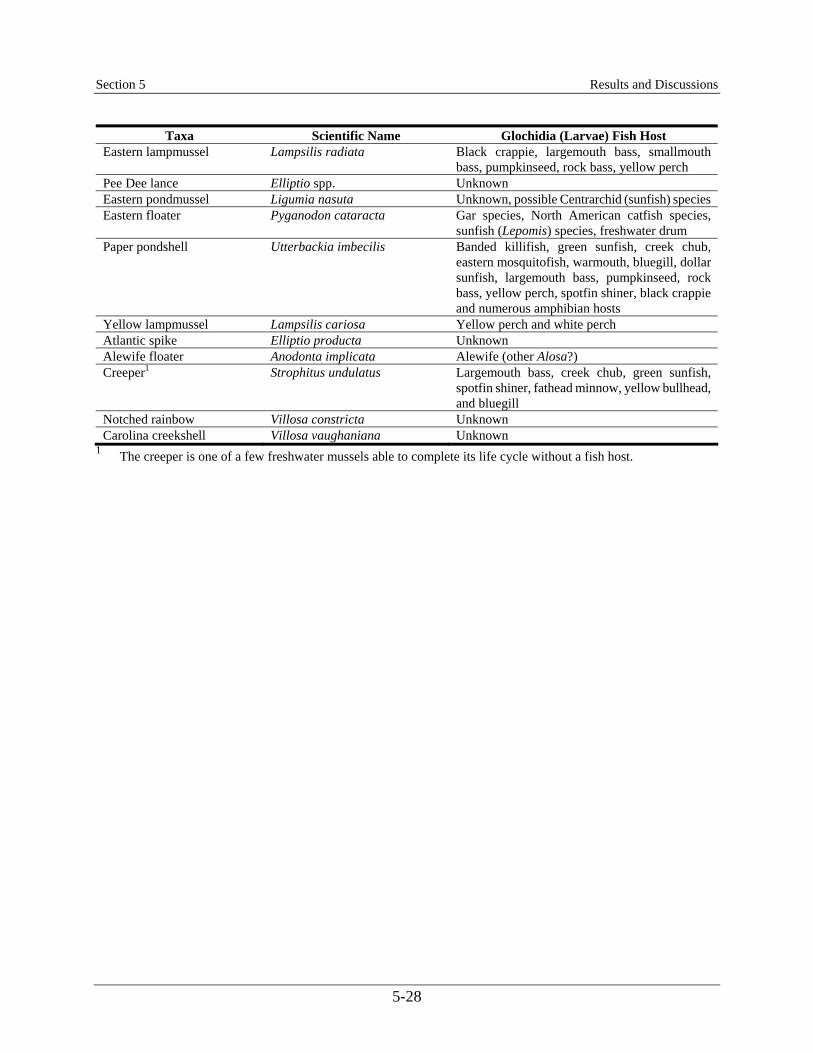
Section 5 Results and Discussions
5-28
Taxa Scientific Name Glochidia (Larvae) Fish Host Eastern lampmussel Lampsilis radiata Black crappie, largemouth bass, smallmouth
bass, pumpkinseed, rock bass, yellow perch Pee Dee lance Elliptio spp. Unknown Eastern pondmussel Ligumia nasuta Unknown, possible Centrarchid (sunfish) species Eastern floater Pyganodon cataracta Gar species, North American catfish species,
sunfish (Lepomis) species, freshwater drum Paper pondshell Utterbackia imbecilis Banded killifish, green sunfish, creek chub,
eastern mosquitofish, warmouth, bluegill, dollar sunfish, largemouth bass, pumpkinseed, rock bass, yellow perch, spotfin shiner, black crappie and numerous amphibian hosts
Yellow lampmussel Lampsilis cariosa Yellow perch and white perch Atlantic spike Elliptio producta Unknown Alewife floater Anodonta implicata Alewife (other Alosa?) Creeper1 Strophitus undulatus Largemouth bass, creek chub, green sunfish,
spotfin shiner, fathead minnow, yellow bullhead, and bluegill
Notched rainbow Villosa constricta Unknown Carolina creekshell Villosa vaughaniana Unknown
1 The creeper is one of a few freshwater mussels able to complete its life cycle without a fish host.

6-1
Section 6 - Summary Shallow water habitat in the Pee Dee River below the Blewett Falls and Tillery Developments, including selected major tributaries, was intensively surveyed for fish, crayfish, and mussels during 2004. The survey was conducted to fulfill study plan requirements outlined in the Water Resources Work Group Issue No. 1: Resident River Aquatic Resources of Project Area. The survey objective was to characterize the fish, crayfish, and mussel shallow water communities in the mainstem Pee Dee River and the major tributaries in the vicinity of each hydroelectric development. Spatial differences in the shallow water fish community were evident in the Pee Dee River below the Tillery Development (i.e., Reach 1). The fish community at Transects TZ1 and TZ2 located immediately below the Tillery Development was characterized as having moderate taxa richness (16 to 19 taxa) and dominated by tolerant or habitat-generalist species. Darter species — fantail darter, tessellated darter, and Piedmont darter — were present at Transects TZ1 and TZ2, but minnow species were absent or reduced in abundance. Fish taxa richness at Transect TZ2 was greater than taxa richness at Transect TZ1, particularly for North American catfish and sunfish species. Darter taxa were also more abundant at Transect TZ2, especially the intolerant Piedmont darter. The fish community below the Rocky River exhibited less taxa richness and lower abundance when compared to upstream (Transects TZ1 and TZ2) and the lowermost downstream transect (Transect TZ5). Minnow and darter species were also reduced in abundance or absent depending upon the sampled transect. Tolerant or habitat generalist species (i.e., omnivores or insectivores with flexible feeding habits) were prevalent and green sunfish supplanted redbreast sunfish as the tolerant sunfish at transects located below the Rocky River. Insectivorous fish species still dominated the trophic feeding guilds although this percentage was lower than observed at Transects TZ1, TZ2, and TZ5. The observed spatial pattern and changes in fish community characteristics suggested the water quality inflow from the Rocky River and Brown Creek was possbily affecting the fish community for a portion of this reach (i.e., approximately 7 to 12 miles of the 17-mile reach). Fish community characteristics at Transect TZ5 suggested there was some degree of recovery in the shallow water fish community in the lower portion of Reach 1 from water quality and flow effects. Several tributaries, including the Little River, are located below the Brown Creek confluence. These tributaries provided additional inflow and dilution of the degraded water quality between the N.C. Highway 109 Bridge and Blewett Falls Lake. Taxa richness and total fish abundance was the greatest at Transect TZ5 and minnow, sunfish, darter, and sucker taxa were well represented at this transect. Contribution of tolerant species was the lowest at this transect and green sunfish abundance also declined at this transect when compared to transects located immediately upstream. However, the fish community was dominated by just two insectivorous feeding species, whitefin shiner and bluegill, at Transect TZ5. When compared to Reach 1, the shallow water fish community in the Pee Dee River below the Blewett Falls Development exhibited greater taxa richness and was more robust as defined by the: (1) greater total fish abundance; (2) number and abundance of minnow, sunfish, darter, and intolerant taxa; (3) species dominance was generally more balanced and not restricted to just a few tolerant or habitat generalist taxa; (4) balanced representation of the trophic feeding guilds; and (5) high percentages of multiple size classes present. Taxa richness was the greatest at Transect BZ1 located immediately below the Blewett Falls Development, which included the greatest number of

Section 6 Summary
6-2
minnow, darter, and sunfish species. The total number of collected fish did not exhibit an explicit spatial trend with increasing distance from the power plant. Total catches were largely influenced by high catch rates of American eel or eastern silvery minnow at several transects. American eel, particularly young-of-year or elvers, were a dominant component of the shallow water fish community below the Blewett Falls Development. American eel comprised 4 to 37 percent of the total fish abundance at sampled transects and was the dominant fish species at five of the eight sampled transects. Elvers were very abundant and comprised 59 percent of the American eels collected from Reach 2 of the Pee Dee River. Spatial differences in eel abundance were observed within this reach with greater electrofishing catches located at transects located 12 to 23 miles downstream of the Blewett Falls Development in the Piedmont Fall Line zone and again at 72 miles downstream in the Coastal Plain zone. American eel catch rates (elvers and older individuals) were greatest at transects with cobble and small boulder substrates with abundant rooted vegetation. These habitat types offered more protective cover and possibly food sources. A small number of American eel, including elvers, were captured in the Pee Dee River reach below the Tillery Development indicating some eels were able to migrate past Blewett Falls Dam and inhabit upstream areas. Crayfish were most abundant in Reach 1 located below the Tillery Development as compared to Reach 2 below the Blewett Development. Crayfish were most abundant immediately below the Tillery Development and generally decreased with increasing distance from the power plant. Crayfish abundance also decreased below the Rocky River confluence (Transect TZ3 at Buzzard Island), but there was no discernible difference in the community below the Brown Creek confluence. There was a genus shift in community dominance from Cambarus to Procambarus species from the Piedmont to Coastal Plain zones. Four species of crayfish were identified from both river reaches, and no threatened or endangered crayfish species were found in the shallow water surveys. Procambarus [O.] braswelli, the Waccamaw crayfish, a species of Special Concern in North Carolina, was collected from Transects BZ7 and BZ8 in the South Carolina Coastal Plain portion of the river below the Blewett Falls Development. The Waccamaw crayfish has no conservation listing status in South Carolina. Collection of the Waccamaw crayfish in the Pee Dee River constituted a range extension for this species from its reported historic range in the Waccamaw, Lumber and Little Pee Dee river basins. There were 12,512 mussels representing 18 taxa collected from the Pee Dee River reaches and tributaries associated with both hydroelectric developments. Approximately 84 percent of the total number of collected mussels were represented by two taxa — Eastern elliptio and Roanoke slabshell. Thirteen of the mussel taxa had state or federal conservation listing status. Roanoke slabshell, Carolina fatmucket/eastern lampmussel, eastern creekshell, yellow lampmussel, pod lance, creeper, alewife floater, easter pondmussell, and Carolina creekshell were present in Reach 1 below the Tillery Development. Roanoke slabshell, Carolina slabshell, pod lance, eastern creekshell, eastern pondmussel, eastern floater, paper pondshell, Carolina fatmucket/eastern lampmussel, yellow lampmussel, and alewife floater were present in Reach 2 below the Blewett Development. The notched rainbow was only collected from the Uwharrie River. The mussel community was also more diverse and had a greater abundance of individuals in the Pee Dee River below the Blewett Falls Development when compared to the mussel community in the
Section 6 Summary
6-3
river reach below the Tillery Development. The greatest number of mussel taxa were collected at the three transects located immediately below the Blewett Falls Development. Seven of the thirteen taxa collected at these transects have a conservation listing status. These transects, located approximately one to five miles below the Blewett Falls Development, also supported a very large amount of mussel biomass and accounted for 84 percent of all collected mussels within this reach. Eastern elliptio and Roanoke slabshell were the dominant components of the mussel community at these three transects. Generally, the mussel taxa composition was similar between the two river reaches. Creeper and Carolina creekshell were present in the river reach below the Tillery Development but absent from the river reach below the Blewett Falls Development during this survey. However, the creeper was found in the river reach below the Blewett Falls Development during previous mussel surveys conducted by North Carolina resource agencies from 1987 to 2001 and by The Nature Conservancy during its 2004 survey. The Pee Dee lance and Carolina slabshell were only found in the river reach below the Blewett Falls Development. All of these mussel taxa were collected in low numbers, and three of the taxa had conservation listing status. The Waccamaw spike, tidewater mucket, and Southern rainbow were also collected from Reach 2 during surveys conducted by The Nature Conservancy during 2004 and 2005. The collection of Waccamaw spike in the lower Pee Dee River represented a new range extension for this species. Mussel taxa richness and abundance was much greater in the mainstem Pee Dee River than the tributaries. Mussels were only collected in 7 of the 14 transects sampled in tributaries associated with both hydroelectric developments. The Little River, Uwharrie River, and Mountain Creek (Blewett Falls Lake) supported the greatest number of mussels, including rare species. The notched rainbow was only collected from the Uwharrie River during this study. Mussels were either absent or reduced in abundance at transects sampled in Clarks Creek, Rocky River, and Cedar Creek which are tributaries within Reach 1. Mussels were also noticeably absent or reduced in abundance at transects sampled in the major tributaries of Reach 2 located below the Blewett Falls Development. In summary, the fish and mussel communities in the mainstem Pee Dee River below the Tillery Development were less diverse and not as abundant as those communities observed below the Blewett Hydroelectric Plant, even when considering watershed drainage area size and physiographic regional differences. Survey results also showed effects to both fish and mussel communities in the river reach below the Tillery Development due to degraded water quality from the Rocky River, and to a lesser extent, Brown Creek. Approximately 7 to 12 miles of river was potentially affected by the degraded water quality in this reach. These effects were manifested in lower species richness, total organism abundance, and increased abundance of certain pollution-tolerant species (particularly the fish community). The degree of effect varied between the fish and mussel communities with recovery observed in the mussel community located downstream of the Brown Creek confluence when compared to the fish community response.

7-1
Section 7 - References Bogan, A.E. 2002. Workbook and key to freshwater bivalves of North Carolina. North Carolina
Museum of Natural Sciences, Raleigh, North Carolina. Bogan, A.E., and J. Alderman. 2004. Workbook and key to the freshwater bivalves of South
Carolina, North Carolina Museum of Natural Sciences, Raleigh, North Carolina. Bain, M.B., and V.H. Travnichek. 1996. Assessing impacts and predicting restoration benefits of
flow alterations in rivers developed for hydroelectric power production. Pages B543-B552 in M. Leclerc, H. Capra, S. Valentin, A. Boudreault, and Y. Côté (editors). Proceedings of the second IAHR Symposium on Habitat Hydraulics, Ecohydraulics 2000.
Karr, J. R. 1981. Assessment of biotic integrity using fish communities. Fisheries. 6:21-27. Karr, J.R., K.D. Fausch, P L. Angermeier, P. R. Yant, I. J. Schlosser. 1986. Assessing biological
integrity in running waters A method and its rationale. Illinois Natural History Survey Special Publication 5, September 1986, Champaign, IL.
LeGrand, H.E., Jr., S.E. McRae, S.P. Hall, and J.T. Finnegan. 2004. Natural heritage program list
of the rare animal species of North Carolina. North Carolina Department of Environment and Natural Resources, North Carolina Natural Heritage Program, Division of Parks and Recreation, Raleigh, North Carolina.
MacMahon, T.E., A.V. Zale, and D.J. Orth. 1996. Aquatic habitat measurements. Pages 83-120 in
B.R. Murphy and D. W. Willis (eds.). Fisheries techniques. 2nd edition. American Fisheries Society, Bethesda, Maryland.
North Carolina Division of Water Quality. 2001. Standard operating procedure biological
monitoring. Stream fish community assessment & fish tissue. North Carolina Department of Environment and Natural Resources, Division of Water Quality, March 14, 2001.
Nelson, J.S., E.J. Crossman, H. Espinsoa-Pérez, L T. Findley, C. R. Gilbert, R. N. Lea, and J. D.
Williams. 2004. Common and scientific names of fishes from the United States, Canada, and Mexico. American Fisheries Society, Special Publication 29, Bethesda, Maryland.
Progress Energy. 2003. Initial Consultation Document. Yadkin-Pee Dee River Project FERC No.
2206. February 2003. Progress Energy, Raleigh, North Carolina. ――. 2004a. Yadkin-Pee Dee Hydroelectric Project No. 2206. RWG meeting summary notes,
templates, and study plans. January 2004. ―― 2004b. Biology Program Procedures Manual. Progress Energy Carolinas, Inc., Raleigh,
North Carolina. ――. 2004c. Biology Program Quality Assurance Manual. Progress Energy Carolinas, Inc.,
Raleigh, North Carolina.
Section 7 References
7-2
Starnes, W.C. 2004. Results of distributional surveys and preliminary genetic investigations for the
Carolina redhorse (Moxostoma sp.)--an interim report. Submitted by Wayne C. Starnes, Ph.D, North Carolina State Museum of Natural Sciences. Submitted to Progress Energy Corporation, New Hill, North Carolina. February 17, 2004.
――. 2005. Fisheries survey of the Pee Dee National Wildlife Refuge. Investigations of Brown
Creek and associated tributaries and the Pee Dee River. U.S. Fish & Wildlife Service Challenge Cost-Share Agreement Number 1448-40181-02-G-251. Performed for the U.S. Fish & Wildlife Service, Pee Dee National Wildlife Refuge. Performed by Progress Energy Carolinas, Inc. March 2005.
South Carolina Department of Natural Resources. 2003. South Carolina Natural Heritage Program.
Online. [URL]: www.dnr.state.sc.us/pls/heritage/county_species.list. (Accessed January 13, 2005.)
The Catena Group. 2006. Freshwater mussel surveys of the Pee Dee River Basin in South Carolina.
Prepared for The Nature Conservancy-South Carolina Chapter. Prepared by The Catena Group, Hillsborough, North Carolina, January 8, 2006.

APPENDICES

APPENDIX A
SUMMARY CATCH DATA BY SAMPLE LOCATION AND GEAR TYPE
FOR THE SHALLOW WATER FISH SURVEY CONDUCTED IN THE PEE
DEE RIVER BELOW THE TILLERY AND BLEWETT FALLS
DEVELOPMENTS DURING APRIL-JUNE 2004
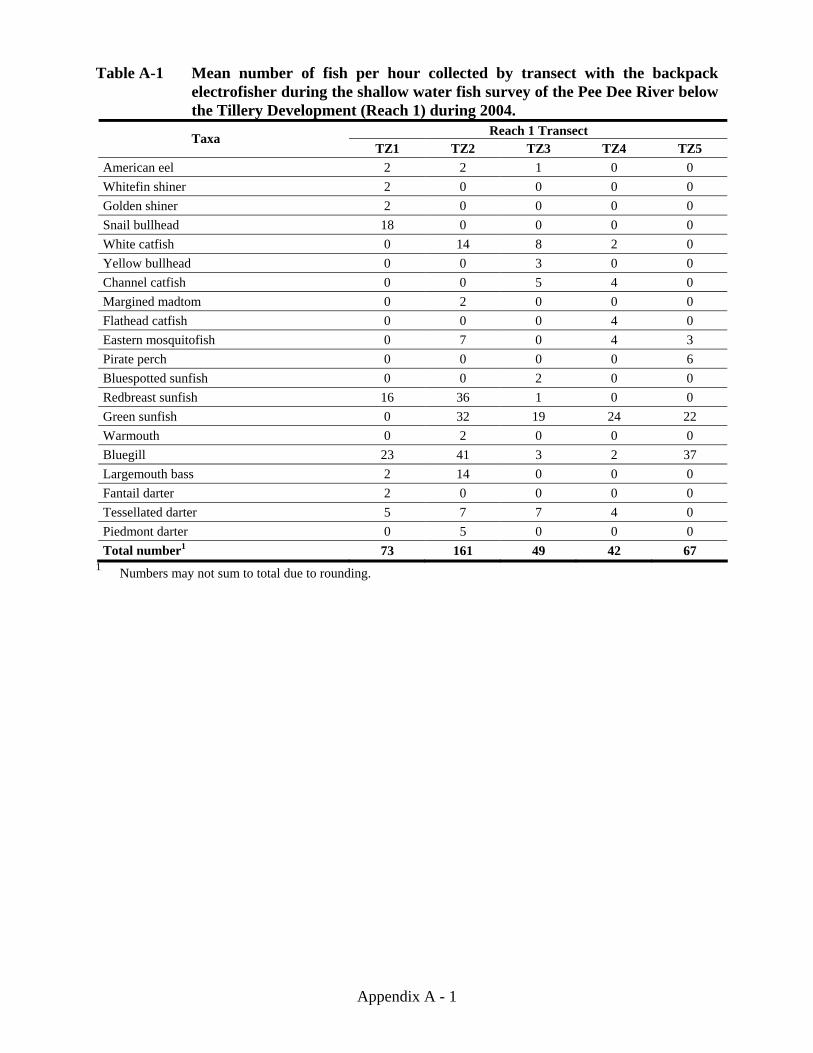
Appendix A - 1
Table A-1 Mean number of fish per hour collected by transect with the backpack electrofisher during the shallow water fish survey of the Pee Dee River below the Tillery Development (Reach 1) during 2004.
Reach 1 Transect Taxa TZ1 TZ2 TZ3 TZ4 TZ5
American eel 2 2 1 0 0 Whitefin shiner 2 0 0 0 0 Golden shiner 2 0 0 0 0 Snail bullhead 18 0 0 0 0 White catfish 0 14 8 2 0 Yellow bullhead 0 0 3 0 0 Channel catfish 0 0 5 4 0 Margined madtom 0 2 0 0 0 Flathead catfish 0 0 0 4 0 Eastern mosquitofish 0 7 0 4 3 Pirate perch 0 0 0 0 6 Bluespotted sunfish 0 0 2 0 0 Redbreast sunfish 16 36 1 0 0 Green sunfish 0 32 19 24 22 Warmouth 0 2 0 0 0 Bluegill 23 41 3 2 37 Largemouth bass 2 14 0 0 0 Fantail darter 2 0 0 0 0 Tessellated darter 5 7 7 4 0 Piedmont darter 0 5 0 0 0 Total number1 73 161 49 42 67
1 Numbers may not sum to total due to rounding.
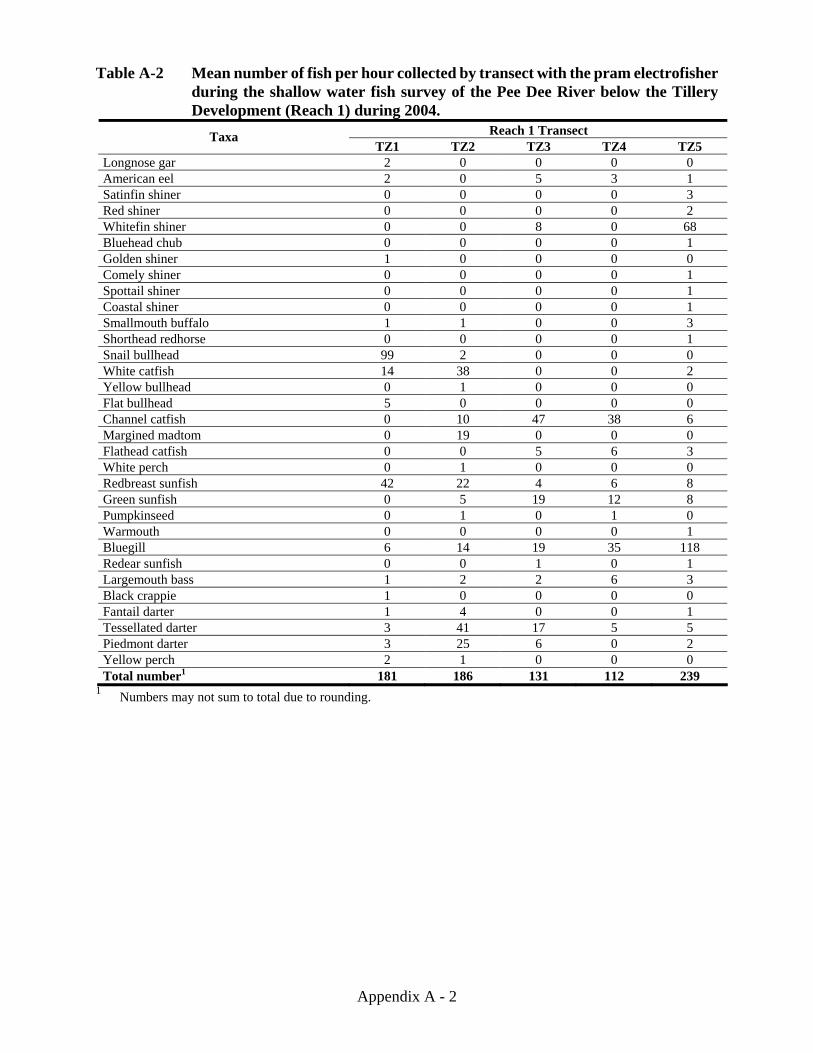
Appendix A - 2
Table A-2 Mean number of fish per hour collected by transect with the pram electrofisher during the shallow water fish survey of the Pee Dee River below the Tillery Development (Reach 1) during 2004.
Reach 1 Transect Taxa TZ1 TZ2 TZ3 TZ4 TZ5
Longnose gar 2 0 0 0 0 American eel 2 0 5 3 1 Satinfin shiner 0 0 0 0 3 Red shiner 0 0 0 0 2 Whitefin shiner 0 0 8 0 68 Bluehead chub 0 0 0 0 1 Golden shiner 1 0 0 0 0 Comely shiner 0 0 0 0 1 Spottail shiner 0 0 0 0 1 Coastal shiner 0 0 0 0 1 Smallmouth buffalo 1 1 0 0 3 Shorthead redhorse 0 0 0 0 1 Snail bullhead 99 2 0 0 0 White catfish 14 38 0 0 2 Yellow bullhead 0 1 0 0 0 Flat bullhead 5 0 0 0 0 Channel catfish 0 10 47 38 6 Margined madtom 0 19 0 0 0 Flathead catfish 0 0 5 6 3 White perch 0 1 0 0 0 Redbreast sunfish 42 22 4 6 8 Green sunfish 0 5 19 12 8 Pumpkinseed 0 1 0 1 0 Warmouth 0 0 0 0 1 Bluegill 6 14 19 35 118 Redear sunfish 0 0 1 0 1 Largemouth bass 1 2 2 6 3 Black crappie 1 0 0 0 0 Fantail darter 1 4 0 0 1 Tessellated darter 3 41 17 5 5 Piedmont darter 3 25 6 0 2 Yellow perch 2 1 0 0 0 Total number1 181 186 131 112 239
1 Numbers may not sum to total due to rounding.

Appendix A - 3
Table A-3 Total number of fish collected by transect with seine hauls (n = 12) during the shallow water fish survey of the Pee Dee River below the Tillery Development (Reach 1) during 2004.
Reach 1 Transect Taxa
TZ1 TZ2 TZ3 TZ4 TZ5
Satinfin shiner 0 0 0 0 30
Red shiner 0 0 0 0 19
Whitefin shiner 0 0 0 0 351
Bluehead chub 0 0 0 0 3
Comely shiner 0 0 0 0 1
Spottail shiner 0 0 0 0 1
Redhorse species 0 0 0 0 11
Snail bullhead 3 0 0 0 0
Eastern mosquitofish 0 0 0 0 2
Bluegill 0 0 0 0 1
Redear sunfish 0 0 0 0 1
Tessellated darter 0 4 0 0 5
Piedmont darter 0 1 0 0 0
Total number 3 5 0 0 425
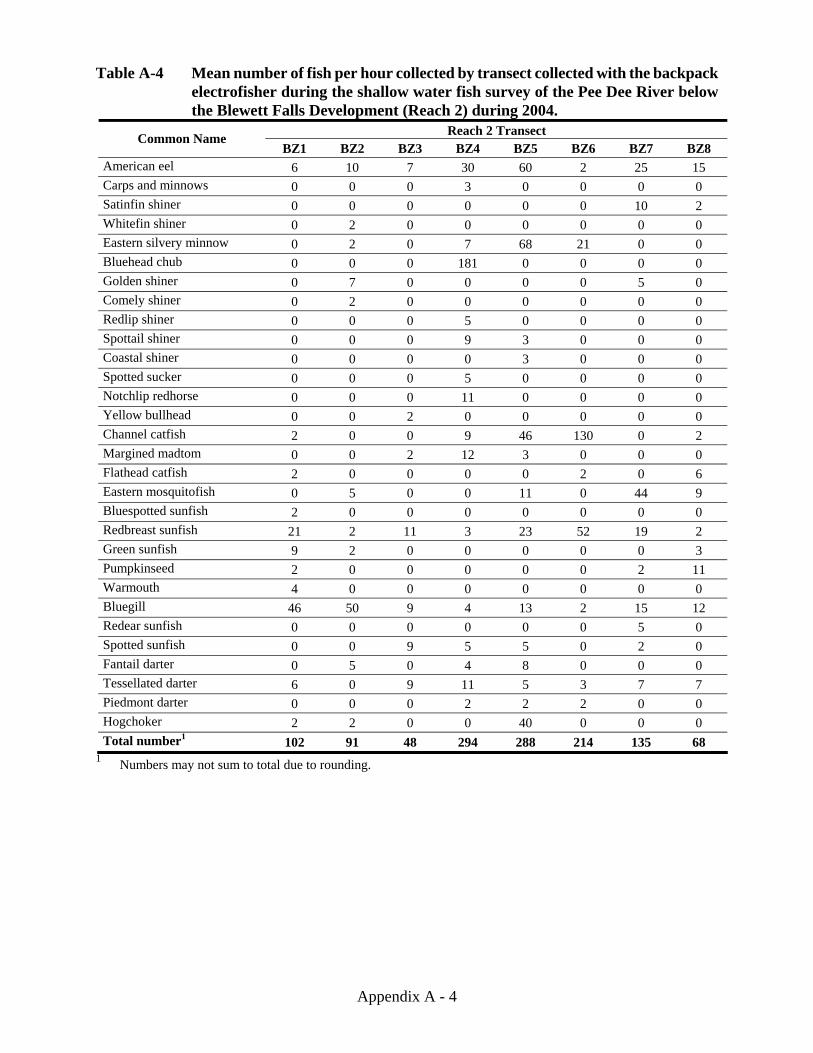
Appendix A - 4
Table A-4 Mean number of fish per hour collected by transect collected with the backpack electrofisher during the shallow water fish survey of the Pee Dee River below the Blewett Falls Development (Reach 2) during 2004.
Reach 2 Transect Common Name BZ1 BZ2 BZ3 BZ4 BZ5 BZ6 BZ7 BZ8
American eel 6 10 7 30 60 2 25 15 Carps and minnows 0 0 0 3 0 0 0 0 Satinfin shiner 0 0 0 0 0 0 10 2 Whitefin shiner 0 2 0 0 0 0 0 0 Eastern silvery minnow 0 2 0 7 68 21 0 0 Bluehead chub 0 0 0 181 0 0 0 0 Golden shiner 0 7 0 0 0 0 5 0 Comely shiner 0 2 0 0 0 0 0 0 Redlip shiner 0 0 0 5 0 0 0 0 Spottail shiner 0 0 0 9 3 0 0 0 Coastal shiner 0 0 0 0 3 0 0 0 Spotted sucker 0 0 0 5 0 0 0 0 Notchlip redhorse 0 0 0 11 0 0 0 0 Yellow bullhead 0 0 2 0 0 0 0 0 Channel catfish 2 0 0 9 46 130 0 2 Margined madtom 0 0 2 12 3 0 0 0 Flathead catfish 2 0 0 0 0 2 0 6 Eastern mosquitofish 0 5 0 0 11 0 44 9 Bluespotted sunfish 2 0 0 0 0 0 0 0 Redbreast sunfish 21 2 11 3 23 52 19 2 Green sunfish 9 2 0 0 0 0 0 3 Pumpkinseed 2 0 0 0 0 0 2 11 Warmouth 4 0 0 0 0 0 0 0 Bluegill 46 50 9 4 13 2 15 12 Redear sunfish 0 0 0 0 0 0 5 0 Spotted sunfish 0 0 9 5 5 0 2 0 Fantail darter 0 5 0 4 8 0 0 0 Tessellated darter 6 0 9 11 5 3 7 7 Piedmont darter 0 0 0 2 2 2 0 0 Hogchoker 2 2 0 0 40 0 0 0 Total number1 102 91 48 294 288 214 135 68
1 Numbers may not sum to total due to rounding.

Appendix A - 5
Table A-5 Mean number of fish per hour collected by transect with the pram electrofisher during the shallow water fish survey of the Pee Dee River below the Blewett Falls Development (Reach 2) during 2004.
Reach 2 Transect Common Name BZ1 BZ2 BZ3 BZ4 BZ5 BZ6 BZ7 BZ8
Longnose gar 1 1 2 0 0 0 0 0 American eel 34 46 124 168 132 48 35 99 Gizzard shad 2 0 0 0 0 0 0 0 Satinfin shiner 6 0 4 2 5 9 51 44 Red shiner 2 0 0 0 0 0 0 0 Whitefin shiner 13 18 8 1 3 4 42 7 Fieryblack shiner 0 1 0 0 0 0 1 3 Thinlip chub 0 0 0 0 0 0 1 0 Eastern silvery minnow 94 17 70 1 55 467 568 73 Bluehead chub 0 0 0 2 0 0 1 0 Golden shiner 1 1 1 0 < 1 0 0 1 Whitemouth shiner 0 0 0 0 0 1 0 0 Comely shiner 3 1 0 0 0 0 0 0 Spottail shiner 39 7 42 27 6 27 28 7 Coastal shiner 1 0 0 2 0 0 1 7 Sandbar shiner 1 0 0 0 0 0 0 0 Smallmouth buffalo 0 0 0 0 0 2 0 0 Spotted sucker 0 0 0 0 0 0 1 1 Shorthead redhorse 1 1 0 0 0 0 0 0 White catfish 0 0 1 0 0 0 0 0 Yellow bullhead 0 1 0 0 0 0 0 0 Channel catfish 26 12 5 30 61 49 4 10 Margined madtom 0 0 2 8 2 0 0 0 Flathead catfish 10 19 6 1 4 1 0 5 Atlantic needlefish 1 0 1 0 0 1 0 0 Eastern mosquitofish 8 0 0 0 0 0 2 7 Brook silverside 0 1 0 0 0 0 0 0 White perch 1 0 0 0 0 0 0 0 Redbreast sunfish 39 26 28 6 45 73 4 25 Green sunfish 2 1 0 2 1 0 0 0 Pumpkinseed 0 0 0 0 0 1 1 9 Warmouth 3 0 0 0 0 0 0 1 Bluegill 28 21 9 2 6 26 2 26 Redear sunfish 1 0 1 0 1 5 1 2 Spotted sunfish 0 1 3 5 9 10 0 2 Largemouth bass 1 1 1 < 1 0 6 4 4 Fantail darter 2 6 28 48 10 4 0 1 Tessellated darter 13 5 6 77 10 17 12 13 Piedmont darter 17 1 1 41 6 3 0 1 Striped mullet 4 10 10 1 0 0 0 4 Hogchoker 1 0 1 2 6 14 30 11 Total number1 352 194 354 426 362 767 788 362
1 Numbers may not sum to total due to rounding.
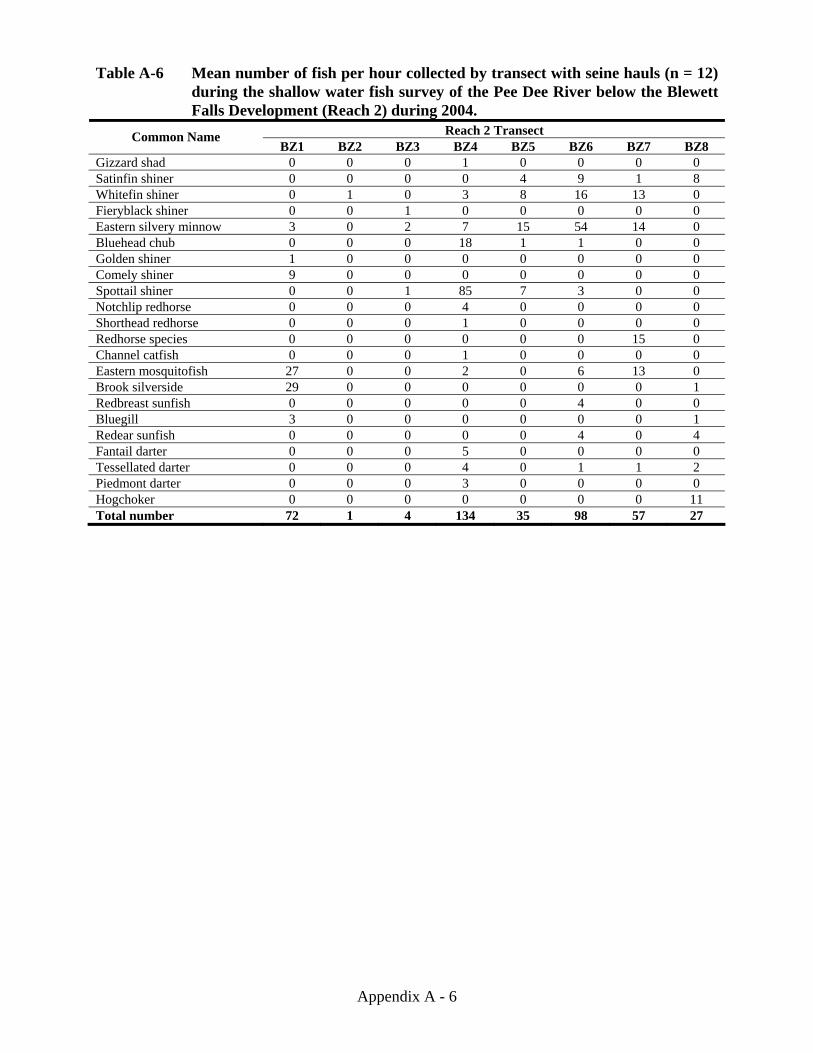
Appendix A - 6
Table A-6 Mean number of fish per hour collected by transect with seine hauls (n = 12) during the shallow water fish survey of the Pee Dee River below the Blewett Falls Development (Reach 2) during 2004.
Reach 2 Transect Common Name BZ1 BZ2 BZ3 BZ4 BZ5 BZ6 BZ7 BZ8
Gizzard shad 0 0 0 1 0 0 0 0 Satinfin shiner 0 0 0 0 4 9 1 8 Whitefin shiner 0 1 0 3 8 16 13 0 Fieryblack shiner 0 0 1 0 0 0 0 0 Eastern silvery minnow 3 0 2 7 15 54 14 0 Bluehead chub 0 0 0 18 1 1 0 0 Golden shiner 1 0 0 0 0 0 0 0 Comely shiner 9 0 0 0 0 0 0 0 Spottail shiner 0 0 1 85 7 3 0 0 Notchlip redhorse 0 0 0 4 0 0 0 0 Shorthead redhorse 0 0 0 1 0 0 0 0 Redhorse species 0 0 0 0 0 0 15 0 Channel catfish 0 0 0 1 0 0 0 0 Eastern mosquitofish 27 0 0 2 0 6 13 0 Brook silverside 29 0 0 0 0 0 0 1 Redbreast sunfish 0 0 0 0 0 4 0 0 Bluegill 3 0 0 0 0 0 0 1 Redear sunfish 0 0 0 0 0 4 0 4 Fantail darter 0 0 0 5 0 0 0 0 Tessellated darter 0 0 0 4 0 1 1 2 Piedmont darter 0 0 0 3 0 0 0 0 Hogchoker 0 0 0 0 0 0 0 11 Total number 72 1 4 134 35 98 57 27
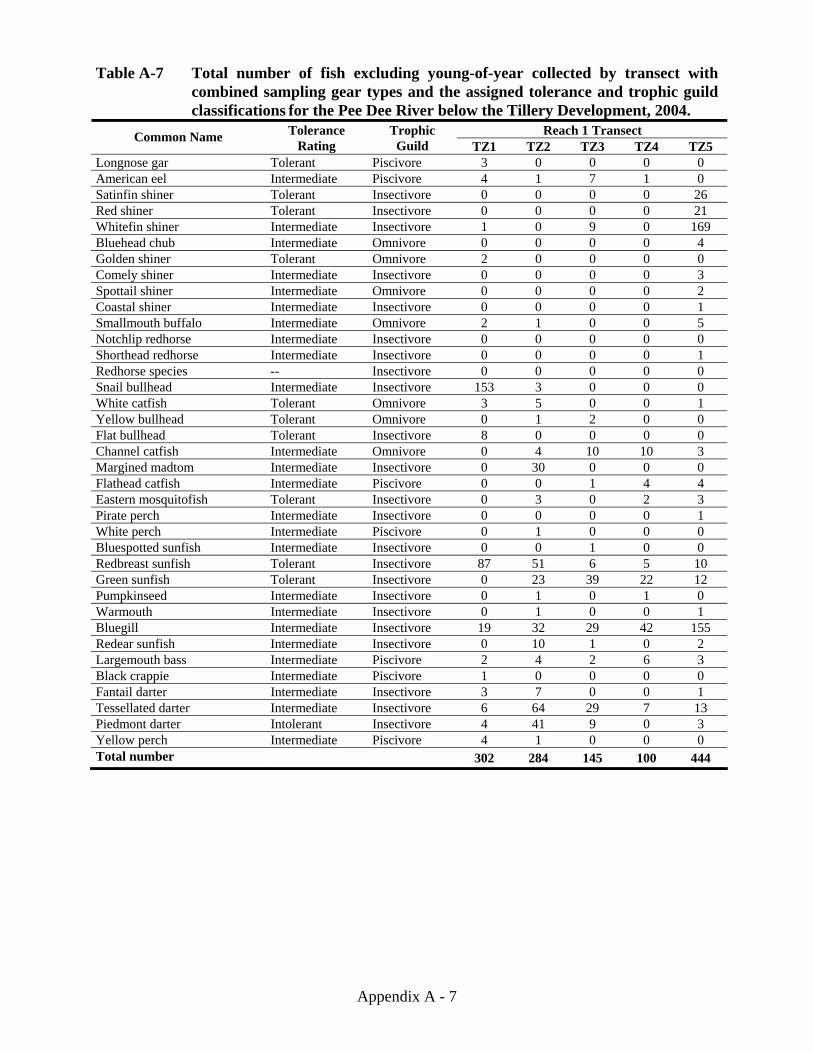
Appendix A - 7
Table A-7 Total number of fish excluding young-of-year collected by transect with combined sampling gear types and the assigned tolerance and trophic guild classifications for the Pee Dee River below the Tillery Development, 2004.
Reach 1 Transect Common Name Tolerance Rating
Trophic Guild TZ1 TZ2 TZ3 TZ4 TZ5
Longnose gar Tolerant Piscivore 3 0 0 0 0 American eel Intermediate Piscivore 4 1 7 1 0 Satinfin shiner Tolerant Insectivore 0 0 0 0 26 Red shiner Tolerant Insectivore 0 0 0 0 21 Whitefin shiner Intermediate Insectivore 1 0 9 0 169 Bluehead chub Intermediate Omnivore 0 0 0 0 4 Golden shiner Tolerant Omnivore 2 0 0 0 0 Comely shiner Intermediate Insectivore 0 0 0 0 3 Spottail shiner Intermediate Omnivore 0 0 0 0 2 Coastal shiner Intermediate Insectivore 0 0 0 0 1 Smallmouth buffalo Intermediate Omnivore 2 1 0 0 5 Notchlip redhorse Intermediate Insectivore 0 0 0 0 0 Shorthead redhorse Intermediate Insectivore 0 0 0 0 1 Redhorse species -- Insectivore 0 0 0 0 0 Snail bullhead Intermediate Insectivore 153 3 0 0 0 White catfish Tolerant Omnivore 3 5 0 0 1 Yellow bullhead Tolerant Omnivore 0 1 2 0 0 Flat bullhead Tolerant Insectivore 8 0 0 0 0 Channel catfish Intermediate Omnivore 0 4 10 10 3 Margined madtom Intermediate Insectivore 0 30 0 0 0 Flathead catfish Intermediate Piscivore 0 0 1 4 4 Eastern mosquitofish Tolerant Insectivore 0 3 0 2 3 Pirate perch Intermediate Insectivore 0 0 0 0 1 White perch Intermediate Piscivore 0 1 0 0 0 Bluespotted sunfish Intermediate Insectivore 0 0 1 0 0 Redbreast sunfish Tolerant Insectivore 87 51 6 5 10 Green sunfish Tolerant Insectivore 0 23 39 22 12 Pumpkinseed Intermediate Insectivore 0 1 0 1 0 Warmouth Intermediate Insectivore 0 1 0 0 1 Bluegill Intermediate Insectivore 19 32 29 42 155 Redear sunfish Intermediate Insectivore 0 10 1 0 2 Largemouth bass Intermediate Piscivore 2 4 2 6 3 Black crappie Intermediate Piscivore 1 0 0 0 0 Fantail darter Intermediate Insectivore 3 7 0 0 1 Tessellated darter Intermediate Insectivore 6 64 29 7 13 Piedmont darter Intolerant Insectivore 4 41 9 0 3 Yellow perch Intermediate Piscivore 4 1 0 0 0 Total number 302 284 145 100 444

Appendix A - 8
Table A-8 Total number of fish excluding young-of-year collected by transect with combined sampling gear types and the assigned tolerance and trophic guild classifications for the Pee Dee River below the Blewett Falls Development, 2004.
Reach 2 Transect Common Name Tolerance Rating
Trophic Guild BZ1 BZ2 BZ3 BZ4 BZ5 BZ6 BZ7 BZ8
Longnose gar Tolerant Piscivore 2 1 3 0 0 0 0 0 American eel Intermediate Piscivore 49 81 159 94 76 12 5 42 Gizzard shad Intermediate Herbivore 3 0 0 0 0 0 0 0 Carps and minnows -- -- 0 0 0 0 0 0 0 0 Satinfin shiner Tolerant Insectivore 8 0 6 5 11 21 69 70 Red shiner Tolerant Insectivore 3 0 0 0 0 0 0 0 Whitefin shiner Intermediate Insectivore 19 38 11 6 12 22 56 10 Fieryblack shiner Intolerant Insectivore 0 2 1 0 0 0 1 4 Thinlip chub Intolerant Insectivore 0 0 0 0 0 0 1 0 Eastern silvery minnow Intermediate Herbivore 154 36 109 11 156 463 272 112 Bluehead chub Intermediate Omnivore 0 0 0 2 1 1 0 0 Golden shiner Tolerant Omnivore 3 4 2 0 1 0 1 1 Whitemouth shiner Intermediate Insectivore 0 0 0 0 0 1 0 0 Comely shiner Intermediate Insectivore 9 1 0 0 0 0 0 0 Redlip shiner Intermediate Insectivore 0 0 0 0 0 0 0 0 Spottail shiner Intermediate Omnivore 51 14 67 37 14 42 35 9 Coastal shiner Intermediate Insectivore 1 0 0 4 1 0 1 10 Sandbar shiner Intermediate Insectivore 2 0 0 0 0 0 0 0 Smallmouth buffalo Intermediate Omnivore 0 0 0 0 0 2 0 0 Spotted sucker Intermediate Insectivore 0 0 0 0 0 0 1 1 Notchlip redhorse Intermediate Insectivore 0 0 0 0 0 0 0 0 Shorthead redhorse Intermediate Insectivore 2 1 0 0 0 0 0 0 Redhorse species -- Insectivore 0 0 0 0 0 0 0 0 White catfish Tolerant Omnivore 0 0 0 0 0 0 0 0 Yellow bullhead Tolerant Omnivore 0 1 1 0 0 0 0 0 Channel catfish Intermediate Omnivore 23 19 6 59 20 13 3 4 Margined madtom Intermediate Insectivore 0 0 4 17 4 0 0 0 Flathead catfish Intermediate Piscivore 3 14 6 2 3 1 0 8 Atlantic needlefish -- Piscivore 2 0 2 0 0 1 0 0 Eastern mosquitofish Tolerant Insectivore 41 2 0 1 4 6 33 17 Brook silverside Intermediate Insectivore 25 1 0 0 0 0 0 0 White perch Intermediate Piscivore 1 0 0 0 0 0 0 0 Bluespotted sunfish Intermediate Insectivore 1 0 0 0 0 0 0 0 Redbreast sunfish Tolerant Insectivore 81 43 51 11 80 105 9 37 Green sunfish Tolerant Insectivore 8 2 0 2 1 0 0 2 Pumpkinseed Intermediate Insectivore 1 0 0 0 0 1 3 15 Warmouth Intermediate Insectivore 7 0 0 0 0 0 0 1 Bluegill Intermediate Insectivore 62 62 19 8 14 29 6 44 Redear sunfish Intermediate Insectivore 1 0 1 0 2 10 2 7 Spotted sunfish Intermediate Insectivore 0 1 9 10 18 10 1 3 Largemouth bass Intermediate Piscivore 1 2 1 1 0 6 5 5 Fantail darter Intermediate Insectivore 3 15 47 88 27 4 0 1 Tessellated darter Intermediate Insectivore 26 7 13 70 24 24 16 22 Piedmont darter Intolerant Insectivore 29 3 1 76 13 3 0 1 Striped mullet -- Omnivore 6 21 18 1 0 0 0 6 Hogchoker -- Insectivore 1 0 0 4 2 3 16 5 Total number 628 371 537 509 484 780 536 437

Appendix A - 9
Table A-9 Water quality data collected during the mussel surveys of Reaches 1 and 2 of the Pee Dee River and associated tributaries at the Blewett Falls and Tillery Developments, June-October 2004.
Transect Location Temperature (ºC)
Dissolved Oxygen (mg/L)
Conductivity (μS/cm) pH Turbidity
(NTU)
TZ1 Below N.C. Highway 731 Bridge 21.2 5.5 100 7.9 2.0
TZ2 Shoal above Rocky River confluence 24.2 9.6 89 7.6 3.7
TZ3 Buzzard Island shoal 27.3 6.1 117 7.1 13.0
TZ4 Shoal below N.C. Highway 109 Bridge 26.5 5.7 117 7.9 13.0
TZ5 Shoal above Blewett Falls Lake 26.5 5.9 97 7.5 14.0 TZ TRB1 Clark's Creek 24.5 7.6 77 7.2 12.0 TZ TRB2 Rocky River 19.7 9.1 181 7.5 9.4 TZ TRB4 Little River 27.7 6.4 106 7.2 4.8 TZ TRB5 Cedar Creek 20.9 1.5 135 7.0 22.0 TYLAKE1 Uwharrie River 17.7 13.9 89 7.8 5.7 TYLAKE2 Mountain Creek 25.4 7.8 148 7.4 14.0 TYLAKE3 Jacobs Creek 23.1 8.8 155 7.9 7.5 BZ1 Big Island Shoal 29.2 6.1 124 7.0 9.8
BZ1A Shoal above U.S. Highway 74 Bridge 28.4 5.3 116 7.1 16.0
BZ2 Hitchcock Creek shoal 28.6 4.8 113 7.1 13.0 BZ3 Jones Creek shoal 27.2 5.0 115 7.4 16.0 BZ4 Great Island Shoal 26.4 7.3 107 7.5 2.3 BZ5 Shoal Above U.S. Highway 1 28.1 8.8 108 9.2 5.5 BZ TRB1 Cartledge Creek 26.4 5.9 117 7.0 11.0 BZ TRB2 Island Creek 25.4 7.7 65 7.2 17.0 BZ TRB3 Hitchcock Creek 23.5 6.5 24 6.1 14.0 BZ TRB4 Jones Creek 24.7 6.3 97 7.4 1.2 BZ TRB5 Westfield Creek 24.5 7.8 71 6.8 11.0 BFLAKE1 Mountain Creek 23.3 7.9 67 7.5 12.0 BFLAKE2 Buffalo Creek 24.6 7.7 127 7.3 12.0

APPENDIX B
LENGTH-FREQUENCY DATA FOR MUSSEL TAXA COLLECTED BY
RIVER REACH FOR THE SHALLOW WATER MUSSEL SURVEY
CONDUCTED IN THE PEE DEE RIVER BELOW THE TILLERY AND
BLEWETT FALLS DEVELOPMENTS DURING 2004

Appendix B - 1
TZ1 Elliptio angustata n = 100
05
101520253035
0 10 20 30 40 50 60 70 80 90 100 110 120 130 140 150 160 170 180Length (mm)
Num
ber
TZ2 Elliptio angustata n = 102
05
101520253035
0 10 20 30 40 50 60 70 80 90 100 110 120 130 140 150 160 170 180Length (mm)
Num
ber
TZ3 Elliptio angustata n = 3
05
101520253035
0 10 20 30 40 50 60 70 80 90 100 110 120 130 140 150 160 170 180Length (mm)
Num
ber
TZ4 Elliptio angustata n = 48
05
101520253035
0 10 20 30 40 50 60 70 80 90 100 110 120 130 140 150 160 170 180Length (mm)
Num
ber
Figure B-1 Length frequency histograms of Elliptio angustata (n = ≥ 3 individuals with
sample size shown above each histogram) collected from stations in Reach 1 of the Pee Dee River below the Tillery Development from June 14 to August 21, 2004.

Appendix B - 2
TZ1 Elliptio complanata n = 100
05
101520253035
0 10 20 30 40 50 60 70 80 90 100 110 120 130 140 150 160 170 180Length (mm)
Num
ber
TZ2 Elliptio complanata n = 106
05
101520253035
0 10 20 30 40 50 60 70 80 90 100 110 120 130 140 150 160 170 180Length (mm)
Num
ber
TZ3 Elliptio complanata n = 3
05
101520253035
0 10 20 30 40 50 60 70 80 90 100 110 120 130 140 150 160 170 180Length (mm)
Num
ber
TZ4 Elliptio complanata n = 117
05
101520253035
0 10 20 30 40 50 60 70 80 90 100 110 120 130 140 150 160 170 180Length (mm)
Num
ber
TZ TRB4 Elliptio complanata n = 97
05
101520253035
0 10 20 30 40 50 60 70 80 90 100 110 120 130 140 150 160 170 180Length (mm)
Num
ber
TZ5 Elliptio complanata n = 83
05
101520253035
0 10 20 30 40 50 60 70 80 90 100 110 120 130 140 150 160 170 180Length (mm)
Num
ber
TZ TRB4 Elliptio complanata n = 97
05
101520253035
0 10 20 30 40 50 60 70 80 90 100 110 120 130 140 150 160 170 180Length (mm)
Num
ber
TZ5 Elliptio complanata n = 83
05
101520253035
0 10 20 30 40 50 60 70 80 90 100 110 120 130 140 150 160 170 180Length (mm)
Num
ber
Figure B-2 Length frequency histograms of Elliptio complanata (n = ≥ 3 individuals with
sample size shown above each histogram) collected from stations in Reach 1 of the Pee Dee River and the Little River below the Tillery Development from June 14 to August 21, 2004.

Appendix B - 3
TZ3 Elliptio roanokensis n = 24
05
101520253035
0 10 20 30 40 50 60 70 80 90 100 110 120 130 140 150 160 170 180Length (mm)
Num
ber
TZ4 Elliptio roanokensis n = 100
05
101520253035
0 10 20 30 40 50 60 70 80 90 100 110 120 130 140 150 160 170 180Length (mm)
Num
ber
TZ5 Elliptio roanokensis n = 84
05
101520253035
0 10 20 30 40 50 60 70 80 90 100 110 120 130 140 150 160 170 180Length (mm)
Num
ber
TZ3 Elliptio roanokensis n = 24
05
101520253035
0 10 20 30 40 50 60 70 80 90 100 110 120 130 140 150 160 170 180Length (mm)
Num
ber
TZ4 Elliptio roanokensis n = 100
05
101520253035
0 10 20 30 40 50 60 70 80 90 100 110 120
TZ3 Elliptio roanokensis n = 24
05
101520253035
0 10 20 30 40 50 60 70 80 90 100 110 120 130 140 150 160 170 180Length (mm)
Num
ber
TZ4 Elliptio roanokensis n = 100
05
101520253035
0 10 20 30 40 50 60 70 80 90 100 110 120 130 140 150 160 170 180Length (mm)
Num
ber
TZ5 Elliptio roanokensis n = 84
05
101520253035
0 10 20 30 40 50 60 70 80 90 100 110 120 130 140 150 160 170 180Length (mm)
Num
ber
Figure B-3 Length frequency histograms of Elliptio roanokensis collected from stations
(n = ≥ 3 individuals with sample size shown above each histogram) in Reach 1 of the Pee Dee River below the Tillery Development from June 14 to August 21, 2004.
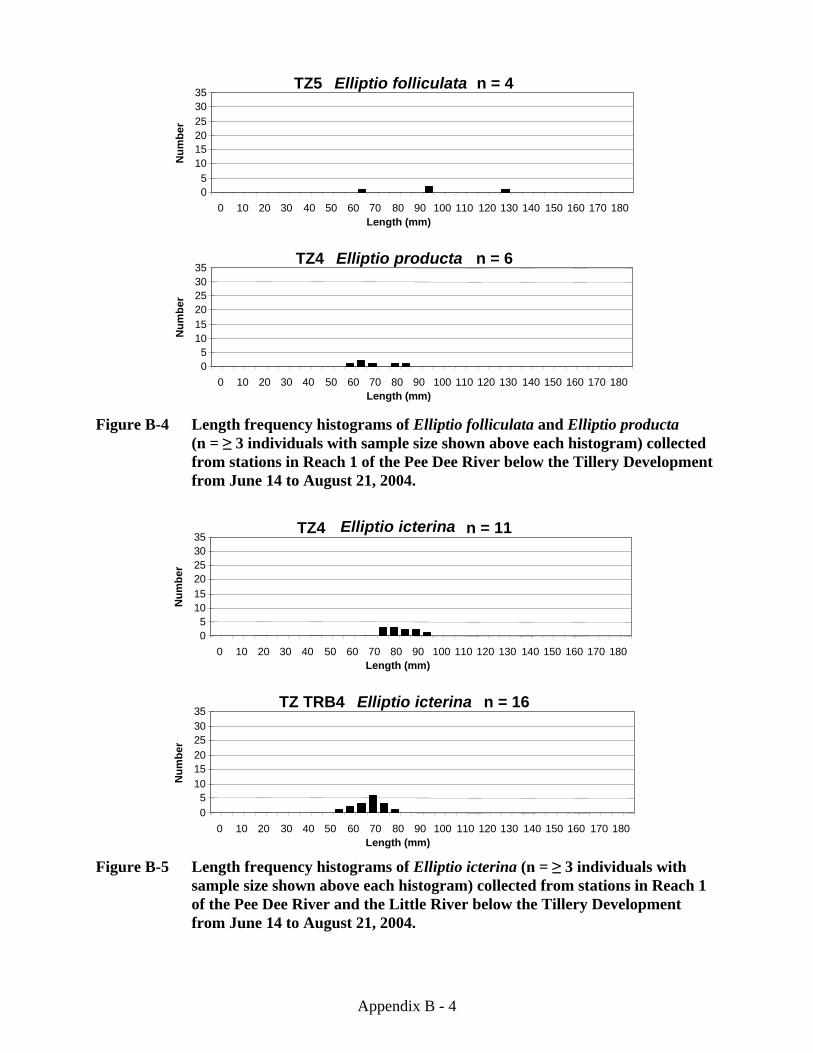
Appendix B - 4
TZ4 Elliptio producta n = 6
05
101520253035
0 10 20 30 40 50 60 70 80 90 100 110 120 130 140 150 160 170 180Length (mm)
Num
ber
TZ5 Elliptio folliculata n = 4
05
101520253035
0 10 20 30 40 50 60 70 80 90 100 110 120 130 140 150 160 170 180Length (mm)
Num
ber
TZ4 Elliptio producta n = 6
05
101520253035
0 10 20 30 40 50 60 70 80 90 100 110 120 130 140 150 160 170 180Length (mm)
Num
ber
TZ5 Elliptio folliculata n = 4
05
101520253035
0 10 20 30 40 50 60 70 80 90 100 110 120 130 140 150 160 170 180Length (mm)
Num
ber
Figure B-4 Length frequency histograms of Elliptio folliculata and Elliptio producta
(n = ≥ 3 individuals with sample size shown above each histogram) collected from stations in Reach 1 of the Pee Dee River below the Tillery Development from June 14 to August 21, 2004.
TZ TRB4 Elliptio icterina n = 16
05
101520253035
0 10 20 30 40 50 60 70 80 90 100 110 120 130 140 150 160 170 180Length (mm)
Num
ber
TZ4 Elliptio icterina n = 11
05
101520253035
0 10 20 30 40 50 60 70 80 90 100 110 120 130 140 150 160 170 180Length (mm)
Num
ber
TZ TRB4 Elliptio icterina n = 16
05
101520253035
0 10 20 30 40 50 60 70 80 90 100 110 120 130 140 150 160 170 180Length (mm)
Num
ber
TZ4 Elliptio icterina n = 11
05
101520253035
0 10 20 30 40 50 60 70 80 90 100 110 120 130 140 150 160 170 180Length (mm)
Num
ber
Figure B-5 Length frequency histograms of Elliptio icterina (n = ≥ 3 individuals with
sample size shown above each histogram) collected from stations in Reach 1 of the Pee Dee River and the Little River below the Tillery Development from June 14 to August 21, 2004.

Appendix B - 5
TZ TRB4 Lampsilis cariosa n = 3
05
101520253035
0 10 20 30 40 50 60 70 80 90 100 110 120 130 140 150 160 170 180Length (mm)
Num
ber
TZ5 Lampsilis cariosa n = 6
05
101520253035
0 10 20 30 40 50 60 70 80 90 100 110 120 130 140 150 160 170 180Length (mm)
Num
ber
TZ TRB4 Lampsilis cariosa n = 3
05
101520253035
0 10 20 30 40 50 60 70 80 90 100 110 120 130 140 150 160 170 180Length (mm)
Num
ber
TZ5 Lampsilis cariosa n = 6
05
101520253035
0 10 20 30 40 50 60 70 80 90 100 110 120 130 140 150 160 170 180Length (mm)
Num
ber
Figure B-6 Length frequency histograms of Lampsilis cariosa (n = ≥ 3 individuals with
sample size shown above each histogram) collected from stations in Reach 1 of the Pee Dee River below the Tillery Development from June 14 to August 21, 2004.
TZ1 Lampsilis radiata n = 27
05
101520253035
0 10 20 30 40 50 60 70 80 90 100 110 120 130 140 150 160 170 180Length (mm)
Num
ber
TZ TRB4 Lampsilis radiata n = 3
05
101520253035
0 10 20 30 40 50 60 70 80 90 100 110 120 130 140 150 160 170 180Length (mm)
Num
ber
TZ1 Lampsilis radiata n = 27
05
101520253035
0 10 20 30 40 50 60 70 80 90 100 110 120 130 140 150 160 170 180Length (mm)
Num
ber
TZ TRB4 Lampsilis radiata n = 3
05
101520253035
0 10 20 30 40 50 60 70 80 90 100 110 120 130 140 150 160 170 180Length (mm)
Num
ber
Figure B-7 Length frequency histograms of Lampsilis radiata (n = ≥ 3 individuals with
sample size shown above each histogram) collected from stations having three or more individuals in Reach 1 of the Pee Dee River below the Tillery Development from June 14 to August 21, 2004.

Appendix B - 6
TZ1 Pyganodon cataracta n = 3
05
101520253035
0 10 20 30 40 50 60 70 80 90 100 110 120 130 140 150 160 170 180Length (mm)
Freq
uenc
y
TZ1 Villosa delumbis n = 10
05
101520253035
0 10 20 30 40 50 60 70 80 90 100 110 120 130 140 150 160 170 180Length (mm)
Freq
uenc
y
TZ1 Pyganodon cataracta n = 3
05
101520253035
0 10 20 30 40 50 60 70 80 90 100 110 120 130 140 150 160 170 180Length (mm)
Freq
uenc
y
TZ1 Villosa delumbis n = 10
05
101520253035
0 10 20 30 40 50 60 70 80 90 100 110 120 130 140 150 160 170 180Length (mm)
Freq
uenc
y
Figure B-8 Length frequency histograms of Pyganodon cataracta and Villosa delumbis
(n = ≥ 3 individuals with sample size shown above each histogram) collected from stations in Reach 1 of the Pee Dee River below the Tillery Development from June 14 to August 21, 2004.
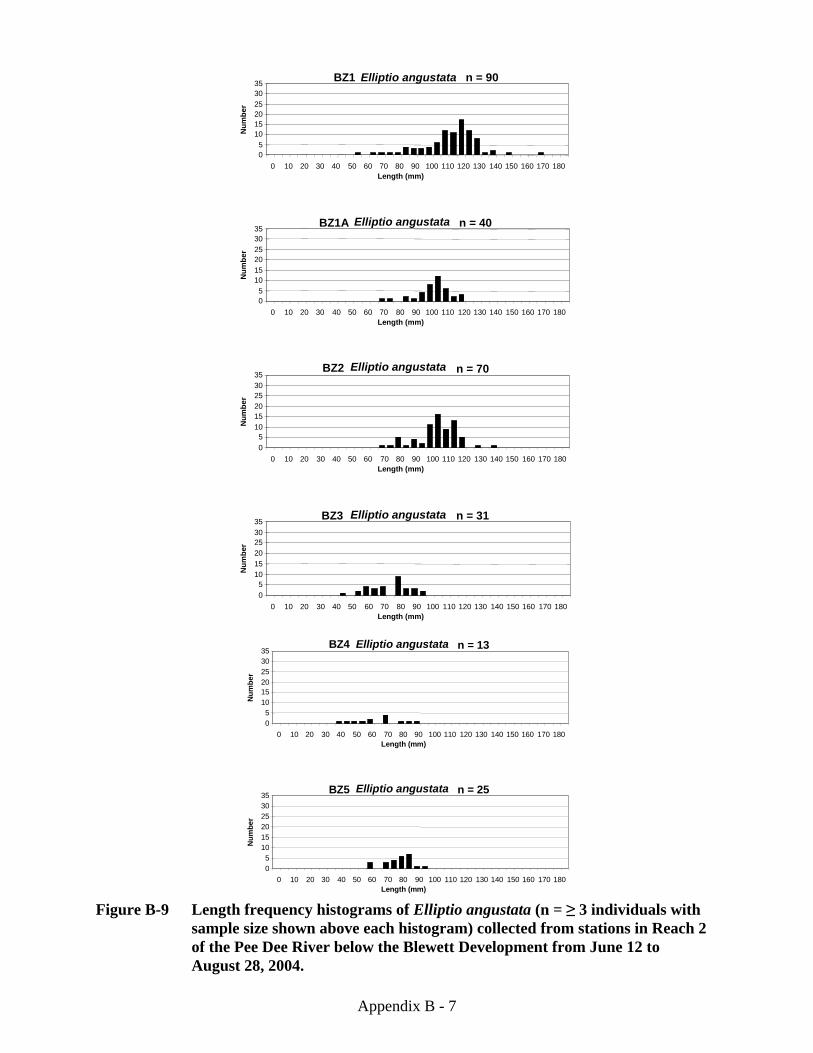
Appendix B - 7
BZ1 Elliptio angustata n = 90
05
101520253035
0 10 20 30 40 50 60 70 80 90 100 110 120 130 140 150 160 170 180Length (mm)
Num
ber
BZ1A Elliptio angustata n = 40
05
101520253035
0 10 20 30 40 50 60 70 80 90 100 110 120 130 140 150 160 170 180Length (mm)
Num
ber
BZ2 Elliptio angustata n = 70
05
101520253035
0 10 20 30 40 50 60 70 80 90 100 110 120 130 140 150 160 170 180Length (mm)
Num
ber
BZ3 Elliptio angustata n = 31
05
101520253035
0 10 20 30 40 50 60 70 80 90 100 110 120 130 140 150 160 170 180Length (mm)
Num
ber
BZ4 Elliptio angustata n = 13
05
101520253035
0 10 20 30 40 50 60 70 80 90 100 110 120 130 140 150 160 170 180Length (mm)
Num
ber
BZ5 Elliptio angustata n = 25
05
101520253035
0 10 20 30 40 50 60 70 80 90 100 110 120 130 140 150 160 170 180Length (mm)
Num
ber
BZ4 Elliptio angustata n = 13
05
101520253035
0 10 20 30 40 50 60 70 80 90 100 110 120 130 140 150 160 170 180Length (mm)
Num
ber
BZ5 Elliptio angustata n = 25
05
101520253035
0 10 20 30 40 50 60 70 80 90 100 110 120 130 140 150 160 170 180Length (mm)
Num
ber
Figure B-9 Length frequency histograms of Elliptio angustata (n = ≥ 3 individuals with
sample size shown above each histogram) collected from stations in Reach 2 of the Pee Dee River below the Blewett Development from June 12 to August 28, 2004.
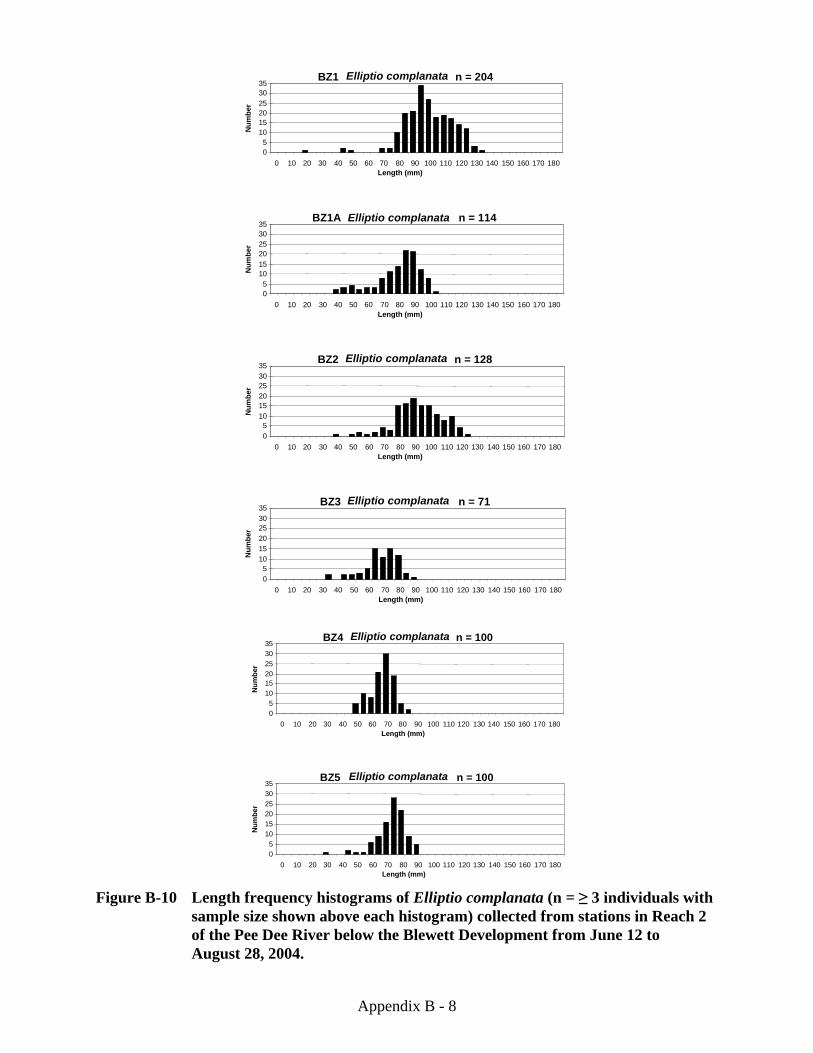
Appendix B - 8
BZ1 Elliptio complanata n = 204
05
101520253035
0 10 20 30 40 50 60 70 80 90 100 110 120 130 140 150 160 170 180Length (mm)
Num
ber
BZ1A Elliptio complanata n = 114
05
101520253035
0 10 20 30 40 50 60 70 80 90 100 110 120 130 140 150 160 170 180Length (mm)
Num
ber
BZ2 Elliptio complanata n = 128
05
101520253035
0 10 20 30 40 50 60 70 80 90 100 110 120 130 140 150 160 170 180Length (mm)
Num
ber
BZ3 Elliptio complanata n = 71
05
101520253035
0 10 20 30 40 50 60 70 80 90 100 110 120 130 140 150 160 170 180Length (mm)
Num
ber
BZ4 Elliptio complanata n = 100
05
101520253035
0 10 20 30 40 50 60 70 80 90 100 110 120 130 140 150 160 170 180Length (mm)
Num
ber
BZ5 Elliptio complanata n = 100
05
101520253035
0 10 20 30 40 50 60 70 80 90 100 110 120 130 140 150 160 170 180Length (mm)
Num
ber
BZ4 Elliptio complanata n = 100
05
101520253035
0 10 20 30 40 50 60 70 80 90 100 110 120 130 140 150 160 170 180Length (mm)
Num
ber
BZ5 Elliptio complanata n = 100
05
101520253035
0 10 20 30 40 50 60 70 80 90 100 110 120 130 140 150 160 170 180Length (mm)
Num
ber
Figure B-10 Length frequency histograms of Elliptio complanata (n = ≥ 3 individuals with
sample size shown above each histogram) collected from stations in Reach 2 of the Pee Dee River below the Blewett Development from June 12 to August 28, 2004.
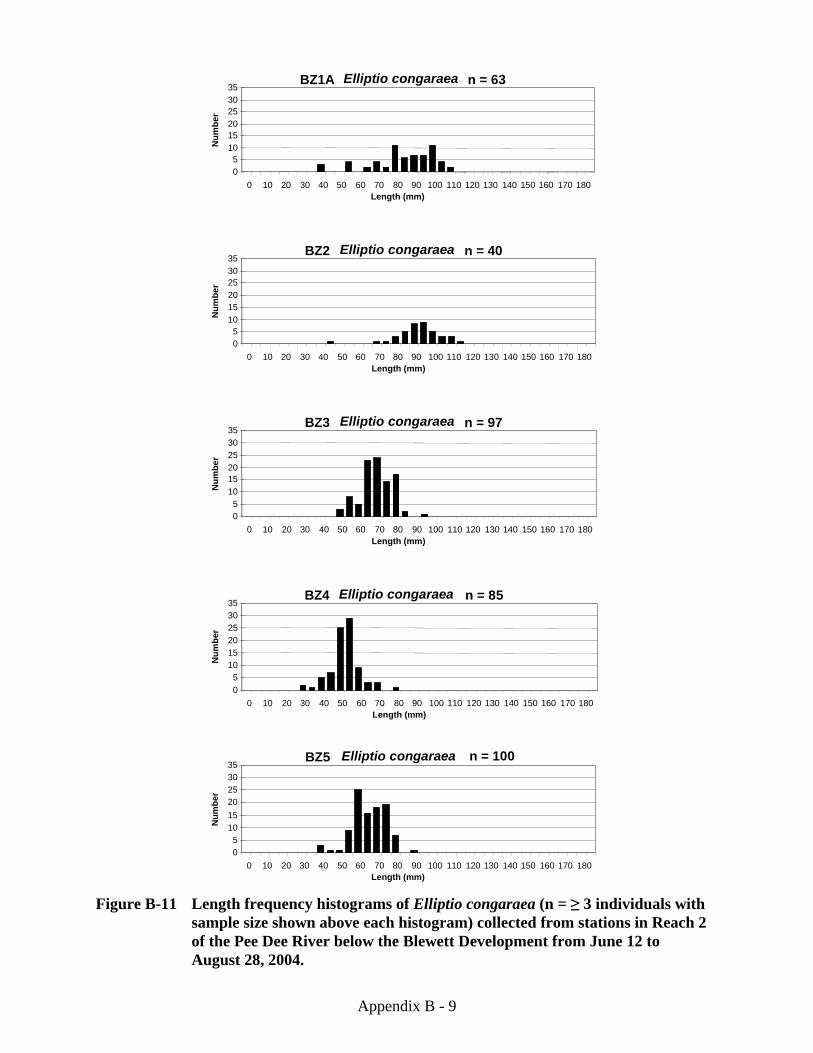
Appendix B - 9
BZ1A Elliptio congaraea n = 63
05
101520253035
0 10 20 30 40 50 60 70 80 90 100 110 120 130 140 150 160 170 180Length (mm)
Num
ber
BZ2 Elliptio congaraea n = 40
05
101520253035
0 10 20 30 40 50 60 70 80 90 100 110 120 130 140 150 160 170 180Length (mm)
Num
ber
BZ3 Elliptio congaraea n = 97
05
101520253035
0 10 20 30 40 50 60 70 80 90 100 110 120 130 140 150 160 170 180Length (mm)
Num
ber
BZ4 Elliptio congaraea n = 85
05
101520253035
0 10 20 30 40 50 60 70 80 90 100 110 120 130 140 150 160 170 180Length (mm)
Num
ber
BZ5 Elliptio congaraea n = 100
05
101520253035
0 10 20 30 40 50 60 70 80 90 100 110 120 130 140 150 160 170 180Length (mm)
Num
ber
BZ5 Elliptio congaraea n = 100
05
101520253035
0 10 20 30 40 50 60 70 80 90 100 110 120 130 140 150 160 170 180Length (mm)
Num
ber
Figure B-11 Length frequency histograms of Elliptio congaraea (n = ≥ 3 individuals with
sample size shown above each histogram) collected from stations in Reach 2 of the Pee Dee River below the Blewett Development from June 12 to August 28, 2004.

Appendix B - 10
BZ1 Elliptio folliculata n = 24
05
101520253035
0 10 20 30 40 50 60 70 80 90 100 110 120 130 140 150 160 170 180Length (mm)
Num
ber
BZ2 Elliptio folliculata n = 28
05
101520253035
0 10 20 30 40 50 60 70 80 90 100 110 120 130 140 150 160 170 180Length (mm)
Num
ber
BZ1 Elliptio folliculata n = 24
05
101520253035
0 10 20 30 40 50 60 70 80 90 100 110 120 130 140 150 160 170 180Length (mm)
Num
ber
BZ2 Elliptio folliculata n = 28
05
101520253035
0 10 20 30 40 50 60 70 80 90 100 110 120 130 140 150 160 170 180Length (mm)
Num
ber
Figure B-12 Length frequency histograms of Elliptio folliculata (n = ≥ 3 individuals with
sample size shown above each histogram) collected from stations in Reach 2 of the Pee Dee River below the Blewett Development from June 12 to August 28, 2004.
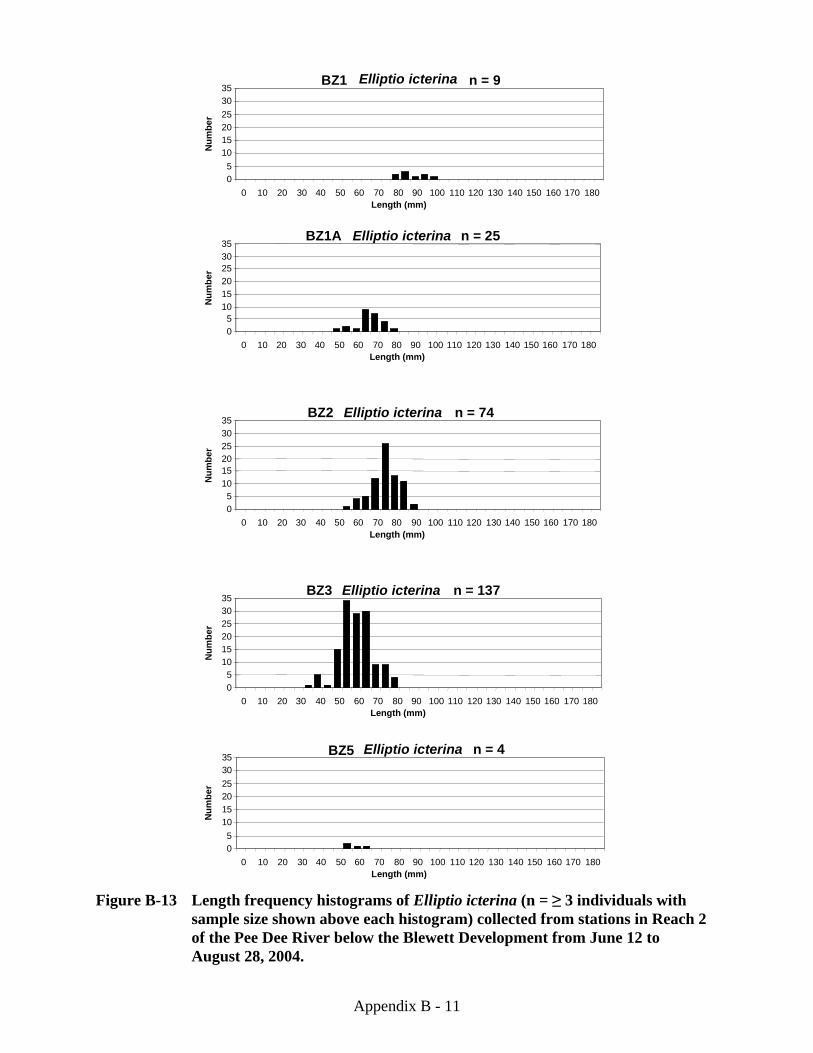
Appendix B - 11
BZ1 Elliptio icterina n = 9
05
101520253035
0 10 20 30 40 50 60 70 80 90 100 110 120 130 140 150 160 170 180Length (mm)
Num
ber
BZ1A Elliptio icterina n = 25
05
101520253035
0 10 20 30 40 50 60 70 80 90 100 110 120 130 140 150 160 170 180Length (mm)
Num
ber
BZ2 Elliptio icterina n = 74
05
101520253035
0 10 20 30 40 50 60 70 80 90 100 110 120 130 140 150 160 170 180Length (mm)
Num
ber
BZ3 Elliptio icterina n = 137
05
101520253035
0 10 20 30 40 50 60 70 80 90 100 110 120 130 140 150 160 170 180Length (mm)
Num
ber
BZ5 Elliptio icterina n = 4
05
101520253035
0 10 20 30 40 50 60 70 80 90 100 110 120 130 140 150 160 170 180Length (mm)
Num
ber
BZ5 Elliptio icterina n = 4
05
101520253035
0 10 20 30 40 50 60 70 80 90 100 110 120 130 140 150 160 170 180Length (mm)
Num
ber
Figure B-13 Length frequency histograms of Elliptio icterina (n = ≥ 3 individuals with
sample size shown above each histogram) collected from stations in Reach 2 of the Pee Dee River below the Blewett Development from June 12 to August 28, 2004.
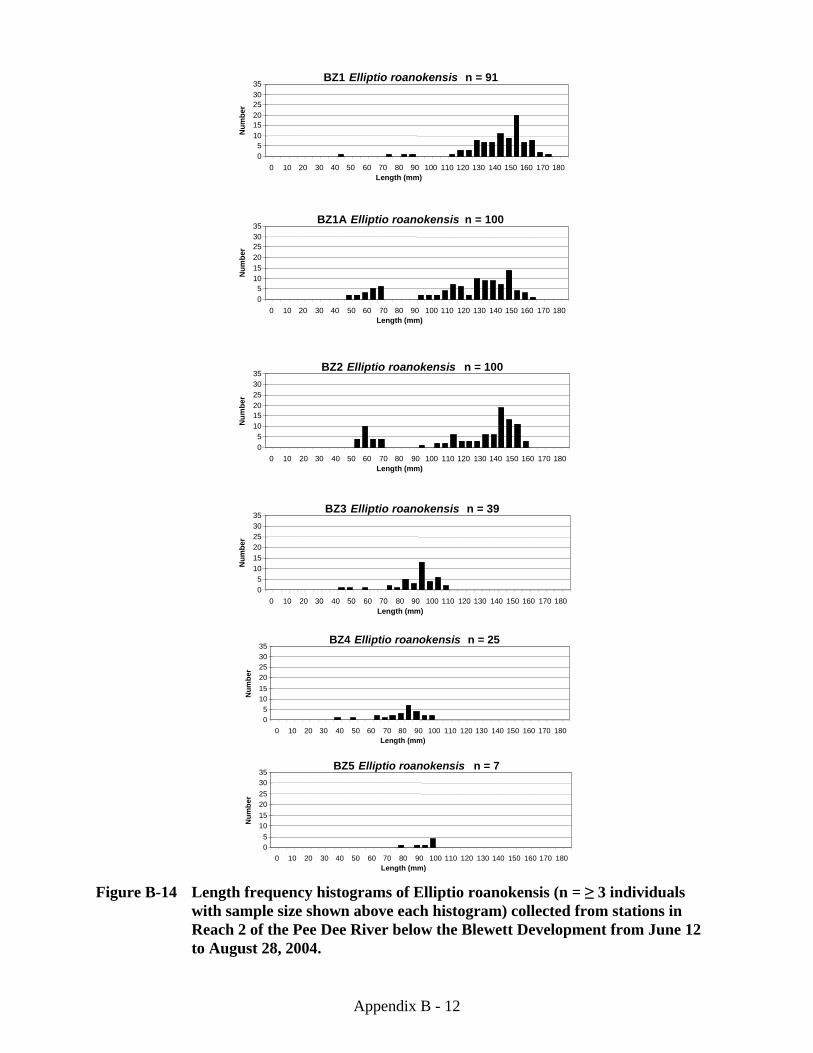
Appendix B - 12
BZ1 Elliptio roanokensis n = 91
05
101520253035
0 10 20 30 40 50 60 70 80 90 100 110 120 130 140 150 160 170 180Length (mm)
Num
ber
BZ1A Elliptio roanokensis n = 100
05
101520253035
0 10 20 30 40 50 60 70 80 90 100 110 120 130 140 150 160 170 180Length (mm)
Num
ber
BZ2 Elliptio roanokensis n = 100
05
101520253035
0 10 20 30 40 50 60 70 80 90 100 110 120 130 140 150 160 170 180Length (mm)
Num
ber
BZ3 Elliptio roanokensis n = 39
05
101520253035
0 10 20 30 40 50 60 70 80 90 100 110 120 130 140 150 160 170 180Length (mm)
Num
ber
BZ4 Elliptio roanokensis n = 25
05
101520253035
0 10 20 30 40 50 60 70 80 90 100 110 120 130 140 150 160 170 180Length (mm)
Num
ber
BZ5 Elliptio roanokensis n = 7
05
101520253035
0 10 20 30 40 50 60 70 80 90 100 110 120 130 140 150 160 170 180Length (mm)
Num
ber
BZ4 Elliptio roanokensis n = 25
05
101520253035
0 10 20 30 40 50 60 70 80 90 100 110 120 130 140 150 160 170 180Length (mm)
Num
ber
BZ5 Elliptio roanokensis n = 7
05
101520253035
0 10 20 30 40 50 60 70 80 90 100 110 120 130 140 150 160 170 180Length (mm)
Num
ber
Figure B-14 Length frequency histograms of Elliptio roanokensis (n = ≥ 3 individuals
with sample size shown above each histogram) collected from stations in Reach 2 of the Pee Dee River below the Blewett Development from June 12 to August 28, 2004.
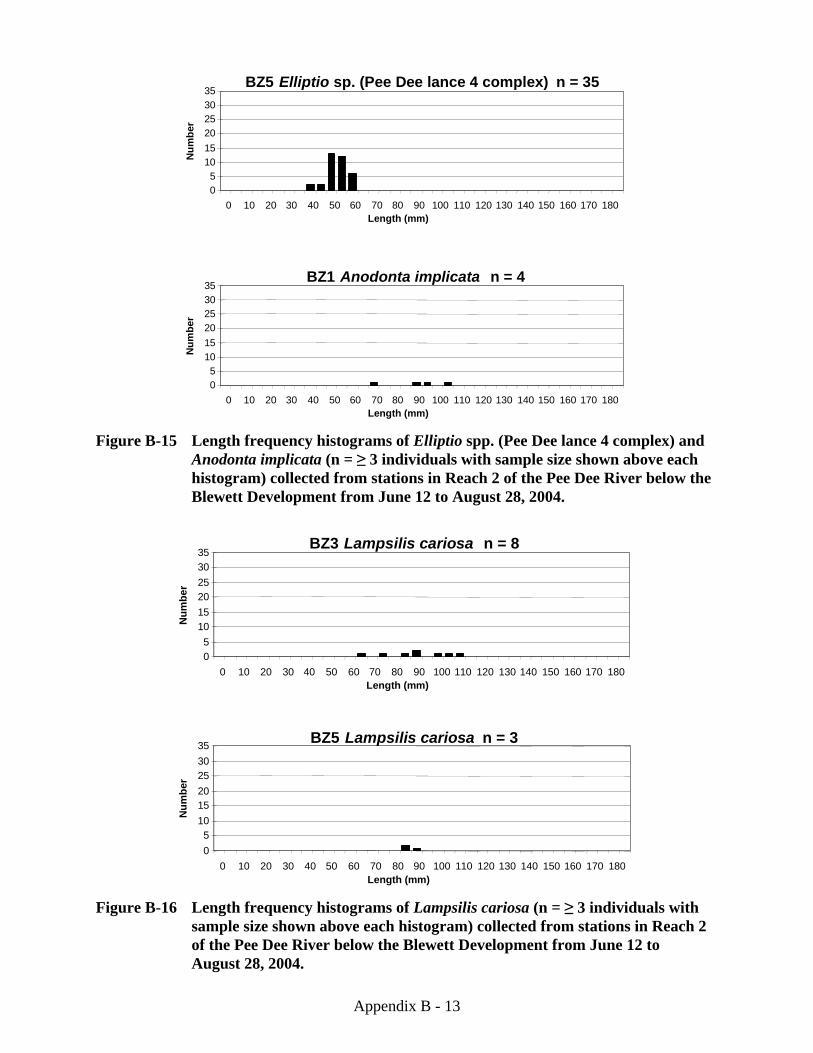
Appendix B - 13
BZ1 Anodonta implicata n = 4
05
101520253035
0 10 20 30 40 50 60 70 80 90 100 110 120 130 140 150 160 170 180Length (mm)
Num
ber
BZ5 Elliptio sp. (Pee Dee lance 4 complex) n = 35
05
101520253035
0 10 20 30 40 50 60 70 80 90 100 110 120 130 140 150 160 170 180Length (mm)
Num
ber
BZ1 Anodonta implicata n = 4
05
101520253035
0 10 20 30 40 50 60 70 80 90 100 110 120 130 140 150 160 170 180Length (mm)
Num
ber
BZ5 Elliptio sp. (Pee Dee lance 4 complex) n = 35
05
101520253035
0 10 20 30 40 50 60 70 80 90 100 110 120 130 140 150 160 170 180Length (mm)
Num
ber
Figure B-15 Length frequency histograms of Elliptio spp. (Pee Dee lance 4 complex) and
Anodonta implicata (n = ≥ 3 individuals with sample size shown above each histogram) collected from stations in Reach 2 of the Pee Dee River below the Blewett Development from June 12 to August 28, 2004.
BZ3 Lampsilis cariosa n = 8
05
101520253035
0 10 20 30 40 50 60 70 80 90 100 110 120 130 140 150 160 170 180Length (mm)
Num
ber
BZ5 Lampsilis cariosa n = 3
05
101520253035
0 10 20 30 40 50 60 70 80 90 100 110 120 130 140 150 160 170 180Length (mm)
Num
ber
BZ3 Lampsilis cariosa n = 8
05
101520253035
0 10 20 30 40 50 60 70 80 90 100 110 120 130 140 150 160 170 180Length (mm)
Num
ber
BZ5 Lampsilis cariosa n = 3
05
101520253035
0 10 20 30 40 50 60 70 80 90 100 110 120 130 140 150 160 170 180Length (mm)
Num
ber
Figure B-16 Length frequency histograms of Lampsilis cariosa (n = ≥ 3 individuals with
sample size shown above each histogram) collected from stations in Reach 2 of the Pee Dee River below the Blewett Development from June 12 to August 28, 2004.

Appendix B - 14
BZ3 Lampsilis radiata n = 8
05
101520253035
0 10 20 30 40 50 60 70 80 90 100 110 120 130 140 150 160 170 180Length (mm)
Num
ber
BZ1 Lampsilis radiata n = 4
05
101520253035
0 10 20 30 40 50 60 70 80 90 100 110 120 130 140 150 160 170 180Length (mm)
Num
ber
BZ3 Lampsilis radiata n = 8
05
101520253035
0 10 20 30 40 50 60 70 80 90 100 110 120 130 140 150 160 170 180Length (mm)
Num
ber
BZ1 Lampsilis radiata n = 4
05
101520253035
0 10 20 30 40 50 60 70 80 90 100 110 120 130 140 150 160 170 180Length (mm)
Num
ber
Figure B-17 Length frequency histograms of Lampsilis radiata (n = ≥ 3 individuals with
sample size shown above each histogram) collected from stations in Reach 2 of the Pee Dee River below the Blewett Development from June 12 to August 28, 2004.
BZ1 Ligumia nasuta n = 10
05
101520253035
0 10 20 30 40 50 60 70 80 90 100 110 120 130 140 150 160 170 180Length (mm)
Num
ber
BZ2 Ligumia nasuta n = 20
05
101520253035
0 10 20 30 40 50 60 70 80 90 100 110 120 130 140 150 160 170 180Length (mm)
Num
ber
BZ1 Ligumia nasuta n = 10
05
101520253035
0 10 20 30 40 50 60 70 80 90 100 110 120 130 140 150 160 170 180Length (mm)
Num
ber
BZ2 Ligumia nasuta n = 20
05
101520253035
0 10 20 30 40 50 60 70 80 90 100 110 120 130 140 150 160 170 180Length (mm)
Num
ber
Figure B-18 Length frequency histograms of Ligumia nasuta (n = ≥ 3 individuals with
sample size shown above each histogram) collected from stations in Reach 2 of the Pee Dee River below the Blewett Development from June 12 to August 28, 2004.
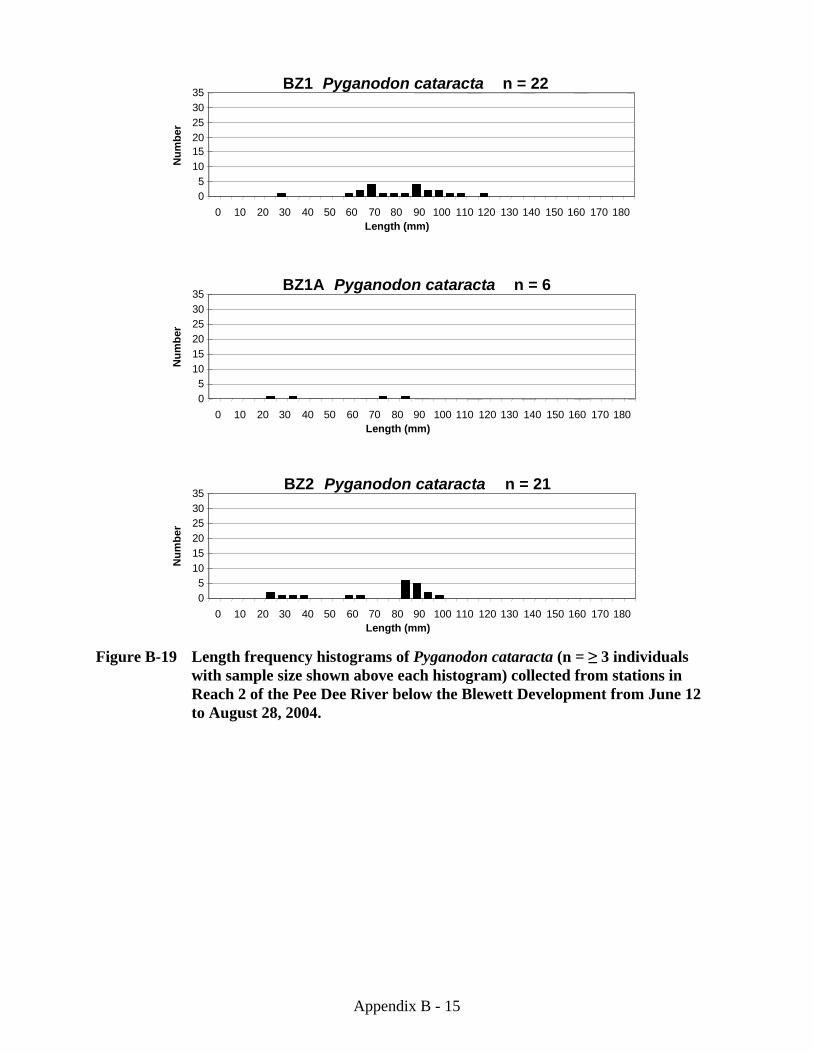
Appendix B - 15
BZ1 Pyganodon cataracta n = 22
05
101520253035
0 10 20 30 40 50 60 70 80 90 100 110 120 130 140 150 160 170 180Length (mm)
Num
ber
BZ1A Pyganodon cataracta n = 6
05
101520253035
0 10 20 30 40 50 60 70 80 90 100 110 120 130 140 150 160 170 180Length (mm)
Num
ber
BZ2 Pyganodon cataracta n = 21
05
101520253035
0 10 20 30 40 50 60 70 80 90 100 110 120 130 140 150 160 170 180Length (mm)
Num
ber
Figure B-19 Length frequency histograms of Pyganodon cataracta (n = ≥ 3 individuals
with sample size shown above each histogram) collected from stations in Reach 2 of the Pee Dee River below the Blewett Development from June 12 to August 28, 2004.

Appendix B - 16
BZ1 Utterbackia imbecilis n = 14
05
101520253035
0 10 20 30 40 50 60 70 80 90 100 110 120 130 140 150 160 170 180Length (mm)
Num
ber
BZ2 Utterbackia imbecilis n = 8
05
101520253035
0 10 20 30 40 50 60 70 80 90 100 110 120 130 140 150 160 170 180Length (mm)
Num
ber
BZ1 Utterbackia imbecilis n = 14
05
101520253035
0 10 20 30 40 50 60 70 80 90 100 110 120 130 140 150 160 170 180Length (mm)
Num
ber
BZ2 Utterbackia imbecilis n = 8
05
101520253035
0 10 20 30 40 50 60 70 80 90 100 110 120 130 140 150 160 170 180Length (mm)
Num
ber
Figure B-20 Length frequency histograms of Utterbackia imbecilis (n = ≥ 3 individuals
with sample size shown above each histogram) collected from stations in Reach 2 of the Pee Dee River below the Blewett Development from June 12 to August 28, 2004.
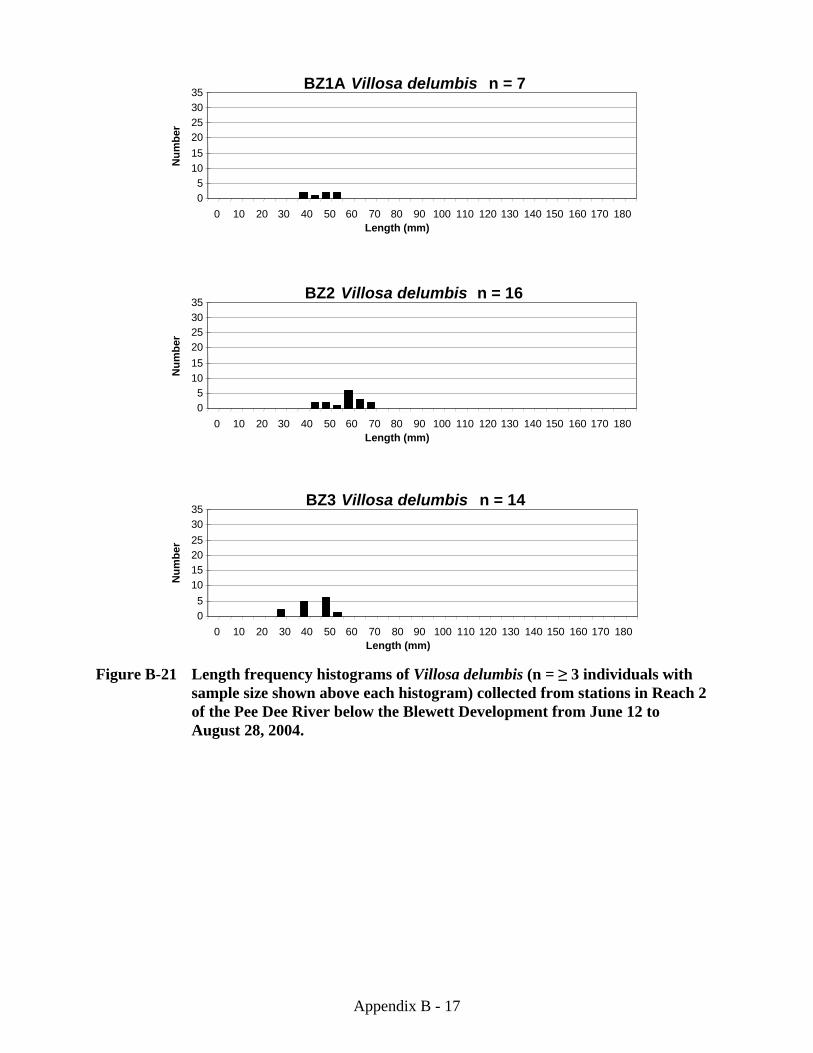
Appendix B - 17
BZ1A Villosa delumbis n = 7
05
101520253035
0 10 20 30 40 50 60 70 80 90 100 110 120 130 140 150 160 170 180Length (mm)
Num
ber
BZ2 Villosa delumbis n = 16
05
101520253035
0 10 20 30 40 50 60 70 80 90 100 110 120 130 140 150 160 170 180Length (mm)
Num
ber
BZ3 Villosa delumbis n = 14
05
101520253035
0 10 20 30 40 50 60 70 80 90 100 110 120 130 140 150 160 170 180Length (mm)
Num
ber
Figure B-21 Length frequency histograms of Villosa delumbis (n = ≥ 3 individuals with
sample size shown above each histogram) collected from stations in Reach 2 of the Pee Dee River below the Blewett Development from June 12 to August 28, 2004.
Related Documents