1 July 2011 SHADOW ECONOMIES AROUND THE WORLD: NOVEL INSIGHTS, ACCEPTED KNOWLEDGE, AND NEW ESTIMATES* Andreas Buehn † and Friedrich Schneider ‡ forthcoming in International Tax and Public Finance Abstract This paper is a first attempt to study the impact of enforcement on the shadow economy. Using a MIMIC model, we find that a higher share of sub-national government employment and the aspiration of public employees to follow rules significantly deter shadow economic activities. Our results also confirm previous findings: Increased burdens of taxation and regulation as well as the state of the “official” economy are important determinants of the shadow economy. The estimated weighted average informality in 162 countries around the world, including developing, Eastern European, Central Asian, and high-income OECD countries, is 17.1% of “official” GDP. JEL-classification O17 O5 D78 H11 H26 Keywords Shadow economies Quality of institutions Enforcement MIMIC Model * We would like to thank two anonymous referees and the editor of the journal, Dhammika Dharmapala, for many helpful suggestions and comments. The paper has also benefitted from comments received at the 2010 Annual Meeting of the Public Choice Society (Monterrey, CA), the 2010 Annual Meeting of the European Public Choice Society (Izmir, Turkey), the workshop Shadow Economy, Tax Policy, and Labour Markets in International Comparison: Options for Economic Policy (Munster, Germany), and the 2010 Annual Meeting of the International Institute of Public Finance (Uppsala, Sweden). Andreas Buehn gratefully acknowledges financial support of the Deutsche Forschungsgemeinschaft. † Corresponding author. Andreas Buehn, Utrecht School of Economics, Utrecht University; Andrew Young School of Policy Studies, Georgia Sate University; Faculty of Business and Economics, Technische Unversität Dresden. E-mail: [email protected] ‡ Friedrich Schneider, Johannes Kepler University of Linz, Department of Economics. E- mail: [email protected]

Welcome message from author
This document is posted to help you gain knowledge. Please leave a comment to let me know what you think about it! Share it to your friends and learn new things together.
Transcript

1
July 2011
SHADOW ECONOMIES AROUND THE WORLD: NOVEL
INSIGHTS, ACCEPTED KNOWLEDGE, AND NEW ESTIMATES*
Andreas Buehn† and Friedrich Schneider‡
forthcoming in International Tax and Public Finance
Abstract This paper is a first attempt to study the impact of enforcement on the shadow
economy. Using a MIMIC model, we find that a higher share of sub-national government
employment and the aspiration of public employees to follow rules significantly deter
shadow economic activities. Our results also confirm previous findings: Increased burdens
of taxation and regulation as well as the state of the “official” economy are important
determinants of the shadow economy. The estimated weighted average informality in 162
countries around the world, including developing, Eastern European, Central Asian, and
high-income OECD countries, is 17.1% of “official” GDP.
JEL-classification O17 O5 D78 H11 H26
Keywords Shadow economies Quality of institutions Enforcement MIMIC Model
* We would like to thank two anonymous referees and the editor of the journal, Dhammika Dharmapala, for many helpful suggestions and comments. The paper has also benefitted from comments received at the 2010 Annual Meeting of the Public Choice Society (Monterrey, CA), the 2010 Annual Meeting of the European Public Choice Society (Izmir, Turkey), the workshop Shadow Economy, Tax Policy, and Labour Markets in International Comparison: Options for Economic Policy (Munster, Germany), and the 2010 Annual Meeting of the International Institute of Public Finance (Uppsala, Sweden). Andreas Buehn gratefully acknowledges financial support of the Deutsche Forschungsgemeinschaft. † Corresponding author. Andreas Buehn, Utrecht School of Economics, Utrecht University; Andrew Young School of Policy Studies, Georgia Sate University; Faculty of Business and Economics, Technische Unversität Dresden. E-mail: [email protected] ‡ Friedrich Schneider, Johannes Kepler University of Linz, Department of Economics. E-mail: [email protected]
2
1 Introduction
Information about the extent of the shadow economy, who is engaged, the frequency
of these activities, and their magnitude is crucial for making effective and efficient
decisions regarding the allocations of a country’s resources in this area. Unfortunately, it is
very difficult to get accurate information about shadow economy activities on the goods
and labor market, because all individuals engaged in these activities do not wish to be
identified. Hence, doing research in this area can be considered as a scientific passion for
knowing the unknown.
Although substantial literature exists on single aspects of the hidden or shadow
economy and comprehensive surveys have been written by Schneider and Enste (2000) as
well as Feld and Schneider (2010), the subject is still quite controversial as there are
disagreements about the definition of shadow economic activities, the estimation
procedures, and the use of their estimates in economic analysis and policy aspects.1 Large
shadow economies in developing countries are associated with a number of serious
problems, e. g., insufficient fiscal capacities, which may result in poor growth performance
[Besley and Persson (2010)]. Shadow economic activities are also significant and alarming
in developed countries. The recent debt crisis in Greece has demonstrated the negative
outcomes of a significant shadow economy (around 30% of official GDP in 2007) on tax
bases and social security systems. Spain, Portugal, and Italy also face a critical budgetary
situation.
Facing budgetary pressure, governments are likely to search for effective instruments
controlling the shadow economy in order to increase the tax base and relax their budget
constraint. Reforming the tax and social security systems and reducing the regulatory
burden are established and widely used policy instruments to improve the dynamics of the
official economy. However, in most countries not registering or paying taxes is a
punishable offense and governments therefore try to uncover those agents that are
operating informally. Hence, a further effective direct policy instrument to deter the
shadow economy might be enforcement as increasing the probability that working in the
shadow economy will be discovered reduces the expected gains from informality
[Allingham and Sandmo (1972)]. Surprisingly, the literature has not paid much attention
to this policy instrument.
The goal of this paper is twofold. First and most importantly, we empirically study –
alongside taxation and regulation – the important determinant of enforcement using
different measures. To our knowledge, this has not been done in the literature and this
paper is a first attempt to fill this gap. Second, we undertake the challenging task of
1 Compare the different opinions of Tanzi (1999), Thomas (1999), Giles (1999a,b) and Pedersen (2003).
3
estimating the shadow economies for 162 countries all over the world and to provide some
insights into the main causes as well as sizes and trends of the shadow economies
between 1999 and 2006/2007 using a unique database. This is an improvement compared
to previous work, because we successfully “created” a unique dataset and used the
Multiple Indicators Multiple Causes (MIMIC) estimation method for all countries with the
explicit goal to have a comparable shadow economy data set.2
The rest of the paper is organized as follows. Section 2 defines the shadow economy
and provides the theoretical background. Section 3 briefly introduces the MIMIC approach
and presents the empirical results. Section 4 concludes.
2 Theoretical considerations about the shadow economy
The shadow economy is still controversially debated in the literature, although
substantial contributions have been made studying particular aspects of this phenomenon
and a comprehensive survey had been written by Schneider and Enste (2000). While
Smith (1994, p. 18) defines it as “…market-based production of goods and services,
whether legal or illegal, that escapes detection in the official estimates of GDP”, others
define the shadow economy as all currently unregistered economic activities that
contribute to the officially calculated (or observed) Gross National Product.3 This paper
defines the shadow economy as all market-based legal production of goods and services
that are deliberately concealed from public authorities for any of the following reasons:
• to avoid payment of income, value added or other taxes,
• to avoid payment of social security contributions,
• to avoid having to meet certain legal labor market standards, such as minimum
wages, maximum working hours, safety standards, etc., and
• to avoid complying with certain administrative procedures, such as completing
statistical questionnaires, or other administrative forms.
Informal agents (firms and workers) decide migrating into the shadow economy depending
on the costs and benefits. According to the definition, they benefit from informality
because avoiding taxes, social security contributions, and market regulations saves costs.
However, not registering or paying taxes is a punishable offense and governments
therefore try to uncover those agents that are tax evading or are operating illegally. The
costs can thus be attributed to the punishment when being caught and the probability that
the informal activity is detected [Becker (1968); Allingham and Sandmo (1972)]. In the
2 A more comprehensive version of this article has been published in Schneider, Buehn,
and Montenegro (2010a, 2011). 3 This definition is used for example by Feige (1989, 1994), Schneider (2005, 2007), Feld
and Schneider (2010) as well as Frey and Pommerehne (1984). Do-it-yourself and illegal activities are not included. An examination of the shadow economy and the do-it-yourself activities for the case of Germany is presented in Buehn et al. (2009).

4
next section we will first address enforcement as determinant of the shadow economy and
then discuss well-established determinants of the shadow economy such as taxes and
regulation.
2.1 The role of enforcement
Allingham and Sandmo (1972) present a simple model of income tax evasion, the
insights of which may be applied to the shadow economy [see e.g. Slemrod and Weber
(2010)]. In this model, a risk-averse individual has true, taxable income Y subject to a flat
income tax t. The individual hides the amount H = Y − R if it reports less than the true
income Y to authorities, i.e., R < Y. The authority will discover the informal activity with
fixed probability p. If evasion is discovered, the individual pays the true tax liability plus a
fine in relation either to the underreported income or the evaded tax liability. While the
probability of detection p is fixed in Allingham-Sandmo (1972) it in fact positively depends
on enforcement actions taken by the authority in order to increase the chance of
detection. Using an endogenous growth model Sarte (2000) shows that increasing costs of
informality decrease the number of informal firms operating in the shadow economy.
Prado (2011) presents a general equilibrium model to study the interaction between
government policy and the firms’ choice to operate formally or informally. Calibrating the
model to match data for 29 countries he shows that lower levels of enforcement –
alongside other determinants of informality like higher taxation and regulation – are on
average associated with a larger informal sector. This suggests that enforcement may be
considered a very important determinant of the size of the shadow economy.4
An intuitive measure of enforcement would be a variable approximating the ability of
government authorities to control economic agent’s activities. A closer distance to
economic agents and a higher frequency of face-to-face contacts between bureaucrats
and economic agents (firms and workers) increase the probability of detection and deter
shadow economic activities, all other things being equal. In order to test this deterrence
argument, we use the share of sub-national government employment in total civilian
government employment (SUBEMPL) as a measure because a direct measure for the
probability of detection is not available. The data is provided by the International Labour
Organization’s (ILO) LABORSTA database. Due to lacking data, we are not able to consider
the size of fines explicitly. However, given that the country specific punishment is set, an
increase of the probability of detection increases deterrence.
In addition to the share of sub-national government employment, we use three
further variables to investigate the relationship between enforcement and the shadow
economy. The first variable is the share of sub-national government expenditures in total
4 Feld and Larsen (2011) using individual survey data find that the probability of detection has a significant negative effect on the probability of working in the shadow economy.

5
government expenditures (SUBEXP). The devolution of fiscal authority towards sub-
national governments gives sub-national governments more discretionary (spending)
power and enables them to allocate more resources to enforce shadow economic activities.
Sub-national government expenditures are calculated from the IMF Government Finance
Statistics. The second variable is taken from the QoG (Quality of Government) Institute at
University of Goteborg. It provides a unique dataset on the structure and behavior of
public administration based on a web survey. The QoG data includes key dimensions on
the quality of government such as professionalization and impartiality and mostly covers
advanced industrialized and post-communist economies. Question 8.d of the survey asks:
To what extent would you say that public sector employees strive to follow rules in the
country you have chosen to submit your answer for. To answer this question, respondents
can choose a number between 1 (Not at all) and 7 (To a very large extent) from a discrete
scale. We use the average of the answers provided by the representatives of a particular
country as a further approximation of enforcement (Rules). The more people believe that
public sector employees strive to follow rules, the higher the perceived probability of
detection and the smaller shadow economic activities, all other things being equal. Finally,
we use a dummy variable taking the value 1 if sub-national governments have extensive
taking, spending, or regulatory authority, and zero otherwise (Authority). The variable is
taken from a large (panel data) database on the Quality of Government, which is also
maintained by the QoG Institute at University of Goteborg.
Unfortunately, more direct measures of enforcement actions by authorities across
countries are not available; even the chosen indirect measures are limited and often
available only for developed and a handful transition countries. For that reason, we can
test the impact of enforcement on the shadow economy only for a sub-sample of
countries.5 Nevertheless, this is an important empirical contribution to the literature
studying the impact of enforcement on informality.6
2.2 Established determinants
2.1.1 Tax and social security contribution
The bigger the difference between the total cost of labor in the official economy and
the after-tax earnings (from work), the greater is the incentive to avoid this difference and
5 See also footnote 8. 6 We are not aware of any empirical analysis except Prado (2011) who uses simulated
enforcement measures to study this relationship. The tax evasion literature however presents more direct empirical evidence on the impact of enforcement. For example, Beron, Tauchen, and Witte (1992) find that higher audit probabilities increase the reported adjusted gross income. Slemrod, Blumenthal, and Christian (2001) confirm this finding especially for low- and middle-income taxpayers analyzing the outcome of a randomized controlled field experiment conducted by the State of Minnesota Department of Revenue; see Slemrod (2007) for an excellent survey on the subject of tax evasion.
6
to work in the shadow economy. Since this difference depends broadly on the social
security burden/payments and the overall tax burden, the latter are key features of the
existence and the increase of the shadow economy. The relationship between taxes and
the shadow economy is theoretically analyzed in Neck, Hofreither, and Schneider (1989).
Assuming an additive-separable utility function and a two-stage decision setup of the
consumer, they find that higher marginal (income) tax rates imply greater labor supply in
the shadow economy. It has also been ascertained empirically that the overall tax and
social security contribution burdens are among the main causes for the existence of the
shadow economy.7
The concrete measurement of the tax and social security contribution burdens is not
easy to define, because the tax and social security systems are vastly different among the
countries. In order to have some general comparable proxies, we use the following causal
variables: (1) Indirect taxes as a proportion of total overall taxation (positive sign
expected); (2) Share of direct taxes: direct taxes as proportion of overall taxation
(positive sign expected); (3) Size of government: general government final consumption
expenditures (in percent of GDP, which includes all government current expenditures for
purchases of goods and services; positive sign expected); (4) Fiscal freedom as
subcomponent of the Heritage Foundation’s economic freedom index measures the fiscal
burden in an economy; i.e. top tax rates on individual and corporate income. The index
ranges from 0 to 100, where 0 is least fiscal freedom and 100 maximum degree of fiscal
freedom (negative sign expected).
2.1.2 Intensity of regulations
Increased intensity of regulations is another important factor that reduces the
freedom (of choice) for individuals engaged in the official economy. One can think of labor
market regulations such as minimum wages or dismissal protections, trade barriers such
as import quotas, and labor market restrictions for foreigners such as restrictions
regarding the free movement of foreign workers. Johnson et al. (1998b) find significant
overall empirical evidence of the influence of (labor) regulations on the shadow economy;
and the impact is clearly described and theoretically derived in other studies, e.g. for
Germany [Deregulation Commission (1990/91)]. Regulations lead to a substantial increase
in labor costs in the official economy. But since most of these costs can be shifted to the
employees, these costs provide another incentive to work in the shadow economy, where
they can be avoided. The empirical evidence supports the model of Johnson et al. (1997),
which predicts, inter alia, that countries with more general regulation of their economies
tend to have a higher share of the unofficial economy in total GDP.
7 See Schneider (1986, 2005, 2007); Johnson et al. (1998a,b); Tanzi (1999); Giles (1999a); Giles and Tedds (2002); Feld and Schneider (2010).

7
To measure the intensity of regulation or the impact of regulation on the decision of
whether to work in the official or unofficial economy is a difficult task, and we try to model
this by using the following causal variables: (1) Business freedom: it is a subcomponent of
the Heritage Foundation’s economic freedom index; it measures the time and efforts of
business activity. It ranges from 0 to 100, where 0 is least business freedom and 100
maximum business freedom (negative sign expected); (2) Economic freedom: Heritage
Foundation economic freedom index which ranges from 0 to 100, where 0 is least
economic freedom and 100 maximum economic freedom (negative sign expected); (3)
Regulatory quality: World Bank´s regulatory quality index including measures of the
incidents of market-unfriendly policies, such as price controls or inadequate bank
supervision, as well as perceptions of the burdens imposed by excessive regulation in
areas, such as foreign trade and business development. It scores between -2.5 and +2.5
with higher scores corresponding to better outcomes (negative sign expected).
2.1.3 Public sector services
An increase of the shadow economy can lead to reduced state revenues which in
turn reduce the quality and quantity of publicly provided goods and services. Ultimately,
this can lead to an increase in the tax rates for firms and individuals in the official sector,
quite often combined with a deterioration in the quality of the public goods (such as the
public infrastructure) and of the administration, with the consequence of even stronger
incentives to participate in the shadow economy. The provision and especially the quality
of the public sector services is thus also a crucial causal variable for people’s decision to
work or not work in the shadow economy. To capture this effect, we have the following
variable: Government Effectiveness from the World Bank´s Worldwide Governance
Indicators. It captures perceptions of the quality of public services, the quality of the civil
service and the degree of its independence from political pressures, the quality of policy
formulation and implementation, and the credibility of government’s commitment to
such policies. The scores of this index lie between -2.5 and +2.5 with higher scores
corresponding to better outcomes (negative sign expected).
2.1.4 Official economy
As it has been shown in a number of studies [Enste and Schneider (20060; Feld and
Schneider (2010)] the situation of the official economy also plays a crucial role of
people’s decision to work or not to work in the shadow economy. In a booming official
economy, people have a lot of opportunities to earn a good salary and “extra money” in
the official economy. This is not the case in an economy facing a recession and more
people try to compensate their losses of income from the official economy through
additional shadow economy activities. In order to capture this, we will use the following
variables: (1) GDP per capita based on Purchasing Power Parity (PPP), measured in

8
constant 2005 US$. PPP as gross domestic product converted to international dollars
using PPP rates (negative sign expected); (2) Inflation rate: GDP deflator (annual rate in
percent); inflation is measured by the annual growth rate of the GDP implicit deflator, it
shows the rate of price changes in the economy as a whole (positive sign expected); (3)
Openness: openness corresponds to trade (in percent of GDP). Trade is the sum of
exports and imports of goods and services, measured as a share of gross domestic
product (negative sign expected). We also use the unemployment rate defined as total
unemployment in percent of total labor force as an additional measure for the situation
of the official economy. We do however not formulate a hypothesis for the relationship to
the shadow economy, as it is theoretically ambiguous. Income losses due to
unemployment reduce demand in both the shadow and official economies. A substitution
of official demand for goods and services for unofficial demand takes place as unemployed
workers turn to the shadow economy – where cheaper goods and services make it easier
to countervail utility losses. This behavior may stimulate additional demand in the shadow
economy. If the income effect exceeds the substitution effect, a negative relationship
develops. Likewise, if the substitution effect exceeds the income effect, the relationship is
positive. Moreover, the ambiguous effect of unemployment on the shadow economy may
not only be due to the countervailing forces of the income and substitution effect but a
consequence of a supply side effect when the unemployed search for and take up jobs in
the shadow economy. While informality in this case clearly increases, the behavoir of the
unemployment rate depends on whether informal worker are considered unemployed in
the official statistics or not.8 In the case informal workers are considered unemployed and
part of the official unemployment statistics, the unemployment rate does not change.
However, if informal workers are not considered unemployed unemployment decreases
and one would observe a negative relationship between informality and unemployment.
Becase the relationship between unemployment and the shadow economy is less clear and
– as explained above – theoretically ambiguous, we refrain from the formulation of an
exact hypothesis.
2.3 Indicators for the shadow economy
By definition, the shadow economy cannot be directly measured. For that reason, we
have to use indicators in which shadow economic activities are reflected and the challenge
is to select those indicators that appear to be influenced. Here, we use the following three
types of indicator variables to make the unobservable shadow economy visible: monetary
indicators, labor market indicators, and variables indicating the impact on the official
economy. These indicator variables mirror activities in the shadow economy particularly
well, as explained below. 8 We thank one referee for pointing this out.

9
2.3.1 Monetary indicators
Given that people who engage in shadow economy transactions do not want to leave
trace, they conduct these activities in cash as this protects the principal and the agent in
their shadow economic activities. All other things being equal, more cash holdings can thus
reflect more shadow economic activity. Hence, shadow economy activities are reflected in
an additional use of cash (or currency). To take into account this, we use the following two
indicators: (1) M0 / M1: M0 corresponds to the currency outside the banks; the usual
definition for M1 is M0 plus deposits; (2) Currency / M2: It corresponds to the currency
outside the banks as a proportion of M2.
2.3.2 Labour market indicators
Shadow economy activities are also reflected in labor market indicators and the labor
force participation rate can serve as an indicator of the shadow economy as changes in the
participation rate – all other things being equal – may reflect a flow of resources between
the official and the shadow economy. We use the following two: (1) Labour force
participation rate: Labour force participation rate is the proportion of the population that is
economically active supplying labor for the production of goods and services during a
specified period; (2) Growth rate of the total labor force: Total labor force compromises
people aging 15 and older who meet the ILO’s definition of the economically active
population: all people who supply labor for the production of goods and services during a
specified period.
2.3.3 State of the official economy
Also, shadow economy activities are reflected in the state of the official economy. For
this reason, we include the following two indicators: (1) GDP per capita: GDP per capita is
gross domestic product converted to international dollars using Purchasing Power Parity
rates, divided by the population; (2) Growth rate of GDP per capita, as (1), but the annual
growth rate of the GDP per capita.
3 The size of the shadow economy for 162 countries
3.1 Econometric methodology
Estimating the size and trend of the shadow economy is a difficult and challenging
task. Methods – designed to estimate the size and trend of the shadow economy – such as
the currency demand approach or the electricity approach consider just one indicator that
”must” capture all effects of the shadow economy. However, it is obvious that shadow
economy effects show up simultaneously in the production, labor, and money markets.
The empirical method used in this paper is based on the statistical theory of unobserved

10
variables, which considers multiple causes and multiple indicators of the phenomenon to
be measured, i.e., it explicitly considers the multiple causes as well as the multiple effects
of the shadow economy.9 In particular, we use a Multiple Indicators Multiple Causes
(MIMIC) model for the empirical analysis.
The main idea behind this model is to examine the relationship between an
unobservable variable, i.e., the shadow economy, and a set of observable variables using
covariance information. In particular, the MIMIC model compares a sample covariance
matrix, i.e., the covariance matrix of the observable variables, with the parametric
structure imposed on it by a hypothesized model.10
For this purpose, the unobservable
variable is linked to the selected indicator variables in a factor analytical model, also called
measurement model. The relationships between the unobservable variable and the
observable explanatory (causal) variables or determinants are specified through a
structural model. The MIMIC model has the following formal structure:
(1)
(2)
The q-vector in the structural equation (1) is a vector of potential causes
of the latent variable η such as measures of the tax and regulatory burdens. The
coefficient vector describes the relationships between the latent variable
and its causes. Thus, the latent variable η is determined by a set of exogenous causes.
Since these causes only partially explain the latent variable η, the error term ς represents
the unexplained component. The measurement equation (2) links the latent variable to its
indicators. The p-vector is a vector of several indicator variables such as
transaction measures and characteristics of the official economy, λ the corresponding
coefficient vector, and ε a p-vector of white noise disturbances.
The MIMIC model is the simultaneous specification of a factor model and a structural
model. In this sense, the MIMIC model tests the consistency of a “structural” theory
through data and has two goals: (i) estimating the parameters (coefficients, variances,
etc.) and (ii) assessing the fit of the model. Applying this to the shadow economy
research, these two goals mean (i) measuring the relationships of a set of observed
causes and indicators to the shadow economy (latent variable), and (ii) testing if the
researcher’s theory or the derived hypotheses, as a whole, fit the data.
9 The pioneers of this approach are Frey and Weck-Hannemann (1984) who applied this approach to cross-section data from the 24 OECD countries for various years. 10 For details see e.g. Bollen (1989).

11
3.2 Limitations estimating the shadow economy
We want to explicitly mention that when using the MIMIC method, there is no clear
division between causal variables, which directly influence (drive) the shadow economy
and indicator variables, in which shadow economy activities are reflected. In other words,
one caveat of the MIMIC method is that, unfortunately, there is not a clear-cut division (or
theoretically-oriented guiding rule) between indicator and causal variables. For example,
when the economy is in a recession with high unemployment, people have a stronger
incentive to work in the shadow economy; this may be seen as a causal variable, but GDP
per capita and other measures are also used as indicator variables, in which shadow
economy activities are reflected. Hence, we recognize that there is some arbitrariness
whether to use a certain variable as causal or indicator. In this paper, we tried to be
consistent, but we admit that we use GDP per capita, for instance, as a causal variable in
some cases, and as an indicator variable in other cases. The reasoning here is that we use
GDP per capita as a causal control variable in the specifications with a relatively
heterogeneous sample, i.e., in the specifications considering the developing countries and
the comprehensive sample of 151/120 countries. We use the growth rate of GDP per
capita as indicator in these specifications and in the specification considering the transition
countries (specification 2). Specifications 3 and 4 considering the high-income OECD
countries use the GDP per capita as an indicator. Given that the OECD countries are
relatively homogeneous, the GDP per capita is not necessarily required as a causal control
variable in these specifications.
Macroeconomic studies estimating the shadow economy typically use traces of
informal activities in the formal economy such as energy consumption, the currency in
circulation, or measures of official GDP to make these activities visible. A “problem” that
can occur is that statistical offices in some countries maybe use certain arbitrary
procedures to impute shadow economy estimates in estimates of official GDP. However,
neither is information about the particular imputation method available nor is data (or
estimates) for the shadow economy published. Clearly, it is important to keep this
measurement issue in mind when interpreting the results. If estimates of official GDP have
been corrected for informality in some countries, we would attribute less informality, when
the true size is larger. Nevertheless, the procedure outlined in this paper is very valuable
for researchers and policy makers as it assesses the determinants and provides insights
into the size and development of each country’s shadow economy. This is especially true
because we use a unique dataset and one consistent method, i.e., the MIMIC approach,
for all countries with the explicit goal to derive shadow economy estimates as comparable
as possible.

12
3.3 Econometric results
As mentioned in the introduction, one important contribution of the paper is to study
the relationship between enforcement and the shadow economy. However, data limitations
do neither allow us to consider these measures for a large number of the developing
countries nor the whole sample. The ideal situation would be if a comprehensive data set
including measures on enforcement was available for all countries over the entire period
1996 to 2007. Unfortunately, this is not the case. For that reason, we present four
different specifications including measures of enforcement for a selected number of
countries in Table 1.11
The second contribution is using a coherent data set for a maximum number of
countries to produce consistent data of the sizes and trends of the shadow economies in
these countries. Doing this, we face – even without enforcement measures – the problem
that there still be data limitations and due to this, Table 2 presents six different
specifications. We believe it is interesting to see which variables turn out to be significant,
especially if one uses subsamples of countries, where more and different causal variables
are available. Consistent estimation for 120 and 151 countries is provided in specification
6 and 5 in Table 2, from which we can also calculate the size and trend of the shadow
economies. The sources and definitions of the variables we have used in the estimations
are elaborated in the appendix.
3.3.1 Findings considering enforcement measures
We have estimated four different specifications each including a different measure of
enforcement. The first specification tests whether a higher share of sub-national
government employment (SUBEMPL) impacts the shadow economy. The structural
equation of this specification is given as:
(3)
and the measurement equation is:
11 The sample includes the following countries: Australia, Bulgaria, Canada, Denmark, Estonia, Hungary, Lithuania, New Zealand, Norway, Poland, the Slovak Republic, Sweden, Switzerland, and the United States for the period 1996 to 2006.

13
(4)
Specifications two, three, and four include the share of sub-national government
expenditures, a variable measuring people’s perceptions about the aspiration of public
sector employees to follow rules in their country, and a dummy indicating whether
governments have extensive taking, spending, or regulatory authority.
Two out of four regressions confirm our expectations that more enforcement
significantly deters shadow economic activities. We find statistical evidence that a higher
share of sub-national government employment reduces the occurrence of shadow
economic activities, all other things being equal (column 1). This result confirms our
theoretical predictions regarding enforcement: The closer the distance between
economic agents and government authorities and the more face to face contacts take
place, the higher is the probability of detection and the less attractive are shadow
economic activities. The dummy variable indicating whether sub-national governments
have extensive taking, spending, or regulatory authority (Authority) provides however
only weak evidence to confirm this finding (Column 4). Column (2) of Table 1 considers a
fiscal measure of enforcement, i.e., the share of sub-national government expenditures.
Although the coefficient shows – as expected – a negative sign, it is not statistically
significant at conventional levels. At a first glance, this result is contradictory to our
theoretical considerations but may be driven by measurement inaccuracy. The
disadvantage of the measure SUBEXP is that it does not reflect the political dimension of
the underlying decision-making process. Even if money is spent at the local level it might
be that central authorities decided about the allocation of expenditures at the local level.
Unfortunately, the SUBEXP variable does not discriminate between financial flows and
the underlying political decision making process. Column (1) however shows that the
political dimension at the local level is an important dimension of enforcement. Finally,
column (3) includes the variable Rules, which approximates enforcement using people’s
believe about the aspiration of public sector employees to follow rules. The more people
believe that public employees strive to follow and enforce rules, the higher the expected
probability of detection and the smaller the shadow economy, all other things being equal.
The estimation result of column (3) presents evidence in favor of this hypothesis as the
estimated coefficient has the correct negative sign and is statistically significant.
In all four estimated specifications we can confirm already accepted knowledge
regarding the determinants of the shadow economy. We find that the variables capturing
the burden of taxation (in a wide sense), i.e., the size of government and fiscal freedom,
have the expected signs and are statistically significant. The same holds for the
unemployment rate. The variable business freedom measuring the regulatory burden also

14
has the expected negative sign and is statistically significant. Turning to the indicator
variables we find that the labor force participation rate and GDP per capita are statistically
significant showing the expected signs.12
[Insert Table 1 about here]
Summarizing these results, we can say that they provide evidence that more
enforcement significantly deters shadow economic activities and confirm our expectations.
The estimated coefficients of the other covariates in the structural equation are quite
stable from one specification to the next and confirm already accepted knowledge about
the shadow economy’s determinants. Although we would like to establish the findings
regarding enforcement making use of a larger set of countries, data availability is the
limiting factor. This is also the reason why we are not able to include enforcement
measures in the empirical analyses for broader sets of countries, which are presented in
the next section.
3.3.2 Findings considering established determinants only
For the total sample two estimations are shown, one for the 151 countries over 1996
to 2007 and, with more causal variables, one sample for 120 countries over 1996 to 2006.
The structural and measurement equations in the empirical models are similar to
equations (3) and (4), although different covariates may be used in the particular equation
depending on data availability and economic reasoning. In addition to the total sample
estimations, econometric estimations using the MIMIC approach are presented for 88
developing countries, 21 Eastern European and Central Asian (mostly former transition)
countries; and 25 high income OECD-countries. For the high income OECD countries two
estimations are shown, one over the period 1996 to 2006 and one over the period 1996 to
2007. For the 88 developing countries and the 21 Eastern European and Central Asian
countries, the estimations were done over the period 1994 to 2006 and for the 25 OECD
countries over the period 1996 to 2007. For the total sample of 151(120) countries we use
data for the period from 1996 up to 2007(2006).
For the developing countries we use as cause variables the following six: share of
direct taxation (direct taxes in percent of overall taxation), size of government (general
government final consumption expenditure, in percent of GDP) as proxy for indirect
taxation and a variable, fiscal freedom (an index consisting of the top tax rate on
individual income, the top tax rate on corporate income, and total tax revenues as percent
of GDP) as three tax burden variables in a wide sense; regulatory intensity for state
regulation, and the business freedom index (which is composed of the following
components: time to open a business, financial costs to start a business, minimum capital
12 Note that the coefficient of the variable currency is fixed to the value of 1 in order to identify the model as explained in section 3.1.

15
stock to start a business, and costs for obtaining a license), the state of economy with the
two variables: the unemployment rate and GDP per capita. As indicator variables we use
growth rate of GDP per capita, the labor force participation rate (people over 15
economically active in % of total population), and as currency we use M0 divided by M1.
For the Eastern European and Central Asian (mostly former transition) countries, we use
as cause variables the size of government, the fiscal freedom index, for state regulation
the business freedom index, and for the state of the economy the unemployment rate,
inflation rate and openness (sum of export and imports of goods and services, in percent
of GDP). As indicators, we use the growth rate of GDP per capita, the growth rate of total
labor force, and the ratio M0 over M1. For the 25 OECD countries, we use the total tax
burden (total tax revenues in percent of GDP), the fiscal and business freedom indices, a
regulatory quality index, and the unemployment rate. As indicator variables, we use GDP
per capita, the labor force participation rate and a measure for currency (M0 over M2). For
the total sample of 151 countries we use as cause variables the size of the government,
the unemployment rate, government effectiveness, and the GDP per capita. As indicators
we use currency (M0 over M1), the growth rate of GDP per capita, and the labor force
participation rate. For the 120 countries, we have additional causal variables. Here we
include the size of the government, the fiscal freedom index, the share of direct taxation,
the business freedom index, the unemployment rate, government effectiveness, and the
GDP per capita. As indicator variables we use currency (M0 over M1), the growth rate of
GDP per capita, and the growth rate of total labor force.
The estimations results for the 88 developing countries over the same period are
shown in specification 1. All estimated coefficients of the cause variables have the
theoretically expected signs. Except for the unemployment rate, all other cause variables
are statistically significant, at least at the 90-percent confidence level. The share of direct
taxation and the size of government are highly statistically significant, as well as the fiscal
freedom and the business freedom variable. Also, the GDP per capita is highly statistically
significant with the expected negative sign. If we turn to the indicator variables, the labor
force participation rate and the growth rate of GDP per capita in the measurement
equation are highly statistically significant. The test statistics are also quite satisfactory.
In specification 2, the MIMIC estimation result for the 21 Eastern European and
Central Asian (mostly former transition) countries over the period 1994 to 2006 is shown.
The size of government and the fiscal freedom variable (both capturing the overall state
burden), they are highly statistically significant causes and have the expected signs.
Turning to regulation, the economic freedom variable has the expected negative significant
sign. As these countries experienced periods of high inflation, we include the inflation rate,
which has the expected positive, highly significant sign. The variable openness, modeling
in a certain way the transition process, is also statistically significant. Considering the

16
indicator variables, the growth rate of the total labor force is statistically significant, as
well as the growth rate of GDP per capita. Also, here the test statistics are quite
satisfactory.
In specifications 3 and 4, the estimation results for the 25 high-income OECD
countries are shown over the period 1996 to 2006 and 1996 to 2007.13
In specification 3,
the two variables capturing government burden (total tax burden and fiscal freedom) are
highly statistically significant and have the expected sign. The unemployment rate has a
positive sign and is at 90 percent confidence level statistically significant. The two
variables capturing the regulatory burden, i.e., business freedom and regulatory quality,
have the expected signs and are highly statistically significant. Turning to the indicator
variables, the labor force participation rate and currency (ratio of M0 over M2) are both
highly statistically significant. Also, the test statistics for this equation are quite
satisfactory. Specification 4 excludes fiscal and business freedom, which allows us to
estimate the model up to the year 2007. All causal variables are highly statistically
significant and have the same signs as in specification 3. The same is true for the
indicators.
Specifications 5 and 6 present two estimations of 151 and 120 countries. In
specification 5 we present the results of 151 countries estimated over the period 1996 to
2007. Turning first to the causal variables, we see that the size of government has the
expected positive sign and is highly statistically significant. The same holds for the two
variables that describe the state of the economy, the unemployment variable, statistically
significant with a positive sign, and GDP per capita, which is highly statistically significant
with the expected negative sign. Turning to the indicator variables, the growth rate of GDP
per capita and the labor force participation rate have the expected signs and are highly
statistically significant. If we reduce this sample to 120 countries, we can include more
causal variables and the results are presented in specification 6. Here, we see that as we
have three variables capturing the burden of taxation (in a wide sense): the size of
government, fiscal freedom and share of direct taxation. All three have the expected signs
and are statistically significant. As regulatory variables we have business freedom and
government effectiveness, which, again, have the expected negative signs and are
statistically significant. For the state of the economy, we have the unemployment rate,
which is not statistically significant, and GDP per capita, statistically significant with the
expected negative sign. For the indicators, we have currency (M0 over M1), the labor force
participation rate and GDP per capita, being statistically significant and showing the
expected sign.
[Insert Table 2 about here]
13 A number of variables are not available for 2007; hence we have two different sets of cause variables.
17
Summarizing these results, we can say that for all groups of countries, the theoretical
considerations of the causes of the shadow economy in section 2 behave according to our
expectations. However, the estimated coefficients in Table 2 are quite different in
magnitude from one specification to the next. Because it is rather difficult to come up with
an explanation for the exact differences in the magnitude of the coefficients, we only
present a general interpretation for this observation. With respect to the indices measuring
regulation in one way or the other, i.e., the fiscal freedom and business/economic freedom
indices, our results suggest that regulation is a much more important determinant in
developed and transition countries than in developing ones. It seems that – for the reason
that the burden of regulation is on average higher in developed and transition countries as
more rules, regulations, and administrative procedures are in place – the importance of
regulation being a determinant of the shadow economy increases with the level of
development. On the contrary, in developing countries in which regulation is often less
burdensome, the coefficients of the fiscal and business freedom indices are much smaller
and hence regulation is a less important determinant of the shadow economy. Regarding
the unemployment rate it seems that higher unemployment rates due to on average more
regulated and hence less flexible labor markets significantly contribute to the size and
trend of the shadow economies in OECD countries. Comparing specifications 2 and 4, the
unemployment rate seems to be a more important determinant in OECD than in transition
countries. In developing countries however, unemployment is not a significant determinant
of the shadow economy. This finding may not be surprising as the formal economy in
those countries hardly provides sufficient income for families and individuals. Working in
the informal sector, or the shadow economy, however is a way of making a living outside
the formal economy – either as an alternative to or as a means of supplementing income
earned in the formal economy [ILO (1972); Bromley and Gerry (1979), pp. 4-6]. That is,
providing subsistence to families is an important reason for the existence of the shadow
economy in developing countries. It may thus not be necessarily attributed to official
measures of the unemployment rate.
The estimation results further show a slightly different impact of “policy” causal
variables compared to non-policy “economic” causal variables across the different groups
of countries. In general economic variables, i.e., the level of development and the state of
the economy measured by the GDP per capital and the unemployment rate are very
important determinants of the shadow economy. The estimated coefficients indicate that
an improvement of economic conditions would reduce the size of the shadow economy. Of
course, for the unemployment rate this is only true for transition and highly developed
OECD countries. Comparing the impact of the policy variables such as the different
measures of the tax burden and regulation on the shadow economy across the estimated
specifications also reveals interesting results. A reduction of the regulatory burden and
18
improvement of business/economic freedom in transition and OECD countries leads to a
much higher reduction of the shadow economy than it would in developing countries;
which is clearly indicated by the (much) larger coefficients of these variables. Fiscal
freedom, however, is similarly important across all groups of countries.
3.4 The shadow economies in 162 countries from 1999 to 2006/2007
We use the estimation results shown in Table 2 to calculate the sizes and trends of the
shadow economies in 162 countries as they are derived from the most comprehensive
dataset available.14
The estimated MIMIC coefficients allow us to determine only relatively
estimated sizes of the shadow economies in the first place, describing their pattern over
time. In order to calculate the sizes and trends of the shadow economies, we must convert
the MIMIC index into “real world” figures measured in percentage of official GDP. This final
step requires an additional procedure so called benchmarking or calibration procedure.
Unfortunately, no consensus exists in the literature which benchmarking procedure to use.
We use the methodology promoted by Dell’Anno (2007) and Dell’Anno and Solomon
(2008). In the first step, the MIMIC model index of the shadow economies is calculated
using the structural equation (1), i.e., by multiplying the coefficients of the significant
causal variables with the respective time series. For the numerical example of specification
1 in Table 2 the structural equation is given as
tttttt xxxxx 54321 26.005.003.006.015.0~ ⋅−⋅−⋅−⋅+⋅=η 15 (5)
Secondly, this index is converted into absolute values of the shadow economies taking
base values in a particular base year. The exogenous base values necessary for this final
step of the calibration procedure are from the year 2000 and taken from Schneider (2007)
who estimated the shadow economies in 145 countries around the world using the MIMIC
and the currency demand approach.16
Using the exogenous shadow economy estimates of
Schneider (2007) derived from a currency demand approach, the size of the shadow
14
Schneider, Buehn, and Montenegro (2010b) present first, preliminary estimates for
the shadow economies around the world. 15 x1t is size of government, x2t is the share of direct taxation, x3t and x4t are the fiscal and business freedom indices, and x5t represents GDP per capita. 16 The currency demand approach may be attributed to Tanzi (1983) who estimated a
currency demand function for the United States for the period 1929 to 1980 in order to calculate the shadow economy. Assuming that economic agents in the shadow economy use cash to leave no observable traces for authorities, an increase in the size of the shadow economy will increase the demand for currency. To isolate the resulting excess demand for currency an equation for currency demand is estimated including covariates such as the development of income, payment habits, interest rates, and so forth. Figures for the size and trend of the shadow economy can then be calculated by comparing the difference between the development of currency when the direct and indirect tax burdens (and government regulations) are held at their lowest values, and the development of currency with the actual burden of taxation and government regulations. See Schneider and Enste (2000) for a more detailed description.

19
economy tη̂ at time t can be calculated as:
*2000
2000~
~ˆ η
ηηη t
t = (6)
where tη~ denotes the value of the MIMIC index at t according to equation (1), 2000~η is the
value of this index in the base year 2000, and 2000η∗ is the exogenous currency-demand-
approach-estimate (base value) of the shadow economies in 2000. Applying this
benchmarking procedure, the final estimates of the shadow economies can be calculated.17
Of course, when showing the size of the shadow economies for countries which are
quite different in location and development stage, one should be aware that such country
comparisons gives only a rough picture of the ranking of the size of the shadow economy
in these countries and over time, because the MIMIC and the currency demand methods
have shortcomings [see e.g. Breusch (2005); Ahumada et al. (2007)]. Table 3 presents
the evolution of the shadow economy in 162 countries between 1999 and 2007. In order
to make the results more accessible for the reader, Table 3 highlights three important sub-
groups of countries, i.e., transition countries of Eastern Europe and the former Soviet
Union, high-income OECD countries, as well as emerging and developing countries.18
The
results within each group are presented in alphabetical order.
[Insert Table 3 about here]
The un-weighted average of the shadow economies in 25 high-income OECD countries
was 17.7% in 1999, and decreased to 16.6% in 2007. Some high-income OECD countries,
like Portugal, have ups and downs, while others (like Belgium and Australia) show a
steady decrease. The countries with the smallest shadow economies include Switzerland,
the United States, and Luxembourg with an average size over the period 1999 to 2007 of
8.5, 8.6, and 9.7 percent, respectively. The largest shadow economies among these 25
high-income OECD countries include Mexico with 30.0, Greece with 27.5, and Italy with
27.0 percent. The un-weighted average shadow economy of the 25 Eastern European and
Central Asian (mostly former transition) countries was 38.7% in 1999 and decreased to
34.2% in 2007. The three countries with the smallest shadow economies are the Slovak
and Czech Republics, and Hungary with an average size over the period 1999 to 2007 of
18.1, 18.4, and 24.4 percent. Romania, Bosnia & Herzegovina, and Albania are in the
middle with 32.6, 33.6, and 34.3 percent. The highest shadow economies include the
Ukraine, Azerbaijan, and Georgia with 49.7, 58.0, and 65.8 percent, respectively.
Large shadow economies in some developing countries are only to some extent an
issue of tax burden and regulation, given the simple fact that the limited local economy
means that citizens are often unable to earn a living wage in a legitimate manner. Working
17 The base values originate from the year 2000 except for some developing countries, for which we sometimes used base values from the year 2005 because of data availability. 18 Classification of emerging and developing countries follows the IMF (2010).

20
in the shadow economy is often the only way of achieving a minimal standard of living in
developing countries (excluding the direct taxation variable in the MIMIC estimation). If we
consider the trend of the un-weighted average of the emerging and developing countries
over time, in the year 1999 the size was 37.5% and modestly decreased to 35.4% in the
year 2007. The three countries with the smallest shadow economies are China, Qatar, and
Vietnam with an average country size of 12.7, 14.1, and 15.1 percent respectively.19 The
middle of the distribution includes Brazil, Guinea, and Burundi with an average size of
39.0, 39.0, and 39.5 percent of GDP. The highest shadow economies include Zimbabwe,
Panama, and Bolivia with a size of 61.8, 63.5, and 66.1 percent of GDP. Overall, the
lowest level of informality for any country in the world is 8.5% of GDP (Switzerland), and
the highest is 66.1 (Bolivia).
Table 3 presents at its bottom line the simple un-weighted yearly average which is not
the average informality for the World but the average World’s informality when one
weights every country equally. In order to measure how much of the GDP in the world is
really informal, we weighted by total country GDP. In particular, for every country/year we
weighted the rate of informality by the total GDP. This gives us the GDP in current Billion
US dollars that is informal for each country/year. Then we added up this amount and
divided it by the total GDP of the sample. The same had also been done for the sub-
samples of the eight world regions the World Bank distinguishes. According to these
calculations, Table 4 shows much lower rates of informal GDP for the world as a whole,
with an average of 17.1%. The results with respect to the countries’ development stage
are very impressive too: the averages of the weighted yearly informality estimates
demonstrate that Sub-Saharan Africa has the largest shadow economies (with an average
of 37.6%) followed by Europe and Central Asia (with an average of 36.4%). At the bottom
of the distribution we find the OECD countries with an average of 13.4%, which is
consistent with the fact that richer economies have lower informality rates.
[Insert Table 4 about here]
We also present the shadow economy measures country by country in a world map
view using the country’s simple average over the years. Countries shown with darker
colors in Figure 1 indicate countries with higher level of informality. Among them are for
example Azerbaijan, Bolivia, Peru, Panama, Tanzania, and Zimbabwe. Countries shown
with lighter color indicate countries with lower levels of informality. Among them are for
example Austria, Japan, Luxembourg, Switzerland, the United States, and the United
Kingdom.
[Figure 1 here]
Finally, we would like to address the reliability of our estimates. The size of the
19 It should be mentioned that Mainland China and Vietnam are still communist countries with partly market economies, so that the figures of these two countries may be biased.

21
shadow economy has been estimated for different countries and time periods using
various methods such as the physical (electricity) input method, the transaction approach,
the currency demand approach, or the MIMIC approach.20
Of course, different estimation
procedures produce different results. The literature agrees on figures produced by the
transaction and the discrepancy approaches being unrealistically large. The figures
obtained using the currency demand and MIMIC approaches are much lower and the
estimates obtained from the survey approach are even more so because when using
survey methods, structured, face-to-face interviews are done asking sensitive questions
about respondents’ activities in the shadow economy. For that reason, the survey method
is often considered providing a lower bound for the size of the shadow economy. The
survey method has been used e.g. in Germany, the Scandinavian countries, Great Britain,
and the Netherlands. While the questionnaires in these studies are broadly comparable in
design, recent attempts by the European Union (EU) to provide survey results for all EU
member states report difficulties regarding comparability [Renooy et al. (2004); European
Commission (2007)]; the wording of the questionnaires becomes more and more
cumbersome depending on the culture of different countries with respect to the shadow
economy.
The MIMIC approach assumes that the shadow economy is an unobservable
phenomenon (latent variable) that can be estimated using measurable causes of
informality such as the tax burden and the intensity of regulation, and indicators reflecting
these activities, for example, currency in circulation or official GDP. Although it yields
reasonable estimates bounded by those produced by the survey method and the currency
demand approach, a disadvantage of the MIMIC procedure is the fact that it produces only
relative estimates of the size and the development of the shadow economy. Thus,
exogenous estimates – mostly calculated using the currency demand approach – are
needed to calibrate the relative into absolute estimates of the size of the shadow
economy. Although both – most widely used methods – have their drawbacks and biases
in the estimates of the shadow economy may exist, no better data are currently available.
4 Summary and conclusions
There are many obstacles to overcome when measuring the size of the shadow
economy and analyzing its consequences on the official economy. But, as this paper
shows, some progress can be made. We provide estimates for the sizes of the shadow
economies in 162 countries over the period 1999 to 2006/2007 using the MIMIC procedure
for the econometric analysis and a benchmarking procedure to calibrate the estimated
20 The paper does not discuss the different methodologies nor their advantages or disadvantages in detail. For an excellent survey concerning this matter we refer to Schneider and Enste (2000).
22
MIMIC into absolute shadow economy values. One may argue that the estimated models
do not capture the shadow economy as the measurement model regresses the indicators
on a – per se undefined – latent variable and the meaning of the latent variable depends
on how well the indicators correspond to the operational definition. Of course, indicators
are often only imperfectly linked to the latent variable (Bollen 1989), but it is obvious from
equation (2) that a change in the latent variable affects its indicators. This can be clarified
further taking the structural model of equation (1) into account: The (microeconomic)
incentives determine the economic agent’s migration into the shadow and the latent
macroeconomic amount of the shadow economy should react. Thus, a change in the
microeconomic incentive structure transmits uniformly to the macroeconomic aggregate of
the shadow economy. From an econometric point of view, there are two ways to test for
the validity of a structural model [Bollen (1989)]. First, it is necessary to examine the fit of
the model. Secondly, variables related to the latent variable in the theoretical literature
should have the expected impact. We have dealt with these two validity tests above: all
causal and indicator variables – their selection has been guided by previous theoretical as
well as empirical findings – show the theoretically expected correlation to the shadow
economy and the various estimated specifications show satisfactory goodness-of-fit
statistics. We thus accept the validity of the empirical models and the new insights gained
from our analysis of the sizes and trends of the shadow economies of 162 countries lead to
four conclusions:
The first conclusion is that enforcement is an important determinant of the shadow
economy. All four enforcement measures are negatively correlated to the shadow
economy and two of them are significant at conventional confidence levels. Our results
thus confirm findings of the theoretical literature: More enforcement can effectively deter
shadow economic activities. Although this result has been derived form a small sub-
sample of countries, the cautious conclusion is that enforcement is a useful policy
instrument to control the size of the shadow economy. Of course, our analysis is only a
first step but offers a promising avenue for future research. The second conclusion is
that for all countries investigated the shadow economy has reached a size of an weighted
average value of 17.1% of official GDP over 162 countries over 1999 to 2007. However,
equally important is the clear negative trend of the sizes of the shadow economies over
time. The average size of the shadow economies of all 162 countries (developing, Eastern
European and Central Asian and high income OECD countries) decreased from 34.0% of
official GDP in 1999 to 31.2% of official GDP in 2007. Of course, these results need to be
interpreted with caution as measurement inaccuracies in the observable variables may
lead to biased shadow economy estimates. The third conclusion is that shadow
economies are a complex phenomenon present to an important extent in developing,
transition as well as highly developed economies. People engage in shadow economic

23
activities for a variety of reasons. Among the most important are government actions,
most notably, taxation and regulation. The fourth conclusion is that there are regional
disparities in the level of informality, but obviously also regional clusters. At the top level
of informality we find Sub-Saharan Africa, while OECD countries show the lowest level.
Considering these four conclusions, it is apparent that one of the big challenges for
every government is to undertake efficient incentive orientated policy measures in order
to make working in the shadow economy less attractive and, hence, to make working in
the official economy more attractive. Successful implementation of such policies may
lead to a stabilization, or even reduction, of the size of the shadow economies. Of
course, even after 20 years of intensive research the size, causes, and consequences of
the shadow economy are still controversially debated in the literature and further
research is necessary to improve our understanding about the shadow economy.
References
Allingham, M. G. and A. Sandmo (1972), “Income Tax Evasion: A Theoretical Analysis,” Journal of Public Economics, 1(3-4), 323–338.
Ahumada, Hildegart, Facundo Alvaredo, and Alfredo Canavese, (2007), “The Monetary Method and the Size of the Shadow Economy: A Critical Assessment,” Review of
Income and Wealth, 53(2), 363-371.
Becker, G. (1968), “Crime and Punishment: An Economic Approach,” Journal of Political
Economy, 76, 169–217.
Beron, Kurt J., Helen V. Tauchen, and Ann Dryden Witte (1992), “The Effect of Audits and Socioeconomic Variables on Compliance,” in Why People Pay Taxes, ed. Joel Slemrod, 67-89. Ann Arbor: University of Michigan Press.
Besley, T. and T. Persson (2010), “State Capacity, Conflict, and Development,” Econometrica, 78(1), 1–34.
Bhattacharyya, Dilip K., (1999), “On the Economic Rationale of Estimating the Hidden Economy,” The Economic Journal, 109(456), 348–359.
Bollen, Kenneth A. (1989), Structural Equations with Latent Variables, New York: Wiley.
Breusch, Trevor, (2005), “The Canadian Underground Economy: An Examination of Giles and Tedds,” Canadian Tax Journal, 53(2), 367–391.
Bromley, R. and C. Gerry (1979), Casual Work and Poverty in Third World Cities, Wiley: Chichester.
Buehn, Andreas, Alexander Karmann and Friedrich Schneider, (2009), “Shadow Economy and do-it-yourself Activities: The German Case,” Journal of Institutional and
Theoretical Economics, 164(4), 701-722.
Dahlström, Carl, Victor Lapuente, and Jan Teorell, (2010), Dimensions of Bureaucracy. A
Cross-National Dataset on the Structure and Behavior of Public Administration, QoG Working Paper Series 2010:13, The Quality of Government Institute, University of Gothenburg.
Dell’Anno, Roberto, (2007), “The Shadow Economy in Portugal: An Analysis with the MIMIC Approach,” Journal of Applied Economics, 10, 253-277.
Dell’Anno, Roberto and Offiong H Solomon, (2008), “Shadow Economy and Unemployment Rate in USA: Is there a Structural Relationship? An Empirical Analysis,” Applied
Economics, 40, 2537-2555.
Deregulation Commission (1991), Opening of Markets and Competition, Report presented
to the German Federal Government, Bonn.

24
Enste, Dominik and Friedrich Schneider, (2006), “Wie groß ist die Schattenwirtschaft? Des Rätsels Lösung,“ Wirtschaftsdienst – Zeitschrift für Wirtschaftspolitik, 86(2), 185–191.
Feige, Edgar L. (1989), The Underground Economies. Tax Evasion and Information
Distortion, Cambridge: Cambridge University Press.
Feige, Edgar L., (1994), “The underground economy and the currency enigma,” Supplement to Public Finance/ Finances Publiques, 49, 119-136.
Feld, Lars and Friedrich Schneider, (2010), “Survey on the Shadow Economy and Undeclared Earnings in OECD Countries,” German Economic Review, 11(2), 109-149.
Feld, Lars P. and Claus Larsen (2011), Undeclared Work, Deterrence, and Social Norms:
The Case of Germany, Berlin: Springer, forthcoming.
Frey, Bruno S. and Hannelore Weck-Hannemann, (1984), “The Hidden Economy as an “Unobserved” Variable,” European Economic Review, 26(1), 33–53.
Frey, Bruno S. and Werner Pommerehne, (1984), “The Hidden Economy: State and Prospect for Measurement,” Review of Income and Wealth, 30(1), 1–23.
Giles, David, E.A., (1999a), “Measuring the Hidden Economy: Implications for Econometric Modelling,” The Economic Journal, 109(456), 370–380.
Giles, David, E.A., (1999b), “Modelling the Hidden Economy in the Tax-Gap in New Zealand,” Empirical Economics, 24(4), 621–640.
Giles, David, E.A. and Lindsay M. Tedds (2002), Taxes and the Canadian Underground
Economy, Toronto/Ontario: Canadian Tax Foundation.
International Labour Organization (ILO) (1972), Employment, Income and Equality: A
Strategy for Increasing Productivity in Kenya, ILO: Geneva.
International Monetary Fund (IMF) (2010), IMF Emerging and Developing Economies List, World Economic Outlook Database, April 2010, Washington, D.C.: The International Monetary Fund.
Johnson, Simon, Daniel Kaufmann, and Andrei Shleifer, (1997), “The Unofficial Economy in Transition,” Brookings Papers on Economic Activity, 2, 159-221.
Johnson, Simon, Daniel Kaufmann, and Pablo Zoido-Lobatón, (1998a), “Regulatory Discretion and the Unofficial Economy,” The American Economic Review, 88(2), 387–392.
Johnson, Simon, Daniel Kaufmann, and Pablo Zoido-Lobatón (1998b), Corruption, Public
Finances and the Unofficial Economy, Washington, D.C.: The World Bank.
Pedersen, Søren (2003), The Shadow Economy in Germany, Great Britain and
Scandinavia: A Measurement Based on Questionnaire Survey, Copenhagen: The Rockwoll Foundation Research Unit.
Prado, Mauricio (2011), “Government Policy in the Formal and Informal Sectors,” European Economic Review, forthcoming.
Sarte, Pierre-Daniel G. (2000), “Informality and Rent-seeking Bureaucracies in a Model of Long-run Growth,” Journal of Monetary Economics, 46, 173-197.
Schneider, Friedrich, (1986), “Estimating the Size of the Danish Shadow Economy Using the Currency Demand Approach: An Attempt,” The Scandinavian Journal of
Economics, 88(4), 643–668.
Schneider, Friedrich, (1997), “The Shadow Economies of Western Europe,” Journal of the
Institute of Economic Affairs, 17(3), 42–48.
Schneider, Friedrich, (2005), “Shadow Economies Around the World: What do we Really Know?,” European Journal of Political Economy, 21(3), 598–642.
Schneider, Friedrich, (2007), “Shadow Economies and Corruption all Over the World: New Estimates for 145 Countries,” Economics, 2007–9, July 2007.
Schneider, Friedrich and Dominik Enste, (2000), “Shadow Economies: Size, Causes, and Consequences,” The Journal of Economic Literature, 38(1), 77–114.
Schneider, Friedrich, Andreas Buehn, and Claudio E. Montenegro (2010a), “Shadow
25
Economies all over the World: New Estimates for 162 Countries from 1999 to 2007,” World Bank Policy Research Paper 5356.
Schneider, Friedrich, Andreas Buehn, and Claudio E. Montenegro (2010b), “New Estimates for the Shadow Economies all over the World,” International Economic
Journal, 24, 443-461.
Schneider, Friedrich, Andreas Buehn, and Claudio E. Montenegro (2011), “Shadow Economies all over the World: New Estimates for 162 Countries from 1999 to 2007,” forthcoming in: Schneider, Friedrich (Ed.), Handbook on the Shadow Economy, Edward Elgar Publishing
Slemrod, Joel (2007), “Cheating Ourselves: The Economics of Tax Evasion,” Journal of
Economic Perspectives, 21(1), 25-48.
Slemrod, Joel and Caroline Weber (2010), “Evidence of the Invisible: Toward a Credibility
Revolution in the Empirical Analysis of Tax Evasion and the Informal Economy,” paper delivered as keynote address at the Annual Congress of the International Institute of Public Finance, August 23-26, 2010, Uppsala, Sweden.
Slemrod, Joel, Marsha Blumenthal, and Charles Christian (2001), “Taxpayer Response to an Increased Probability of Audit: Evidence from a Controlled Experiment in Minnesota,” Journal of Public Economics, 79(3): 455-83.
Smith, Philip, (1994), “Assessing the Size of the Underground Economy: The Statistics Canada Perspectives,” Canadian Economic Observer, 7, 3.16-3.33.
Tanzi, Vito, (1983), “The Underground Economy in the United States: Annual Estimates, 1930– 1980,” IMF-Staff Papers, 30(2), 283–305.
Tanzi, Vito, (1999), “Uses and Abuses of Estimates of the Underground Economy,” The
Economic Journal, 109(456), 338–340.
Teorell, Jan, Nicholas Charron, Marcus Samanni, Sören Holmberg & Bo Rothstein, (2010), The Quality of Government Dataset, version 27May10. University of Gothenburg: The Quality of Government Institute, http://www.qog.pol.gu.se
Thomas, Jim J., (1999), Quantifying the Black Economy: Measurement without Theory Yet Again?,” The Economic Journal, 109(456), 381–389.

26
Table 1 Estimation results addressing enforcement
Independent variables Enforcement-
specification
1
Enforcement-
specification
2
Enforcement-
specification
3
Enforcement-
specification
4
Causal variables
Size of government 0.28*** (4.52)
0.30*** (4.68)
0.31*** (4.79)
0.30*** (4.60)
Share of direct taxation 0.05 (1.50)
0.05 (1.45)
0.05 (1.70)*
0.04 (1.29)
Fiscal freedom -0.09*** (2.77)
-0.09*** (2.62)
-0.09*** (2.63)
-0.08*** (2.55)
Business freedom -0.24*** (5.38)
-0.25*** (5.53)
-0.25*** (5.55)
-0.25*** (5.39)
Unemployment rate 0.08** (2.23)
0.08** (2.23)
0.09*** (2.42)
0.08** (2.22)
Government effectiveness -0.02 (0.79)
-0.02 (0.85)
-0.02 (0.71)
-0.02 (0.85)
SUBEMPL -0.38** (1.99)
SUBEXP
-0.21 (1.27)
Rules
-0.11** (2.17)
Autonomy
-0.05 (0.66)
Indicator variables
GDP per capita -1.40*** (6.35)
-1.35*** (6.53)
-1.34*** (6.59)
-1.39*** (6.36)
Labor force participation rate
-0.26* (1.68)
-0.25* (1.68)
-0.26* (1.71)
-0.25 (1.63)
Currency 1 1 1 1
Statistical tests
RMSEA (p-value)
0.00 (1.00)
0.00 (1.00)
0.00 (1.00)
0.00 (0.98)
Chi-square (p-value)
21.06 (0.97)
21.99 (0.96)
21.00 (0.97)
27.10 (0.83)
AGFI 0.95 0.95 0.95 0.94
Degrees of freedom 35 35 35 35
Number of observations 141 141 141 141
Note: SUBEMPL = share of sub-national government employment; SUBEXP = share of sub-national government expenditures; Rules = people’s perceptions about public employees’ aspirations to follow rules; Authority dummy = 1 if sub-national governments have extensive taking, spending, or regulatory authority, zero otherwise. Absolute z-statistics in parentheses. ***, **, * denote significance at the 1, 5, and 10% significance level. All variables are used as their standardized deviations from mean. According to the MIMIC models identification rule (see also section 3.1), one indicator has to be fixed to an a priory value. We have consistently chosen the currency variable. The degrees of freedom are determined by 0.5(p+q)(p+q+1)–t; with p= number of indicators; q =
number of causes; t = the number for free parameters.
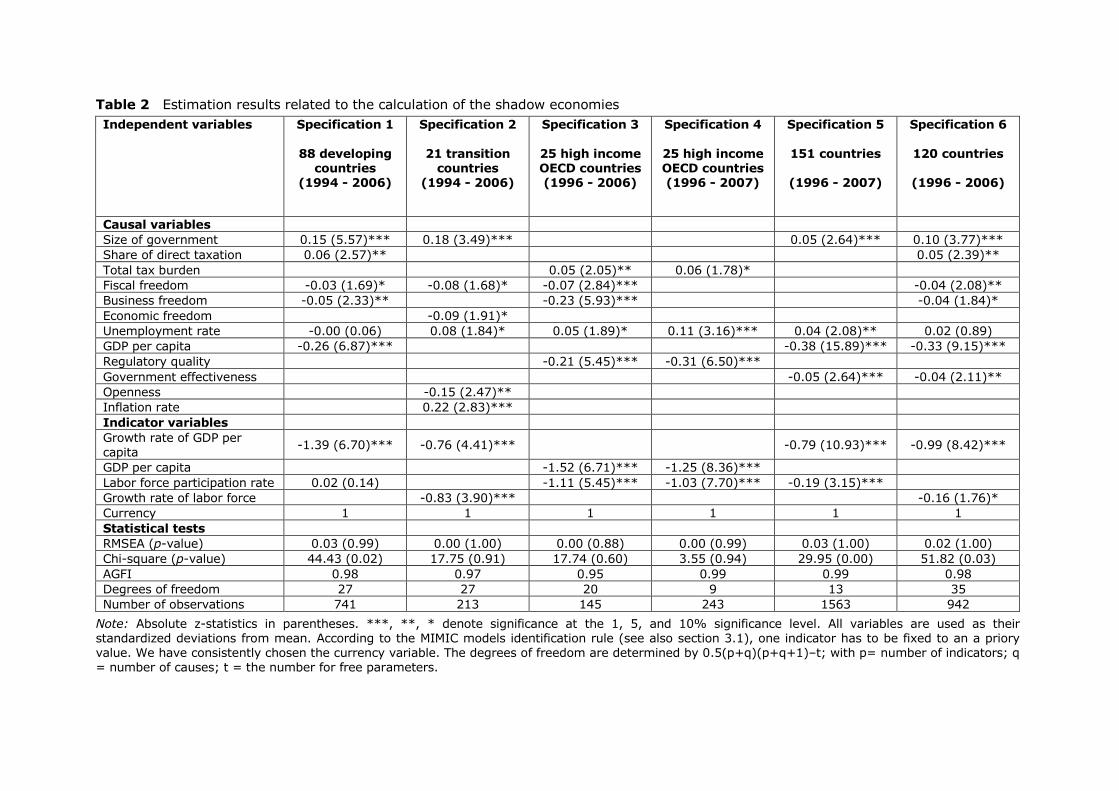
Table 2 Estimation results related to the calculation of the shadow economies
Independent variables Specification 1
88 developing
countries
(1994 - 2006)
Specification 2
21 transition
countries
(1994 - 2006)
Specification 3
25 high income
OECD countries
(1996 - 2006)
Specification 4
25 high income
OECD countries
(1996 - 2007)
Specification 5
151 countries
(1996 - 2007)
Specification 6
120 countries
(1996 - 2006)
Causal variables Size of government 0.15 (5.57)*** 0.18 (3.49)*** 0.05 (2.64)*** 0.10 (3.77)*** Share of direct taxation 0.06 (2.57)** 0.05 (2.39)** Total tax burden 0.05 (2.05)** 0.06 (1.78)* Fiscal freedom -0.03 (1.69)* -0.08 (1.68)* -0.07 (2.84)*** -0.04 (2.08)** Business freedom -0.05 (2.33)** -0.23 (5.93)*** -0.04 (1.84)*
Economic freedom -0.09 (1.91)* Unemployment rate -0.00 (0.06) 0.08 (1.84)* 0.05 (1.89)* 0.11 (3.16)*** 0.04 (2.08)** 0.02 (0.89) GDP per capita -0.26 (6.87)*** -0.38 (15.89)*** -0.33 (9.15)***
Regulatory quality -0.21 (5.45)*** -0.31 (6.50)***
Government effectiveness -0.05 (2.64)*** -0.04 (2.11)** Openness -0.15 (2.47)** Inflation rate 0.22 (2.83)***
Indicator variables Growth rate of GDP per capita
-1.39 (6.70)*** -0.76 (4.41)*** -0.79 (10.93)*** -0.99 (8.42)***
GDP per capita -1.52 (6.71)*** -1.25 (8.36)*** Labor force participation rate 0.02 (0.14) -1.11 (5.45)*** -1.03 (7.70)*** -0.19 (3.15)*** Growth rate of labor force -0.83 (3.90)*** -0.16 (1.76)* Currency 1 1 1 1 1 1 Statistical tests RMSEA (p-value) 0.03 (0.99) 0.00 (1.00) 0.00 (0.88) 0.00 (0.99) 0.03 (1.00) 0.02 (1.00) Chi-square (p-value) 44.43 (0.02) 17.75 (0.91) 17.74 (0.60) 3.55 (0.94) 29.95 (0.00) 51.82 (0.03)
AGFI 0.98 0.97 0.95 0.99 0.99 0.98 Degrees of freedom 27 27 20 9 13 35 Number of observations 741 213 145 243 1563 942
Note: Absolute z-statistics in parentheses. ***, **, * denote significance at the 1, 5, and 10% significance level. All variables are used as their standardized deviations from mean. According to the MIMIC models identification rule (see also section 3.1), one indicator has to be fixed to an a priory value. We have consistently chosen the currency variable. The degrees of freedom are determined by 0.5(p+q)(p+q+1)–t; with p= number of indicators; q = number of causes; t = the number for free parameters.

28
Table 3 Ranking of 162 countries (categorized and in alphabetical order)
No. Country Years Country
1999 2000 2001 2002 2003 2004 2005 2006 2007 Av.
High-income OECD countries
1 Australia 14.4 14.3 14.3 14.1 13.9 13.7 13.7 13.7 13.5 14.0
2 Austria 10.0 9.8 9.7 9.8 9.8 9.8 9.8 9.6 9.5 9.8
3 Belgium 22.7 22.2 22.1 22.0 22.0 21.8 21.8 21.4 21.3 21.9
4 Canada 16.3 16.0 15.9 15.8 15.7 15.6 15.5 15.3 15.3 15.7
5 Denmark 18.4 18.0 18.0 18.0 18.0 17.8 17.6 17.0 16.9 17.7
6 Finland 18.4 18.1 17.9 17.8 17.7 17.6 17.4 17.1 17.0 17.7
7 France 15.7 15.2 15.0 15.1 15.0 14.9 14.8 14.8 14.7 15.0
8 Germany 16.4 16.0 15.9 16.1 16.3 16.1 16.0 15.6 15.3 16.0
9 Greece 28.5 28.7 28.2 28.0 27.4 27.1 26.9 26.4 26.5 27.5
10 Iceland 16.0 15.9 15.8 16.0 15.9 15.5 15.1 15.0 15.0 15.6
11 Ireland 16.1 15.9 15.9 15.9 16.0 15.8 15.6 15.5 15.4 15.8
12 Italy 27.8 27.1 26.7 26.8 27.0 27.0 27.1 26.9 26.8 27.0
13 Japan 11.4 11.2 11.2 11.3 11.2 10.9 10.7 10.4 10.3 11.0
14 Korea. Rep. 28.3 27.5 27.3 26.9 26.8 26.5 26.3 25.9 25.6 26.8
15 Luxembourg 10.0 9.8 9.8 9.8 9.8 9.8 9.7 9.6 9.4 9.7
16 Mexico 30.8 30.1 30.3 30.4 30.5 30.1 29.9 29.2 28.8 30.0
17 Netherlands 13.3 13.1 13.1 13.2 13.3 13.2 13.2 13.2 13.0 13.2
18 New Zealand 13.0 12.8 12.6 12.4 12.2 12.0 12.1 12.1 12.0 12.4
19 Norway 19.2 19.1 19.0 19.0 19.0 18.5 18.5 18.2 18.0 18.7
20 Portugal 23.0 22.7 22.6 22.7 23.0 23.1 23.3 23.2 23.0 23.0
21 Spain 23.0 22.7 22.4 22.4 22.4 22.5 22.4 22.4 22.2 22.5
22 Sweden 19.6 19.2 19.1 19.0 18.7 18.5 18.6 18.2 17.9 18.8
23 Switzerland 8.8 8.6 8.6 8.6 8.8 8.6 8.5 8.3 8.1 8.5
24 United Kingdom 12.8 12.7 12.6 12.6 12.5 12.4 12.4 12.3 12.2 12.5
25 United States 8.8 8.7 8.8 8.8 8.7 8.6 8.5 8.4 8.4 8.6
Average 17.7 17.4 17.3 17.3 17.3 17.1 17.0 16.8 16.6
Transition countries
26 Albania 35.7 35.3 34.9 34.7 34.4 33.9 33.7 33.3 32.9 34.3
27 Armenia 46.6 46.3 45.4 44.5 43.9 43.6 42.7 42.1 41.1 44.0
28 Azerbaijan 61.0 60.6 60.3 60.0 59.1 58.6 56.7 54.0 52.0 58.0
29 Belarus 48.3 48.1 47.9 47.6 47.0 46.1 45.2 44.2 43.3 46.4
30 Bosnia Herzeg. 34.3 34.1 34.0 33.9 33.5 33.6 33.2 32.9 32.8 33.6
31 Bulgaria 37.3 36.9 36.6 36.1 35.6 34.9 34.1 33.5 32.7 35.3
32 Croatia 33.8 33.4 33.2 32.6 32.1 31.7 31.3 30.8 30.4 32.1
33 Czech Republic 19.3 19.1 18.9 18.8 18.7 18.4 17.8 17.3 17.0 18.4
34 Estonia - 32.7 32.4 32.0 31.4 31.1 30.5 29.8 29.5 31.2
35 Georgia 68.3 67.3 67.2 67.2 65.9 65.5 65.1 63.6 62.1 65.8
36 Hungary 25.4 25.1 24.8 24.5 24.4 24.1 24.0 23.7 23.7 24.4
37 Kazakhstan 43.8 43.2 42.5 42.0 41.1 40.6 39.8 38.9 38.4 41.1
38 Kyrgyz Republic 41.4 41.2 40.8 41.4 40.5 39.8 40.1 39.8 38.8 40.4
39 Latvia 30.8 30.5 30.1 29.8 29.4 29.0 28.4 27.7 27.2 29.2
40 Lithuania 33.8 33.7 33.3 32.8 32.0 31.7 31.0 30.4 29.7 32.0
41 Macedonia. FYR 39.0 38.2 39.1 38.9 38.4 37.4 36.9 36.0 34.9 37.6
42 Moldova 45.6 45.1 44.1 44.5 44.6 44.0 43.4 44.3 - 44.5
43 Poland 27.7 27.6 27.7 27.7 27.5 27.3 26.9 26.4 26.0 27.2
44 Romania 34.3 34.4 33.7 33.5 32.8 32.0 31.7 30.7 30.2 32.6
45 Russia 47.0 46.1 45.3 44.5 43.6 43.0 42.4 41.7 40.6 43.8
46 Slovak Republic 18.9 18.9 18.8 18.6 18.3 18.1 17.6 17.2 16.8 18.1
47 Slovenia 27.3 27.1 26.7 26.6 26.4 26.2 25.8 25.3 24.7 26.2
48 Tajikistan 43.5 43.2 42.9 42.7 42.1 41.7 41.5 41.2 41.0 42.2
49 Turkey 32.7 32.1 32.8 32.4 31.8 31.0 30.0 29.5 29.1 31.3
50 Ukraine 52.7 52.2 51.4 50.8 49.7 48.8 47.8 47.3 46.8 49.7
Average 38.7 38.1 37.8 37.5 37.0 36.5 35.9 35.3 34.2
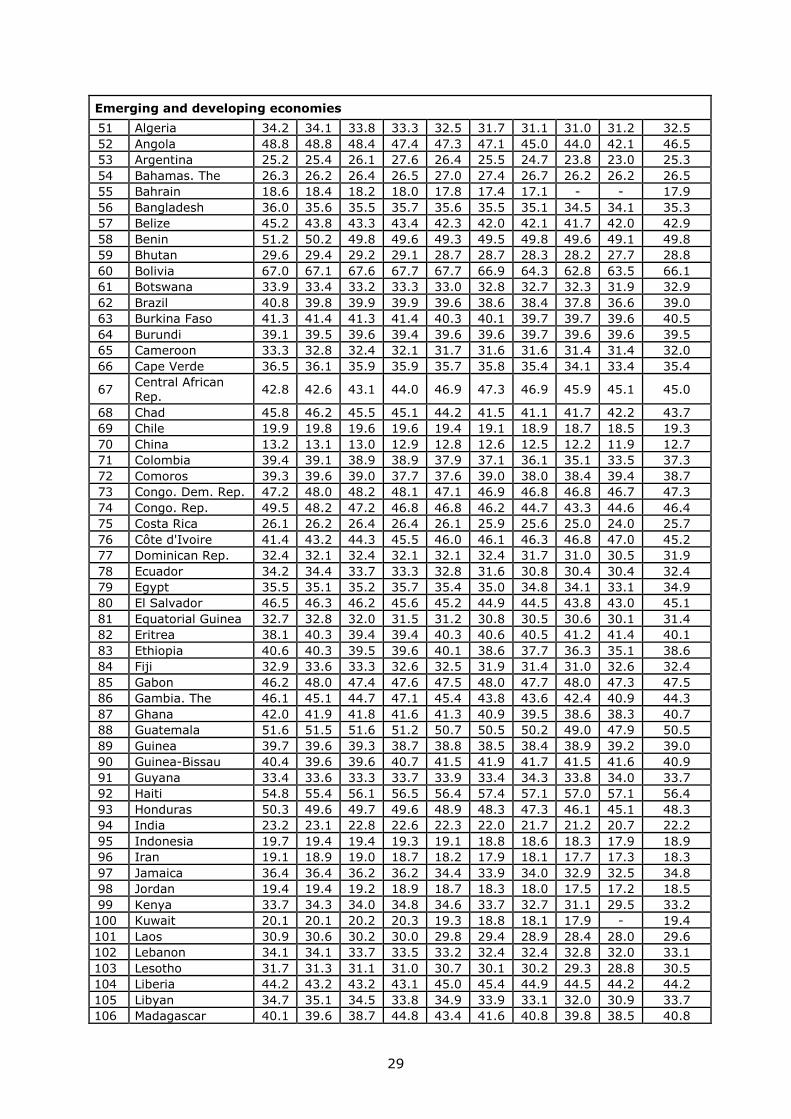
29
Emerging and developing economies
51 Algeria 34.2 34.1 33.8 33.3 32.5 31.7 31.1 31.0 31.2 32.5
52 Angola 48.8 48.8 48.4 47.4 47.3 47.1 45.0 44.0 42.1 46.5
53 Argentina 25.2 25.4 26.1 27.6 26.4 25.5 24.7 23.8 23.0 25.3
54 Bahamas. The 26.3 26.2 26.4 26.5 27.0 27.4 26.7 26.2 26.2 26.5
55 Bahrain 18.6 18.4 18.2 18.0 17.8 17.4 17.1 - - 17.9
56 Bangladesh 36.0 35.6 35.5 35.7 35.6 35.5 35.1 34.5 34.1 35.3
57 Belize 45.2 43.8 43.3 43.4 42.3 42.0 42.1 41.7 42.0 42.9
58 Benin 51.2 50.2 49.8 49.6 49.3 49.5 49.8 49.6 49.1 49.8
59 Bhutan 29.6 29.4 29.2 29.1 28.7 28.7 28.3 28.2 27.7 28.8
60 Bolivia 67.0 67.1 67.6 67.7 67.7 66.9 64.3 62.8 63.5 66.1
61 Botswana 33.9 33.4 33.2 33.3 33.0 32.8 32.7 32.3 31.9 32.9
62 Brazil 40.8 39.8 39.9 39.9 39.6 38.6 38.4 37.8 36.6 39.0
63 Burkina Faso 41.3 41.4 41.3 41.4 40.3 40.1 39.7 39.7 39.6 40.5
64 Burundi 39.1 39.5 39.6 39.4 39.6 39.6 39.7 39.6 39.6 39.5
65 Cameroon 33.3 32.8 32.4 32.1 31.7 31.6 31.6 31.4 31.4 32.0
66 Cape Verde 36.5 36.1 35.9 35.9 35.7 35.8 35.4 34.1 33.4 35.4
67 Central African Rep.
42.8 42.6 43.1 44.0 46.9 47.3 46.9 45.9 45.1 45.0
68 Chad 45.8 46.2 45.5 45.1 44.2 41.5 41.1 41.7 42.2 43.7
69 Chile 19.9 19.8 19.6 19.6 19.4 19.1 18.9 18.7 18.5 19.3
70 China 13.2 13.1 13.0 12.9 12.8 12.6 12.5 12.2 11.9 12.7
71 Colombia 39.4 39.1 38.9 38.9 37.9 37.1 36.1 35.1 33.5 37.3
72 Comoros 39.3 39.6 39.0 37.7 37.6 39.0 38.0 38.4 39.4 38.7
73 Congo. Dem. Rep. 47.2 48.0 48.2 48.1 47.1 46.9 46.8 46.8 46.7 47.3
74 Congo. Rep. 49.5 48.2 47.2 46.8 46.8 46.2 44.7 43.3 44.6 46.4
75 Costa Rica 26.1 26.2 26.4 26.4 26.1 25.9 25.6 25.0 24.0 25.7
76 Côte d'Ivoire 41.4 43.2 44.3 45.5 46.0 46.1 46.3 46.8 47.0 45.2
77 Dominican Rep. 32.4 32.1 32.4 32.1 32.1 32.4 31.7 31.0 30.5 31.9
78 Ecuador 34.2 34.4 33.7 33.3 32.8 31.6 30.8 30.4 30.4 32.4
79 Egypt 35.5 35.1 35.2 35.7 35.4 35.0 34.8 34.1 33.1 34.9
80 El Salvador 46.5 46.3 46.2 45.6 45.2 44.9 44.5 43.8 43.0 45.1
81 Equatorial Guinea 32.7 32.8 32.0 31.5 31.2 30.8 30.5 30.6 30.1 31.4
82 Eritrea 38.1 40.3 39.4 39.4 40.3 40.6 40.5 41.2 41.4 40.1
83 Ethiopia 40.6 40.3 39.5 39.6 40.1 38.6 37.7 36.3 35.1 38.6
84 Fiji 32.9 33.6 33.3 32.6 32.5 31.9 31.4 31.0 32.6 32.4
85 Gabon 46.2 48.0 47.4 47.6 47.5 48.0 47.7 48.0 47.3 47.5
86 Gambia. The 46.1 45.1 44.7 47.1 45.4 43.8 43.6 42.4 40.9 44.3
87 Ghana 42.0 41.9 41.8 41.6 41.3 40.9 39.5 38.6 38.3 40.7
88 Guatemala 51.6 51.5 51.6 51.2 50.7 50.5 50.2 49.0 47.9 50.5
89 Guinea 39.7 39.6 39.3 38.7 38.8 38.5 38.4 38.9 39.2 39.0
90 Guinea-Bissau 40.4 39.6 39.6 40.7 41.5 41.9 41.7 41.5 41.6 40.9
91 Guyana 33.4 33.6 33.3 33.7 33.9 33.4 34.3 33.8 34.0 33.7
92 Haiti 54.8 55.4 56.1 56.5 56.4 57.4 57.1 57.0 57.1 56.4
93 Honduras 50.3 49.6 49.7 49.6 48.9 48.3 47.3 46.1 45.1 48.3
94 India 23.2 23.1 22.8 22.6 22.3 22.0 21.7 21.2 20.7 22.2
95 Indonesia 19.7 19.4 19.4 19.3 19.1 18.8 18.6 18.3 17.9 18.9
96 Iran 19.1 18.9 19.0 18.7 18.2 17.9 18.1 17.7 17.3 18.3
97 Jamaica 36.4 36.4 36.2 36.2 34.4 33.9 34.0 32.9 32.5 34.8
98 Jordan 19.4 19.4 19.2 18.9 18.7 18.3 18.0 17.5 17.2 18.5
99 Kenya 33.7 34.3 34.0 34.8 34.6 33.7 32.7 31.1 29.5 33.2
100 Kuwait 20.1 20.1 20.2 20.3 19.3 18.8 18.1 17.9 - 19.4
101 Laos 30.9 30.6 30.2 30.0 29.8 29.4 28.9 28.4 28.0 29.6
102 Lebanon 34.1 34.1 33.7 33.5 33.2 32.4 32.4 32.8 32.0 33.1
103 Lesotho 31.7 31.3 31.1 31.0 30.7 30.1 30.2 29.3 28.8 30.5
104 Liberia 44.2 43.2 43.2 43.1 45.0 45.4 44.9 44.5 44.2 44.2
105 Libyan 34.7 35.1 34.5 33.8 34.9 33.9 33.1 32.0 30.9 33.7
106 Madagascar 40.1 39.6 38.7 44.8 43.4 41.6 40.8 39.8 38.5 40.8

30
107 Malawi 39.9 40.3 42.5 44.4 43.4 42.5 42.6 41.3 39.4 41.8
108 Malaysia 32.2 31.1 31.6 31.5 31.2 30.7 30.4 30.0 29.6 30.9
109 Maldives 30.3 30.3 30.0 29.4 29.2 28.9 29.6 29.3 28.6 29.5
110 Mali 42.5 42.3 40.8 40.2 39.9 40.6 40.1 39.9 39.9 40.7
111 Mauritania 35.5 36.1 36.0 35.8 35.8 35.1 34.4 31.7 35.1
112 Mauritius 23.3 23.1 22.9 23.0 22.7 22.4 22.4 22.2 21.9 22.7
113 Mongolia 18.4 18.4 18.3 18.0 17.7 17.4 17.1 16.7 16.4 17.6
114 Morocco 36.5 36.4 35.7 35.5 35.0 34.2 34.9 33.1 33.1 34.9
115 Mozambique 41.1 40.3 40.4 39.8 39.8 39.7 38.9 38.6 - 39.8
116 Namibia 31.4 31.4 31.2 31.3 30.7 29.7 29.6 28.8 28.5 30.3
117 Nepal 37.2 36.8 36.7 37.1 36.9 36.8 36.7 36.3 36.0 36.7
118 Nicaragua 45.7 45.2 45.3 45.5 45.0 44.2 43.8 43.5 43.1 44.6
119 Niger 41.7 41.9 40.9 40.3 39.7 40.7 39.7 38.6 - 40.4
120 Nigeria 58.0 57.9 57.8 57.6 56.3 55.1 53.8 53.0 - 56.2
121 Oman 19.1 18.9 18.5 18.5 18.4 18.3 18.0 17.6 - 18.4
122 Pakistan 37.0 36.8 37.0 36.8 36.2 35.3 34.9 33.8 33.6 35.7
123 Panama 64.8 64.1 64.7 65.1 64.4 63.5 61.7 60.0 - 63.5
124 Papua New Guinea
35.5 36.1 36.8 37.1 37.1 37.0 37.2 37.1 36.5 36.7
125 Paraguay 38.0 39.8 39.7 40.1 39.1 38.3 38.2 37.4 - 38.8
126 Peru 60.1 59.9 60.2 59.1 58.6 57.9 57.2 55.7 53.7 58.0
127 Philippines 43.8 43.3 43.0 42.5 42.0 41.6 40.1 39.5 38.3 41.6
128 Qatar - 19.0 19.3 19.0 19.6 17.4 18.4 - - 14.1
129 Rwanda 40.5 40.3 40.6 39.9 40.7 40.2 39.3 39.1 - 40.1
130 Saudi Arabia 18.7 18.4 18.7 19.2 18.3 17.7 17.4 17.4 16.8 18.1
131 Senegal 45.0 45.1 44.5 45.1 44.4 43.2 42.3 42.4 41.7 43.7
132 Sierra Leone 48.6 48.6 47.6 45.4 44.8 44.4 44.3 43.6 42.9 45.6
133 Solomon Islands 31.7 33.4 34.5 34.8 34.7 33.8 33.4 33.2 32.7 33.6
134 South Africa 28.4 28.4 28.4 28.0 27.8 27.1 26.5 26.0 25.2 27.3
135 Sri Lanka 45.2 44.6 44.6 44.1 43.8 43.9 43.4 42.9 42.2 43.9
136 Sudan 34.1 - - - - - - - - 34.1
137 Suriname 39.7 39.8 39.3 38.9 38.1 36.9 36.5 35.9 35.1 37.8
138 Swaziland 43.5 41.4 41.3 40.9 40.2 40.1 39.3 38.9 - 40.7
139 Syrian 19.3 19.3 19.2 19.1 19.3 19.1 19.0 18.7 18.5 19.1
140 Tanzania 58.6 58.3 57.7 56.9 56.6 56.0 55.4 54.7 53.7 56.4
141 Thailand 53.4 52.6 52.4 51.5 50.2 49.6 49.0 48.5 48.2 50.6
142 Togo 34.4 35.1 35.4 34.5 34.9 35.0 35.0 34.6 - 34.9
143 Trinidad & Tobago 34.7 34.4 34.3 34.4 33.4 33.1 32.9 31.9 31.5 33.4
144 Tunisia 38.7 38.4 37.8 37.8 37.4 36.9 36.7 35.9 35.4 37.2
145 Uganda 43.5 43.1 42.9 42.9 42.5 42.4 42.2 41.0 40.3 42.3
146 United Arab Emi. 26.3 26.4 27.0 27.4 26.3 25.4 24.8 23.5 - 25.9
147 Uruguay 50.5 51.1 51.7 54.0 53.6 51.1 49.2 48.5 46.1 50.6
148 Venezuela. RB 33.8 33.6 33.5 35.5 36.9 34.9 33.5 32.0 30.9 33.8
149 Vietnam 15.8 15.6 15.5 15.3 15.2 15.1 14.7 14.6 14.4 15.1
150 Yemen. Rep. 27.7 27.4 27.3 27.2 27.0 27.0 26.6 26.8 26.8 27.1
151 Zambia 49.3 48.9 48.3 48.1 47.5 46.8 46.3 45.0 43.9 47.1
152 Zimbabwe 59.6 59.4 61.5 62.8 63.7 62.3 62.0 62.3 62.7 61.8
Average 37.5 37.3 37.2 37.2 37.0 36.5 36.1 35.9 35.4
Remaining countries
153 Brunei Darussalam
31.3 31.1 31.0 30.2 29.9 31.2 31.8 30.8 31.2 30.9
154 Cambodia 50.4 50.1 49.6 50.0 49.2 48.8 47.8 46.8 46.0 48.7
155 Cyprus 29.2 28.7 28.2 27.8 28.2 28.1 27.7 27.3 26.5 28.0
156 Hong Kong 17.0 16.6 16.6 16.6 16.4 15.9 15.5 15.0 14.7 16.0
157 Israel 22.7 21.9 22.3 22.7 22.7 22.1 21.8 21.2 20.7 22.0
158 Macao 13.3 13.1 13.0 12.9 12.5 12.1 11.9 11.7 11.1 12.4
159 Malta 27.4 27.1 27.3 27.3 27.5 27.6 27.3 27.0 26.5 27.2
160 Myanmar 51.6 52.6 51.5 50.7 49.0 49.1 47.8 - - 50.3

31
161 Singapore 13.3 13.1 13.3 13.3 13.1 12.8 12.7 12.4 12.2 12.9
162 Taiwan 25.7 25.4 25.7 25.4 25.2 24.7 24.5 24.2 23.9 25.0
Average 28.2 28.0 27.9 27.7 27.4 27.2 26.9 24.0 23.6
Overall average 34.0 33.7 33.6 33.6 33.3 32.9 32.5 32.1 31.2

32
Table 4 Average informality weighted by total GDP in 2005
Region Mean Median Min Max SD
East Asia and Pacific 17.5 12.7 12.7 50.6 10.6
Europe and Central Asia 36.4 32.6 18.1 65.8 8.4
Latin America and the Caribbean 34.7 33.8 19.3 66.1 7.9
Middle East and North Africa 27.3 32.5 18.3 37.2 7.7
High income OECD 13.4 11.0 8.5 28.0 5.7
Other high income countries 20.8 19.4 12.4 33.4 4.9
South Asia 25.1 22.2 22.2 43.9 5.9
Sub-Saharan Africa 37.6 33.2 18.4 61.8 11.7
World 17.1 13.2 8.5 66.1 9.9

Fig. 1 World view of informality

Appendix
Variable Description Source
Authority Dummy variable taking the value 1 if sub-national governments have extensive taking, spending, or regulatory authority, zero otherwise
Teorell et al. (2010)
Business freedom Measures the time and efforts of business activity ranging; 0 = least business freedom, and 100 = maximum business freedom
Heritage Foundation
Currency M0 over M1; currency outside the banks (M0) as a proportion of M1 (specification 4 and 5 use currency over M2 because of higher data availability (Source: ECB)
International Monetary Fund
Economic freedom
Economic Freedom Index; 0 = least economic freedom, and 100 = maximum economic freedom
Heritage Foundation
Fiscal freedom Measures the fiscal burden in an economy, i.e., top tax rates on individual and corporate income; 0 = least fiscal freedom, and 100 = maximum degree of fiscal freedom
Heritage Foundation
GDP per capita GDP per capita based on purchasing power parity (PPP), (constant 2005 international $)
World Bank
Government effectiveness
Captures the quality of public and civil services, the degree of its independence from political pressures, the quality of policy formulation and implementation; scores between -2.5 and 2.5, with higher scores corresponding to better outcomes
World Bank Governance Indicators
Inflation rate Inflation, GDP deflator (annual %) United Nations Statistical Database
Labor force participation rate
Labor force participation, total (% of total population)
International Labor Organization
Openness Sum of exports and imports of goods and services (% of GDP)
United Nations Statistical Database
Regulatory quality
Measures the incidence of market-unfriendly policies; scores between -2.5 and 2.5, with higher scores corresponding to better outcomes
World Bank Governance Indicators
Share of direct taxes
Direct taxes as a proportion of total overall taxation
World Bank and Penn World Table (PWT 6.2)
Rules Average of the country-specific answers to the following question: To what extent would you
Dahlström et al. (2010)
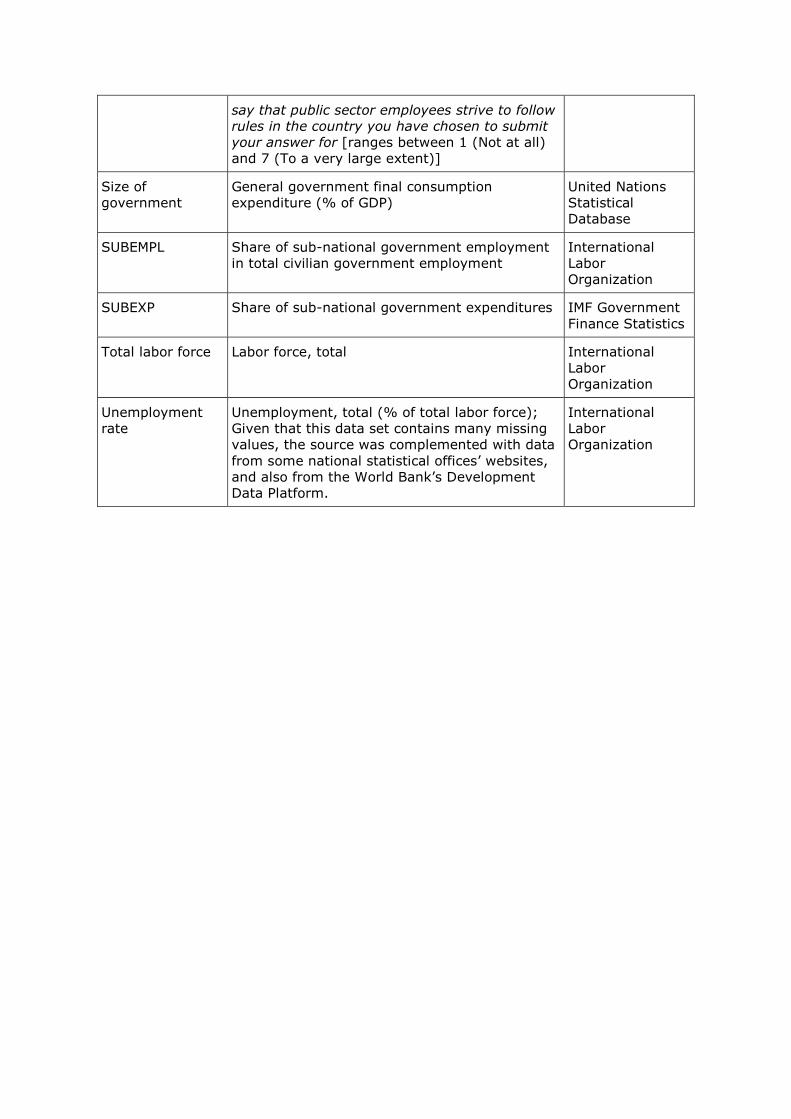
say that public sector employees strive to follow
rules in the country you have chosen to submit
your answer for [ranges between 1 (Not at all) and 7 (To a very large extent)]
Size of government
General government final consumption expenditure (% of GDP)
United Nations Statistical Database
SUBEMPL Share of sub-national government employment in total civilian government employment
International Labor Organization
SUBEXP Share of sub-national government expenditures IMF Government Finance Statistics
Total labor force Labor force, total International Labor Organization
Unemployment rate
Unemployment, total (% of total labor force); Given that this data set contains many missing values, the source was complemented with data from some national statistical offices’ websites, and also from the World Bank’s Development Data Platform.
International Labor Organization
Related Documents