Sex, drugs, and bitcoin: How much illegal activity is financed through cryptocurrencies? * Sean Foley a , Jonathan R. Karlsen b , Tālis J. Putniņš b, c a University of Sydney b University of Technology Sydney c Stockholm School of Economics in Riga January, 2018 Abstract Cryptocurrencies are among the largest unregulated markets in the world. We find that approximately one-quarter of bitcoin users and one-half of bitcoin transactions are associated with illegal activity. Around $72 billion of illegal activity per year involves bitcoin, which is close to the scale of the US and European markets for illegal drugs. The illegal share of bitcoin activity declines with mainstream interest in bitcoin and with the emergence of more opaque cryptocurrencies. The techniques developed in this paper have applications in cryptocurrency surveillance. Our findings suggest that cryptocurrencies are transforming the way black markets operate by enabling “black e-commerce”. JEL classification: G18, O31, O32, O33 Keywords: blockchain, bitcoin, detection controlled estimation, illegal trade * We thank an anonymous referee, Andrew Karolyi, Maureen O’Hara, Paolo Tasca, Michael Weber, as well as the conference/seminar participants of the RFS FinTech Workshop of Registered Reports, the Behavioral Finance and Capital Markets Conference, the UBS Equity Markets Conference, and the University of Technology Sydney. Jonathan Karlsen acknowledges financial support from the Capital Markets Co-operative Research Centre. Tālis Putniņš acknowledges financial support from the Australian Research Council (ARC) under grant number DE150101889. The Online Appendix that accompanies this paper can be found at goo.gl/GvsERL Send correspondence to Tālis Putniņš, UTS Business School, University of Technology Sydney, PO Box 123 Broadway, NSW 2007, Australia; telephone: +61 2 95143088. Email: [email protected].

Welcome message from author
This document is posted to help you gain knowledge. Please leave a comment to let me know what you think about it! Share it to your friends and learn new things together.
Transcript

Sex, drugs, and bitcoin:
How much illegal activity is financed through cryptocurrencies? *
Sean Foley
a, Jonathan R. Karlsen
b, Tālis J. Putniņš
b, c
a University of Sydney
b University of Technology Sydney
c Stockholm School of Economics in Riga
January, 2018
Abstract
Cryptocurrencies are among the largest unregulated markets in the world. We find that approximately
one-quarter of bitcoin users and one-half of bitcoin transactions are associated with illegal activity.
Around $72 billion of illegal activity per year involves bitcoin, which is close to the scale of the US and
European markets for illegal drugs. The illegal share of bitcoin activity declines with mainstream interest
in bitcoin and with the emergence of more opaque cryptocurrencies. The techniques developed in this
paper have applications in cryptocurrency surveillance. Our findings suggest that cryptocurrencies are
transforming the way black markets operate by enabling “black e-commerce”.
JEL classification: G18, O31, O32, O33
Keywords: blockchain, bitcoin, detection controlled estimation, illegal trade
* We thank an anonymous referee, Andrew Karolyi, Maureen O’Hara, Paolo Tasca, Michael Weber, as well as the
conference/seminar participants of the RFS FinTech Workshop of Registered Reports, the Behavioral Finance and
Capital Markets Conference, the UBS Equity Markets Conference, and the University of Technology Sydney.
Jonathan Karlsen acknowledges financial support from the Capital Markets Co-operative Research Centre. Tālis
Putniņš acknowledges financial support from the Australian Research Council (ARC) under grant number
DE150101889. The Online Appendix that accompanies this paper can be found at goo.gl/GvsERL
Send correspondence to Tālis Putniņš, UTS Business School, University of Technology Sydney, PO Box 123
Broadway, NSW 2007, Australia; telephone: +61 2 95143088. Email: [email protected].

1
1. Introduction
Cryptocurrencies have grown rapidly in price, popularity, and mainstream adoption. The total
market capitalization of bitcoin alone exceeds $250 billion as at January 2018, with a further $400 billion
in over 1,000 other cryptocurrencies. The numerous online cryptocurrency exchanges and markets have
daily dollar volume of around $50 billion.2 Over 170 “cryptofunds” have emerged (hedge funds that
invest solely in cryptocurrencies), attracting around $2.3 billion in assets under management.3 Recently,
bitcoin futures have commenced trading on the CME and CBOE, catering to institutional demand for
trading and hedging bitcoin.4 What was once a fringe asset is quickly maturing.
The rapid growth in cryptocurrencies and the anonymity that they provide users has created
considerable regulatory challenges. An application for a $100 million cryptocurrency Exchange Traded
Fund (ETF) was rejected by the US SEC in March 2017 (and again in 2018) amid concerns including the
lack of regulation. China has banned residents from trading cryptocurrencies and made initial coin
offerings (ICOs) illegal. Central bank heads have publically expressed concerns about cryptocurrencies.
While cryptocurrencies have many potential benefits including faster and more efficient, regulatory
concerns center around their use in illegal trade (drugs, hacks and thefts, illegal pornography, even
murder-for-hire), potential to fund terrorism, launder money, and avoid capital controls. There is little
doubt that by providing a digital and anonymous payment mechanism, cryptocurrencies such as bitcoin
have facilitated the growth of “darknet” online marketplaces in which illegal goods and services are
traded. The recent FBI seizure of over $4 million of bitcoin from one such marketplace, the “Silk Road”,
provides some idea of the scale of the problem faced by regulators.
This paper seeks to quantify and characterize the illegal trade facilitated by bitcoin. In doing so,
we hope to better understand the nature and scale of the “problem” facing this nascent technology. We
develop methods for identifying illegal activity in bitcoin. These methods can also be used in analyzing
many other blockchains.
Several recent seizures of bitcoin by law enforcement agencies (including the US FBI’s seizure of
the “Silk Road” marketplace), combined with the public nature of the blockchain, provide us with a
unique laboratory in which to analyze the illegal ecosystem that has evolved in the bitcoin network.
Although individual identities are masked by the pseudo-anonymity of a 26-35 character alpha-numeric
address, the public nature of the blockchain allows us to link bitcoin transactions to individual “users”
(market participants) and then further identify the users that had bitcoin seized by authorities. Bitcoin
2 SEC Release No. 34-79103, March 10, 2017; and https://coinmarketcap.com
3 Source: financial research firm Autonomous Next and cnbc.com.
4 Bitcoin futures commenced trading on the CME (Chicago Mercantile Exchange) on December 18, 2017 and on the
Chicago Board Options Exchange (CBOE) on December 10, 2017. A bitcoin futures contract on CBOE is for one
bitcoin, whereas on CBOE it is five bitcoins. At a price of approximately $20,000 per bitcoin at the time the CME
bitcoin futures launched, one CME bitcoin futures contract has a notional value of around $100,000.

2
seizures (combined with a few other sources) provide us with a sample of users known to be involved in
illegal activity. This is the starting point for our analysis, from which we apply two different empirical
approaches to go from the sample to the estimated population of illegal activity.
Our first approach exploits the trade networks of users known to be involved in illegal activity
(“illegal users”). We use the bitcoin blockchain to reconstruct the complete network of transactions
between market participants. We then applying a type of network cluster analysis to identify two distinct
communities in the data—the legal and illegal communities. Our second approach exploits certain
characteristics that distinguish between legal and illegal bitcoin users, applying detection controlled
estimation models (simultaneous equation models with latent variables). For example, we measure the
extent to which individual bitcoin users take actions to conceal their identity and trading records, which is
a predictor of involvement in illegal activity.
We find that illegal activity accounts for a substantial proportion of the users and trading activity
in bitcoin. For example, approximately one-quarter of all users (25%) and close to one-half of bitcoin
transactions (44%) are associated with illegal activity. Furthermore, approximately one-fifth (20%) of the
total dollar value of transactions and approximately one-half of bitcoin holdings (51%) through time are
associated with illegal activity. Our estimates suggest that in the most recent part of our sample (April
2017), there are an estimated 24 million bitcoin market participants that use bitcoin primarily for illegal
purposes. These users annually conduct around 36 million transactions, with a value of around $72
billion, and collectively hold around $8 billion worth of bitcoin.
To give these numbers some context, a report to the US White House Office of National Drug
Control Policy estimates that drug users in the United States in 2010 spend in the order of $100 billion
annually on illicit drugs.5 Using different methods, the size of the European market for illegal drugs is
estimated to be at least €24 billion per year.6 While comparisons between such estimates and ours are
imprecise for a number of reasons (and the illegal activity captured by our estimates is broader than just
illegal drugs), they do provide a sense that the scale of the illegal activity involving bitcoin is not only
meaningful as a proportion of bitcoin activity, but also in absolute dollar terms.
The use of bitcoin in illegal trade has interesting time-series patterns. In recent years (since 2015),
the proportion of bitcoin activity associated with illegal trade has declined. We attribute this trend to two
main factors. The first is an increase in mainstream and speculative interest in bitcoin. For example, we
find that the proportion of illegal activity in bitcoin is inversely related to the Google search intensity for
5 The report, prepared by the RAND Corporation, estimates the user of cocaine, crack, heroin, marijuana, and
methamphetamine, and is available at (www.rand.org/t/RR534). A significant share of the illegal activity involving
bitcoin is likely associated with buying/selling illegal drugs online (e.g., Soska and Christin, 2015), which is what
motivates the comparison with the size of the market for illegal drugs. 6 The estimate is from the European Monitoring Centre for Drugs and Drug Addiction / Europol “EU Drug Markets
Report” for the year 2013. (http://www.emcdda.europa.eu/attachements.cfm/att_194336_EN_TD3112366ENC.pdf)

3
the keyword “bitcoin”. Furthermore, while the proportion of illegal bitcoin activity has declined, the
absolute amount of such activity has continued to increase, indicating that the declining proportion is due
to rapid growth in legal bitcoin use. The second factor is the emergence of alternative cryptocurrencies
that are more opaque and better at concealing a user’s activity (e.g., Dash, Monero, and ZCash). We find
that the emergence of such alternative cryptocurrencies is also associated with a decrease in the
proportion of illegal activity in bitcoin. Despite these two factors affecting the use of bitcoin in illegal
activity, as well as numerous darknet marketplace seizures by law enforcement agencies, the amount of
illegal activity involving bitcoin at the end of our sample in April 2017 remains close to its all-time high.
Bitcoin users that are involved in illegal activity differ from other users in several characteristics.
Differences in transactional characteristics are generally consistent with the notion that while illegal users
predominantly (or solely) use bitcoin as a payment system to facilitate trade in illegal goods/services,
some legal users treat bitcoin as an investment or speculative asset. Specifically, illegal users tend to
transact more, but in smaller transactions. They are also more likely to repeatedly transact with a given
counterparty. Despite transacting more, illegal users tend to hold less bitcoin, consistent with them facing
risks of having bitcoin holdings seized by authorities.
We find several other robust predictors of involvement in illegal activity. A user is more likely to
be involved in illegal activity if they trade when there are many darknet marketplaces in operation, few
shadow coins in existence, little bitcoin hype or mainstream interest, and immediately following darknet
marketplaces seizures or scams. A user is also more likely to be involved in illegal activity if they use
“tumbling” and/or “wash trades”—trading techniques that help conceal one’s activity.
The network of bitcoin transactions between illegal users is three to four times denser, with users
much more connected with one another through transactions. The higher density is consistent with illegal
users transacting more and using bitcoin primarily as a payment system in buying/selling goods.
It is important to consider the differences between cryptocurrencies and cash. After all, cash is
also largely anonymous (traceable only through serial numbers) and has therefore traditionally played an
important role in facilitating crime and illegal trade (e.g., Rogoff, 2016). The key difference is that
cryptocurrencies (similar to PayPal and credit cards) enable digital transactions and thus e-commerce.
Arguably, the ability to make digital payments revolutionized retail and wholesale trade. Online shopping
substantially impacted the structure of retailing, consumption patterns, choice and hence welfare,
marketing, competition, and ultimately supply and demand. Until cryptocurrencies, such impacts were
largely limited to legal goods and services due to the traceability of digital payments. Cryptocurrencies
have changed this, by combining the anonymity of cash with digitization, which enables efficient
anonymous online and cross-border commerce. Cryptocurrencies therefore have the potential to cause an
important structural shift in how the black market operates.

4
While the emergence of illegal darknet marketplaces illustrates that this shift has commenced, it
is not obvious to what extent the black market will adopt the opportunities for e-commerce and digital
payments via cryptocurrencies—this is an important empirical question. Our findings illustrate the
dynamics of this adoption process and suggest that eight years after the introduction of the first
cryptocurrency, the black market has indeed adopted this form of electronic payment on a meaningful
scale. Thus, our results suggest that cryptocurrencies are having a material impact on the way the black
market for illegal goods and services operates.
Our findings have a number of further implications, which we discuss in Section 6. Blockchain
technology and the systems/protocols that can be implemented on a blockchain have the potential for
revolutionizing numerous industries. In shedding light on the dark side of cryptocurrencies, we hope this
research will reduce some of the regulatory uncertainty about the negative consequences and risks of this
innovation, facilitating more informed policy decisions that assess both the costs and benefits. In turn, we
hope this contributes to these technologies reaching their potential. Second, our paper contributes to
understanding the intrinsic value of bitcoin, highlighting that a significant component of its value as a
payment system derives from its use in facilitating illegal trade. This has ethical implications for bitcoin
as an investment, as well as valuation implications. Third, our paper moves the literature closer to
understanding the welfare consequences of the growth in illegal online trade. A crucial piece of this
puzzle is understanding the extent to which illegal online trade simply reflects a migration of activity that
would have otherwise occurred on the street, versus the alternative that by making illegal goods more
accessible, convenient to buy, and less risky to buy due to anonymity, “black e-commerce” could lead to
growth in the aggregate black market. Our estimates contribute to understanding this issue, but further
research is required to relate these estimates to trends in the offline black market to further our
understanding of the welfare consequences.
This paper also makes a methodological contribution. The techniques developed in this paper can
be used in cryptocurrency surveillance in a number of ways, including monitoring trends in illegal
activity, its response to regulatory interventions, and how its characteristics change through time. The
methods can also be used to identify key bitcoin users (e.g., “hubs” in the illegal trade network) which,
when combined with other sources of information, can be linked to specific individuals. The techniques in
this paper can also be used to study other types of activity in bitcoin or other cryptocurrencies /
blockchains.
Our paper contributes to a few areas of recent literature, which we discuss in more detail in
Section 6. We add to the literature on the economics of cryptocurrencies and applications of blockchain
technology to securities markets by showing that one of the major uses of cryptocurrencies as a payment
5
system is in settings where anonymity is valued (e.g., illegal trade).7 Our paper also contributes to the
computer science literature that analyzes the degree of anonymity in bitcoin by developing algorithms that
identify entities/users/activities in bitcoin’s blockchain.8 We exploit algorithms from this literature to
identify individual users in the data, and we add new methods to the literature that go beyond observing
individuals, to identification of communities and estimation of populations of users. Finally, our paper is
also related to studies of darknet marketplaces and the online drug trade, including papers from computer
science and drug policy.9 We contribute to this literature by quantifying the amount of illegal activity that
involves bitcoin, rather than studying a single market (e.g., Silk Road) or indirect lower-bound measures
of darknet activity such as the feedback left by buyers. Empirically, we confirm that the estimated
population of illegal activity is several times larger than what can be “observed” through studying
observable darknet marketplaces and their customers.
The next section provides institutional details about bitcoin and the blockchain, darknet
marketplaces in which illegal goods and services are bought/sold using bitcoin, and law enforcement
efforts to monitor and disrupt illegal online activity. Section 3 describes the blockchain data used in this
paper. Section 4 explains three approaches that we use to construct a sample of illegal activity and
characterizes that sample. The sample forms the input to our empirical methods in Section 5 that quantify
the total amount of illegal activity, its trends, and its characteristics. A discussion of the implications of
the results and how they relate to existing studies is in Section 6, while Section 7 concludes.
2. Institutional details
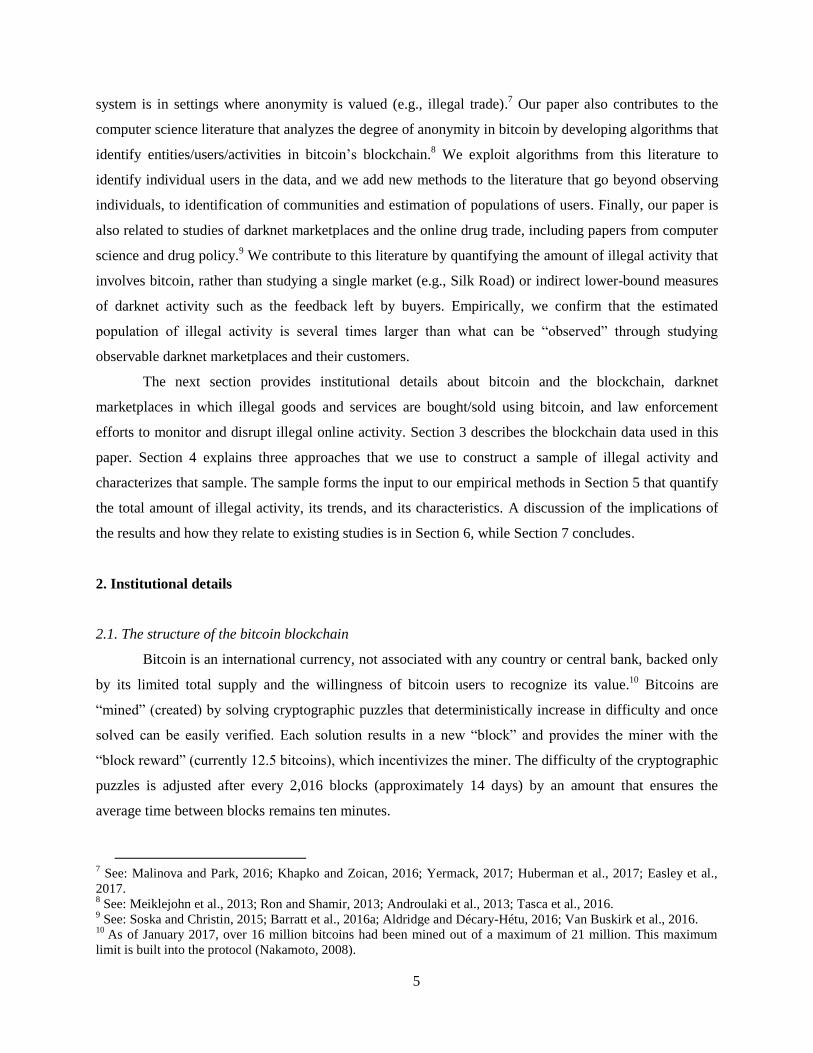
2.1. The structure of the bitcoin blockchain
Bitcoin is an international currency, not associated with any country or central bank, backed only
by its limited total supply and the willingness of bitcoin users to recognize its value.10
Bitcoins are
“mined” (created) by solving cryptographic puzzles that deterministically increase in difficulty and once
solved can be easily verified. Each solution results in a new “block” and provides the miner with the
“block reward” (currently 12.5 bitcoins), which incentivizes the miner. The difficulty of the cryptographic
puzzles is adjusted after every 2,016 blocks (approximately 14 days) by an amount that ensures the
average time between blocks remains ten minutes.
7 See: Malinova and Park, 2016; Khapko and Zoican, 2016; Yermack, 2017; Huberman et al., 2017; Easley et al.,
2017. 8 See: Meiklejohn et al., 2013; Ron and Shamir, 2013; Androulaki et al., 2013; Tasca et al., 2016.
9 See: Soska and Christin, 2015; Barratt et al., 2016a; Aldridge and Décary-Hétu, 2016; Van Buskirk et al., 2016.
10 As of January 2017, over 16 million bitcoins had been mined out of a maximum of 21 million. This maximum
limit is built into the protocol (Nakamoto, 2008).

6
Each block, as well as expanding the supply of bitcoin, confirms a collection of recent
transactions (transactions since the last block). Each block also contains a reference to the last block,
thereby forming a “chain”, giving rise to the term “blockchain”. The blockchain thus forms a complete
and sequential record of all transactions and is publically available to any participant in the network.
Bitcoins are divisible to the “Satoshi”, being one hundred millionth of one bitcoin (currently
worth less than two hundredths of a cent). Each bitcoin holding (or parcel) is identified by an address,
analogous to the serial number of a banknote. Unlike banknotes, bitcoin does not have to be held in round
units (e.g., 5, 10, 50). Unless a holding of bitcoin with a given address is exactly spent in a transaction,
the “change” from the transaction is returned to a new address forming a new parcel of bitcoin.
A bitcoin “user” (a participant in the network) stores the addresses associated with each parcel of
bitcoin that they own in a “wallet”. Similar to a conventional cash wallet, a bitcoin wallet balance is the
sum of the balances of all the addresses inside the wallet. While individual bitcoin addresses are designed
to be anonymous, it is possible to link addresses belonging to the same wallet when more than one
address is used to make a purchase.
2.2. Darknet marketplaces and their microstructure
The “darknet” is a network like the internet, but that can only be accessed through particular
communications protocols that provide greater anonymity than the internet. The darknet contains online
marketplaces, much like EBay, but with anonymous communications, which also makes these
marketplaces less accessible than online stores on the internet. Darknet marketplaces are particularly
popular for trading illegal goods and services because the identities of buyers and sellers are concealed.
The darknet is estimated to contain approximately 30,000 domains (Lewman, 2016).
To access a darknet marketplace, a user is generally required to establish an account (usually free)
at the marketplace in order to browse vendor products (Martin, 2014a; Van Slobbe, 2016). Similar to the
way PayPal propelled EBay, the secure, decentralized, and anonymous nature of cryptocurrencies has
played an important role in the success of darknet marketplaces. While bitcoin is the most widespread
cryptocurrency used in such marketplaces, other currencies have occasionally been adopted, either due to
their popularity (such as Ethereum) or improved anonymity (such as Monero). Despite the availability of
alternate currencies on some marketplaces, the vast majority of transactions on the darknet are still
undertaken in bitcoin.11
A user that wants to buy goods or services on a darknet marketplace must first acquire
cryptocurrency (typically from an online exchange or broker) and then deposit this in an address
11
A recent estimate from a darknet marketplace operator identified bitcoin as accounting for 98% of transactions:
https://www.wired.com/2017/01/monero-drug-dealers-cryptocurrency-choice-fire/.

7
belonging to the darknet marketplace (often termed a “hot wallet”). These funds are held in “escrow” by
the marketplace. Vendor prices on darknet markets are often quoted inclusive of a marketplace fee. The
escrow system also assists marketplace administrators in mediating disputes between buyers and sellers
and minimizing scams in which money is collected without the intention of ever shipping any goods
(Aldridge and Décary-Hétu, 2014; Christin, 2013). Funds are released when the vendor indicates the
goods have been sent. In some marketplaces, the funds are held until the buyer indicates that the goods
have been received. The escrow function of the darknet marketplaces sometimes leads to “exit scams”,
whereby a marketplace ceases operations but does not return bitcoin held in escrow. Many such scams
have been perpetrated by marketplaces in the last five years, including Sheep Marketplace (2013), Pirate
Market (2014), Evolution (2015), and Nucleus (2016).
The evolution of dark marketplaces allows sellers of illegal goods and services to reach global
audiences (Van Buskirk et al., 2016). This internationalization of illegal trade necessitates more complex
methods of communications and logistics to avoid detection. To this end, buyers placing an order with an
online seller typically communicate using PGP (Pretty Good Privacy) encryption, which encodes and
decodes messages using a pair of public and private keys (Cox, 2016). On some (typically more recent)
marketplaces, this functionality is built into the site. Logistically, items are typically delivered by mail
and the process by which this occurs has been widely documented (Christin, 2013; Van Hout and
Bingham, 2013; Lavorgna, 2016; Van Slobbe, 2016). Many methods are used to minimize the chance of
such deliveries being intercepted by law enforcement, including professional logos, vacuum sealed bags,
posting small quantities of product, and including a (fake) return address (Christin, 2013; Basu, 2014;
Tzanetakis et al., 2016). Customers are advised by marketplaces to avoid using their real name or address
to minimize the risk of being caught by law enforcement agencies (Martin, 2014b).
After receiving their goods, buyers are encouraged to leave feedback about the seller,
commenting on the arrival (or otherwise) of the goods, their quality, and overall service (Van Slobbe,
2016). Such feedback is paramount for developing a reputation in a marketplace that is primarily based on
trust between participants, with few ramifications for “scamming” purchasers (Aldridge and Décary-Hétu,
2014; Tzanetakis et al., 2016).
To get a sense of how a buyer navigates a darknet marketplace, Figure 1 provides screenshots
from one of the first darknet marketplaces, “Silk Road”. Panel A provides an example of the “Drugs”
page illustrating that a wide variety of illegal drugs, weapons, and forgeries can be purchased using
bitcoin. Panel B provides an example of information about individual items and sellers. Clicking on the
appropriate headings, one can obtain further information about the items (detailed description,
insurance/refund policies, available postage methods and locations, security and encryption, and so on)
and about the seller (their rating from buyers, detailed feedback from buyers, history of sales, and so on).

8
Panel C shows the interface for depositing bitcoin to Silk Road’s escrow account, how to transfer bitcoins
to a given seller, and how to withdraw bitcoins from escrow.
< Figure 1 >
By providing an anonymous, digital method of payment, bitcoin did for darknet marketplaces
what PayPal did for EBay—provide a reliable, scalable, and convenient payment mechanism. What was
also required was an anonymous way of hosting and accessing those illegal marketplaces. This issue is
solved through the use of The Onion Router (TOR), originally developed by the US Navy. By routing the
message through several nodes in the TOR network, TOR obfuscates the path (and hence the IP address)
of a message sent between two clients.
The combination of TOR for covert communications and bitcoin for covert payments has led to
the proliferation of darknet marketplaces. The most well-known marketplace was the “Silk Road” started
in 2011. Since its shutdown by the FBI in 2013, numerous other marketplaces have sprung up (see Table
A2 in Appendix A for a list). Despite frequent shutdowns, seizures and scams, measures of darknet
marketplace activity indicate steady growth in the number of market participants and products (Matthews
et al., 2017). For example, one of the largest marketplaces in 2017, “AlphaBay”, had over 350,000 items
available for sale in categories such as drugs, weapons, malware, and illegal pornography.
2.3. Surveillance and cryptocurrency seizures from darknet marketplaces
Cryptocurrencies have proven effective not only in facilitating illegal trade, but also in the
detection of illegal activity due to the public nature of the blockchain. Even though bitcoin has been used
extensively in illegal activity, some argue that the blockchain actually makes it easier for law enforcement
to detect illegal activity, despite the currency’s anonymity. Koshy, Koshy, and McDaniel (2014) show
that by monitoring transactions transmitted from computers to the blockchain, they are able to link
individual transactions to the IP address of the sender. Meiklejohn et al. (2013) describe how tracing a
bitcoin theft on the blockchain to bitcoin exchanges could be used by authorities with subpoena powers to
potentially identify perpetrators. Yermack (2017) hypothesizes that the growing popularity of bitcoin will
inevitably lead to a growing market for de-anonymizing technologies, leading to increased transparency
of the users making transactions on the blockchain. In response to these pressures, supporters of the
anonymity provided by cryptocurrencies are actively developing new currencies that challenge law
enforcement’s detection methods. Such currencies include Monero, which hides user’s public keys among
a group of public keys that contain the same amount (known as “Ring Signatures”), and ZCash (launched

9
in 2016), which uses zero-knowledge proofs that hide sender, recipient, and transaction amount (Noether,
2015; Ben-Sasson et al., 2014).
Recently, law enforcement agencies have been successful in seizing bitcoin from a number of
darknet marketplaces. For example, the Silk Road marketplace was raided by the FBI on October 2, 2013,
seizing bitcoin from customer and supplier escrow accounts (hot wallets) and from the owner/operator,
Ross William Ulbircht. After the closure of the Silk Road, law enforcement agencies successfully seized
bitcoin from several other illegal sites/individuals (see Table A1 of Appendix A). Numerous darknet sites
were raided and shut down in “Operation Onymous”; an international collaboration between US and
European law enforcement agencies that targeted illegal darknet sites. Despite the seizures, illegal darknet
marketplaces continue to operate, with many new ones being created since the seizures.
The seized bitcoin from these operations allows us to identify bitcoin users (customers, suppliers,
and marketplace operators) involved in illegal activity. These observations provide a starting point from
which to estimate the extent of illegal activity involving bitcoin.
Law enforcement agencies use a number of strategies to detect illegal activity on the darknet,
ranging from cyber-surveillance to forensic analysis. Given that detected illegal activity feeds into our
identification techniques, it is important to understand law enforcement strategies. Christin (2013) and
Kruithof et al. (2016) describe a number of such strategies, including: infiltrating the TOR network to
determine individual IP addresses, decoding the financial infrastructure of bitcoin to identify individuals,
and using traditional forensic and investigative techniques on seized packages. Law enforcement agencies
monitor suspicious packages passing through the postal service. Agencies also order drugs on darknet
marketplaces to investigate the return address on the package. For example, an unusual amount of
outgoing mail from a large Australian drug dealer led authorities to seize over 24,000 in bitcoin, along
with a wide array of drugs and cash. Investigators also sometimes pose as suppliers to gather addresses of
customers and reveal their identities. Finally, by conducting major seizures, agencies can create distrust in
the online trade of illegal drugs among participants (Van Slobbe, 2016; Christin, 2013). Large-scale
initiatives such as “Operation Onymous”, in which law enforcement agencies shut down several illegal
marketplaces and made 17 arrests across 17 countries, can discourage illegal online activity by increasing
the risk of detection (Franklin, Paxson, Perrig, and Savage, 2007).
3. Data and descriptive statistics
We extract the complete record of bitcoin transactions from the public bitcoin blockchain, from
the first block on January 3, 2009, to the end of April 2017. For each transaction, we collect the
transaction ID, sender and recipient address, timestamp, block ID, transaction fee, and transaction
amount.

10
3.1 Identifying users in transaction-level bitcoin data
The data that make up the bitcoin blockchain reveal “addresses” (identifiers for parcels of bitcoin)
but not the “users” (individuals) that control those addresses. A user typically controls several addresses.
This one-to-many mapping occurs partly as a result of various activities that users employ to preserve
their anonymity and partly due to transaction mechanics (e.g., when a user receives “change” in a
transaction, the change is given a new address).12
We find addresses connected to a single user with the
Union-Find algorithm, which is developed by Cormen, Leiserson, Rivest, and Stein (2001) and Ron and
Shamir (2013) and used in several related papers such as Meiklejohn et al. (2013). This algorithm
transforms the transaction-level data into user-level data, linking each transaction to the associated users.
The following illustrates how the Union-Find algorithm works. A transaction usually involves
several addresses from one user. For example, the payer (“sender”) of bitcoin might send bitcoin from
multiple addresses and also receive change to a new address. Because a user must control the private key
of each address from which bitcoin is sent in a given transaction, all of the sender’s addresses in one
transaction are almost certainly associated with one user. Transitivity is then used to link the addresses of
a user across multiple transactions. For example, suppose two separate transactions are observed; one in
which bitcoin is sent from addresses A and B and another in which bitcoin is sent from addresses B and
C. The first transaction identifies addresses A and B as belonging to the one user, while the second
identifies B and C as belonging to the same user. By transitivity, all three addresses (A, B, and C) belong
to the same user.
None of the existing algorithms that cluster bitcoin addresses by user has perfect accuracy.13
The
Union-Find algorithm is the most widely used approach, primarily because the errors it makes (too little
clustering of addresses rather than too much clustering) are conservative in most applications (Meiklejohn
et al, 2013). The Union-Find algorithm might fail to cluster together two sets of addresses controlled by
the one user if the user never makes a transaction that uses an address from each set. In such instances,
two or more address clusters might in fact correspond to one user.14
In contrast, the Union-Find algorithm
(unlike other approaches such as those that exploit the change from transactions) is very unlikely to make
the opposite and more severe error of incorrectly clustering together sets of addresses that involve more
than one user. In our application, too little clustering (and thus having instances where two or more
clusters correspond to one actual user) is unlikely to have severe consequences for our empirical methods,
12
For example, individuals can send bitcoin to a “tumbling” service which then returns the bitcoin (minus a fee) to a
new address, or by sending bitcoin to oneself using a newly generated address as the recipient of the transaction
(Ron and Shamir, 2013). 13
For example, Androulaki et al. (2013) examine two approaches using simulations and find that many, but not all,
of the users can be correctly identified by clustering algorithms even when users try to enhance their privacy by
creating new addresses. 14
Meiklejohn et al. (2013) empirically find that this error is “not too common” in bitcoin blockchain analysis.
11
whereas incorrectly joining multiple users into a single cluster would be far more problematic.15
Therefore, the Union-Find algorithm is a suitable choice given our requirements.
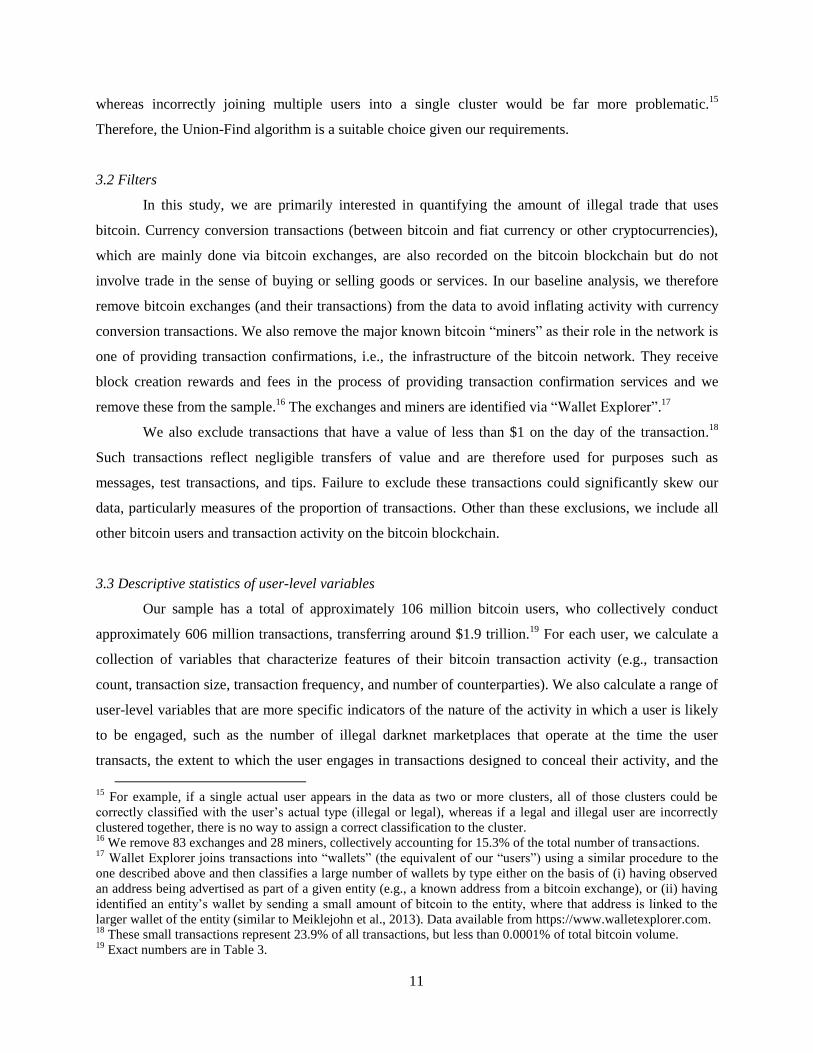
3.2 Filters
In this study, we are primarily interested in quantifying the amount of illegal trade that uses
bitcoin. Currency conversion transactions (between bitcoin and fiat currency or other cryptocurrencies),
which are mainly done via bitcoin exchanges, are also recorded on the bitcoin blockchain but do not
involve trade in the sense of buying or selling goods or services. In our baseline analysis, we therefore
remove bitcoin exchanges (and their transactions) from the data to avoid inflating activity with currency
conversion transactions. We also remove the major known bitcoin “miners” as their role in the network is
one of providing transaction confirmations, i.e., the infrastructure of the bitcoin network. They receive
block creation rewards and fees in the process of providing transaction confirmation services and we
remove these from the sample.16
The exchanges and miners are identified via “Wallet Explorer”.17
We also exclude transactions that have a value of less than $1 on the day of the transaction.18
Such transactions reflect negligible transfers of value and are therefore used for purposes such as
messages, test transactions, and tips. Failure to exclude these transactions could significantly skew our
data, particularly measures of the proportion of transactions. Other than these exclusions, we include all
other bitcoin users and transaction activity on the bitcoin blockchain.
3.3 Descriptive statistics of user-level variables
Our sample has a total of approximately 106 million bitcoin users, who collectively conduct
approximately 606 million transactions, transferring around $1.9 trillion.19
For each user, we calculate a
collection of variables that characterize features of their bitcoin transaction activity (e.g., transaction
count, transaction size, transaction frequency, and number of counterparties). We also calculate a range of
user-level variables that are more specific indicators of the nature of the activity in which a user is likely
to be engaged, such as the number of illegal darknet marketplaces that operate at the time the user
transacts, the extent to which the user engages in transactions designed to conceal their activity, and the
15
For example, if a single actual user appears in the data as two or more clusters, all of those clusters could be
correctly classified with the user’s actual type (illegal or legal), whereas if a legal and illegal user are incorrectly
clustered together, there is no way to assign a correct classification to the cluster. 16
We remove 83 exchanges and 28 miners, collectively accounting for 15.3% of the total number of transactions. 17
Wallet Explorer joins transactions into “wallets” (the equivalent of our “users”) using a similar procedure to the
one described above and then classifies a large number of wallets by type either on the basis of (i) having observed
an address being advertised as part of a given entity (e.g., a known address from a bitcoin exchange), or (ii) having
identified an entity’s wallet by sending a small amount of bitcoin to the entity, where that address is linked to the
larger wallet of the entity (similar to Meiklejohn et al., 2013). Data available from https://www.walletexplorer.com. 18
These small transactions represent 23.9% of all transactions, but less than 0.0001% of total bitcoin volume. 19
Exact numbers are in Table 3.

12
degree of interest in bitcoin at the time the user transacts (using Google search intensity). The detailed
definitions of these variables are reported in Table 1.
< Table 1 >
Table 2 reports descriptive statistics about the user-level variables. Focusing on the variables that
characterize a user’s bitcoin transaction activity (Panel A), we see that a typical (median) user engages in
three bitcoin transactions (mean Transaction Count is 5.7 transactions) with three different counterparties
(mean of Counterparties is 4.2). Thus, a typical user has a low degree of concentration in counterparties,
in that they do not repeatedly transact with the same counterparty (our measure of Concentration, which
is a normalized Herfindahl–Hirschman Index, has a median of zero). There are a small number of highly
active entities, with the most active having 11.4 million transactions and 4.4 million counterparties.
The average transaction size is around $5,000, but a typical transaction (the median Transaction
Size) is much smaller at $112. Some transactions are very large, with the largest exceeding $90 million.
For most users, their first and last bitcoin transaction occurs within the same month (the median Existence
Time is one month), although some users are present for many years (the maximum Existence Time is 101
months, or just over eight years).
The other variables (Panel B) are more specific indicators of the nature of the activity in which a
user is likely to be engaged and are thus important in our empirical models. We therefore define and
discuss these variables when we turn to the empirical models.
< Table 2 >
4. Identifying a sample of illegal users
We identify a sample of addresses (and therefore users) involved in illegal activity using three
approaches described below.
4.1. First approach: Bitcoin seizures by law enforcement agencies
Our first approach exploits bitcoin seizures by law enforcement agencies such as the US FBI. We
manually identifying bitcoin seizures from news articles (via searches using Factiva) and US court
records (via searches of the digital PACER records). Table A1 in Appendix A reports the list of seizures
that we use. For each seizure, we extract information from court records and law enforcement agency
disclosures about any identified bitcoin addresses or transactions (amounts and dates). From these details

13
we uniquely identify the users involved in the illegal activity, by matching up the bitcoin address or
transaction identifier with our user-level data constructed from the bitcoin blockchain.
In some cases (e.g., the US FBI’s seizure of Silk Road and Ross Ulbricht’s holdings, and the
Australian law enforcement’s seizure of Richard Pollard’s holdings) the law enforcement agency
auctioned the seized bitcoin to the public. Given the public nature of the auctions, we are able to identify
the auction transactions on the bitcoin blockchain and work backwards to identify the seized bitcoin
addresses, which in turn identify those individuals that were involved in illegal activity and had some or
all of their bitcoin holdings seized by law enforcement agencies. Using this approach we are able to
identify 1,016 known illegal users, which we refer to as “Seized Users”.
4.2. Second approach: Illegal darknet marketplaces and their users
Our second approach exploits the known “hot wallets” of major illegal darknet marketplaces.
These are central accounts, many of which operate like escrow accounts, into which users of darknet
marketplaces deposit or withdraw funds. We are able to identify 17 such marketplaces using data from the
Wallet Explorer service, which in turn identifies these marketplaces using an approach similar to
Meiklejohn et al. (2013), i.e., on the basis of small “probing” transactions undertaken with a given entity.
From these hot wallets, we identify slightly over 6 million darknet marketplace users as
individuals that send to and/or receive bitcoin from a known darknet marketplace. We refer to the darknet
marketplace hot wallets and their contributors/recipients as “Black Market Users”.
An underlying assumption is that the trade that occurs in darknet marketplaces is illegal. This
assumption is supported by ample anecdotal evidence, objective empirical evidence in the form of darknet
market scrapes that show the goods and services traded there (e.g., Christin, 2013; Aldridge Décary-Hétu,
2014; Van Buskirk et al., 2014; Soska and Christin, 2015), as well as actions by law enforcement
agencies, including indiscriminate seizures of all bitcoin from such markets.
4.3. Third approach: Users identified in darknet forums
Our third approach exploits information contained in the darknet, in particular the bitcoin
addresses of users identified in darknet forums as selling goods/services. We use systematic scrapes of
darknet forums from 2013 to 2017.20
This allows us to identify users that might never have been caught
by authorities and might not be otherwise identified in the data through transactions with known darknet
marketplaces. Users often post bitcoin addresses in cases such as fraud (they did not receive their goods),
quality checking, and for the purposes of advertising the address to which funds should be sent, including
20
A list of known darknet markets is in Table A2 of Appendix. An archive of darknet forums during 2013-2015 is
available at https://www.gwern.net/index. We scrape information from active darknet sites during 2016-2017.

14
in privately negotiated trade. While other studies have also scraped darknet marketplaces for certain types
of information (e.g., Soska and Christin, 2015; Van Buskirk et al., 2016), as far as we know no other
study has used scrapes to identify the bitcoin addresses of illegal users.
Using this approach, ee identify an additional 448 users that were not already identified in either
of the previous two approaches. We refer to these as “Forum Users”.
4.4. The sample of illegal users
Table 3 shows the number of illegal users identified using the three approaches above and various
measures of their activity.21
Together, there are 6,223,337 “observed” illegal users, representing 5.86% of
all bitcoin participants. They account for an even larger share of transactions—a total of 196 million
transactions, or around one-third of all transactions (32.38%). They also account for an even larger share
of bitcoin holdings—throughout the sample period, the average dollar value of the bitcoin holdings of
observed illegal users is around $1.3 billion, which is close to half (45.28%) of the average dollar value of
holdings for all users.22
Observed illegal users control around one-quarter (26.33%) of all bitcoin
addresses, and the dollar value of their transactions is approximately 12.96% of the total dollar value of
bitcoin transactions.
Within the three subgroups of illegal users, the largest group in terms of number of users is the
“Black market users”, followed by “Seized users” and then “Forum users”. Seized users and Forum users
are nevertheless meaningful subgroups, for example, they account for 3.93% and 2.47% of all
transactions, respectively.
< Table 3 >
The results in Table 3 indicate that the sample of “observed” illegal users is already a substantial
proportion of users and bitcoin transaction activity, without yet having applied methods to estimate the
population of illegal users/activity. Capturing a relatively large sample of illegal activity is important
because it provides rich information to our empirical methods that estimate the totality of illegal activity.
The fact that the sample of illegal activity is drawn from three different approaches is also likely to help
the subsequent empirical models by providing a more diverse sample.
21
Given a transaction has two sides (a sender and a receiver) and it is possible for the different sides to be users
from different groups, throughout the paper we (double) count the number of transactions and volume by
considering each transaction from the perspective of the sender and receiver. 22
The average holdings numbers are considerably lower than current holdings because for the first few years of
bitcoin’s existence, its market capitalization was much lower than it is currently.

15
Finally, given the nature of illegal activity could change through time, it is also important that our
sample of observed illegal users spans different time periods and is not completely concentrated at one
point in time. Figure 2 indicates that this is the case for our sample of observed illegal users and their
activity. Figure 2 plots the time-series of the observed illegal users and their activity as a percentage of:
total users (Panel A), total number of transaction (Panel B), the dollar value of all transactions (Panel C),
and the dollar value of all bitcoin holdings (Panel D).
These time-series show that the observed illegal users are present during all points in time
throughout our sample period. Their share of activity is highest at the start of the sample in 2009, and then
again during a period from 2012 to the end of 2015. The first of these periods (the year 2009) is not
particularly economically meaningful as the first year or two of bitcoin’s existence involves a very small
number of users and transactions compared to subsequent years. In contrast, the activity in the second
period, 2012-2015, is meaningful. This period corresponds to the time when illegal darknet marketplaces
grew rapidly in number and popularity. Silk Road 1 was established in January 2011 and soon became a
popular venue in which to buy and sell illegal goods and services (e.g., Soska and Christin, 2015). After
Silk Road 1 was shut down by the US FBI in October of 2013, a large number of other illegal darknet
marketplaces commenced operating throughout 2013-2015 (see Table A2 of Appendix A). Thus, perhaps
somewhat unsurprisingly, the peak activity of our sample of observed illegal users coincides with
substantial darknet marketplace activity. However, we also observe a reasonable number of illegal users
and illegal activity outside of this peak window.
< Figure 2 >
5. Quantifying and characterizing all illegal activity
Having identified a substantial sample of bitcoin users that are involved in illegal activity, our
next step is to use the information in this sample to estimate the totality of illegal activity that uses
bitcoin. We use two different methods to classify users into those that are primarily involved in illegal
activity (“illegal users”) and those that are primarily involved in legal activity (“legal users”).
Subsequently, we measure the size and activity of the two groups.
At an intuitive level, the first method exploits the network topology—the information about who
trades with whom. Trade networks reveal “communities” of users and can thereby identify other illegal
users that were not part of our initial sample. In contrast, the second method exploits characteristics that
distinguish illegal users from legal users (controlling for non-random detection). Both methods allow a
user that was initially classified as an “observed” illegal user to be reclassified as a user that is
predominantly engaged in legal activity (a “legal user”). This feature of the methods allows for the

16
possibility that some of the users identified in the previous stage as having engaged in illegal activity
actually engaged in more legal activity than illegal activity.
The two methods provide independent estimates of the illegal activity and its characteristics.
Given that the methods rely on completely different assumptions and exploit different information, their
concurrent use provides robustness and the ability to cross-validate results. The methods are described
below in separate subsections. We then report the results of how many users and how much trade is
estimated to be associated with illegal activity, after which we characterize the nature of the illegal users
and their trading activity compared to legal users.
5.1. Method 1: Network cluster analysis
The first method exploits network topology to identify “communities” of users based on the
transactions between users. In simple terms, the method works as follows. If users A, B, and C are known
to be involved in illegal activity (e.g., their bitcoin was seized by law enforcement agencies), a user X that
trades exclusively or predominantly with users A, B, or C is likely to also be involved in illegal activity.
Similarly, a user Y that trades predominantly with users that are not identified as illegal is likely to be a
legal user. This intuition drives the classification of users into legal and illegal on the basis of their
transaction partners.
More formally, the method we apply is a network cluster analysis algorithm that takes as inputs
the set of users (“nodes” in network terminology) and the trades between users (“edges” or “links” in
network terminology). The output of the algorithm is an assignment of users to communities such that the
“modularity” of the communities (density of links within communities and sparsity of links between
communities) is maximized. The method labels a user as illegal (legal) if the disproportionate share of
their transactions is with members of the illegal (legal) community. The method does not assume that
users only engage in either legal or illegal activity—users can do both. Therefore, there will be some
trades between the legal and illegal communities.
We apply a variant of the Smart Local Moving (SLM) algorithm developed by Waltman and van
Eck (2013), adapted to our specific application. The algorithm’s name (“smart moving”) comes from the
fact that the algorithm finds the underlying community structure in the network by moving nodes from
one community to another, if such a move improves the model fit. The SLM algorithm is among the
leading network cluster analysis algorithms.23
Applied to our data, the algorithm is as follows.
23
For example, Emmons et al. (2016) in their comparison of multiple methods find that the SLM algorithm
performs the best in terms of maximizing cluster quality metrics.

17
Step 1: Assign all the observed illegal users to the illegal community and all of the remaining
users to the legal community.
Step 2: Loop through each user, performing the following action on each:
o If the user disproportionately transacts with members of the user’s currently assigned
community, then leave the user in that community24
;
o Otherwise, move the user to the other community (if the user is assigned to the
illegal community, move the user to legal community, and vice versa).
Step 3: Repeat Step 2 until, in a complete loop through all users, no user switches between
communities. At that point the assignment to communities is stable and ensures that each
member trades disproportionately with other members of the same community.
Note that due to the iterative moving in the algorithm, not all of the “observed” illegal users will
necessarily remain in the illegal community. For example, it is possible that some of the users that had
bitcoin seized by authorities were involved in some illegal activity (hence getting bitcoin seized) but were
mainly using bitcoin for legal purposes. This will be recognized by the algorithm in Step 2 and the user
will be moved to the legal community.
5.2. Method 2: Detection controlled estimation (DCE)
The second method we use to estimate the population of users involved in illegal activity (“illegal
users”) is detection controlled estimation (DCE). Intuitively, this method exploits the differences in the
characteristics of legal and illegal users of bitcoin to probabilistically identify the population of illegal
users. If we had a random sample of illegal users and a set of characteristics that differ between legal and
illegal users (e.g., measures of the extent to which a user has employed tools to conceal their activity), this
task would be relatively simple and could be achieved with standard techniques (regression, discriminant
analysis, and so on). A complication is that detection (as in most settings where violators attempt to
conceal their illegal activity from authorities) is not random, and this non-randomness must be accounted
for to obtain unbiased estimators.25
We use “detection” in the broad sense of an illegal user having been
identified by any of the three approaches described in the previous section (had bitcoin seized by a law
enforcement agency, was identified in darknet forums, or was observed in the blockchain data as having
24
“Disproportionately” is if the proportion of transactions the user makes with other members of the same
community is greater than or equal to the community’s proportion of total transactions. In robustness tests we
consider the proportion of volume rather than transactions and find consistent results. 25
A further complication is that the determinants of this non-randomness are not separately observed (unlike, for
example, non-respondents in a survey, or people that choose not to participate in the labor force) and therefore the
classic tools to deal with sample selection bias (e.g., Heckman models) cannot be applied.

18
transacted with a known illegal darknet marketplace). Thus, “detected” illegal users are the observed
illegal users described in Section 4.
Fortunately this econometric challenge is not unique to illegal activity in bitcoin and methods to
overcome this challenge exist. The same challenge occurs in quantifying other forms of misconduct such
as tax evasion, fraud, insider trading, and market manipulation, as well as contexts such as nuclear power
plant safety regulation breaches, cancer detection by mammograms, and so on. The standard tool for these
settings is DCE. Since its development by Feinstein (1989, 1990), DCE models have been applied to
various financial misconduct settings including tax evasion (Feinstein, 1991), corporate fraud (Wang et
al., 2010), and market manipulation (Comerton-Forde and Putniņš, 2014). By explicitly modelling both
underlying processes (violation and detection) simultaneously, one can obtain unbiased estimates of the
illegal activity, which is otherwise only partially observed.
< Figure 3 here >
Figure 3 illustrates the two-stage DCE model that we estimate. On the left is the starting point, the
data, which in our case is the set of all bitcoin users. In the middle we have the two processes, violation
(undertaking illegal activity) and detection (e.g., bitcoin seizures). On the right-hand side are the joint
outcomes of those processes: the observable classifications of users into detected illegal users (the set 𝐴)
and other users (the complement set 𝐴𝐶, comprising legal users and undetected illegal users).
The first branch models whether a bitcoin user, 𝑖, is predominantly involved in illegal or legal
activity. This branch is modelled as an unobservable binary process (𝐿1𝑖) driven by a continuous latent
function (𝑌1𝑖) of a vector of characteristics, 𝑥1𝑖, that can distinguish between legal and illegal users:
𝑌1𝑖 = 𝛽1𝑥1𝑖 + 𝜖1𝑖 (1)
𝐿1𝑖 = {
1 0
(𝐼𝑙𝑙𝑒𝑔𝑎𝑙 𝑢𝑠𝑒𝑟)
(𝐿𝑒𝑔𝑎𝑙 𝑢𝑠𝑒𝑟) if
𝑌1𝑖 > 0 𝑌1𝑖 ≤ 0
}
(2)
The second branch models whether or not an illegal user is “detected” (they enter our sample of
observed illegal users). This detection process is modelled as another unobservable binary process (𝐿2𝑖)
driven by a different continuous latent function (𝑌2𝑖) of a vector of characteristics, 𝑥2𝑖, that affect the
probability that an illegal user is detected:
𝑌2𝑖 = 𝑥2𝑖𝛽2 + 𝜖2𝑖 (3)
𝐿2𝑖 = {
1 0
(𝐷𝑒𝑡𝑒𝑐𝑡𝑒𝑑)
(𝑁𝑜𝑡 𝑑𝑒𝑡𝑒𝑐𝑡𝑒𝑑) 𝑖𝑓
𝑌2𝑖 > 0 𝑌2𝑖 ≤ 0
}
(4)
Both stages of the model are estimated simultaneously using maximum likelihood. The likelihood
function for the model is derived in Appendix B. Intuitively, this process finds estimates for the vectors of

19
model parameters, 𝛽1 and 𝛽2, that maximize the likelihood of the observed data (the classification of
users into sets 𝐴 and 𝐴𝐶). From the estimates of 𝛽1 and 𝛽2, we compute each user’s probability of being
involved in illegal activity and construct a binary classification of legal and illegal users.
Similar to the SLM approach, the DCE model does not assume that detected illegal users were
engaged solely or predominantly in illegal activity. Once the DCE model is estimated, the classification
of users into legal and illegal categories can result in some detected illegal users being re-classified as
predominantly legal users.26
Similar to Heckman models, identification in a DCE model without instruments is possible,
relying on functional form and distributional assumptions. However, more robust identification is
achieved through instrumental variables that affect one process but not the other. We take the more robust
route of using instrumental variables. The next subsection describes the instrumental variables and their
descriptive statistics.
5.3. Variables used in the DCE model and their descriptive statistics
One of the instrumental variables associated with illegal activity is the extent to which the user
employs methods to conceal their identity or obfuscate their transaction history. For example, to partially
conceal their identities from an observer of the bitcoin blockchain, users can use “tumbling” and “wash
trades” to alter the addresses of their bitcoin holdings, increasing the difficulty of tracing their activity.
Tumbling, in its simplest form, involves a user sending bitcoin to a tumbling provider who (in return for a
small fee) returns the balance to a different address controlled by the user. Wash trades involve a user
sending bitcoin from one address to another (new) address that they also control. Legal users have little
reason to take such actions to conceal their actions (and incur associated costs). In contrast, users involved
in illegal activity are likely to use these concealment techniques. As such, the use of tumbling services
and wash trades is likely to be a predictor of whether a user is involved in illegal activity. Importantly (for
this to be an instrumental variable), using wash trades and tumbling does not alter the probability of
“detection” by law enforcement agencies via the seizures of bitcoin from darknet sites. The seizures
confiscated all bitcoin held in darknet marketplace escrow accounts (“hot wallets”) irrespective of
whether the user employed tumbling or wash trades. For each user, we measure the percentage of their
transactions that are tumbling or wash trades and call this variable Tumbling.
26
For example, suppose a user was involved in some illegal activity and had bitcoin seized by authorities but was
mainly using bitcoin for legal purposes. Such a user will have characteristics that are similar to those of legal users
and not very similar to illegal users, which would lead to a classification by the DCE model into the legal user
category. In contrast, a predominantly illegal user, even if not detected or observed, is likely to have characteristics
similar to other illegal users and therefore (after controlling for the differences in characteristics due to non-random
detection) the user is likely to be classified as illegal by the DCE model.

20
Another set of instruments for the likelihood that a user is involved in illegal activity involves
time-series variables that are likely to correlate with the type of activity in which bitcoin users are
engaged. For example, for each user we construct a measure of the average number of operational illegal
darknet marketplaces at the time the user transacts (we label the variable Darknet Sites). All else equal,
illegal transactions (and thus users involved in illegal activity) are more likely when there is a lot of
illegal darknet marketplace activity than when there is little or no illegal darknet activity.
In a similar spirit, we construct a measure of the average number of opaque cryptocurrencies in
existence (Dash, Monero, and ZCash) at the time the user participates in bitcoin (labelled Shadow Coins).
These major alternative “shadow coins” were developed, at least in part, to provide more privacy than
bitcoin. If some of the online black market starts using these shadow coins instead of bitcoin, the number
of such coins in existence at the time a user transacts in bitcoin is likely to inversely correlate with the
user’s likelihood of being involved in illegal activity.
For each user, we also construct a measure of the amount of mainstream interest and hype
associated with bitcoin at the time of their participation in bitcoin (we label the variable Bitcoin Hype).
We take the average Google Trends search intensity for the keyword “bitcoin” at the time of the user’s
bitcoin transactions. If Google search intensity for “bitcoin” correlates with speculative trading in bitcoin
and mainstream (legal) use, this variable will have an inverse association with the likelihood of the user
being involved in illegal activity.
Our final instrument for involvement in illegal activity exploits the anecdotal evidence that
significant darknet marketplace shocks such as seizures of darknet marketplaces by law enforcement
agencies or closures of such marketplaces for scams or hacks result in a brief spike of transaction activity
by illegal users as they turn to alternative marketplaces or relocate their holdings in response to the shock.
At the same time, shocks to darknet marketplaces are unlikely to materially affect the activity of legal
users. Therefore, for each user, we measure the fraction of the user’s transaction value that occurs in the
one week period after each major darknet marketplace shock (marketplace “raids”, “scams”, and “hacks”
in Table A2 of Appendix A). We label this variable Darknet Shock Volume.
As determinants of the probability of detection, we include a binary variable for whether the user
started using bitcoin (date of first bitcoin transaction) before the first seizure of bitcoin by law
enforcement agencies from Silk Road 1 (we label the variable Pre-Silk-Road User). Because users that
enter the bitcoin network after the first seizure can only be detected in subsequent seizures, post-Silk-
Road-seizure users are likely to have a lower detection probability.
A few things are worth noting about the variables used in the DCE model. First, while the
instrumental variables help identify the model, they are not the only characteristics that help separate legal
and illegal users—the full set of characteristics used in the model serve that purpose, including variables

21
common to both detection and violation equations (they have different coefficients in each equation). The
full list of variables is presented in Table 1. Second, identification of the model requires only one variable
that is associated with either the probability of being involved in illegal activity or the probability of
detection, but not both. We have more candidate instrumental variables than this minimum of one, and in
robustness tests we examine how sensitive the results are to the assumptions about these instruments. We
do so by relaxing the assumed exclusion restrictions on a subset of the instruments one at a time, from
which we conclude that the results are not particularly sensitive to any individual instrumental variable’s
exclusion restriction.
Table 2 Panel B reports descriptive statistics about the variables that serve as instruments.
Darknet Sites indicates that for the average bitcoin participant, there are on average 17 operational
darknet marketplaces around the time of their transactions. This number ranges from a minimum of zero
to a maximum of 27. Tumbling indicates that only a relatively small proportion of users (less than 25%)
engage in “tumbling” and/or “wash trades”, which are used to obscure the user’s holdings. Thus, while
techniques exist to help a bitcoin user conceal their activity, it appears that few bitcoin users adopt such
techniques.
The variable Shadow Coins indicates that for the average bitcoin participant, there are around two
opaque alternative cryptocurrencies in existence at the time of their transactions. The variable Darknet
Shock Volume indicates that while most users do not trade in the period immediately following darknet
shocks (median of zero), some users conduct a large fraction of their trading during these periods, with
the average bitcoin user undertaking 17% of their trading following darknet shocks.
The variable Bitcoin Hype indicates that for the average user, the intensity of Google searches for
“bitcoin” is around 28% of its maximum of 100%. The Pre-Silk-Road User dummy indicates that only
around 7% of all bitcoin participants started transacting before October 2013, when the first darknet
marketplace seizure by law enforcement agencies occurred (the seizure of Silk Road 1 by the FBI).
5.4. How much illegal activity involves bitcoin?
Both methods—network cluster analysis (SLM) and detection controlled estimation (DCE)—
arrive at probabilistic classifications of bitcoin users into those primarily involved in legal activity and
those primarily involved in illegal activity. Once the users have been partitioned into the legal and illegal
“communities”, we use those categorizations to quantify the size and activity of the two groups.
Table 4 presents the main results at the aggregate level, for the whole sample period. Panel A
reports the estimated size of the groups and their level of activity, while Panel B re-expresses these values
as percentages for each group. First, the percentage of bitcoin users estimated to be predominantly
involved in illegal activity is 29.12% using the SLM and 21.37% using the DCE, giving a midpoint

22
estimate of about one-quarter of bitcoin users (25.24%, the average of the estimates from the two
models). The 99% confidence interval around this estimate is 21.73% to 28.76%.27
The midpoint estimate
suggests around 26.82 million bitcoin users are predominantly involved in illegal activity, versus 79.42
million legal users.
The estimated number of illegal users is around four times larger than our sample of observed
illegal users. Given our sample of observed illegal users is based on a comprehensive approach and
includes all users that can be observed transacting with one of the known darknet marketplaces, the
results suggest that without empirical methods such as the SLM or DCE, illegal activity that can be
inferred from involvement with known darknet marketplaces represents only a small (and likely non-
random) fraction of all illegal activity. Thus, our results suggest that studies of known/identifiable darknet
markets (e.g., Soska and Christin, 2015; Meiklejohn et al., 2013) only scratch the surface of all illegal
activity involving bitcoin.
< Table 4 >
Table 4 also indicates that illegal users account for an even larger share of all transactions—
around 44.33% (45.67% using the SLM and 42.99% using the DCE) or approximately 269 million
transactions. Thus, the average illegal user is involved in more transactions than a legal user. This result is
consistent with the notion that illegal users are likely to use bitcoin as a payment system (which involves
actively transacting), whereas legal users may hold bitcoin for reasons such as speculation. A similar
proportion is observed for holding values—illegal users on average hold around one-half (51.28%) of the
outstanding bitcoin. One reason for the large share of illegal user holdings (relative to their share of the
number of users) is related to the calculation of this variable as a time-series average. A high fraction of
illegal users in the early parts of the sample (when there are fewer bitcoin users) can generate such a
result even if the holdings per user are lower among illegal users compared to legal users.
Illegal users are estimated to control around 38.21% of bitcoin addresses and account for about
one-fifth (20.30%) of the dollar volume of bitcoin transactions. In dollar terms, illegal users conduct
approximately $378 billion worth of bitcoin transactions. Because illegal users account for a larger share
of transactions than their share of dollar volume, they tend to make smaller value transactions than legal
27
We use a form of bootstrapped standard errors to form the confidence interval. First we obtain standard errors
from the DCE model using a bootstrap of 200 samples in which, for computational reasons, we are forced to reduce
the sample size by taking a random sample (this is a conservative step as it inflates the estimated standard errors
relative to the standard errors for the full sample size). We then apply the conservative bootstrapped DCE standard
errors to approximate the error in the midpoint estimate. This step assumes the SLM standard errors (which we
cannot compute as a bootstrap would not be appropriate when one needs to use the transaction network in the
model) are similar in magnitude to the DCE standard errors.
23
users. This result is consistent with illegal users primarily using bitcoin as a payment system rather than
holding it as an investment or speculative asset.
Three general conclusions can be drawn from the results in Table 4. First, illegal users account
for a sizeable proportion of both users and trading activity in bitcoin, with the exact proportion varying
across different measures of activity and the two estimation models. Second, the estimates from both the
SLM and DCE are fairly similar across the various activity measures, despite relying on completely
different assumptions and information. Third, even a fairly comprehensive approach to identifying illegal
activity directly (such as the approach used in the previous section and that used in other darknet market
studies) only captures a small fraction of the total illegal activity, highlighting the importance of
extrapolation beyond a directly observed sample.
5.5. How does the illegal activity vary through time?
There is interesting time-series variation in the amount of illegal activity and its share of all
bitcoin activity. Figures 4 to 7 plot the estimated amount of illegal activity that uses bitcoin through time
from the first block in 2009 to 2017. The figures show the estimated number of illegal users, the number
and dollar value of their transactions, and the value of their bitcoin holdings. Panel B of each of the
figures shows these activity measures as a percentage of the total across all bitcoin participants.28
< Figure 4 here >
< Figure 5 here >
< Figure 6 here >
< Figure 7 here >
A pattern that is observed across all activity measures is that illegal activity, as a percentage of
total bitcoin activity, tends to be high at the start of the sample in 2009, and then again from 2012 to the
end of 2015, after which it steadily declines through to 2017. The activity levels indicate that there is only
a very small (negligible) level of activity in bitcoin until about the middle of 2011, so the activity at the
start of the sample is not economically meaningful. In contrast, the high relative level of illegal activity
between 2012 and 2015 is noteworthy and coincides with the growth in the number of illegal darknet
marketplaces, starting with the Silk Road in 2011. After the Silk Road was shut down in October of 2013,
a large number of other illegal darknet marketplaces commenced operating between 2013 and 2015
(Table A2 of Appendix A).
28
Figures 4-7 use the average of the SLM and DCE model estimates. The SLM and DCE time-series estimates are
separately reported in Figures A1-A8 of the Online Appendix.

24
What could drive the decline in the relative level of illegal activity from the end of 2015
onwards? The first thing to note is that the decline is observed in relative terms (that is, illegal activity as
a fraction of total bitcoin activity), but not in absolute terms. Thus, it is not the case that the level of
illegal activity in bitcoin has declined in recent years, rather, there has been a disproportionate increase in
the legal use of bitcoin since the end of 2015. For example, from the end of 2015 to April 2017, the
estimated number of illegal bitcoin users increases from around 16 million to around 24 million,
reflecting growth of around 50%, whereas the estimated number of legal bitcoin users increases from
around 15 million to around 58 million, reflecting growth of around 290%. The rapid growth of legal use
is likely driven by factors such as increased interest from investors and speculators (e.g., the emergence of
“cryptofunds”, and more recently bitcoin futures) and increased mainstream adoption as a payment
system (e.g., cafes and internet merchants accepting bitcoin).
The time-series of legal and illegal activity levels show strong growth in both illegal and legal
activity throughout the sample period, in particular since 2012. Interestingly, the strong growth in illegal
activity precedes the strong growth in legal activity—by about three or four years. Thus it seems illegal
users were relatively early adopters of bitcoin as a payment system.
Finally, because of the rapid growth in the legal use of bitcoin in the final two years of the
sample, the aggregate measures of the illegal proportion of bitcoin activity reported in the previous
subsection understate the proportion seen throughout most of the sample period. For example, for most of
the sample period, the estimated proportion of illegal users is closer to one-half than one-quarter (the
aggregate estimate). The aggregate estimate is heavily influenced by the large number of legal users that
enter in the last two years of the sample. Similarly, for much of the sample period, the estimated
proportion of bitcoin transactions involved in illegal activity is between 60% and 80%, contrasting with
the aggregate estimate of around 44%.
The most recent estimates of illegal activity (at the end of our sample in April 2017) suggest there
are around 24 million illegal users of bitcoin. These users conduct around 36 million bitcoin transactions
annually, valued at around $72 billion, and collectively hold around $8 billion in bitcoin.29
5.6. What are the characteristics of illegal users?
We assess the differences between legal and illegal user characteristics in two ways: univariate
statistics that compare observed or estimated illegal users with their legal counterparts, and multivariate
tests exploiting the coefficients of the estimated DCE model.
29
For these estimates, we have halved the double-counted volumes so that the estimates can be interpreted as the
volume/value of goods/services bought/sold by the illegal users.

25
< Table 5 >
Starting with a univariate difference in means, Table 5 compares the characteristics of the sample
of “observed” illegal users with the characteristics of other users. Note that the “other users” are not all
legal users—they contain a mix of legal users and undetected illegal users. Therefore, the table also
compares the characteristics of users classified by the SLM and DCE models as being involved in illegal
activity with those of users classified as legal. Interestingly, despite being based on completely different
assumptions, the SLM and DCE models generally agree on how the characteristics of legal users differ
from illegal users. This is true for the signs of the mean differences for all but one characteristic
(Transaction Frequency).
The SLM and DCE models agree that illegal users tend to transact more (have a two to three
times higher Transaction Count), but use smaller sized transactions (about half the average size of legal
transactions). This result could be a reflection of illegal users predominantly using bitcoin to buy and sell
goods and services, whereas some legal users also use bitcoin for investment and speculation.30
The models also agree that illegal users tend to hold less bitcoin (measured in dollar value) than
legal users; their average Holding Value is about half that of legal users. This characteristic is consistent
with the previous conjecture—legal users might tend to hold larger bitcoin balances because some use
bitcoin for investment/speculation purposes, whereas for an illegal user that buys/sells illegal goods and
services using bitcoin, holding a large balance is costly due to (i) opportunity costs of capital, and (ii)
risks associated with having holdings seized by authorities. For these reasons, illegal users are likely to
prefer holding less bitcoin and this tendency is supported by the data.
Illegal users tend to have more counterparties in total, reflecting their larger number of
transactions, but tend to have a higher counterparty concentration. This suggests that illegal users are
more likely to repeatedly transact with a given counterparty. This characteristic might be a reflection of
illegal users repeatedly transacting with a given illegal darknet marketplace or other illegal user once trust
is established from a successful initial exchange. Illegal users have a longer Existence Time (time between
their first and last transactions in bitcoin), consistent with our observations from the time-series that
illegal users tend to become involved in bitcoin earlier than legal users. Similarly, the differences in
means also show that there is a higher proportion of Pre-Silk-Road users among the illegal users than the
legal users (as indicated by the variable Pre-Silk-Road User).
30
While the result could also reflect illegal users engaging in techniques to conceal their trading, this is less likely to
be an explanation because a similar result holds in multivariate (DCE) tests that control for tumbling and wash
trades.

26
The more specific indicators of illegal activity also show significant differences between the two
groups. Illegal users tend to be more active during periods in which there are many illegal darknet
marketplaces operating (a higher mean for the variable Darknet Sites). They make greater use of tumbling
and wash trades to conceal their activity (two to four times more Tumbling). On average, a larger
proportion of illegal volume, compared to legal volume, is transacted immediately following shocks to
darknet marketplaces (Darknet Shock Volume). This finding is consistent with anecdotal evidence that
illegal users turn to alternative marketplaces in response to darknet marketplace seizures or scams.
Interestingly, illegal users are more likely to transact with bitcoin when there are fewer opaque
“shadow coins” in existence, suggesting such coins do get used as alternatives to bitcoin in illegal
transactions. This result (for the variable Shadow Coins) is consistent with anecdotal accounts of shadow
coins becoming recognized by the illegal community for their increased privacy, as well as recent
examples of hackers demanding ransom payments in shadow coins rather than bitcoin.
Another interesting result is that legal users tend to be more active in bitcoin when there is less
Bitcoin Hype, measured by the Google search intensity for “bitcoin”. It therefore appears that Google
searches for “bitcoin” are associated with mainstream (legal) adoption of bitcoin for payments, and/or
speculative/investment interest in bitcoin.
In summary, the comparison of transactional characteristics (number and size of transactions,
holdings, and counterparties) is consistent with the notion that illegal users predominantly use bitcoin for
payments, whereas legal users are more likely to treat bitcoin as an investment asset. Furthermore, legal
and illegal users differ with respect to when they are most active in bitcoin, with illegal users being most
active when there are more darknet marketplaces, fewer shadow coins, less bitcoin hype, and immediately
following shocks to darknet marketplaces. The differences in characteristics for the instrumental variables
are consistent with the hypothesized differences, lending support to their use as instruments.
< Table 6 >
The DCE model coefficients reported in Table 6 provide multivariate tests of how the
characteristics relate to the likelihood that a user is involved in illegal activity. The results confirm most
of the observations made in the simple comparison of means. The effects of all of the instrumental
variables are consistent with their hypothesized effects. A user is more likely to be involved in illegal
activity if they trade when: (i) there are many darknet marketplaces operating, (ii) there are fewer shadow
coins in existence, (iii) there is little bitcoin hype, and (iv) darknet marketplaces experience seizures or
scams. A user is also more likely to be involved in illegal activity if they use tumbling and/or wash trades,
transact frequently in small sized transactions, and tend to repeatedly transact with a given counterparty.

27
The marginal effects in Table 6, reported in parentheses below the coefficient estimates, provide a
sense of the magnitudes of the effects and their relative importance.31
For example, the marginal effects
indicate that a one standard deviation increase in the number of illegal darknet marketplaces at the time a
user transacts in bitcoin increases the probability of that user being involved in illegal activity by a factor
of 0.435, or 43.5% of what their probability would otherwise be.32
The magnitudes generally show that
most of the determinants of involvement in illegal activity and determinants of the detection probability
are economically meaningful. In particular, the instrumental variables of Darknet Sites, Shadow Coins,
Bitcoin Hype, and Darknet Shock Volume all have strong relations with the probability that a user is
involved in illegal activity.
The DCE model also sheds light on the determinants of the likelihood that an illegal user is
“detected” by either of our three approaches. The main instrument, Pre-Silk-Road User has a strong
relation with detection, indicating that illegal users that commence transacting in bitcoin prior to the first
darknet marketplace seizure in October 2013 have a higher probability of being detected. Similarly, those
users that transact in bitcoin for a longer period of time (higher Existence Time), trade more frequently
(higher Transaction Frequency), or tend to trade repeatedly with a given counterparty such as a darknet
marketplace (higher Concentration) have a significantly higher detection probability.
Model 2 in Table 6 adds further control variables to the models, including Holding Value and
Transaction Count, and finds that the main results do not change much in response to additional control
variables. A risk of adding too many transactional control variables is co-linearity between such variables.
5.7. What are the characteristics of the illegal user network?
Exploiting the fact that the bitcoin blockchain provides us with a complete record of every
transaction between every pair of counterparties, we briefly explore how the trade network of illegal users
differs from that of legal users. Our approach is to compute a few descriptive network metrics that capture
different aspects of network topology and structure for each of the two groups or “communities”
separately and then compare the values between the two communities. In mapping the networks, users
form the “nodes”, and transactions between users form the “edges” or “links” between nodes.
< Table 7 >
31
To make the comparisons and interpretation easier, before estimating the DCE models, we standardize all
variables to have mean zero and standard deviation of one. We also log transform the right skewed variables
(Transaction Frequency, Size, and Count, and Holding Value) and winsorize the variables at +/- three standard
deviations to reduce the influence of extreme values. 32
As an example of how to interpret the marginal effect of 0.435, if a user’s illegal probability is say 20%, the
predicted effect of a one standard deviation increase in Darknet Sites, holding all else constant, is to increase the
user’s probability to 20% × 1.435 = 28.7%, an increase of 43.5% of what their probability would otherwise be.

28
Table 7 reports the results. The first metric, Density, takes the range [0,1] and indicates how
highly connected the users are within a community (versus how sparse the connections are between
users); it is the actual number of links between users within the given community (a “link” between two
users means that they have transacted with one another) divided by the total potential number of links. It
shows that the illegal trade network is three to four times denser in the sense that users are much more
connected to one another through transactions. This observation is consistent with the fact that illegal
users tend to transact more than legal users. It is also consistent with the notion that in the illegal
community, bitcoin’s dominant role is likely that of a payment system in buying/selling goods, whereas in
the legal community, bitcoin is also used as an investment or for speculation.
Reciprocity takes the range [0,1] and indicates the tendency for users to engage in two-way
interactions; it is the number of two-way links between users within the given community (a two-way link
is when two users send and receive bitcoin to and from one another) divided by the total number of links
within the given community (two-way and one-way). While Reciprocity is higher among illegal users
than it is among legal users, it is generally very low in both communities (1% among legal users and 3%
among illegal users). Thus, interactions between bitcoin users are generally only one-way interactions
with one counterparty receiving bitcoin from the other but not vice versa.
Entropy measures the amount of heterogeneity among users in their number of links to other
members of the community. It takes its minimum value of zero when all users have the same number of
links (same degree).33
The results suggest that illegal users are a more heterogeneous group in terms of
the number of links each user has with other members of the community. A driver of that heterogeneity
could be that the illegal community at one end of the spectrum has darknet marketplaces that have
hundreds of thousands of links to vendors and buyers, and at the other end has individual customers of a
single marketplace, potential with only the one link.
A concluding observation is that both the SLM and DCE models provide a consistent picture of
how legal and illegal users differ, this time in the context of their trade networks. Again, this suggests that
the two different models tend to agree about the nature of the illegal activity in bitcoin.
5.8. Robustness tests
We conduct a number of different robustness tests. Perhaps the most rigorous robustness test of
an empirical model is to compare its results with results from a completely different model/approach that
makes different assumptions and draws on different information. Throughout the paper we put our two
33
Formally,𝐸𝑛𝑡𝑟𝑜𝑝𝑦 = −∑ 𝑃(𝑑)log [𝑃(𝑑)]𝑑 , where 𝑃(𝑑) is the degree distribution (probability density of the
degree for each user, where a user’s degree, 𝑑, is the number of links the user has with other members of the same
community).

29
empirical models through this test. The two models, one based on a network cluster analysis algorithm
and the other on a structural latent variables model drawing on observable characteristics, provide highly
consistent results. The two models tend to agree, within a reasonable margin of error, on the overall levels
of illegal activity, as well as the differences between legal and illegal users in terms of characteristics and
network structure.
We also subject each of the models to specific tests that vary key assumptions or modelling
choices. Table 8 reports the estimated amount of illegal activity for the most notable of these tests. For the
SLM, we re-estimate the model using transaction volumes as the measure of interaction between users
rather than transaction counts (SLM Alternative 1). We also consider a modification of the SLM algorithm
in which we impose a constraint that does not allow the sample of “observed” illegal users to be moved to
the legal community (SLM Alternative 2). For the DCE model, one set of robustness tests involves
examining the sensitivity to relaxing key exclusion restrictions. For example, in the baseline model,
Darknet Sites (the number of operational darknet marketplaces at the time a user transacts) is included
only as a determinant of illegal activity. As a robustness test (DCE Alternative 1), we include it in both
equations, allowing it to also affect the probability of detection. Of all the determinants of illegal activity,
Darknet Sites has the most plausible reasons for possibly also affecting detection—the existence of many
darknet marketplaces might be a catalyst for increased surveillance and enforcement by law enforcement
authorities. We also test sensitivity to the key exclusion restriction in the detection equation by including
Pre-Silk-Road User in both equations (DCE Alternative 1), thereby allowing it to also affect the
probability of illegal activity.
< Table 8 >
Table 8 shows that the estimated overall levels of illegal activity across the various activity
measures are not overly sensitive to modifications of the baseline model. Similarly, the estimated
characteristics of illegal users are not overly sensitive to these modifications (results not reported for
conciseness). The Online Appendix Table A1 reports the coefficient estimates for the two DCE models
described above in which we relax key exclusion restrictions, showing that the coefficients are also not
particularly sensitive to these modifications.
We also examine the robustness of the DCE model to the initial parameter values used in
estimating the model. We initialize the model with different starting values (-1, 0, +1, and randomly
drawn starting values), and find that our results are not sensitive to the choice of starting values,
suggesting convergence to a global rather than local maximum of the likelihood function.
30
Finally, we re-estimate the standard errors used in confidence bounds around the estimated illegal
activity and significance tests. Instead of the bootstrapped standard errors that we use in the main results,
we instead compute standard errors using analytic expressions. We find that the analytic standard errors
are considerably smaller than the bootstrapped standard errors. This finding suggests that using
bootstrapped standard errors in the main results is the more conservative of the two approaches.
Finally, the characteristics of illegal users could change through time (for example, in response to
seizures by law enforcement agencies), which could lead to model mis-specification. To examine this
possibility, we repeat the difference-in-means comparison of legal and illegal users, partitioning the
sample into a pre-Silk-Road seizure period and a post-Silk-Road seizure period (pre/post October 2013).
Tables A2 and A3 in the Online Appendix report these results for both SLM and DCE classifications of
illegal users.34
For most characteristics, the differences between legal and illegal users take the same sign
in both the pre/post periods, typically with similar magnitudes. In cases where the pre and post periods are
different, the difference is often driven by a change in the characteristics of legal rather than illegal users
(the change in the legal user mean is larger than the change in the illegal user mean). This tendency
suggests while some characteristics do change through time, the changes are more likely to reflect general
trends rather than a response of illegal users to events such as darknet marketplaces seizures.
6. Discussion
6.1. Implications
Blockchain technology and the systems/protocols that can be implemented on a blockchain have
the potential to revolutionize numerous industries. Possible benefits to securities markets include reducing
equities settlement times and costs (Malinova and Park, 2016; Khapko and Zoican, 2016), increasing
ownership transparency leading to improved governance (Yermack, 2017), and providing a payments
system with the network externality benefits of a monopoly but the cost discipline imposed by free market
competition (Huberman et al., 2017). The technology has even broader applications beyond securities
markets, from national land registries, to tracking the provenance of diamonds, decentralized decision
making, peer-to-peer insurance, prediction markets, online voting, distributed cloud storage, internet
domain name management, conveyancing, medical record management, and many more.
This technology, however, is encountering considerable resistance, especially from regulators.
Regulators are cautious due to their limited ability to regulate cryptocurrencies and the many potential but
poorly understood risks associated with these innovations. The negative exposure generated by anecdotal
accounts and salient examples of illegal activity no doubt contributes to regulatory concerns and risks
34
The comparison excludes characteristics that have little or no variation with the pre or post periods, such as Pre-
Silk Road User dummy variable, Shadow Coins, and Darknet Sites.

31
stunting the adoption of blockchain technology, limiting its realized benefits. In quantifying and
characterizing this area of concern, we hope to reduce the uncertainty about the negative consequences of
cryptocurrencies, allowing for more informed decisions by policymakers that assess both the costs and
benefits. Hopefully, by shedding light on the dark side of cryptocurrencies, this research will help
blockchain technologies reach their potential.
A second contribution of this paper is the development of new approaches to identifying illegal
activity in bitcoin, drawing on network cluster analysis and detection controlled estimation techniques.
These methods can be used by law enforcement authorities in surveillance activities. For example, our
methods can be applied to blockchain data going forward as new blocks are created, allowing authorities
to keep their finger on the pulse of illegal activity in bitcoin. Applied in this way, one could monitor
trends in illegal activity such as its growth or decline, its response to various regulatory interventions such
as seizures, and how its characteristics change through time. Such information could help make more
effective use of scarce regulatory and enforcement resources.
Another surveillance application is in identifying individuals/entities of strategic importance, for
example, major suppliers of illegal goods. Combining these empirical methods with other sources of
information can “de-anonymize” the nameless entities identified in the data. This might be done, for
example, by tracing the activity of particular individuals to the interface of bitcoin with either fiat
currency or the regulated financial sector (many exchanges and brokers that convert cryptocurrencies to
fiat currencies require personal identification of clients). The methods that we develop can also be used in
analyzing many other blockchains.
Third, our finding that a substantial amount of illegal activity is facilitated with bitcoin suggests
that bitcoin has contributed to the emergence of an online black market, which raises several welfare
considerations. Should policymakers be concerned that people are buying and selling illegal goods such
as drugs online and using the anonymity of cryptocurrencies to make the payments? This is an important
question and the answer is not obvious. If the online market for illegal goods and services merely reflects
a migration of activity that would have otherwise occurred “on the street” to the digital world of e-
commerce, the illegal online activity facilitated via bitcoin might not be bad from a welfare perspective.
In fact, there are many potential benefits to having illegal drugs and other goods bought and sold online
rather than on the street. For example, it might be safer and lead to reduced violence (e.g., Barratt et al.,
2016a). It could also increase the quality and safety of the drugs because darknet marketplaces rely
heavily on user feedback and vendor online reputation, which can give a buyer access to more
information about a seller’s track record and product quality than when buying drugs on the street (e.g.,
Soska et al., 2015). There is also more choice in the goods offered, which has the potential to increase
consumer welfare.

32
However, by making illegal goods more accessible, convenient, and reducing risk (due to
anonymity), the darknet might encourage more consumption of illegal goods and increase reach, rather
than simply migrating existing activity from the street to the online environment (Barratt et al., 2016b).
Presuming illegal goods and services have negative net welfare consequences, then bitcoin and other
cryptocurrencies could decrease welfare by enabling the online black market. Such negative
consequences would have to be weighed up against welfare gains that also accompany cryptocurrencies.
Therefore, while our paper does not provide a definitive answer to the question of welfare effects,
it does get us closer to an answer by having estimated both the trends and scale of illegal activity
involving bitcoin (the most widely used cryptocurrency in darknet marketplaces). Future research might
quantify the relation between drug trafficking on the street vs online (drawing on our methods or
estimates) to understand to what extent we are experiencing a simple migration vs an expansion in the
overall market. It might also quantify the benefits of moving to an online market and contrast them with
the negative consequences of any expansion in the market as a result of it being more accessible /
convenient / safe.
Our results also have implications for the intrinsic value of bitcoin. The rapid increase in the price
of bitcoin in recent times has prompted much debate and divided opinions among market participants and
even policymakers / central banks about whether cryptocurrency valuations are disconnected from
fundamentals and whether their prices reflect a bubble. In part, the debate reflects the uncertainty about
how to value cryptocurrencies and how to estimate a fundamental or intrinsic value. While we do not
propose a valuation model, our results provide an input to an assessment of fundamental value in the
following sense. One of the intrinsic uses of cryptocurrencies, giving them some fundamental value, is as
a payment system. To make payments with bitcoin, one has to hold some bitcoin; the more widespread its
use as a payment system, the greater the aggregate demand for holding bitcoin to make payments, which,
given the fixed supply, implies a higher price. Our results suggest that currently, as a payment system,
bitcoin is relatively widely used to facilitate trade in illegal goods and services and thus the illegal use of
bitcoin is likely to be a meaningful contributor to bitcoin’s fundamental value.
This observation—that a component of bitcoin’s fundamental value derives from its use in illegal
trade—raises a few issues. First, an ethical investor might not be comfortable investing in a security for
which a meaningful component of the fundamental value derives from illegal use. Second, changes in the
demand to use bitcoin in illegal trade are likely to impact its fundamental value. For example, increased
attention from law enforcement agencies or increased adoption/substitution to more opaque alternative
cryptocurrencies could materially decrease the fundamental value of bitcoin. Conversely, continued
migration of the black market to online with continued use of bitcoin, could further increase bitcoin’s
fundamental value. Third, recent price appreciation of bitcoin greatly exceeds the growth in its use in

33
illegal activity, suggesting either a substantial change in other components of bitcoin’s fundamental value
or a dislocation of the bitcoin price from its fundamental value.
6.2. Relation to other literature
This paper contributes to three branches of literature. First, several recent papers analyze the
economics of cryptocurrencies and applications of blockchain technology to securities markets (e.g.,
Malinova and Park, 2016; Khapko and Zoican, 2016; Yermack, 2017; Huberman et al., 2017; Easley et
al., 2017). Our paper contributes to this literature by showing that one of the major uses of
cryptocurrencies as a payment system is in settings in which anonymity is valued (e.g., illegal trade).
Another related, although small, branch of literature examines the degree of anonymity in bitcoin
by quantifying the extent to which various algorithms can identify entities/users in bitcoin blockchain data
and track their activity (e.g., Meiklejohn et al., 2013; Ron and Shamir, 2013; Androulaki et al., 2013;
Tasca et al., 2016). In doing so, some of these papers also provide insights about the different types of
activities that use bitcoin. Of these papers, one of the closest to ours is Meiklejohn et al. (2013), who
explore the bitcoin blockchain up to April 2013, clustering addresses into entities/users and manually
identifying some of those entities by physically transacting with them. They are able to identify the
addresses of some miners, exchanges, gambling services, and vendors/marketplaces (including one
darknet marketplace), suggesting bitcoin entities are not completely anonymous. Tasca et al. (2016) use a
similar approach to explore the different types of activity in bitcoin, focusing only on the largest entities,
so-called “super clusters”, and within that set, only those with a known identity.
None of these papers attempt to categorize all of the activity in bitcoin, nor do they try and
quantify or characterize the population of illegal bitcoin users, which is the focus of our paper. We exploit
the lack of perfect anonymity that is documented in these studies and draw on some of the techniques
from this literature to construct an initial sample of known illegal users. We add new methods to this
literature, extending the empirical toolkit from making direct observations about individuals, to
identification of communities and estimation of populations of users.
Finally, another related branch of literature is the recent studies of darknet marketplaces and the
online drug trade, including papers from computer science and drug policy. For example, Soska and
Christin (2015), use a web-crawler to scrape information from darknet marketplaces during 2013-2015,
collecting a variety of data. Their paper provides valuable insights into these markets, including
information about the types of goods and services traded (largely drugs), the number of goods listed, a
lower bound on darknet turnover using posted feedback as a proxy (they do not have data on actual
transactions/sales), the number of vendors, and the qualitative aspects of how these marketplaces operate
(reputation, trust, feedback). The related drug policy studies often draw on other sources of information

34
such as surveys of drug users and contribute insights such as: (i) darknet marketplaces like the Silk Road
facilitate initiation into drug use or a return to drug use after cessation (Barratt et al., 2016b) and can
encourage drug use through the provision of drug samples (Ladegaard, 2017); (ii) darknet forums can
promote harm minimization by providing inexperienced users with support and knowledge from vendors
and more experienced users (Bancroft, 2017); (iii) darknet marketplaces tend to reduce systemic violence
compared with in-person drug trading because no face-to-face contact is required (Barratt et al., 2016a;
Martin, 2017; Morselli et al., 2017); (iv) about one-quarter of the drugs traded on the Silk Road occur at a
wholesale scale, suggesting that such markets might also indirectly serve drug users “on the street” by
impacting dealers (Aldridge and Décary-Hétu, 2016); and (v) there are interesting cross-country
differences in the use of the darknet marketplace “Agora” (Van Buskirk et al., 2016).
We contribute to this literature by quantifying the amount of illegal activity undertaken using
bitcoin. All of the illegal activity captured by the existing studies of one or several darknet marketplaces
is also in our measures because one of the approaches we use to construct a sample of observed illegal
activity involves measuring transactions with known darknet marketplaces. However, our estimates
include much more than this activity—we use direct measures of transactions rather than a lower-bound
measure such as feedback, consider all known darknet marketplaces (rather than one or a few), include
two other methods of obtaining a sample of illegal activity, and most importantly, we estimate models
that extrapolate from the sample of observed illegal activity to the estimated population. This yields
vastly different and more comprehensive estimates. Empirically, we confirm that studies of darknet
marketplaces only scratch the surface of the illegal activity involving bitcoin—the estimated population
of illegal activity is several times larger than what can be “observed” through studying known darknet
marketplaces. Furthermore, the studies of darknet marketplaces do not analyze how the characteristics of
illegal and legal bitcoin users differ, or how recent developments such as increased mainstream interest in
bitcoin and the emergence of new, more opaque cryptocurrencies impacts the use of bitcoin in illegal
activity. These are further contributions of our paper.
7. Conclusion
As an emerging FinTech innovation, cryptocurrencies and the blockchain technology on which
they are based could revolutionize many aspects of the financial system, ranging from smart contracts to
settlement, interbank transfers to venture capital funds, as well as applications beyond the financial
system. Like many innovations, cryptocurrencies also have their dark side. We shed light on that dark
side by quantifying and characterizing their use in illegal activity.
We find that illegal activity accounts for a sizable proportion of the users and trading activity in
bitcoin, as well as an economically meaningful amount in dollar terms. For example, approximately one-

35
quarter of all users and close to one-half of transactions are associated with illegal activity, equating to
around 24 million market participants with illegal turnover of around $72 billion per year in recent times.
Illegal users of bitcoin tend to transact more, in smaller sized transactions, often repeatedly
transacting with a given counterparty, and they tend hold less bitcoin. These features are consistent with
their use of bitcoin as a payment system rather than for investment or speculation. Illegal users also make
greater use of transaction techniques that obscure their activity, and their activity spikes following shocks
to darknet marketplaces. The proportion of bitcoin activity associated with illegal trade declines with
increasing mainstream interest and hype (Google search intensity), with the emergence of more opaque
alternative cryptocurrencies, and with fewer darknet marketplaces in operation.
Our results have a number of implications. First, by shedding light on the dark side of
cryptocurrencies, we hope this research will reduce some of the regulatory uncertainty about the negative
consequences and risks of this innovation, thereby allowing more informed policy decisions that weigh up
the benefits and costs. In turn, we hope this contributes to these technologies reaching their potential.
Second, the techniques developed in this paper can be used in cryptocurrency surveillance in a
number of ways. The methods can be applied going forward as new blocks are added to the blockchain,
allowing authorities to keep their finger on the pulse of illegal activity and monitor its trends, its
responses to regulatory interventions, and how its characteristics change through time. Such information
could help make more effective use of scarce regulatory and enforcement resources. The methods can
also be used to identify individuals of strategic importance in illegal networks.
Third, our paper suggests that a significant component of the intrinsic value of bitcoin as a
payment system derives from its use in facilitating illegal trade. This has ethical implications for those
that view bitcoin as an investment, as well as valuation implications. For example, changes in the demand
to use bitcoin in illegal trade (e.g., due to law enforcement crackdowns or increased adoption of more
opaque cryptocurrencies in illegal trade) are likely to impact its fundamental value.
Finally, our paper moves the literature closer to answering the important question of the welfare
consequences of the growth in illegal online trade. A crucial piece of this puzzle is understanding the
extent to which the online illegal trade simply reflects migration of activity that would have otherwise
occurred on the street, versus the alternative that by making illegal goods more accessible, convenient to
buy, and less risky due to anonymity, the move online could lead to growth in the aggregate black market.
Our estimates of the amount of illegal trade facilitated with bitcoin through time contribute to
understanding this issue, but further research is required to relate these estimates to trends in the offline
black market.

36
Appendix A: Bitcoin seizures and darknet sites
Table A1: Bitcoin seizures
This table reports major bitcoin seizures, the seizing authority, the owner of the seized bitcoin, the date of the
seizure, and the amount (in bitcoin) seized.
Seizing authority Seized entity Owner of seized bitcoins Date of seizure Bitcoin seized
Australian Government Individual Richard Pollard December 1, 2012 24,518
US government Individual Matthew Luke Gillum July 23, 2013 1,294
ICE and HSI Individual Cornelius Jan Slomp August 27, 2013 385,000
FBI Individual Ross William Ulbircht October 1, 2013 144,000
FBI Site Silk Road escrow
accounts (many users)
October 2, 2013 29,655
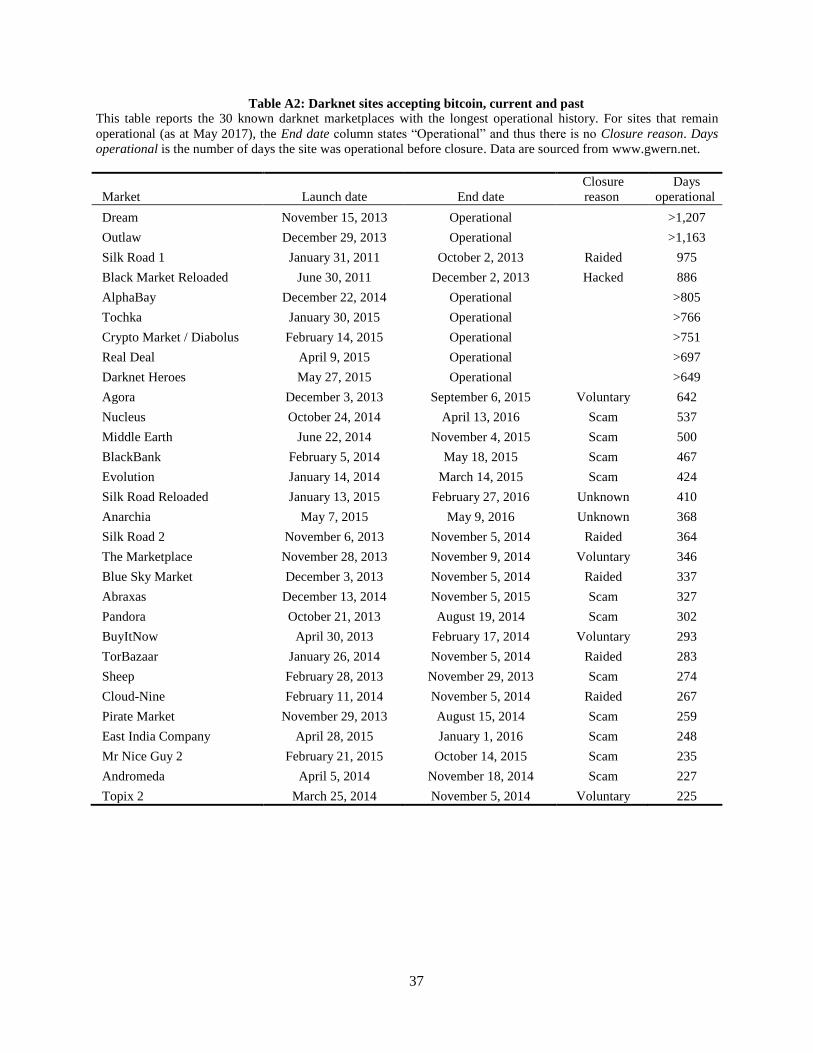
37
Table A2: Darknet sites accepting bitcoin, current and past
This table reports the 30 known darknet marketplaces with the longest operational history. For sites that remain
operational (as at May 2017), the End date column states “Operational” and thus there is no Closure reason. Days
operational is the number of days the site was operational before closure. Data are sourced from www.gwern.net.
Market Launch date End date
Closure
reason
Days
operational
Dream November 15, 2013 Operational
>1,207
Outlaw December 29, 2013 Operational
>1,163
Silk Road 1 January 31, 2011 October 2, 2013 Raided 975
Black Market Reloaded June 30, 2011 December 2, 2013 Hacked 886
AlphaBay December 22, 2014 Operational >805
Tochka January 30, 2015 Operational >766
Crypto Market / Diabolus February 14, 2015 Operational >751
Real Deal April 9, 2015 Operational >697
Darknet Heroes May 27, 2015 Operational >649
Agora December 3, 2013 September 6, 2015 Voluntary 642
Nucleus October 24, 2014 April 13, 2016 Scam 537
Middle Earth June 22, 2014 November 4, 2015 Scam 500
BlackBank February 5, 2014 May 18, 2015 Scam 467
Evolution January 14, 2014 March 14, 2015 Scam 424
Silk Road Reloaded January 13, 2015 February 27, 2016 Unknown 410
Anarchia May 7, 2015 May 9, 2016 Unknown 368
Silk Road 2 November 6, 2013 November 5, 2014 Raided 364
The Marketplace November 28, 2013 November 9, 2014 Voluntary 346
Blue Sky Market December 3, 2013 November 5, 2014 Raided 337
Abraxas December 13, 2014 November 5, 2015 Scam 327
Pandora October 21, 2013 August 19, 2014 Scam 302
BuyItNow April 30, 2013 February 17, 2014 Voluntary 293
TorBazaar January 26, 2014 November 5, 2014 Raided 283
Sheep February 28, 2013 November 29, 2013 Scam 274
Cloud-Nine February 11, 2014 November 5, 2014 Raided 267
Pirate Market November 29, 2013 August 15, 2014 Scam 259
East India Company April 28, 2015 January 1, 2016 Scam 248
Mr Nice Guy 2 February 21, 2015 October 14, 2015 Scam 235
Andromeda April 5, 2014 November 18, 2014 Scam 227
Topix 2 March 25, 2014 November 5, 2014 Voluntary 225

38
Appendix B: Derivations for the DCE model
We define 𝐼( . ) and 𝐷(. ) to be monotonic link functions that map 𝑥1𝑖𝛽1 and 𝑥2𝑖𝛽2 to latent
probabilities of a bitcoin user being involved predominantly in illegal activity, and detection of an illegal
user, respectively.35
That is,
𝐼(𝑥1𝑖𝛽1) = Pr (𝐿1𝑖 = 1) (B.1)
𝐷(𝑥2𝑖𝛽2) = Pr(𝐿2𝑖 = 1 | 𝐿1𝑖 = 1) (B.2)
Table B1 reports the probabilities of various joint outcomes (represented by cells in the table). The
joint outcomes are mutually exclusive and exhaustive, so the probabilities in Table B1 sum to one.
Table B1: Two-stage DCE model probability matrix
Illegal user Legal user
Detected 𝐼(𝑥1𝑖𝛽1)𝐷(𝑥2𝑖𝛽2) 0
Not detected 𝐼(𝑥1𝑖𝛽1)[1 − 𝐷(𝑥2𝑖𝛽2)] 1 − 𝐼(𝑥1𝑖𝛽1)
The log likelihood of the users that end up in the detected (seized) illegal users category (𝐴) is the log of
the sum (over users in 𝐴) of the probabilities of that joint outcome:
𝑙𝑜𝑔 𝐿𝐴 = ∑ log [𝐼(𝑥1𝑖𝛽1)𝐷(𝑥2𝑖𝛽2)]𝑖𝜖𝐴 (B.3)
Similarly, the log likelihood of the users that end up in the other category (𝐴𝐶) is the log of the sum (over
users in 𝐴𝐶) of the probabilities of that joint outcome (the probability that the user is a legal one plus the
probability that an illegal user is not detected):
𝑙𝑜𝑔 𝐿𝐴𝐶 = ∑ log [𝐼(𝑥1𝑖𝛽1)[1 − 𝐷(𝑥2𝑖𝛽2)] + 1 − 𝐼(𝑥1𝑖𝛽1)𝑖𝜖𝐴𝐶 ] (B.4)
𝑙𝑜𝑔 𝐿𝐴𝐶 = ∑ log [1 − 𝐼(𝑥1𝑖𝛽1)𝐷(𝑥2𝑖𝛽2)𝑖𝜖𝐴𝐶 ] (B.5)
Sets 𝐴 and 𝐴𝐶 constitute the universe of all bitcoin users. Therefore the full-sample log likelihood is:
𝑙𝑜𝑔 𝐿 = ∑ log [𝐼(𝑥1𝑖𝛽1)𝐷(𝑥2𝑖𝛽2)]𝑖𝜖𝐴 + ∑ log [1 − 𝐼(𝑥1𝑖𝛽1)𝐷(𝑥2𝑖𝛽2)]𝑖𝜖𝐴𝑐 (B.6)
Maximum likelihood estimation involves selecting parameter vectors 𝛽1 and 𝛽2 such that the function
𝑙𝑜𝑔 𝐿 is maximized.
35
In our implementation, the link functions are cumulative logistic distribution functions, that is, 𝐼(𝑥1𝑖𝛽1) =1
1+𝑒−𝑥1𝑖𝛽1, 𝐷(𝑥2𝑖𝛽2) =
1
1+𝑒−𝑥2𝑖𝛽2.

39
References
Aldridge, J., and D. Décary-Hétu, 2014, ‘Not an ebay for drugs’: The cryptomarket ‘Silk Road’ as a
paradigm shifting criminal innovation, Unpublished manuscript.
Aldridge, J., and D. Décary-Hétu, 2016, Hidden wholesale: The drug diffusing capacity of online drug
cryptomarkets, International Journal of Drug Policy 35, 7–15.
Androulaki, E., G. Karame, M. Roeschlin, T. Scherer, and S. Capkun, 2013, Evaluating user privacy in
bitcoin, In Proceedings of Financial Cryptography 2013.
Bancroft, A., 2017, Responsible use to responsible harm: Illicit drug use and peer harm reduction in a
darknet cryptomarket, Health, Risk and Society 19, 336–350.
Barratt, M.J., J.A. Ferris, and A.R. Winstock, 2016a, Safer scoring? Cryptomarkets, social supply and
drug market violence, International Journal of Drug Policy 35, 24–31.
Barratt, M.J., S. Lenton, A. Maddox, and M. Allen, 2016b, ‘What if you live on top of a bakery and you
like cakes?’—Drug use and harm trajectories before, during and after the emergence of Silk Road,
International Journal of Drug Policy 35, 50–57.
Basu, G., 2014, The strategic attributes of transnational smuggling: Logistics flexibility and operational
stealth in the facilitation of illicit trade, Journal of Transportation Security 7, 99–113.
Ben-Sasson, E., A. Chiesa, C. Garman, M. Green, I. Miers, E. Tromer, and M. Virza, 2014, Zerocash:
Decentralized anonymous payments from bitcoin, In 2014 IEEE Symposium on Security and
Privacy.
Christin, N., 2013, Traveling the silk road: A measurement analysis of a large anonymous online
marketplace, In Proceedings of the 22nd International Conference on World Wide Web.
Comerton-Forde, C., and T.J. Putniņš, 2014, Stock price manipulation: Prevalence and determinants,
Review of Finance 18, 23–66.
Cormen, T.H., C.E. Leiserson, R.L. Rivest, and C. Stein, 2001, Introduction to Algorithms, Cambridge:
MIT Press.
Cox, J., 2016, Staying in the shadows: The use of bitcoin and encryption in cryptomarkets, In The
Internet and Drug Markets, Edited by EMCDDA, 41–47, Lisbon: EMCDDA.
Emmons, S., S. Kobourov, M. Gallant, and K. Börner, 2016, Analysis of network clustering algorithms
and cluster quality metrics at scale, PLOS ONE 11, 1–18.
Feinstein, J.S., 1989, The safety regulation of US nuclear power plants: Violations, inspections, and
abnormal occurrences, Journal of Political Economy 97, 115–154.
Feinstein, J.S., 1990, Detection controlled estimation, Journal of Law and Economics 33, 233–276.
Feinstein, J.S., 1991, An econometric analysis of income tax evasion and its detection, RAND Journal of
Economics 22, 14–35.

40
Franklin, J., A. Perrig, V. Paxson, and S. Savage, 2007, An inquiry into the nature and causes of the
wealth of internet miscreants, In Proceedings of the 14th ACM Conference on Computer and
Communications Security.
Huberman, G., J.D. Leshno, and C. Moallemi, 2017, Monopoly without a monopolist: An economic
analysis of the bitcoin payment system, Unpublished manuscript.
Easley, D., M. O’Hara, and S. Basu, 2017, From mining to markets, Unpublished manuscript.
Khapko, M., and M.A. Zoican, 2016, “Smart” settlement, Unpublished manuscript.
Koshy, P., D. Koshy, and P. McDaniel, 2014, An analysis of anonymity in bitcoin using p2p network
traffic, In 18th International Conference on Financial Cryptography and Data Security.
Kruithof, K., J. Aldridge, D. Décary-Hétu, M. Sim, E. Dujso, and S. Hoorens, 2016, Internet-facilitated
drugs trade, Unpublished manuscript.
Ladegaard, I., 2017, Instantly hooked? Freebies and samples of opioids, cannabis, MDMA, and other
drugs in an illicit e-commerce market, Journal of Drug Issues (forthcoming).
Lavorgna, A., 2016, How the use of the internet is affecting drug trafficking practices, In Internet and
Drug Markets, EMCDDA Insights.
Lewman, A., 2016, Tor and links with cryptomarkets, In Internet and Drug Markets, EMCDDA Insights.
Malinova, K., and A. Park, 2016, Market design for trading with blockchain technology, Unpublished
manuscript.
Martin, J., 2014a, Drugs on the Dark Net: How Cryptomarkets are Transforming the Global Trade in
Illicit Drugs, Berlin: Springer.
Martin, J., 2014b, Lost on the silk road: Online drug distribution and the “cryptomarket”, Criminology
and Criminal Justice 14, 351–367.
Martin, J., 2017, Cryptomarkets, systemic violence and the “gentrification hypothesis”, Addiction
(forthcoming).
Matthews, A., R. Sutherland, A. Peacock, J. Van Buskirk, E. Whittaker, L. Burns, and R. Bruno, 2017, I
like the old stuff better than the new stuff? Subjective experiences of new psychoactive
substances, International Journal of Drug Policy 40, 44–49.
Meiklejohn, S., M. Pomarole, G. Jordan, K. Levchenko, D. McCoy, G.M. Voelker, and S. Savage, 2013,
A fistful of bitcoins: Characterizing payments among men with no names, In 13th ACM Internet
Measurement Conference.
Morselli, C., D. Décary-Hétu, M. Paquet-Clouston, and J. Aldridge, 2017, Conflict management in illicit
drug cryptomarkets, International Criminal Justice Review 27, 237–254.
Nakamoto, S., 2008, Bitcoin: A peer-to-peer electronic cash system, Unpublished manuscript.

41
Noether, S., 2015, Ring signature confidential transactions for monero, In IACR Cryptology ePrint
Archive, 1098.
Rogoff, K., 2016, The Curse of Cash, (Princeton, NJ: Princeton University Press).
Ron, D., and A. Shamir, 2013, Quantitative analysis of the full bitcoin transaction graph, In 17th Financial
Cryptography and Data Security International Conference.
Soska, K., and N. Christin, 2015, Measuring the longitudinal evolution of the online anonymous
marketplace ecosystem, In Proceedings of the 24th USENIX Conference on Security Symposium.
Tasca, P., S. Liu, and A. Hayes, 2016, The evolution of the bitcoin economy: Extracting and analyzing
the network of payment relationships, Unpublished manuscript.
Tzanetakis, M., G. Kamphausen, B. Werse, and R. Von Laufenberg, 2016, The transparency paradox.
Building trust, resolving disputes and optimising logistics on conventional and online drugs
markets, International Journal of Drug Policy 35, 58–68.
Van Buskirk, J., A. Roxburgh, M. Farrell, and L. Burns, 2014, The closure of the silk road: What has this
meant for online drug trading?, Addiction 109, 517–518.
Van Buskirk, J., S. Naicker, A. Roxburgh, R. Bruno, and L. Burns, 2016, Who sells what? Country
specific differences in substance availability on the agora cryptomarket, International Journal of
Drug Policy 35, 16–23.
Van Hout, M.C., and T. Bingham, 2013, ‘Surfing the silk road’: A study of users’
experiences, International Journal of Drug Policy 24, 524–529.
Van Slobbe, J., 2016, The drug trade on the deep web: A law enforcement perspective, In Internet and
Drug Markets, EMCDDA Insights.
Waltman, L., and N. Jan Van Eck, 2013, A smart local moving algorithm for large-scale modularity-
based community detection, The European Physical Journal B 86, 1–14.
Wang, T.Y., A. Winton, and X. Yu, 2010, Corporate fraud and business conditions: Evidence from IPOs,
Journal of Finance 65, 2255–2292.
Yermack, D., 2017, Corporate governance and blockchains, Review of Finance 21, 7–31.

42
Table 1: Variable definitions
This table defines the variables that we compute for each bitcoin user. The third column, DCE equation, specifies
whether the variable is used in the first equation of the DCE model (the equation modelling whether the user is
involved in illegal activity, I), the second equation of the DCE model (the equation modelling whether a user that is
involved in illegal activity is “detected”, e.g., seized by law enforcement agencies, D), both equations (I & D), or as
an additional control variable in some specifications (C).
Variable Definition DCE
equation
Transaction Count The total number of bitcoin transactions involving the given user (where the
user is a sender and/or recipient of bitcoin).
C
Transaction Size Average USD value of the transactions involving the given user. The
transaction size is converted from bitcoin to USD using end of day USD/BTC
conversion rates. Exchange rates prior to July 18, 2010 are not available and
are set to 0.09USD, being the exchange rate on that day.
I & D
Transaction
Frequency
The number of bitcoin transactions made by the user per month. This is
computed as Transaction Count divided by Existence Time.
I & D
Counterparties The total number of other users with which the given user has transacted.
C
Holding Value The average USD value of the user’s bitcoin holdings. The average is
computed from the holding balances recorded at the end of each of the user’s
bitcoin transactions. Holding values are converted from bitcoin to USD using
end of day USD/BTC conversion rates. Exchange rates prior to July 18, 2010
are not available and are set to 0.09USD, being the exchange rate on that day.
C
Concentration Concentration is a measure of the tendency for a user to transact with one or
many counterparties. It ranges from 1 for a highly concentrated user who
transacts with only one counterparty, to 0 for a user that has many transactions,
each with a different counterparty. Formally, it is computed using an
adaptation of a normalized Herfindahl–Hirschman Index:
𝐶𝑜𝑛𝑐𝑒𝑛𝑡𝑟𝑎𝑡𝑖𝑜𝑛 =
{
1 − [
[(𝐶𝑇) − (
1𝑇)]
1 − (1𝑇)
] if 𝑇 > 1
1 if 𝑇 = 1
where 𝑇 is Transaction Count and 𝐶 is Counterparties (the total number of
other users with which the given user has transacted).
I & D
Existence Time
Number of months the bitcoin user is active in the bitcoin network. Measured
as the number of months the user’s first transaction until the user’s last
observed transaction, if that transaction results in the user having a bitcoin
balance of zero. If the user’s last transaction results in a bitcoin balance above
zero, the user is regarded as active until the end of our sample in May 2017.
I & D
Darknet Sites A transaction-weighted average of the number of operational illegal darknet
marketplaces at the time a user transacts (the sum of number of operational
darknet marketplaces at every transaction, divided by Transaction Count). The
logic is that if a user transacts at a time when there is a lot of illegal darknet
marketplace activity, they are more likely to be involved in illegal activity than
if they are active when there is little or no illegal darknet activity.
I
Tumbling Tumbling refers to techniques or services used to obscure a user’s holdings or I

43
transaction history. Wash transactions (transactions where a user is both the
sender and receiver of bitcoin in a transaction) are also sometimes used for
such purpose. We compute Tumbling for each user by calculating the
percentage of tumbling and wash transactions in their total number of
transactions. We classify transactions involved in tumbling using three
approaches, as follows. Approach 1: transactions with known tumbling service
providers (such as Coin Fog). Approach 2: transactions where a user sends
bitcoin to another user (potential tumbler) and that user sends the bitcoin back
(less a tumbling fee of between 0 to 10 % (tumbler characteristic 1) within 10
blocks (tumbler characteristics 2). Approach 3: transactions with users that
display the characteristics of tumbling service providers (a Transaction Count
of 10 or above and displays the two tumbling characteristics above in at least
8% of transitions). The logic is that illegal users are likely to have greater
incentives to obscure their activity than legal users.
Shadow Coins The transaction-weighted average of the number of opaque cryptocurrencies in
existence (Dash, Monero, and ZCash) at the time the user participates in
bitcoin. For each user, we calculate the number of major alternative “shadow
coins” available (Dash, Monero, and ZCash, which provide more privacy than
bitcoin) at the time of each user’s transactions. We then compute the average
across all of the user’s transactions. The logic is that if illegal users make use
of shadow coins, the likelihood of illegal activity in bitcoin will be lower when
more shadow coins are in existence.
I
Darknet Shock
Volume
The percentage of the user’s transaction value that occurs immediately after
shocks to darknet marketplaces, including one week after each seizure or “exit
scam” of a darknet marketplace. Seizures by law enforcement officials and
“exit scams” in which darknet sites close without warning are likely to result in
increased activity from illegal users as they turn to alternative marketplaces or
relocate their holdings. At the same time, shocks to darknet marketplaces are
unlikely to materially affect the activity of legal users.
I
Bitcoin Hype The transaction-weighted average of the Google Trends value for “bitcoin”
(calculated from Jan 1, 2009 to May 1, 2017). For each user, we record the
intensity of Google searches for the term “bitcoin” (scaled from 0-100) in the
months of their transactions and then compute the average for each user across
all of their transactions. The logic is that the more intensive is the search
activity for bitcoin on Google, the more likely the user is transacting for
speculative (as opposed to illegal) purposes.
I
Pre-Silk-Road User Dummy variable that is equal to one if the user commenced transacting in
bitcoin prior to the seizure of Silk Road 1 on October 1, 2013. The logic is that
an illegal user that was using bitcoin prior to the first major darknet seizure by
law enforcement authorities has a higher probability of having been detected
than a user that started transacting in bitcoin after that seizure because such a
user could not have been “detected” in the first seizure.
D
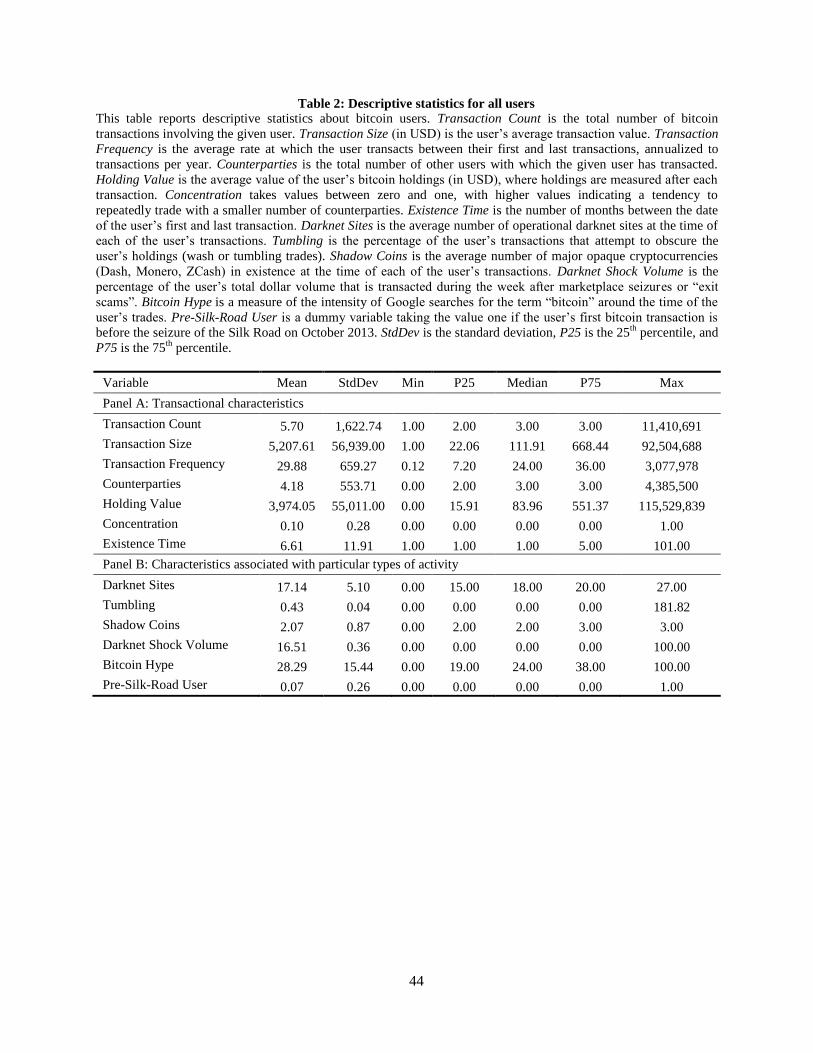
44
Table 2: Descriptive statistics for all users
This table reports descriptive statistics about bitcoin users. Transaction Count is the total number of bitcoin
transactions involving the given user. Transaction Size (in USD) is the user’s average transaction value. Transaction
Frequency is the average rate at which the user transacts between their first and last transactions, annualized to
transactions per year. Counterparties is the total number of other users with which the given user has transacted.
Holding Value is the average value of the user’s bitcoin holdings (in USD), where holdings are measured after each
transaction. Concentration takes values between zero and one, with higher values indicating a tendency to
repeatedly trade with a smaller number of counterparties. Existence Time is the number of months between the date
of the user’s first and last transaction. Darknet Sites is the average number of operational darknet sites at the time of
each of the user’s transactions. Tumbling is the percentage of the user’s transactions that attempt to obscure the
user’s holdings (wash or tumbling trades). Shadow Coins is the average number of major opaque cryptocurrencies
(Dash, Monero, ZCash) in existence at the time of each of the user’s transactions. Darknet Shock Volume is the
percentage of the user’s total dollar volume that is transacted during the week after marketplace seizures or “exit
scams”. Bitcoin Hype is a measure of the intensity of Google searches for the term “bitcoin” around the time of the
user’s trades. Pre-Silk-Road User is a dummy variable taking the value one if the user’s first bitcoin transaction is
before the seizure of the Silk Road on October 2013. StdDev is the standard deviation, P25 is the 25th
percentile, and
P75 is the 75th
percentile.
Variable Mean StdDev Min P25 Median P75 Max
Panel A: Transactional characteristics
Transaction Count 5.70 1,622.74 1.00 2.00 3.00 3.00 11,410,691
Transaction Size 5,207.61 56,939.00 1.00 22.06 111.91 668.44 92,504,688
Transaction Frequency 29.88 659.27 0.12 7.20 24.00 36.00 3,077,978
Counterparties 4.18 553.71 0.00 2.00 3.00 3.00 4,385,500
Holding Value 3,974.05 55,011.00 0.00 15.91 83.96 551.37 115,529,839
Concentration 0.10 0.28 0.00 0.00 0.00 0.00 1.00
Existence Time 6.61 11.91 1.00 1.00 1.00 5.00 101.00
Panel B: Characteristics associated with particular types of activity
Darknet Sites 17.14 5.10 0.00 15.00 18.00 20.00 27.00
Tumbling 0.43 0.04 0.00 0.00 0.00 0.00 181.82
Shadow Coins 2.07 0.87 0.00 2.00 2.00 3.00 3.00
Darknet Shock Volume 16.51 0.36 0.00 0.00 0.00 0.00 100.00
Bitcoin Hype 28.29 15.44 0.00 19.00 24.00 38.00 100.00
Pre-Silk-Road User 0.07 0.26 0.00 0.00 0.00 0.00 1.00

45
Table 3: Size and activity of observed user groups
This table reports the size and activity of (1) all users, (2) observed illegal users, and (3) other users. The observed
illegal user group includes three subgroups: users that had bitcoin seized by law enforcement agencies (“Seized
Users”), illegal darknet marketplace escrow accounts (hot wallets) and users that have interacted (sent or received
bitcoin) with those accounts (“Black Market Users”), and users whose bitcoin address(es) are mentioned in darknet
forums (“Forum Users”). The measures of group size and activity are: the number of users (Users), the number of
transactions (Transaction Count), the dollar value monthly average of bitcoin holdings (Holding Value), the number
of bitcoin addresses (Number Of Addresses), and the dollar volume of transactions (Volume). The percentage of the
total users/activity is reported in parentheses below each value.
Group / Subgroup Users Transaction
Count (Mil)
Holding
Value ($Mil)
Number Of
Addresses (Mil)
Volume
($Bil)
1. All Users 106,244,432 605.69 2,964.66 221.71 1,862.51
(100.00%) (100.00%) (100.00%) (100.00%) (100.00%)
2. Observed Illegal Users 6,223,337 196.11 1,342.43 58.38 241.46
(5.86%) (32.38%) (45.28%) (26.33%) (12.96%)
2A. Seized Users 1,016 23.83 9.39 8.30 17.51
(0.00%) (3.93%) (0.32%) (3.74%) (0.94%)
2B. Black Market Users
(not in 2A) 6,221,873 157.30 1,324.32 49.71 220.91
(5.86%) (25.97%) (44.67%) (22.42%) (11.86%)
2C. Forum Users
(not in 2A or 2B) 448 14.98 8.72 0.38 3.03
(0.00%) (2.47%) (0.29%) (0.17%) (0.16%)
3. Other Users 100,021,095 409.58 1,622.23 163.33 1,621.05
(94.14%) (67.62%) (54.72%) (73.67%) (87.04%)
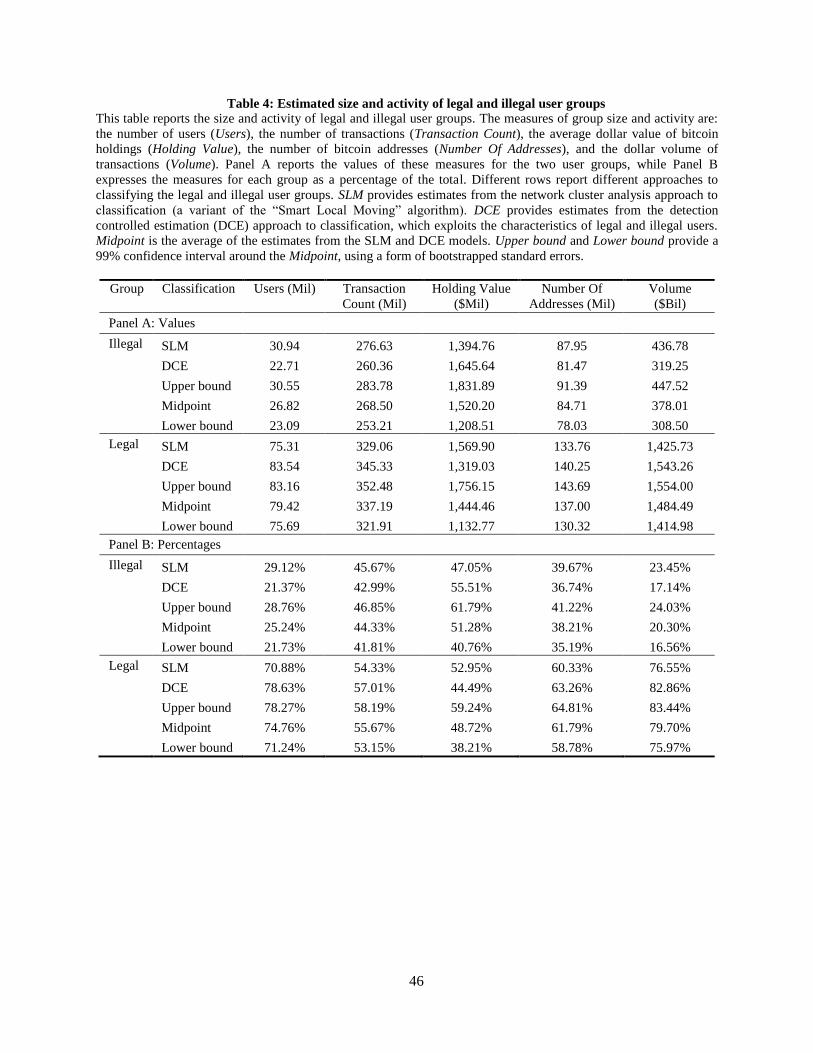
46
Table 4: Estimated size and activity of legal and illegal user groups
This table reports the size and activity of legal and illegal user groups. The measures of group size and activity are:
the number of users (Users), the number of transactions (Transaction Count), the average dollar value of bitcoin
holdings (Holding Value), the number of bitcoin addresses (Number Of Addresses), and the dollar volume of
transactions (Volume). Panel A reports the values of these measures for the two user groups, while Panel B
expresses the measures for each group as a percentage of the total. Different rows report different approaches to
classifying the legal and illegal user groups. SLM provides estimates from the network cluster analysis approach to
classification (a variant of the “Smart Local Moving” algorithm). DCE provides estimates from the detection
controlled estimation (DCE) approach to classification, which exploits the characteristics of legal and illegal users.
Midpoint is the average of the estimates from the SLM and DCE models. Upper bound and Lower bound provide a
99% confidence interval around the Midpoint, using a form of bootstrapped standard errors.
Group Classification Users (Mil) Transaction
Count (Mil)
Holding Value
($Mil)
Number Of
Addresses (Mil)
Volume
($Bil)
Panel A: Values
Illegal SLM 30.94 276.63 1,394.76 87.95 436.78
DCE 22.71 260.36 1,645.64 81.47 319.25
Upper bound 30.55 283.78 1,831.89 91.39 447.52
Midpoint 26.82 268.50 1,520.20 84.71 378.01
Lower bound 23.09 253.21 1,208.51 78.03 308.50
Legal SLM 75.31 329.06 1,569.90 133.76 1,425.73
DCE 83.54 345.33 1,319.03 140.25 1,543.26
Upper bound 83.16 352.48 1,756.15 143.69 1,554.00
Midpoint 79.42 337.19 1,444.46 137.00 1,484.49
Lower bound 75.69 321.91 1,132.77 130.32 1,414.98
Panel B: Percentages
Illegal SLM 29.12% 45.67% 47.05% 39.67% 23.45%
DCE 21.37% 42.99% 55.51% 36.74% 17.14%
Upper bound 28.76% 46.85% 61.79% 41.22% 24.03%
Midpoint 25.24% 44.33% 51.28% 38.21% 20.30%
Lower bound 21.73% 41.81% 40.76% 35.19% 16.56%
Legal SLM 70.88% 54.33% 52.95% 60.33% 76.55%
DCE 78.63% 57.01% 44.49% 63.26% 82.86%
Upper bound 78.27% 58.19% 59.24% 64.81% 83.44%
Midpoint 74.76% 55.67% 48.72% 61.79% 79.70%
Lower bound 71.24% 53.15% 38.21% 58.78% 75.97%

47
Table 5: Differences in characteristics between illegal and legal users
This table reports differences in mean characteristics for illegal vs legal bitcoin users. The first three columns (“Observed”) compare observed illegal users (those
identified through law enforcement seizures, darknet marketplaces, and darknet forums) vs other users (including both legal and undetected illegal users). The
second three columns (“SLM”) compare illegal vs legal users, as classified by a network cluster analysis algorithm (SLM). The final three columns (“DCE”)
compare illegal vs legal users, as classified by a detection controlled estimation model (DCE). The characteristics are as follows. Transaction Count is the total
number of bitcoin transactions involving the given user. Transaction Size (in USD) is the user’s average transaction value. Transaction Frequency is the average
rate at which the user transacts between their first and last transactions, annualized to transactions per year. Counterparties is the total number of other users with
which the given user has transacted. Holding Value is the average value of the user’s bitcoin holdings (in USD), where holdings are measured after each
transaction. Concentration takes values between zero and one, with higher values indicating a tendency to repeatedly trade with a smaller number of
counterparties. Existence Time is the number of months between the date of the user’s first and last transaction. Darknet Sites is the average number of
operational darknet sites at the time of each of the user’s transactions. Tumbling is the percentage of the user’s transactions that attempt to obscure the user’s
holdings (wash or tumbling trades). Shadow Coins is the average number of major opaque cryptocurrencies (Dash, Monero, ZCash) in existence at the time of
each of the user’s transactions. Darknet Shock Volume is the percentage of the user’s total dollar volume that is transacted during the week after marketplace
seizures or “exit scams”. Bitcoin Hype is a measure of the intensity of Google searches for the term “bitcoin” around the time of the user’s trades. Pre-Silk-Road
User is a dummy variable taking the value one if the user’s first bitcoin transaction is before the seizure of the Silk Road on October 2013. The significance of
the difference in means is computed with t-tests. ***, **, and * indicate statistical significance at 1%, 5%, and 10% levels respectively.
Variable Observed SLM DCE
Other
(1)
Illegal
(2)
Difference
(2-1)
Legal
(1)
Illegal
(2)
Difference
(2-1)
Legal
(1)
Illegal
(2)
Difference
(2-1)
Transaction Count 4.09 31.51 27.42*** 4.37 8.94 4.57*** 4.13 11.47 7.33***
Transaction Size 5,346.87 2,969.38 -2377.49*** 6,225.51 2,729.66 -3495.85*** 5,955.68 2,455.41 -3500.28***
Transaction Frequency 28.91 45.46 16.54*** 29.77 30.16 0.39** 31.44 24.15 -7.30***
Counterparties 3.53 14.61 11.08*** 3.77 5.18 1.42*** 3.71 5.91 2.20***
Holding Value 4,021.77 3,207.06 -814.71*** 4,625.45 2,388.31 -2237.14*** 4,487.67 2,084.42 -2403.25***
Concentration 0.09 0.20 0.11*** 0.08 0.13 0.05*** 0.06 0.23 0.17***
Existence Time 6.19 13.44 7.26*** 5.91 8.31 2.40*** 4.06 15.99 11.93***
Darknet Sites 17.17 16.67 -0.50*** 17.13 17.17 0.04*** 16.53 19.37 2.84***
Tumbling 0.38 1.15 0.77*** 0.36 0.60 0.24*** 0.24 1.11 0.87***
Shadow Coins 2.11 1.43 -0.69*** 2.17 1.84 -0.33*** 2.25 1.42 -0.83***
Darknet Shock Volume 15.84 27.25 11.40*** 14.51 21.39 6.88*** 10.34 39.21 28.87***
Bitcoin Hype 28.74 1.43 -27.31*** 29.67 1.84 -27.82*** 30.33 1.42 -28.9***
Pre-Silk-Road User 0.06 0.22 0.16*** 0.06 0.12 0.07*** 0.05 0.16 0.11***

48
Table 6: DCE model estimates This table reports the coefficient estimates and marginal effects of two detection controlled estimation (DCE)
models. Both models use the two-equation structure given by equations (1-4) of the paper. Model 1 is the baseline
model used for the main results in the paper. Model 2 includes additional control variables. I() is the probability that
a given user is predominantly using bitcoin for illegal activity. D() is the conditional probability of detection.
Variables are defined in Table 1. Numbers not in brackets are the coefficient estimates. Numbers in brackets are the
marginal effects (partial derivatives of the corresponding probability with respect to each of the variables, reported
as a fraction of the estimated corresponding probability). Pseudo 𝑅2 is McFadden’s likelihood ratio index (one
minus the ratio of the log-likelihood with all predictors and the log-likelihood with intercepts only). Significance at
the 10%, 5%, and 1% levels is indicated by *, **, and ***, respectively, using bootstrapped standard errors.
Model 1 Model 2
Variable I() D() I() D()
Intercept -1.127*** 0.409***
-1.196*** 0.564***
(-0.744) (0.194)
(-0.806) (0.258)
Darknet Sites 0.659***
0.647***
(0.435)
(0.435)
Tumbling 0.070***
0.078***
(0.046)
(0.052)
Shadow Coins -0.977***
-0.963***
(-0.645)
(-0.649)
Bitcoin Hype -0.512***
-0.505***
(-0.338)
(-0.340)
Darknet Shock Volume 0.433***
0.429***
(0.286)
(0.289)
Pre-Silk-Road User
0.862**
1.253***
(0.410)
(0.573)
Transaction Frequency 0.328*** 0.788***
0.153*** 0.964***
(0.217) (0.375)
(0.103) (0.441)
Transaction Size -0.124*** -0.121*
-1.282*** 0.274***
(-0.082) (-0.058)
(-0.863) (0.126)
Concentration 0.292*** 0.507***
0.291*** 0.482***
(0.193) (0.241)
(0.196) (0.220)
Existence Time 0.117*** 2.322***
0.024** 2.362***
(0.077) (1.104)
(0.016) (1.081)
Holding Value
1.831*** -0.909***
(1.233) (-0.416)
Transaction Count
4.967*** -1.085***
(3.346) (-0.497)
Pseudo 𝑅2 19.90%
20.06%
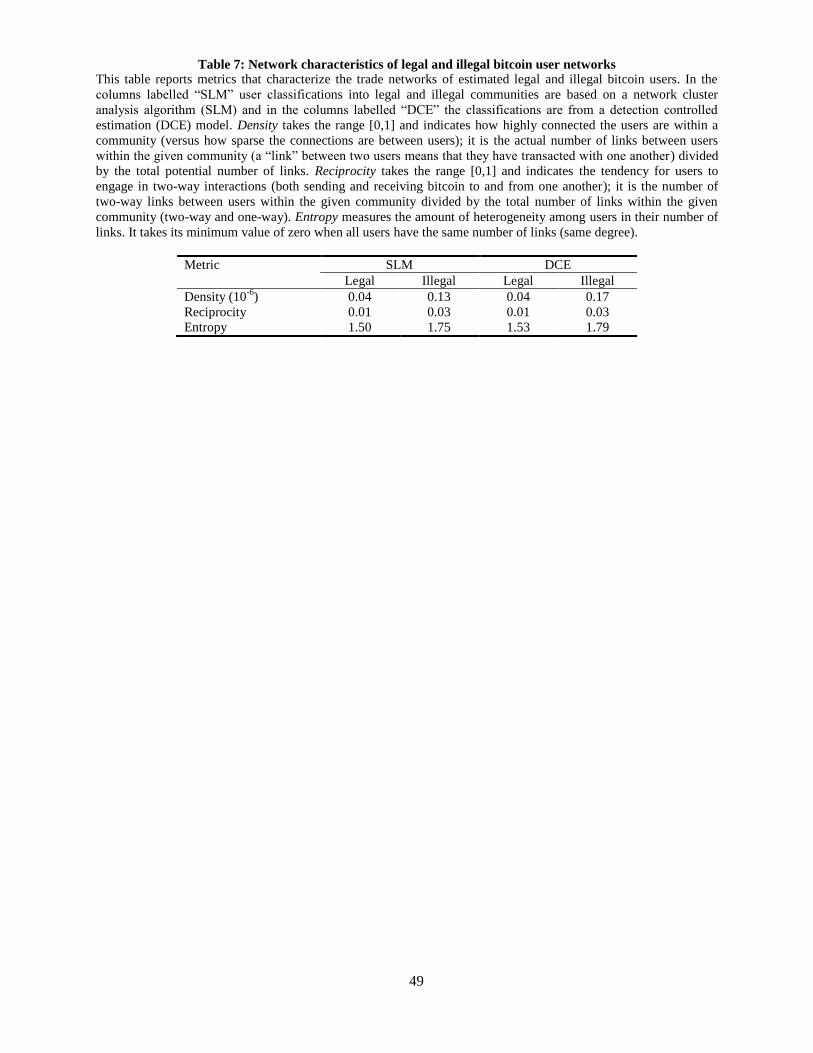
49
Table 7: Network characteristics of legal and illegal bitcoin user networks This table reports metrics that characterize the trade networks of estimated legal and illegal bitcoin users. In the
columns labelled “SLM” user classifications into legal and illegal communities are based on a network cluster
analysis algorithm (SLM) and in the columns labelled “DCE” the classifications are from a detection controlled
estimation (DCE) model. Density takes the range [0,1] and indicates how highly connected the users are within a
community (versus how sparse the connections are between users); it is the actual number of links between users
within the given community (a “link” between two users means that they have transacted with one another) divided
by the total potential number of links. Reciprocity takes the range [0,1] and indicates the tendency for users to
engage in two-way interactions (both sending and receiving bitcoin to and from one another); it is the number of
two-way links between users within the given community divided by the total number of links within the given
community (two-way and one-way). Entropy measures the amount of heterogeneity among users in their number of
links. It takes its minimum value of zero when all users have the same number of links (same degree).
Metric SLM DCE
Legal Illegal Legal Illegal
Density (10-6
) 0.04 0.13 0.04 0.17
Reciprocity 0.01 0.03 0.01 0.03
Entropy 1.50 1.75 1.53 1.79

50
Table 8: Robustness tests This table reports robustness tests for the sensitivity of the overall estimated amount of illegal activity in bitcoin to
variations in the specification of the underlying empirical models. The rows reflect estimates from different models.
SLM Baseline and DCE Baseline are the SLM and DCE models used to produce the main results, and are included
for comparison. The models labelled “Alternative” are variations on the corresponding baseline model. SLM
Alternative 1 is an SLM model that considers the transaction volume (in bitcoins) rather than the transaction count
as a measure of trading activity when applying the network cluster analysis algorithm. SLM Alternative 2 is a
variation of the baseline SLM model in which observed (known) illegal user are constrained from leaving the illegal
community. DCE Alternative 1 and 2 are variations of the baseline DCE model in which exclusion restrictions for
the instrumental variables are relaxed one at a time (these models correspond to Models 1 and 2 of Table A1 in the
internet appendix) respectively. The measures of group size and activity are: the number of users (Users), the
number of transactions (Transaction Count), the average dollar value of bitcoin holdings (Holding Value), the
number of bitcoin addresses (Number Of Addresses), and the dollar volume of transactions (Volume). Panel A
reports the values of these measures for the two user groups, while Panel B expresses the measures for each group as
a percentage of the total.
Group Model
Users (Mil) Transaction
Count (Mil)
Holding
Value
($Mil)
Number Of
Addresses
(Mil)
Volume
($Bil)
Panel A: Values
Illegal SLM Baseline 30.94 276.63 1,394.76 87.95 436.78
SLM Alternative 1 28.95 270.69 1,418.42 85.10 400.29
SLM Alternative 2 23.60 287.16 1,866.15 89.14 440.64
DCE Baseline 22.71 260.36 1,645.64 81.47 319.25
DCE Alternative 1 27.14 275.20 1,882.34 88.23 418.79
DCE Alternative 2 21.14 254.79 1,722.23 78.77 309.96
Panel B: Percentages
Illegal SLM Baseline 29.12% 45.67% 47.05% 39.67% 23.45%
SLM Alternative 1 27.25% 44.69% 47.84% 38.38% 21.49%
SLM Alternative 2 22.21% 47.41% 62.95% 40.20% 23.66%
DCE Baseline 21.37% 42.99% 55.51% 36.74% 17.14%
DCE Alternative 1 25.55% 45.44% 63.49% 39.80% 22.49%
DCE Alternative 2 19.90% 42.07% 58.09% 35.53% 16.64%

51
Panel A: Example of illegal drugs that can be purchased with bitcoin on the Silk Road marketplace
Panel B: Example of information on individual items and sellers on the Silk Road marketplace
Panel C: The escrow account and bitcoin payment interface for the Silk Road marketplace
Figure 1
Screenshots from one of the first illegal darknet marketplaces, Silk Road 1 Panel A provides an example of the “Drugs” page from Silk Road. It illustrates the wide variety of illegal goods that
can be purchased using bitcoin, including a vast array of illegal drugs, weapons, and forgeries. Panel B provides an
example of information about individual items and sellers. Clicking on the appropriate headings, one can obtain
further information about the item for sale (detailed product description, insurance/refunds, postage methods and
locations, security and encryption, etc.) and about the seller (detailed feedback and ratings from buyers, history of
sales, etc.). Panel C shows the interface for depositing bitcoin to Silk Road’s escrow account, transferring bitcoins to a
given seller, and withdrawing bitcoins from escrow. Screenshot source: www.businessinsider.com.au

52
Panel A: Percentage of users
Panel B: Percentage of transactions
Panel C: Percentage of dollar volume
Panel D: Percentage of bitcoin holdings
Figure 2
Size and activity of the sample of “observed” illegal bitcoin users
This figure illustrates the time-series of the three subgroups of observed illegal users as a percentage of total users
(Panel A), their number of transactions as a percentage of all transaction (Panel B), the dollar value of their
transactions as a percentage of the dollar value of all transactions (Panel C), and the dollar value of their bitcoin
holdings as a percentage of the dollar value of all bitcoin holdings (Panel D). The observed illegal user group
includes three subgroups: users that had bitcoin seized by law enforcement agencies (“Seized Users”), illegal
darknet marketplace escrow accounts (hot wallets) and users that have sent or received bitcoin from those accounts
(“Black Market Users”), and users whose bitcoin address(es) are mentioned in darknet forums (“Forum Users”).
“Other Users” corresponds to all bitcoin users other than those in the sample of observed illegal users. The values
are smoothed with a three-month moving average.
0%
5%
10%
15%
20%
2009 2011 2013 2015 2017
0%
20%
40%
60%
2009 2011 2013 2015 2017
0%
10%
20%
30%
40%
50%
2009 2011 2013 2015 2017
0%
20%
40%
60%
80%
2009 2011 2013 2015 2017Seized Users Black Market Users Forums Other Users

53
Figure 3
Two-stage detection controlled estimation (DCE) model
The figure illustrates the structure of the two-stage DCE model. Stage 1 models how legal and illegal users of
bitcoin differ in characteristics. Stage 2 models the determinants of the probability that an illegal user was
“detected” (had bitcoin seized by a law enforcement agency, was identified in darknet forums, or was observed in
the blockchain data as having transacted with a known illegal darknet marketplace). Both stages are estimated
simultaneously using maximum likelihood to select parameter values that maximize the likelihood of the observable
user classifications, 𝐴 and 𝐴𝐶.
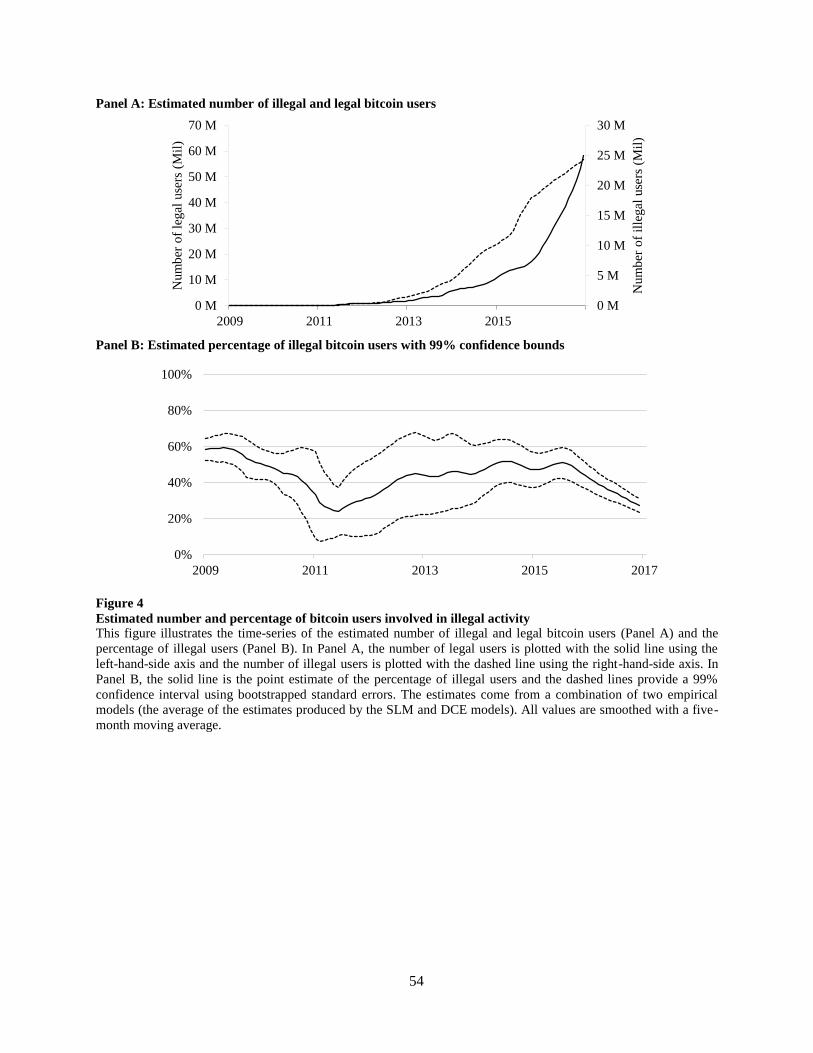
54
Panel A: Estimated number of illegal and legal bitcoin users
Panel B: Estimated percentage of illegal bitcoin users with 99% confidence bounds
Figure 4
Estimated number and percentage of bitcoin users involved in illegal activity This figure illustrates the time-series of the estimated number of illegal and legal bitcoin users (Panel A) and the
percentage of illegal users (Panel B). In Panel A, the number of legal users is plotted with the solid line using the
left-hand-side axis and the number of illegal users is plotted with the dashed line using the right-hand-side axis. In
Panel B, the solid line is the point estimate of the percentage of illegal users and the dashed lines provide a 99%
confidence interval using bootstrapped standard errors. The estimates come from a combination of two empirical
models (the average of the estimates produced by the SLM and DCE models). All values are smoothed with a five-
month moving average.
0 M
10 M
20 M
30 M
40 M
50 M
60 M
70 M
2009 2011 2013 2015
0 M
5 M
10 M
15 M
20 M
25 M
30 M
Num
ber
of
legal
use
rs (
Mil
)
Num
ber
of
ille
gal
use
rs (
Mil
)
0%
20%
40%
60%
80%
100%
2009 2011 2013 2015 2017

55
Panel A: Estimated number of illegal and legal bitcoin user transactions per month
Panel B: Estimated percentage illegal user transactions with 99% confidence bounds
Figure 5
Estimated number and percentage of illegal bitcoin users transactions
This figure illustrates the time-series of the estimated number of illegal and legal bitcoin user transactions per month
(Panel A) and the percentage of illegal user transactions (Panel B). In Panel A, the number of legal user transactions
is plotted with the solid line using the left-hand-side axis and the number of illegal user transactions is plotted with
the dashed line using the right-hand-side axis. In Panel B, the solid line is the point estimate of the percentage of
illegal user transactions and the dashed lines provide a 99% confidence interval using bootstrapped standard errors.
The estimates come from a combination of two empirical models (the average of the estimates produced by the SLM
and DCE models). All values are smoothed with a five-month moving average.
0 M
1 M
2 M
3 M
4 M
5 M
6 M
7 M
8 M
0 M
5 M
10 M
15 M
20 M
25 M
2009 2011 2013 2015 2017
Ille
gal
use
r tr
ansa
ctio
ns
(Mil
)
Leg
al u
ser
tran
sact
ions
(Mil
)
0%
20%
40%
60%
80%
100%
2009 2011 2013 2015 2017

56
Panel A: Estimated dollar volume of illegal and legal bitcoin user transactions per month
Panel B: Estimated percentage illegal user dollar volume with 99% confidence bounds
Figure 6
Estimated dollar volume and percentage dollar volume of illegal bitcoin user transactions
This figure illustrates the time-series of the estimated dollar volume of illegal and legal bitcoin user transactions per
month (Panel A) and illegal user dollar volume as a percentage of total dollar volume of bitcoin transactions (Panel
B). In Panel A, the dollar volume of legal user transactions is plotted with the solid line using the left-hand-side axis
and the dollar volume of illegal user transactions is plotted with the dashed line using the right-hand-side axis. In
Panel B, the solid line is the point estimate of the illegal dollar volume as a percentage of total dollar volume and the
dashed lines provide a 99% confidence interval using bootstrapped standard errors. The estimates come from a
combination of two empirical models (the average of the estimates produced by the SLM and DCE models). All
values are smoothed with a five-month moving average.
0 B
20 B
40 B
60 B
80 B
100 B
120 B
140 B
160 B
180 B
2009 2011 2013 2015 2017
0 B
2 B
4 B
6 B
8 B
10 B
12 B
14 B
16 B
18 B
Leg
al u
ser
vo
luum
e ($
Bil
)
Ille
gal
use
r vo
lum
e (
$ B
il)
0%
20%
40%
60%
80%
100%
2009 2011 2013 2015 2017

57
Panel A: Estimated dollar value of illegal and legal user bitcoin holdings
Panel B: Estimated percentage of illegal users bitcoin holdings with 99% confidence bounds
Figure 7
Estimated dollar value and percentage of illegal user bitcoin holdings
This figure illustrates the time-series of the estimated dollar value of illegal and legal user bitcoin holdings (Panel A)
and illegal user holdings as a percentage of total bitcoin holdings (Panel B). In Panel A, the dollar value of legal user
bitcoin holdings is plotted with the solid line using the left-hand-side axis and the dollar value of illegal user
holdings is plotted with the dashed line using the right-hand-side axis. In Panel B, the solid line is the point estimate
of the illegal user holdings as a percentage of total bitcoin holdings and the dashed lines provide a 99% confidence
interval using bootstrapped standard errors. The estimates come from a combination of two empirical models (the
average of the estimates produced by the SLM and DCE models). All values are smoothed with a five-month
moving average.
0 B
2 B
4 B
6 B
8 B
10 B
12 B
2009 2011 2013 2015 2017
0 B
1 B
2 B
3 B
4 B
5 B
6 B
7 B
8 B
9 B
Leg
al u
ser
ho
ldin
gs
($ B
il)
Ille
gal
use
r ho
ldin
gs
($ B
il)
0%
20%
40%
60%
80%
100%
2009 2011 2013 2015 2017
Related Documents