Sex differences in adults' motivation to achieve Sophie van der Sluis a, ⁎, Anna A.E. Vinkhuyzen b , Dorret I. Boomsma b , Danielle Posthuma a,c a Functional Genomics, Center for Neurogenomics and Cognitive Research (CNCR), VU University Amsterdam, de Boelelaan 1085, 1081 HV, Amsterdam, The Netherlands b Department of Biological Psychology, VU University Amsterdam, Van der Boechorststraat 1, 1081 BT Amsterdam, The Netherlands c Medical Genomics, VU Medical Centre, van der Boechorststraat 7, 1081 BT, Amsterdam, The Netherlands article info abstract Article history: Received 26 August 2009 Received in revised form 8 March 2010 Accepted 20 April 2010 Available online 14 May 2010 Achievement motivation is considered a prerequisite for success in academic as well as non- academic settings. We studied sex differences in academic and general achievement motivation in an adult sample of 338 men and 497 women (ages 18–70 years). Multi-group covariance and means structure analysis (MG-CMSA) for ordered categorical data was used to establish the location of possible sex differences, i.e., on the level of the latent factors or on the level of the observed items (i.e., sex-related item bias). Five of the 28 achievement motivation items showed severe bias with respect to sex, exemplifying the usefulness of MG-CMSA in locating the source of sex differences. The Academic Achievement Motivation scale consisted of two latent factors: Dedication and Persistence. Sex differences were observed for the factor Dedication only, with women showing more dedication towards their academic work than men. The General Achievement Motivation scale consisted of five latent factors: Pressure, Accomplishment, Work Approach, Future Orientation, and Competition. Sex differences were significant for the factor Future Orientation, with women contemplating less about the future than men, and a trend towards significance (p = .06) was observed for the factor Competition, with women being less actuated by competitive motives than men. These results suggest that sex-related item bias merits attention in achievement motivation research, but that men and women still differ in aspects of achievement motivation when biased items are eliminated from the analyses. © 2010 Published by Elsevier Inc. Keywords: Sex differences Multi-group covariance and mean structure analysis Motivation Achievement 1. Introduction Achievement motivation is considered a prerequisite for success, not only in academic, but also in sports- and job- related situations. In academic settings, the interest in motivation is partly inspired by the notion that students' motivation, operationalized, e.g. as their competency beliefs and value beliefs, could be more malleable than their cognitive ability, and as such could prove to be a potential lead for the educational system for improving learning and achievement processes in students (e.g., Spinath, Spinath, Harlaar, & Plomin, 2006). Sex differences in achievement motivation have been studied widely (cf. Meece, Glienke, & Burg, 2006). In the context of academic achievement, gender role stereotypes are confirmed when motivation is studied domain-specifically, with boys being more confident and interested in mathe- matics and science compared to girls, while girls prefer, and feel more confident about language-related domains com- pared to boys. Researchers have studied whether these sex differences in motivation can predict sex differences in academic achievement (e.g., Steinmayr & Spinath, 2008; Freudenthaler, Spinath, & Neubauer, 2008). In all these studies, motivation-related items and subscale scores are compared directly between boys and girls. It has, however, never been verified whether these items or subscales are actually directly comparable, i.e., are measurement invariant across sex (see below). Yet, if the factor structure of a motivational instrument is not equal in boys and girls, differences in item-, or sumscores should be interpreted with caution. That is, when the measurement model is not Intelligence 38 (2010) 433–446 ⁎ Corresponding author. E-mail address: [email protected] (S. der Sluis). 0160-2896/$ – see front matter © 2010 Published by Elsevier Inc. doi:10.1016/j.intell.2010.04.004 Contents lists available at ScienceDirect Intelligence

Welcome message from author
This document is posted to help you gain knowledge. Please leave a comment to let me know what you think about it! Share it to your friends and learn new things together.
Transcript

Intelligence 38 (2010) 433–446
Contents lists available at ScienceDirect
Intelligence
Sex differences in adults' motivation to achieve
Sophie van der Sluis a,⁎, Anna A.E. Vinkhuyzen b, Dorret I. Boomsma b, Danielle Posthuma a,c
a Functional Genomics, Center for Neurogenomics and Cognitive Research (CNCR), VU University Amsterdam, de Boelelaan 1085, 1081 HV, Amsterdam, The Netherlandsb Department of Biological Psychology, VU University Amsterdam, Van der Boechorststraat 1, 1081 BT Amsterdam, The Netherlandsc Medical Genomics, VU Medical Centre, van der Boechorststraat 7, 1081 BT, Amsterdam, The Netherlands
a r t i c l e i n f o
⁎ Corresponding author.E-mail address: [email protected] (S.
0160-2896/$ – see front matter © 2010 Published bydoi:10.1016/j.intell.2010.04.004
a b s t r a c t
Article history:Received 26 August 2009Received in revised form 8 March 2010Accepted 20 April 2010Available online 14 May 2010
Achievement motivation is considered a prerequisite for success in academic as well as non-academic settings. We studied sex differences in academic and general achievementmotivation in an adult sample of 338 men and 497 women (ages 18–70 years). Multi-groupcovariance and means structure analysis (MG-CMSA) for ordered categorical data was used toestablish the location of possible sex differences, i.e., on the level of the latent factors or on thelevel of the observed items (i.e., sex-related item bias). Five of the 28 achievement motivationitems showed severe bias with respect to sex, exemplifying the usefulness of MG-CMSA inlocating the source of sex differences. The Academic Achievement Motivation scale consisted oftwo latent factors: Dedication and Persistence. Sex differences were observed for the factorDedication only, with women showing more dedication towards their academic work thanmen. The General Achievement Motivation scale consisted of five latent factors: Pressure,Accomplishment, Work Approach, Future Orientation, and Competition. Sex differences weresignificant for the factor Future Orientation, with women contemplating less about the futurethan men, and a trend towards significance (p=.06) was observed for the factor Competition,with women being less actuated by competitive motives than men. These results suggest thatsex-related item bias merits attention in achievement motivation research, but that men andwomen still differ in aspects of achievement motivation when biased items are eliminated fromthe analyses.
© 2010 Published by Elsevier Inc.
Keywords:Sex differencesMulti-group covariance and mean structureanalysisMotivationAchievement
1. Introduction
Achievement motivation is considered a prerequisite forsuccess, not only in academic, but also in sports- and job-related situations. In academic settings, the interest inmotivation is partly inspired by the notion that students'motivation, operationalized, e.g. as their competency beliefsand value beliefs, could be more malleable than theircognitive ability, and as such could prove to be a potentiallead for the educational system for improving learning andachievement processes in students (e.g., Spinath, Spinath,Harlaar, & Plomin, 2006).
Sex differences in achievement motivation have beenstudied widely (cf. Meece, Glienke, & Burg, 2006). In the
der Sluis).
Elsevier Inc.
context of academic achievement, gender role stereotypes areconfirmed when motivation is studied domain-specifically,with boys being more confident and interested in mathe-matics and science compared to girls, while girls prefer, andfeel more confident about language-related domains com-pared to boys. Researchers have studied whether these sexdifferences in motivation can predict sex differences inacademic achievement (e.g., Steinmayr & Spinath, 2008;Freudenthaler, Spinath, & Neubauer, 2008). In all thesestudies, motivation-related items and subscale scores arecompared directly between boys and girls. It has, however,never been verified whether these items or subscales areactually directly comparable, i.e., are measurement invariantacross sex (see below). Yet, if the factor structure of amotivational instrument is not equal in boys and girls,differences in item-, or sumscores should be interpretedwith caution. That is, when the measurement model is not

434 S. der Sluis et al. / Intelligence 38 (2010) 433–446
equivalent across sex, differences between boys and girls intest scores do not necessarily reflect differences in achieve-ment motivation. The present study is concerned with sexdifferences in academic achievement motivation and generalachievement motivation in an adult sample, and explicitlydeals with the question of whether the motivationalinstrument is measurement invariant across sex.
In 2006, Meece et al. (2006) published a comprehensivereview of studies on sex differences in motivation. Studies onmotivation have mainly focused on the school-going popu-lation, and report sex differences for motivation-relatedconstructs such as expectations for success, causal attributionof failure/success, competency beliefs, value beliefs (i.e.,perceived importance, usefulness, interest, and costs ofacademic activities), and self-efficacy judgements (i.e., one'sconfidence in learning, performing and succeeding academ-ically). These sex differences mostly follow gender norms andstereotypes. Boys are more confident than girls with respectto math, science, and sports related abilities. In addition, boysvalue these abilities more highly, and attribute their successin these domains to ability while girls attribute their math orscience related success mostly to effort and hard work.Contrarily, girls are more confident than boys in domainsconcerning verbal and language abilities, value these abilitiesmore highly than boys do, and attribute their success in thesedomains to their own ability. Noteworthy, however, is thatthese findings are not consistent, and seem to depend notonly on the achievement domain for which motivation ismeasured, but also on socioeconomic status, ethnicity, andactual ability level. In addition, all these studies focus on sexdifferences observed in adolescents, while sex differences inadults' work- or career-related achievement motivation havenot received much attention.
In adolescents, studies focussed on academic achievementmotivation, examining whether motivation predicts academ-ic success independently of cognitive ability. Sex differencesin academic achievement have been observed in manycountries (USA: Epstein, Elwood, Hey, & Maw, 1998; Grant& Rong, 1999; Japan: Wong, Lam, & Ho, 2002; Belgium: vanHoutte, 2004; Netherlands: de Knecht-van Eekelen, Gille, &van Rijn, 2007; CITO Terugblik en resultaten, 2009). Thequestion logically following from this is whether these sexdifferences in achievement can be explained by sex differ-ences in motivation.
In 17 year olds, Steinmayr and Spinath (2009) report thatmotivational aspects like hope for success, fear of failure, andneed for achievement contributed to the prediction ofacademic achievement over and above general IQ and priorachievement. Although the additional effects of the motiva-tional constructs to the prediction of academic success weresmaller (R2b10%) than the effects of general intelligence(R2≈12%) and of prior achievement (R2≈24–52%), theauthors emphasized the importance of motivation becauseof its possible susceptibility to intervention.
In another study in 17 year olds, Steinmayr and Spinath(2008) observed sex differences for almost all motivation-related predictors included in their study. On average, girlsexpressed less hope for success, less work avoiding behav-iour, and less confidence in their math-related ability, whileat the same time rating math as less interesting, importantand useful than boys. Boys, on the other hand, showed less
fear of failure, less interest in learning as a goal in itself, andthey were less confident about their German language-related ability, but also valued language as less importantand useful than girls. Sex differences were however notapparent for performance avoidance (i.e., avoiding mistakes)and performance-approach (seeking other people's appreci-ation of one's own intellectual ability), and the relations ofthese motivational predictors to academic achievement weresimilar across sex.
Conversely, Freudenthaler et al. (2008) did report sexdifferences in prediction of academic achievement in 14 yearolds. In boys, self-esteem, intrinsic motivation, performanceavoidance, and school anxiety predicted academic achieve-ment over and above IQ, while in girls, only work avoidance(i.e., doing no more than strictly required) and self-esteemdid. In yet another study in 13-year old female students,Gagné and St Père (2001) observed no relation whatsoeverbetween self-reported motivation on the one hand, and IQand academic achievement on the other. In that study, onlyself-reported persistence was slightly related to academicachievement.
In sum, sex differences in motivational constructs, and sexdifferences in the relation between these motivationalconstructs on the one hand, and actual academic achievementon the other, have been found, but not consistently.Mediating effects of socioeconomic status, ethnicity, age,and actual ability level have been put forward as explanationsfor the inconsistencies. Another possible source of inconsis-tency, however, is that the tests and items used to measuremotivation are not identical across studies, leaving open thepossibility that the inconsistencies between studies are due tothe use of different instruments. In addition, inconsistencymay result when test- and item scores are not directlycomparable between boys and girls, i.e., when items do notmeasure exactly the same constructs in boys and girls, e.g.,because the connotation of the item is sex dependent. Suchitem bias could result in different relationships betweenitems in boys and girls (and thus different underlying factorstructures), and the sex differences observed on such biaseditems may not be indicative of sex differences in actualachievement motivation. If a test or items of a test are biasedwith respect to sex, then sex differences in the scores on thistest are difficult to interpret.
One flexible framework for testing, and accommodating,group differences within the context of factor models ismulti-group covariance and mean structure analysis (MG-CMSA; Sörbom, 1974; Little, 1997; Widaman & Reise, 1997).This method, which has been used in studies on groupdifferences in intelligence (e.g., Dolan & Hamaker, 2001;Dolan et al., 2006; van der Sluis et al., 2006; van der Sluis et al.,2008; Wicherts et al., 2004), provides a model-based meansto investigate the main source(s) of group differences. MG-CMSA allows one to test whether sex differences observed atthe level of specific items are indeed a function of sexdifferences on the level of the latent trait(s) underlying theresponse to these items. When differences in scores onindividual motivation items are not indicative of differencesin actual motivation, then this may indicate that the itemdifferences reflect a situation- or ability-specific differencebetween boys and girls, rather than a difference in motivationper se. In the context of MG-CMSA, items are considered

435S. der Sluis et al. / Intelligence 38 (2010) 433–446
‘biased' when the mean differences observed on the level ofthe item cannot be explained bymean differences on the levelof the latent factor. The term ‘bias’ does not imply that theobserved sex difference on the item is not real, but simplythat the difference observed for the item is smaller or greaterthan the difference expected based on the means of theunderlying factor, and can therefore not be taken as indicativeof a sex difference in the latent trait. MG-CMSA can be used tolocate such bias.
In addition, MG-CMSA allows one to evaluate andcompare the fit of different models that reflect differenthypotheses. In most research onmotivation, researchers haveused sum scores. The implicit assumption with respect to thesum score model is that the factor model underlying the testis 1-dimensional, and that all items are equally informative ofthe trait of interest. Whether such a highly-restricted modelfits the data, i.e., describes the variance–covariance andmeans structure of the data adequately, is usually not tested.However, if that model does not describe the data adequately,then the sex differences are tested within the context of apoorly fitting model, which could result in incorrect conclu-sions with respect to the presence, and source, of sexdifferences.
The aim of the present paper is to investigate sexdifferences in academic achievement motivation and generalachievement motivation in adults using MG-CMSA. Specifi-cally, we investigate whether sex differences in achievementmotivation test scores are really indicative of sex differencesin the achievement motivation trait, or more likely of sex-related item bias. Below, we will first outline the MG-CMSAprocedure for categorical data that we used to investigate thesources of sex differences in our motivational instruments.For convenience, results are presented separately for aca-demic achievement motivation and general achievementmotivation.
1 The original DAMT consists of three more subscales, tapping intopositive and negative fear of failure and social desirability, but these werenot included in the larger questionnaire for reasons of efficiency.
2 The original general achievement motivation subtest consists of 20rather than 18 items. Two items were, however, eliminated because theydid not correlate with the other 18, which hindered the factor model fitting.As the content of these two items was also very different from the other 18(one item asked whether one likes to organize things, the other asked theparticipant's opinion on the expression ‘time is money’), we decided todiscard these two items from all subsequent analyses.
2. Method
2.1. Participants
All participants in this study were volunteer members ofthe Netherlands Twin Register (Boomsma et al., 2006) whoparticipated in a larger ongoing study on the interplaybetween genes and environment on cognition. As part ofthis extended family study, participants were asked to fill outa questionnaire, which included the 28 questions onachievement motivation, which are used in the presentstudy. At the time of publication, data were available from284 families, including data from twins, and their siblings,and the parents, children, and partners of these twins andsibling (note that not all relations were represented in allfamilies). The sample comprised 835 subjects in total: 338men and 497 women. The overrepresentation of women inour study sample may affect the generalizability of thisstudy's results to other populations (see Discussion). It doesnot, however, detract from the illustrative value of using MG-CMSA in the context of motivation research.
Becauseof thenatureof thedata collection, the age rangewasconsiderable (from18 to 70,M=45.37, SD=14.08), but age didnot differ significantly betweenmenandwomen(t(833)b1, ns).
Age was included as a covariate in all confirmatory factoranalyses.
2.2. Instrument
The items used in this study were part of a largerquestionnaire on life experiences, which was administeredas part of the study on the interplay between genes andenvironment on cognition. The entire questionnaire tookabout 50min to complete. The 28 multiple-choice achieve-ment motivation items were adopted from the Dutch‘Prestatie Motivatie Test’ (Dutch Achievement MotivationTest, DAMT, Hermans, 2004).1 Ten of the 28 achievementmotivation items focused on the academic achievementmotivation subscale (AAM, e.g., “When I was in school, thedemands that I made on myself concerning studying werevery high / high / pretty high / low”; “Studying hard in schoolwas something I did not like at all / did not like much / liked alot”), while the other 18 focused on the general achievementmotivation subscale (GAM, e.g., “The demands that I make onmyself at work are very high / high / pretty high / not thathigh”; “The urge to surpass myself is very strong / prettystrong / not very strong”).2 All items were categorical innature with 2 to 4 ordered answer options (see Appendix Afor more example items). Negative items were recoded suchthat for all 28 items, higher scores reflect higher achievementmotivation. The reliability of the AAM and the GAM subscaleswas .83, and .75, respectively.
Like many motivation instruments, AAM and GAM areself-report measures. In addition, our adult participants wereasked to retrospectively evaluate their academic and generalachievement motivation. Both the retrospective characterand the self-reporting nature of the scales formed a potentialsource of bias in the evaluation of a person's motivation toachieve (see Discussion). It does not, however, detract fromthe illustrative value of using MG-CMSA in the context ofmotivation research.
3. Statistical analyses
3.1. Exploratory factor analysis
The factor structure of the two subscales of the DAMT hasnot been studied before. We therefore first conductedexploratory factor analyses for ordered categorical items toinvestigate the number of factors required to describe thestructure of the AAM and GAM subscales, and, if multiplefactorswere required, to establish thepatternof factor loadings.These exploratory analyses were conducted inMplus version 5(Muthén & Muthén, 1998–2007), for men and womenseparately, andwere followed by an oblique rotation (geomin).

436 S. der Sluis et al. / Intelligence 38 (2010) 433–446
3.2. Confirmatory factor analysis and testing for the presence ofmeasurement invariance
To examine sex differences with respect to the latentfactors of academic and general achievement motivation, onefirst needs to establish whether the AAM and GAM subscalesare measurement invariant with respect to sex. Measurementinvariance with respect to sex implies that the distribution ofthe observed scores of subjects i on an item j (yij), given afixed level of the latent factor (η), depends on the score on thelatent factor η only, and not on sex, i.e., f(yij|η,sex)= f(yij|η)(Mellenbergh, 1989). That is, given equal latent factor scoresη, men and women should score similarly on item j. In thecase of continuous items, and given normally distributeddata, measurement invariance can be defined in terms of themeans and variances of yij given η. With ordered categoricaldata the definition is however somewhat different.
In factor models for ordered categorical data, the observedscores for item yijk, i.e., the jth ordered categorical measure forthe ith person in the kth group (where sex defines the twogroups in the present paper), are assumed to be determined bythe unobserved scores on the latent response variate y*ijk. Theselatent response variates are continuous in scale, and theobservedmeasures yijk can be considered a categorized versionsof the latent variates y*ijk, where the scores on the categorizeditems yijk depend on the threshold parameters νjk(0…c−1),where c is the number of categories, of the jth item in the kthgroup (Millsap & Yun-Tein, 2004).
Given p items, the scores on the vector of latent responsevariates for the ith person in the kth group, y*ik, arewithin eachsubgroup assumed to be multivariate normally distributed(y*ik∼MVN(μ*k, Σ*k)), where μ*k is a p×1 vector of means of thelatent response variates, and Σ*k is a p×p covariance matrixfor the latent response variates, each estimated separately ineach subgroup k.
Given the latent response variate y*ijk, the factor model isspecified as:
y�ijk = τjk + λjkηik + εijk; ð1Þ
where τjk is a latent intercept parameter, λjk is a r×1 vector offactor loadings of the jth variate on the r factors, ηik is the r×1vector of factor scores of the ith person in the kth group, andεijk denotes the jth unique factor score for that person. If εik isthe 1×p vector of unique factor scores, it is assumed thatηik∼MVN(κk,Ψk),whereκk is the r×1vectorof factormeans andΨk denotes the r×r factor covariance, and that εik∼MVN(0, Θk),where Θk denotes the p×p (usually diagonal) matrix of residual(or unique) variances, i.e., the variance not explained by thelatent factors η.
The model implied expected values for the vector of latentresponse variates y*ik are given as:
E y�ikð Þ = μ�k = τk + Λkκk; ð2Þ
and the model implied covariance matrix is given as:
Cov y�ikð Þ = Σ�k = ΛkΨkΛ′k + Θk; ð3Þ
where Λk is the p×r matrix of factor loadings, with Λ′kdenoting the transpose of this matrix.
Note that to begin with, all factor model parameters (τk,Λk, κk,Ψk, Θk) are estimated separately in the different groups(as denoted by subscript k). However, not all parameters maybe identified, especially when the observed items are orderedcategorical.
To establish measurement invariance with respect to sexin a factor model for ordered categorical data, one needs toestablish whether the relation between the observed itemscores yijk (via the latent variates yijk
* ) and the underlyinglatent factor(s) η is the same in men and women. Measure-ment invariance with respect to sex can be examined througha series of constraints on the model parameters (Meredith,1993; Millsap & Yun-Tein, 2004), which are, to begin with,estimated separately in men and women.
To test whether the mean structure and the covariancestructure of the AAM and GAM subscales were measurementinvariant across sex, multi-group confirmatory factor analysisfor ordered categorical data had to be carried out. Below wewill give a short overview of the constraints required toidentify the factor model, and to test for measurementinvariance when data are categorical. We refer to Millsapand Yun-Tein (2004) for more details on and the rationalebehind these constraints. All steps required to test formeasurement invariance were previously described anddiscussed in detail by Horn and McArdle (1992) and Wida-man and Reise (1997).
The first step (Model 1) in testing for measurementinvariance concerned the test for ‘configural invariance’, i.e.,the test of whether the pattern of factor loadings (andcorrelated residuals, if present) was the same in men andwomen, while the actual values of these parameters wereallowed to differ across sex. Several constraints were requiredto identify this model. In all subsequent analyses, we chosethe male group as a reference group. In this group, the latentintercepts τ and the factorial means κ needed to be fixed to 0,and all thresholds ν were estimated freely. In the women,however, we needed to constrain one threshold per item tobe sex-invariant, i.e., to be equal to the threshold of the men.In addition, we needed to pick r reference items (i.e., one foreach latent factor) for which the second threshold wasconstrained to be sex-invariant as well. All remainingthresholds were estimated freely in the women, just as thefactorial means κ, which were identified due to theconstraints on the thresholds. The latent intercepts τ werehowever fixed to 0 in women as well. As with continuousdata, one needs to fix the arbitrary scale of the latent factor;we chose to fix the factorial variances to 1 in both groups. Thecategorical nature of the observed data requires one to alsoadopt a scale for the continuous latent variates underlying thecategorical response data. To this end, the residual varianceswere fixed to 1 in the male reference group (i.e., the so-calledtheta parameterization in Mplus, see Muthén & Muthén,1998-2007), but these parameters could then be estimatedfreely in thewomen (unless an item is dichotomous in nature,in which case its' residual variance needs to be fixed to 1 inthe women as well). We refer to Millsap and Yun-Tein (2004)for an elaborate discussion of these constraints.
In the second step (Model 2), we tested for ‘metricinvariance’. Metric invariance implies that the relationsbetween the observed items on the one hand and the latentfactor on the other are the same across sex. The test for metric

437S. der Sluis et al. / Intelligence 38 (2010) 433–446
invariance thus involves constraining all factor loadings to beequal across sex. Note that metric invariance is a prerequisitefor meaningful comparison of the latent factors across sex:only when the factor loadings are equal across sex, can we besure that the latent factors themselves are identical, and thuscomparable, between men and women. Metric invariance issaid to be tenable when the equality constraints on the factorloadings do not result in a significant deterioration of theoverall model fit. Note that as a result of these constraints onthe factor loadings, fixation of the factorial variances in bothgroups became superfluous: the factorial variances remainedfixed to 1 in the male reference group, but could now beestimated freely in the women.
In the third step (Model 3), we tested for ‘strong factorialinvariance’. Strong factorial invariance implies that the meandifferences that are observed between men and women onthe level of the observed items can all be accounted for by thelatent factor, i.e., are indicative of mean differences on thelatent trait of interest. The test for strong factorial invariancethus involves constraining all thresholds to be equal acrosssex. These constraints allowed free estimation of the factorialmeans of the female group, while the factorial means in themale reference group remained fixed to 0 for identificationpurposes. Modelled as such, the factorial mean of the womenshould be interpreted as deviation from the factorial means ofthe men (i.e., deviations from zero). Note that in this model,sex differences in observed scores yijk can only result from sexdifferences in factorial means, because, at this point in themodel fitting sequence, these factorial means are the onlyparameters that differ across sex in the regression of theitems on the latent factors. In other words, if the constraintsimplied by strong factorial invariance hold, i.e., do not lead toa significant deterioration of the model fit, then theassumption that the expected observed scores depend onlyon a subject's factor score and not on the subject's sex holds,i.e., E(yijk|η,sex)=E(yijk|η). If these constraints do howeverresult in a significant deterioration of the model fit, then thelatent factors cannot account for the sex differences inobserved scores, i.e., one or more of the differences inthresholds between men and women cannot be accountedfor by the latent factors. Comparing men and women withrespect to their latent factor means is only meaningful ifstrong measurement invariance holds. Those items, for whichthe sex differences observed on the level of the thresholdscannot be explained by sex differences on the level of thelatent factor, are considered biased with respect to sex.
The fourth step (Model 4) tested for strict factorialinvariance. Strict factorial invariance implies that the residualvariances, i.e., the parts of the observed items that are notexplained by, or related to, the latent factor, are also equalacross sex. Strict factorial invariance thus involves constrainingthe residual variances to be also equal across sex. Note thatbecause of the categorical nature of the items, the residualvarianceswere fixed to 1 in themale reference group, andwereestimated freely in the women. In the context of categoricaldata, the test for strict factorial invariance thus implies fixingthe residual variances inwomen to1 aswell. If these constraintswere tenable,we concluded that all sex differenceswith respectto the observed scores on the items, and the relations betweenthe items, could be accounted for by sex differences on the levelof the latent factor. Note however that for the comparison of
threshold or factor means between men and women, strictfactorial invariance is not required (i.e., strong factorialinvariance suffices).
Finally (Model 5), when at least strong factorial invarianceholds (i.e., the constraints in Model 4 are tenable), we wereready to testwhether the factorialmeanswere the same inmenandwomen. Note that for reasons of identification, the factorialmeans were fixed to 0 in the male reference group, and werefreely estimated in the women. The test for equal factor meansthus involvesfixing the factorialmeans of thewomen to zero aswell. If this constraint resulted in a significant deterioration ofthemodel fit, thenwe concluded thatmen andwomen differedwith respect to the latent trait of interest (i.e., achievementmotivation in the present study).
3.3. General model fitting strategies
For reasons of convenience in reporting results andestimation of parameters, all analyses were conducted sepa-rately for the academic achievement motivation (AAM)subscale and the general achievement motivation (GAM)subscale. Note that in theory, the factor structure and themodel fitting results could be different for subsets of items,compared to the results for the complete item set, e.g. becauseitems of the AAM subscale cannot load on the factors of theGAM subscales if they are analyzed separately. However, whenthe separate factor models of the AAM and the GAM wereeventually combined in one overall model (the Total Model inthe Results section), this model showed good fit, and no largemodification indices (indices of local misfit in the model) orlarge residuals (i.e., parts not explained by the model). Thechoice to start with exploratory and confirmatory factoranalyses in the two subscales separately turned therefore outto be justified.
All itemswere regressed on a standardizedmeasure of ageto correct for possible age effects.
Because the data were collected within families, theobservations could not be considered independent. As treatingwithin-family data as if they are independently distributedobservations results in incorrect standard errors and incorrectχ2 goodness of fit statistics, all analyses were performed inMplus version 5 (Muthén & Muthén, 1998-2007), whichcomputes corrected standard errors and Satora–Bentler scaledχ2-tests with adjusted number of degrees of freedom, takinginto account the dependence of the observations. The fit ofnested models can then be compared through a weighted χ2-difference test (Satorra, 2000). More restricted (i.e., nested)models are accepted if their fit is not significantly worse thanthe fit of the less restricted model, i.e., if the weighted χ2-difference test (henceforth χdiff
2 ) is not significant. Below, wewill not report the scaledχ2-values for eachmodel, as these arenot informative, but rather report the weighted χdiff
2 tests forthe comparisons of competing models.
The fit of ensuing models to the data were also evaluatedusing the Root Mean Square Error of Approximation (RMSEA)and the Comparative Fit Index (CFI, Bentler, 1990; Bollen &Long, 1993; Jöreskog, 1993; Schermelleh-Engel, Moosbrugger,& Müller, 2003). The RMSEA is a measure of the discrepancy(i.e., error of approximation) between the covariance andmeanstructure implied by the fitted model, and the covariance andmean structure in the population. Calculating the discrepancy

Table 1Endorsement rates of the 10 academic achievement motivation (AAM) itemsfor men and women separately.
Men Women Effectsize r
Cat 1 Cat 2 Cat 3 Cat 4 Cat 1 Cat 2 Cat 3 Cat 4
AAM1 8.9 50.3 40.8 – 6.7 42.5 50.8 – .10AAM2 59.9 40.1 – – 58.6 41.4 – – .01AAM3 21.0 61.0 18.0 – 16.4 62.9 20.7 – .06AAM4 28.1 25.4 46.5 – 20.7 8.0 71.3 – .21AAM5 9.7 44.8 40.9 4.5 4.5 34.1 52.9 8.5 .17AAM6 36.7 47.4 15.9 – 27.0 53.9 19.1 – .10AAM7 22.5 42.3 29.1 6.0 18.5 37.6 34.1 9.9 .09AAM8 61.8 31.5 6.7 – 54.7 34.3 11.0 – .08AAM9 14.3 31.3 40.4 14.0 18.1 26.7 41.9 13.3 −.01AAM10 10.5 38.4 51.1 – 7.7 37.9 54.4 – .04
Note: Number of ordered answer options varies across items (range: 2–4).Higher categories correspond to higher motivation. Effect size r is calculatedas Z/√N, where Z is obtained in a Mann–Whitney test, and N is the effectivesample size (men+women) for each individual item. Positive effect sizesdenote higher academic achievement motivation for women.
438 S. der Sluis et al. / Intelligence 38 (2010) 433–446
per degree-of-freedom, this fit index favours more parsimoni-ous models. Generally, as a rule of thumb, RMSEA values b.05are taken as indicative of good fit (i.e., good approximation),RMSEA values between .05 and .08 indicate acceptable fit, andvalues larger than .08 indicate poorfit (Browne&Cudeck, 1993;Schermelleh-Engel et al, 2003). The CFI is based on thecomparison between the independence model, i.e., the modelin which all variables are modelled as unrelated, and the user-specified model. The CFI, for which theoretically values rangebetween 0 and 1.00, favours more parsimonious models, andtakes on larger values when the difference between theindependence model and the hypothesized model increases.Usually, values N.95 are taken to indicate good model fit, andvalues between .90 and .95 indicate acceptable fit (Hu &Bentler, 1999; Schermelleh-Engel et al., 2003).
The RMSEA and the CFI were used only as indication of thegeneral fit of models, while the scaled χ2-tests and weightedχdiff2 tests were used specifically when testing the effects of
the constraints required for measurement invariance. Mod-ification indices, which express the expected drop in scaledχ2 if constrained parameters are estimated freely, were usedto detect local misfit in models.
Raw data maximum likelihood estimation was used toaccommodate missingness (mean percentage of missingnessacross the entire 28-itemDAMTwas 1.47 % (SD=1.05)with amaximum of 4.4% for one of the academic motivation items).3
For all analyses, α was set at .05.
4. Results
4.1. Preliminary analyses
Table 1 shows the endorsement rated in valid percentagesfor the 10 items of the AAM subscale for men and womenseparately. Effect size r is calculated as the Z-score obtainedfrom a Mann–Whitney test (i.e., the non-parametric testcomparing two independent groups with respect to theirranks scores on a categorical measure: the Z-score is ameasure of whether the smallest sum of ranks deviates fromthe expected sum of ranks), divided by the square root of thetotal number of observations, i.e., Z/√N (Rosenthal, 1991).Most effect sizes for the AAM items were small and positive,implying that women scored overall somewhat higher thanmen, i.e., were somewhat more motivated or more zealous.The largest effect size was observed for item AAM4 (“Inschool, people thought I was quite lazy/ not very diligent /diligent”), where women remembered themselves moreoften as being considered more zealous than men.
The polychoric correlations between the 10 AAM items areshown in Table 2 for men and women separately.
The endorsement rates (in valid percentages) for the 18GAM items are shown in Table 3. The effect sizes for the GAMitems were mostly small but the more sizable ones werenegative, implying that women scored somewhat lower than
3 Note that missingness on some of the academic achievement motivationitems was significantly related to the age of the participants, withmissingness being more frequent in older subjects. This could suggest thaquestions about academic achievement motivation are more difficult toanswer when the school years are in the remote past, or that academictraining was less often granted to the older participants, renderingquestions about e.g. homework unsuitable.
t
men. The largest effect size was observed for item GAM4 (“Asthe manager of a factory you are often very busy andoverworked. I would certainly not want such a job / wouldnot readily accept such a job / would really like such a job”.)
The polychoric correlations between the 18 GAM itemsare shown in Table 4 for men and women separately.Important to note is that, although some correlations werehigher than .35, many correlations between these categoricalitems were lower than .20.
Whether the small differences observed betweenmen andwomen on the categorical items, were indicative of differ-ences on the latent level, was further examined using multi-group covariance and means structure analysis (MG-CMSA).First, however, the factor structure of the AAM and the GAMwas established using exploratory factor analysis.
4.2. Exploratory factor analyses (EFA)
Because the factor structure of the subscales AAM andGAM has not been studied before, exploratory factor analyseswere conducted in order to get a first impression of thepattern of factor loadings. As explained before, analyses wereconducted separately for the AAM and the GAM.
4.2.1. Academic achievement motivationWith respect to the AAM, an exploratory factor solution
with two correlated factors showed a good fit in both men(CFI = .98, RMSEA= .036) and women (CFI= .98,RMSEA=.046). Table 5 shows the geomin rotated factorloadings of the 10 AAM items on the two correlated factors formen and women separately.
The items loading on the first factor all representDedication(willingness to study and allocate time to homework), whilethe items loading on the second factor mostly refer to focus orPersistence (the ease with which one could start and continuedoing schoolwork in spite of distraction). Item1 loadedonbothfactors, and item 10 loaded mainly on factor 1 in men, and onfactor 2 in women. Based on the content of these items and themodel fit statistics, however, we choose to let these items loadon the Dedication factor only in all subsequent confirmatoryfactor analyses. In these analyses, the Persistence factor was

Table 2Polychoric correlations between the 10 academic achievement motivation (AAM) items for men (below diagonal) and women (above diagonal) separately.
AAM1 AAM2 AAM3 AAM4 AAM5 AAM6 AAM7 AAM8 AAM9 AAM10
AAM1 .37 .44 .41 .57 .34 .55 .39 .54 .55AAM2 .41 .33 .29 .40 .44 .33 .33 .27 .23AAM3 .34 .35 .46 .35 .27 .54 .42 .50 .35AAM4 .49 .27 .46 .47 .28 .55 .47 .57 .32AAM5 .49 .47 .34 .43 .48 .47 .57 .50 .52AAM6 .35 .44 .37 .31 .45 .30 .42 .29 .39AAM7 .38 .27 .57 .58 .44 .36 .44 .57 .44AAM8 .38 .41 .37 .37 .50 .45 .38 .44 .37AAM9 .53 .22 .39 .48 .38 .32 .47 .33 .50AAM10 .47 .27 .39 .39 .37 .39 .38 .35 .48
439S. der Sluis et al. / Intelligence 38 (2010) 433–446
thus indicated by 4 items (items 2, 6, 8, and 9), and theDedication factor by 6 items (items 1, 3, 4, 5, 7, and 10). Thisconfiguration of factor loadings was used for the multi-groupCFA analyses, with the bold factor loading of Table 5 estimatedfreely, and all other factor loadings fixed to zero.
4.2.2. General achievement motivationExploratory factor analyses on the 18 items of the GAM
subscale showed that a factor solution with 5 factors des-cribed the data structure adequately in both men (CFI=.96,RMSEA=.029) and women (CFI=.96, RMSEA=.032). Table 6shows the geomin rotated factor loadings of the 18 items onthe 5 correlated factors for men and women separately.
Based on the content of the items, factor 1 represents theextent towhich subjects experience time pressure as a result oftheir work (Pressure; items 2, 4, 17 and 20), factor 2 representsthe intrinsic motivation to accomplish goals and to surpassoneself (Accomplishment; items 1, 5, 6, 10, 11, and 20), factor 3gives an indication of work approach or avoidance, i.e., howmuch subjects are inclined towork in general (WorkApproach;
Table 3Endorsement rates of the 18 general achievement motivation (GAM) itemsfor men and women separately.
Men Women Effectsize r
Cat 1 Cat 2 Cat 3 Cat 4 Cat 1 Cat 2 Cat 3 Cat 4
GAM1 2.4 15.7 56.4 25.5 1.4 22.2 48.0 28.4 −.01GAM2 1.2 14.5 54.7 29.6 .6 13.3 57.6 28.5 .00GAM3 19.6 55.2 25.2 – 13.9 64.2 21.8 – .01GAM4 22.0 49.7 28.3 – 33.8 55.7 10.5 – −.21GAM5 6.5 74.7 18.8 – 6.4 82.8 10.9 – −.09GAM6 13.4 39.2 38.3 9.2 9.9 51.1 32.3 6.7 −.05GAM7 35.7 34.5 25.9 3.9 42.6 35.3 18.7 3.4 −.09GAM9 5.3 24.9 69.7 – 9.0 34.2 56.8 – −.13GAM10 47.6 36.5 15.9 – 46.2 39.5 14.4 – .00GAM11 15.5 37.8 29.2 17.6 15.1 34.0 33.0 17.9 .03GAM12 27.5 46.2 26.3 – 20.6 50.7 28.7 – .06GAM13 14.9 38.2 36.4 10.4 10.6 39.7 40.7 9.0 .03GAM14 14.9 15.8 69.3 – 12.7 18.2 69.1 – .00GAM15 13.9 40.6 45.5 – 11.6 47.0 41.4 – −.02GAM16 13.6 50.1 36.2 – 22.8 55.8 31.4 – −.03GAM17 6.6 42.9 46.8 3.6 3.3 39.8 50.6 6.3 .08GAM19 49.1 22.5 23.1 5.4 59.7 22.0 15.7 2.6 −.12GAM20 4.8 37.0 49.4 8.7 5.1 33.7 50.3 10.8 .03
Note: Number of ordered answer options varies across items (range: 3–4).Higher categories correspond to higher motivation. Effect size r is calculatedas Z/√N, where Z is obtained in a Mann–Whitney test, and N is the effectivesample size (men+women) for each individual item. Positive effect sizesdenote higher academic achievement motivation for women.
items3, 9, 14and15), factor 4 gives an indicationofhow future-oriented subjects are (Future Orientation; items 4, 7 and 16),and factor 5 represents the extrinsic motivation of subjects tocompete with others and to earn respect (Competition; items10, 12, 13, 15 and19). Thepattern of factor loadings of items4, 5and 9 was somewhat different for men and women, but basedon the content of these items, it was decided to start with aconfirmatory factor model in which item 5 loaded on theAccomplishment factor, item 9 on the Work Approach factor,and item 4 on both factors Pressure and Future. Thisconfiguration of factor loadings was used for the multi-groupCFA analyses, with the bold factor loading of Table 6 estimatedfreely, and all other factor loadings fixed to zero.
4.3. Multi-group covariance and means structure analysis (MG-CMSA)
4.3.1. Academic achievement motivationThe results and fit statistics of the multi-group CFA of the
AAM items are presented in Table 7.InModel 1,we tested for configural invariance, with 4 items
loading on the Persistance factor, and 6 on the Dedicationfactor. No cross-loadings were modelled (i.e., congenericstructure), and all residual terms were modelled as uncorre-lated. To correct for possible age effects, all 10 items wereregressed on age in men and women separately. The CFI (.98)and theRMSEA (.06) indicated thatModel 1fitted thedatawell.
InModel 1awe testedwhether the age regressions could beconstrained tobe equal inmenandwomen,but thiswasnot thecase (Model 1a vs Model 1: χdiff
2 (6)=30.19, pb .001). In allsubsequent models, age effects were therefore modelledseparately in men and women. Note that this part of themodel was saturated (i.e., all regressions on age wereestimated) so that the age correction could not contribute tomodel misfit.
To test for metric invariance, all factor loadings wereconstrained to be equal in men and women in Model 2, andthe factor variances were estimated freely in the women (andfixed to 1 for reasons of identification in the male referencegroup). Themodelfit did not deteriorate significantly as a resultof these constraints (Model 2 vs Model 1: χdiff
2 (7)=11.34, ns),implying that metric invariance across sex was tenable for theAAM subscale.
In Model 3, strong factorial invariance was tested byconstraining all thresholds to be equal across sex, andestimating the factor means freely in women, while theseremained fixed to 0 in the male reference group for reasons of

Table4
Polych
oric
correlations
betw
eenthe18
gene
rala
chieve
men
tmotivation(G
AM)item
sformen
(below
diag
onal)an
dwom
en(abo
vediag
onal)sepa
rately.
GAM1
GAM2
GAM3
GAM4
GAM5
GAM6
GAM7
GAM9
GAM10
GAM11
GAM12
GAM13
GAM14
GAM15
GAM16
GAM17
GAM19
GAM20
GAM1
.30
.06
.31
.18
.41
.22
.06
.52
.24
.28
.20
-.02
.08
.20
.23
.38
.39
GAM2
.31
.10
.21
.18
.16
.14
.10
.27
.10
.18
.16
.06
.02
.20
.44
.10
.43
GAM3
.16
.08
.13
.19
.15
−.04
.16
.10
.10
.05
.16
.50
.22
.04
−.02
.12
.15
GAM4
.29
.30
.12
.25
.15
.25
.14
.28
.16
.11
.11
.09
.26
.36
.08
.34
.16
GAM5
.25
.15
.16
.27
.11
.06
.14
.10
.04
.04
.06
.10
.28
.16
−.02
.21
.16
GAM6
.36
.12
.13
.04
.02
.12
.16
.38
.16
.15
.06
.10
.10
.07
.11
.21
.16
GAM7
.25
.17
.16
.28
.26
.09
−.11
.23
.15
.08
.21
−.07
.20
.64
.06
.25
.06
GAM9
.13
.15
.04
.15
.09
.13
.11
.06
.06
−.03
.03
.43
.07
.15
−.09
−.02
.20
GAM10
.49
.17
.12
.25
.18
.35
.36
.02
.26
.33
.20
.07
.23
.32
.21
.50
.30
GAM11
.23
.20
.09
.21
.17
.08
.12
.14
.21
.11
.16
.13
.12
.23
.02
.18
.33
GAM12
.07
.05
.08
−.02
.02
−.04
.17
−.15
.22
−.00
.17
.01
.13
.05
.10
.45
.20
GAM13
.16
.02
.24
.14
−.05
.14
.25
−.01
.17
.06
.18
.17
.26
.18
.13
.26
.16
GAM14
.18
.17
.52
.23
.12
.07
.27
.22
.02
.19
.03
.15
.34
.15
−.03
−.01
.19
GAM15
.19
.03
.32
.33
.16
−.04
.22
−.01
.11
.09
.28
.28
.31
.36
.01
.34
.12
GAM16
.17
.11
.23
.32
.24
.09
.66
-.01
.34
.16
.14
.19
.27
.45
.12
.27
.21
GAM17
.09
.41
.03
.19
−.09
.02
.18
.03
.12
−.03
.05
−.05
.17
.04
.16
.09
.21
GAM19
.43
.22
.05
.33
.27
.13
.27
.01
.58
.13
.28
.37
.10
.33
.39
.17
.15
GAM20
.41
.44
.13
.27
.31
.18
.20
.19
.26
.33
.06
.15
.22
.12
.17
.27
.26
440 S. der Sluis et al. / Intelligence 38 (2010) 433–446
identification. These constraints did however result in asignificant deterioration of the model fit (Model 3 vs Model 2:χdiff2 (9)=23.61, pb .01), implying that not all threshold
differences observed between men and women could beaccounted for by differences on the level of the factors. Themodification indices indicated that themisfitwasmainly due toitem 4. Note that this is the diligence item for which the largesteffect sizewas observed in the item-specific analyses (Table 1).In Model 3a, we constrained all thresholds equal across sexexcept the thresholds of item 4. This set of constraints did notresult in a significant drop in model fit (Model 3a vs Model 2:χdiff2 (8)=9.23, ns). For theAAM, strong factorial invariancewas
thus established for 9 out of 10 items, while the sex differenceon item AAM4 was too large to be accounted for by the model,i.e., this item is biased in the context of this model. In thesubsequent models, the thresholds for item 4 were thereforeestimated freely in both groups. Note that free estimation of thethresholds for this item implies that this item no longercontributes to the estimation of the differences between menand women in the mean of the latent factor Dedication (Byrne,Shavelson, &Muthén, 1989). Themean of the Dedication factorwas thus not biased, but directly comparable betweenmen andwomen.
Strict factorial invariancewas tested inModel4by restrictingall residuals in the women to be equal to the residuals inthe male reference group, i.e., equal to 1. The fit did notdeteriorate significantly (Model 4 vs Model 3a: χdiff
2 (8)=9.14,ns), implying that strict factorial invariancewas tenable. Table 8shows the factorial correlations and factor means taken fromModel 4 for men and women separately.
Given that the factor model was invariant across sex, wecould subsequently meaningfully test whether men andwomen differed with respect to the means of the two factors,Persistence and Dedication. InModel 4, the factormeanswerefixed to 0 in the male reference group for reasons ofidentification, while they were freely estimated in women,such that these estimates can be considered deviations fromthe factor means of the men. In Model 5, the mean of thePersistence factor was fixed to 0 in women, which did notresult in a significant drop in model fit (Model 5 vs Model 4:χdiff2 (1)=2.36, ns), meaning that men and women did not
differ significantly with respect to persistence. In Model 6, the
Table 5Geomin rotated (oblique) exploratory factor solution for the 10 academicachievement motivation (AAM) items for men and women separately.
Men (N=338) Women (N=497)
Factor 1 Factor 2 Factor 1 Factor 2
Dedication Persistence Dedication Persistence
AAM1 .313 .412 .374 .405AAM2 −.231 .829 .038 .514AAM3 .634 .013 .695 −.017AAM4 .613 .088 .723 .085AAM5 .637 .096 .629 .086AAM6 .056 .692 .000 .823AAM7 .878 −.128 .812 −.004AAM8 .013 .629 −.146 .734AAM9 .005 .662 .185 .516AAM10 .377 .260 .192 .497
Note: Factor loadings in bold print are estimated freely in the subsequentconfirmatory multi-group covariance and means structure analyses.
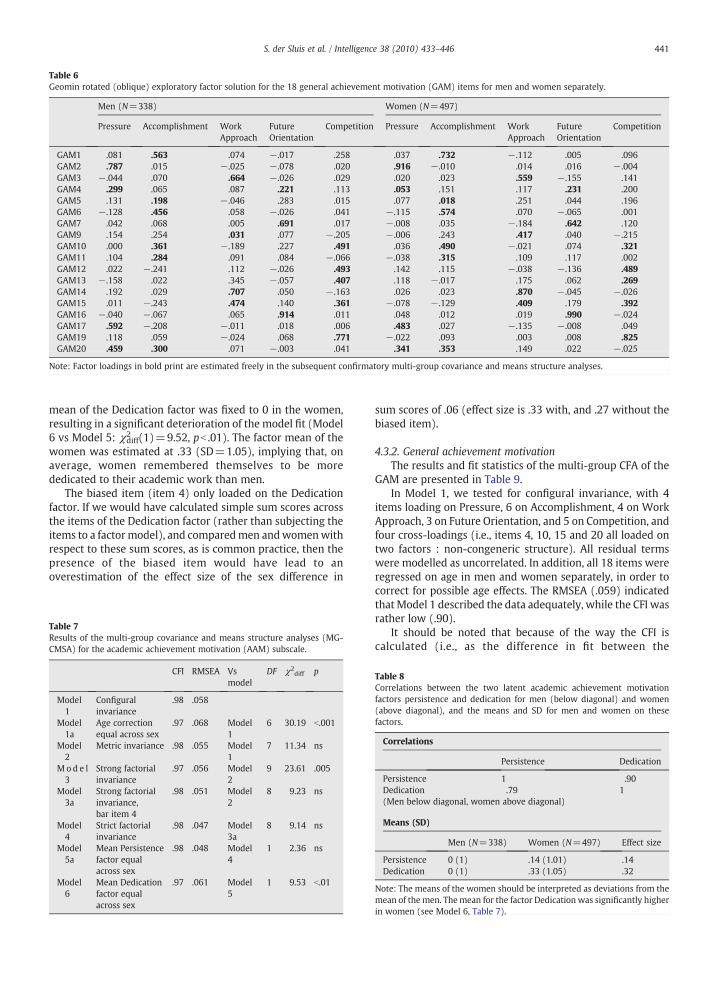
Table 6Geomin rotated (oblique) exploratory factor solution for the 18 general achievement motivation (GAM) items for men and women separately.
Men (N=338) Women (N=497)
Pressure Accomplishment WorkApproach
FutureOrientation
Competition Pressure Accomplishment WorkApproach
FutureOrientation
Competition
GAM1 .081 .563 .074 −.017 .258 .037 .732 −.112 .005 .096GAM2 .787 .015 −.025 −.078 .020 .916 −.010 .014 .016 −.004GAM3 −.044 .070 .664 −.026 .029 .020 .023 .559 −.155 .141GAM4 .299 .065 .087 .221 .113 .053 .151 .117 .231 .200GAM5 .131 .198 −.046 .283 .015 .077 .018 .251 .044 .196GAM6 −.128 .456 .058 −.026 .041 −.115 .574 .070 −.065 .001GAM7 .042 .068 .005 .691 .017 −.008 .035 −.184 .642 .120GAM9 .154 .254 .031 .077 −.205 −.006 .243 .417 .040 −.215GAM10 .000 .361 −.189 .227 .491 .036 .490 −.021 .074 .321GAM11 .104 .284 .091 .084 −.066 −.038 .315 .109 .117 .002GAM12 .022 −.241 .112 −.026 .493 .142 .115 −.038 −.136 .489GAM13 −.158 .022 .345 −.057 .407 .118 −.017 .175 .062 .269GAM14 .192 .029 .707 .050 −.163 .026 .023 .870 −.045 −.026GAM15 .011 −.243 .474 .140 .361 −.078 −.129 .409 .179 .392GAM16 −.040 −.067 .065 .914 .011 .048 .012 .019 .990 −.024GAM17 .592 −.208 −.011 .018 .006 .483 .027 −.135 −.008 .049GAM19 .118 .059 −.024 .068 .771 −.022 .093 .003 .008 .825GAM20 .459 .300 .071 −.003 .041 .341 .353 .149 .022 −.025
Note: Factor loadings in bold print are estimated freely in the subsequent confirmatory multi-group covariance and means structure analyses.
441S. der Sluis et al. / Intelligence 38 (2010) 433–446
mean of the Dedication factor was fixed to 0 in the women,resulting in a significant deterioration of the model fit (Model6 vs Model 5: χdiff
2 (1)=9.52, pb .01). The factor mean of thewomen was estimated at .33 (SD=1.05), implying that, onaverage, women remembered themselves to be morededicated to their academic work than men.
The biased item (item 4) only loaded on the Dedicationfactor. If we would have calculated simple sum scores acrossthe items of the Dedication factor (rather than subjecting theitems to a factor model), and comparedmen andwomenwithrespect to these sum scores, as is common practice, then thepresence of the biased item would have lead to anoverestimation of the effect size of the sex difference in
Table 7Results of the multi-group covariance and means structure analyses (MG-CMSA) for the academic achievement motivation (AAM) subscale.
CFI RMSEA Vsmodel
DF χ2diff p
Model1
Configuralinvariance
.98 .058
Model1a
Age correctionequal across sex
.97 .068 Model1
6 30.19 b.001
Model2
Metric invariance .98 .055 Model1
7 11.34 ns
M o d e l3
Strong factorialinvariance
.97 .056 Model2
9 23.61 .005
Model3a
Strong factorialinvariance,bar item 4
.98 .051 Model2
8 9.23 ns
Model4
Strict factorialinvariance
.98 .047 Model3a
8 9.14 ns
Model5a
Mean Persistencefactor equalacross sex
.98 .048 Model4
1 2.36 ns
Model6
Mean Dedicationfactor equalacross sex
.97 .061 Model5
1 9.53 b.01
sum scores of .06 (effect size is .33 with, and .27 without thebiased item).
4.3.2. General achievement motivationThe results and fit statistics of the multi-group CFA of the
GAM are presented in Table 9.In Model 1, we tested for configural invariance, with 4
items loading on Pressure, 6 on Accomplishment, 4 on WorkApproach, 3 on Future Orientation, and 5 on Competition, andfour cross-loadings (i.e., items 4, 10, 15 and 20 all loaded ontwo factors : non-congeneric structure). All residual termswere modelled as uncorrelated. In addition, all 18 items wereregressed on age in men and women separately, in order tocorrect for possible age effects. The RMSEA (.059) indicatedthat Model 1 described the data adequately, while the CFI wasrather low (.90).
It should be noted that because of the way the CFI iscalculated (i.e., as the difference in fit between the
Table 8Correlations between the two latent academic achievement motivationfactors persistence and dedication for men (below diagonal) and women(above diagonal), and the means and SD for men and women on thesefactors.
Correlations
Persistence Dedication
Persistence 1 .90Dedication .79 1(Men below diagonal, women above diagonal)
Means (SD)
Men (N=338) Women (N=497) Effect size
Persistence 0 (1) .14 (1.01) .14Dedication 0 (1) .33 (1.05) .32
Note: The means of the women should be interpreted as deviations from themean of the men. Themean for the factor Dedication was significantly higherin women (see Model 6, Table 7).

Table 9Results of the multi-group covariance and means structure analyses (MG-CMSA) for the general achievement motivation (GAM) subscale.
CFI RMSEA Vsmodel
DF χdiff2 p
Model1
Configuralinvariance
.90 .059
Model1a
Age correctionequal across sex
.90 .058 Model 1 13 28.44 b.01
Model2
Metric invariance .91 .057 Model 1 14 21.63 ns
Model3
Strong factorialinvariance
.90 .059 Model 2 18 67.61 b.001
Model3a
Strong factorialinvariance,bar items 4, 5,9, and 12
.91 .056 Model 2 15 25.61 .04
Model4
Strict factorialinvariance
.90 .057 Model3a
15 50.08 b.001
Model4a
Strict factorialinvariance barresiduals items6 and 12
.91 .055 Model3a
15 23.83 ns
Model5
Factorial meansequal across sex
.91 .054 Model4a
4 7.86 ns
Model5a
Factorial meansequal across sexbar for factorsFuture Orientationand Competition
.92 .053 Model4a
3 .92 ns
442 S. der Sluis et al. / Intelligence 38 (2010) 433–446
independence model and the hypothesized model), this fitindex can never take on high values if the intercorrelationsbetween the modelled items are small to begin with. In thatcase, the fit of the independence model will not be very bad,and the differencewith the hypothesizedmodel can thereforenot become large. Experience thus teaches that the CFI isnever high when the intercorrelations between the modelleditems are low overall, and in the present data, manyintercorrelations were smaller than .20. As the RMSEAindicated adequate fit, and the residual terms (i.e., the partof the data not predicted by the model) were all small, Model1 was accepted as baseline model for further testing formeasurement invariance across sex.
In Model 1a, we tested whether the age effects could beconstrained equal across sex, but as this was not the case(Model 1a vs Model 1: χdiff
2 (13)=28.44, pb .01), we chose toleave this part of the model saturated. That is, all ageregressions are estimated separately in men and women inall following models, and this part of the model did thereforenot contribute to any model misfit.
Metric invariance was tested inModel 2 by fixing all factorloadings to be equal across sex. Factorial variances wereestimated freely in the women, but remained fixed to 1 in themale reference group for identification. This set of constraintsproved tenable (Model 2 vs Model 1: χdiff
2 (14)=21.63, ns),implying that metric invariance across sexwas tenable for theGAM subscale.
To test for strong factorial invariance, all thresholds wereconstrained to be equal across sex in Model 3. This set ofconstraints, however, resulted in a significant deterioration ofthemodel fit (Model 3 vsModel 2:χdiff
2 (18)=67.61, pb .001).By systematically testing for strong factorial invariance foreach of the 5 factors separately, it appeared that 4 of the 18
items (items 4, 5, 9, and 12) were biased with respect to sex.Note that in the item-specific analyses (Table 3), large effectsizes were observed for items GAM4 and GAM9. The effectsizes for items GAM5 and GAM12 were smaller, but the factorloadings for these items were not that large (althoughsignificant), meaning that these items were not stronglyrelated to the latent factors. Constraining all thresholds, barthe thresholds of these 4 items, to be equal across sex, did justresult in a significant drop of the model fit (Model 3a vsModel 2: χdiff
2 (15)=25.61, p=.04), but as the overall fit ofModel 3a was satisfactory, we accepted this model. For theGAM, strong factorial invariance was thus established for 14out of 18 items, while sex differences on 4 items were toolarge to be accounted for by the model. In the subsequentmodels, the thresholds of these 4 items were thereforeestimated freely in both groups, and as such no longercontributed to the means of the underlying latent factors. Themeans of these factors were thus directly comparablebetween men and women.
In Model 4 we tested for strict factorial invariance, byconstraining all residual variances in the women equal tothose of the male reference group, i.e., equal to 1. Theseconstraints were however not tenable (Model 4 vs Model 3a:χdiff2 (15)=50.08, pb .001). In Model 4a, all residuals except
the residual for item 12, were fixed to be equal in men andwomen, and this set of constraints was tenable (Model 4a vsModel 3a: χdiff
2 (15)=23.83, ns). This implies that thereliability of item 12 was not equal across sex: the residualvariance was smaller in women, implying that the reliabilityof this item was higher in women. Table 10 shows the factorcorrelations and factor means taken from Model 4a for menand women separately.
Given that the greater part of the factor model wasinvariant across sex, while the parts that were not were freelyestimated and thus no longer contributed to any sexdifferences, we could now meaningfully compare the fivefactor means across sex. In Model 4a, all factor means in thewomen's group were freely estimated while the factor meansin the male reference groups were fixed to 0 for reasons ofidentification. In Model 5, we fixed all factor means to 0 in thewomen. This did not result in a significant drop in model fit(Model 5 vs Model 4a: χdiff
2 (4)=7.86, p=.10). However, thisomnibus test disguised what was already apparent from theeffect sizes shown in Table 10, namely the fact that themean of the factor Future Orientation was actually signifi-cantly different between men and women (Future Orienta-tion: χdiff
2 (1)=5.67, pb .05) while a trend was observed forthe factor Competition (χdiff
2 (1)=3.22, p=.07). In the finalmodel, Model 5a, we freely estimated these means in thewomen, and fixed the means of the other three factors to zero(Model 5a vs Model 4a: χdiff
2 (3)=.92, ns). The means of thefactors Future Orientation and Competition were negative inwomen, implying that women were somewhat less future-oriented, and less driven by motives related to competitionwith others.
The four biased items (4, 5, 9, and 12) affected all factors ofthe GAM. Ifwewould have calculated simple sum scores acrossthe items of each of the five factors (rather than subjecting theitems to a factor model), and compared men and women withrespect to these sum scores, as is common practice, then thepresence of the biased items would have lead to considerable

Table 10Correlations between the five latent general achievement motivation factors pressure, accomplishment, work approach, future orientation and competition formen (below diagonal) and women (above diagonal), and the means and SD for men and women on these factors.
Correlations
Pressure Accomplishment Work Approach Future Orientation Competition
Pressure 1 .50 .13 .19 .29Accomplishment .44 1 .26 .41 .60Work Approach .25 .33 1 .14 .13Future Orientation .23 .44 .43 1 .50Competition .20 .50 .16 .57 1(Men below diagonal, women above diagonal)
Means (SD)
Men (N=338) Women (N=497) Effect size
Pressure 0 (1) .08 (.84) .09Accomplishment 0 (1) .02 (1.06) .02Work approach 0 (1) .05 (1.00) .05Future orientation 0 (1) -.22 (.85) -.24Competition 0 (1) -.18 (.70) -.22
Note: The means of the women should be interpreted as deviations from the mean of the men. The mean for the factor Future Orientation is significantly lower inwomen, and a trend towards significance was observed for the factor Competition.
443S. der Sluis et al. / Intelligence 38 (2010) 433–446
over- or underestimation of the effect sizes of the sex differencefor the factors Pressure (effect size with the biased item: .05,effect size without the biased item: −.13, difference: −.18),Accomplishment (with: .03, without: .00, difference: −.03),Work Approach (with: .08, without: −.01, difference:−.09), Future Orientation (with: .29, without:.14, difference:−.15), and Competition (with: .02, without: .08, difference:.06).
Finally, in order to estimate the correlations between theacademic and the general achievement motivation factors,we combined the final models from the AAM (Model 5) andthe GAM (Model 5a) into one overall model. The fit of thismodel, which we denoted the Total Model, was adequate(CFI=.92, RMSEA=.053), and the correlations between the7 subscales are shown in Table 11. All correlations betweenthe AAM factors and the GAM factors were positive and mostof themwere significant. Note that themodification indices ofthe Total Model were all small, as were the residuals (i.e., thepart not explained by the model), which implies that thechoice to analyze the AAM and the GAM subscales separatelybefore combining them, was justified (i.e., there were nocross-loading between the AAM and the GAM factors, and nocorrelated errors, etc).
Table 11Correlations between the two latent academic achievement motivationfactors and the five general achievement motivation factors for men andwomen separately.
Men Women
Persistence Dedication Persistence Dedication
Pressure .06 .11 .07 .25**Accomplishment .39** .33** .46** .58**Work approach .37** .20** .42** .32**Future orientation .18* .13† .13† .14*Competition .18* .32** .15* .36**
Note: Signs denote the significance of the observed correlations: ** pb .01,* pb .05, † pb .08
5. Discussion
In this study, sex differences in academic achievementmotivation and general achievement motivation were exam-ined in adult subjects using categorical multi-group covari-ance and mean structure analysis (MG-CMSA).
Academic achievement motivation was measured with 10items. A two-factor solution, with factors Dedication andPersistence, described the relations between these itemsadequately. On the level of the latent factors, men andwomendiffered significantly with respect to the mean of the factorDedication, with women considering themselves to havebeen more dedicated to their academic work than men. Nomean difference was observed for the factor Persistence, i.e.,men and women did not differ in their retrospectiveevaluation of how well they had been able in their schoolyears to allocate time to, and focus on, homework. Thequestionnaire, of which the DAMTwas part, also included tworetrospective questions on whether the parents of theparticipants had considered school important, and whetherthe participants' school results were discussed at home. Themen and women in this study did not respond differently tothese questions (Z=−1.74, ns, and Z=−.71, ns, respective-ly). This suggests that the differences in Dedication observedbetween men and women in this study were most likely notdue to a difference in how they experienced their academicupbringing. One academic achievement motivation itemproved biased with respect to sex, i.e., the sex difference onthis item was too large to be explained by the underlyinglatent factor Dedication, and this item-specific sex differencewas not indicative of a sex difference in Dedication. On thisitem, which concerned the question of whether others hadthought the participant to be diligent in school, womenscoredmuch higher thanmen, i.e., women thought they wereperceived as more diligent by others.
General achievement motivation was measured with 18items. A five-factor solution, with factors Pressure, Accom-plishment, Work approach, Future Orientation, and Competi-tion, described the relations between those items adequately.

444 S. der Sluis et al. / Intelligence 38 (2010) 433–446
On the level of the latent factors, sex differences were observedfor the factors Future Orientation and a trendwas observed forthe factor Competition. On both factors, women scored lowerthan men. This means that women cogitated less about thefuture and made less future-related plans, compared to men,and achievingmore than others was considered less importantby women compared to men. Men and women did not differwith respect to the means of the factors Pressure, Accomplish-ment, andWorkapproach, i.e.,menandwomendidnot differ intheir perception of how occupied they are by their work, intheir assessment of thedemands theyput on themselves, and intheir evaluation of how importantwork/employment is in theirlives. Four of the 18 general achievement motivation itemswere biasedwith respect to sex, i.e., the sex difference observedon the items were not indicative of the sex difference on theunderlying factors. On three of the four items, women scoredlower thanmen:women aspired less after a busymanagementjob at a factory (item 4), were less often of the opinion thatother people could work harder (item 5), and perceivedworking on something for a long time as more tiring (item 9).At the same time, women were more concerned about otherpeoples' opinion about their achievements thanmen (item12).It should be noted that in the exploratory factor analysis, thepattern of factor loadings for some of the biased items differedbetween men and women. In MG-CMSA, item bias is definedwithin the context of a specific factor model, i.e., an item isconsidered biased if themeandifferencesobserved for this itemcannot be explained by the specifiedmodel. This means that intheory, bias can originate frommodelmisspecification in one ofthe groups. To verify whether this was the case, we ranalternative models in which the biased items were allowed toload on other factors as well. The bias however remainedsignificant, implying that it was not the result of misspecifica-tions in the factor structure.
In our analyses, we chose to leave items for which the biaswas uniform (i.e., limited to the intercepts) in the model. Thisstrategy is justified as uniformly biased items no longercontribute to the misfit of the model when their interceptsare freely estimated and thus allowed to vary across thegroups. This strategy is, however, not recommended whenthe bias is non-uniform (implying significant differences infactor loadings between groups). In that case, one shouldremove the item from themodel before testing for strong andstrict measurement invariance.
Individual items which clearly showed differences inendorsement rates between the sexes were indeed flagged asbiased in the MG-CMSA analyses. However, although thesample sizes in our study were considerable (N=338 andN=497, respectively), the statistical power to detect meandifferences betweengroups on the level of the latent factorswasnot optimal. For example, even though the sex difference in thefactor Competition was associated with an effect size of −.22,the effect was only marginally significant (p=.07).
These results show that items that measure motivation-related concepts can be biasedwith respect to sex. It is possiblethat the sex difference on these items was just too large tobe accounted for by underlying latent factors (i.e., the sexdifference is item specific), but it is also possible that theconnotationof these itemswasdifferent formen andwomen tosuch an extent that the responses of men and women on thebiased items were actually incomparable. MG-CMSA can only
point out the location of the bias, but further research into thecontent and interpretation of these items would be required touncover the exact nature of the bias. The present results are ofcourse limited to these specific academic and general achieve-ment motivation subscales of the DAMT. Yet, the study showsthat researchers should be cautious in directly comparingmotivation-related scores of men and women without firststudying their comparability. Our calculations based on sumscores showed that the effect sizes of the sex differences inachievement motivation can be very much affected by thepresence of a few biased items. As a result, sex differences inachievement motivation may be exaggerated or underesti-mated in one study, and may fail to replicate in subsequentstudies, in which different instruments are used to measureachievement motivation.
One advantage of studying academic achievement motiva-tion and general achievement motivation simultaneously isthat one can calculate the correlation between these two typesof motivation. In this study, the two academic achievementmotivation factors and thefivegeneral achievementmotivationfactors correlated positively. Correlations were particularlystrongbetween the2 academic achievementmotivation factorsPersistence and Dedication on the one hand, and the 3 generalachievement motivation factors Accomplishment, Work Ap-proach and Competition on the other.
One disadvantage of studying academic achievementmotivation in an adult population is that such a study is bydefinition retrospective. For some of the participants in oursample, which was particularly heterogeneous with respect toage, the schooldays were a distant past. Retrospective assess-ments of one's own academic achievement motivational levelsmay not always be reliable. The fact that we find clear factorstructures, and significant correlations between academic andgeneral measures of achievementmotivation, suggests that theanswersmust at least have been consistentwithin subjects, buthow reliably such retrospective assessments reflect the pastreality, cannot be answered with the present data.
In this study, age effectswere accounted for bypartiallingoutthe effects of ageon the level of the itemsbeforefitting the factormodels. Of the 28DAMT items, 12 showed significant age effectsin men, and 15 showed significant age effects in women.Moreover, especially for the academic achievement motivationitems, age effects were markedly different for men and women,not only in size (e.g., AAM items 1, 7 and9) but even in sign (e.g.,AAM for items 2 and 5). The aim of this paper was not to studytheeffectof ageonmotivation.We thereforedecided tokeep theage-corrective part of the model saturated, which implies thatthe effects of age were fully controlled for in men and womenseparately, and not studied in more detail. Yet, the finding thatage did affect the responses, and that it did so in a differentmanner for men and women, does suggest that inconsistenciesbetween former studies in whether or not sex differences inmotivationwere observed, andwhethermotivationwas relatedto actual achievement, could be due to differences betweenthese studies in the age range of their study-samples.
The heavy reliance on self-report measures in research onachievement motivation forms another potential source ofbias since subjective and objective evaluations of a person'smotivation, effort and dedication, may not always be inagreement, especially retrospectively. Especially with respectto the Academic Achievement Motivation scale, we

445S. der Sluis et al. / Intelligence 38 (2010) 433–446
emphasize that we measured our participants' personalrecollection of how dedicated and persistent they werewhen they were in school. It is possible that sex bias, suchas observed for the diligence item of the AAM scale,represented a difference between women and men in howthey perceived and recalled reactions from their environment,rather than objective differences in diligence with respect toacademic work. Besides the problems related to self-reportmeasures, the lack of standardized and validated measures ofacademic and general achievement motivation hampers thegeneralizability of results across studies. Still, the present studyshows that MG-CMSA is useful in locating the exact source ofsex differences in motivation, and that the study of item biasmay be advantageous in the field of sex differences inachievement motivation.
The present sample consisted of family data, i.e., twins andtheir (in-law) family members, and one question of interest iswhether twin-samples can be considered representative of thegeneral population. In general, twins are born in all strata ofsociety, and they are on average somewhat more willing toparticipate in research, as are their relatives (Martin, Boomsma,& Machin, 1997). To date, no studies have been performed onwhether twins differ from non-twins in motivation-relatedcharacteristics. At present, there is however no reason tobelieve thatmotivational differences between the sexes shouldbe different for men and women born as twins or coming fromtwin families. Another question of interest is whether the sexdifferences observed in the present sample are representativeof sex differences in the Dutch population. Generally, men andwomen differ in their willingness to participate in research(womenbeing somewhatmorewilling). If this sex difference inwillingness to participate in research is in turn related to, ordependent on, social status or success (i.e., men are morewilling to participate if they are socially more successful, whilewomen's willingness to participate is independent of theirsocial status) then the sex differences observed in achievementmotivation could be a function of the sex difference in thewillingness to participate. In principle, this could be tested bycomparing the within-pair differences in motivation observedbetween opposite sex twins or opposite sex siblings,4 to the sexdifferences observed in unrelated individuals. That is, if the sexdifferences in motivation such as observed across families arealso observed within families (where brothers and sisters arematchedwith respect to social background and social economicstatus), then the possible distortion (due to sex differences inwillingness to participate, or due to studying twins rather thannon-twins) is probably minor. Our family data included 47complete opposite sex twin pairs and opposite sex sibling pairs.Wilcoxon non-parametric signed-rank tests showed that evenwithin this limited number of opposite sex pairs, brothers andsisters scored markedly differently on items AAM4, GAM4 andGAM12,whichwere all labelled as severely biased in this study.The fact that the sex effects as reported in the total samplewere
4 Note that in principle, father–daughter and mother–son relations couldalso be included in the within-family comparisons, in addition to brother–sister relations. The advantage of brother–sister comparisons is, however,that these relatives are of approximately the same age, grew up atapproximately the same juncture, and were nursed under approximatelythe same (social economic) circumstances, i.e., these relatives are matchedwith respect to background variables, while such matching is not as obviousacross generations.
also observed within families, confirms our expectation thatselection effects were absent or minor. Yet, the question ofwhether the development of motivation-related traits isinfluenced by the presence of a co-twin or sibling, does meritfurther study. Such studies could possibly even provide insightinto the origin of sex differences in motivation. Similarly, thequestion ofwhether thewillingness to participate in research isitself related to achievementmotivation is worth following-up.
This studywas thefirst to examinemeasurement invarianceand sex differences in the context of motivational researchusing MG-CMSA in a large sample of adult participants. It wasshown that five motivation items (1 academic, 4 generalachievementmotivation)werebiasedwith respect to sex.Oncethese biased items were effectively removed from the meansmodel, sex difference were still observed for Dedication(academic achievement motivation), and for Future Orienta-tion and Competition (general achievement motivation).Further studies into the nature of the sex bias observed forsome items are merited. In addition, it would be interesting tostudy how the sex differences observed in subjects' self-reported motivation, relate to more objective measures. Forexample, in the present study, sex differenceswere absentwithrespect to the factor Pressure, implying that men and womendo not differ in their perception of the extent to which they areengaged by their work. It would be interesting to relate thissubjective perception to an objective measure such as thenumber of hours of work per week. Such studies could be usedfor validation, but could also enhance our insight into therelation between achievement motivation-related constructson the one hand, and actual achievement on the other.
Acknowledgement
Sophie van der Sluis (VENI-451-08-025) and DaniellePosthuma (VIDI-016-065-318) are financially supported bythe Netherlands Scientific Organization (Nederlandse Orga-nisatie voor Wetenschappelijk Onderzoek, gebiedMaatschappij-en Gedragswetenschappen: NWO/MaGW).
We thank all our test assistants for their help with the datacollection.
Appendix A. DAMT example items
Academic Achievement Motivation (AAM)
Dedication:AAM7: “When I was in school, the demands that I made on
myself concerning studying were very high, high, pretty high,low” (R)
Persistence:AAM8: “When I'm studying, my thoughts often wander /
I'm not easily distracted / I work ceaselessly”
General Achievement Motivation (GAM)
Pressure:GAM2: “Usually, I'm busy / quite busy / not very busy / not
busy at all” (R)

446 S. der Sluis et al. / Intelligence 38 (2010) 433–446
Accomplishment (intrinsic motivation):GAM10: “The urge to surpass myself is very strong / pretty
strong / not very strong” (R)
Work approach:GAM14: “For me, working is something which I would like
to do only occasionally / which I like to do, but whichgenerally takesme a lot of effort / which I always enjoy doing”
Future Orientation:GAM7: “When thinking about my future, I usually plan
very far ahead / plan far ahead / I plan ahead quite a bit / I donot usually plan ahead very far” (R)
Competition:GAM19: “Achieving more than others, is very important
for me / is important for me / is quite important for me / is notthat important for me” (R)
References
Bentler, P.M. (1990). Comparativefit indixes in structuralmodels. PsychologicalBulletin, 107, 238−246.
Bollen, K., & Long, J. S. (Eds.). (1993). Testing structural equation models.Newbury Park, CA: Sage.
Boomsma, D. I., de Geus, E. J. C., Vink, J. M., Stubbe, J. H., Distel, M. A., Hottenga,J. H., et al. (2006). Netherlands twin register: From twins to twin families.Twin Research and Human Genetics, 9(6), 849−857.
Browne, M.W., & Cudeck, R. (1993). Alternative ways of assessing model fit. InK. A. Bollen, & J. S. Long (Eds.), Testing structural equation models(pp. 136−162). Newbury Park, CA: Sage.
Byrne, B.M., Shavelson, R. J., &Muthén, B. (1989). Testing for the equivalence offactor covariance and mean structures: The issue of partial measurementinvariance. Psychological Bulletin, 105, 456−466.
CITO Terugblik en resultaten 2009 - Eindtoets Basisonderwijs, versie februari27, 2009.
de Knecht-van Eekelen, A., Gille, E., & van Rijn, P. (2007). Resultaten PISA 2006.Praktische kennis en vaardigheden van 15-jarigen. Nederlandse uitkom-stenvanhetOESOProgramme for International Student Assessment (PISA)op het gebied van natuurwetenschappen, leesvaardigheid en wiskunde inhet jaar 2006.
Dolan, C. V., Colom, R., Abad, F. J., Wicherts, J., Hessen, D. J., & van der Sluis, S.(2006). Multi-group covariance and mean structure modeling of therelationshipbetweenWAIS-III common factors andgenderandeducationalattainment in Spain. Intelligence, 34(2), 193−210.
Dolan, C. V., & Hamaker, E. L. (2001). In F. Columbus (Ed.), Investigating balck-white differences in psychometric IQ: Multi-group confirmatory factor analyesof the WISC-R and K-ABC and a critique of the method of correlatedvectorsAdvances of Psychological Research, vol. 6. (pp. 31−59) Huntington:Nova Science Publishers.
Epstein, D., Elwood, J., Hey, V., & Maw, J. (Eds.). (1998). Failing boys? Issues ingender and achievement. Buckingham: Open University Press.
Freudenthaler, H. H., Spinath, B., & Neubauer, A. C. (2008). Predicting schoolachievement inboys andgirls. European Journal of Personality,22, 231−245.
Hermans, H. J. M. (2004). Prestatie Motivatie Test, Handleiding. Lisse: HarcourtAssessment B.V.
Horn, J. L., & McArdle, J. J. (1992). A practical and theoretical guide tomeasurement invariance in aging research. Experimental Aging Research,18, 117−144.
Hu, L. T., & Bentler, P. M. (1999). Cutoff criteria for fitindexes in covariancestructure analysis: Conventional criteria versus new alternatives.Structural Equation Modelling, 6(1), 1−55.
Gagné, F., & St Père, F. (2001). When IQ is controlled for, does motivation stillpredict achievement? Intelligence, 30, 71−100.
Grant, L., & Rong, X. L. (1999). Gender, immigrant generation, ethnicity, andschooling progress of youth. Journal of Research and Development inEducation, 33, 15−26.
Jöreskog, K. G. (1993). Testing structural equation models. In K. A. Bollen &J.S. Long (Eds.), Testing structural equation models (pp. 294−316).Newbury Park, CA: Sage.
Little, T. D. (1997). Mean and covariance structures (MACS) analysis of cross-cultural data: practical and theoretical issues. Multivariate BehavioralResearch, 32, 53−76.
Martin, N., Boomsma, D., & Machin, G. (1997). A twin-pronged attack oncomplex traits. Nature Genetics, 17(4), 387−392.
Meece, J. L., Glienke, B. B., & Burg, S. (2006). Gender andmotivation. Journal ofSchool Psychology, 44, 351−373.
Mellenbergh, G. J. (1989). Item Bias and Item Response Theory. InternationalJournal of Educational Research, 13, 127−143.
Meredith, W. (1993). Measurement invariance, factor analysis, and factorialinvariance. Psychometrika, 58(4), 525−543.
Millsap, R. E., & Yun-Tein, J. (2004). Assessing factorial invariance in ordered-categorical measures. Multivariate Behavioral Research, 39(3), 479−515.
Muthén, L. K., &Muthén, B. O. (1998-2007).Mplus user's guide, Fourth EditionLos Angeles, CA: Muthén & Muthén.
Rosenthal, R. (1991). Meta-analytic procedures for social research (revised).Newbury Park, CA: Sage.
Satorra, A. (2000). Scaled and adjusted restricted tests in multi-sampleanalysis of moment structures. In R. D. H. Heijmans, D. S. G. Pollock, & A.Satorra (Eds.), Innovations in multivariate statistical analysisA Festschriftfor Heinz Neudecker. (pp. 233−247) London: Kluwer AcademicPublishers.
Schermelleh-Engel, K., Moosbrugger, H., & Müller, H. (2003). Evaluating thefit of structural equation models: Test of significance and descriptivegoodness-of-fit measures. Methods of Psychological Research, 8(2),23−74.
Sörbom, D. (1974). A general method for studying differences in factormeans and factor structure between groups. British Journal of Mathe-matical and Statistical Psychology, 27, 229−239.
Spinath, B., Spinath, F. M., Harlaar, N., & Plomin, R. (2006). Predicting schoolachievement from general cognitive ability, self-perceived ability, andintrinsic value. Intelligence, 34, 363−374.
Steinmayr, R., & Spinath, B. (2008). Sex differences in school achievement:What are the roles of personality and achievement motivation? EuropeanJournal of Personality, 22, 185−209.
Steinmayr, R., & Spinath, B. (2009). The importance of motivation as apredictor of school achievement. Learning and Individual Differences, 19,80−90.
Van der Sluis, S., Posthuma, D., Dolan, C. V., Boomsma, D. I., de Geus, E. J. C.,Colom, R., et al. (2006). Gender differences on the Dutch WAIS-IIIR.Intelligence, 34(3), 273−289.
Van der Sluis, S., Derom, C., Thiery, E., Bartles, M., Polderman, T. J. C., Verhulst,F. C., et al. (2008). Sex differences on the WISC-R in Belgium and theNetherlands. Intelligence, 36, 48−67.
Houtte, Van (2004). Why boys achieve less at school than girls: Thedifference between boys' and girls' academic culture. Educational Studies,30(2), 159−173.
Wicherts, J. M., Dolan, C. V., Hessen, D. J., Oosterveld, P., van Baal, G. C. M.,Boomsma, D. I., et al. (2004). Are intelligence tests measurement invariantover time? Investigating the nature of the Flynn effect. Intelligence, 32(5),509−537.
Widaman, K. F., & Reise, S. P. (1997). Exploring the measurement invarianceof psychological instruments: Applications in the substance use domain.In K. J. Bryant & M. Windle (Eds.), The science of prevention:Methodological advances from alcohol and substance abuse research(pp. 281−324). Washington, DC: American Psychological Association.
Wong, K. -C., Lam, Y. R., & Ho, L. -M. (2002). The effect of schooling on genderdifferences. British Educational Research Journal, 28, 827−843.
Related Documents