Welcome message from author
This document is posted to help you gain knowledge. Please leave a comment to let me know what you think about it! Share it to your friends and learn new things together.
Transcript


1
ABBREVIATIONS AND SYMBOLS
g gram
μL micro liter
ºC degree Celsius
% percentage
ppm parts per millions
mg/L milligrams per liter
hrs. Hours
mins Minutes
mM millimolar
N Normality
M Molarity
Tur Turbiduty
D.W. distilled water
B.R. Burette reading
ST sample taken
SS Suspended solids
TDS total dissolved solids
COD chemical oxygen demand
2
BOD biochemical oxygen demand
DO dissolved oxygen
TC total coliform
FC faecal coliform
E.coli. Escherichia coli
MPN most probable number
FAS ferrous ammonium sulphate
O.D. Optical Density
nm nanometer
STD standard
3
CONTENT
Chapter Page No.
1. Introduction 5 – 17
2. Materials & Methods 18 – 34
4. Results & Discussion 35 – 47
References 48 – 49
List of Tables
Table:1 Physical & Microbial parameter of Site 1 from
final outlet35
Table:2 Physical & Microbial parameter of Site 2 from
final outlet35
Table:3 Physical & Microbial parameter of Site 3 from
final outlet36
Table:4 Physical & Microbial parameter of Site 4 from
final outlet36
Table:5 Physical & Microbial parameter of Site 5 from
final outlet37
Table:6 Physical & Microbial parameter of Site 6 from
final outlet37
Table:7 Physical & Microbial parameter of Site 7 from
final outlet38
Table:8 Physical & Microbial parameter of Site 8 from
final outlet38
Table:9 Physical & Microbial parameter of Site 9 from
final outlet39
Table:10 Physical & Microbial parameter of Site 10 from
final outlet39
Table:11 Physical & Microbial parameter of Site 11 from
final outlet40
4
Table:12 Physical & Microbial parameter of Site 12 from
final outlet40
Table:13 Physical & Microbial parameter of Site 13 from
final outlet41
Table:14 Physical & Microbial parameter of Site 14 from final outlet
41
Table:15 Physical & Microbial parameter of Site 15 from
final outlet42
Table:16 Physical & Microbial parameter of Site 16 from
final outlet42
Table:17 Physical & Microbial parameter of Site 17 from
final outlet43
Table:18 Physical & Microbial parameter of Site 18 from
final outlet43
Table:19 Physical & Microbial parameter of Site 19 from
final outlet44
Table:20 Physical & Microbial parameter of Site 20 from
final outlet44
5
CHAPTER: 1 INTRODUCTION
1.1 ENVIRONMENT
"Environment is surrounding atmosphere/ condition for
existence" OR "Environment is an essential natural process
or an outcome of occurrence"
It means, our Environment is our surrounding which includes
living and non-living things around us. The non-living
components of environment are land, water and air. The living
components are germs, plants, animals and people. Due to our
selfish purposes we create disturbances in it and thus, as a result
imbalance in nature can be seen from few decades which is
increased with the increase of time. The main cause of imbalance
is pollution, which may be produced due to different
anthropogenic activities. Here we are going to discuss on
pollution, types of pollution and its effects on plants and animals
with the assessment of aqueous sample by different parameters.
1.2 POLLUTION
Pollution is the introduction of contaminants into a natural
environment that causes instability, disorder, harm or discomfort to
the ecosystem, physical systems or living organisms. Pollution can
take the form of chemical substances or energy, such as noise, heat
or light. Pollutants, the components of pollution, can be either
foreign substances/energies or naturally occurring contaminants.
1.2.1 Environmental pollution is any discharge of material or
energy into water, land, or air that causes or may cause acute
6
(short-term) or chronic (long-term) detriment to the Earth's
ecological balance or lowers the quality of life. Or any
unfavourable change or degeneration in the environment is
known as Environmental Pollution.
1.2.2 Pollutant: A pollutant is a waste material that pollutes air,
water or soil. Three factors determine the severity of a pollutant:
its chemical nature, the concentration and the persistence.
1.3 WATER is one of the most important elements on earth.
Every living being needs water for its survival. Without water,
plants, animals, microbes– everything will perish. Population
growth - coupled with industrialization and urbanization has
resulted in an increasing demand for water thus leading to water
crisis and serious consequences on the environment. The
requirement of fresh water for industrial use will increase from
30 BCM (Billion Cubic Meters) to 120 BCM by 2025 AD. A
rapid industrialization has lead to the industrial effluents and
sewage, resulting in water pollution which leads to water crisis in
India and all over the world.
1.3.1 WATER POLLUTION, by the discharge
of wastewater from the commercial and industrial
waste (intentionally or through spills) into surface waters;
discharges of untreated domestic sewage, and chemical
contaminants, such as chlorine, from treated sewage; release of
waste and contaminants into surface runoff flowing to surface
waters (including urban runoff and agricultural runoff, which
may contain chemical fertilizers and pesticides); waste disposal
7
and leaching into groundwater; eutrophication and littering. This
process ranges from simple addition of dissolved or suspended
solids to discharge of the most insidious and persistent toxic
pollutants (such as pesticides, heavy metals, and nondegradable,
bio accumulative, chemical compounds).
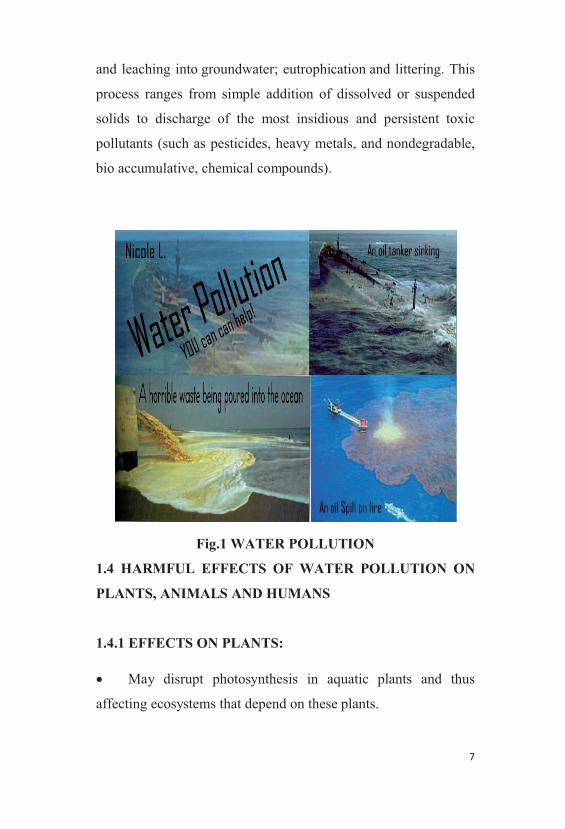
Fig.1 WATER POLLUTION
1.4 HARMFUL EFFECTS OF WATER POLLUTION ON
PLANTS, ANIMALS AND HUMANS
1.4.1 EFFECTS ON PLANTS:
� May disrupt photosynthesis in aquatic plants and thus
affecting ecosystems that depend on these plants.
8
� Terrestrial and aquatic plants may absorb pollutants from
water (as their main nutrient source) and pass them up the food
chain to consumer animals and humans.
� Plants may be killed by too much sodium chloride (ordinary
slat) in water.
� Plants may be killed by mud from construction sites as well
as bits of wood and leaves, clay and other similar materials.
� Plants may be killed by herbicides in water; herbicides are
chemicals which are most harmful to plants.
1.4.2 EFFECTS ON ANIMALS
� Nutrient pollution (nitrogen, phosphates etc) causes
overgrowth of toxic algae eaten by other aquatic animals, and
may cause death
� Oil pollution (as part of chemical contamination) can
negatively affect development of marine organisms, increase
susceptibility to disease and affect reproductive processes; can
also cause gastrointestinal irritation, liver and kidney damage,
and damage to the nervous system.
� Mercury in water can cause abnormal behavior, slower
growth and development, reduced reproduction, and death
Too much sodium chloride (ordinary salt) in water may kill
animals.
9
1.4.3 EFFECTS ON HUMANS
We know that pollution causes not only physical disabilities but
also psychological and behavioural disorders in people. The
following pollution effects on humans have been reported:
a) Waterborne diseases caused by polluted drinking water
� Typhoid
� Amoebiasis
� Giardiasis
� Ascariasis
b) Waterborne diseases caused by polluted beach water:
� Rashes, ear ache, pink eye
� Respiratory infections
� Hepatitis,encephalitis,gastroenteritis,diarrhoea,
vomiting,and stomach ache
c) Conditions related to water polluted by chemicals (such as
pesticides, hydrocarbon, organic pollutants, heavy metals etc):
� Cancer, incl. prostate cancer and non-Hodgkin’s lymphoma
� Hormonal problems that can disrupt reproductive and
developmental processes
� Damage to the nervous system
� Liver and kidney damage
� Damage to the DNA
� Damage to people may be caused by vegetable crops grown
or washed with polluted water .
� The effects of water pollution are not always immediate.
They are not always seen at the point of contamination. They are
10
sometimes never known by the person responsible for the
pollution. However, water pollution has a huge impact on our
lives. With knowledge, consideration and preparation, water
pollution can be decreased. It doesn't take much effort -- just a
little thought
1.5 SEWAGE AND WASTEWATER
� Domestic households, industrial and agricultural practices
produce wastewater that can cause pollution of many lakes and
rivers..
� Waste Water is any water that has been adversely affected
in quality by anthropogenic influence. It is , basically the flow of
used water from a community.
� The nature of wastewater includes physical, chemical, and
biological characteristics which depend on the water usage in the
community, the industrial and commercial contributions,
weather, and infiltration/inflow. It is 99.94 percent water by
weight (Water Pollution Control Federation 1980). The
remaining 0.06 percent is material dissolved or suspended in the
water.
� Sewage is the term used for wastewater that often contains
faeces, urine and laundry waste. It also includes domestic,
municipal, or industrial liquid waste products disposed of,
usually via a pipe or sewer or similar structure, sometimes in
acesspool emptier
� There are billions of people on Earth, so treating sewage is
a big priority.
11
� Sewage disposal is a major problem in developing countries
as many people in these areas don’t have access to sanitary
conditions and clean water.
� Untreated sewage water in such areas can contaminate the
environment and cause diseases such as diarrhoea.
� Sewage in developed countries is carried away from the
home quickly and hygienically through sewage pipes.
� Sewage is treated in water treatment plants and the waste is
often disposed into the sea.
� Sewage is mainly biodegradable and most of it is broken
down in the environment.
� In developed countries, sewage often causes problems when
people flush chemical and pharmaceutical substances down the
toilet. When people are ill, sewage often carries harmful viruses
and bacteria into the environment causing health problems.
Wastewater or sewage can come from:
� Human waste (faces, used toilet paper or wipes, urine, or
other bodily fluids), also known as black water, usually from
lavatories
� Septic tank discharge
� Sewage treatment plant discharge
� Washing water (personal, clothes, floors, dishes, etc.), also
known as grey water or silage;
� Rainfall collected on roofs, yards, hard-standings, etc.
(generally clean with traces of oils and fuel)
� Groundwater infiltrated into sewage
12
� Surplus manufactured liquids from domestic sources
(drinks, cooking oil, pesticides, lubricating, paint, cleaning
liquids, etc.)
� Urban rainfall runoff from roads, car parks, roofs,
sidewalks, or pavements (contains oils, animal faces, litter, fuel
or rubber residues, metals from vehicle exhausts, etc.)
� Direct ingress of manmade liquids (illegal disposal of
pesticides, used oils, etc.)
� Highway drainage (oil, de-icing agents, rubber residues)
� Storm drains (almost anything, including cars, shopping
trolleys, trees, cattle, etc.)
� Black water (surface water contaminated by sewage)
� Industrial waste
� industrial site drainage (silt, sand, alkali, oil, chemical
residues)
� Industrial cooling waters
� Industrial process waters
1.5.2 WASTEWATER CONSTITUENTS
The composition of wastewater varies widely. The partial list is
as follows:
Water ( > 95%) which is often added during flushing to carry
waste down a drain.
� Pathogens such as bacteria (Salmonella and Vibrio cholera)
, viruses (Hepatitis and Norwalk) prions and parasitic worms
(Cryptosporidium and Schistomsoma)
� Non-pathogenic bacteria;
13
� Organic particles such as faeces, hairs, food, vomit, paper
fibres, plant material, humus, etc.;
� Soluble organic material such as urea, fruit sugars, soluble
proteins, drugs, pharmaceuticals, etc.;
� Soluble inorganic material such as ammonia, road-salt, sea-
salt, cyanide, hydrogen sulphide etc.
� Animals such as protozoa, insects, arthropods, small fish,
etc.;
� Macro-solids such as sanitary napkins, nappies/diapers,
needles, children's toys, dead animals or plants, etc.
� Gases such as hydrogen sulphide, carbon dioxide, methane,
etc.;
� Emulsions such as paints, adhesives, mayonnaise, hair
colorants, emulsified oils, etc.;
� Toxins such as pesticides, poisons, herbicides, etc.
� Pharmaceuticals and other hormones.
To treat the discharge water from building and colonies
effectively, we are engaged in offering sewage treatment plant
and effluent treatment plant. These sewage treatment plant and
effluent treatment plant are efficiently assisting in better
treatment of extra polluted water from various industries, housing
complexes, colonies. Our effluent & sewage treatment plants are
functions as per the BOD and COD load and within the
permissible limits. These sewage treatment plant and effluent
treatment plant are appreciated by the clients for safeguarding the
environment from severely polluted water.
14
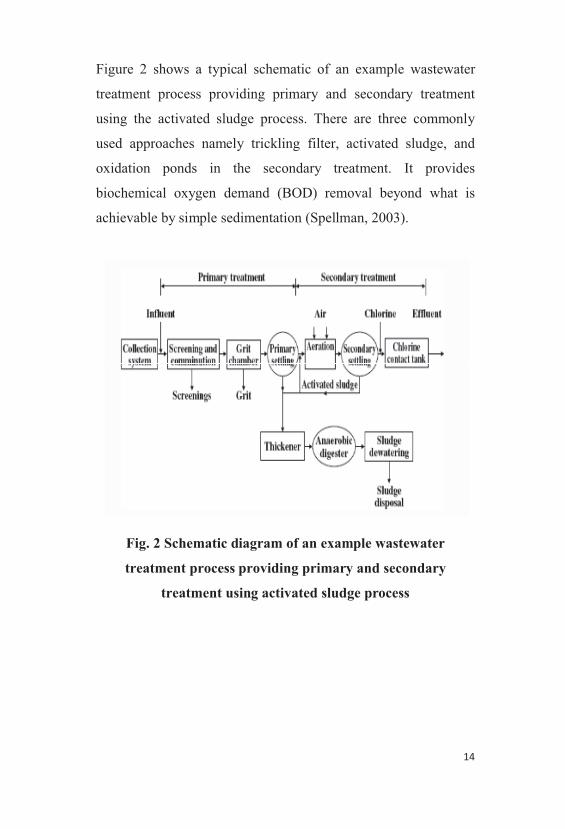
Figure 2 shows a typical schematic of an example wastewater
treatment process providing primary and secondary treatment
using the activated sludge process. There are three commonly
used approaches namely trickling filter, activated sludge, and
oxidation ponds in the secondary treatment. It provides
biochemical oxygen demand (BOD) removal beyond what is
achievable by simple sedimentation (Spellman, 2003).
Fig. 2 Schematic diagram of an example wastewater
treatment process providing primary and secondary
treatment using activated sludge process
15
1.6 STEPS OF SEWAGE TREATMENT PLANT:
Wastewater treatment is a series of steps. Each of the steps can be
accomplished using one or more treatment processes or types of
equipment. The major categories of treatment steps are:
1. PRELIMINARY TREATMENT - Removes materials that
could damage plant equipment or would occupy treatment
capacity without being treated.
2. PRIMARY TREATMENT - Removes settle able and
floatable solids (may not be present in all treatment plants).
3. SECONDARY TREATMENT - Removes BOD and
dissolved and colloidal suspended organic matter by biological
action. Organics are converted to stable solids, carbon dioxide
and more organisms.
4. DISINFECTION - Removes microorganisms to eliminate or
reduce the possibility of disease when the flow is discharged.
1.6.1 PRELIMINARY-TREATMENT:
Pre-treatment removes materials that can be easily collected from
the raw waste water before they damage or clog the pumps and
skimmers of primary treatment clarifiers (trash, tree limbs,
leaves, etc.).
1.6.1.1 SCREENING
The influent sewage water is screened to remove all large objects
like cans, rags, sticks, plastic packets etc. carried in the sewage
stream.
This is most commonly done with an automated mechanically
raked bar screen in modern plants serving large populations,
16
whilst in smaller or less modern plants a manually cleaned screen
may be used.
1.6.1.2 GRIT REMOVAL
Pre-treatment may include a sand or grit channel or chamber
where the velocity of the incoming wastewater is adjusted to
allow the settlement of sand, grit, stones, and broken glass.
1.6.2 PRIMARY TREATMENT:
In the primary sedimentation stage, sewage flows through
large tanks, commonly called "primary clarifiers" or "primary
sedimentation tanks." The tanks are used to settle sludge while
grease and oils rise to the surface and are skimmed off. Primary
settling tanks are usually equipped with mechanically driven
scrapers that continually drive the collected sludge towards a
hopper in the base of the tank where it is pumped to sludge
treatment facilities. Grease and oil from the floating material can
sometimes be recovered for saponification.
The dimensions of the tank should be designed to effect
removal of a high percentage of the floatables and sludge. A
typical sedimentation tank may remove from 60 to 65 percent of
suspended solids, and from 30 to 35 percent of biochemical
oxygen demand (BOD) from the sewage.
1.6.3 SECONDARY TREATMENT:
Secondary treatment is designed to substantially degrade
the biological content of the sewage which is derived from
human waste, food waste, soaps and detergent. The majority of
municipal plants treat the settled sewage liquor using aerobic
biological processes. To be effective, the biota requires both
17
oxygen and food to live. The bacteria and protozoa consume
biodegradable soluble organic contaminants and bind much of
the less soluble fractions into flock.
Secondary treatment systems are classified as fixed-film or
suspended-growth systems.
- FIXED-FILM or attached growth systems include trickling
filters and rotating biological contactors, where the biomass
grows on media and the sewage passes over its surface.
- SUSPENDED-GROWTH systems include activated
sludge, where the biomass is mixed with the sewage and can be
operated in a smaller space than fixed-film systems that treat the
same amount of water
1.6.4 TERTIARY TREATMENT:
� The pollutants were not sufficiently removed in secondary
treatment;
� As solids, nitrogen, phosphorus, and other pollutants such as
color and metals.
� The purpose of tertiary treatment is to provide a final
treatment stage to raise the effluent quality before it is discharged
to the receiving environment (sea, river, lake, ground, etc.).
� Tertiary treatment are of 3 types:
- FILTRATION: Sand filtration removes much of the residual
suspended matter
- NUTRIENT REMOVAL: Wastewater may contain high
levels of the nutrients nitrogen and phosphorus. In certain ways
that can be toxic to fish.
18
- DISINFECTION: The purpose of disinfection in the
treatment of waste water is to substantially reduce the number of
microorganisms in the water to be discharged back into the
environment.The effectiveness of disinfection depends on the
quality of the water being treated (cloudiness, pH, etc.)
Chapter: 2 PRINCIPLES, MATERIAL AND
METHOD OF THE PARAMETERS TO BE
ASSESSED:
2.1.1 PHYSICAL PARAMETERS:
1. COLOR :
� The color of industrial waste is considered to be the color of
light transmitted by the water after removing the suspended
matter.
� Colour in the water may results from natural metallic ions
(Mg & Fe), humus and peat materials, planktons, weeds, and
industrial waste. Coloured industrial wastewater may require
colour removal before discharge into water courses.
� Colour- It means true colour, that is the colour of water
form which turbidity is removed.
� Apparent colour- Includes not only colour due to
substances in solution, but also that due to suspended matters.
� Apparent colour is determined on the original sample
without filtration or centrifugation.
� In some highly coloured industrial wastewater colour is
contributed principally by colloidal or suspended material.
19
� The colour of the wastewater typically depends upon the
different industrial processes. The measurement and removal of
colour is essential part as it is unfit for recycling without proper
treatment
� Methods used:-
� Visual comparison method
� Spectrophotometric-single wavelength method.
� Significance:
- Consumer acceptance decreases, hinders the normal
photosynthetic activities in natural water bodies.
� Method:
� Visual Comparison Method/Platinum Cobalt Method
� Principle:
� The term color is used here to mean “true color”, that is,
the color of water from which turbidity has been removed.
The term “apparent color” includes not only color due to
substances in solution but also that due to suspended matter.
� Collection of sample: -
� Collect the sample in the plastic carbouy.
� Preservation:-
� Ice.
� Apparatus :-
20
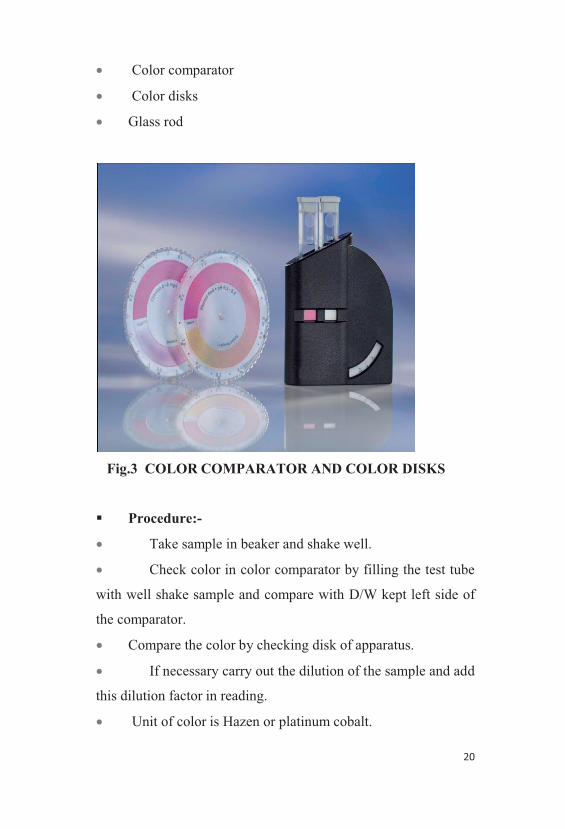
� Color comparator
� Color disks
� Glass rod
Fig.3 COLOR COMPARATOR AND COLOR DISKS
� Procedure:-
� Take sample in beaker and shake well.
� Check color in color comparator by filling the test tube
with well shake sample and compare with D/W kept left side of
the comparator.
� Compare the color by checking disk of apparatus.
� If necessary carry out the dilution of the sample and add
this dilution factor in reading.
� Unit of color is Hazen or platinum cobalt.
21
� Calculation: -
Color Hazen or Pt.Co. Scale = Reading × Dilution
� Interferences: -
� Turbidity – it is removed by filtration or by centrifugation.
� pH- color value increases as the pH of water is raised.
2. SOLIDS:
� Solids- “Matters that suspended or dissolved in the water or
waste water”.
� It may affect the quality of water and waste water.
� High DS in water indicate inferior palatability.
� Desirable limit for drinking water for dissolved solids -
500mg/l.
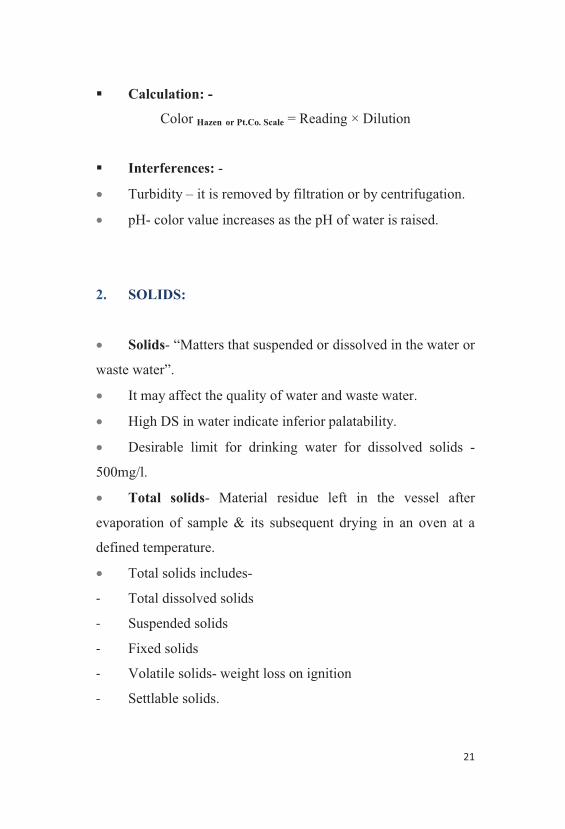
� Total solids- Material residue left in the vessel after
evaporation of sample & its subsequent drying in an oven at a
defined temperature.
� Total solids includes-
- Total dissolved solids
- Suspended solids
- Fixed solids
- Volatile solids- weight loss on ignition
- Settlable solids.
22
A. Total dissolved solids:
� Desirable limit for drinking water of dissolved solids –
Ranges from 20 to 1000mg/l
� Hardness increases with TDS
� Filter paper used are of two types,
- Whatman filter paper - 42 mesh size , 47mm ,2μ pore size
- GF/C - glass fiber filter paper, 2μ pore size, resist high
temperature, 47mm, made up of glass wool.
� Main contributors of TDS- SO4-, Alkalinity as CaCO3,
Hardness as Ca, Mg, Nitrate,
� Silicates, Borates, Phosphates, Na, K ,F.
� In TDS , 0.6 of alkalinity`s results is participated.
� Significance: Highly mineralized water is less acceptable
than water with a moderate mineral content for drinking and
household purposes.
� Method:
� Gravimetric / Filtration Method.
� Principle:
� A well-mixed sample is filtered through a standard glass
fiber filter, and the filtrate is evaporated to dryness in a weighed
dish and dried to constant weight at 180°C. The increase in dish
weight represents the total dissolved solids. This procedure may
be used for drying at other temperatures. The results may not
agree with the theoretical value for solids calculated from
23
chemical analysis of sample. Approximate methods for
correlating chemical analysis with dissolved solids are available.
The filtrate from the total suspended solids determination may be
used for determination of total dissolved solids.
� Collection of sample :
� Collect the sample in the plastic carbouy.
� Preservation:-
� Ice
� Apparatus:
� Vacuum Filtration Assembly
� Graduated 50ml Cylinder
� Beakers
� Glass microfiber filter Paper GF/C (47mm)
� Oven
� Balance
24
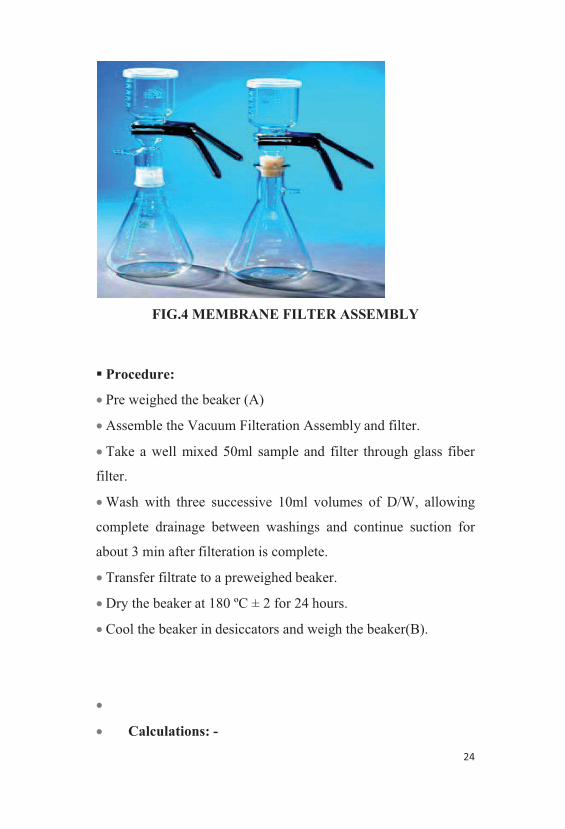
FIG.4 MEMBRANE FILTER ASSEMBLY
� Procedure:
� Pre weighed the beaker (A)
� Assemble the Vacuum Filteration Assembly and filter.
� Take a well mixed 50ml sample and filter through glass fiber
filter.
� Wash with three successive 10ml volumes of D/W, allowing
complete drainage between washings and continue suction for
about 3 min after filteration is complete.
� Transfer filtrate to a preweighed beaker.
� Dry the beaker at 180 ºC ± 2 for 24 hours.
� Cool the beaker in desiccators and weigh the beaker(B).
�
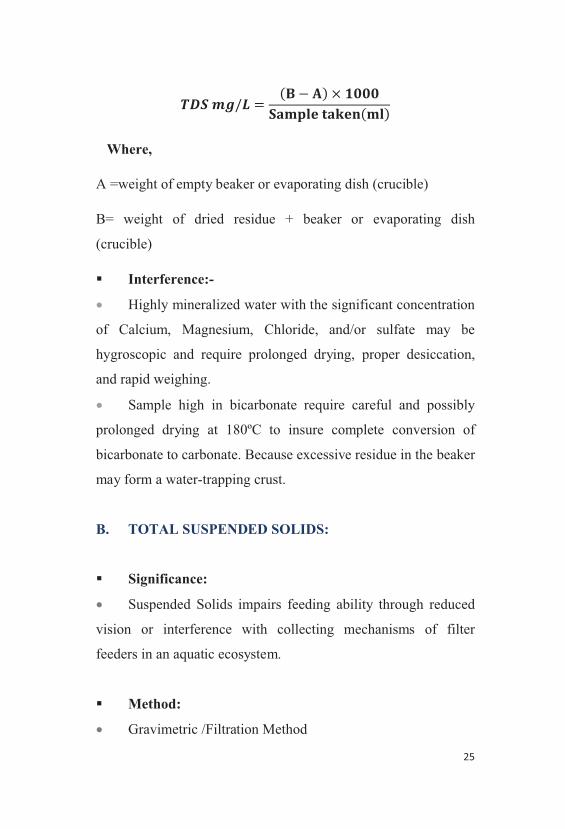
� Calculations: -
25
�������� � ��� ��� ������������������
Where,
A =weight of empty beaker or evaporating dish (crucible)
B= weight of dried residue + beaker or evaporating dish
(crucible)
� Interference:-
� Highly mineralized water with the significant concentration
of Calcium, Magnesium, Chloride, and/or sulfate may be
hygroscopic and require prolonged drying, proper desiccation,
and rapid weighing.
� Sample high in bicarbonate require careful and possibly
prolonged drying at 180ºC to insure complete conversion of
bicarbonate to carbonate. Because excessive residue in the beaker
may form a water-trapping crust.
B. TOTAL SUSPENDED SOLIDS:
� Significance:
� Suspended Solids impairs feeding ability through reduced
vision or interference with collecting mechanisms of filter
feeders in an aquatic ecosystem.
� Method:
� Gravimetric /Filtration Method
26
� Principle :-
� A well-mixed sample is filtered through a weighed standard
glass-fiber filter and the residue retained on the filter is dried to a
constant weight at 103 to 105°C. The increase in weight of the
filter represents the total suspended solids. If the suspended
material clogs the filter and prolongs filtration, it may be
necessary to increase the diameter of the filter or decrease the
sample volume. To obtain an estimate of total suspended solids,
calculate the difference between total dissolved solids and total
solids.
� Collection of sample:-
� Collect the sample in the plastic carbouy.
� Preservation:-
� Ice
� Apparatus:
� Vacuum Filteration Assembly
� Graduated 50ml Cylinder
� Glass microfiber filter Paper GF/C (47mm)
� Oven
� Balance
27
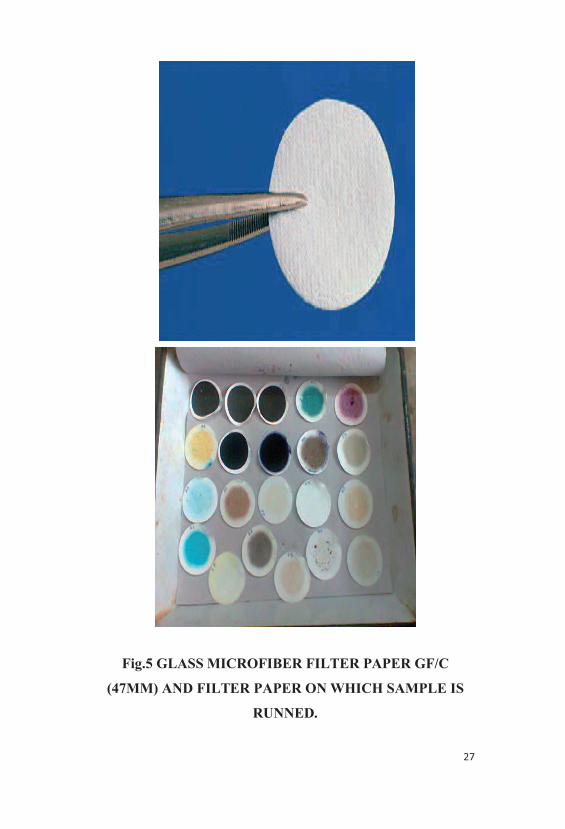
Fig.5 GLASS MICROFIBER FILTER PAPER GF/C
(47MM) AND FILTER PAPER ON WHICH SAMPLE IS
RUNNED.
28
� Procedure:
� Pre weighed the Glass microfiber filter Paper GF/C (47mm)
� Assemble the Vacuum Filteration Assembly and filter paper.
� Take a well mixed 50ml sample and filter through glass fiber
filter.
� Wash with three successive 10ml volumes of D/W, allowing
complete drainage between washings and continue suction for
about 3 min after filteration is complete.
� Carefully remove the filter paper from Vacuum Filteration
Assembly and transfer it to petridish.
� Dry the Glass microfiber filter Paper GF/C at 103 to 105 ºC for
atleast 1 hour.
� Weigh the Glass microfiber filter Paper GF/C after cooling (B).
� Calculation: -
�������� � ��� ��� �����������������
Where,
A = weight of empty filter paper
B = weight of filter + dried residue
� Interference:-
� Large Floating Particle/Submerged agglomerates of
nonhomogeneous materials
29
2.1.3 BIOLOGICAL PARAMETERS:
1) Total COLIFORM and FECAL COLIFORM
� Another most common and widespread health risk
associated with drinking water is the bacterial contamination
caused either directly or indirectly by human or animal excreta.
� Assessment of indicator bacteria namely coliform bacteria
is a convenient way to evaluate potability and sanitary conditions
of water bodies.
� The bacterial species E.coli is a typical coliform bacteria
traditionally used as hygiene indicator bacteria, and methods for
their detection are essential for drinking water regulations all
over the world.
� Significance:
� These parameters give an idea about the contamination of
drinking water directly or indirectly by sewage or by human or
animal excreta. The contamination results into communicable
enteric disease. Presence of coliform bacteria in water supplies
indicates inadequate treatment or post treatment contamination.
E.coli is always present in the faceless of man. Animals & birds.
Tootle plate count or colony court is used to assess the general
bacterial contamination.
� Method :
� Most Probable Number
� Principle:
30
� It is statistical method based on the probability theory. In
this technique, the sample is serially diluted till the numbers of
organisms reach the point of extension. From each of these
dilutions several multiple tubes of a specific medium are
inoculated. Presence of organism is indicated by acid and gas in
the medium. Pattern of positive and negative test results are then
used to estimate the number of bacteria in the original sample.
Since the test gives the most probable number of organisms
present in the sample it is also known as MPN test.
� Collection of samples
� collect the sample in sterile glass bottle.
� Preservation:
� ice
� Apparatus:
� autoclave,
� Incubator,
� Gas burner,
� Nichrome wire loop
� ,Sterile pipettes and
� Sterile dilution water bottles.
� Reagents :
1. MacConkey’s Lactose Bile Broth (MLBB)
� Pepton-20.0 g
31
� Lactose-10.0 g
� Sodium Chloride-5.0 g
� Bile salts-3.0 to 5.0 g
� Neutral red-30.0 g
� Crystal violet-10.0 g
� Distilled water-1000 ml
� Agar-30.0 g
� pH-7.4
� Dissolve by heating; adjust pH to 7.4 and sterilize by
autoclaving. Above composition will make Single strength, But
double the concentration will make it Double strength medium
in 1000 ml distilled water.
2. Brilliant green lactose bile broth:
� Peptone-10 g
� Lactose- 10g
� Oxgall- 20 g
� Brilliant green- 0.0133 g
� Distilled water 1 litre
� pH should be 7.2 after sterilization and is then ready for use
� 1 MLBB tube having 50 ml double strength (2X)
medium.
� 5 MLBB tubes each having 10 ml double strength (2X)
medium.
� 11 MLBB tubes each having 5 ml single strength (X)
medium.

32
� Sterile 10 ml and 1 ml pipettes.
� Water sample to be tested.
3. Kovac’s reagent:
� P-dimethylaminobenzaldehyde-5 g
� Amyl alcohol- 75 ml
� Concentrated HCl - 25 ml
� Dissolve aldehyde in alcohol by gently warming in a
water bath.Cool and add with care.
� Procedure:
� Shake the water sample vigorously to ensure uniform
distribution of organisms.
� Dilute the sample (if necessary) by transferring 10 ml of
water sample by sterile pipette to 90 ml of sterile distilled water.
This makes 10-1
dilution. Make more dilutions if needed.
� With the sterile graduated pipettes inoculate the water
sample (diluted sample, if the dilution is done) as follows.
� 1 MLBB tube having 50 ml double strength (2X) medium
with 50 ml sample.
� 5 MLBB tube having 10ml double strength (2X) medium
with 10 ml sample each.
� 5 MLBB tube having 5ml single strength (X) medium with
1 ml sample each.
� 5 MLBB tube having 5ml single strength (X) medium with
0.1 ml sample each.
33
� One tube of MLBB having 5 ml (X) medium is left
uninoculated, which serves as control.
� Incubates all tubes at 37 0C for 24 hours.
� Examine tubes for acid and gas after 24 hours.
� If no tube shows acid and gas reincubate all tubes for
another 24 hours.
� At the end of the incubation period, record the number
of positive tubes in each of three sets (i.e. 10 ml, 1 ml and 0.1
ml), and interprete results as follows.
� Confirm test :
� Transfer the 1-2 loopful of culture from the presumptive
tube in each of two brilliant green broth each of 5ml fermentation
tube and incubate one tube at 37�C for 24 hr and other tubes at
44�C for 24 hr. the fermentation of gas in the tube after 24 hr.48
hr shows positive test.also incubate 1-2 loopful of culture in
peptone water tube(each of 5 ml) and incubate at 44�C for 24 hr.
� Interpretation:
� McCrady in 1918 computed tables (refer Apendix-1)
regarding the most probable number of organisms present in 100
ml of water, on the basis of various combination of positive and
negative results in the amounts used for tests. Number of
organisms per 100 ml is read from the McCrady’s table, and the
number is multiplied by the dilution factor (if any), to come to
the final number.
34
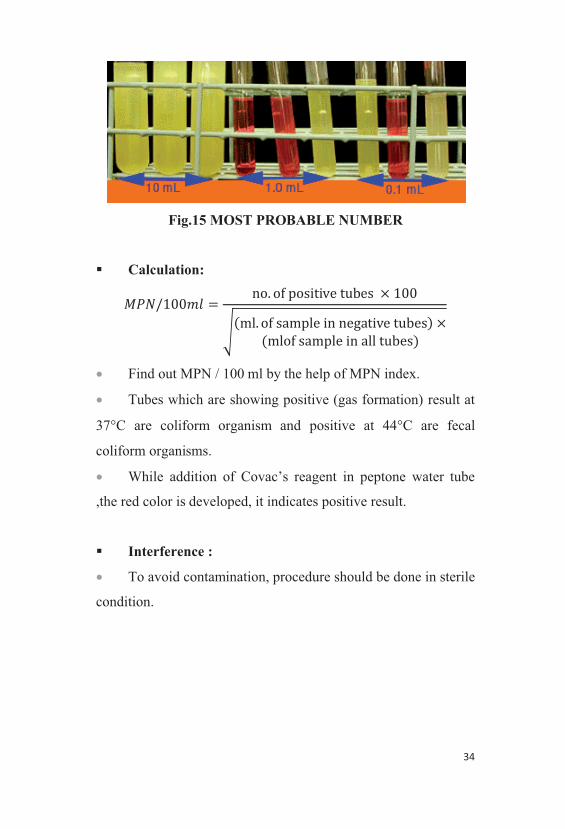
Fig.15 MOST PROBABLE NUMBER
� Calculation:
�� ������ � ��� ����������� ���� ����������������������������� ����
��������������������� ���
� Find out MPN / 100 ml by the help of MPN index.
� Tubes which are showing positive (gas formation) result at
37�C are coliform organism and positive at 44�C are fecal
coliform organisms.
� While addition of Covac’s reagent in peptone water tube
,the red color is developed, it indicates positive result.
� Interference :
� To avoid contamination, procedure should be done in sterile
condition.
35
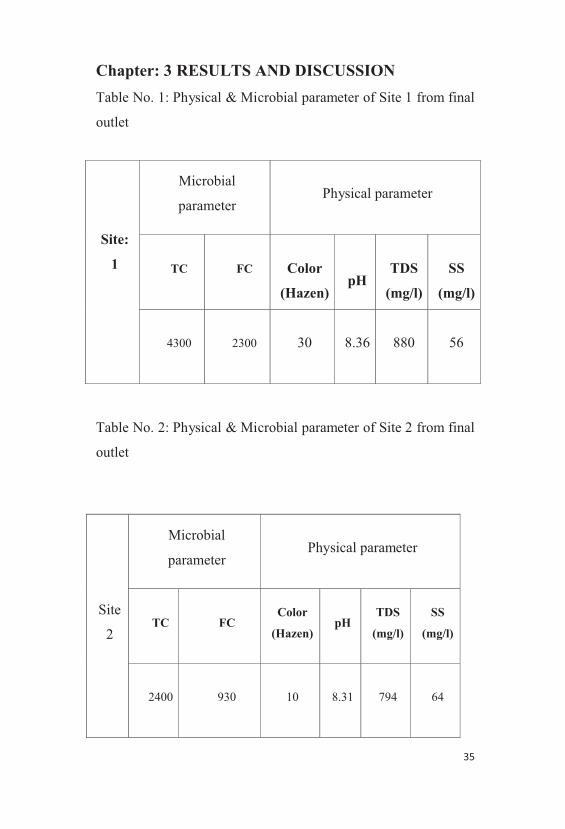
Chapter: 3 RESULTS AND DISCUSSION
Table No. 1: Physical & Microbial parameter of Site 1 from final
outlet
Table No. 2: Physical & Microbial parameter of Site 2 from final
outlet
Site
2
Microbial
parameterPhysical parameter
TC FCColor
(Hazen)pH
TDS
(mg/l)
SS
(mg/l)
2400 930 10 8.31 794 64
Site:
1
Microbial
parameterPhysical parameter
TC FC Color
(Hazen)pH
TDS
(mg/l)
SS
(mg/l)
4300 2300 30 8.36 880 56
36
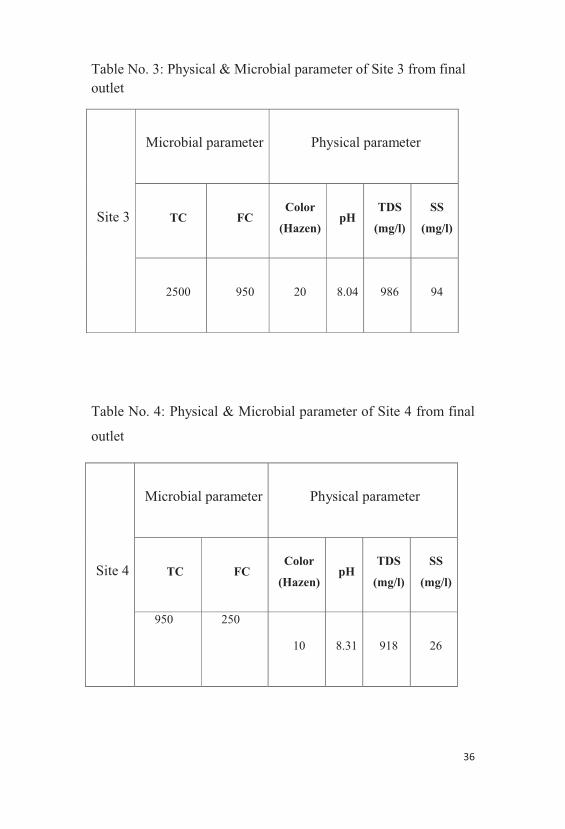
Table No. 3: Physical & Microbial parameter of Site 3 from final
outlet
Site 3
Microbial parameter Physical parameter
TC FCColor
(Hazen)pH
TDS
(mg/l)
SS
(mg/l)
2500 950 20 8.04 986 94
Table No. 4: Physical & Microbial parameter of Site 4 from final
outlet
Site 4
Microbial parameter Physical parameter
TC FCColor
(Hazen)pH
TDS
(mg/l)
SS
(mg/l)
950 250
10 8.31 918 26
37
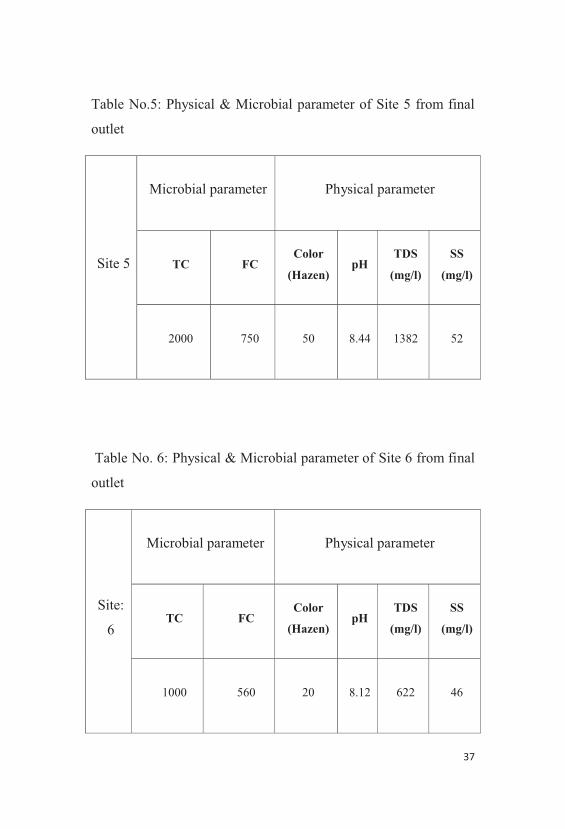
Table No.5: Physical & Microbial parameter of Site 5 from final
outlet
Site 5
Microbial parameter Physical parameter
TC FCColor
(Hazen)pH
TDS
(mg/l)
SS
(mg/l)
2000 750 50 8.44 1382 52
Table No. 6: Physical & Microbial parameter of Site 6 from final
outlet
Site:
6
Microbial parameter Physical parameter
TC FCColor
(Hazen)pH
TDS
(mg/l)
SS
(mg/l)
1000 560 20 8.12 622 46
38
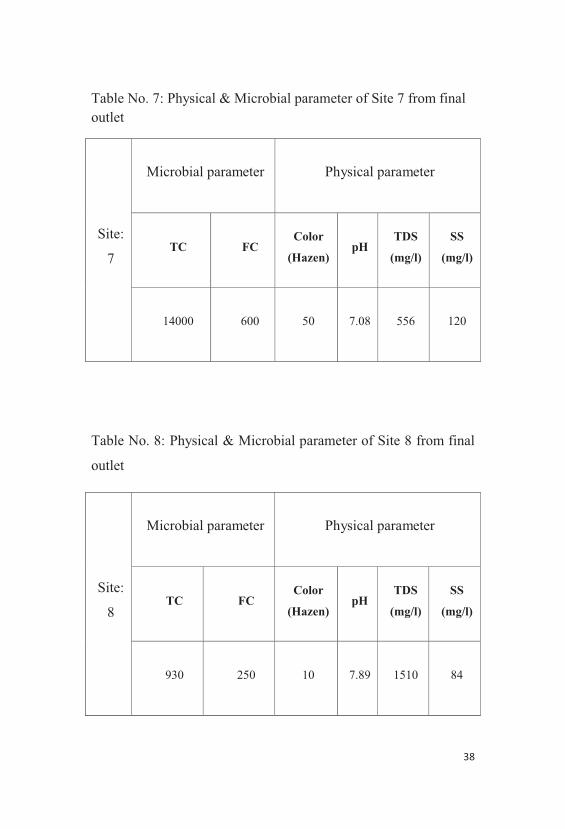
Table No. 7: Physical & Microbial parameter of Site 7 from final
outlet
Site:
7
Microbial parameter Physical parameter
TC FCColor
(Hazen)pH
TDS
(mg/l)
SS
(mg/l)
14000 600 50 7.08 556 120
Table No. 8: Physical & Microbial parameter of Site 8 from final
outlet
Site:
8
Microbial parameter Physical parameter
TC FCColor
(Hazen)pH
TDS
(mg/l)
SS
(mg/l)
930 250 10 7.89 1510 84
39
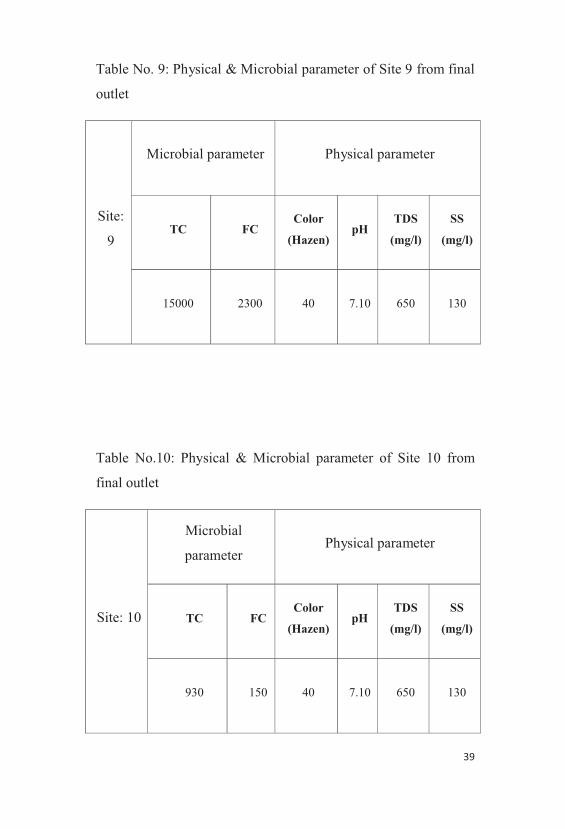
Table No. 9: Physical & Microbial parameter of Site 9 from final
outlet
Site:
9
Microbial parameter Physical parameter
TC FCColor
(Hazen)pH
TDS
(mg/l)
SS
(mg/l)
15000 2300 40 7.10 650 130
Table No.10: Physical & Microbial parameter of Site 10 from
final outlet
Site: 10
Microbial
parameterPhysical parameter
TC FCColor
(Hazen)pH
TDS
(mg/l)
SS
(mg/l)
930 150 40 7.10 650 130
40
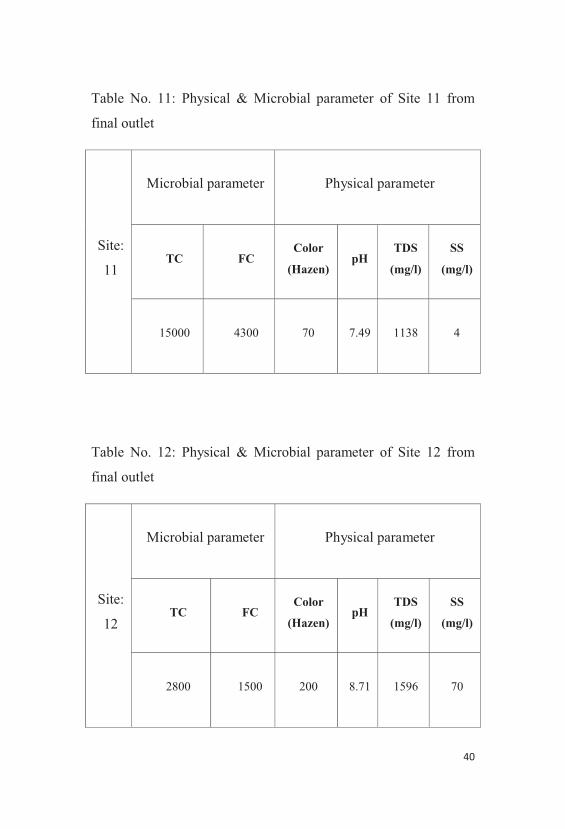
Table No. 11: Physical & Microbial parameter of Site 11 from
final outlet
Site:
11
Microbial parameter Physical parameter
TC FCColor
(Hazen)pH
TDS
(mg/l)
SS
(mg/l)
15000 4300 70 7.49 1138 4
Table No. 12: Physical & Microbial parameter of Site 12 from
final outlet
Site:
12
Microbial parameter Physical parameter
TC FCColor
(Hazen)pH
TDS
(mg/l)
SS
(mg/l)
2800 1500 200 8.71 1596 70
41
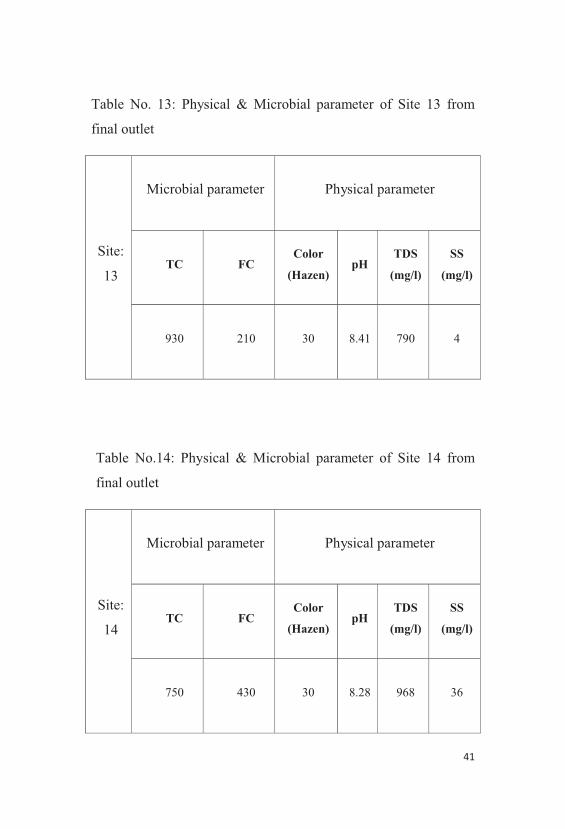
Table No. 13: Physical & Microbial parameter of Site 13 from
final outlet
Site:
13
Microbial parameter Physical parameter
TC FCColor
(Hazen)pH
TDS
(mg/l)
SS
(mg/l)
930 210 30 8.41 790 4
Table No.14: Physical & Microbial parameter of Site 14 from
final outlet
Site:
14
Microbial parameter Physical parameter
TC FCColor
(Hazen)pH
TDS
(mg/l)
SS
(mg/l)
750 430 30 8.28 968 36
42
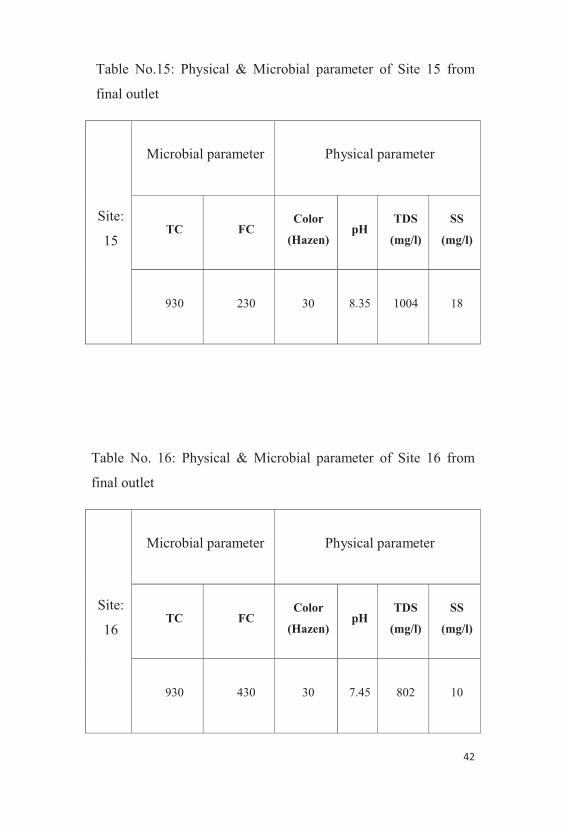
Table No.15: Physical & Microbial parameter of Site 15 from
final outlet
Site:
15
Microbial parameter Physical parameter
TC FCColor
(Hazen)pH
TDS
(mg/l)
SS
(mg/l)
930 230 30 8.35 1004 18
Table No. 16: Physical & Microbial parameter of Site 16 from
final outlet
Site:
16
Microbial parameter Physical parameter
TC FCColor
(Hazen)pH
TDS
(mg/l)
SS
(mg/l)
930 430 30 7.45 802 10
43
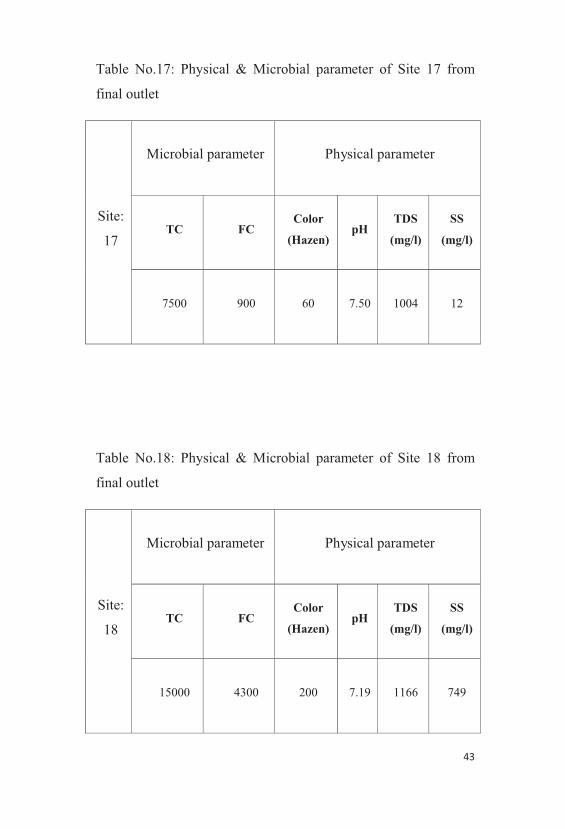
Table No.17: Physical & Microbial parameter of Site 17 from
final outlet
Site:
17
Microbial parameter Physical parameter
TC FCColor
(Hazen)pH
TDS
(mg/l)
SS
(mg/l)
7500 900 60 7.50 1004 12
Table No.18: Physical & Microbial parameter of Site 18 from
final outlet
Site:
18
Microbial parameter Physical parameter
TC FCColor
(Hazen)pH
TDS
(mg/l)
SS
(mg/l)
15000 4300 200 7.19 1166 749
44
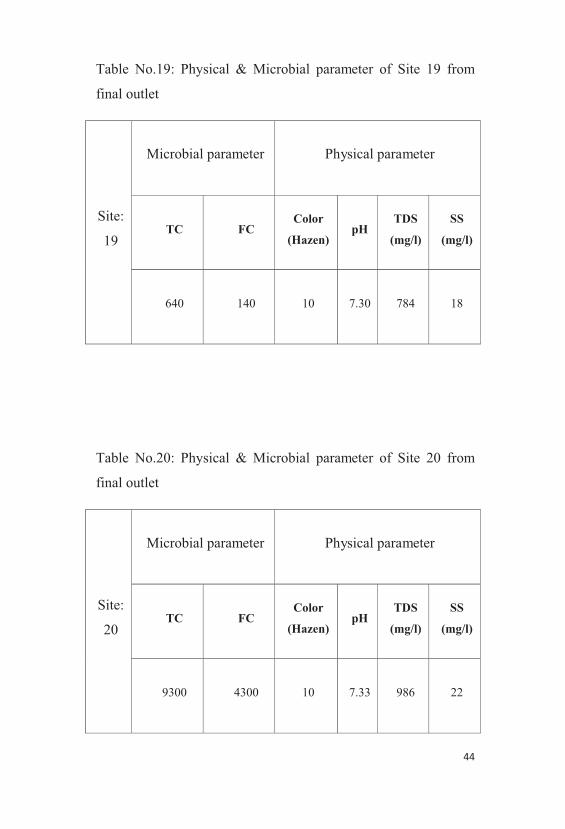
Table No.19: Physical & Microbial parameter of Site 19 from
final outlet
Site:
19
Microbial parameter Physical parameter
TC FCColor
(Hazen)pH
TDS
(mg/l)
SS
(mg/l)
640 140 10 7.30 784 18
Table No.20: Physical & Microbial parameter of Site 20 from
final outlet
Site:
20
Microbial parameter Physical parameter
TC FCColor
(Hazen)pH
TDS
(mg/l)
SS
(mg/l)
9300 4300 10 7.33 986 22
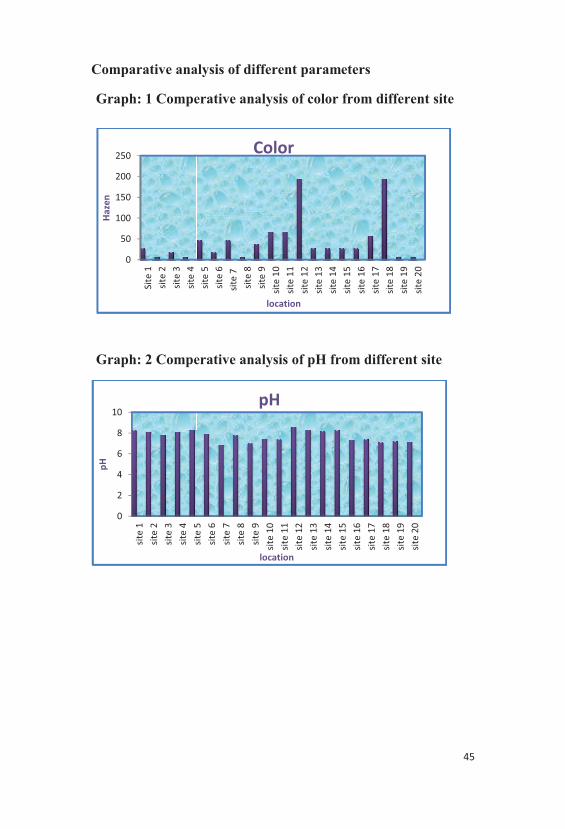
Comparative ana
Graph: 1 Compe
Graph: 2 Compe
0
50
100
150
200
250
Site1
site2
site3
site4
Ha
zen
0
2
4
6
8
10
site1
site2
site3
site4
site5
pH
alysis of different parameters
erative analysis of color from different
erative analysis of pH from different sit
site5
site6
site7
site8
site9
site10
site11
site12
site13
site14
site15
site16
site17
site18
site19
site20
location
Color
site5
site6
site7
site8
site9
site10
site11
site12
site13
site14
site15
site16
site17
site18
site19
site20
location
pH
45
site
te
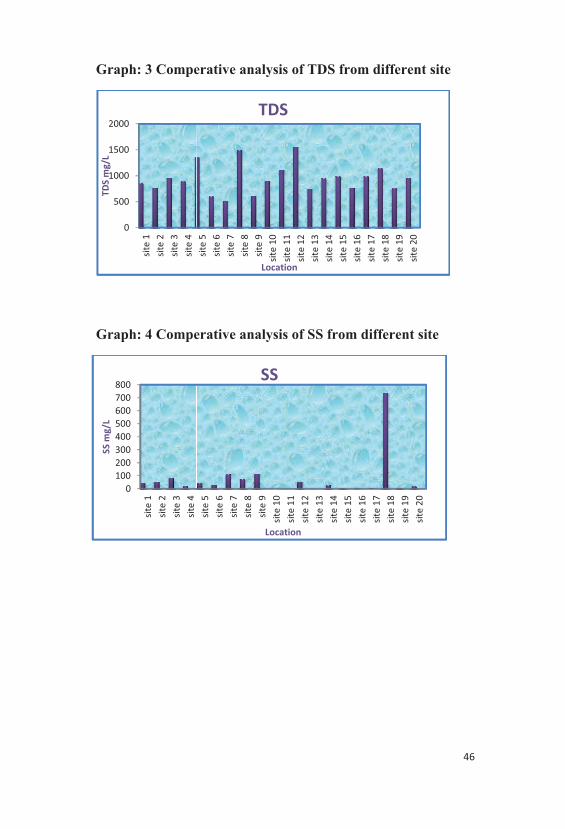
Graph: 3 Compe
Graph: 4 Compe
0
500
1000
1500
2000
site1
site2
site3
site4
TD
Sm
g/L
0
100
200
300
400
500
600
700
800
site1
site2
site3
site4
SS
mg
/L
erative analysis of TDS from different s
erative analysis of SS from different sit
site5
site6
site7
site8
site9
site10
site11
site12
site13
site14
site15
site16
site17
site18
site19
site20
Location
TDS
site5
site6
site7
site8
site9
site10
site11
site12
site13
site14
site15
site16
site17
site18
site19
site20
Location
SS
46
site
te
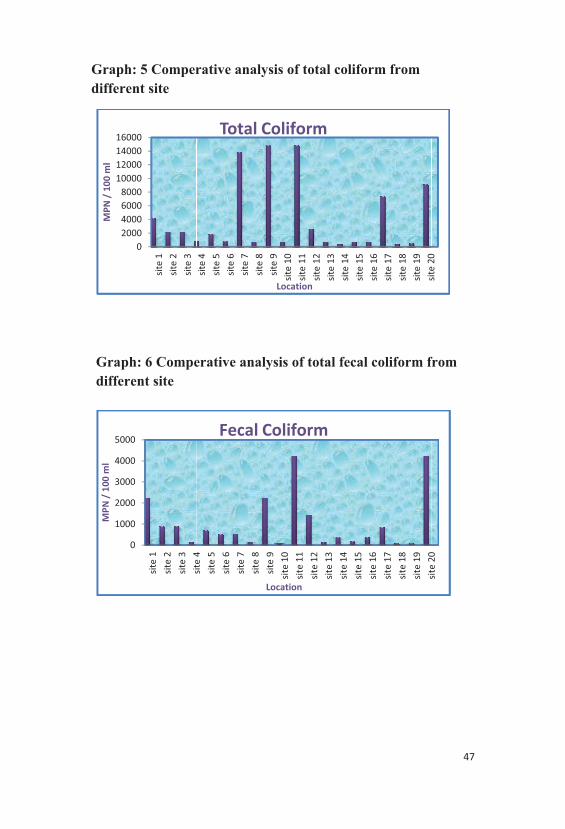
Graph: 5 Comper
different site
Graph: 6 Compe
different site
0
2000
4000
6000
8000
10000
12000
14000
16000
site1
site2
site3
MP
N/
10
0m
l
0
1000
2000
3000
4000
5000
site1
site2
site3
site4
MP
N/
10
0m
l
rative analysis of total coliform from
erative analysis of total fecal coliform f
site4
site5
site6
site7
site8
site9
site10
site11
site12
site13
site14
site15
site16
site17
site18
site19
site20
Location
Total Coliform
site4
site5
site6
site7
site8
site9
site10
site11
site12
site13
site14
site15
site16
site17
site18
site19
site20
Location
Fecal Coliform
47
from
site20
site20
48
REFRENCES:
� Standard Methods of the Examination of Water and
Wastewater.
� ETD
� Shodhganga.
� Prescott, Harley, and Klein's Microbiology
� ASTM D1426 - 08 Standard Test Methods for Ammonia
Nitrogen In Water
� Johnson, D. L.; Ambrose, S. H.; Bassett, T. J.; Bowen, M.
L.; Crummey, D. E.; Isaacson, J. S.; Johnson, D. N.;
Lamb, P. et al (1997). "Meanings of Environmental
Terms". Journal of Environmental Quality 26 (3): 581–
589.doi:10.2134/jeq1997.00472425002600030002x
� "Pollution - Definition from the Merriam-Webster Online
Dictionary". Merriam-webster.com. 2010-08-13.
Retrieved 2010-08-26.
� Schueler, Thomas R. "Microbes and Urban Watersheds:
Concentrations, Sources, & Pathways."eprinted in The
Practice of Watershed Protection. 2000. Center for
Watershed Protection. Ellicott City, MD.
49
� United States Geological Survey (USGS). Denver, CO.
"Ground Water and Surface Water: A Single Resource."
USGS Circular 1139. 1998.
� Schueler, Thomas R. "Microbes and Urban Watersheds:
Concentrations, Sources, & Pathways." Reprinted in The
Practice of Watershed Protection. 2000. Center for
Watershed Protection. Ellicott City, MD.
� EPA. “Illness Related to Sewage in Water.” Accessed
February 20, 2009.


Buy your books fast and straightforward online - at one of world’s
fastest growing online book stores! Environmentally sound due to
Print-on-Demand technologies.
Buy your books online at
www.get-morebooks.com
Kaufen Sie Ihre Bücher schnell und unkompliziert online – auf einer
der am schnellsten wachsenden Buchhandelsplattformen weltweit!
Dank Print-On-Demand umwelt- und ressourcenschonend produzi-
ert.
Bücher schneller online kaufen
www.morebooks.deVDM Verlagsservicegesellschaft mbH
Heinrich-Böcking-Str. 6-8 Telefon: +49 681 3720 174 [email protected] - 66121 Saarbrücken Telefax: +49 681 3720 1749 www.vdm-vsg.de

Related Documents