79 Received : 10 March 2011, first revision : 18 January 2012, second revision : 07 May 2012, accepted : June 2012 INDONESIAN MINING JOURNAL Vol. 15, No. 2, June 2012 : 79 - 91 SEVERAL EVALUATION AND ANALYTICAL INDICATORS OF REGIONAL AUTONOMY IMPLEMENTATION IMPACTS IN INDONESIA: ENERGY AND MINERAL RESOURCE SECTOR DEVELOPMENT UKAR W. SOELISTIJO Faculty of Engineering, Bandung Islamic University (Unisba) Faculty of Mining and Petroleum Engineering, Institute of Technology Bandung (ITB) Jl. Taman Sari No. 1 Bandung 40116 - Jawa Barat Retired Senior Reseacher from R & D Centre for Mineral and Coal Technology ABSTRACT In general, the example of case study of the energy and mining company such as PT Bukit Asam (Tbk) in South Sumatera Province and PT INCO (Tbk) in South Sulawesi Province has positive impact to the regional economy in terms of the community development and economic productivity. Coordination between central and regional governments should set up grand strategy of increasing their in- tensive exploration program to identify the distribution, locality, quality and quantity of their energy and mineral resources in every region to develop its potentials and its mineral base downstream industries so instrumental to development in the near future, especially if they have resource endowments having optimal added value and positive terms of trade (TOT) or TOT greater than 1. In overall, it indicates that the energy and mineral resources (EMR) sector could be used as one of among the catalysts to achieve interregional convergence through “cross fertilization” toward the national Gross Domestic Product (GDP) per capita index. All in one purpose is to set up of creating job and income toward a welfare society. Keywords: the role of energy and mining company, prime mover, productivity, regional development, community development program, grand strategy INTRODUCTION The concept of the development mainly in terms of economy is based on economic growth, equitable distribution of development and stability. Regional autonomy was launched to create equitable dis- tribution of development over the regions in the country. Using the input of development, such as natural resources, human resources and other man-made resources; the process of regional development would result in physical and non- physical ouput. The physical output may include infrastructure, physical environment and spatial order. Whilst, non-physical output may cover the convergence of economic development across- region, mobility of goods and services and other input economic factors, modernization and com- munity development and other governmental as- signments as well (Soelistijo et al, 2003; Soelistijo, 2008; Eggert, 2001). In the energy and mineral resource sector, the economic transformation process could be seen in the form of production function : Y= f (K,L,R,E,I,Z) T, where Y = goods and services as the out- put, K= capital, L=labor, R= natural resources, E=environment, I = information, T= technology as the input factors, Z= other input factors. This sector as part of the economic sector would also be function of the implementation of the above concept of development. It requires many steps to follow up in line with concept in order so instru- mental to development (Miernyk, 1965; Miernyk, 1982; Soelistijo et. al, 2003).

Welcome message from author
This document is posted to help you gain knowledge. Please leave a comment to let me know what you think about it! Share it to your friends and learn new things together.
Transcript
79
Several Evaluation and Analytical Indicators of Regional Autonomy ... Ukar W. Soelistijo
Received : 10 March 2011, fi rst revision : 18 January 2012, second revision : 07 May 2012, accepted : June 2012
INDONESIAN MINING JOURNAL Vol. 15, No. 2, June 2012 : 79 - 91
SEVERAL EVALUATION AND ANALYTICAL INDICATORS OF REGIONAL AUTONOMY
IMPLEMENTATION IMPACTS IN INDONESIA: ENERGY AND MINERAL RESOURCE SECTOR
DEVELOPMENT
UKAR W. SOELISTIJOFaculty of Engineering, Bandung Islamic University (Unisba)
Faculty of Mining and Petroleum Engineering, Institute of Technology Bandung (ITB)Jl. Taman Sari No. 1 Bandung 40116 - Jawa Barat
Retired Senior Reseacher from R & D Centre for Mineral and Coal Technology
ABSTRACT
In general, the example of case study of the energy and mining company such as PT Bukit Asam (Tbk) in South Sumatera Province and PT INCO (Tbk) in South Sulawesi Province has positive impact to the regional economy in terms of the community development and economic productivity.
Coordination between central and regional governments should set up grand strategy of increasing their in-tensive exploration program to identify the distribution, locality, quality and quantity of their energy and mineral resources in every region to develop its potentials and its mineral base downstream industries so instrumental to development in the near future, especially if they have resource endowments having optimal added value and positive terms of trade (TOT) or TOT greater than 1.
In overall, it indicates that the energy and mineral resources (EMR) sector could be used as one of among the catalysts to achieve interregional convergence through “cross fertilization” toward the national Gross Domestic Product (GDP) per capita index. All in one purpose is to set up of creating job and income toward a welfare society.
Keywords: the role of energy and mining company, prime mover, productivity, regional development, community development program, grand strategy
INTRODUCTION
The concept of the development mainly in terms of economy is based on economic growth, equitable distribution of development and stability. Regional autonomy was launched to create equitable dis-tribution of development over the regions in the country. Using the input of development, such as natural resources, human resources and other man-made resources; the process of regional development would result in physical and non-physical ouput. The physical output may include infrastructure, physical environment and spatial order. Whilst, non-physical output may cover the convergence of economic development across-region, mobility of goods and services and other input economic factors, modernization and com-
munity development and other governmental as-signments as well (Soelistijo et al, 2003; Soelistijo, 2008; Eggert, 2001).
In the energy and mineral resource sector, the economic transformation process could be seen in the form of production function : Y= f (K,L,R,E,I,Z)T, where Y = goods and services as the out-put, K= capital, L=labor, R= natural resources, E=environment, I = information, T= technology as the input factors, Z= other input factors. This sector as part of the economic sector would also be function of the implementation of the above concept of development. It requires many steps to follow up in line with concept in order so instru-mental to development (Miernyk, 1965; Miernyk, 1982; Soelistijo et. al, 2003).

80
INDONESIAN MINING JOURNAL Vol. 15, No. 2, June 2012 : 79 - 91
Regional autonomy has actually been launched since 1975 by law that is called as regional au-tonomy period I (RAP I), then renewed in 1999 and re-enforced in 2004 as regional autonomy period II (RAP II). If within RAP I only few sectors decentralized to the regional government, then in RAP II most of the sectors are decentralized, ex-cept six sectors. Those are foreign affairs, fi nance, defense and security, justice, religion and certain sectors that will be determined by government regulation [Anonymous (b), 2009; Anonymous (c), 2009; Anonymous (d) , 2004].
Spotlighting the energy and mineral resource sector in the regional autonomy development is purposed to enlighten kinds of problem faced by the sector over the country for certain regions in the case of provinces or regencies for example. It is also spotlighted the result of convergence between region during the process of regional autonomy up to now. This evaluation and ana-lytical indicators of current regional autonomy implementation impacts in Indonesia in the case of energy and mineral resource sector develop-ment is based on several studies that currently have been carried out by several researchers including the writer.
THEORY AND METHODOLOGY
Theory
As indicated in the fundamental aggregate pro-duction function, Gross Domestic Product (Y) is a function of capital fl ow (K), available labor (L), natural resource (R) and time (t) representing neutral technical change (Solow et al., 1961):
Y = f (K,L,R)t
This study will focus on natural resources within the energy and mineral resources. Thus, national income from the expenditure side (Ye) is repre-sented as being composed of consumption ( C ) and investment (I) :
Ye = C + I = (PC + GC) + (PI + GI)
where PC = private consumption, GC = govern-ment consumption, PI= private investment, GI = government investment.
Government is a function of exports (X). To seg-regate from investment those government social
services that are distinct from administration and the formation of infrastructure, net expenditure of the latter is designated (GC) and described as a function of population (P) under full employment policies. Other variables are taken, in conven-tional form, as functions of income:
Ye = PI(Y) + PC(Y) + GC(P) + GI(X).
Expressing national income in terms of the major explanatory variables thus yields:
Ye = f(Y) + g(X-M) + h(P); where M is imports.
There is a relationship between productivity, or income per capita (Y/L), and the output of capital ratio (Y/K) (Solow, et al, 1961). The higher the productivity, the higher the terms of trade of the commodity output will be.
Moreover, since Ye = f(BOP, C) = f (BOT, ∆K, C) and BOP = f(BOT, ∆K), then there will be a re-lationship between Ye and BOP as well as BOT, where BOP is balance of payment, BOT is balance of trade, ∆K is capital fl ow in minus capital fl ow out, and C is consumption.
Methodology
Modeling and its clarifi cation have been used to observe several fi elds of study, i.e.:a. I-O model shows the analysis of multiplying
effects;b. Productivity analyzes the impact of energy
and mineral sector development to the pro-ductivity of labor (Y/L) and productivity of capital (Y/L) of the region;
c. The role of mining company on the community development in the energy and mineral sec-tor;
d. Econometrics is applied to look the forecast of the trend of several economic variables.
e. Observation would also look at the condition of terms of mineral commodity trade with the international market;
f. Convergence of economy across-regions (provinces) using income per capita indices over time.
Then, the recent results of researches of several researchers are recombined, recomputed and reprocessed as the basis in this study on analysis and evaluation (Amrullah, 2006; Bank Indonesia, 2008; Fauzi, 2010; Munthe, 2010; Soelistijo,
81
Several Evaluation and Analytical Indicators of Regional Autonomy ... Ukar W. Soelistijo
2010, 2008, 2005, 2004; Soelistijo et al, 2003; Sagir, 2009; Supriharjiyanto, 2006; Toni, 2009; Purnomo, 2000).
RESULTS AND DISCUSSION
Economic Interregional Convergence between Provinces
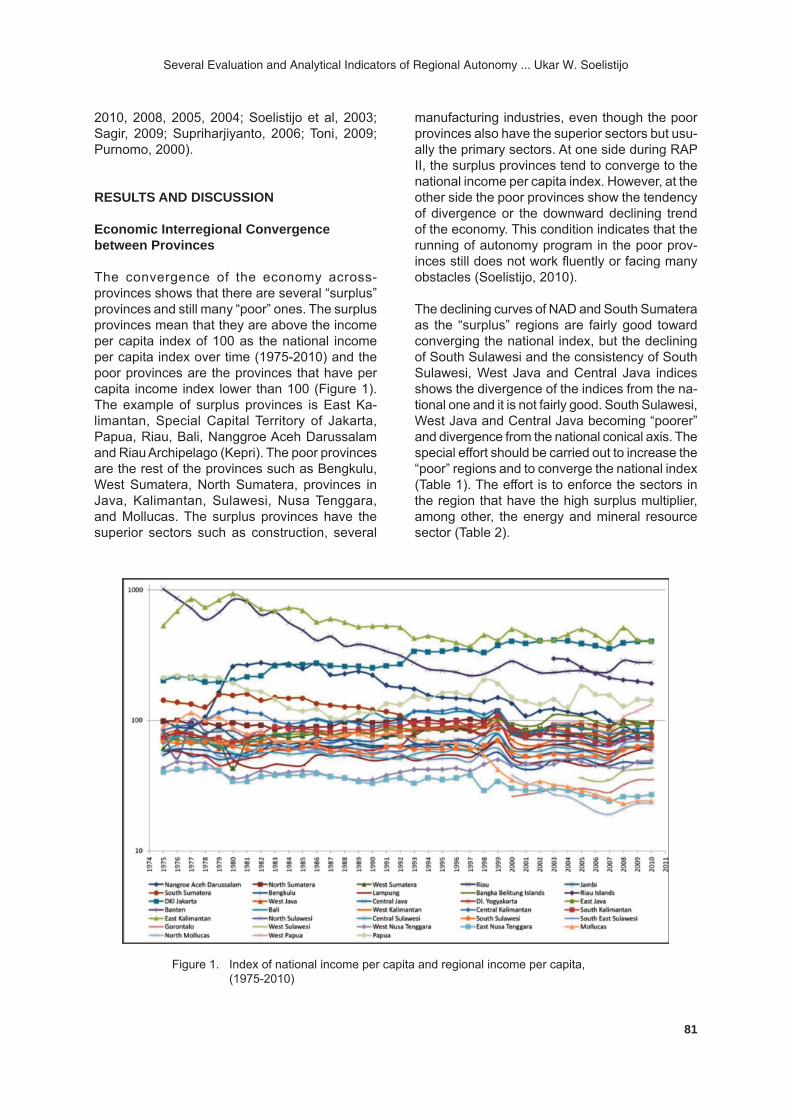
The convergence of the economy across-provinces shows that there are several “surplus” provinces and still many “poor” ones. The surplus provinces mean that they are above the income per capita index of 100 as the national income per capita index over time (1975-2010) and the poor provinces are the provinces that have per capita income index lower than 100 (Figure 1). The example of surplus provinces is East Ka-limantan, Special Capital Territory of Jakarta, Papua, Riau, Bali, Nanggroe Aceh Darussalam and Riau Archipelago (Kepri). The poor provinces are the rest of the provinces such as Bengkulu, West Sumatera, North Sumatera, provinces in Java, Kalimantan, Sulawesi, Nusa Tenggara, and Mollucas. The surplus provinces have the superior sectors such as construction, several
manufacturing industries, even though the poor provinces also have the superior sectors but usu-ally the primary sectors. At one side during RAP II, the surplus provinces tend to converge to the national income per capita index. However, at the other side the poor provinces show the tendency of divergence or the downward declining trend of the economy. This condition indicates that the running of autonomy program in the poor prov-inces still does not work fl uently or facing many obstacles (Soelistijo, 2010).
The declining curves of NAD and South Sumatera as the “surplus” regions are fairly good toward converging the national index, but the declining of South Sulawesi and the consistency of South Sulawesi, West Java and Central Java indices shows the divergence of the indices from the na-tional one and it is not fairly good. South Sulawesi, West Java and Central Java becoming “poorer” and divergence from the national conical axis. The special effort should be carried out to increase the “poor” regions and to converge the national index (Table 1). The effort is to enforce the sectors in the region that have the high surplus multiplier, among other, the energy and mineral resource sector (Table 2).
Figure 1. Index of national income per capita and regional income per capita, (1975-2010)

82
INDONESIAN MINING JOURNAL Vol. 15, No. 2, June 2012 : 79 - 91
In principle, the arrangement of convergence to the national income per capita index (100) could be carried out by “cross fertilization” from the “surplus” to the “minus” regions through the management of autonomy budget allocation. On the other side, the minus regions should push the prime sectors to speed up their economic growth. Therefore, the surplus regions would transfer the economic effl uent to the minus regions, and the minus regions would speed up their income per capita, then both regions would be moving toward converging to the national axis index.
Condition of Mineral Resources and Commodity Trade Management
Energy and mineral resource management
Several studies on the aspects of energy and min-eral resource management have been carried out
at the level of provinces, regencies and districts, for instance in Nanggore Aceh Darussalam (NAD) (Munthe, 2010), Rembang Regency in Central Java (Supriharjiyanto, 2006), Garut Regency and Pasirwangi District in West Java (Soelistijo, 2010), South Sulawesi and Luwu Timur Regency in South Sulawesi Province (Amrullah, 2006), Muara Enim Regency South Sumatera Province (Toni, 2009). These studies will be further clari-fi ed as follows:
a. Regional energy and mineral resource deve-lopment planning in Nanggroe Aceh Darus-salam
The inter-regency/town economic trend in Nang-groe Aceh Darussalam (NAD) Province within the period of 1993-2010 has shown trend of conver-gence of the Gross Regional Domestic Product (GRDP) per capita index of each region toward
Table 1. The several observed provinces and the trend of their GDP per capita indices
Province and National 1975 1980 1985 1990 1995 2000 2005 2007 2008 2009 2010Indonesia (national) 100 100 100 100 100 100 100 100 100 100 100Nanggroe Aceh Darussalam (NAD) 100 258 249 222 150 135 111 99 91 81 78South Sumatera 142 155 148 120 89 89 95 89 100 94 95South Sulawesi 69 63 62 55 60 57 54 51 59 63 66Central Java (Rembang Regency in it)
58 52 65 69 69 54 58 55 62 62 62
Source: Soelistijo (2010). Note: 2011 data not yet published.
Table 2. Surplus multipliers based on the Indonesia Input-Output Table of 2008
No. Sector Surplus multiplier1. Agriculture 1.242. Coal and metallic mining 1.263. Oil mining and geothermal 1.064. Non-metallic mining 1.205. Manufacturing industry 2.886. Oil refi ning 2.177. Electricity, gas and water 2.388. Construction 3.469. Trade, Hotel and Restaurant 1.7810. Transportation and Communication 1.411. Bank and other fi nancial institution 1.2912. Services 2.20
Source: Results of computation based on Indonesia Input-Output Table 2008.

83
Several Evaluation and Analytical Indicators of Regional Autonomy ... Ukar W. Soelistijo
the axis of the convergence conical axis of NAD Province valued 100. Several regions which have high percentage of mineral contribution (includ-ing oil and gas) in the GRDP within 1993-2010, are NAD Province (53.84%), East Aceh Regency (54.60%), Aceh Tamiang Regency (16.72 %), North Aceh Regency (80.52%) and Lhokseumawe (79.71%).
Within 2010-2020, in lieu with the economic growth of NAD Province the overall investment amounted to IDR 53.2 trillion is required. While the energy and mineral resource sector requires general surveying amounted to IDR 17.4 billion, and further exploration up to detail exploration requires IDR 6.9 trillion or IDR 699 billion per an-num. In this case, exploration is mainly focused in the regencies of East Aceh, Aceh Tamiang, North Aceh, Central Aceh, South Aceh, Pidie, and West Aceh (Munthe, 2010).
The most potential energy and mineral resources in NAD Province that could be potentially devel-oped, among others, are oil and gas, geothermal, coal/peat, underground water, metallic minerals and non-metallic minerals (including rocks), hence that detail and intensive exploration program is really required from now and on. Supporting the acceleration of infrastructure development, utilization of geothermal, coal/peat, underground water and industrial minerals particularly lime-stone, granite, clay, andesite, marble, sands and stone, dolomite, trass (tuffaceous rock), kaolin, serpentinite and quartz sand as raw materials of the manufacturing industry should be optimally encouraged. Furthermore, those energy and min-eral resources could be functioned as engine of economic growth toward strengthening regional resilience, mainly beyond the declining contribu-tion of oil and gas to the NAD economy due to the coming declining its reserves and production.
To maintain the economic convergence between regency/town in the NAD Province, the economic growth of NAD should be supported by the sec-ondary and tertiary sectors such as processing industry, electricity, gas and water, trade, hotel and restaurant, transportation and communica-tion and other sector of services. Those sectors would contribute added value to the economy rather than the primary sector. The government of NAD, Regency/town, and private parties both domestic and international should cooperate to implement the upstream to downstream policy from exploration up to exploitation and utilization
of NAD energy and mineral resources. In such a case, the utilization of natural resources could be optimally benefi cial for the NAD economic growth as a whole inter-regionally either at the provincial or national level.
It is valid for other regions or provinces that have similar condition of energy and mineral resource potential with the NAD Province, to encourage their resources in supporting their infrastructure and economic sector.
b. Regional mineral resource development plan-ning in Rembang Regency, Central Java
Rembang Regency is located in Central Java that acquires GRDP per capita index under the national one (100), where between 2005-2025 it would be at the value between 67 and 82. Though this regency is not very resourceful in terms of energy and minerals, it is tried to investigate the possibility of utilizing its potential resources to support its economic growth in the future.
The energy and mineral resource sector has the highest location quotient (4.74). It means that this sector has capability to create “export” the Energy and Mineral Resources (EMR) commodity to other region. The available potential deposits are limestone around 3,934 billion tonnes, an-desite about 3.180 billion tonnes, clay 909 billion tonnes, quartz sand around 309 billion tonnes, dolomite around 67 billion tonnes, tuffaceous rock 56 billion tonnes, ball clay 48.2 billion tonnes, and phosphate rock 1 billion tonnes (Regional Offi ce of Mines, Rembang Regency, 2006). However, it is just at the level of geological reserves that should be intensively explored in more detail to be proved reserves that ready for exploiting and utilizing it in the downstream industry.
Several potential manufacturing industries that could be developed in the coming years are composite fertilizer, kieserite fertilizer, pozzolan cement, light carbonate and of course still con-sistently develop home industry such as tile/brick, earthenware, burned lime and pressed cement-brick. This industry has high surplus multiplier (SM) of 4.32. The second priority is food and beverages (SM 3.35), the third one is electric-ity, gas and water (SM 3.02), construction (SM 2.77), and restaurant and hotel as well (SM 2.60). Further study based on econometric projection of non-metallic mineral utilization in 2025 concludes that the production of composite fertilizer would

84
INDONESIAN MINING JOURNAL Vol. 15, No. 2, June 2012 : 79 - 91
reach 2.4 million tonnes, lime-pozzolan cement 16.4 million tonnes, light carbonate 1.4 million tonnes for paint and paper industry. This is in line with the projection of GRDP in 2025 that would reach IDR 1.2 trillions or about twice than in 2004 and requires investment about IDR 520.4 billions, employment creation around 482,420 manpower or 1.75 times than in 2004 with the increase of employment around 2,100 men per 1 percent increase of GRDP (Supriharjiyanto, 2006).
In general, industrial minerals are found out in almost every region within country. Based on the above-mentioned investigation results, it is recom-mended allocate enough investment for manufac-turing industry that consumes non-metallic-based mineral in every region such as in Rembang Regency, such as composite fertilizer, kieserite fertilizer, pozzolan cement, light carbonate and still consistently developing the existing industry of earthenware, tile/brick, burned lime, concrete brick in terms of gain in their local added value besides developing infrastructure for local devel-opment. It is necessary to develop standardized customer plant to facilitate transaction between producer and consumer in terms of quality, quan-tity and continuity of the commodity product. Last but not the least cionducting detail exploration to get the proved reserves of all non-metallic mineral deposits as important main raw materials of those industries is also necessary.
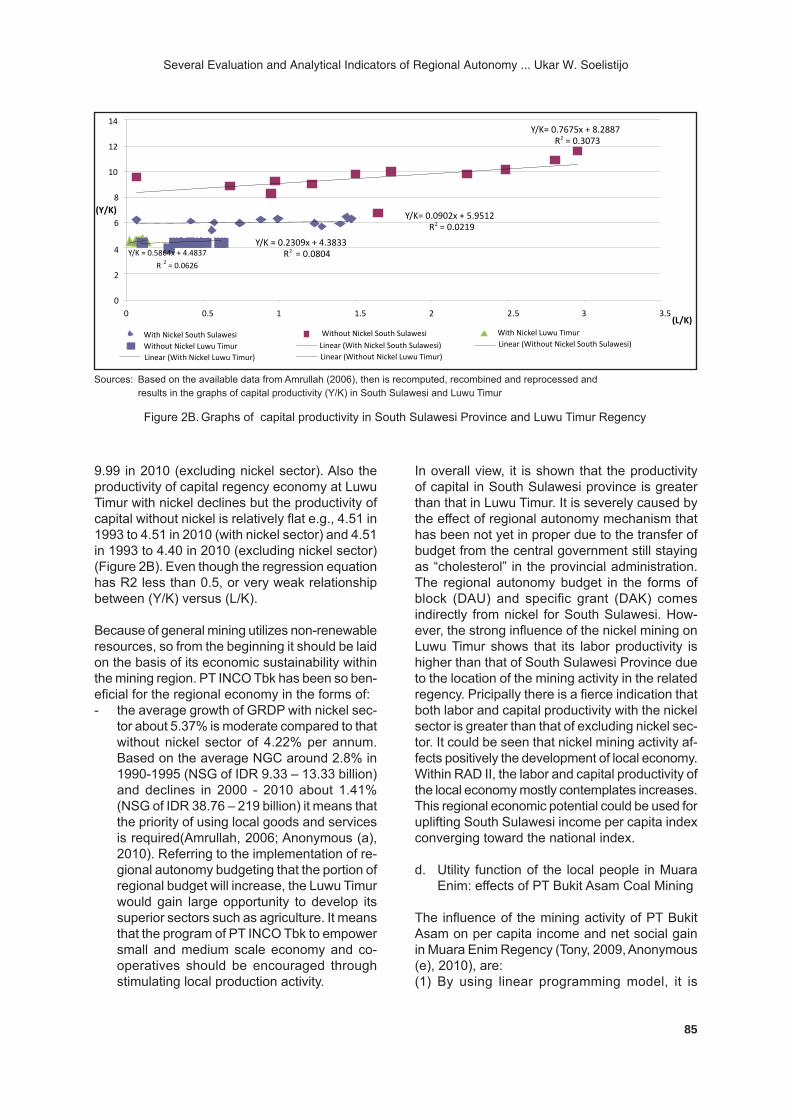
c. Economic productivity in South Sulawesi Province : The effects of PT INCO Tbk.
Recent study (1993-2010) indicates that there is a signifi cant infl uence of the PT INCO (Tbk) exis-tence in South Sulawesi to the region productivity of capital (Y/K) and the productivity of labor (K/L) (Amrullah, 2006; Anonymous (a), 2010). The nickel mining and processing plant of PT INCO Tbk is located at Luwu Timur Regency, within the Province of South Sulawesi.
At the level of the provincial economy, it shows that the productivity of labor (with or without nickel) declines, i.e. from 17.73 in 1993 down to 4.90 in 2010 (with nickel sector) and from 16.37 in 1993 to 4.70 in 2010 (excluding nickel sector). At the level of the regency economy in Luwu Timur, the pro-ductivity of labor (with or without nickel) increases, i.e. from 58.83 in 1993 to 89.88 in 2010 (with nickel sector) and from 11.69 in 1993 to 15.70 in 2010 (excluding nickel sector) as shown in Figure 2A. The regression equation of (Y/L) versus (K/L) has corelation coeffi cient (R2) greater than 0.9 or very severe relationship.
At the level of provincial economy shows that the productivity of capital with nickel declines but the productivity of capital without nickel is a little bit increase, namely, 6.18 in 1993 down to 5.99 in 2010 (with nickel sector) and 9.61 in 1993 to
Y/L = 6.0595x - 0.0531R2 = 0.9919
Y/L= 8.8906x + 0.2945R2 = 0.9707
R 2 = 0.9984
y = 4.465x + 0.8317
Y/L = 4.0857x + 0.9402R2 = 0.981
0.00
10.00
20.00
30.00
40.00
50.00
60.00
70.00
80.00
90.00
100.00
10 20 30 0(K/L)
(Y/L)
With Nickel South Sulawesi Without Nickel South SulawesiWith Nickel Luwu Timur Without Nickel Luwu TimurLinear (With Nickel South Sulawesi) Linear (Without Nickel South Sulawesi)Linear (With Nickel Luwu Timur) Linear (With Nickel Luwu Timur)Linear (Without Nickel Luwu Timur)
Sources: Based on the available data of Amrullah ( 2006), then recomputed, recombined and reprocessed and resulting the graphs of labor productivity (Y/L) in South Sulawesi Province and Luwu Timur Regency
Figure 2A. Graphs of labor productivity in South Sulawesi Province and Luwu Timur Regency
85
Several Evaluation and Analytical Indicators of Regional Autonomy ... Ukar W. Soelistijo
9.99 in 2010 (excluding nickel sector). Also the productivity of capital regency economy at Luwu Timur with nickel declines but the productivity of capital without nickel is relatively fl at e.g., 4.51 in 1993 to 4.51 in 2010 (with nickel sector) and 4.51 in 1993 to 4.40 in 2010 (excluding nickel sector) (Figure 2B). Even though the regression equation has R2 less than 0.5, or very weak relationship between (Y/K) versus (L/K).
Because of general mining utilizes non-renewable resources, so from the beginning it should be laid on the basis of its economic sustainability within the mining region. PT INCO Tbk has been so ben-efi cial for the regional economy in the forms of:- the average growth of GRDP with nickel sec-
tor about 5.37% is moderate compared to that without nickel sector of 4.22% per annum. Based on the average NGC around 2.8% in 1990-1995 (NSG of IDR 9.33 – 13.33 billion) and declines in 2000 - 2010 about 1.41% (NSG of IDR 38.76 – 219 billion) it means that the priority of using local goods and services is required(Amrullah, 2006; Anonymous (a), 2010). Referring to the implementation of re-gional autonomy budgeting that the portion of regional budget will increase, the Luwu Timur would gain large opportunity to develop its superior sectors such as agriculture. It means that the program of PT INCO Tbk to empower small and medium scale economy and co-operatives should be encouraged through stimulating local production activity.
In overall view, it is shown that the productivity of capital in South Sulawesi province is greater than that in Luwu Timur. It is severely caused by the effect of regional autonomy mechanism that has been not yet in proper due to the transfer of budget from the central government still staying as “cholesterol” in the provincial administration. The regional autonomy budget in the forms of block (DAU) and specifi c grant (DAK) comes indirectly from nickel for South Sulawesi. How-ever, the strong infl uence of the nickel mining on Luwu Timur shows that its labor productivity is higher than that of South Sulawesi Province due to the location of the mining activity in the related regency. Pricipally there is a fi erce indication that both labor and capital productivity with the nickel sector is greater than that of excluding nickel sec-tor. It could be seen that nickel mining activity af-fects positively the development of local economy. Within RAD II, the labor and capital productivity of the local economy mostly contemplates increases. This regional economic potential could be used for uplifting South Sulawesi income per capita index converging toward the national index.
d. Utility function of the local people in Muara Enim: effects of PT Bukit Asam Coal Mining
The infl uence of the mining activity of PT Bukit Asam on per capita income and net social gain in Muara Enim Regency (Tony, 2009, Anonymous (e), 2010), are:(1) By using linear programming model, it is
Figure 2B. Graphs of capital productivity in South Sulawesi Province and Luwu Timur Regency
Y/K= 0.0902x + 5.9512R2 = 0.0219
Y/K= 0.7675x + 8.2887R2 = 0.3073
Y/K = 0.5864x + 4.4837
R 2 = 0.0626
Y/K = 0.2309x + 4.3833R2 = 0.0804
0
2
4
6
8
10
12
14
0 0.5 1 1.5 2 2.5 3(L/K)
(Y/K)
3.5
Sources: Based on the available data from Amrullah (2006), then is recomputed, recombined and reprocessed and results in the graphs of capital productivity (Y/K) in South Sulawesi and Luwu Timur
Linear (With Nickel Luwu Timur) Linear (Without Nickel Luwu Timur)
Linear (Without Nickel South Sulawesi)With Nickel Luwu Timur
Linear (With Nickel South Sulawesi)Without Nickel Luwu TimurWith Nickel South Sulawesi Without Nickel South Sulawesi
86
INDONESIAN MINING JOURNAL Vol. 15, No. 2, June 2012 : 79 - 91
indicated that the optimized annual GRDP of Muara Enim Regency (MER) within 1997-2010 gains the average increase of about 17.1 % per annum greater than the actual one (based on the current value). The actual GRDP is IDR 4.2 trillion in 1997 and IDR 20 trillion in 2010 and the optimized GRDP is IDR 5.1 trillion in 1997 and IDR 26 trillion in 2010;
(2) The existence of PT BA at Tanjung Enim contributes the NSG to MER around IDR 26.9 billion in 1997 and IDR 231.0 billion, with the average annual increase of 24.7% NSG per capita is IDR 46,625 in 1997 and IDR 349,571 in 2009. Furthermore, the average annual NGC within 1997-2010 is 0.0395 or 3.95%. It means that if the company’s output increase IDR 1000, then the impact on the increase of NSG value is about IDR 39.5 or 3.95%. The average optimized NSG (IDR 4,899,463) is 17% greater than that of the average actual NSG (IDR 4,174,928). Based on the historical data within 1997-2009, the projected value of income per capita in coal sector and the value of NSG in 2025 will continuously increase to become twice than that in 2010.
The family welfare at Muara Enim is shown that the income per capita with and without coal sec-tor has been above IDR 20 million. This quantity is much higher than the category of poor family with the expenses not greater than IDR 2.8 million per capita per year. Thus, the majority of the MER community is not in the poor category, or they are grouped in the wealthy family category II and III. Based on the Pareto optimization approach, it is shown that the optimum domestic consumption and export of coal are able to make the local com-munity in prosperous life at export composition (E) 4,570,907 tonnes of coal per year and the domestic consumption (DC) 6,856,293 tonnes coal per year (composition of E/DC=40/60 as the First Scenario) or the total coal production of about 11.5 million tonnes per year. If it is based on the Second Scenario as in lieu with the Govern-ment Coal Policy at composition E/DC = 30/70, then the export composition is 3,590,213 tonnes coal per year and the domestic coal consumption 8,352,494 tonnes coal per year with the total pro-duction around 11.9 million tonnes per year.
Based on backward and forward linkages (Bulmer – Thomas, 1998), it is indicated that the secondary sector is the superior sector to develop without neglecting the third sector which usually has the
highest added value. Referring to the above-men-tioned study, it is recommended that the regional development concept, where CD in it has been composed by PT BA, will primarily use the local goods and services. This policy will support the regional added value and push raising the ability of productivity of the local entrepreneurship and stimulating the emerging potential business in the region.
In order to increase social benefi t of PT BA to Muara Enim Regency is to increase the NGC as one of indicators of an accredited mining enterprise through: (i) optimizing coal production value, so that the resulted output refl ects the ef-fective and effi cient point but still following the Government policy of Domestic Market Obliga-tion; (ii) increasing added value of employer’s service rewards and increasing the role of local employment; (iii) empowering local enterprisers/suppliers; (iv) giving priority to the role of well coordinated and integrated small enterprise/co-operatives credit, education and training, public relation assistance, utilities and infrastructure to the local community, so that it could increase income in the effort of raising the society welfare at the region. (Soelistijo, 2011).
Through the above efforts, it is expected that it would suppress the impact of the possible emerg-ing social cost caused by the existence of PT BA in Muara Enim Regency where PTBA is located. Moreover, PT BA could be able to satisfy the local community income per capita to become higher and higher in the future toward more prosperous and uplift the income per capita index that con-verge toward the national index.
Terms of Mineral Commodity Trade
Current study on the relationship between GDP, BOP, BOT and TOT submits the followings:- beyond the 1997-economic crisis up to 2010,
Indonesia balance of payment (BOP) did not any longer depend on capital account, how-ever, it was dominated initially by the surplus of current account and supported by goods (commodity) balance of trade (BOT). So far, the role of oil and gas on Indonesian economy begins decreasing, even the household con-sumption is still as the highest contribution to the Indonesian economy;
- the relationship between BOT and BOP is positive and strong, where (R2) = 0.653 and real (Soelistijo, 2009). At the other side, the

87
Several Evaluation and Analytical Indicators of Regional Autonomy ... Ukar W. Soelistijo
relationship between BOT and GDP is also still positive and signifi cant strong where (R2) = 0.689;
- the relationship between BOT of mineral with Indonesian GDP is also positive and very fi rm where (R2) = 0.935;
- the relationship between BOP and GDP is positive but not so fi rm where (R2) = 0.336;
- the relationship between BOT of national commodity with TOT of national commodity is positive and fi rm enough where (R2) = 0.731;
- in 1989, the BOT contribution to GDP was 40%, and contribution of BOT to GDP was 0.4%. In 2015, BOT of national commodity is estimated surplus around US$ 44 billion, where oil would be the negative trend and valued around US$ 13.7 billion defi cit while gas has a positive trend with surplus of US$ 12.7 billion. While mineral including coal would have positive trend with US$ 8.3 billion. Metallic mineral has surplus of US$ 5.7 bil-lion, but industrial mineral has negative BOT of US$ 387.4 million;
- in 1989, commodity that had surplus BOT and TOT greater than 1 (the fi rst group) was oil, coal, copper, nickel, gold, and rocks. Com-modity that had surplus BOT but TOT less than 1 (the second group) was aluminum, tin, and gas. On the other hand, commodity that had defi cit BOT and TOT less than 1 (the third group) was iron and steel, other metallic minerals and industrial minerals;
- in 2010, the fi rst group was copper, gold, rocks, and gas. The second one was tin, nickel, and coal. The third one was iron and steel, aluminum, other metallic minerals and industrial minerals. Oil had defi cit BOT but TOT greater than 1 (Bank of Indonesia, 2010; Fauzi, 2010).
Based on the above study, it is recommended that export promotion in terms of goods and services should be encouraged so instrumental to the economic growth. Export of coal and minerals should be endeavored as end use commodity in order to achieve optimal added value. Among nine important Indonesia mineral commodities, the promising mineral commodity is still dominated by copper, gold, natural gas and rocks with their current positive BOT and TOT greater than 1 from now and on, as far as their resources are still available in the country. Other minerals which are still promising due to their negative BOT but their greater than TOT 1 are tin, nickel and coal due to
their resources are still large in Indonesia.
Moreover, the government should create favor-able investment climate in the purpose of intensive grass root exploration of oil, coal and minerals. Initial long term research and development of extracting rare minerals as non-conventional one is necessarily required to utilize it for instance as high alloy super-conductor for fi ber and semi-con-ductor in chip industry with high added value.
Effects and Future Step of EMR Development
Condition of regional energy and mineral resource management
Current condition of regional energy and mineral resource management in Rembang Regency Central Java and Nanggroe Aceh Darussalam (NAD) indicates that certainty of the upstream side is still very weak due to the minimum avail-able geological data. In general, the energy and mineral reserves are still at the level of geological reserves. This condition should be increased up to proved reserves level to support its encourage-ment of the downstream industry. Furthermore, in-tensive grass root exploration is strongly required. In the policy side, certain incentives should be enlarged and encouraged to attract the investors in the energy and mineral resource as well.
The central government has responsibility of ca-pacity building development of the regional gov-ernment to conduct good mining practice (green mining activity) and to gain added value of energy and mineral resource sector through developing mineral base downstream industry, producing end use commodity encouraging sustainable economic development. Capacity building may include the fi elds of natural resource develop-ment management, namely, (i) governmental sub-system (regulation, public policy making, incentive/disincentive in investment); (ii) industrial sub-system (production-transportation-demand linkages to enforce trade and added value; (iii) re-gional sub-system (regional development (physi-cal and non-physical aspects); (iv) technological sub-system (effi cient and effective value added processing, environmental friendly to support sustainable development); and (v) international sub-system (trading and international institu-tional relationship). This management system is purposed to achieve the national and regional resilience as well as national goal.
88
INDONESIAN MINING JOURNAL Vol. 15, No. 2, June 2012 : 79 - 91
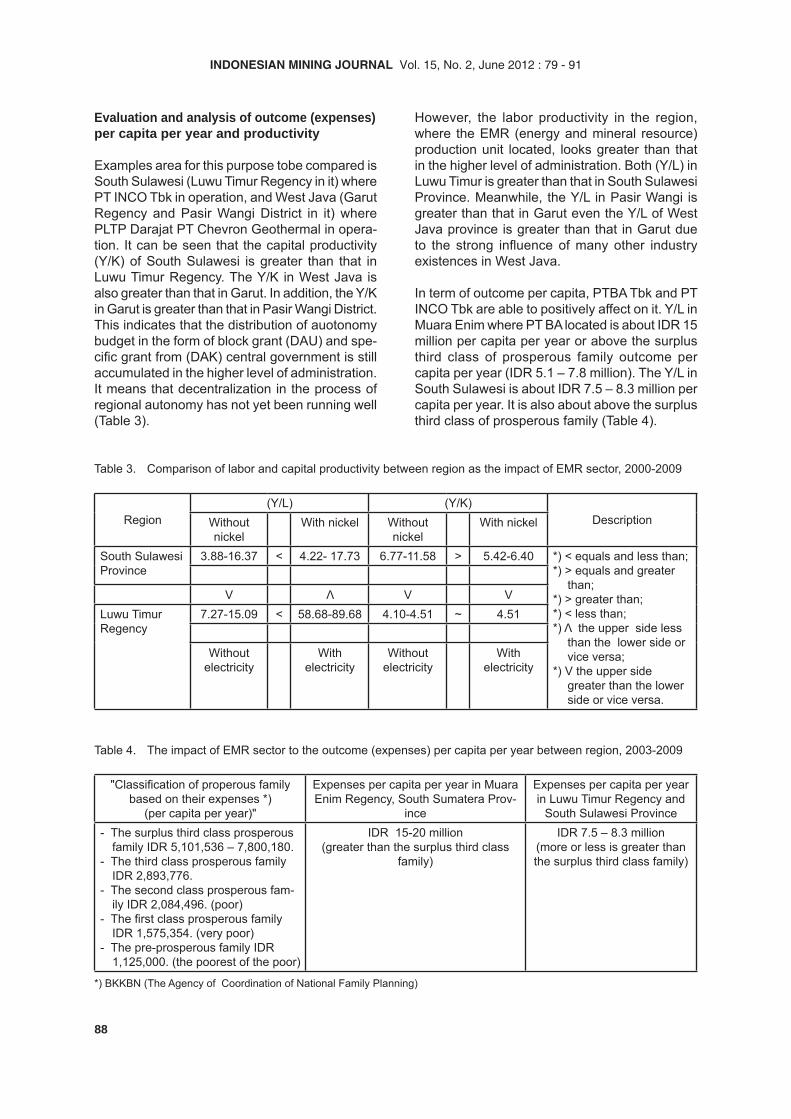
Evaluation and analysis of outcome (expenses) per capita per year and productivity
Examples area for this purpose tobe compared is South Sulawesi (Luwu Timur Regency in it) where PT INCO Tbk in operation, and West Java (Garut Regency and Pasir Wangi District in it) where PLTP Darajat PT Chevron Geothermal in opera-tion. It can be seen that the capital productivity (Y/K) of South Sulawesi is greater than that in Luwu Timur Regency. The Y/K in West Java is also greater than that in Garut. In addition, the Y/K in Garut is greater than that in Pasir Wangi District. This indicates that the distribution of auotonomy budget in the form of block grant (DAU) and spe-cifi c grant from (DAK) central government is still accumulated in the higher level of administration. It means that decentralization in the process of regional autonomy has not yet been running well (Table 3).
However, the labor productivity in the region, where the EMR (energy and mineral resource) production unit located, looks greater than that in the higher level of administration. Both (Y/L) in Luwu Timur is greater than that in South Sulawesi Province. Meanwhile, the Y/L in Pasir Wangi is greater than that in Garut even the Y/L of West Java province is greater than that in Garut due to the strong infl uence of many other industry existences in West Java.
In term of outcome per capita, PTBA Tbk and PT INCO Tbk are able to positively affect on it. Y/L in Muara Enim where PT BA located is about IDR 15 million per capita per year or above the surplus third class of prosperous family outcome per capita per year (IDR 5.1 – 7.8 million). The Y/L in South Sulawesi is about IDR 7.5 – 8.3 million per capita per year. It is also about above the surplus third class of prosperous family (Table 4).
Table 3. Comparison of labor and capital productivity between region as the impact of EMR sector, 2000-2009
Region(Y/L) (Y/K)
DescriptionWithout nickel
With nickel Without nickel
With nickel
South SulawesiProvince
3.88-16.37 < 4.22- 17.73 6.77-11.58 > 5.42-6.40 *) < equals and less than;*) > equals and greater
than;*) > greater than;*) < less than;*) Λ the upper side less
than the lower side or vice versa;
*) V the upper side greater than the lower side or vice versa.
V Λ V VLuwu Timur Regency
7.27-15.09 < 58.68-89.68 4.10-4.51 ~ 4.51
Without electricity
With electricity
Without electricity
With electricity
Table 4. The impact of EMR sector to the outcome (expenses) per capita per year between region, 2003-2009
"Classifi cation of properous family based on their expenses *)
(per capita per year)"
Expenses per capita per year in Muara Enim Regency, South Sumatera Prov-
ince
Expenses per capita per year in Luwu Timur Regency and
South Sulawesi Province- The surplus third class prosperous
family IDR 5,101,536 – 7,800,180.- The third class prosperous family
IDR 2,893,776.- The second class prosperous fam-
ily IDR 2,084,496. (poor)- The fi rst class prosperous family
IDR 1,575,354. (very poor)- The pre-prosperous family IDR
1,125,000. (the poorest of the poor)
IDR 15-20 million(greater than the surplus third class
family)
IDR 7.5 – 8.3 million(more or less is greater than the surplus third class family)
*) BKKBN (The Agency of Coordination of National Family Planning)
89
Several Evaluation and Analytical Indicators of Regional Autonomy ... Ukar W. Soelistijo
Some Strategy Thoughts of EMR Sector Development
Based on the above-mentioned indicators of the on going condition regarding the EMR status dur-ing the implementation of regional autonomy in Indonesia, some thoughts of EMR sector develop-ment strategy could be raised for supporting the regional economy convergence to the national economy as follows:a. General survey and detail exploration should
be largely launched in the fi elds of the un-known remainder of 21 natural oil and gas basins (view basins located in Sumatera and Kalimantan offshores and Java Sea, others in the Eastern Region of Indonesia), gold deposit potentials especially within the arc of inner belt and other potential areas besides other potential metallic deposits such as cop-per, tin, bauxite, nickel and other non-metallic minerals;
b. The strong efforts to gain the added value of those mineral resource domestically through the application of value added processing technology for extracting the metals includ-ing rare metals, metallic and non-metallic rare elements (e.g. thorium and yttrium in monazite associated mineral of tin, titan as ilmenite in iron sand, etc.) that will be use as super- and semi-conductor, non-metallic minerals (through developing customer plants in every potential region), utilization of geothermal to generate electricity as a prime source of energy (not just as the alternative one). This effort is for strengthening the aim of mineral industry to support of producing end use commodity through developing mineral resource-based manufacturing industry in the country;
c. Implementing good mining practice to have effectively and effi ciently utilizing energy and mineral resource that concerns with gaining optimal added value, environmental protec-tion (green mining practice), attention on CSR or community development program and solution of illegal mining;
d. All in one purpose is creating a job and income toward a welfare society.
CONCLUSION
The arrangement of convergence to the national income per capita index could be carried out by “cross fertilization” from the “surplus” to the “minus” regions through the management of au-tonomy budget allocation. On the other hand, the minus regions should push the prime or potential sectors to speed up their economic growth. In this case, the surplus regions would transfer the economic effl uent to the minus regions and the minus regions would speed up their income per capita. As a results, both regions would move toward converging to the national axis index.
In general, the energy and mining company such as PT Bukit Asam (Tbk) in South Sumatera Prov-ince and PT INCO (Tbk) in South Sulawesi Prov-ince has a positive impact to the regional economy in terms of GRDP, community development and economic productivity. NGC as a quantitative indi-cator shows that in both regions they create NGC of about 0.5 - 5%, however this amount should be increased in the future. It means that the local community has satisfi es the regional development program implemented by those companies. The NGC has increased if compared to that long time ago before the community development program launched by the GOI.
Several comprehensive indicators that could be used to evaluate the successfulness of CD pro-gram implementation are: participation of local community and sustainability in terms of human, social economic achievement and environment as well (Soelistijo, 2008).
Firm coordination between central and regional governments should increase their intensive ex-ploration program to identify distribution, locality, quality and quantity of their energy and mineral resources; This effort should also be endeavored to other resources as long as Indonesia is a re-sourceful country.
90
INDONESIAN MINING JOURNAL Vol. 15, No. 2, June 2012 : 79 - 91
REFERENCES
Amrullah, A., 2006. Kajian peran PT INCO (Tbk) da-lam mendukung pembangunan ekonomi Kabu-paten Luwu Timur – Sulawesi Selatan era otonomi daerah: Pendekatan interindustri. Tesis Program Studi Rekayasa Pertambangan, Institut Teknologi Bandung, 173 p.
Anonymous (d), 2004. Undang – Undang Nomor 32 Tahun 2004 Republik Indonesia, tentang Pemer-intah Daerah.
Anonymous (b), 2009. Undang-Undang Nomor 4 Tahun 2009, tentang Pertambangan Mineral dan Batubara.
Anonymous (c), 2009. Undang-Undang Nomor 32 Ta-hun 2009, tentang Perlindungan dan Pengelolaan Lingkungan Hidup.
Anonymous (a), 2010. Produk Domestik Regional Bruto Provinsi Sulawesi Selatan Tahun 2010. Badan Pusat Statistik Provinsi Sulawesi Selatan.
Anonymous (e), 2010. Kabupaten Muara Enim Dalam Angka Tahun 2010. Badan Statistik Kabupaten Muara Enim.
Bank Indonesia, 2010. Neraca Pembayaran Indonesia dan Posisi Investasi Indonesia: Konsep, Sumber Data, dan Metode. Jakarta, 216 halaman.
Bulmer – Thomas, V., 1998. Input – Output Analysis in Developing Countries, John Wiley & Sons Ltd., 297 p.
Eggert, R. G., 2001. Mining and Economic Sustain-ability: National Economies and Local Communi-ties. International Institute for Environment and Development, 61 p.
Fauzi, A., 2010. Analisis neraca perdagangan komoditi mineral dan batubara serta pengaruhnya terhadap neraca pembayaran dan produk domestik bruto di Indonesia, Tesis Program Studi Rekayasa Pertam-bangan, Institut Teknologi Bandung, 192 p.
Miernyk, W. H., 1965. The Element of Input-Output Analysis. Random House Inc. of Canada Limited, 156 p.
Miernyk, W.H., 1982. Regional Analysis and Regional Policy. West Virginia University, Oelgeschlager, Gunn & Hain, Publishers, Inc, Cambridge, Mas-sachusetts, 145 p.
Munthe, M., 2010. Pengaruh dan arah pengelolaan kebijakan kontribusi sektor energi dan sumber daya mineral terhadap konvergensi ekonomiantar kabupaten/kota di Provinsi Nanggroe Aceh Darus-
salam. Tesis Program Studi rekayasa Pertambang-an, Institut Teknologi Bandung, 216 p.
Yusgiantoro, P., 2000. Ekonomi Energi, Teori dan Prak-tik. Pustaka LP3ES Jakarta, 466 p.
Soelistijo, U.W., Suseno., T, Mujib, Suherman, I., Nas, C., 2003. Ekonomi Regional dan Model Penera-pannya: Pengembangan Sumber Daya Mineral dan Energi dalam Rangka Otonomi Daerah di Indonesia. Pusat Penelitian dan Pengembangan Teknologi Mineral dan Batubara, Departemen Energi dan Sumber Daya Mineral, 439 p.
Soelistijo, U.W., 2004. Kajian Pengembangan Bahan Galian Industri di Indonesia. Pusat Penelitian dan Pengembangan Teknologi Mineral dan Batubara, Bandung, 64 p.
Soelistijo, U.W., 2004. Several Applications of Input-Output Model for the Indonesian Economy. Bultein tekMIRA, Nomor 30 Tahun 12, Januari 2004, Pusat Penelitian dan Pengembangan Teknologi Mineral dan Batubara, Departemen Energi dan Sumber Daya Mineral, p. 1-8.
Soelistijo, U.W., 2005. Perdagangan Internasional Mineral dan Batubara. Catatan Kuliah Program Studi Teknik Pertambangan, ITB, 121 p.
Soelistijo, U.W., 2008. Pembangunan Regional Berkelanjutan. ITB, 240 p.
Soelistijo, U.W., 2009. Topik Khusus. Pasca Sarjana Rekayasa Pertambangan, ITB, 197 p.
Soelistijo, U.W., 2010. Kondisi Konvergensi Ekonomi Antardaerah di Indonesia, 1975-2007. Seminar In-teren Prodi Teknik Pertambangan Fakultas Teknik Universitas Islam Bandung, 2010, 26 p.
Soelistijo, U.W., Sembodo, H., 2010. Analisis Program Pengembangan Masyarakat dari PLTP Darajat PT Chevron di Kabupaten Garut – Jawa Barat. Pro-ceedings Pekan Ilmiah Fakultas Teknik Universitas Islam Bandung, Maret 2010, hal. 31-44.
Soelistijo, U.W., 2011. Dinamika Penanaman Modal Asing (PMA) Bidang Pertambangan Umum di Indonesia. Mimbar, vol. XXVII, No. 1 (Juni 2011), p. 79-86.
Soelistijo, U.W., 2011. Control of Illegal Mining (PETI) in Indonesia: Policy and Program. Indonesian Mining Journal, Volume 14 Number 1, February 2011, p. 1-16.
Sagir, S., 2009. Kapita Selekta Ekonomi Indonesia, Kencana Prenada Media Group, Jakarta. (The Se-lected Topics in The Indonesia Economy), 660 p.

91
Several Evaluation and Analytical Indicators of Regional Autonomy ... Ukar W. Soelistijo
Solow, R., Arrow, K., and Minhas, B., 1961. Capital-La-bor Substitution and Economic Effi ciency. Review of Economics and Statistics, August, 6 p.
Supriharjiyanto, 2006. Kajian prioritas sektoral dan peran sektor pertambangan/penggalian dalam rangka meningkatkan pendapatan Kabupaten Rembang – Provinsi Jawa Tengah. Tesis Program Studi Rekayasa Pertambangan, Institut Teknologi Bandung, 146 p.
Toni, 2009. Pengaruh optimasi nilai produksi batubara PT Tambangan Batubara Bukit Asam (PTBA) di Kabupaten Muara Enim untuk memenuhi kebu-tuhan batubara nasional terhadap nilai manfaat sosial bruto masyarakat setempat. Tesis Program Studi Rekayasa Pertambangan, Institut Teknologi Bandung, 183 p.
Unpublished Data (Bank Data Pertambangan), Re-gional Offi ce of Mines, Rembang Regency, 2006.
Related Documents


![Practical Analytical chemistry Section (3). Choice of Acid- Base indicators: The Equivalence Point [Theoretical] It is the point at which the added.](https://static.cupdf.com/doc/110x72/5697c0031a28abf838cc3dd9/practical-analytical-chemistry-section-3-choice-of-acid-base-indicators.jpg)


