Seven questions about supercritical fluids – towards a new fluid state diagram Daniel T. Banuti * , Muralikrishna Raju † , Peter C. Ma ‡ , and Matthias Ihme § Stanford University, Stanford, CA 94305, USA Jean-Pierre Hickey ¶ University of Waterloo, Waterloo, ON N2L 3G1, Canada In this paper, we discuss properties of supercritical and real fluids, following the over- arching question: ‘What is a supercritical fluid?’. It seems there is little common ground when researchers in our field discuss these matters as no systematic assessment of this ma- terial is available. This paper follows an exploratory approach, in which we analyze whether common terminology and assumptions have a solid footing in the underlying physics. We use molecular dynamics (MD) simulations and fluid reference data to compare physical properties of fluids with respect to the critical isobar and isotherm, and find that there is no contradiction between a fluid being supercritical and an ideal gas; that there is no difference between a liquid and a transcritical fluid; that there are different thermody- namic states in the supercritical domain which may be uniquely identified as either liquid or gaseous. This suggests a revised state diagram, in which low-temperature liquid states and higher temperature gaseous states are divided by the coexistence-line (subcritical) and pseudoboiling-line (supercritical). As a corollary, we investigate whether this implies the existence of a supercritical latent heat of vaporization and show that for pressures smaller than three times the critical pressure, any isobaric heating process from a liquid to an ideal gas state requires approximately the same amount of energy, regardless of pressure. Fi- nally, we use 1D flamelet data and large-eddy-simulation results to demonstrate that these pure fluid considerations are relevant for injection and mixing in combustion chambers. I. Introduction While supercritical fluid injection has been used for decades in liquid propellant rocket engines and gas turbines, the process is still considered not well understood. 1 Nonetheless, significant progress has been made; a set of review articles summarized the experimental 2–4 and numerical 5–7 state of knowledge. The established concepts are best illustrated by the classical visualization of an injection experiment of liquid nitrogen with a helium co-flow by Mayer et al. 8 in Fig. 1. A subcritical break-up process can be seen in Fig. 1a, where surface instabilities on the liquid nitrogen jet grow; ligaments and droplets form and separate from the jet. Acting surface tension is clearly reflected in the formation of small distinct droplets and sharp interfaces. As the pressure is increased sufficiently, the effect of surface tension becomes negligible, c.f. Fig. 1b. No sharp interface can be identified, the break-up process has been replaced by turbulent mixing. This experimental insight in turn has resulted in a switch from Lagrangian droplet-based numerical representation, to a continuous Eulerian mixing model. 3, 9 Recently, however, interest in the fundamentals is rising again. New theoretical models are being devel- oped that are concerned with the underlying molecular/physical nature of supercritical injection phenomena. Approaches can be divided into the study of interfacial phenomena of mixtures, and bulk behavior of pure * Postdoctoral Research Fellow, Department of Mechanical Engineering, Center for Turbulence Research. † Postdoctoral Research Fellow, Department of Mechanical Engineering. ‡ Graduate Research Assistant, Department of Mechanical Engineering. § Assistant Professor, Department of Mechanical Engineering, Center for Turbulence Research. ¶ Assistant Professor, Mechanical & Mechatronics Engineering. 1 of 15 American Institute of Aeronautics and Astronautics Downloaded by STANFORD UNIVERSITY on February 3, 2017 | http://arc.aiaa.org | DOI: 10.2514/6.2017-1106 55th AIAA Aerospace Sciences Meeting 9 - 13 January 2017, Grapevine, Texas AIAA 2017-1106 Copyright © 2017 by D. Banuti, P. Ma, J.-P. Hickey, M. Ihme. Published by the American Institute of Aeronautics and Astronautics, Inc., with permission. AIAA SciTech Forum

Welcome message from author
This document is posted to help you gain knowledge. Please leave a comment to let me know what you think about it! Share it to your friends and learn new things together.
Transcript
Seven questions about supercritical fluids –
towards a new fluid state diagram
Daniel T. Banuti∗, Muralikrishna Raju†, Peter C. Ma‡, and Matthias Ihme§
Stanford University, Stanford, CA 94305, USA
Jean-Pierre Hickey¶
University of Waterloo, Waterloo, ON N2L 3G1, Canada
In this paper, we discuss properties of supercritical and real fluids, following the over-arching question: ‘What is a supercritical fluid?’. It seems there is little common groundwhen researchers in our field discuss these matters as no systematic assessment of this ma-terial is available. This paper follows an exploratory approach, in which we analyze whethercommon terminology and assumptions have a solid footing in the underlying physics. Weuse molecular dynamics (MD) simulations and fluid reference data to compare physicalproperties of fluids with respect to the critical isobar and isotherm, and find that thereis no contradiction between a fluid being supercritical and an ideal gas; that there is nodifference between a liquid and a transcritical fluid; that there are different thermody-namic states in the supercritical domain which may be uniquely identified as either liquidor gaseous. This suggests a revised state diagram, in which low-temperature liquid statesand higher temperature gaseous states are divided by the coexistence-line (subcritical) andpseudoboiling-line (supercritical). As a corollary, we investigate whether this implies theexistence of a supercritical latent heat of vaporization and show that for pressures smallerthan three times the critical pressure, any isobaric heating process from a liquid to an idealgas state requires approximately the same amount of energy, regardless of pressure. Fi-nally, we use 1D flamelet data and large-eddy-simulation results to demonstrate that thesepure fluid considerations are relevant for injection and mixing in combustion chambers.
I. Introduction
While supercritical fluid injection has been used for decades in liquid propellant rocket engines and gasturbines, the process is still considered not well understood.1 Nonetheless, significant progress has beenmade; a set of review articles summarized the experimental2–4 and numerical5–7 state of knowledge. Theestablished concepts are best illustrated by the classical visualization of an injection experiment of liquidnitrogen with a helium co-flow by Mayer et al.8 in Fig. 1. A subcritical break-up process can be seen inFig. 1a, where surface instabilities on the liquid nitrogen jet grow; ligaments and droplets form and separatefrom the jet. Acting surface tension is clearly reflected in the formation of small distinct droplets andsharp interfaces. As the pressure is increased sufficiently, the effect of surface tension becomes negligible,c.f. Fig. 1b. No sharp interface can be identified, the break-up process has been replaced by turbulentmixing. This experimental insight in turn has resulted in a switch from Lagrangian droplet-based numericalrepresentation, to a continuous Eulerian mixing model.3,9
Recently, however, interest in the fundamentals is rising again. New theoretical models are being devel-oped that are concerned with the underlying molecular/physical nature of supercritical injection phenomena.Approaches can be divided into the study of interfacial phenomena of mixtures, and bulk behavior of pure
∗Postdoctoral Research Fellow, Department of Mechanical Engineering, Center for Turbulence Research.†Postdoctoral Research Fellow, Department of Mechanical Engineering.‡Graduate Research Assistant, Department of Mechanical Engineering.§Assistant Professor, Department of Mechanical Engineering, Center for Turbulence Research.¶Assistant Professor, Mechanical & Mechatronics Engineering.
1 of 15
American Institute of Aeronautics and Astronautics
Dow
nloa
ded
by S
TA
NFO
RD
UN
IVE
RSI
TY
on
Febr
uary
3, 2
017
| http
://ar
c.ai
aa.o
rg |
DO
I: 1
0.25
14/6
.201
7-11
06
55th AIAA Aerospace Sciences Meeting
9 - 13 January 2017, Grapevine, Texas
AIAA 2017-1106
Copyright © 2017 by D. Banuti, P. Ma, J.-P. Hickey, M. Ihme. Published by the American Institute of Aeronautics and Astronautics, Inc., with permission.
AIAA SciTech Forum
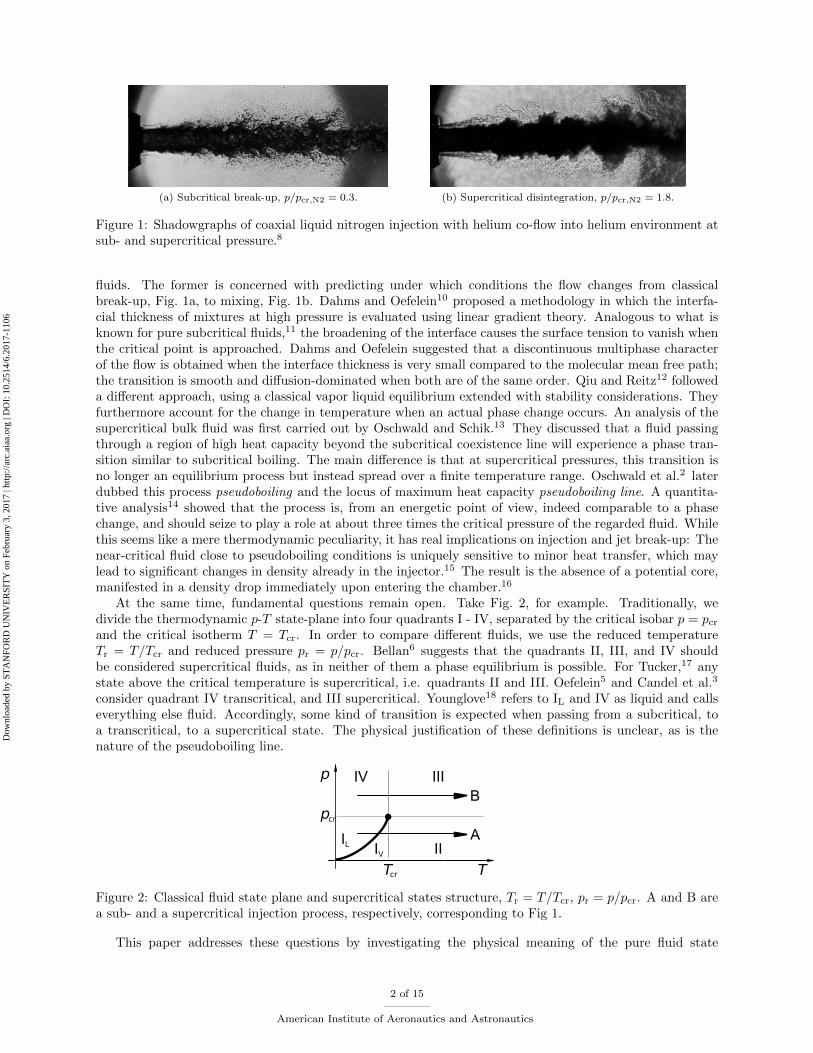
(a) Subcritical break-up, p/pcr,N2 = 0.3. (b) Supercritical disintegration, p/pcr,N2 = 1.8.
Figure 1: Shadowgraphs of coaxial liquid nitrogen injection with helium co-flow into helium environment atsub- and supercritical pressure.8
fluids. The former is concerned with predicting under which conditions the flow changes from classicalbreak-up, Fig. 1a, to mixing, Fig. 1b. Dahms and Oefelein10 proposed a methodology in which the interfa-cial thickness of mixtures at high pressure is evaluated using linear gradient theory. Analogous to what isknown for pure subcritical fluids,11 the broadening of the interface causes the surface tension to vanish whenthe critical point is approached. Dahms and Oefelein suggested that a discontinuous multiphase characterof the flow is obtained when the interface thickness is very small compared to the molecular mean free path;the transition is smooth and diffusion-dominated when both are of the same order. Qiu and Reitz12 followeda different approach, using a classical vapor liquid equilibrium extended with stability considerations. Theyfurthermore account for the change in temperature when an actual phase change occurs. An analysis of thesupercritical bulk fluid was first carried out by Oschwald and Schik.13 They discussed that a fluid passingthrough a region of high heat capacity beyond the subcritical coexistence line will experience a phase tran-sition similar to subcritical boiling. The main difference is that at supercritical pressures, this transition isno longer an equilibrium process but instead spread over a finite temperature range. Oschwald et al.2 laterdubbed this process pseudoboiling and the locus of maximum heat capacity pseudoboiling line. A quantita-tive analysis14 showed that the process is, from an energetic point of view, indeed comparable to a phasechange, and should seize to play a role at about three times the critical pressure of the regarded fluid. Whilethis seems like a mere thermodynamic peculiarity, it has real implications on injection and jet break-up: Thenear-critical fluid close to pseudoboiling conditions is uniquely sensitive to minor heat transfer, which maylead to significant changes in density already in the injector.15 The result is the absence of a potential core,manifested in a density drop immediately upon entering the chamber.16
At the same time, fundamental questions remain open. Take Fig. 2, for example. Traditionally, wedivide the thermodynamic p-T state-plane into four quadrants I - IV, separated by the critical isobar p = pcrand the critical isotherm T = Tcr. In order to compare different fluids, we use the reduced temperatureTr = T/Tcr and reduced pressure pr = p/pcr. Bellan6 suggests that the quadrants II, III, and IV shouldbe considered supercritical fluids, as in neither of them a phase equilibrium is possible. For Tucker,17 anystate above the critical temperature is supercritical, i.e. quadrants II and III. Oefelein5 and Candel et al.3
consider quadrant IV transcritical, and III supercritical. Younglove18 refers to IL and IV as liquid and callseverything else fluid. Accordingly, some kind of transition is expected when passing from a subcritical, toa transcritical, to a supercritical state. The physical justification of these definitions is unclear, as is thenature of the pseudoboiling line.
Tcr
pcr
p
T
IL IV II
IIIIV
A
B
Figure 2: Classical fluid state plane and supercritical states structure, Tr = T/Tcr, pr = p/pcr. A and B area sub- and a supercritical injection process, respectively, corresponding to Fig 1.
This paper addresses these questions by investigating the physical meaning of the pure fluid state
2 of 15
American Institute of Aeronautics and Astronautics
Dow
nloa
ded
by S
TA
NFO
RD
UN
IVE
RSI
TY
on
Febr
uary
3, 2
017
| http
://ar
c.ai
aa.o
rg |
DO
I: 1
0.25
14/6
.201
7-11
06

plane. Using microscopic data from molecular dynamics (MD) simulations, macroscopic data from the NISTdatabase, theoretical reasoning, and results from the literature, we will develop a new state diagram whichis based on local physical properties to characterize the difference between gases, liquids, and supercriticalfluids. Using flamelet and large-eddy-simulation results, we demonstrate that these pure fluid considerationsmay be relevant for combustion systems.
II. Methods
A. Molecular dynamics
The microscopic view is obtained from molecular dynamics (MD) computations. We have used the LAMMPSpackage19 to run a system with 25,600 Ar atoms in the canonical NpT (constant number of atoms N ,constant pressure p, and constant temperature T ) ensemble at different temperatures and pressures. Argon(Tcr = 150.7 K, pcr = 4.9 MPa) has been chosen as a monatomic general fluid, because its state structureis very similar to nitrogen and oxygen,14 but minimizes modeling influences. The MD simulations wereperformed with a time step of 0.25 fs using the Nose-Hoover thermostat with a coupling time constant of10 fs and Nose-Hoover barostat with a coupling time constant of 100 fs to control the temperature andpressure of the system, respectively. For each simulation, the system was first energy-minimized with aconvergence criterion of 0.1 kcal/A. The system was then equilibrated for 62.5 ps and the system energyand other properties were averaged for the following 62.5 ps of the production run. The simulations wereperformed at pressures of 0.7, 1.4, 3.0 and 9.4 pcr at temperatures ranging from 75 K to 235 K in 5 Kintervals. We observe that a 5 K temperature interval is sufficient to illustrate the energetic and structuraldifferences between the liquid to vapor phase transition at sub- and supercritical pressures. To quantitativelyinvestigate the structural characteristics, we compute the radial distribution function (RDF)
g(r) = limdr→0
p(r)
4π(Npairs/V )r2 dr, (1)
with the distance between a pair of atoms r, the average number of atom pairs p(r) at a distance between rand r + dr, the total volume of the system V , and the number of pairs of atoms Npairs.
20
B. Large-eddy-simulation
Large-eddy-simulations (LES) are carried out using CharLESx, the massively parallel, finite-volume solverdeveloped at the Center for Turbulence Research of Stanford University. The method is discussed in detailelsewhere,21–23 only a brief overview will be given here. Time advancement is carried out using a strongstability preserving 3rd-order Runge-Kutta scheme. The convective flux is discretized using a sensor-basedhybrid scheme in which a high-order, non-dissipative scheme is combined with a low-order, dissipative schemeto minimize the numerical dissipation. Due to the large density gradients across the pseudoboiling14 regionunder transcritical conditions, an entropy-stable flux correction technique as well as a double-flux approachare used22–24 to ensure the physical realizability of the numerical solutions and dampen the non-linearinstabilities in the numerical schemes. The Peng-Robinson25 equation of state is used to account for realfluid effects using the canonical approach,9 combustion is modeled using the Flamelet-Progress-Variablemethod.26,27
C. Flamelet
The method is described in detail in,28 an overview will be provided here. Following the flamelet assumptions(Peters29) a profile through a diffusion flame can be represented by a 1D-counterflow diffusion flame, depend-ing only on the boundary conditions and the strain rate. The axisymmetric, laminar counterflow diffusionflame admits a self-similar solution and can be simplified to a one-dimensional problem.30,31 The governing
3 of 15
American Institute of Aeronautics and Astronautics
Dow
nloa
ded
by S
TA
NFO
RD
UN
IVE
RSI
TY
on
Febr
uary
3, 2
017
| http
://ar
c.ai
aa.o
rg |
DO
I: 1
0.25
14/6
.201
7-11
06
equations including continuity, radial momentum, species and temperature equations can be written as
d
dx(ρu) + 2ρV = 0 , (2a)
ρudV
dx+ ρV 2 =
d
dx(µ
dV
dx)− Λ , (2b)
ρudYkdx
+dJkdx
= ωk , (2c)
ρucpdT
dx=
d
dx(λ
dT
dx)−
∑k
Jkdhkdx−∑k
ωkhk , (2d)
where conventional notations are used, V = v/r, Λ = (∂p/∂r)/r, hk is the partial enthalpy of species k,and Jk = ρYkVk is the diffusion flux for species k. The governing equations and the equation of stateare implemented in the Cantera package,32 we use the Peng-Robinson equation of state25 to account forthermodynamic real fluid effects. A high-pressure chemical kinetic mechanism from Burke et al.33 is usedfor the H2/O2 combustion accounting for 8 species and 27 reactions. We use a formulation of the mixturefraction Z based on the hydrogen atom, as used by Lacaze and Oefelein:34
ZH = WH
(2YH2
WH2
+YHWH
+ 2YH2O
WH2O+YOH
WOH+YHO2
WHO2
+ 2YH2O2
WH2O2
), (3)
where Yα and Wα are mass fraction and molecular weight, respectively.
III. Seven questions about supercritical fluids
A. Is there only one kind of supercritical fluid?
It is common knowledge that there exists no physical observable to distinguish different regions in thesupercritical state space beyond the critical point.35 In the introduction, we listed different naming definitionsof the state quadrants – none of which went into details about differentiating supercritical states from aphysical perspective.
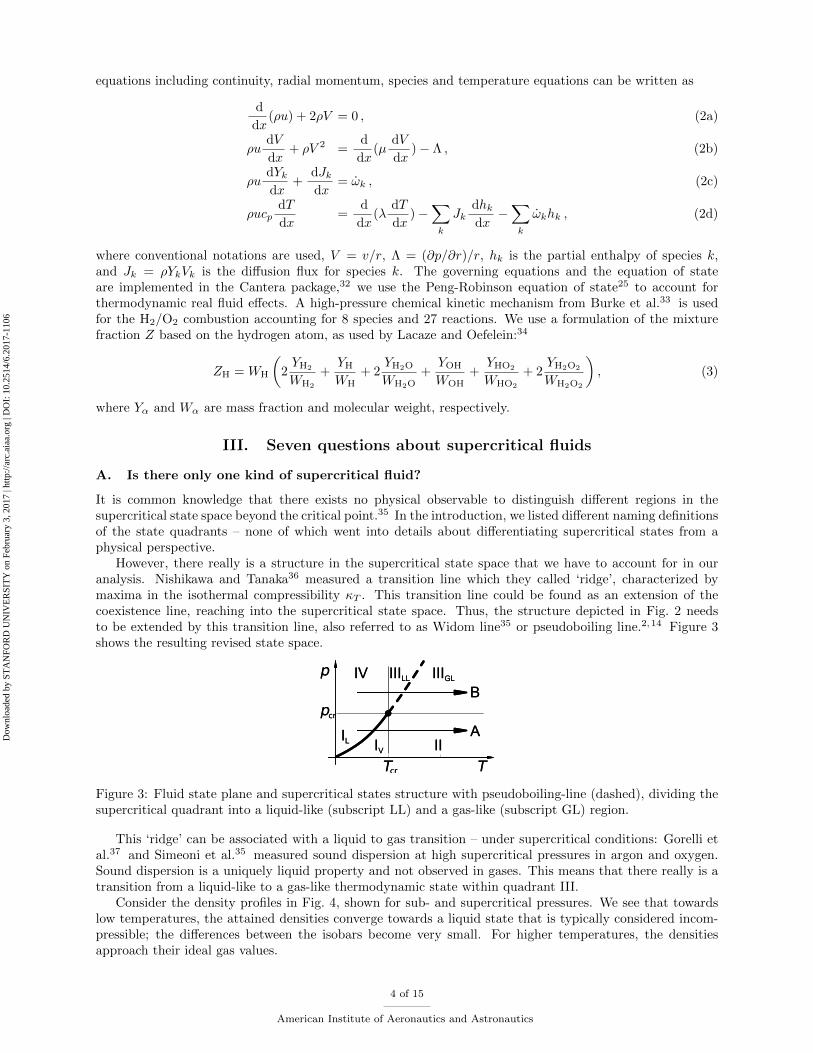
However, there really is a structure in the supercritical state space that we have to account for in ouranalysis. Nishikawa and Tanaka36 measured a transition line which they called ‘ridge’, characterized bymaxima in the isothermal compressibility κT . This transition line could be found as an extension of thecoexistence line, reaching into the supercritical state space. Thus, the structure depicted in Fig. 2 needsto be extended by this transition line, also referred to as Widom line35 or pseudoboiling line.2,14 Figure 3shows the resulting revised state space.
Tcr
pcr
p
T
IL IV II
IIIGLIV
A
BIIILL
Tcr
pcr
p
T
IL IV II
IIIGLIV
A
BIIILL
Figure 3: Fluid state plane and supercritical states structure with pseudoboiling-line (dashed), dividing thesupercritical quadrant into a liquid-like (subscript LL) and a gas-like (subscript GL) region.
This ‘ridge’ can be associated with a liquid to gas transition – under supercritical conditions: Gorelli etal.37 and Simeoni et al.35 measured sound dispersion at high supercritical pressures in argon and oxygen.Sound dispersion is a uniquely liquid property and not observed in gases. This means that there really is atransition from a liquid-like to a gas-like thermodynamic state within quadrant III.
Consider the density profiles in Fig. 4, shown for sub- and supercritical pressures. We see that towardslow temperatures, the attained densities converge towards a liquid state that is typically considered incom-pressible; the differences between the isobars become very small. For higher temperatures, the densitiesapproach their ideal gas values.
4 of 15
American Institute of Aeronautics and Astronautics
Dow
nloa
ded
by S
TA
NFO
RD
UN
IVE
RSI
TY
on
Febr
uary
3, 2
017
| http
://ar
c.ai
aa.o
rg |
DO
I: 1
0.25
14/6
.201
7-11
06
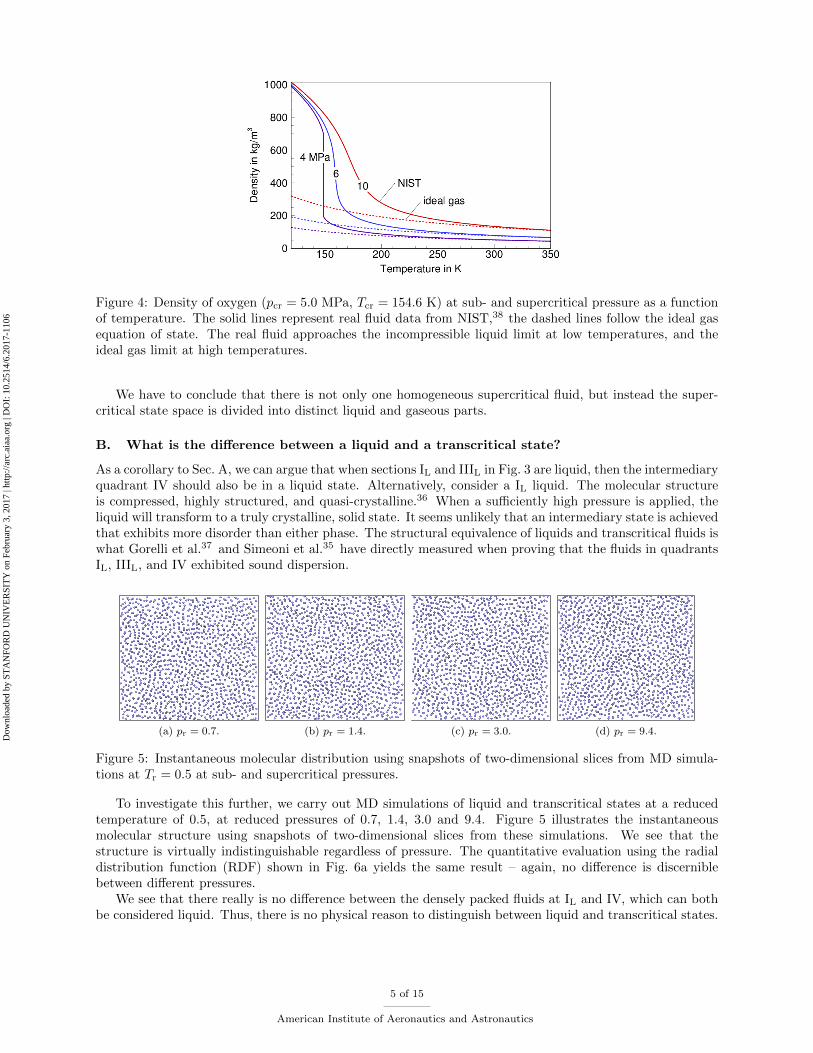
Figure 4: Density of oxygen (pcr = 5.0 MPa, Tcr = 154.6 K) at sub- and supercritical pressure as a functionof temperature. The solid lines represent real fluid data from NIST,38 the dashed lines follow the ideal gasequation of state. The real fluid approaches the incompressible liquid limit at low temperatures, and theideal gas limit at high temperatures.
We have to conclude that there is not only one homogeneous supercritical fluid, but instead the super-critical state space is divided into distinct liquid and gaseous parts.
B. What is the difference between a liquid and a transcritical state?
As a corollary to Sec. A, we can argue that when sections IL and IIIL in Fig. 3 are liquid, then the intermediaryquadrant IV should also be in a liquid state. Alternatively, consider a IL liquid. The molecular structureis compressed, highly structured, and quasi-crystalline.36 When a sufficiently high pressure is applied, theliquid will transform to a truly crystalline, solid state. It seems unlikely that an intermediary state is achievedthat exhibits more disorder than either phase. The structural equivalence of liquids and transcritical fluids iswhat Gorelli et al.37 and Simeoni et al.35 have directly measured when proving that the fluids in quadrantsIL, IIIL, and IV exhibited sound dispersion.
(a) pr = 0.7. (b) pr = 1.4. (c) pr = 3.0. (d) pr = 9.4.
Figure 5: Instantaneous molecular distribution using snapshots of two-dimensional slices from MD simula-tions at Tr = 0.5 at sub- and supercritical pressures.
To investigate this further, we carry out MD simulations of liquid and transcritical states at a reducedtemperature of 0.5, at reduced pressures of 0.7, 1.4, 3.0 and 9.4. Figure 5 illustrates the instantaneousmolecular structure using snapshots of two-dimensional slices from these simulations. We see that thestructure is virtually indistinguishable regardless of pressure. The quantitative evaluation using the radialdistribution function (RDF) shown in Fig. 6a yields the same result – again, no difference is discerniblebetween different pressures.
We see that there really is no difference between the densely packed fluids at IL and IV, which can bothbe considered liquid. Thus, there is no physical reason to distinguish between liquid and transcritical states.
5 of 15
American Institute of Aeronautics and Astronautics
Dow
nloa
ded
by S
TA
NFO
RD
UN
IVE
RSI
TY
on
Febr
uary
3, 2
017
| http
://ar
c.ai
aa.o
rg |
DO
I: 1
0.25
14/6
.201
7-11
06
(a) Tr = 0.5. No difference is dis-cernible between sub- and super-critical pressures.
(b) Tr = 1.6. The transition frommonotonous (gaseous) to oscilla-tory (liquid) behavior can be ob-served as the pressure is increased.
Figure 6: Radial distribution function from MD for the reduced pressures 0.7, 1.4, 3.0 and 9.4.
C. Can a supercritical fluid be an ideal gas?
Figure 4 shows that even at supercritical pressures, the real fluid density approaches its ideal gas value atsufficiently high temperatures. In order to investigate this more systematically, we carry out MD simulationsof gaseous and supercritical states at a reduced temperature of 1.6, at reduced pressures of 0.7, 1.4, 3.0 and9.4. Figure 5 illustrates the change in the molecular distribution from a gas with little molecular interaction atpr = 0.7 to a denser packed fluid at pr = 9.4. The RDF in Fig. 6b reveals the monotonous declining behaviorcharacteristic of gases39 at pr = 0.7 and 1.4, and the oscillatory character signifying liquid behavior39 atpr = 3.0 and 9.4. At the investigated pressures, however, the liquid character is clearly weaker than inthe systems shown in Fig. 6a, with a reduced range structure. Nonetheless, the gaseous supercritical stateencourages further investigation.
(a) pr = 0.7. (b) pr = 1.4. (c) pr = 3.0. (d) pr = 9.4.
Figure 7: Instantaneous molecular distribution using snapshots of two-dimensional slices from MD simula-tions at Tr = 1.6 at sub- and supercritical pressures.
For a finer scan of the fluid p-T state space, we evaluate the compressibility factor Z as a measure of thedeviation of a fluid from ideal gas behavior. It is defined as
Z =p
ρRT, (4)
with the gas constant R. Z is the nondimensional ratio of the real fluid pressure to the pressure an idealgas at identical density ρ, and temperature T would exert. In an ideal gas, Z ≡ 1. The compressibilityfactor can thus be interpreted as a measure of molecular interaction. Figure 8 shows the distribution ofZ in the nondimensional pr-Tr plane. The ideal gas equation of state is strictly only valid along a line,approaching Tr = 2.5 for vanishing pressurea. This is in accordance with the analytical evaluation of vander Waals’ equation of state.41 However, by allowing for a 5% deviation, the region of applicability expands
aThis corresponds to Boyle’s temperature.40
6 of 15
American Institute of Aeronautics and Astronautics
Dow
nloa
ded
by S
TA
NFO
RD
UN
IVE
RSI
TY
on
Febr
uary
3, 2
017
| http
://ar
c.ai
aa.o
rg |
DO
I: 1
0.25
14/6
.201
7-11
06

significantly; it is shown as the shaded area. Figure 8 reveals that there is no contradiction between afluid being supercritical and an ideal gas simultaneously: For Tr > 2, the ideal gas domain extends to highpressures; for pr < 6, the deviation is smaller than 10 %, for pr < 3, the deviation does not exceed 5 %.It becomes clear that the critical isobar and isotherm do not coincide with any fluid property boundaries.The Z = 1 line does not reach the coexistence line; Z = 0.95 is reached only for very low pressures: vapordoes not behave like an ideal gas except for very low pressures. At pr = 0.3, the error in calculated pressureby using an ideal gas equation of state for the equilibrium vapor amounts to 20% (Z = 0.8), at pr = 0.8 itreaches 40% (Z = 0.6).
We conclude that a supercritical fluid may well be characterized as an ideal gas for T > 2Tcr and p < 3pcr.
Figure 8: Real gas compressibility Z (solid lines) in pure fluid pr-Tr diagram. Dashed lines are isochors.Regions of less than 5% deviation from ideal gas behavior are shaded. The critical point is marked by thered circle. Data from NIST38 for nitrogen.
D. Are supercritical fluid properties insensitive to small changes in p and T?
From the classical view of the supercritical state space in quadrant III as homogeneous and featureless, onecould conclude that the fluid state is insensitive to minor changes in pressure or temperature. Instead, we haveidentified a new transition across the pseudoboiling-line, whose properties we need to investigate. Figure 9compares the change in density and isobaric specific heat capacity of oxygen upon crossing the coexistenceline at 5 MPa, with the supercritical pseudoboiling transition at 7 and 10 MPa. The divergence of the heatcapacity vanishes at supercritical pressures, it is replaced with finite but pronounced heat capacity peaks,significantly exceeding the liquid and gaseous limit values. This introduces a strong sensitivity: consider the7 MPa isobar in Fig. 9. Around the pseudoboiling temperature of 162.5 K, a ±2.5 K variation introduces achange in density from 600 to 400 kg/m3. This is important to keep in mind during design and interpretationof experiments.
We thus need to be able to predict the state of maximum sensitivity. Figure 9 shows that the corre-sponding pseudoboiling temperature is a function of pressure. For simple fluids, such as nitrogen, oxygen,methane, this relation can be expressed in the following form,14
pr = exp [As (Tr − 1)] ; As species dependent. (5)
For molecules exhibiting more complex behavior, the extended relation
pr = exp [A′ (Tr − 1)a] ; A′, a species dependent. (6)
yields improved accuracy.42 Data for As,A′, and a are obtained by fitting and are compiled in Table 1 for
several species relevant for combustion. Figure 10 evaluates Eq. (6) for the propellants hydrogen and oxygen,and the combustion product water.
7 of 15
American Institute of Aeronautics and Astronautics
Dow
nloa
ded
by S
TA
NFO
RD
UN
IVE
RSI
TY
on
Febr
uary
3, 2
017
| http
://ar
c.ai
aa.o
rg |
DO
I: 1
0.25
14/6
.201
7-11
06

Figure 9: Density (solid black lines) and specific isobaric heat capacity (dashed red lines) for a sub- and twosupercritical pressures. The supercritical transition through the pseudoboiling line, indicated by the peakin cp, is similar to subcritical boiling when maxima in thermal expansion and heat capacity are regarded.Data for oxygen from NIST38 for nitrogen.
Species As A′ a
H2 4.137 3.098 0.849
O2 5.428 5.428 1.0
N2 5.589 5.589 1.0
CH4 5.386 5.386 1.0
C6H14 6.688 5.365 0.921
CO2 6.470 8.256 1.102
H2O 6.479 5.448 0.911
Table 1: Slope of the pseudoboiling-line for a number of species obtained from NIST.38
Reduced temperature Tr
Re
du
ce
d p
ressu
re p
r
1 1.05 1.1 1.15 1.2 1.25 1.31
1.5
2
2.5
3
Figure 10: Comparison of pseudoboiling-line fluid data (symbols) and correlations Eq. (5) and (6) withAs, A
′, a.
E. What is the significance of the critical temperature and pressure?
Having demonstrated that liquid and ideal gas states prevail upon crossing the critical pressure raises thequestion of the physical significance of the critical isobar and isotherm. From a microscopic perspective,
8 of 15
American Institute of Aeronautics and Astronautics
Dow
nloa
ded
by S
TA
NFO
RD
UN
IVE
RSI
TY
on
Febr
uary
3, 2
017
| http
://ar
c.ai
aa.o
rg |
DO
I: 1
0.25
14/6
.201
7-11
06

interatomic interactions can be expressed in terms of interatomic potentials. Molecules are surrounded byforce fields, with attractive and repulsive components. In a liquid, atoms and molecules are closely packed asthey are trapped in each others’ potential fields. However, as the temperature increases, so does the averagekinetic energy of the molecules.43 At a certain temperature, the kinetic energy of the molecules is sufficientto leave the potential well; molecules can no longer confine each other in the potential field. This impliesthat the critical temperature is approximately proportional to the potential well depth; this is used e.g. byGiovangigli et al.44 to estimate critical temperatures of radicals for combustion simulations. When thistemperature is reached, the coexistence line terminates at the critical point; the critical pressure is then thevapor pressure at the critical temperature. More technically, the properties of the phases become identicalat the critical point – the difference between liquid and gas vanishes. In a mixture, also the composition isidentical. However, this does not imply any relevance away from the coexistence line.
F. Is less energy required to vaporize a supercritical fluid?
As the latent heat of vaporization decreases with rising pressure and vanishes at the critical point,40 onecould hypothesize that the supercritical process B in Fig. 3 would require less energy than the subcriticalprocess A. However, we have shown that for pr < 3, both processes sub- and supercritical processes describethe transformation from a liquid to a an ideal gas state. Thus, from the molecular perspective depicted inFig. 11, the endpoints of both processes are essentially indistinguishable.
Figure 11: In order to transform the liquid to a gaseous state, the molecules have to be separated from theirrespective force-fields. Snapshots of molecular structure obtained from MD computations at a liquid (left),transitional (mid), and gaseous (right) state.
Tcr
pcrA1
p
T
B1 B2
A2δh
Figure 12: In order to assess the excess latent heat δh required to heat a fluid from a liquid to a gaseousstate at a subcritical pressure A1 → A2 compared to the supercritical case B1 → B2, the process from A1
to B2 is analyzed.
To study the difference between the sub- and the supercritical case, regard the processes illustrated inFig. 12, where A1 / B1, and A2 / B2 are identical to start and end conditions of the processes A and B ofFigure 3, respectively. We can introduce δh as the excess enthalpy required to vaporize the subcritical fluidcompared to the supercritical process without latent heat,
δh = (hB2 − hB1)− (hA2 − hA1). (7)
Any process from A1 to B2 requires the same amount of energy, regardless of the path taken,
hB2 − hA1 = (hB2 − hA2) + (hA2 − hA1) = (hB2 − hB1) + (hB1 − hA1). (8)
Combining Eqs. (7) and (8) yields
δh = (hB2 − hA2)− (hB1 − hA1), (9)
9 of 15
American Institute of Aeronautics and Astronautics
Dow
nloa
ded
by S
TA
NFO
RD
UN
IVE
RSI
TY
on
Febr
uary
3, 2
017
| http
://ar
c.ai
aa.o
rg |
DO
I: 1
0.25
14/6
.201
7-11
06
reducing the problem to a caloric evaluation of isothermal compression. When we assume A2 / B2 to bestates at the same sufficiently high temperature to yield ideal gas properties (i.e. T > 2Tcr), the enthalpy ispressure-independent and an isothermal compression A2 → B2 requires negligible energy. Then, the energeticdifference between the processes A1 → A2 and B1 → B2 solely depends on the liquid compression A1 → B1.Figure 13 shows that isothermal compression of a liquid requires negligible energy compared to the latentheat of vaporization, even close to the critical pressure. Thus,
δh =�����
�:0(hB2 − hA2)−���
���:0
(hB1 − hA1). (10)
and we conclude that the energetic difference between the subcritical and the supercritical heating processis negligible.
Pressure in MPa
Sp
ecific
enth
alp
y in k
J/k
g
0 5 10 15 20150
100
50
0
50
100
150
200
100 K
120 K
150 K
Figure 13: Change in enthalpy for isothermal compression at subcritical temperatures (liquid limit). Oncethe fluid is condensed (discontinuous step-down), the change in enthalpy is negligible compared to the latentheat even close to the critical point.
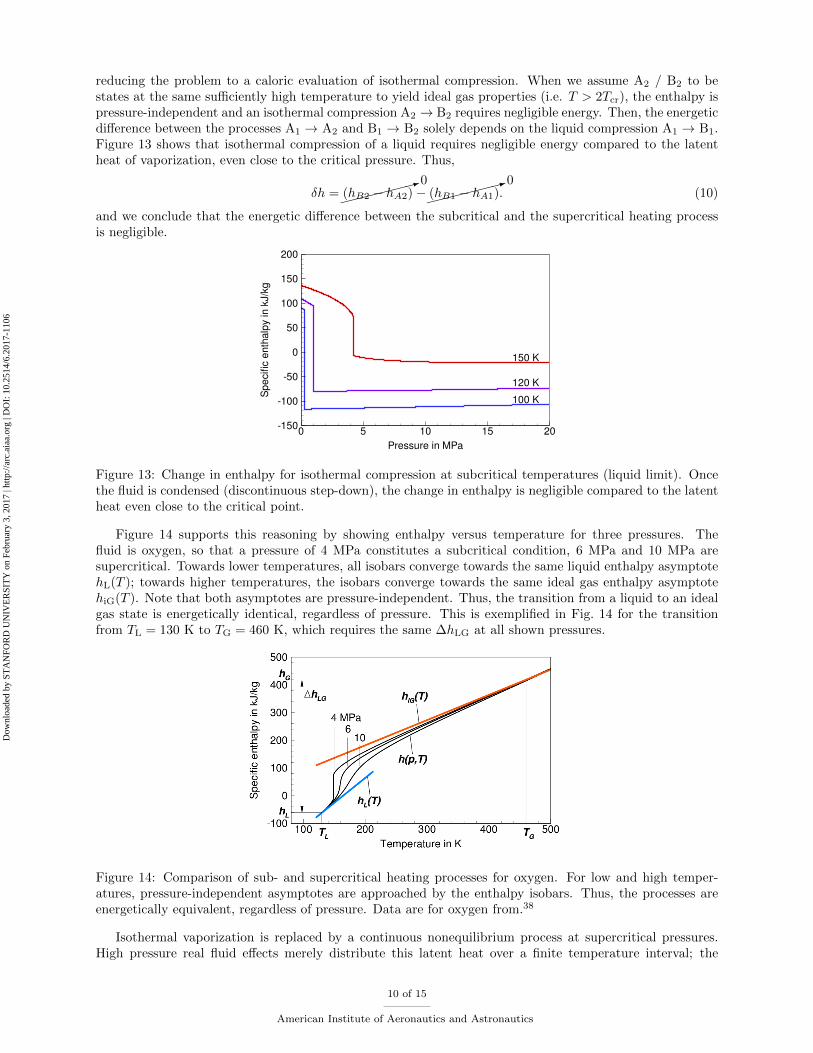
Figure 14 supports this reasoning by showing enthalpy versus temperature for three pressures. Thefluid is oxygen, so that a pressure of 4 MPa constitutes a subcritical condition, 6 MPa and 10 MPa aresupercritical. Towards lower temperatures, all isobars converge towards the same liquid enthalpy asymptotehL(T ); towards higher temperatures, the isobars converge towards the same ideal gas enthalpy asymptotehiG(T ). Note that both asymptotes are pressure-independent. Thus, the transition from a liquid to an idealgas state is energetically identical, regardless of pressure. This is exemplified in Fig. 14 for the transitionfrom TL = 130 K to TG = 460 K, which requires the same ∆hLG at all shown pressures.
Figure 14: Comparison of sub- and supercritical heating processes for oxygen. For low and high temper-atures, pressure-independent asymptotes are approached by the enthalpy isobars. Thus, the processes areenergetically equivalent, regardless of pressure. Data are for oxygen from.38
Isothermal vaporization is replaced by a continuous nonequilibrium process at supercritical pressures.High pressure real fluid effects merely distribute this latent heat over a finite temperature interval; the
10 of 15
American Institute of Aeronautics and Astronautics
Dow
nloa
ded
by S
TA
NFO
RD
UN
IVE
RSI
TY
on
Febr
uary
3, 2
017
| http
://ar
c.ai
aa.o
rg |
DO
I: 1
0.25
14/6
.201
7-11
06
energy supplied is used to increase temperature and overcome molecular forces simultaneously (Oschwaldand Schik,13 Banuti14). Intermolecular forces do not just vanish when a liquid is compressed beyond thecritical pressure; the energy needed to overcome them needs to be supplied regardless of pressure.
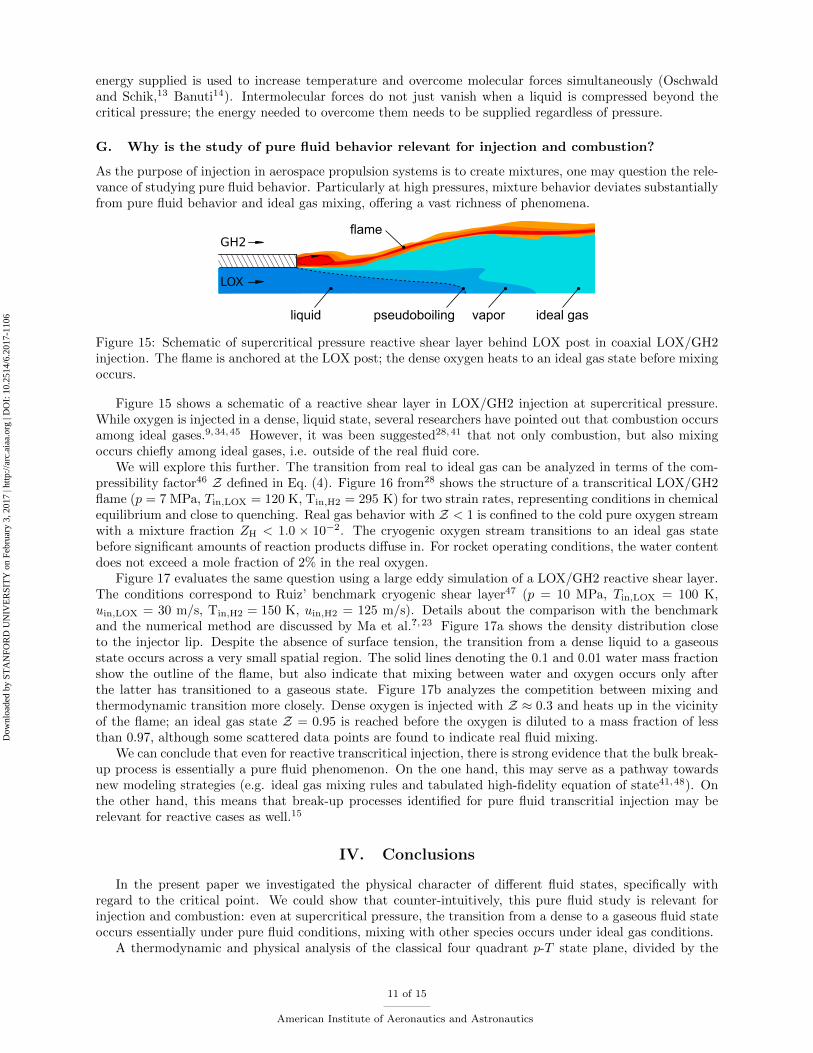
G. Why is the study of pure fluid behavior relevant for injection and combustion?
As the purpose of injection in aerospace propulsion systems is to create mixtures, one may question the rele-vance of studying pure fluid behavior. Particularly at high pressures, mixture behavior deviates substantiallyfrom pure fluid behavior and ideal gas mixing, offering a vast richness of phenomena.
GH2
LOX
liquid vapor ideal gaspseudoboiling
flame
Figure 15: Schematic of supercritical pressure reactive shear layer behind LOX post in coaxial LOX/GH2injection. The flame is anchored at the LOX post; the dense oxygen heats to an ideal gas state before mixingoccurs.
Figure 15 shows a schematic of a reactive shear layer in LOX/GH2 injection at supercritical pressure.While oxygen is injected in a dense, liquid state, several researchers have pointed out that combustion occursamong ideal gases.9,34,45 However, it was been suggested28,41 that not only combustion, but also mixingoccurs chiefly among ideal gases, i.e. outside of the real fluid core.
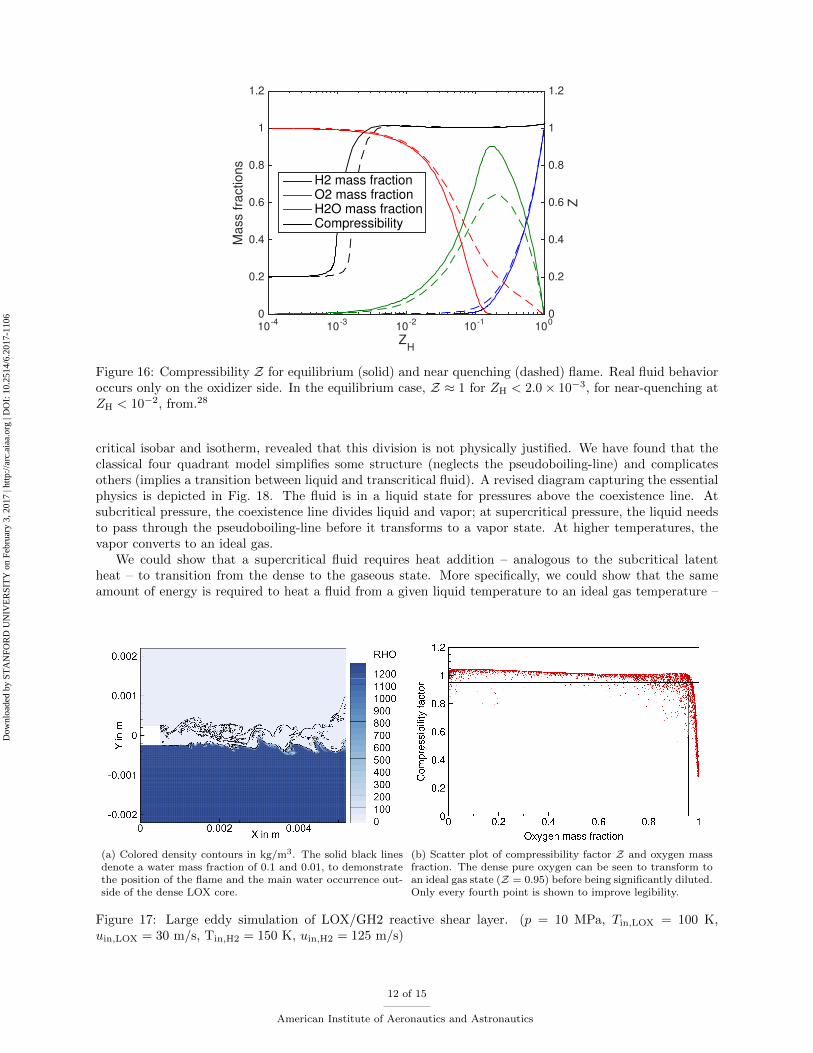
We will explore this further. The transition from real to ideal gas can be analyzed in terms of the com-pressibility factor46 Z defined in Eq. (4). Figure 16 from28 shows the structure of a transcritical LOX/GH2flame (p = 7 MPa, Tin,LOX = 120 K, Tin,H2 = 295 K) for two strain rates, representing conditions in chemicalequilibrium and close to quenching. Real gas behavior with Z < 1 is confined to the cold pure oxygen streamwith a mixture fraction ZH < 1.0 × 10⁻². The cryogenic oxygen stream transitions to an ideal gas statebefore significant amounts of reaction products diffuse in. For rocket operating conditions, the water contentdoes not exceed a mole fraction of 2% in the real oxygen.
Figure 17 evaluates the same question using a large eddy simulation of a LOX/GH2 reactive shear layer.The conditions correspond to Ruiz’ benchmark cryogenic shear layer47 (p = 10 MPa, Tin,LOX = 100 K,uin,LOX = 30 m/s, Tin,H2 = 150 K, uin,H2 = 125 m/s). Details about the comparison with the benchmarkand the numerical method are discussed by Ma et al.?, 23 Figure 17a shows the density distribution closeto the injector lip. Despite the absence of surface tension, the transition from a dense liquid to a gaseousstate occurs across a very small spatial region. The solid lines denoting the 0.1 and 0.01 water mass fractionshow the outline of the flame, but also indicate that mixing between water and oxygen occurs only afterthe latter has transitioned to a gaseous state. Figure 17b analyzes the competition between mixing andthermodynamic transition more closely. Dense oxygen is injected with Z ≈ 0.3 and heats up in the vicinityof the flame; an ideal gas state Z = 0.95 is reached before the oxygen is diluted to a mass fraction of lessthan 0.97, although some scattered data points are found to indicate real fluid mixing.
We can conclude that even for reactive transcritical injection, there is strong evidence that the bulk break-up process is essentially a pure fluid phenomenon. On the one hand, this may serve as a pathway towardsnew modeling strategies (e.g. ideal gas mixing rules and tabulated high-fidelity equation of state41,48). Onthe other hand, this means that break-up processes identified for pure fluid transcritial injection may berelevant for reactive cases as well.15
IV. Conclusions
In the present paper we investigated the physical character of different fluid states, specifically withregard to the critical point. We could show that counter-intuitively, this pure fluid study is relevant forinjection and combustion: even at supercritical pressure, the transition from a dense to a gaseous fluid stateoccurs essentially under pure fluid conditions, mixing with other species occurs under ideal gas conditions.
A thermodynamic and physical analysis of the classical four quadrant p-T state plane, divided by the
11 of 15
American Institute of Aeronautics and Astronautics
Dow
nloa
ded
by S
TA
NFO
RD
UN
IVE
RSI
TY
on
Febr
uary
3, 2
017
| http
://ar
c.ai
aa.o
rg |
DO
I: 1
0.25
14/6
.201
7-11
06
ZH
10-4
10-3
10-2
10-1
100
Mass fra
ctions
0
0.2
0.4
0.6
0.8
1
1.2
Z
0
0.2
0.4
0.6
0.8
1
1.2
H2 mass fractionO2 mass fractionH2O mass fractionCompressibility
Figure 16: Compressibility Z for equilibrium (solid) and near quenching (dashed) flame. Real fluid behavioroccurs only on the oxidizer side. In the equilibrium case, Z ≈ 1 for ZH < 2.0× 10⁻³, for near-quenching atZH < 10−2, from.28
critical isobar and isotherm, revealed that this division is not physically justified. We have found that theclassical four quadrant model simplifies some structure (neglects the pseudoboiling-line) and complicatesothers (implies a transition between liquid and transcritical fluid). A revised diagram capturing the essentialphysics is depicted in Fig. 18. The fluid is in a liquid state for pressures above the coexistence line. Atsubcritical pressure, the coexistence line divides liquid and vapor; at supercritical pressure, the liquid needsto pass through the pseudoboiling-line before it transforms to a vapor state. At higher temperatures, thevapor converts to an ideal gas.
We could show that a supercritical fluid requires heat addition – analogous to the subcritical latentheat – to transition from the dense to the gaseous state. More specifically, we could show that the sameamount of energy is required to heat a fluid from a given liquid temperature to an ideal gas temperature –
(a) Colored density contours in kg/m3. The solid black linesdenote a water mass fraction of 0.1 and 0.01, to demonstratethe position of the flame and the main water occurrence out-side of the dense LOX core.
(b) Scatter plot of compressibility factor Z and oxygen massfraction. The dense pure oxygen can be seen to transform toan ideal gas state (Z = 0.95) before being significantly diluted.Only every fourth point is shown to improve legibility.
Figure 17: Large eddy simulation of LOX/GH2 reactive shear layer. (p = 10 MPa, Tin,LOX = 100 K,uin,LOX = 30 m/s, Tin,H2 = 150 K, uin,H2 = 125 m/s)
12 of 15
American Institute of Aeronautics and Astronautics
Dow
nloa
ded
by S
TA
NFO
RD
UN
IVE
RSI
TY
on
Febr
uary
3, 2
017
| http
://ar
c.ai
aa.o
rg |
DO
I: 1
0.25
14/6
.201
7-11
06
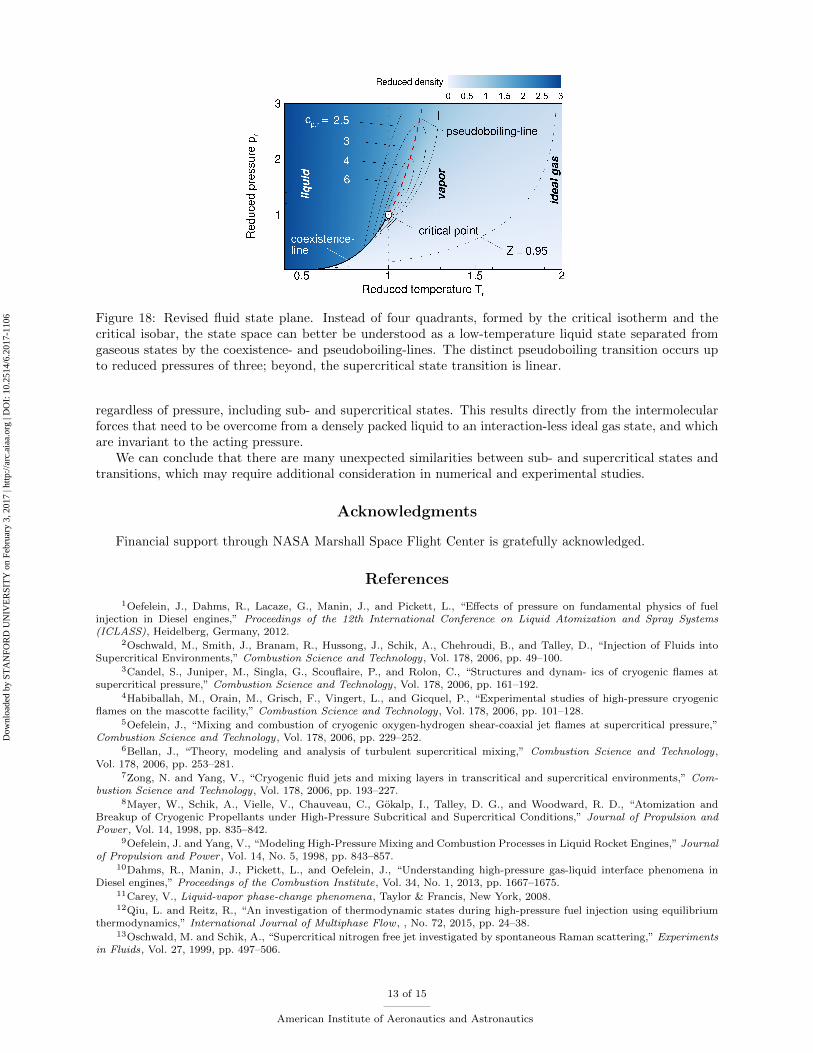
Figure 18: Revised fluid state plane. Instead of four quadrants, formed by the critical isotherm and thecritical isobar, the state space can better be understood as a low-temperature liquid state separated fromgaseous states by the coexistence- and pseudoboiling-lines. The distinct pseudoboiling transition occurs upto reduced pressures of three; beyond, the supercritical state transition is linear.
regardless of pressure, including sub- and supercritical states. This results directly from the intermolecularforces that need to be overcome from a densely packed liquid to an interaction-less ideal gas state, and whichare invariant to the acting pressure.
We can conclude that there are many unexpected similarities between sub- and supercritical states andtransitions, which may require additional consideration in numerical and experimental studies.
Acknowledgments
Financial support through NASA Marshall Space Flight Center is gratefully acknowledged.
References
1Oefelein, J., Dahms, R., Lacaze, G., Manin, J., and Pickett, L., “Effects of pressure on fundamental physics of fuelinjection in Diesel engines,” Proceedings of the 12th International Conference on Liquid Atomization and Spray Systems(ICLASS), Heidelberg, Germany, 2012.
2Oschwald, M., Smith, J., Branam, R., Hussong, J., Schik, A., Chehroudi, B., and Talley, D., “Injection of Fluids intoSupercritical Environments,” Combustion Science and Technology, Vol. 178, 2006, pp. 49–100.
3Candel, S., Juniper, M., Singla, G., Scouflaire, P., and Rolon, C., “Structures and dynam- ics of cryogenic flames atsupercritical pressure,” Combustion Science and Technology, Vol. 178, 2006, pp. 161–192.
4Habiballah, M., Orain, M., Grisch, F., Vingert, L., and Gicquel, P., “Experimental studies of high-pressure cryogenicflames on the mascotte facility,” Combustion Science and Technology, Vol. 178, 2006, pp. 101–128.
5Oefelein, J., “Mixing and combustion of cryogenic oxygen-hydrogen shear-coaxial jet flames at supercritical pressure,”Combustion Science and Technology, Vol. 178, 2006, pp. 229–252.
6Bellan, J., “Theory, modeling and analysis of turbulent supercritical mixing,” Combustion Science and Technology,Vol. 178, 2006, pp. 253–281.
7Zong, N. and Yang, V., “Cryogenic fluid jets and mixing layers in transcritical and supercritical environments,” Com-bustion Science and Technology, Vol. 178, 2006, pp. 193–227.
8Mayer, W., Schik, A., Vielle, V., Chauveau, C., Gokalp, I., Talley, D. G., and Woodward, R. D., “Atomization andBreakup of Cryogenic Propellants under High-Pressure Subcritical and Supercritical Conditions,” Journal of Propulsion andPower , Vol. 14, 1998, pp. 835–842.
9Oefelein, J. and Yang, V., “Modeling High-Pressure Mixing and Combustion Processes in Liquid Rocket Engines,” Journalof Propulsion and Power , Vol. 14, No. 5, 1998, pp. 843–857.
10Dahms, R., Manin, J., Pickett, L., and Oefelein, J., “Understanding high-pressure gas-liquid interface phenomena inDiesel engines,” Proceedings of the Combustion Institute, Vol. 34, No. 1, 2013, pp. 1667–1675.
11Carey, V., Liquid-vapor phase-change phenomena, Taylor & Francis, New York, 2008.12Qiu, L. and Reitz, R., “An investigation of thermodynamic states during high-pressure fuel injection using equilibrium
thermodynamics,” International Journal of Multiphase Flow , , No. 72, 2015, pp. 24–38.13Oschwald, M. and Schik, A., “Supercritical nitrogen free jet investigated by spontaneous Raman scattering,” Experiments
in Fluids, Vol. 27, 1999, pp. 497–506.
13 of 15
American Institute of Aeronautics and Astronautics
Dow
nloa
ded
by S
TA
NFO
RD
UN
IVE
RSI
TY
on
Febr
uary
3, 2
017
| http
://ar
c.ai
aa.o
rg |
DO
I: 1
0.25
14/6
.201
7-11
06
14Banuti, D. T., “Crossing the Widom-line – Supercritical pseudo-boiling,” Journal of Supercritical Fluids, Vol. 98, 2015,pp. 12–16.
15Banuti, D. T. and Hannemann, K., “The absence of a dense potential core in supercritical injection: A thermal break-upmechanism,” Physics of Fluids, Vol. 28, No. 3, 2016, pp. 035103.
16Branam, R. and Mayer, W., “Characterization of Cryogenic Injection at Supercritical Pressure,” Journal of Propulsionand Power , Vol. 19, No. 3, 2003, pp. 342–355.
17Tucker, S., “Solvent Density Inhomogeneities in Supercritical Fluids,” Chemical Reviews, Vol. 99, No. 2, 1999, pp. 391–418.
18Younglove, B. A., “Thermophysical properties of fluids. I. Argon, ethylene, parahydrogen, nitrogen, nitrogen trifluoride,and oxygen,” Journal of Physical and Chemical Reference Data, Vol. 11, 1982, pp. Supplement 1.
19Plimpton, S., “Fast Parallel Algorithms for Short-Range Molecular Dynamics.” Journal of Computational Physics,Vol. 117, 1995, pp. 1–19.
20Levine, B., Stone, J., and Kohlmeyer, A., “Fast analysis of molecular dynamics trajectories with graphics processingunitsRadial distribution function histogramming,” Journal of Computational Physics, Vol. 230, No. 9, 2011, pp. 3556 – 3569.
21Hickey, J.-P., Ma, P., Ihme, M., and Thakur, S., “Large Eddy Simulation of Shear Coaxial Rocket Injector: Real FluidEffects,” Proceedings of the 49th AIAA/ASME/SAE/ASEE Joint Propulsion Conference and Exhibit , No. AIAA 2013-4071,AIAA, San Jose, USA, 2013.
22Ma, P. C., Banuti, D. T., Ihme, M., and Hickey, J.-P., “Numerical framework for transcritical real-fluid reacting flowsimulations using the flamelet progress variable approach,” Proceedings of the 55th AIAA Aerospace Sciences Meeting, Gaylord,USA.
23Ma, P. C., Lv, Y., and Ihme, M., “An entropy-stable hybrid scheme for simulations of transcritical real-fluid flows,”Journal of Computational Physics, under review .
24Ma, P. C., Lv, Y., and Ihme, M., “Numerical methods to prevent pressure oscillations in transcritical flows,” AnnualResearch Brief , Center for Turbulence Research, Stanford University, 2016, pp. 223–234.
25Peng, D.-Y. and Robinson, D., “A New Two-Constant Equation of State,” Industrial & Engineering Chemistry Funda-mentals, Vol. 15, No. 1, 1976, pp. 59–64.
26Pierce, C. and Moin, P., “Progress-variable approach for large-eddy simulation of non-premixed turbulent combustion,”Journal of Fluid Mechanics, Vol. 504, 2008.
27Ihme, M., Cha, C., and Pitsch, H., “Prediction of local extinction and re-ignition eects in non-premixed turbulentcombustion using a flamelet/progress variable approach,” Proceedings of the Combustion Institute, Vol. 30, 2005, pp. 793–800.
28Banuti, D. T., Ma, P. C., Hickey, J.-P., and Ihme, M., “Sub- or supercritical? A flamelet analysis for high-pressurerocket propellant injection,” 52nd AIAA/SAE/ASEE Joint Propulsion Conference, Propulsion and Energy Forum, No. AIAA2016-4789, Salt Lake City, USA, 2016.
29Peters, N., Turbulent Combustion, Cambridge, 2000.30Kee, R. J., Miller, J. A., Evans, G. H., and Dixon-Lewis, G., “A computational model of the structure and extinction of
strained, opposed flow, premixed methane-air flames,” Symposium (International) on Combustion, Vol. 22, Elsevier, 1989, pp.1479–1494.
31Huo, H., Wang, X., and Yang, V., “A general study of counterflow diffusion flames at subcritical and supercriticalconditions: oxygen/hydrogen mixtures,” Combust. Flame, Vol. 161, No. 12, 2014, pp. 3040–3050.
32Goodwin, D. G., Moffat, H. K., and Speth, R. L., “Cantera: An Object-oriented Software Toolkit for Chemical Kinetics,Thermodynamics, and Transport Processes,” http://www.cantera.org, 2016, Version 2.2.1.
33M.P. Burke, M. Chaos, Y. J. F. D. and Klippenstein, S., “Comprehensive H2/O2 kinetic model for highpressure combus-tion,” International Journal of Chemical Kinetics, Vol. 44, No. 7, 2012, pp. 444–474.
34Lacaze, G. and Oefelein, J., “A non-premixed combustion model based on flame structure analysis at supercriticalpressures.” Combustion and Flame, Vol. 159, No. 6, 2012, pp. 2087–2103.
35Simeoni, G., Bryk, T., Gorelli, F., Krisch, M., Ruocco, G., Santoro, M., and Scopigno, T., “The Widom line as thecrossover between liquid-like and gas-like behaviour in supercritical fluids,” Nature Physics, Vol. 6, 2010, pp. 503–507.
36Nishikawa, K. and Tanaka, I., “Correlation lengths and density fluctuations in supercritical states of carbon dioxide,”Chemical Phyics Letters, Vol. 244, 1995, pp. 149–152.
37Gorelli, F., Santoro, M., Scopigno, T., Krisch, M., and Ruocco, G., “Liquidlike behavior of supercritical fluids,” PhysicalReview Letters, Vol. 97, 2006, pp. 245702.
38Linstrom, P. and Mallard, W., editors, NIST Chemistry WebBook, NIST Standard Reference Database Number 69 , chap.http://webbook.nist.gov, National Institute of Standards and Technology, Gaithersburg MD, 20899, retrieved 2016.
39Fisher, M. and Widom, B., “Decay of correlations in linear systems,” The Journal of Chemical Physics, Vol. 50, No. 9,1969, pp. 3756–3772.
40Atkins, P. and de Paula, J., Physical Chemistry, Oxford University Press, 2010.41Banuti, D. T., Hannemann, V., Hannemann, K., and Weigand, B., “An efficient multi-fluid-mixing model for real gas
reacting flows in liquid propellant rocket engines,” Combustion and Flame, Vol. 168, 2016, pp. 98–112.42Banuti, D. T., Raju, M., and Ihme, M., “Supercritical pseudoboiling for general fluids and its application to injection,”
Annual Research Brief , Center for Turbulence Research, Stanford University, 2016, pp. 211–221.43Hirschfelder, J., Curtiss, C., and Bird, R., Molecular Theory of Gases and Liquids, Wiley, 1954.44Giovangigli, V., Matuszewski, L., and Dupoirieux, F., “Detailed modeling of planar transcritical H2-O2-N2 flames,”
Combustion Theory and Modelling, Vol. 15, No. 2, 2011, pp. 141–182.45Ribert, G., Zong, N., Yang, V., Pons, L., Darabiha, N., and Candel, S., “Counterflow diffusion flames of general fluids:
oxygen/hydrogen mixtures,” Combustion and Flame, Vol. 154, 2008, pp. 319–330.46Stanley, H., Introduction to Phase Transitions and Critical Phenomena, Oxford University Press, 1971.
14 of 15
American Institute of Aeronautics and Astronautics
Dow
nloa
ded
by S
TA
NFO
RD
UN
IVE
RSI
TY
on
Febr
uary
3, 2
017
| http
://ar
c.ai
aa.o
rg |
DO
I: 1
0.25
14/6
.201
7-11
06

47Ruiz, A., Lacaze, G., Oefelein, J., Mari, R., Cuenot, B., Selle, L., and Poinsot, T., “Numerical Benchmark for High-Reynolds-Number Supercritical Flows with Large Density Gradients,” AIAA Journal , Vol. 54, No. 5, 2015, pp. 1445–1460.
48Banuti, D. T. and Hannemann, K., “Real Gas Library in Continuous Phase Propellant Injection Model for Liquid RocketEngines,” Proceedings of the 49th AIAA/ASME/SAE/ASEE Joint Propulsion Conference and Exhibit , No. AIAA 2013-4068,San Jose, USA, 2013.
15 of 15
American Institute of Aeronautics and Astronautics
Dow
nloa
ded
by S
TA
NFO
RD
UN
IVE
RSI
TY
on
Febr
uary
3, 2
017
| http
://ar
c.ai
aa.o
rg |
DO
I: 1
0.25
14/6
.201
7-11
06
Related Documents