In Press - Academy of Management Journal Serving Multiple Constituencies in the Business School: MBA Program vs. Research Performance James S. Trieschmann Terry College of Business University of Georgia, Athens GA 30602 Alan R. Dennis Kelley School of Business Indiana University, Bloomington IN 47405 e-mail: [email protected] Gregory B. Northcraft College of Commerce and Business Administration University of Illinois, Champaign IL 66801 Albert W. Niemi Cox Graduate School of Management Southern Methodist University, Dallas TX 75275 May 17, 2000

Welcome message from author
This document is posted to help you gain knowledge. Please leave a comment to let me know what you think about it! Share it to your friends and learn new things together.
Transcript
In Press - Academy of Management Journal
Serving Multiple Constituencies in the Business School: MBA Program vs. Research Performance
James S. Trieschmann Terry College of Business
University of Georgia, Athens GA 30602
Alan R. Dennis Kelley School of Business
Indiana University, Bloomington IN 47405 e-mail: [email protected]
Gregory B. Northcraft College of Commerce and Business Administration
University of Illinois, Champaign IL 66801
Albert W. Niemi Cox Graduate School of Management
Southern Methodist University, Dallas TX 75275
May 17, 2000
2
Serving Multiple Constituencies in the Business School:
MBA-Program vs. Research Performance1
ABSTRACT
Business schools strive to meet two goals: knowledge exploration through research and
knowledge exploitation through instruction. Our results indicate that research performance
(pages published in leading journals) and MBA program performance (from the popular press)
are different. Research performance was improved by the number of faculty, the proportion of
full professors, the proportion of assistant professors, and editorships. MBA program
performance was improved by the budget per faculty member, and the proportion of full
professors.
1. We would like to thank Srini Reddy, Dale Goodhue, and Bob Vandenberg all of The
University of Georgia for statistical advice, and the editor and anonymous reviewers for helpful
comments on previous drafts. This article was prepared while Alan Dennis was on faculty at
The University of Georgia.
3
March and Sutton (1997) have noted that, “Explaining variation in performance or
effectiveness is…one of the more enduring themes in the study of organizations.” However,
studying organization-level performance is problematic because of the multiple constituencies
which organizations serve (e.g., Zammuto, 1984; Tsui, 1990). The existence of these multiple-
constituencies means that, “It is not clear that organizational purpose can be portrayed as unitary
or that the multiple purposes of an organization are reliably consistent” (March & Sutton, 1997).
The failure of measures of organizational performance to reflect an organization’s multiple
constituencies may lead the organization to treat the satisfaction of one of its constituencies as
the primary goal and the satisfaction of others as pathology, rather than maintaining a healthy
tension between them (March & Sutton, 1997). From a resource dependence perspective
(Pfeffer & Salancik, 1978), this could lead to alienation of important constituencies and eventual
demise of the organization.
The purpose of this paper is to explore multiple constituency problems in measuring the
organizational performance of business schools. The study described in this paper examines (a)
whether diverse measures of business school performance – those apparently reflecting different
constituencies – agree, and (b) what factors are likely to influence them..
CONCEPTUAL BACKGROUND AND HYPOTHESES
Business schools typically acknowledge at least two constituencies: 1) students and
business practitioners and 2) academics (e.g., Stahl, Leap, & Wei, 1988; D’Aveni, 1996). Within
business schools, distinct sub-cultures – what March & Sutton (1997) refer to as the “soldiers of
organizational performance and the priests of research purity” – have developed to serve these
two constituencies. These two business school sub-cultures also map onto March’s (1991) more
general distinction between exploration and exploitation in organizations. The priests of
research purity are the explorers who create deep knowledge about organizations; their
constituency is composed of like-minded academics. The soldiers of organizational performance
are the exploiters who disseminate (and apply) that knowledge in the pursuit of improved
organizational practice; their constituency is composed of students and practitioners who
4
embrace the resulting recommendations. The interdependence of these functions means that
organizational success may depend upon striking a balance between the two.
In the case of business schools, emphasizing either exploration (academic constituency)
or exploitation (student and business constituency) may prove adaptive in the short run, but
harmful in the long run. Pure exploration without an eye toward exploitation eventually forgets
the point of exploration; pure exploitation without an eye toward exploration eventually loses its
foundation for innovation and adaptation (March, 1991). Thus, it seems critical that accepted
measures of performance capture the goals of multiple constituencies. The risk when they do not
is perverse learning – that organizational members will “strive to meet measured performance
objectives to the detriment of objectives that are not measured” (Meyer & Gupta, 1994).
Over the past few years, the popular press routinely has published rankings of business
schools (e.g., BusinessWeek, 1998a; U.S. News and World Report, 1999). These rankings have
become increasingly important to business schools. The status conveyed by such visible
measures of organizational performance allows organizations to “cream” inputs (e.g.,
recruitment of students and faculty, support of alumni and donors) and “stream” outputs (e.g.,
placement of graduates) (D’Aveni, 1996). University presidents, vice presidents, and deans have
become quite aware of the rankings and (if positive) include them in their speeches and program
evaluations (e.g., see Southern Methodist University, 1997).
The best-known business school rankings (e.g., BusinessWeek, 1998a; U.S. News &
World Report, 1999) evaluate business school performance from the viewpoint of the MBA
program. In contrast, articles in academic journals have assessed business school performance
from the perspective of research productivity -- the quantity of research published in various
academic and professional journals. Unfortunately, in contrast to the popular press rankings of
business school, these studies have evaluated organizational research performance in a single
journal or a group of journals within a given academic discipline (e.g., Reeve & Hutchinson,
1995; Stahl, et al., 1988; Zivney, T.L. & Bertin, 1992). Since 1988 (Niemi, 1988), no surveys of
research have presented a broad, business-school-wide assessment of research performance
5
comparable to the popular press evaluations of MBA programs. This paper reports a measure of
business school research performance which reflects performance across major disciplines.
The risk of focusing on a single measure (e.g., MBA program performance) is that
current popular press business school rankings may overemphasize the student/business
constituency and the exploitation role, and thereby dysfunctionally focus attention and effort on
exploitation to the exclusion of complementary exploration. Thus, a primary purpose of this
paper is to assess whether current, exploitation-focused measures of organizational performance
(i.e., teaching) are different than exploration-focused measures of performance (i.e., research).
As a starting point, it is hypothesized that:
H1: Exploitation-focused measures of business school performance (i.e., MBA-program
rankings) and exploration-focused measures of business school performance (i.e., research
rankings) will reflect distinct competencies.
Tsui (1990) suggests that organizations should be more likely to simultaneously satisfy
their multiple constituencies when the environment is more munificent. If exploration and
exploitation are distinct competencies, then schools with greater financial resources should be
better able to address their multiple constituencies. In contrast, schools with lesser financial
resources may be more likely to focus their efforts on satisfying one constituency to the
detriment of the other. This argument should apply to the tension between external and internal
constituencies, and also to the tension among internal constituencies (e.g., departments).
Therefore, for schools with lesser financial resources, we would expect greater differences
between the performance measures targeting exploration and those targeting exploitation, and
greater differences among those measures for different disciplines. It is hypothesized:
H2a: Research performance and MBA program performance will be improved by
greater financial resources.
H2b: There will be smaller differences between measures of exploration (research) and
exploitation (MBA program) performance for schools with greater financial resources.
H2c: There will be smaller differences between measures of exploration performance
6
(research) among disciplines within a school for schools with greater financial resources.
Resource-dependence theory (Pfeffer & Salancik, 1978) suggests that attention paid to a
constituency should reflect the organization’s reliance on that constituency for resources. This
suggests that private schools – which are more dependent on students and businesses for
resources – should devote more time and effort to this constituency through exploitation of
knowledge (i.e., as reflected by MBA rankings). Because public institutions have some minimum
level of guaranteed state funding for undergraduate programs, they can devote less attention to
satisfying the student/business constituency via MBA programs, and therefore instead may
emphasize their academic constituency through exploration of knowledge (i.e., research). Thus:
H3: Privately-funded schools will have higher exploitation performance (MBA program),
while publicly-funded schools will have higher exploration performance (research).
If exploration and exploitation are truly distinct goals for business schools, they should be
influenced by different factors. If the satisfaction of multiple constituencies is key to survival,
such differences would have important implications for resource allocations. A critical problem
for organizations is that satisfying multiple constituencies can require a diverse portfolio of skills
and responses (Tsui, 1990), some of which enhance the organization’s reputation in the eyes of
one constituency while simultaneously diminishing it in the eyes of its other constituencies
(D’Aveni, 1996). This problem is a particular concern when those skills and responses compete
for scarce resources in the organization.
Knowledge exploration and exploitation are labor intensive activities that draw on the
same scarce resources (i.e., the faculty). There are practical limits to the number of journal
articles that any one faculty member can produce, so as the number of faculty increase, the
potential to produce more research should also increase. Because of the differential emphasis in
many business schools on publishing (exploration) for junior faculty and instruction/service
(exploitation) for senior faculty, faculty composition in terms of the proportion of assistant,
associate, and full professors might also be expected to influence research and MBA-program
performance measures. A large proportion of assistant professors, whose primary measure of
7
individual performance for promotion is exploration, is more likely to result in more
publications. Conversely, a large proportion of full professors, who have reached a terminal rank
and may be drawn more deeply into exploitation activities such as instruction and service
(including executive education and consulting), is less likely to result in more publications. Such
a switch in emphasis to exploitation is also likely to improve the quality of MBA instruction. A
close involvement in the publishing process through in-house journal editorships may also be
linked to research performance, either because editorships are awarded based on prior research
prowess or because the presence of an in-house editor is likely to encourage local authors to
submit their best work to the editor's journal (Stahl, et al., 1988). Therefore:
H4a: Research performance will be positively related to the number of journal
editorships.
H4b: Research performance will be improved as the proportion of assistant professors
increases, but impaired as the proportion of full professors increases.
H4c: MBA program performance will be improved as the proportion of full professors
increases.
METHODS
Research Performance Measure
This paper reports a measure of business school research performance which is based on
articles published in leading business research journals. Because the quality of published
research is debatable (e.g., Byrne, 1990), as is the quality of the journals in which the research is
published (e.g., Glick et al., 1997), an important concern is the extent to which the research
performance measure is significantly influenced by the inclusion or exclusion of certain journals.
The research performance measure examined the number of pages published in 20 "top
tier" business research journals. We focused on the 13 year time period (from 1986 to 1998)
starting immediately after the last published cross-discipline ranking study (Niemi, 1988). A
three-step approach was used to identify the journals included in the study. First, we used the
AACSB (1998) definition of business school disciplines to identify a set of 13 disciplines, which
8
we integrated into a set of 8 discipline groups: accounting, finance, management, management
information systems, management science, marketing, production/operations management, and a
combination of insurance/international business/real estate. Second, we examined 7 to 13
articles in each discipline group that ranked journals or listed "top" journals in that discipline,
resulting in a set of candidate journals for each. Finally, we selected the specific journals for
inclusion in the study. We attempted to select journals so that there was the same relative
number of journals in each discipline group as there were faculty (i.e., more journals from larger
groups), so that there was at least one journal from every discipline, and so that the selected
journals were ranked highly by both journal ranking articles and citation impact factors (ISI,
1995; 1996; 1997; Starbuck, 1997). The journals in each discipline group are shown in Table 1.
The journal selection process is described on the Web at:
www.kelley.indiana.edu/ardennis/rankings.
[ insert Table 1 about here ]
For our measure of research performance, we chose the page count approach used in
previous studies (Henry & Burch, 1974; Niemi, 1988). We counted the number of pages
published by each university, adjusted for the relative page size of each journal, using Academy
of Management Journal as the standard. The conversion was accomplished by calculating the
mean number of characters per line based on a randomly selected 20-line section of text in each
journal for each year (i.e., 12 samples per journal) multiplied by the average number of lines per
page; this number was then divided by the average for AMJ to produce a conversion index for
each journal. As an aside, we note that this measures the performance of a school at one point in
time, not the performance of the current faculty; faculty compositions change, and we make no
attempt to trace faculty movements and credit past publications to their new school.
For articles written by professors from different universities, we followed the approach of
Niemi (1988) which gives equal credit to all schools regardless of the number of authors on the
paper or number of authors from each school (a modified version of the “normal count” method
of Lindsey, 1980). We made no attempt to exclude publications by faculty from outside the
9
business school; our measure is of research published in major business research journals,
regardless of whether the author(s) are from within the business school or not (see Niemi, 1988).
To avoid overemphasizing some disciplines and underemphasizing others, we
standardized the number of pages across disciplines so that the number of pages published within
each discipline was weighted by the number of faculty in that discipline. We first divided the
number of pages published in each journal by the total number of pages published in that
discipline to convert the page counts into percentages of pages within discipline, and then
multiplied by the number of faculty in that discipline as reported by AACSB (1998) (see Table 1
for the number of faculty). The results were then summed for each school.
To assess the stability of the standardized, weighted pages published over time, we
performed a Cronbach alpha analysis, treating each year as separate measure. The alpha was .92
indicating reliability over time. To assess the extent to which the measure is significantly
influenced by the specific journals included in the sample, we calculated Cronbach alpha (.97)
for the entire set of journals (i.e., treating each journal as a separate item). We then omitted each
of the individual journals in turn and recalculated the alpha for the remaining journals. In all
cases, the overall alpha remained .97, suggesting that the overall measure of research
effectiveness is quite robust with respect to which top journals are included. We also performed
a Cronbach alpha analysis on the journals within each discipline group (accounting, marketing,
etc.) except for the production/ operations management group (which had only one journal).
Alphas were acceptably strong (i.e., above .80) for all but the insurance/international
business/real estate group (.67) and the management information systems group (.73).
MBA Program Performance Measure
We used the U. S. News and World Report MBA program evaluations because they are
published annually and rank more MBA programs (the top 50). U.S. News reports a continuous
score (and a ranking based on the score) which is composed of an opinion survey of business
school deans and graduate coordinators (25% weighting), an opinion survey of corporate
recruiters (15%), the median salary of MBA graduates (14%), proportion of MBAs employed
10
upon graduation (7%), proportion employed after three months (12.25%), the ratio of recruiting
firms to graduates (1.75%), GMAT test scores (16.25%), undergraduate grade point average
(7.5%), and the proportion of applicants accepted (1.25%).
Our statistical analyses focus on the MBA rankings from 1995-1999. Over this five year
time period, 49 business schools were ranked in the top fifty in at least four of these five years.
We chose these 49 schools for our analyses. To assess the stability of the MBA program score
over time, we performed a Cronbach alpha analysis, treating each year in our analyses (1995
through 1999) as a separate observation; an MBA score of 10% less than the lowest score in that
year was assigned for any “missing” data (i.e., those schools not ranked in the top 50 for a given
year). The Cronbach alpha was .98, indicating high reliability over time.
Potential Factors Affecting Performance
We measured in-house editorships as the number of years (or part years) during 1993-
1997 that any school in the sample was home to an editor or associate editor for any of the
sampled journals (we did not include editorial board memberships, or if a journal had more than
three associate editors, the associate editorships). We used this time period because of the time
lag between the editorial acceptance of an article and its publication (Stahl, et al., 1988). This
was standardized and weighted in the same manner as the number of pages published.
Following Stahl, et al., (1988), we contacted AACSB to obtain the number of tenure-
track research faculty in each rank at each business school for 1996 (AACSB, 1997a). This
number excludes visiting faculty, non-tenure-track faculty (e.g., lecturers, executive professors),
faculty holding administrative appointments (e.g., deans) and emeritus faculty. It is important to
note that faculty size data for some schools include economics departments and other
departments such as business law, public policy and so on, while in other cases it does not; thus,
results based on the faculty size data need to be interpreted with caution. BusinessWeek (1998b)
provided budget data for 47 of the 49 schools (BusinessWeek obtained the budget data by
surveying deans and MBA program directors in 1997, requesting 1996-97 data). Because total
budget was significantly related to the number of faculty (r=.52, p=.001), we used budget per
11
faculty member as our measure of financial resources.
Analyses
Our analyses compare MBA program performance and business research performance.
While research performance data (standardized, weighted pages published and the resulting
rankings) are available for all schools (because one can see the extent to which any given school
has published in any time period), MBA performance data (scores and rankings) are only
available for the top 50 schools in any given year. Therefore, our analyses focus only on the last
five years, and only on the 49 top MBA schools whose performance has been almost consistently
rated over this time period. Because MBA program data are only available on the those schools
that were ranked in the top 50 for a given year, this analysis suffers from reduced variability in
the measures because we are forced to sample based on the dependent measure (see Hannan &
Carroll, 1995).
We conducted two separate analyses to test H1: 1) on the rank data; 2) on the underlying
continuous data that produced the rank data. To test the rank data, which are the primary popular
press measure, we first calculated an average MBA rank for each school over the 1995-1999
time period (using a value of 55 for any year in which a school was not ranked in the top 50) and
then converted the average into a rank from 1 to 49. We then calculated a research performance
ranking for each of the schools by calculating the total number of standardized, weighted pages
published from 1994-1998 and converting this into a rank. We choose this time period to
correspond with the 1995-1999 time period for the MBA performance because the MBA
performance data published in each year are gathered based on performance in the preceding
year (i.e., MBA performance data published in 1999 are based on performance in 1998). We
used the Wilcoxon matched pairs signed rank test (Siegel, 1956) which does not assume that the
distribution is normal or that the data are interval scaled to test whether the two sets of ranks
were significantly different.
We then examined the underlying continuous measures. We calculated the average MBA
program score for each school, using a value of 10% more than the lowest score in that year for
12
any school that was not rated. One might be tempted to examine the correlation between MBA
program score and research pages published, but our question is not whether the two measures
are related, but whether they are the same. Instead, we computed Z-scores for the average MBA
score and for the standardized, weighted pages published (both using just the 49 schools in our
data set), and then calculated the absolute difference between the two Z-scores for each school.
We used a t-test to test whether the mean absolute Z-score was significantly different from zero.
We used a LISREL model to test the effects of different factors on MBA and research
performance (H2a, H3, H4a, H4b, H4c), using only the 47 schools for which we had budget data.
We used the average MBA score (not rank) and the number of standardized, weighted pages
published as dependent variables, and budget per faculty member, total number of faculty,
proportion of assistant and full professors, weighted years of editorships and the public-private
status of the school as independent variables.
To test H2b, we first computed Z-scores for the average MBA score and Z-scores for the
standardized, weighted pages published by each of the 47 schools for which we had budget data.
We then calculated the absolute difference between the research Z-score and the MBA Z-score
for each school and used a linear regression to see if there was a relationship between the
absolute difference and the budget per faculty member (including the same five other factors
used in the LISREL model above as covariates).
To test H2c, we first computed Z-scores for the standardized, weighted of pages
published within each discipline by each of the 47 schools for which we had budget data. We
then calculated the sum of the absolute differences between a school’s average discipline Z-score
and each of its eight discipline-specific Z-scores and performed a linear regression to see if there
was a relationship between the absolute difference and the budget per faculty member (including
the other five factors used in the LISREL model above as covariates).
RESULTS
The top 50 universities in research performance over the entire 13-year period are listed
in Table 2, along with their mean MBA program performance from 1995-1999. (Research
13
rankings for the Top 100 schools are on the Web at: www.kelley.indiana.edu/ardennis/rankings).
Over the 13-year time period, 431 universities published 213,158 pages in these 20 top tier
journals (adjusted for the average size of an AMJ page and crediting multi-authored articles to
all schools). The top ten ranked schools accounted for 25.5% of the total pages in these journals,
the top 25 schools accounted for 48.0%, the top 50 for 69.5%, and the top 100 for 87.2%.
[ insert Table 2 about here ]
MBA-Program vs. Research Rankings
As shown in Table 2, 19 of the top 50 research schools have not been consistently ranked
in the top 50 MBA programs. The Wilcoxon test on the rank data found significant differences
between the research rankings and MBA rankings (t(48)=2.32, p<.05). The t-test on the mean
absolute difference between the two underlying continuous measures of performance found
significant differences (t(48)=8.44, p<.001), although the two are significantly correlated (r=.57,
p<.001). We conclude that MBA-program performance measures and research performance
measures are distinct; H1 is supported.
Factors Affecting Performance
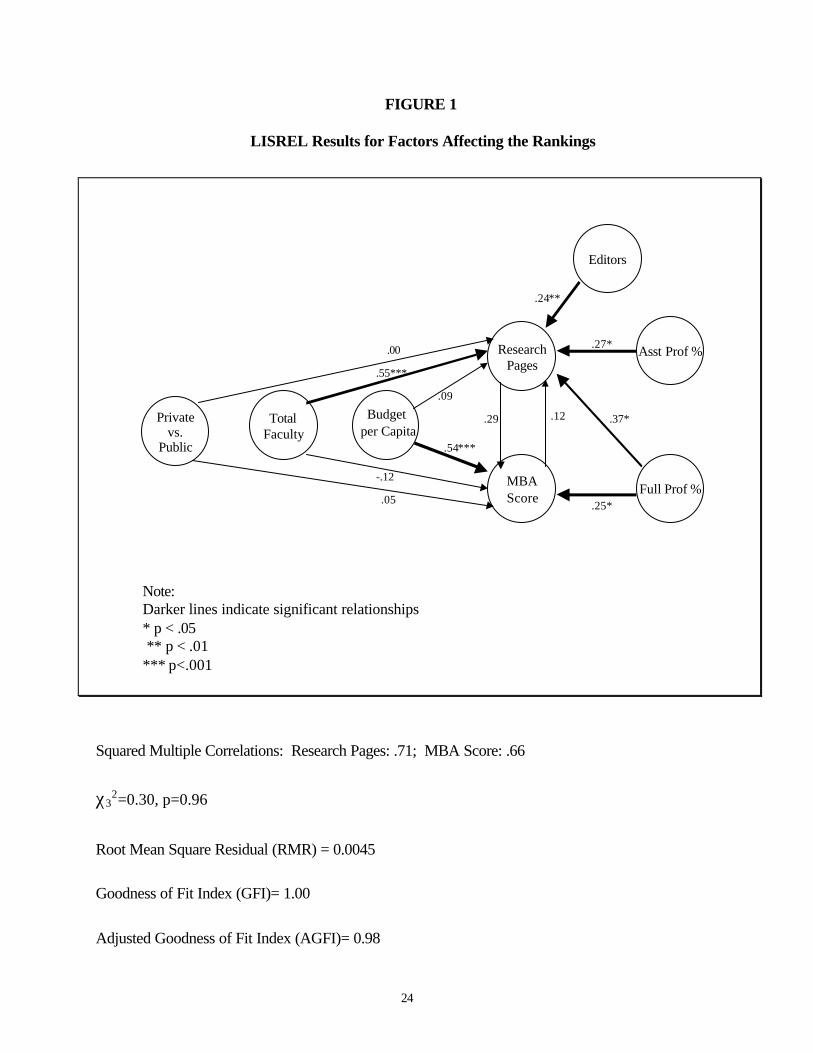
The results of the LISREL analysis on the factors affecting performance is presented in
Figure 1. While the goodness of fit and χ2 statistics show that the model fits the data, we should
caution readers that it is built using only a small sample and thus may suffer from the usual
problems of small sample sizes (some insignificant effects may have been found to be significant
with a larger sample). We are also sampling based on a dependent variable (MBA performance)
which may limit the observed variability in the sample, also reducing power. Although there is a
significant correlation between the MBA score and the research pages published, the LISREL
model shows that neither MBA score nor pages published affects the other measure, after
accounting for the effects of the other factors. In short, any relationship between the two
measures is due to the effects of and relationships among underlying factors, not to direct effects.
[ insert Figure 1 about here ]
The number of research pages published is positively affected by the total number of
14
faculty, the proportion of full professors, the proportion of assistant professors and the number of
years of editorships. The MBA score is positively affected by the budget per faculty member,
and the proportion of full professors. Thus H2a is partially supported, H3 is not supported, H4a
is supported, H4b is partially supported, and H4c is supported.
Factors Affecting Variability in Performance
H2b, which argued that the difference between research performance and MBA
performance would be reduced for schools with greater financial resources, was not supported.
The linear regression found that the absolute difference between the measures for each school
was affected only by the number of faculty (t(40)=2.07, p<.05); as the number of faculty
increased, the absolute difference increased. We repeated the analysis, but this time using the
simple difference between the Z-scores, not the absolute difference, and found that as the number
of faculty increased, the difference favored research performance (t(40)=4.66, p<.001) but as the
budget per faculty member increased, the difference favored MBA performance (t(40)=2.51,
p<.05). In short, larger schools tended to emphasize research performance, while richer schools
tended to emphasize MBA performance; or schools that excel in research tend to acquire more
faculty, while those which excel in MBA education tend to gather more financial resources per
faculty member.
H2c, which argued that there would be fewer performance differences among disciplines
within schools with greater financial resources, was not supported. The linear regression found
that the total absolute difference between the discipline research performance measures for each
school increased as the number of faculty increased (t(40)=3.27, p<.01) and as the budget per
faculty member increased (t(40)=2.49, p<.05). That is, there was a significant relationship
between financial resources and the variability in performance across disciplines, but it was the
opposite of what we hypothesized; richer schools displayed greater differences among disciplines.
Table 3, which presents the within discipline rankings for each of the top fifty research
schools, shows that three of the top 10 research schools (Columbia, Chicago, and Northwestern)
have no publications in the selected MIS and POM journals. These three schools are also among
15
the top five schools in budget per faculty member. We performed a exploratory factor analysis
treating each discipline as a separate item, and found the disciplines to load onto two factors, one
for MIS and POM (with correlations of .60 and .78, respectively), and one for the other six
disciplines (with correlations ranging from .68 to .89).
[ insert Table 3 about here ]
DISCUSSION
First and foremost, the results indicate that the popular press measure of MBA program
performance is significantly different from our measure of business research performance. MBA
program rankings were linked to budget per faculty member, and to a lesser extent to the
proportion of full professors. It is not surprising that financial resources affect MBA performance
suggesting perhaps that this performance enables schools to acquire the financial resources
needed to reinforce the MBA program (D’Aveni, 1996). Some resources such as specialized
placement offices and staff, classroom facilities, alumni relations, and MBA program marketing
are uniquely associated with the MBA program, and schools with larger budgets can invest in
those resources to improve their MBA performance without affecting research performance.
Larger schools tend to produce more research because faculty are the production engine
for research, and there are limits as to how much research any one faculty member can
consistently produce. We had argued that a greater proportion of full professors might be
associated with poorer performance (due to a shift in their attention away from research), but the
data suggest the opposite: more full professors are linked to better research performance. This
suggests that those faculty who continue to publish after tenure and are promoted to full
professor also tend to continue publishing after promotion to full professor, either because of the
added incentives of professorships and chairs, or because the promotion and tenure system has
successfully identified those faculty who are productive researchers. One might also argue that
the presence of more full professors may provide additional support and encouragement so that
assistant and associate professor publish more.
Our results indicate that research performance is not consistent across disciplines within a
16
school. With the exception of Michigan, all of the top 10 schools have at least one discipline
(usually three) in which they are not ranked in the top 20. Implicitly or explicitly, most schools
tend to focus their research strength in a few disciplines, rather than spread efforts more evenly
across disciplines. Contrary to our hypothesis, this focus was most clear among schools with
greater financial resources: richer schools tended to have a greater focus. We speculate that
increased financial resources enable deans to shift resources to build a strength in a few areas,
and/or that focusing on a few areas creates a salient institutional identify that attracts
endowments and faculty to those areas, both of which are self-reinforcing.
Understanding how schools develop specific foci is an important issue for future
research. Perhaps different sub-cultures that place different values on exploration and
exploitation emerge within schools and constrain efforts (March & Sutton, 1997). Perhaps the
proximity of schools to constituencies may affect their focus (e.g., schools who serve Wall Street
may emphasize finance, while schools who serve manufacturing emphasize production). As an
aside, we note that there were significant correlations between budget per faculty and research
performance in accounting and finance -- two disciplines with the highest mean salary --
suggesting that increased wealth enabled a focus on "expensive" disciplines. Our exploratory
factor analysis suggests that performance in MIS and POM may be different from performance
in the more "established" disciplines. It is unclear whether this may reflect explicit strategic
decision making, a slower acceptance of on MIS and POM in general, or a slower acceptance of
the need for change to include these disciplines at the most successful schools.
More research is clearly warranted to understand how some universities have managed to
significantly improve their research performance (e.g., Texas, Harvard, Penn State, Vanderbilt),
when many of the factors affecting performance are hard to manage. While deans can affect
performance by increasing the number of faculty, they have less control over the proportion of
full professors or editorships. We speculate that internal policies that focus on serving the
research constituency are important in motivating faculty. Future research should also explore
whether schools with high rankings across both MBA program and business research measures
17
accomplish this via constituency specialization among faculty (e.g., teachers vs. researchers), or
by making it possible for individual faculty to address multiple constituencies more effectively,
or by focusing within constituencies (e.g., many private schools do not have large undergraduate
programs as do public universities; the role of Ph.D. programs may also warrant future research).
Finally, about 70% of the research in the leading business journals (by our measure) was
produced by the top 50 research schools. In other words, the production of business research is a
highly concentrated "industry," with these 50 schools forming the core of what the Economist
(1997) calls the "global knowledge factory" for business research. If these 50 schools were to
focus unduly on knowledge exploitation rather than knowledge exploration, the global
production of business research would likely be reduced. The value of business research is
debatable, but in the past, business research has transformed markets (e.g., the Black-Scholes
option-pricing model that created the derivatives industry (AACSB, 1997b)).
Our study has an important implication for business school deans and university
presidents. The finding that measures of research performance and MBA-program performance
are different, suggests that focusing only on one of these measures (e.g., popular press MBA
program rankings) risks “perverse learning” and an imbalance in the tension between exploration
and exploitation, possibly threatening a school’s long-term viability -- and the viability of the
global knowledge factory. In contrast, a “balanced scorecard” (Kaplan & Norton, 1992)
approach to assessing organizational performance uses multiple indicators of performance in
order to ensure a healthy balance among multiple-constituency demands. In the short-run, re-
emphasizing the multiple-constituency nature of business school performance in this way might
decrease a school’s performance on some dimensions (e.g., MBA rankings) as efforts are
redirected toward neglected constituencies. However, such short-term losses may be minimized
by identifying ways in which resources can be applied to serve both constituencies.
The tension in serving multiple constituencies has a long history in the business school
(AACSB, 1997b). For much of 20th century, most business schools focused on undergraduate
instruction and very practical applied research. The Carnegie report (Pierson, 1959), which was
18
highly critical of this exploitation focus, provoked a sharp turn to a focus on research,
particularly "scientific" research. The Porter-McKibbin report (1988), which was highly critical
of theoretical research, coupled with the rise of popular press MBA program rankings, has, we
believe, driven the focus back to MBA instruction at the possible expense of research (cf.,
AACSB, 1997b). Our results show that over the past five years, schools with greater financial
resources have tended to emphasize MBA program performance over research performance.
While the popular press has highlighted one facet of performance in business schools, it
may have done so at the expense of a healthy tension between exploitation and the critical
exploration role also performed by these schools. Published rankings create status, and as noted
by D’Aveni (1996), status has self-reinforcing effects on organizational performance. However,
if the measures of performance ignore or overlook critical constituencies and dimensions of
performance (e.g., research performance), then those self-reinforcing influences on performance
will be similarly misdirected. We believe that a more balanced measure that considers both MBA
program and research performance -- and understands the healthy tension between them -- is
needed to help ensure that the lessons learned from published rankings are productive rather than
perverse.
19
TABLE 1
Journals Studied (and Number of Faculty) in Each Discipline Area
Accounting (3,336a)
• Accounting Review
• J of Accounting & Economics
• J of Accounting Research
Managementc (3,457)
• Administrative Sciences Quarterly
• Academy of Management Journal
• Academy of Management Review
• Strategic Management Journal
Finance (2,409)
• J of Finance
• J of Financial Economics
Management Information Systems (1,627)
• Information Systems Research
• MIS Quarterly
Insurance, International Business &
Real Estate (584)
• J of Risk and Insurance
• J of International Business Studies
• Real Estate Economicsb
Marketing (2,432)
• J of Consumer Research
• J of Marketing
• J of Marketing Research
Management Science (752)
• Management Science
• Operations Research
Production/Operations Mgmt (877)
• J of Operations Management
a) Numbers in parentheses are the total number of faculty in these areas from AACSB (1998).
b) Prior to 1995, this was entitled Journal of the American Real Estate and Urban Economics
Association.
c) Includes management, strategy, human resource management, and organizational behavior.
20
TABLE 2
Business School Research Rankings
Research Rank Research
Rank
1986-98
University
Percent of
Weighted
Pages 1986-89 1990-93 1994-98
Average
MBA Rank
1995-99
1 Pennsylvania 3.71% 1 1 1 2
2 Michigan 3.03% 4 2 2 10
3 Stanford 2.59% 2 3 7 1
4 New York University 2.55% 5 4 5 14
5 Chicago 2.45% 7 5 3 6
6 Columbia 2.37% 3 10 6 7
7 Minnesota 2.33% 6 6 10 29
8↑ Texas - Austin 2.29% 14 7 4 19
9↑ Harvard 2.12% 20 8 8 3
10 Northwestern 2.05% 9 9 9 5
11 Washington - Seattle 1.72% 8 18 14 49*
12 Southern California 1.72% 18 15 11 27
13 Massachusetts Inst Tech 1.69% 13 11 18 4
14 Illinois 1.68% 12 14 13 40*
15↓ California - Berkeley 1.64% 10 12 19 12
16↓ California - Los Angeles 1.55% 11 13 22 13
17↑ Cornell 1.54% 24 20 12 18
18↓ Ohio State 1.45% 16 17 26 24
19 Duke 1.43% 15 19 20 9
20↑ Wisconsin - Madison 1.42% 26 22 17 *
21 Indiana 1.39% 22 21 21 20
22↓ Arizona 1.38% 17 27 27 38
23↑ UNC - Chapel Hill 1.34% 29 30 15 17
24 Carnegie Mellon 1.30% 28 23 24 15
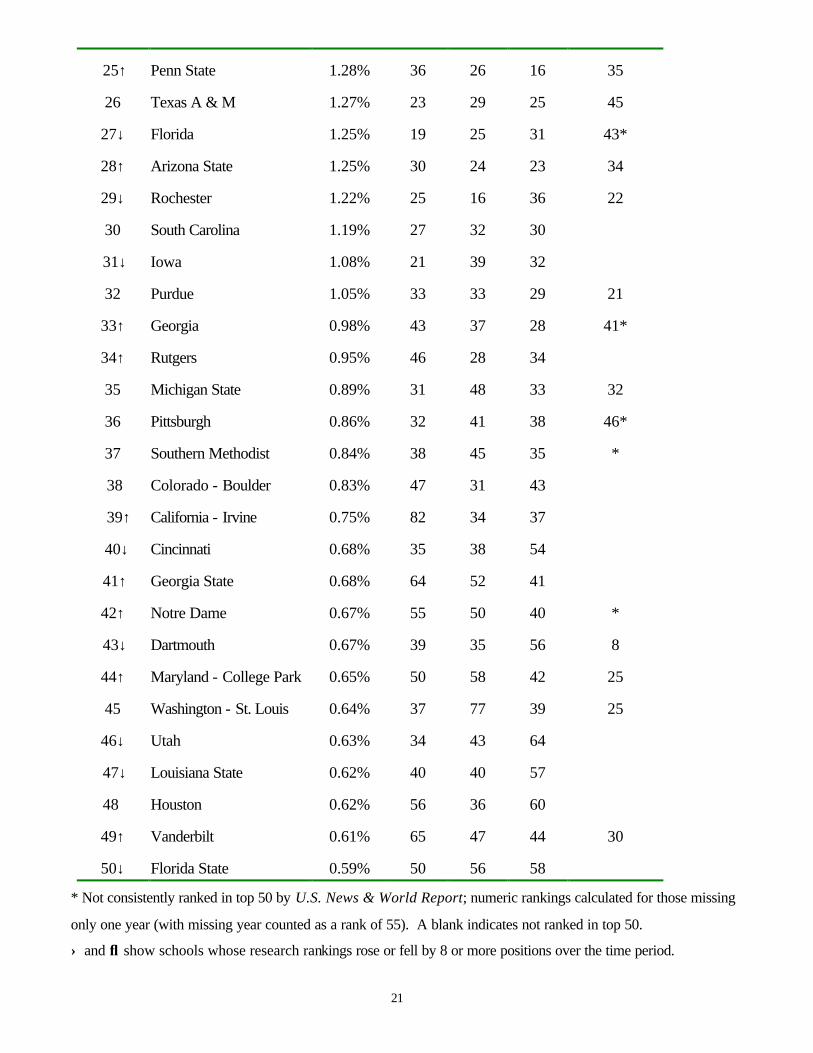
21
25↑ Penn State 1.28% 36 26 16 35
26 Texas A & M 1.27% 23 29 25 45
27↓ Florida 1.25% 19 25 31 43*
28↑ Arizona State 1.25% 30 24 23 34
29↓ Rochester 1.22% 25 16 36 22
30 South Carolina 1.19% 27 32 30
31↓ Iowa 1.08% 21 39 32
32 Purdue 1.05% 33 33 29 21
33↑ Georgia 0.98% 43 37 28 41*
34↑ Rutgers 0.95% 46 28 34
35 Michigan State 0.89% 31 48 33 32
36 Pittsburgh 0.86% 32 41 38 46*
37 Southern Methodist 0.84% 38 45 35 *
38 Colorado - Boulder 0.83% 47 31 43
39↑ California - Irvine 0.75% 82 34 37
40↓ Cincinnati 0.68% 35 38 54
41↑ Georgia State 0.68% 64 52 41
42↑ Notre Dame 0.67% 55 50 40 *
43↓ Dartmouth 0.67% 39 35 56 8
44↑ Maryland - College Park 0.65% 50 58 42 25
45 Washington - St. Louis 0.64% 37 77 39 25
46↓ Utah 0.63% 34 43 64
47↓ Louisiana State 0.62% 40 40 57
48 Houston 0.62% 56 36 60
49↑ Vanderbilt 0.61% 65 47 44 30
50↓ Florida State 0.59% 50 56 58
* Not consistently ranked in top 50 by U.S. News & World Report; numeric rankings calculated for those missing
only one year (with missing year counted as a rank of 55). A blank indicates not ranked in top 50.
↑ and ↓ show schools whose research rankings rose or fell by 8 or more positions over the time period.
22
TABLE 3
Within-Discipline Research Rankings
Rankings within Disciplines Rank
1986-
1997
University Acc Fin Ins, IB
& RE
Mgt MIS Mgt
Sci
Mkt POM
1 Pennsylvania 1 2 1 3 34 3 1 38
2 Michigan 2 5 19 2 17 8 12 15
3 Stanford 4 19 81 1 35 4 14 55
4 New York University 20 3 10 4 9 26 6 56
5 Chicago 3 1 117 41 21 8
6 Columbia 10 8 38 5 2 5
7 Minnesota 22 34 17 7 1 24 9 1
8 Texas - Austin 13 15 3 20 3 5 3 41
9 Harvard 16 4 49 8 7 18 25 26
10 Northwestern 7 9 156 6 11 10
11 Washington - Seattle 5 16 50 15 16 22 44 39
12 Southern California 14 11 17 24 29 13 25
13 Massachusetts Inst Tech 37 14 52 27 2 1 32 107
14 Illinois 21 18 7 9 28 32 17 16
15 California - Berkeley 11 20 13 11 112 12 24 111
16 California - Los Angeles 23 7 27 24 20 15 18 89
17 Cornell 12 13 61 13 142 17 37 73
18 Ohio State 26 6 21 36 52 14 30 6
19 Duke 19 10 78 37 7 11 23
20 Wisconsin - Madison 33 25 5 25 107 25 4 11
21 Indiana 34 17 12 18 30 43 16 8
22 Arizona 18 28 230 33 10 36 7 97
23 UNC - Chapel Hill 8 38 11 22 45 19 62 9
24 Carnegie Mellon 25 31 19 5 6 73 34
23
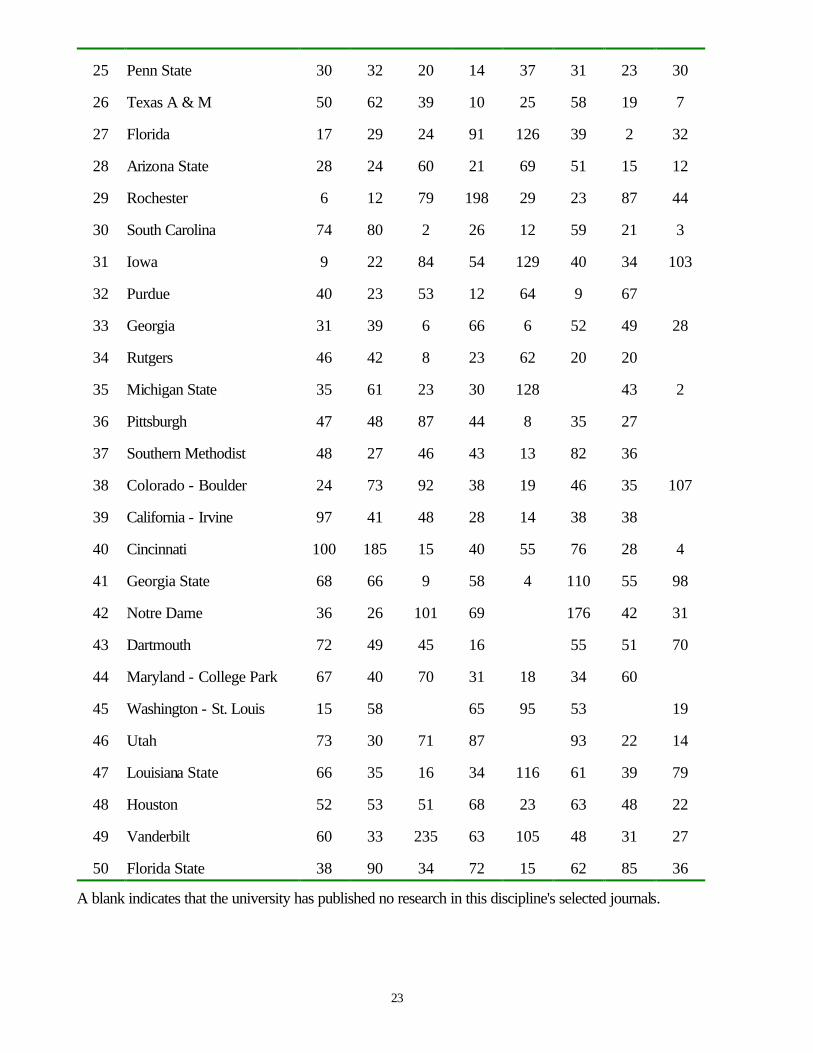
25 Penn State 30 32 20 14 37 31 23 30
26 Texas A & M 50 62 39 10 25 58 19 7
27 Florida 17 29 24 91 126 39 2 32
28 Arizona State 28 24 60 21 69 51 15 12
29 Rochester 6 12 79 198 29 23 87 44
30 South Carolina 74 80 2 26 12 59 21 3
31 Iowa 9 22 84 54 129 40 34 103
32 Purdue 40 23 53 12 64 9 67
33 Georgia 31 39 6 66 6 52 49 28
34 Rutgers 46 42 8 23 62 20 20
35 Michigan State 35 61 23 30 128 43 2
36 Pittsburgh 47 48 87 44 8 35 27
37 Southern Methodist 48 27 46 43 13 82 36
38 Colorado - Boulder 24 73 92 38 19 46 35 107
39 California - Irvine 97 41 48 28 14 38 38
40 Cincinnati 100 185 15 40 55 76 28 4
41 Georgia State 68 66 9 58 4 110 55 98
42 Notre Dame 36 26 101 69 176 42 31
43 Dartmouth 72 49 45 16 55 51 70
44 Maryland - College Park 67 40 70 31 18 34 60
45 Washington - St. Louis 15 58 65 95 53 19
46 Utah 73 30 71 87 93 22 14
47 Louisiana State 66 35 16 34 116 61 39 79
48 Houston 52 53 51 68 23 63 48 22
49 Vanderbilt 60 33 235 63 105 48 31 27
50 Florida State 38 90 34 72 15 62 85 36
A blank indicates that the university has published no research in this discipline's selected journals.
24
FIGURE 1
LISREL Results for Factors Affecting the Rankings
ResearchPages
MBAScore
.12.29
Full Prof %
.37*
.25*
TotalFaculty
Budget per Capita
Privatevs.
Public
Asst Prof %
Editors
.27*
.24**
.54***
.09
-.12
.05
.55***
.00
Note:Darker lines indicate significant relationships* p < .05 ** p < .01*** p<.001
Squared Multiple Correlations: Research Pages: .71; MBA Score: .66
χ32=0.30, p=0.96
Root Mean Square Residual (RMR) = 0.0045
Goodness of Fit Index (GFI)= 1.00
Adjusted Goodness of Fit Index (AGFI)= 0.98
25
References
AACSB. 1997a. Response to Information Request on Faculty Composition. American
Association of Collegiate Schools of Business.
AACSB. 1997b. “Research Relevance Remains a Challenge for Business Schools,” AACSB
Newsline, 27(3): 1-5.
AACSB. 1998. Faculty Positions Filled, Vacant, and Planned Growth. Newsline 28, 3, 27.
Armstrong, J. S. & Sperry, T. 1994. The Ombudsman: Business School Prestige -- Research
versus Teaching. Interfaces, 24: 2, 13-43.
BusinessWeek, 1998a. "The Best B-Schools," October, 19, 86-94
BusinessWeek, 1998b. "1998/99 B-School Budget" accessed 10/25/99,
http://www.businessweek.com/bschools/faqsnfigs/index.htm
Byrne, J. A., 1990. Is research in the ivory tower ‘fuzzy, irrelevant, pretentious’?,
D’Aveni, R.A. 1996. A Multiple-constituency, Status-based Approach to Interorganizational
Mobility of Faculty and Input-output competition among top business schools.
Organization Science, 7, 166-189.
Economist. 1997. Inside the Knowledge Factory, October 4.
Glick, W., McKelvey, W., Cooper, M., Huber, G., & Zmud, W. 1997. Survey Feedback from
Surveys of Journal Reputations, Report of the 1997 INFORMS Committee Review of
Organization Science.
Hannan, M. T. & Carroll, G. R. (eds.) (1995) Organizations in industry : strategy, structure, and
selection, New York, Oxford University Press.
Henry, W. R. & Burch, E. E. 1974. Institutional Contributions to Scholarly Journals of Business.
Journal of Business, 47, 56-66.
Hollman, K. W., Murrey, J. H., Jr., & Homaifar, G. 1991. The structure and disciplinary
boundaries of insurance: A citational analysis of JRI articles, The Journal of Risk and
Insurance 58, 714-721.
26
Kaplan, R.S. & Norton, D.P. (1992) The Balanced Scorecard – Measures that Drive
Performance. Harvard Business Review, January/February, 71-79.
Kirkpatrick, S. A. & Locke, E. A. 1992. The Development of Measures of Faculty Scholarship.
Group & Organizational Management, 17, 5-23.
Lindsey, D. 1980. Production and Citation Measure in the Sociology of Science: The Problem of
Multiple Authorships. Social Studies of Science. 10: 145-162.
Mansfield, E. 1987. Statistics for Business and Economics, 3rd edition, W.W. Norton &
Company, New York.
March J.G. 1991. Exploration and exploitation in organizational learning. Organization
Science. 2, 71-87.
March, J.G. 1996. Continuity and change in theories of organizational action. Administrative
Sciences Quarterly, 41, 278-287.
March, J.G. & Sutton, R. I. 1997. Organizational performance as a dependent variable.
Organization Science, 8, 698-706.
McDowell, J. M. & Amacher, R. C. 1986. Economic Value of an In-House Editorship. Public
Choice, 48, 101-112.
Meyer, M.W., & Gupta, V. 1994 The performance paradox. In B.M. Staw & L.L. Cummings
(Eds.), Research in Organization Behavior, 16, 309-369.
Northcraft, G. B., Neale, M. A., & Huber, V. L. 1988. Decision bias and social influence in
human resource decision making. In K. Rowland & G. Ferris eds. Research in Personnel
and Human Resource Management. Greenwich, CT: JAI Press, 157-189.
Niemi, A. W., 1987. Institutional contributions to the leading finance journals, 1975 through
1986: A note, The Journal of Finance 42, 1389-1397.
Niemi, A. W., 1988. Research productivity of American business schools, 1975-85, Review of
Business and Economic Research, Spring 1988, 1-17.
Pierson, F.C. 1959. The Education of American Businessmen: A Study of University-College
Programs in Business Administration, The Carnegie Series in American Education, New
27
York: McGraw-Hill
Porter, L. & McKibbin, L. 1988. Management Education and Development: Drift or Thrust into
the 21st Century? New York: McGraw-Hill.
Reeve, R. C. & Hutchinson, P. J. 1988. The Contribution of Non-U.S. Institutions to Academic
Accounting Journals. Abacus 24, 1 90-94.
Siegal, S. Nonparametric Statistics for the Behavioral Sciences. New York: McGraw Hill.
Southern Methodist University 1997. Edwin L. Cox School of Business Annual Report, Dallas,
Texas.
Stahl, M. J., Leap, T. L. & Wei, Z. Z. 1988. Publication in leading management journals as a
measure of institutional research productivity, Academy of Management Journal 31, 707-
720.
Starbuck, W. 1997. Estimates of the 1997 Impact Ratings. Unpublished Web document.
http://www.stern.nyu.edu/~wstarbuc/cites.html and
http://www.stern.nyu.edu/~wstarbuc/whatmean.html
Tsui, A.S. (1990) A Multiple-constituency Model of Effectiveness: An Empirical Examination
at the Human Resource Subunit Level. Administrative Sciences Quarterly, 35, 458-483.
U.S. News and World Report, (1999) “Schools of Business,” America’s Best Graduate Schools,
special issue, March 29, 86-87.
Zivney, T. L. & Bertin, W. J. 1992. Publish or perish: What the competition is really doing. The
Journal of Finance 47, 295-329.
28
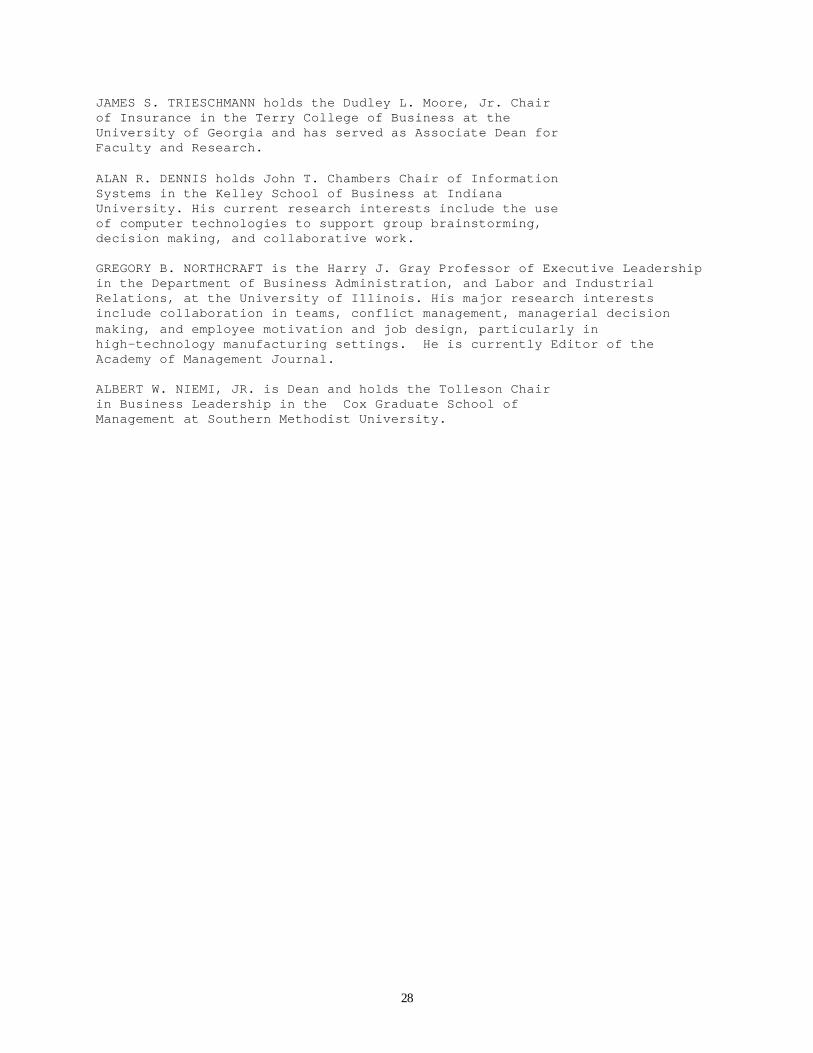
JAMES S. TRIESCHMANN holds the Dudley L. Moore, Jr. Chair of Insurance in the Terry College of Business at the University of Georgia and has served as Associate Dean for Faculty and Research. ALAN R. DENNIS holds John T. Chambers Chair of Information Systems in the Kelley School of Business at Indiana University. His current research interests include the use of computer technologies to support group brainstorming, decision making, and collaborative work. GREGORY B. NORTHCRAFT is the Harry J. Gray Professor of Executive Leadership in the Department of Business Administration, and Labor and Industrial Relations, at the University of Illinois. His major research interests include collaboration in teams, conflict management, managerial decision making, and employee motivation and job design, particularly in high-technology manufacturing settings. He is currently Editor of the Academy of Management Journal. ALBERT W. NIEMI, JR. is Dean and holds the Tolleson Chair in Business Leadership in the Cox Graduate School of Management at Southern Methodist University.
Related Documents