Service Time Approximation in IEEE 802.11 Single-Hop Ad Hoc Networks Atef Abdrabou and Weihua Zhuang Centre for Wireless Communications (CWC) Department of Electrical and Computer Engineering University of Waterloo, Waterloo, Ontario, Canada N2L 3G1 Tel: 1-519-888-4567 ext. {37476, 35354}, Fax: 1-519-746-3077 Email: {alotfy, wzhuang}@bbcr.uwaterloo.ca Abstract — This paper investigates the near-memoryless behavior of the service time for IEEE 802.11 saturated single-hop ad hoc networks. We show that the number of packets successfully trans- mitted by any node over a time interval follows a general distribution, which is close to a Poisson distribution with an upper bounded distribution distance. The bound on the distribution distance is almost constant and is mainly affected by some system parameters and very slightly by the number of active nodes in the network. We also show that the service time distribution can be approximated by a geometric distribution. We illustrate that the usage of discrete-time queuing analysis (M/Geo/1) near network saturation greatly simplifies the queuing analysis and leads to sufficiently accurate results for both the first order statistics and the probability distribution of the number of packets in the queuing system. Computer simulation results demonstrate that the M/Geo/1 queuing model is very accurate. Index Terms — IEEE 802.11 MAC, ad hoc network, service time, packet delay, distribution distance, queuing model, resource allocation, call admission control

Welcome message from author
This document is posted to help you gain knowledge. Please leave a comment to let me know what you think about it! Share it to your friends and learn new things together.
Transcript
Service Time Approximation in IEEE 802.11 Single-HopAd Hoc Networks
Atef Abdrabou and Weihua ZhuangCentre for Wireless Communications (CWC)
Department of Electrical and Computer EngineeringUniversity of Waterloo, Waterloo, Ontario, Canada N2L 3G1
Tel: 1-519-888-4567 ext.{37476, 35354}, Fax: 1-519-746-3077Email: {alotfy, wzhuang}@bbcr.uwaterloo.ca
Abstract — This paper investigates the near-memoryless behavior of the service time for IEEE
802.11 saturated single-hop ad hoc networks. We show that the number of packets successfully trans-
mitted by any node over a time interval follows a general distribution, which is close to a Poisson
distribution with an upper bounded distribution distance.The bound on the distribution distance is
almost constant and is mainly affected by some system parameters and very slightly by the number of
active nodes in the network. We also show that the service time distribution can be approximated by a
geometric distribution. We illustrate that the usage of discrete-time queuing analysis (M/Geo/1) near
network saturation greatly simplifies the queuing analysisand leads to sufficiently accurate results for
both the first order statistics and the probability distribution of the number of packets in the queuing
system. Computer simulation results demonstrate that the M/Geo/1 queuing model is very accurate.
Index Terms — IEEE 802.11 MAC, ad hoc network, service time, packet delay,distribution
distance, queuing model, resource allocation, call admission control
1 Introduction
In recent years, contention-based medium access control (MAC) protocols (such as IEEE 802.11)
are widely adopted in wireless local area networks (WLANs). There are many different research
works that address 802.11 performance analysis in the open literature (for example, [1], [2], [3] and
references therein). Nevertheless, in the bulk of the research works, the analysis of very important
design parameters (such as MAC packet delay and service time) is done in terms of the first and second
order statistics only. The MAC service time under consideration in this paper is defined as the delay
seen by a packet from the instant of being at the head of the queue to the instant of being successfully
transmitted. The service time is vital for handling any 802.11 queuing model. Our objective in this
paper, in contrary to most of previous research works, is notto analyze the performance of IEEE
802.11 by including the impact of the queuing model. We mainly aim at reaching a sufficiently
accurate approximation for the service time distribution that can easily be used in statistical resource
allocation (call admission control and/or resource reservation) decisions. In fact, using the first and
second order statistics may lead to inefficient network resource utilization or ineffective quality-of-
service (QoS) provisioning.
Although not much researches in the literature study the queuing models of 802.11 [2] [4] [5] [6],
we can identify four different queuing disciplines; namely, M/G/1 [2] [7] [8] , M/MMGI/1/K [4],
G/G/1 [5, 9] and M/M/1/K [2, 6]. Two of these disciplines M/G/1 [2], [7] and G/G/1 [5, 9] treat
the 802.11 as a server with a general service time distribution. The queuing analysis with a general
service time distribution can be carried out either by (i) finding the distribution itself; (ii) using the
estimated average and variance of an unknown distribution;or (iii) approximating the general distri-
bution, if possible, to an easy-handling one such as exponential or geometric. Finding a close-form
expression for the service time probability density function (PDF) is a mathematically challenging
task. In fact, the distribution is complicated since, between two successful packet transmissions of
any node, three different random variables (in the case of a fixed packet size) are involved; namely,
the number of idle time slots, the number of collisions happened (either to other nodes or to the node
under consideration), and the number of successful transmissions of the other nodes. Moreover, these
random variables are not independent since the number of successful transmissions and collisions
from the others nodes (between successful transmissions ofa given node) depends on the backoff
1
http://folk.uio.no/paalee
http://www.unik.no/personer/paalee
counter value. As the counter value increases, more successful transmissions and collisions are likely
to happen. Also, the number of successful transmissions of the other nodes depends on how many
collisions they suffered. On the other hand, previous analysis and simulation results indicate that a
large number of packets have a very short service time and a small number of packets experience a
very long one (i.e., the packet service time is not close to its average value) [2, 5, 9, 10, 11, 12]. Using
only the average value in resource allocation may lead eventually to a conservative estimation of the
available resources, which in turn reduces the utilizationof the network resources.
In this paper, we study the service time distribution for the802.11 DCF with the request-to-
send/clear-to-send (RTS/CTS) access method. We seek a simplified approximation mainly to be used
for efficient statistical call admission control and resource reservation in ad hoc networks. The paper
presents three related contributions that lead to the realization of this objective:
• It is shown that the service time distribution has a partial memoryless behavior. We demonstrate
that the distribution of the number of packets successfullytransmitted over a time interval from
any of the active nodes in a saturated ad hoc network follows ageneral distribution that is close
to the Poisson distribution with an upper bounded distribution distance. The Poisson process is
a renewal counting process with a memoryless distribution for the renewal inter-arrival times
[13]. We obtain this bound analytically using the Chen-Steinapproximation method [14] and
verify it by simulations. We also show that the bound is almost a constant, which depends
mainly on some system parameters and very slightly on the number of active nodes in the
network.
• We illustrate that the service time distribution, with its near memoryless behavior and the dis-
crete nature shown in [2] [7] [10], can be approximated by thegeometric distribution. We
characterize the distribution by analytically deriving its parameter.
• We propose to use the discrete-time queuing system (M/Geo/1) as a queuing model for IEEE
802.11 single-hop ad hoc networks near saturation. We show that the average queue length
and the probability distribution of the number of packets inthe queuing system obtained by
computer simulations match closely the analytical resultsobtained from the M/Geo/1 queuing
system.
The significance of this research lies in the introduction ofa simple approximation to the service time
2
distribution, which can be used with sufficient accuracy in the queuing analysis and the prediction of
the buffer occupancy for the sake of QoS provisioning. Distributed resource allocation mechanisms
(such as call admission control) are mandatory in ad hoc networks which lack a centralized controller.
This research offers a step toward a fully distributed statistical call admission control for single-hop ad
hoc networks, based on the PDF of the buffer occupancy instead of just first or second order statistics.
Any node with a minimal amount of information from its neighbors (i.e. the number of neighboring
nodes) can determine the possibility of its call being admitted with its QoS constraints (such as delay)
being satisfied without degrading the QoS provisioning of the ongoing calls.
The rest of paper is organized as follows. Section 2 presentssome related works. We introduce the
system model in Section 3. In Section 4, we discuss the partial memoryless behavior of the service
time in the IEEE 802.11 at saturation. Section 5 presents ourproposed approximation to the service
time and the M/Geo/1 queuing system. We verify the analysis by simulation results in Section 6.
Finally, we conclude this research in Section 7.
2 Related Works
Studying the service time distribution of the IEEE 802.11 DCFhas drawn the attention of many re-
searchers since it is essential for performance evaluationand queuing analysis. In [5], [9], [7], [10]
and [8], exact close-form expressions of the probability generating function (PGF) of the service time
are derived. The PGF expressions can be converted to the PDF only numerically, which makes them
not practical to use in making dynamic statistical resourceallocation decisions. In [15], an approxi-
mation to the service time PGF has been given and shown to be accurate. However, the approximated
PGF is a general distribution, which is not easy to handle with queuing analysis although it is simpler
than the exact close-form expressions. In [16], an approximation to the asymptotic distribution of the
total delay (M/G/1 queuing delay plus the service time) has been shown to follow a power law. This
approximation is given under certain assumptions such as large total delay and non-integer binary
logarithm of the collision probability.
The assumption of Markovian service time in the 802.11 queuing discipline (such as M/M/1/K
[2, 6]) has not been analytically verified, to the best of our knowledge. Zhai et al. in [2] compare the
service time distribution obtained by simulations graphically with standard distributions and conclude
3
that an exponential distribution may give a good approximation to the inter-arrival times of success-
fully received packets. Foh and Zukerman [17] and Tantra et al. [18] study the IEEE 802.11 DCF
performance by modeling a WLAN withK nodes using an M/PH/1/K queuing analysis (where each
node waits in the queue to be served). In [17] and [18], a phasetype distribution (such as Erlang with
parameter 8 in [17]) is used to approximate the service time based on simulation results and graphical
comparison to the actual service time distribution (obtained by simulations). It is also assumed in
[17] and [18] that every node can only keep one data frame in its queue (low utilization factor), which
impacts the service time distribution for a low or medium number of nodes. Pham et al. in [6] use the
M/M/1/K discipline, assuming that the service time is exponential without verifying the assumption.
In [19], it is shown that the service interval distribution can converge to an exponential distribution
when the number of nodes in the network is sufficiently large.However, the definition of the service
interval or the service time for a node in [19] is the same as the slot time in [1]. The author in [19]
uses the expression for the average slot time given in [1] to analytically describe the average service
interval for a node. The operation of the IEEE 802.11 protocol is based on a slotted time. The slot
time in [1] is defined as either the unit slot time (when the channel is idle), or the packet transmission
time (when the channel is busy sending a packet), or the time for a collision to be detected on the
channel. The service time definition under consideration inthis paper is substantially different; it is
also used by many other researchers [2, 3], [10]-[12].
3 System Model
We consider a single-channel IEEE 802.11 single-hop ad hoc network that contains a cluster of termi-
nals (nodes). The nodes use the DCF mechanism to access the channel. The random access employs
the four-way RTS-CTS-DATA-ACK handshaking procedure. All the nodes have the same transmis-
sion range, and are randomly distributed in an area with dimensions limited to the node’s transmission
range. As a result, all the nodes can hear each other, and there are no hidden or exposed terminals.
Only half of the nodes are active traffic sources, the other half are only receivers. The network rep-
resents a single-hop ad hoc network; every sender (active) node sends data packets to one unique
receiver node. For simplicity in studying the 802.11 protocol operation, we assume that the transmit-
ted packets may be lost only due to collision. We consider that the network is in saturation condition
(i.e. all the active nodes have backlogged packets all the time) unless otherwise specified.
4
Following the carrier-sense multiple access with collision avoidance (CSMA/CA) protocol as de-
scribed in the IEEE 802.11 standard [20], if a node has packetto transmit and senses the channel to
be idle for a period of Distributed InterFrame Spacing (DIFS), the node proceeds by transmitting an
RTS packet. If the channel is busy, the node defers its transmission until an idle DIFS is detected
and waits for a random backoff time in order to avoid collisions. The backoff time counter is chosen
uniformly in the range [0,Wi - 1], wherei ∈ [0, mb], mb is the number of backoff stages, andWi is the
current contention window (CW ) size in time slots. A time slot is the unit time in IEEE 802.11. The
contention window at the first transmission of a packet is setequal toCWmin. After an unsuccessful
transmission, theCW is doubled up to a maximum value
CWmax = 2mb × CWmin. (1)
The backoff counter decreases at every slot time when the channel is sensed idle. The counter is
stopped when the channel is busy and resumed when the channelis sensed idle again for more than
DIFS. A station transmits the RTS packet when its backoff timer reaches zero. If the destination
station successfully receives the RTS packet, it responds with a CTS packet after a short inter-frame
space (SIFS) time interval. Upon the reception of the CTS packet, the sender sends the data packet.
The receiver then waits for an SIFS time interval and transmits an acknowledgment (ACK) packet. If
the ACK packet is not received within a specified ACK timeout interval, the data packet is assumed
lost and a retransmission will be scheduled.
We assume a fixed packet size. The packet transmission timeTs is given by [1]
Ts = TRTS + TCTS + 3 SIFS + TACK + T + DIFS (2)
and the packet collision time is given by [1]
Tc = TRTS + DIFS. (3)
The symbolsTRTS, TCTS andTACK represent the transmission times for the RTS, CTS and ACK
packets, respectively;T is the data packet transmission time, which is constant for afixed packet size.
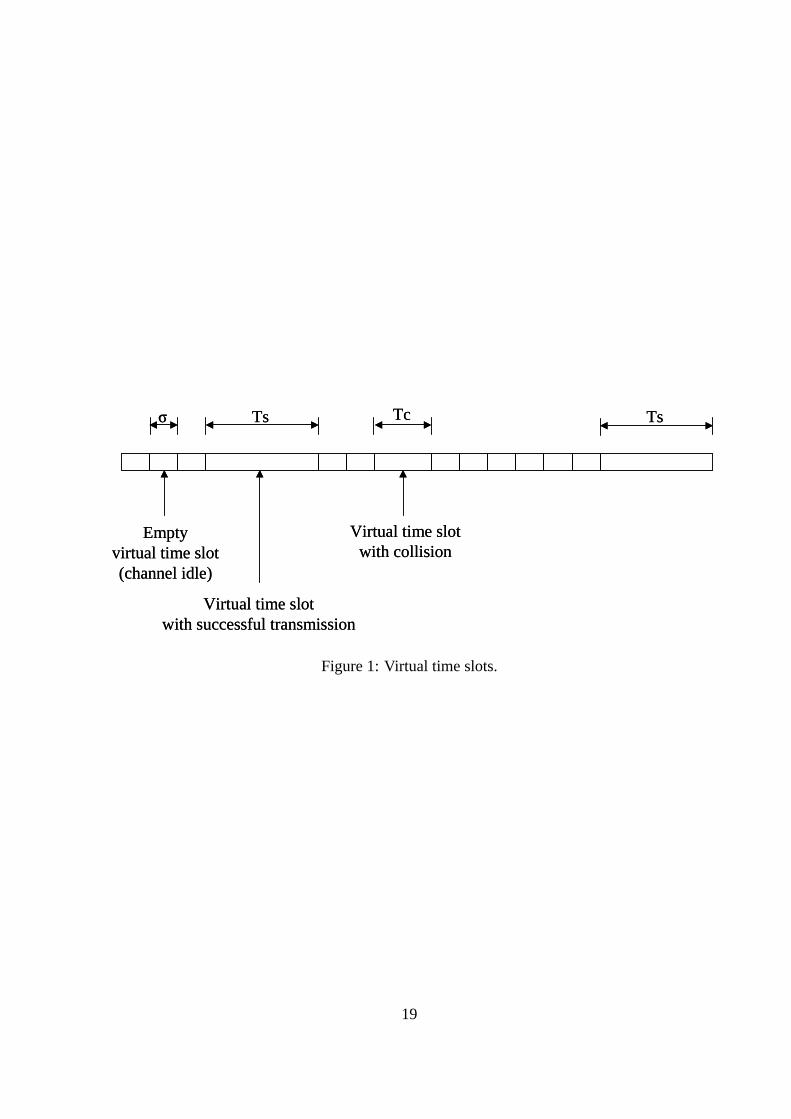
Here we differentiate two types of time slots: physical timeslot and virtual time slot. The physical
time slot (the unit time) has a fixed length denoted byσ. A virtual time slot is the time during which
5
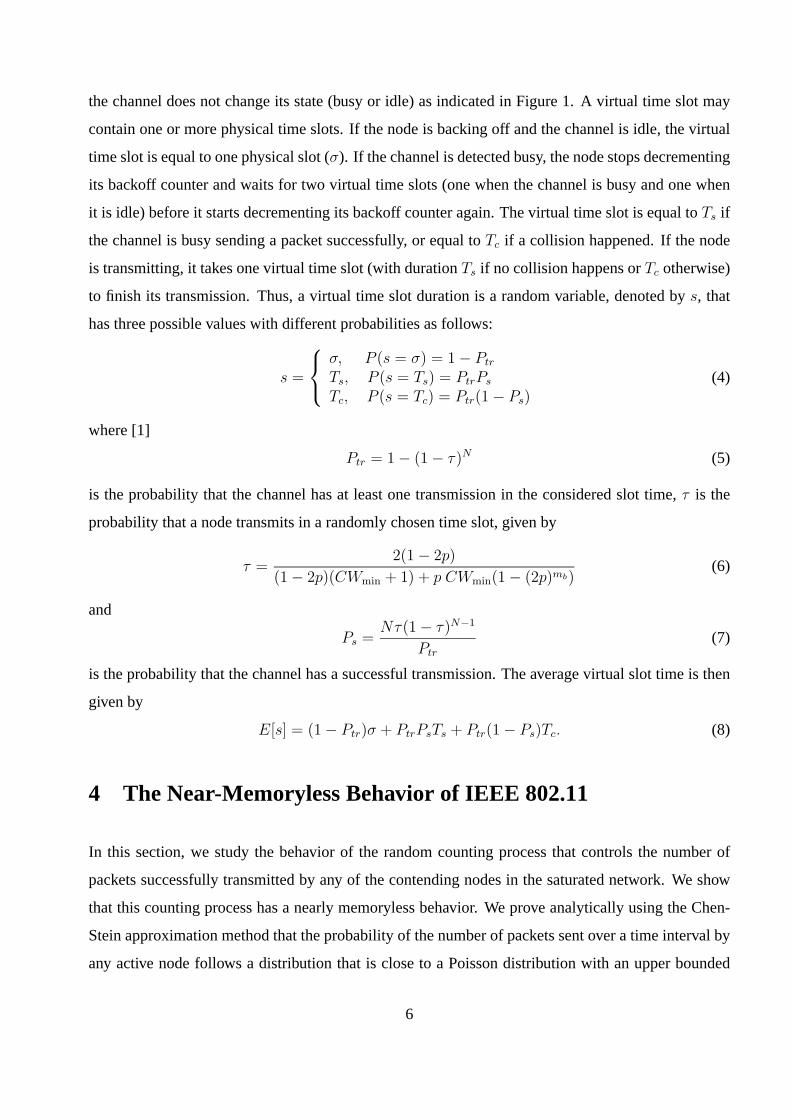
the channel does not change its state (busy or idle) as indicated in Figure 1. A virtual time slot may
contain one or more physical time slots. If the node is backing off and the channel is idle, the virtual
time slot is equal to one physical slot (σ). If the channel is detected busy, the node stops decrementing
its backoff counter and waits for two virtual time slots (onewhen the channel is busy and one when
it is idle) before it starts decrementing its backoff counter again. The virtual time slot is equal toTs if
the channel is busy sending a packet successfully, or equal to Tc if a collision happened. If the node
is transmitting, it takes one virtual time slot (with durationTs if no collision happens orTc otherwise)
to finish its transmission. Thus, a virtual time slot duration is a random variable, denoted bys, that
has three possible values with different probabilities as follows:
s =
σ, P (s = σ) = 1 − Ptr
Ts, P (s = Ts) = PtrPs
Tc, P (s = Tc) = Ptr(1 − Ps)(4)
where [1]
Ptr = 1 − (1 − τ)N (5)
is the probability that the channel has at least one transmission in the considered slot time,τ is the
probability that a node transmits in a randomly chosen time slot, given by
τ =2(1 − 2p)
(1 − 2p)(CWmin + 1) + p CWmin(1 − (2p)mb)(6)
and
Ps =Nτ(1 − τ)N−1
Ptr
(7)
is the probability that the channel has a successful transmission. The average virtual slot time is then
given by
E[s] = (1 − Ptr)σ + PtrPsTs + Ptr(1 − Ps)Tc. (8)
4 The Near-Memoryless Behavior of IEEE 802.11
In this section, we study the behavior of the random countingprocess that controls the number of
packets successfully transmitted by any of the contending nodes in the saturated network. We show
that this counting process has a nearly memoryless behavior. We prove analytically using the Chen-
Stein approximation method that the probability of the number of packets sent over a time interval by
any active node follows a distribution that is close to a Poisson distribution with an upper bounded
6
distribution distance. We also discuss the possible causesof this behavior; namely, the fairness of
the IEEE 802.11 and the randomness of the CSMA/CA backoff procedure. In the following, brief
overviews of the Chen-Stein approximation and the IEEE 802.11 fairness are given for the sake of
completeness.
4.1 Chen-Stein Approximation
The Chen-Stein approximation is a more generalized form of the “law of small numbers”. The law
states that the distribution B(n,pb) can converge to the Poisson distributionPλ, whereλ = npb, for
smallpb and very largen [14] [19] as long as B(n,pb) can be represented as the sum ofn indepen-
dent and identically distributed Bernoulli (indicator) random variables where each indicator equals
to one with probabilitypb. The law of small numbers applies only to this class of variables. How-
ever, the Chen-Stein approximation method extends the law tomeasuring the convergence rate (the
distribution distance) betweenPλ and B(n,pb) asn goes large and relaxes to some extent both the
identical distribution and the independence assumptions [14]. In our case, the indicator random vari-
ables are independent and identically distributed. Therefore, the distribution under consideration can
be described by the random variableW as follows
W =n
∑
i=1
Ii (9)
whereI1, I2, . . . , In are independent and identically distributed random variables and
pbi = P (Ii = 1) = E[Ii]. (10)
According to the Chen-Stein method [14], the distribution distance between the cumulative distribu-
tion function (CDF) of the actual distribution P(W∈ A) and the Poisson CDFPλ(A), where A⊂ Z+,
is bounded by
|P (W ∈ A) − Pλ(A)| ≤(1 − e−λ)
λ
n∑
i=1
p2bi. (11)
4.2 MAC Fairness
MAC fairness refers to the ability of the link layer to allow contending nodes to equally access a
channel. The CSMA/CA technique used in IEEE 802.11 is not perfectly fair, but it can achieve long-
term fairness with a high fairness index [21]. This implies that the probability (the fraction of the
7
number of times) the channel has been accessed by one node successfully can be considered to be
1/N on the long term, whereN is the number of contending nodes. Since we aim at approximating
the distribution of the number of packets successfully transmitted over a time interval, a question
here is how short the time interval could be. Recently it has been shown in [22] and [23] that the
IEEE 802.11 MAC intrinsically (without the hidden terminalproblem) also has a short-term fairness.
The short term is in the order of tens of milliseconds [22]. Asour aim is to provide a tool for
statistical resource allocation in order to provision QoS,the short term fairness implies the validity
of our analysis for multimedia traffic sessions which usually have durations in the order of minutes
[24] [25]. The short-term fairness can be proved as long as the CSMA/CA backoff procedure, as
mentioned in the system model, follows the IEEE 802.11 standard [20]. We limit our analysis only to
the IEEE 802.11 standard since other implementations of theCSMA/CA backoff procedure (such as
WaveLAN) is proved to be short-term unfair [21].
4.3 Distribution Distance
The motivation to study the distance between the distribution of the number of successfully transmit-
ted packets and the Poisson distribution is driven by our intuition that the IEEE 802.11 has a kind of
memoryless behavior. This behavior can be explained from the following two aspects:
• The number of packets successfully transmitted by any active node at saturation over a time in-
terval is a renewal process, since the node restarts again its contention window to the minimum
size after every successful transmission and it always has backlogged packets;
• The node contends for the channel with the same collision probability, irrespective of the num-
ber of retransmissions it had before, though the contentionwindow size doubles after every
retransmission [1]. In fact, the probability of a successful transmission of any node (when
contending for the channel) is the same irrespective of how long it has been waiting for the
transmission.
We use the Chen-Stein approximation as a tool to quantify mathematically the distribution distance.
We introduce a mathematical model to the random counting process that describes the number of
successfully transmitted packets over a time interval (onesecond for simplicity).
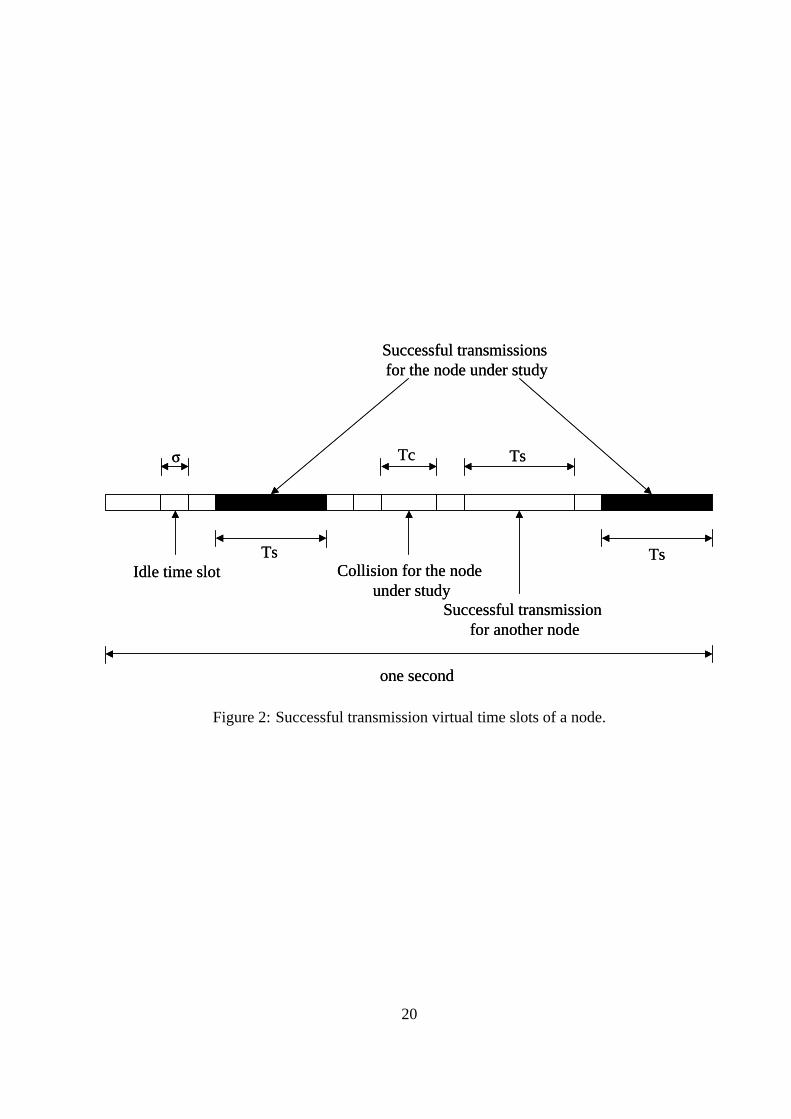
8
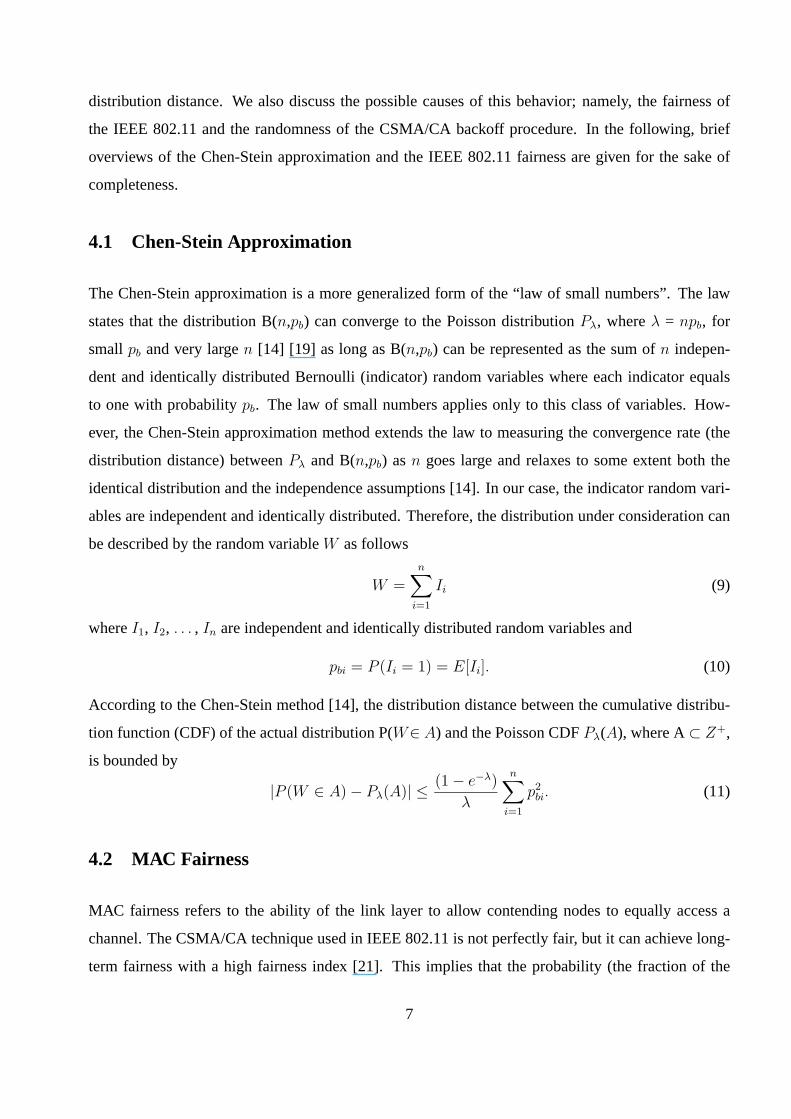
In this model, any active node has a number of virtual time slots with successful transmissions in
one second. This number can be considered as the number of successful trials out of the total number
of other virtual time slots that the channel has in one second, as illustrated in Figure 2. The figure
shows the virtual time slots that contain successful transmissions for a certain active node in black,
and other white slots corresponding to successful transmissions or collisions from other nodes, idle
channel or collisions associated with the same node.
Under the assumption that the packet of any node sees a collision with constant and independent
packet collision probabilityp, the relation between the probabilityτ that a node sends a packet at a
random time slot andp is given by [1]
p = 1 − (1 − τ)N−1. (12)
We model the number of successfully transmitted packets over a time interval of one second from
a certain node as the summation of indicator random variables Ii, where
Ii =
1, A certain node transmitted a packetsuccessfully (no collision) in slot i
0, Otherwise(13)
with
P (Ii = 1) = τ (1 − p) = τ (1 − τ)N−1 , q. (14)
In (14), the probability is observed from the perspective ofa certain node, wherei is the slot index
as the transmission in 802.11 MAC is time slotted. Therefore, the number of successfully transmitted
packets in one second from a certain node is given by
W =M
∑
i=1
Ii (15)
whereM is a random variable represents the total number of virtual time slots in one second. Given
M , the expected number of packets sent per second by a certain node is represented by
λ , E(W |M = m) = E
[
m∑
i=1
Ii|M = m
]
=m
∑
i=1
E(Ii) = mτ(1 − p). (16)
We assume thatIi andM are independent. The independence is reasonable since under the satura-
tion conditionM takes very large values since the backoff procedure should be executed after each
collision or successful transmission. This implies the number of idle virtual time slots is much higher
9
than the number of virtual collision slots or the number of virtual successful transmission slots. The
duration of an idle time slot is in the order of tens of micro seconds as in Table 1. Because of the
fairness of the MAC and the saturation condition, all the active nodes are treated similarly. Hence, the
distribution distance in (11) for any node is bounded by
|P (W ∈ A|M = m) − Pλ(A|M = m)| ≤N(1 − e−λ)
λ
m∑
i=1
τ 2(1 − τ)2(N−1)
By evaluating the summation and substituting the value ofλ, we have
|P (W ∈ A|M = m) − Pλ(A|M = m)| ≤ Nτ(1 − τ)N−1(1 − e−λ) (17)
which leads to
|P (W ∈ A) − Pλ(A)| ≤ Nτ(1 − τ)N−1∑
m
(1 − e−λ)P (M = m)
The random variableM represents the number of virtual slots within a certain timeperiod (one
second). The duration of a virtual time slot with successfultransmission,Ts, is the longer than the
other two types of virtual slots; namely, an idle slot and a slot with collision. Therefore, if almost
all1 the virtual slots contain successful transmission, the random variableM would take its smallest
value and henceλ, which directly depends onM , would take its smallest value. In this case,M
roughly takes the value1/Ts, which is in the order of hundreds virtual slots per second (according to
the parameters given in Table 1 ) makingλ in the order of tens of packets per second. Therefore, the
exponential terme−λ approaches zero and the distribution distance can be approximately bounded by
|P (W ∈ A) − Pλ(A)| ≤ Nτ(1 − τ)N−1. (18)
It has been shown in [1] that the saturation throughput, for acertain number of active nodes in the
network, has a maximum value that can be achieved by fine tuning of the probabilityτ . The tuning
can be done by changing the minimum size of the contention window CWmin and/or the number
of backoff stagesmb. It can be noticed from [1] that the maximum saturation throughput for the
RTS/CTS access scheme approaches the saturation throughputcalculated at the standardized values
for both CWmin andmb [20] (i.e. 16, 32 or 64 forCWmin and 5 formb) and a sufficiently large
number of nodes (N ≥ 5). As indicated in Table 1, we use the standard values for both CWmin and
1The channel should be idle for at least one time slot between two successful transmissions.
10
mb (i.e. CWmin = 16 andmb = 5). For these standard values, the transmission probability for a
maximum throughput is approximately given by [1]
τ ≈1
NK(19)
where
K =
√
Tc
2σ(20)
which leads to
Nτ(1 − τ)N−1 ≈1 − e−1/K
K(e1/K − 1). (21)
Thus, the distribution distance becomes
|P (W ∈ A) − Pλ(A)| ≤1 − e−1/K
K(e1/K − 1). (22)
Equation (22) shows that there is an almost constant upper bound on the distribution distance. The
bound depends mainly onK, which in turn depends on system parametersTc (i.e. TRTS andDIFS)
andσ. An approximated upper bound value of 0.3 is obtained from (22) when using the IEEE system
parameters given in Table 1. It implies that IEEE 802.11 has akind of near-memoryless behavior,
which is aligned with our intuition, but not completely memoryless since the upper bound is not
small. This is due to that IEEE 802.11 is not completely fair,as the protocol may favor the node
that had a successful transmission before to transmit successfully again and again. Also, the discrete
nature of the slotted operation limits the packet service time to discrete values. Therefore, the renewal
counting process for successfully transmitted packets does not exactly have independent increments,
which explains the deviation from the Poisson process.
5 Service Time Approximation
Our service time approximation stems from the mathematicalmodel introduced in the previous section
for the counting process of the number of successfully transmitted packets. Here, we approximate the
random length of the virtual time slot by its average valueE[s]. By this approximation, the number of
virtual time slots over a time interval becomes a deterministic value. Thus, the counting process now
describes the number of virtual time slots with successful transmissions (successful trials) out of the
total number of virtual time slots (total number of trials) over a time intervalt, which is the typical
binomial process
11
B(t) =
⌊t/E[s]⌋∑
i=1
Ii (23)
whereIi is defined in (13). It can be shown that, for a binomial process, the time between successive
events (the service time in our case) follows a geometric distribution [13]. The geometric distribution
is a probability distribution for discrete random variables, and suits well the discrete slotted nature of
IEEE 802.11. In addition, it has a memoryless nature [26]. This can be intuitively explained: the fact
that we have donen trials and got failures does not change how many more times westill have to try
to get the next success.
Therefore, the probability that the service time equalsn virtual time slots is given by
P{ts = n} = q (1 − q)n−1 (24)
where the distribution parameterq is the successful transmission probability given by (14).
As a result, the average service timeµ can be obtained from
1
µ=
⌊1/E[s]⌋∑
i=1
E[Ii] =τ · (1 − p)
E[s](25)
which is consistent with (14). The service time distribution given by (24) is discrete with an exponential-
like decay that really resembles the actual distributions shown in [2], [7] and [10]. Moreover, the
average value given in (25) is consistent with the expressions obtained by the previous researchers
[12] [27] for the average packet delay when substituting thevalue ofτ by (6).
5.1 M/Geo/1 Queuing Model
Here, we propose using the discrete-time queuing discipline (M/Geo/1) as a queuing model for nearly
saturated IEEE 802.11 single-channel ad hoc networks (withPossion traffic sources). This model
describes a queuing system with a Possion arrival process, and an output server (channel) that is
subjected to interruptions controlled by a geometric distribution [28]. The output channel is capable
of sending one packet successfully per unit service interval (virtual time slot). The probability that the
output channel is available (i.e. available to send the packet successfully) at saturation is given byq,
which is defined by (14). The probability the channel is blocked (cannot send the packet successfully)
for exactly(n − 1) consecutive service intervals at saturation is given by (24). We do the queuing
12
analysis at near saturation (with utilization factorρ very close to but less than 1) to guarantee the
stability of the queue and also to take the advantage of high network throughput [1]. At saturation,
the queue may not be stable and hence it is impractical for resource allocation and QoS provisioning.
We note that, in IEEE 802.11, the service rate of the queuing system is not constant but depends on
the arrival rate. In most queuing systems, we can simply choose the arrival rate for a requiredρ value.
However, in IEEE 802.11, when the arrival rate increases toward saturation, the service rate decreases
until it reaches a saturation value. In fact, the saturationservice rate is the minimum achievable value
before the queue becomes totally unstable. The M/Geo/1 queuing model is sufficiently accurate for
0.98≤ ρ < 1 , which is very close to saturation (ρ = 1). As ρ decreases, the approximation error
increases. The service rate (the number of successfully transmitted packets per virtual slot) in a non-
saturated case, denoted byβ, can be calculated with sufficient accuracy using the methoddescribed
in [29]. Actually, Cai et. al give basic equations in [29] thatcan be solved to get the average service
rate and the collision probabilityp for a certain utilization factorρ and a certain arrival rate in non
saturated conditions. We use the service rate obtained fromthe solution of those equations to get the
average queue length and the probability distribution of the buffer occupancy based on the M/Geo/1
analysis given by (26)-(27). We assume an infinite buffer model for simplicity. The assumption is
reasonable due to the huge available capacity of the latest memory chips, e.g. those used in small
devices such as personal digital assistants (PDAs). Based on[28], the average queue length for the
Poisson arrivals and geometric service time can be exactly calculated by
Lq =ρ (2 − α)
2 (1 − ρ)(26)
whereα is the number of packet arrivals per virtual slot andρ is the utilization factor given by
ρ =α
β.
The probability distribution ofm packets in the queuing system can be approximated (as the aver-
age virtual slot time is small) by [30]
pm ≈
(1−γ) γm
1−β (1−γ), m > 0
(1−β) (1−γ)1−β (1−γ)
, m = 0
(27)
where
γ =α (1 − β)
β (1 − α).
In the next section, we verify by computer simulations that both the average queue length and the
probability distribution of the number of packets given in (26)-(27) are very accurate.
13
6 Simulation Results
We verify our analysis using the ns-2 simulator [31]. The simulation model simulates nodes moving
in an unobstructed plane following therandom waypointmodel [32] with a maximum speed of 1
m/s. In the model, a node chooses its speed and its destination randomly and then moves to the
destination. The simulation is done for a network having a variable number of mobile nodes over an
area of 250x250 m2. The node radios have a transmission range of 250 m and a carrier-sense range of
550 m. Only half of the nodes are active traffic sources, the other half are only receivers. The network
represents a single-hop ad hoc network; every sender sends data packets to one unique receiver. To
verify the distribution distance bound (22), we use constant bit rate traffic sources with a high data
rate to force the active nodes to be in a saturation state (always have backlogged packets). For the
queuing analysis verification, we use Poisson traffic sources.
Basically, the ns-2 simulator uses the WaveLAN implementation for medium access control. This
MAC implementation has two main differences from the IEEE 802.11 standard as follows: (i) The
backoff counter does not stop, when a transmission of another node is in progress; (ii) The CSMA/CA
implementation is short-term unfair [21] since the node doubles its backoff window if it sensed the
channel busy after its backoff counter is already decremented to zero. This gives a higher chance
for the node currently transmitting a packet to continue transmission. According to the IEEE 802.11
standard [20], the node doubles its contention window only when collision is detected. Therefore,
we modified the ns-2 implementation to comply with the standard. In the following, we verify the
distribution distance analysis and the queuing analysis. Table 1 gives the system parameter values
used in the analysis and simulations.
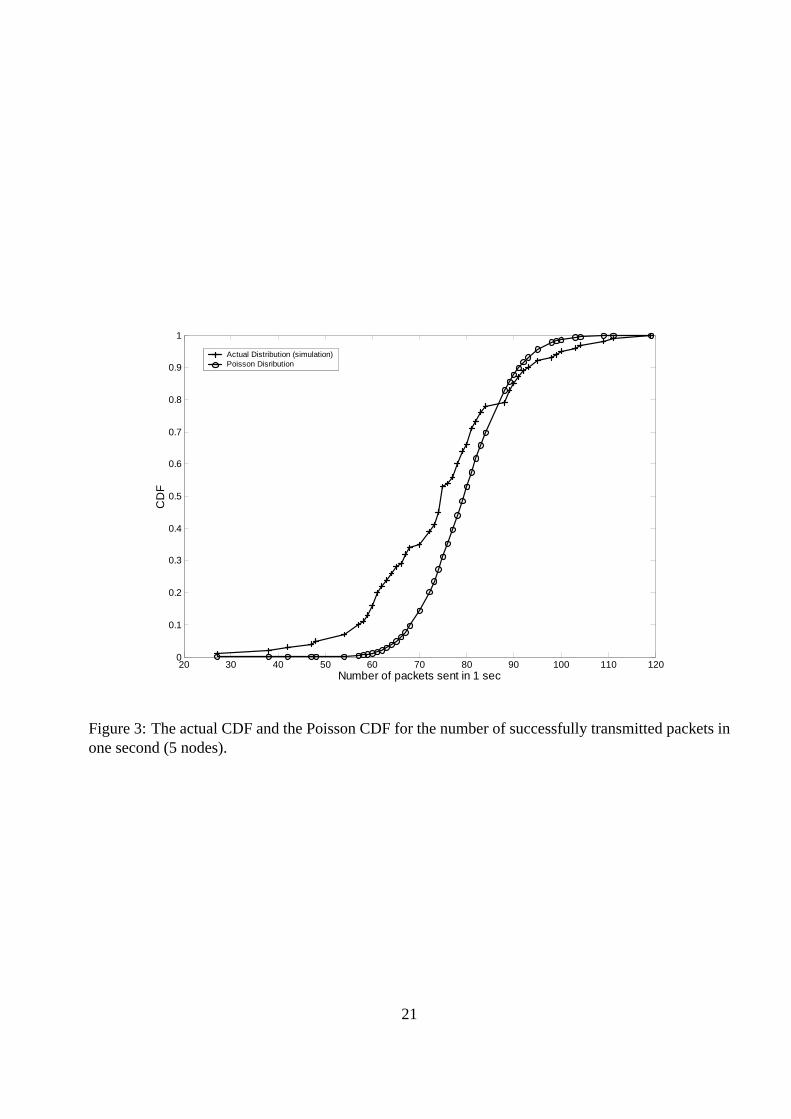
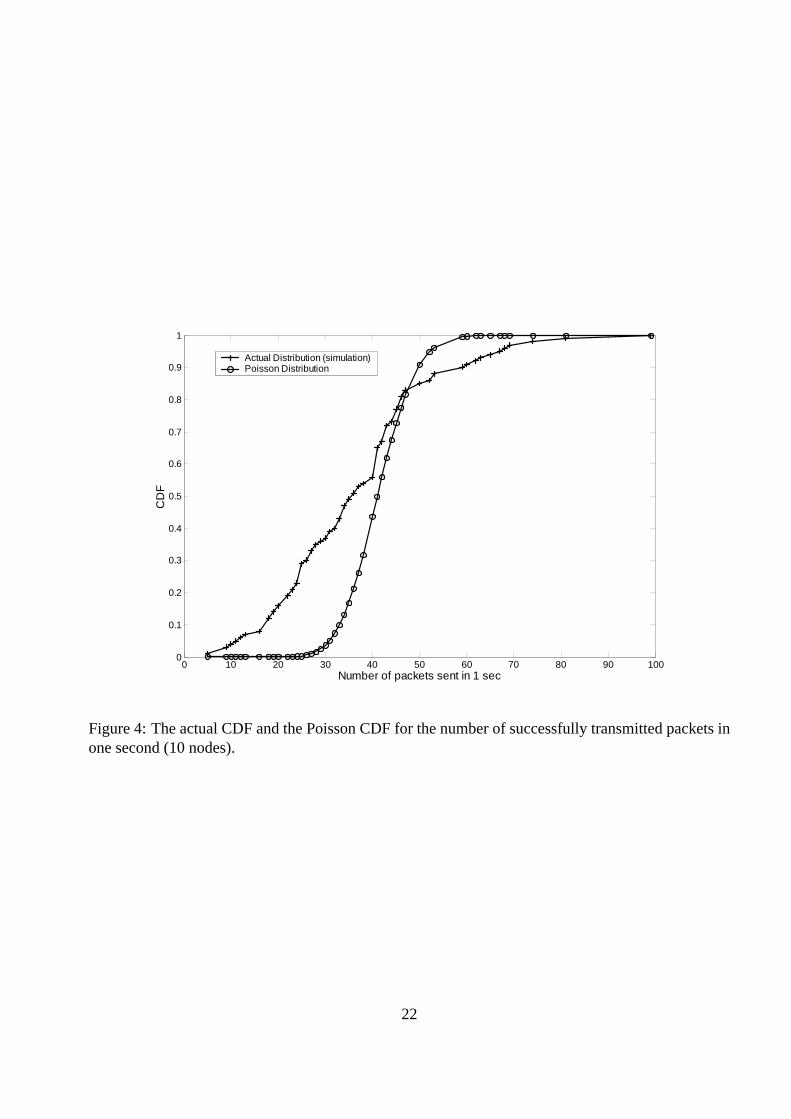
6.1 Distribution distance verification
We measure the probability distribution of the number of packets successfully transmitted by any
node over a duration of one second for different number of active source nodes, namely, 5, 10 and
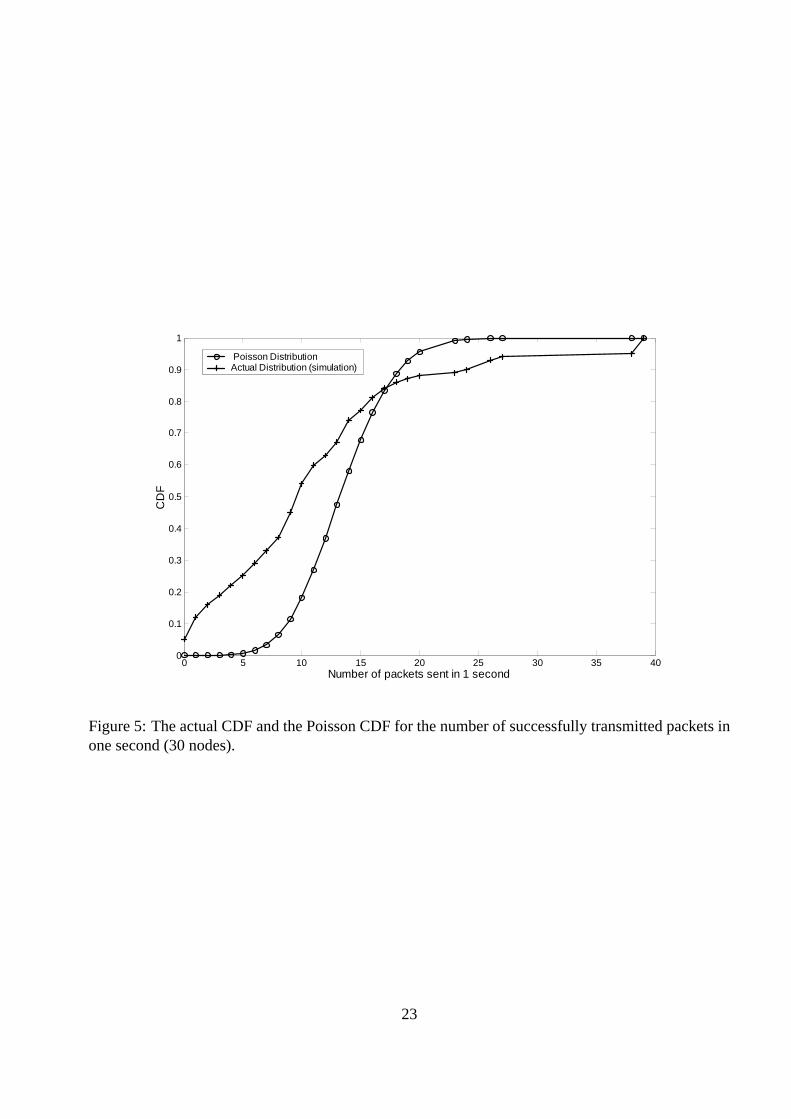
30 nodes. Figures 3-5 show the cumulative distribution function (CDF) of the number of success-
fully transmitted packets for the different numbers of active nodes, respectively. For comparison,
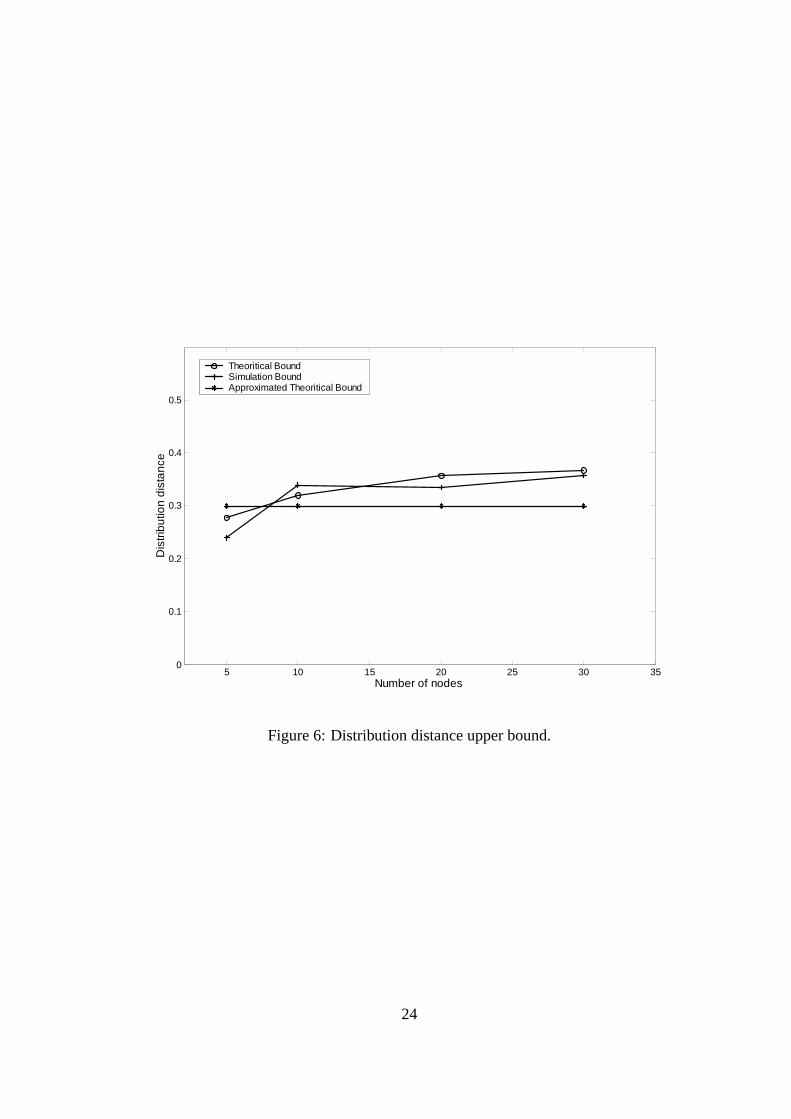
the corresponding Poisson distribution is also included. Figure 6 shows a comparison between the
calculated upper bounds for different numbers of active source nodes (5, 10, 20 and 30 nodes) using
14

(18) and (22) respectively, and the results from the computer simulations. The figure shows a close
match between the analysis and simulation results. The upper bound, as can be seen from the figure,
is almost constant and slightly affected by the number of active nodes. The figure also shows that
the upper bound for different number of active nodes is very close to the approximated theoretical
value obtained from (22). From Figures 3-5, it can be seen that the upper bound has been reached
mainly at a small number of packets, which reflects a higher probability of a long service time than
the exponential distribution. When the number of packets increases, getting closer to the average and
larger, the distribution distance becomes smaller than theupper bound. The difference between the
distributions results from the discrete nature of the service time distribution, in addition to the fact
that the service time is not completely memoryless.
6.2 M/Geo/1 queuing system verification
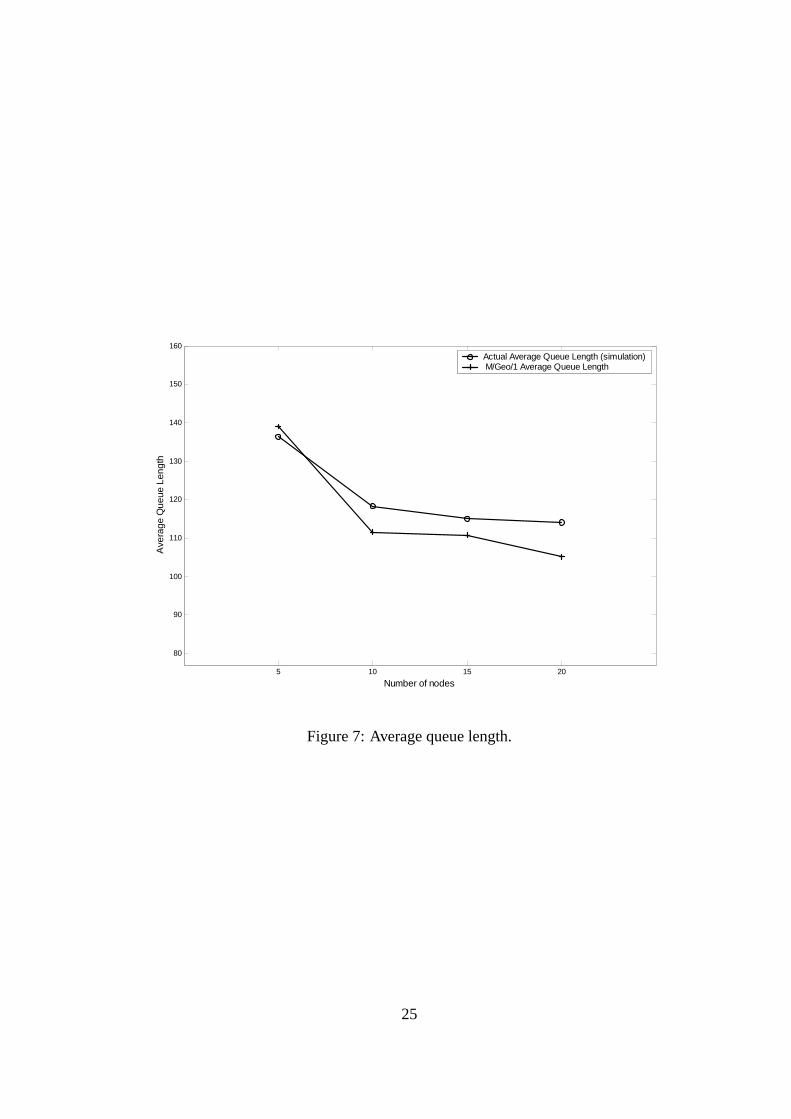
We calculate the average queue length and the probability distribution of the number of packets in the
queuing system using (26) and (27). Figure 7 compares the average queue length for different numbers
of active nodes based on both the analysis and simulations. It is observed that, the difference between
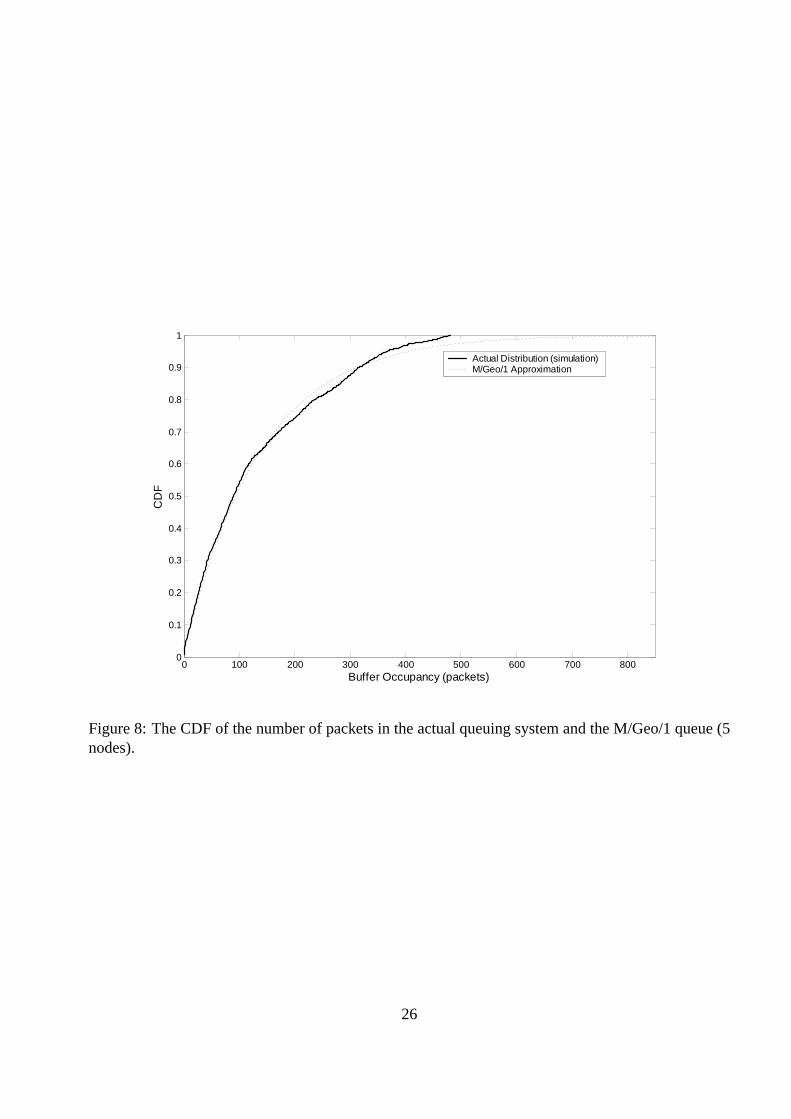
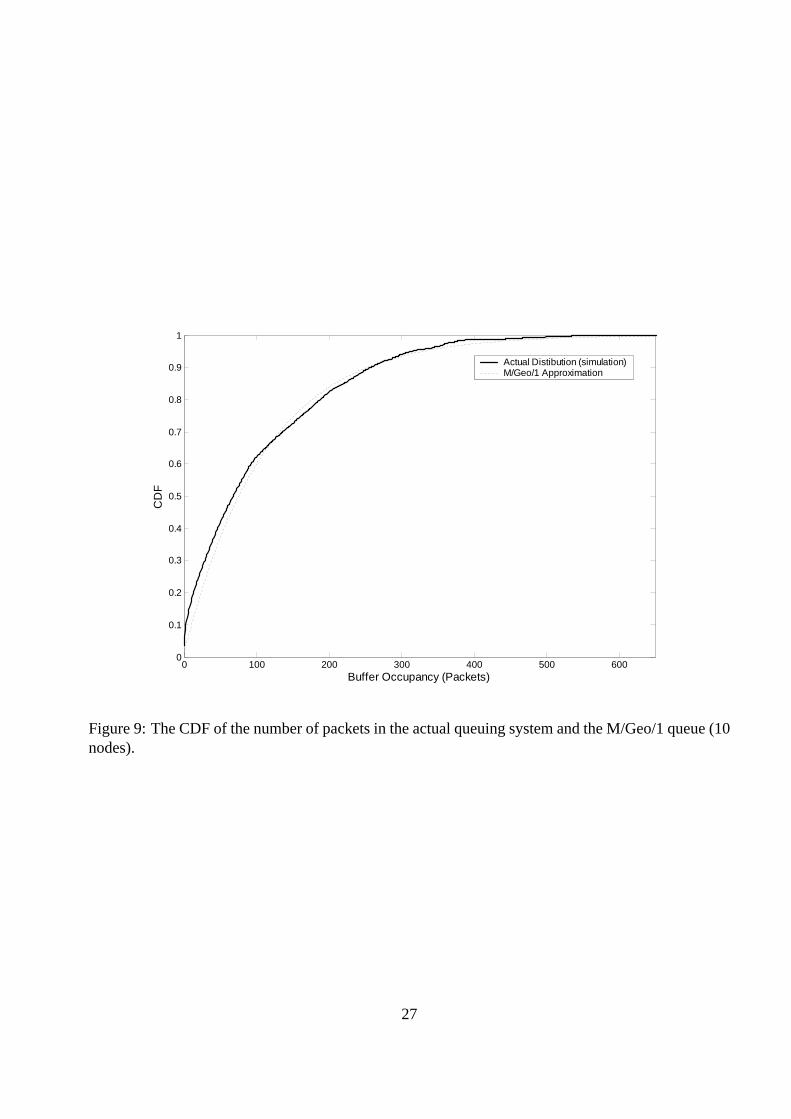
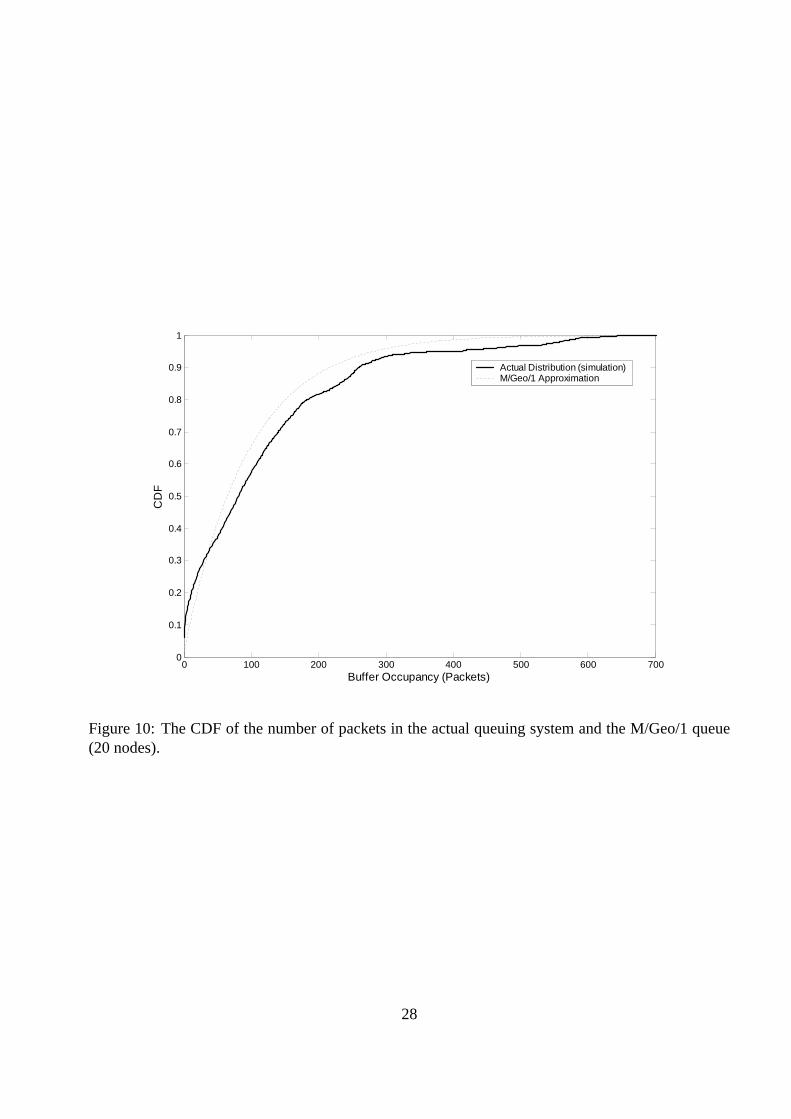
the analytical and simulation results is small (around 5% to7%). Figures 8-10 show a comparison
between the simulation and analysis results for the CDF of thenumber of packets in the queuing
system for 5, 10 and 20 active source nodes, respectively. The two distributions in each of the figures
are in a close match. The result indicates that the geometricdistribution is effective in approximating
the actual service time. We notice that, although the counting process of the successful transmitted
packets deviates from the true memoryless behavior, the deviation does not significantly affect the
queuing analysis when the discrete memoryless distribution is considered for the service time. As
a result, we suggest to use the M/Geo/1 analysis as a tool for statistical QoS provisioning (such as
statistical call admission control). The accurate match between the analytical and simulation results
of the probability distribution of the buffer occupancy implies that the M/Geo/1 analysis can be used
to provide stochastic QoS guarantees for any type of traffic flows (as long as their arrival process can
be modeled approximately as a Poisson process).
15
7 Conclusion
This paper aims at reaching a simplified and sufficiently accurate approximation for the service time
distribution in IEEE 802.11 nearly saturated single-hop adhoc networks. The approximated distri-
bution can be used in statistical resource allocation for efficient resource utilization and QoS pro-
visioning. Through investigating the memoryless behaviorof the service time, we have shown that
the number of successful packet transmissions by any node inthe network over a time interval has a
probability distribution that is close to Poisson by an upper bounded distribution distance. By using
the Chen-Stein approximation, we calculate the bound and illustrate that it depends mainly on some
system parameters and slightly on the number of active nodes. Further we propose to use the geomet-
ric distribution with the appropriate parameter as an approximation of the probability distribution of
the actual discrete service time. We illustrate that a discrete-time queuing discipline (M/Geo/1) can
be used as a queuing model for IEEE 802.11 ad hoc networks (fedby Poisson traffic sources). The
analytical results and computer simulation results show a very close match not only in the average
queue length but also in the probability distribution of thenumber of packets in the queuing system.
References
[1] G. Bianchi,“Performance analysis of the IEEE 802.11 distributed coordination function,”IEEE J. Select.Areas Commun., vol. 18, Issue 3, Mar.2000, pp. 535–547.
[2] H. Zhai, Y. Kwon, and Y. Fang, “Performance analysis of IEEE 802.11 MAC protocols in wirelessLANs,” Wirel. Commun. Mob. Comput., vol. 4, 2004, pp. 917–931.
[3] P. Raptis, V. Vitsas, K. Paparrizos, P. Chatzimisios, A. C. Boucouvalas and P. Adamidis, “ Packet delaymodeling of IEEE 802.11 Wireless LANs ,”Proc. Intl. Conf. on Cyber. Info. Tech. Sys. Apps. CITSA2005, Jul. 2005.
[4] M. Ozdemir and A. McDonald, “An M/MMGI/1/K queuing model for IEEE 802.11 ad hoc networks,”Proc. 1st ACM Intl. Workshop on Perf. Eval. of Wirel. Ad Hoc Sensor Ubiquit. Net. PE-WASUN ’04, Apr.2004, pp. 107–111.
[5] O. Tickoo and B. Sikdar, “Queueing analysis and delay mitigation in IEEE802.11 random access MACbased wireless networks,”Proc. INFOCOM 2004, vol. 2, Mar. 2004, pp. 1404–1413.
[6] P. Pham, S. Perreau and A. Jayasuriya, “New cross-layer design approach to ad hoc networks underRayleigh fading,”IEEE J. Select. Areas Commun., vol. 23, no. 1, Jan. 2005, pp. 28–39.
[7] Y. Zheng, K. Lu, D. Wu and Y. Fang, “Performance analysis of IEEE 802.11 DCF in binary symmetricchannels,”Proc. IEEE GLOBECOM 2005, vol. 5, Dec. 2005, pp. 3144–3148.
[8] P. Engelstad and O. sterb, “Analysis of the Total Delay of IEEE 802.11e EDCA and 802.11 DCF,”Proc.IEEE ICC 2006, Jun. 2006.
[9] O. Tickoo and B. Sikdar,“A queueing model for finite load IEEE 802.11random access MAC,”ICC 2004,vol. 1, Jun. 2004, pp. 175–179.
16
[10] A. Zanella, F. De Pellegrini, “Statistical characterization of the service time in saturated IEEE 802.11networks,”IEEE Commun. Lett., vol. 9, Mar. 2005, pp. 225–227.
[11] P. Raptis, K. Paparrizos, P. Chatzimisios and A.C. Boucouvalas, “Packet delay distribution of the IEEE802.11 distributed coordination function,”Proc. 6th IEEE Intl. Symp. World of Wirel. Mob. Multimed.Net. WoWMoM’05, Jun. 2005, pp. 299–304.
[12] P. Chatzimisios, A.C. Boucouvalas and V. Vitsas, “IEEE 802.11 packet delay – a finite retry limit analy-sis,” Proc. GLOBECOM 2003, vol. 2, 2003, pp. 950–954.
[13] S. Ross,Introduction to probability models, 7th ed. Harcourt Academic Press, 2000.
[14] C. Goldschmidt, “The Chen-Stein method for convergence of distributions ”, Masters-level essay, Uni-versity of Cambridge, UK, 2000 [online] http://www.statslab.cam.ac.uk/ cag27/chen-stein.ps.gz.
[15] A. Banchs, “Analysis of the distribution of the backoff delay in 802.11 DCF: a step towards end-to-enddelay guarantees in WLANs,”Proc. QoFIS 2004, LNCS 3266, Sep. 2004, pp. 64-73.
[16] P. Jacquet, A. Naimi and G. Rodolakis, “Routing on Asymptotic Delays inIEEE 802.11 Wireless AdHoc Networks,”Proc. RAWNET 2005, Apr. 2005.
[17] C. Foh and M. Zukerman, “Performance analysis of the IEEE 802.11 MAC protocol,” Proc. EuropeanWireless 2002,Italy, Feb. 2002.
[18] J. Tantra, C. Foh, I. Tinnirello and G. Bianchi, “Analysis of the IEEE 802.11e EDCA Under StatisticalTraffic,” Proc. IEEE ICC 2006, Jun. 2006.
[19] S. Sitharaman, “Modeling queues using poisson approximation in IEEE802.11 ad hoc networks,”Loc.Metro. Area Net. LANMAN 2005, Sep. 2005, pp. 1–6.
[20] IEEE Standard for Wireless LAN Medium Access Control (MAC) and Physical Layer (PHY) specifica-tions, ISO/IE 8802-11: 1999(E), August 1999.
[21] C.E. Koksal, H. Kassab, and H. Balakrishnan, “An analysis of short-term fairness in wireless mediaaccess protocols,”Proc. ACM SIGMETRICS, Jun. 2000.
[22] G. Berger-Sabbatel, A. Duda, M. Heusse, and F. Rousseau, “Short-term fairness of 802.11 networks withseveral hosts,”Proc. 6th IFIP/IEEE Intl. Conf. Mob. Wirel. Communi. Net., Oct. 2004, pp. 263–274.
[23] G. Berger-Sabbatel, A. Duda, O. Gaudoin, M. Heusse, F. Rousseau, “Fairness and its impact on delay in802.11 networks,”GLOBECOM ’04, vol. 5, Dec. 2004, pp. 2967–2973.
[24] C. Trabelsi,“Access protocol for broadband multimedia centralized wireless local area networks ,”Sec-ond IEEE Symp. on Comp. and Communi., Jul. 1997, pp. 540–544.
[25] W. Song, H. Jiang, W. Zhuang, and X. Shen, “Resource management for QoS support in cellular/WLANinterworking,” IEEE Network, vol. 19, Sep. 2005, pp. 12–18.
[26] J. Walrand (Nov. 2003), EECS 126 - Probability and Random Processes, [Online] Available:http://robotics.eecs.berkeley.edu/ wlr/126/w11.htm
[27] P. Chatzimisios, A.C. Boucouvalas and V. Vitsas, “Packet delay analysis of IEEE 802.11 MAC protocol,”Elect. Lett.,vol. 39, Sep. 2003, pp. 1358–1359.
[28] J. Hsu, “Buffer behavior with Poisson arrivals and geometric output processes,”IEEE Trans. Communi-cations., vol. 22, Dec. 1974, pp. 1940 – 1941.
[29] L. X. Cai, X. Shen, J. Mark, L. Cai, and Y. Xiao, “Voice capacity analysis of WLAN with unbalancedtraffic,” IEEE Trans. Vech. Tech., vol. 55, May 2006, pp. 752–761.
[30] M. Woodward,Communication and Computer Networks: Modeling with Discrete-Time Queues, LosAlamitos, Calif., IEEE Computer Society Press, 1994.
[31] The VINT Project. The UCB/LBNL/VINT Network Simulator-ns (version 2).http://mash.cs.berkeley.edu/ns.
[32] J. Broch, D. Maltz, D. Jonthon, Y. Hu and J. Jetcheva, “A performance comparison of multi-hop wirelessad-hoc network routing protocols,”Proc. ACM/IEEE Mobicom’98, pp. 85–97.
17
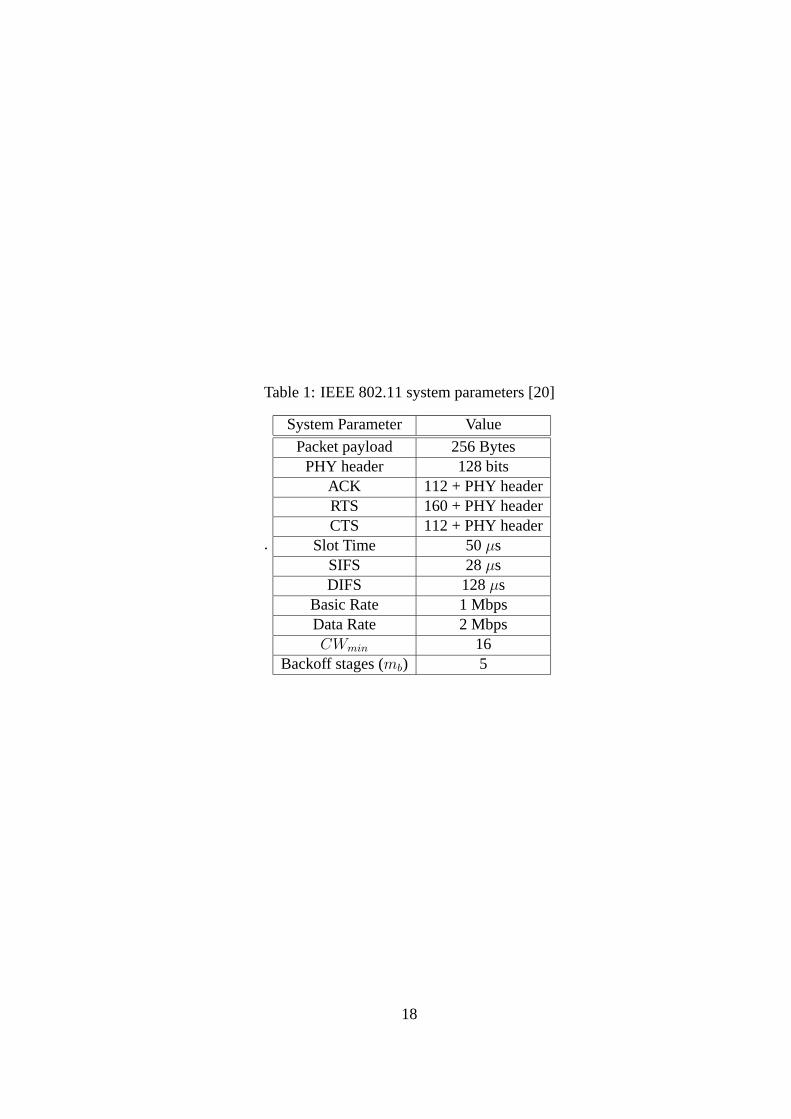
Table 1: IEEE 802.11 system parameters [20]
.
System Parameter Value
Packet payload 256 BytesPHY header 128 bits
ACK 112 + PHY headerRTS 160 + PHY headerCTS 112 + PHY header
Slot Time 50µsSIFS 28µsDIFS 128µs
Basic Rate 1 MbpsData Rate 2 MbpsCWmin 16
Backoff stages (mb) 5
18
Emptyvirtual time slot(channel idle)
Ts TsTc
Virtual time slotwith successful transmission
Virtual time slotwith collision
σ
Emptyvirtual time slot(channel idle)
Ts TsTc
Virtual time slotwith successful transmission
Virtual time slotwith collision
σ
Figure 1: Virtual time slots.
19
Idle time slotTs Ts
Tc
Successful transmissionsfor the node under study
Collision for the node under study
σ
Successful transmissionfor another node
Ts
one second
Idle time slotTs Ts
Tc
Successful transmissionsfor the node under study
Collision for the node under study
σ
Successful transmissionfor another node
Ts
one second
Figure 2: Successful transmission virtual time slots of a node.
20
20 30 40 50 60 70 80 90 100 110 1200
0.1
0.2
0.3
0.4
0.5
0.6
0.7
0.8
0.9
1
Number of packets sent in 1 sec
CD
F
Actual Distribution (simulation)Poisson Disribution
Figure 3: The actual CDF and the Poisson CDF for the number of successfully transmitted packets inone second (5 nodes).
21
0 10 20 30 40 50 60 70 80 90 1000
0.1
0.2
0.3
0.4
0.5
0.6
0.7
0.8
0.9
1
CD
F
Number of packets sent in 1 sec
Actual Distribution (simulation)Poisson Distribution
Figure 4: The actual CDF and the Poisson CDF for the number of successfully transmitted packets inone second (10 nodes).
22
0 5 10 15 20 25 30 35 400
0.1
0.2
0.3
0.4
0.5
0.6
0.7
0.8
0.9
1
Number of packets sent in 1 second
CD
F
Poisson DistributionActual Distribution (simulation)
Figure 5: The actual CDF and the Poisson CDF for the number of successfully transmitted packets inone second (30 nodes).
23
5 10 15 20 25 30 350
0.1
0.2
0.3
0.4
0.5
Number of nodes
Dis
tribu
tion
dist
anc
e
Theoritical BoundSimulation BoundApproximated Theoritical Bound
Figure 6: Distribution distance upper bound.
24
5 10 15 20
80
90
100
110
120
130
140
150
160
Number of nodes
Ave
rage
Que
ue L
engt
h
Actual Average Queue Length (simulation) M/Geo/1 Average Queue Length
Figure 7: Average queue length.
25
0 100 200 300 400 500 600 700 8000
0.1
0.2
0.3
0.4
0.5
0.6
0.7
0.8
0.9
1
Buffer Occupancy (packets)
CD
F
Actual Distribution (simulation)M/Geo/1 Approximation
Figure 8: The CDF of the number of packets in the actual queuingsystem and the M/Geo/1 queue (5nodes).
26
0 100 200 300 400 500 6000
0.1
0.2
0.3
0.4
0.5
0.6
0.7
0.8
0.9
1
Buffer Occupancy (Packets)
CD
F
Actual Distibution (simulation)M/Geo/1 Approximation
Figure 9: The CDF of the number of packets in the actual queuingsystem and the M/Geo/1 queue (10nodes).
27
0 100 200 300 400 500 600 7000
0.1
0.2
0.3
0.4
0.5
0.6
0.7
0.8
0.9
1
Buffer Occupancy (Packets)
CD
F
Actual Distribution (simulation)M/Geo/1 Approximation
Figure 10: The CDF of the number of packets in the actual queuing system and the M/Geo/1 queue(20 nodes).
28
Related Documents