Economic Research Service Economic Information Bulletin Number 144 September 2015 United States Department of Agriculture Biofuel Use in International Markets: The Importance of Trade Jayson Beckman

Welcome message from author
This document is posted to help you gain knowledge. Please leave a comment to let me know what you think about it! Share it to your friends and learn new things together.
Transcript
Economic Research Service
Economic Information Bulletin Number 144
September 2015
United States Department of Agriculture
Biofuel Use in International Markets: The Importance of Trade
Jayson Beckman

Economic Research Service www.ers.usda.gov
The U.S. Department of Agriculture (USDA) prohibits discrimination in all its programs and activities on the basis of race, color, national origin, age, disability, and, where applicable, sex, marital status, familial status, parental status, religion, sexual orientation, genetic information, political beliefs, reprisal, or because all or a part of an individual’s income is derived from any public assistance program. (Not all prohibited bases apply to all programs.) Persons with disabilities who require alternative means for communication of program information (Braille, large print, audiotape, etc.) should contact USDA’s TARGET Center at (202) 720-2600 (voice and TDD).
To file a complaint of discrimination write to USDA, Director, Office of Civil Rights, 1400 Independence Avenue, S.W., Washington, D.C. 20250-9410 or call (800) 795-3272 (voice) or (202) 720-6382 (TDD). USDA is an equal opportunity provider and employer.
United States Department of Agriculture
Access this report online:
www.ers.usda.gov/publications/eib-economic-information-bulletin/eib144
Download the charts contained in this report:
• Go to the report’s index page www.ers.usda.gov/publications/ eib-economic-information-bulletin/eib144
• Click on the bulleted item “Download eib144.zip”
• Open the chart you want, then save it to your computer
Recommended citation format for this publication:
Beckman, Jayson. Biofuel Use in International Markets: The Importance of Trade, EIB-144, U.S. Department of Agriculture, Economic Research Service, September 2015.
Cover images: Shutterstock
Use of commercial and trade names does not imply approval or constitute endorsement by USDA.

United States Department of Agriculture
Economic Research Service
Economic Information Bulletin Number 144
September 2015
Abstract
Global biofuel production rose tremendously over 2001-13, led largely by rapid growth in the United States and the European Union (EU). Brazil, the second largest biofuel producer, doubled its production in that span. A favorable business and policy climate from 2001 to 2010 helped fuel the large increase in biofuel production. After 2011, U.S. consumption of biofuels was slowed by falling prices of traditional transportation fuels, a decrease in biofuel feedstock prices, and logistical and infrastructure challenges. The dropoff in U.S. biofuel use and an increase in biofuel demand from the EU and Brazil led to the United States becoming a net exporter of biofuels for the first time in 2010. In addition to the United States exporting ethanol, it concurrently imports ethanol to meet mandates for biofuels. With the EU imposing countervailing duties, recent U.S. biofuel exports have gone to Canada and other countries. U.S. ethanol production and exports both remained strong in the face of falling gasoline prices in 2014. However, continuation of a strong export market is contingent on plant capacity and biofuel policies.
Keywords: biodiesel, biofuels, Brazil, ethanol, EU, European Union, policy, trade, U.S., United States
Acknowledgments
Jim Duffield, USDA, Office of the Chief Economist, Office of Energy Policy and New Uses; Joseph Cooper, USDA, Economic Research Service (ERS); Scott Irwin, University of Illinois; and two anonymous peer reviewers provided valuable comments and sugges-tions. The author also thanks John Weber and Lori A. Fields of USDA/ERS for editorial and design services.
Jayson Beckman
Biofuel Use in International Markets: The Importance of Trade

ii Biofuel Use in International Markets: The Importance of Trade, EIB-144
Economic Research Service/USDA
Contents
Introduction . . . . . . . . . . . . . . . . . . . . . . . . . . . . . . . . . . . . . . . . . . . . . . . . . . . . . . . . . 1
Background . . . . . . . . . . . . . . . . . . . . . . . . . . . . . . . . . . . . . . . . . . . . . . . . . . . . . . . . . 3
Global Biofuel Trade . . . . . . . . . . . . . . . . . . . . . . . . . . . . . . . . . . . . . . . . . . . . . . . . . 7
Prospects for U .S . Biofuel Trade Going Forward . . . . . . . . . . . . . . . . . . . . . . . . . 22
Conclusions . . . . . . . . . . . . . . . . . . . . . . . . . . . . . . . . . . . . . . . . . . . . . . . . . . . . . . . . 26
References . . . . . . . . . . . . . . . . . . . . . . . . . . . . . . . . . . . . . . . . . . . . . . . . . . . . . . . . . 27
Appendix 1: Government Policy . . . . . . . . . . . . . . . . . . . . . . . . . . . . . . . . . . . . . . . 31

United States Department of Agriculture
A report summary from the Economic Research Service
ERS is a primary source of economic research and
analysis from the U.S. Department of Agriculture, providing timely informa-
tion on economic and policy issues related to agriculture, food, the environment, and
rural America. www.ers.usda.gov
Economic Research Service
Economic Information Bulletin Number 144
September 2015
United States Department of Agriculture
Biofuel Use in International Markets: The Importance of Trade
Jayson Beckman
September 2015
Find the full report at www.ers.usda.gov/
publications/eib-economic-information-
bulletin/eib144
Jayson Beckman
Biofuel Use in International Markets: The Importance of Trade
What Is the Issue?
Between 2001 and 2013, global biofuel production grew rapidly, driven by a combination of rising gasoline prices, falling prices of biofuel inputs, and policies mandating use of renewable fuels. The same factors that led to production increases also led to the expansion of global trade in biofuels. Among countries that produce biofuels, some have emerged as major exporters, such as the United States and Brazil, and others have found it necessary to import biofuels to help fulfill their renewable fuel mandates, such as the EU. In addition, some countries trade similar products with each other (known as intra-industry trade), while several countries have taken steps to restrict biofuel trade with certain countries. Since 2011, the United States has emerged as the leading ethanol exporter; however, declining gasoline prices in the last quarter of 2014 highlights potential challenges to future exports.
This study provides an overview of the growth of the global biofuels industry, focusing on the favorable market conditions and policies that made growth possible. Biofuel trade is examined in detail, with the goal of helping public and private decisionmakers understand the current state of this important topic. The study examines factors behind intra-industry trade in biofuels (especially ethanol) and also the market fundamentals and policy changes that can affect U.S. biofuels trade going forward.
What Did the Study Find?
Global biofuel production grew rapidly from 2001 to 2013. For the largest producers—the United States, Brazil, and the EU—biofuel production increased 462 percent; however, most of the rapid growth was before 2011. Indeed, production of biofuels can broadly be examined over two phases. In the first phase (pre-2011), biofuel production and consumption rapidly expanded; in the second phase (post-2011), biofuel production continued to grow but at a much slower rate. Moderating prices, along with the saturation of the corn ethanol market in the United States, increased the importance of energy policies as a way to help sustain biofuel production and consumption during this second phase.
The amount of biofuels trade increased substantially during this second phase due to favor-able market conditions and energy policies mandating use of renewable fuels. In particular, the United States and Brazil trade physically similar biofuel products with each other. Several other countries beyond the biggest three producers have experienced rapid growth in biofuel (especially biodiesel) production. Among these countries, Argentina and Indonesia have become major exporters. This increase in total global fuel trade has occurred despite the EU

placing trade barriers post-2011 to biofuel imports from the major biofuel producers (e.g., the United States, Brazil, Argentina). These anti-dumping duties essentially prohibit any imports from those countries.
The ethanol blend wall in the United States and an increase in demand for biofuels from other countries helped the United States emerge as a net exporter of ethanol for the first time in 2010, with net exports positive each year since. Indeed, the United States has become the world’s largest exporter of ethanol. U.S. ethanol produc-tion and exports both remained strong in the face of falling gasoline prices in 2014 due to interactions of supply- and demand-side factors; production capacity beyond domestic policy requirements and strong export markets helped make high exports possible. In addition, U.S. imports of ethanol in 2014 fell to their lowest amounts in years.
Along with market forces, policies can affect future U.S. biofuel trade. If the blending rate in Brazil continues to increase (as it has recently), less Brazilian ethanol will be available to compete with the United States on the global market. At the same time, Brazil could continue to import U.S. ethanol to help meet its mandate. In addition, U.S. biofuel policies could affect the future of U.S. biofuel trade. For example, reducing the amount of ethanol that can be derived from corn in the U.S. renewable fuel mandate could potentially lead to reduc-tion in U.S. ethanol production infrastructure in the long run, which could limit the availability of ethanol for exports. Although in the short run, reducing the mandate could actually increase the amount available for export markets to make use of the already existing infrastructure. Additionally, if the scheduled future increases in the U.S. mandate for advanced biofuel are not met by increased domestic production of advanced biofuels (and are not waived), the increase in the mandate amounts will need to be met with imports, such as sugarcane-based ethanol from Brazil.
How Was the Study Conducted?
This study examines historical trends to characterize biofuel markets in the United States, Brazil, and the EU, which are the major participants in global biofuel production and trade. Because actual changes in the biofuels sector are a result of complex interactions among many policy and market influences, this report was developed to offer an overview of many of these factors, and, as a result, relies on several data sources. ERS data on global commodity prices show changes to biofuel feedstock prices. Biofuel production, consumption, and trade data from the U.S. Energy Information Administration are used to detail the changes to the U.S. biofuel sector. USDA’s Agricultural Baseline Projections provide some insights on possible future paths for biofuel markets. This study also draws heavily from individual country biofuel reports from USDA’s Foreign Agricultural Service.
www.ers.usda.gov
1 Biofuel Use in International Markets: The Importance of Trade, EIB-144
Economic Research Service/USDA
Biofuel Use in International Markets: The Importance of Trade
Introduction
Policies mandating consumption of biofuels,1 along with favorable market factors, have led to a large increase in biofuel production worldwide since 2001 (Beckman et al., 2011). This is especially true for the United States, the European Union (EU), and Brazil, with total biofuel production in these countries increasing 462 percent from 2001 to 2013. As with any agricultural commodity, trade exists to fill gaps between production and consumption. The EU imports biofuels from Central America and Southeast Asia, while leveling trade-distorting charges against the exports of biofuels from the United States and other countries. The United States imports sugar-based ethanol from Brazil, while Brazil imports a physically similar product from the United States. This study exam-ines the growth of the global biofuels industry, especially biofuel trade.2
To fully understand how biofuel trade has developed, it is necessary to first look at the market fundamentals and policy changes that led to the large increases in production. For most coun-tries, the biofuels market can be grouped into two phases: pre-2011, where biofuel production and consumption expanded rapidly; and post-2011, where biofuel production continued to grow but at a slower rate. This is especially true for countries that produce ethanol. For example, annual U.S. biofuel production spiked from 2001 to 2010, increasing from 1.77 billion gallons to just over 13.64 billion gallons. Ethanol production accounted for 13.30 billion gallons of the total in 2010. By 2013, U.S. biofuel production had risen further to just over 14.63 billion gallons, largely driven by an increase in biodiesel production. Some of this growth was driven by market forces, such as the pre-2011 rise in gasoline and diesel prices. Also, prices of inputs to biofuel production (corn, sugar-cane, oilseeds) were relatively low during 2001-10. This, combined with rising prices for gasoline and diesel, contributed to high profits for biofuel producers during the period.
More recently, however, market conditions have changed and policies mandating production or consumption have become increasingly important to sustaining the biofuels market. In addition, the United States is approaching the ethanol “blend wall,” or the maximum percentage of ethanol that can be blended with gasoline and used in conventional vehicles (see box “Blending Biofuels and Flex-Fuel Cars”). This blend wall, and an increase in demand for biofuels from Brazil and the EU, helped the United States emerge as a net exporter of ethanol for the first time in 2010, with exports increasing further from 2011 to 2013.
Brazil is the world’s second-largest biofuel producer and has long been a net exporter of biofuels, particularly ethanol. However, a decline in ethanol production in 2011 and 2012 due to high sugar (Brazil’s ethanol feedstock) prices and lower yields led to historical highs in ethanol imports (FAS, 2011a). Furthermore, the United States and Brazil engage in two-way trade of biofuels, commonly
1Throughout this study, we refer to biofuels as so-called first-generation ethanol (from commonly produced sugars—barley, corn, sugar beets, sugarcane, and wheat) and biodiesel (produced from vegetable oils), unless specifically noted.
2Although many countries have stated or expressed interest in promoting future biofuel use, the United States and the EU have the most aggressive policies and play the largest role in global agricultural markets. Therefore, these two countries are a focus of this study. In addition, Brazil has produced biofuels since 1970 and is also a focus.

2 Biofuel Use in International Markets: The Importance of Trade, EIB-144
Economic Research Service/USDA
known as intra-industry trade. A substantial mandate for renewable transportation fuel has helped the EU emerge as the third-largest producer, consumer, and importer of biofuels in the world. However, EU countries enforce substantial trade restrictions on both the United States and Brazil and instead rely on imports from other countries (e.g., Malaysia, Pakistan, Peru).
The situation for biofuels changed again in 2014, as oil prices declined by more than half. The lower oil prices put pressure especially on U.S. ethanol consumption; however, the market remained strong due to government policies mandating ethanol use, the use of ethanol as an octane enhancer, and a large export market. Ethanol profits in 2014 were actually stronger than in any other year since 2006. Negative profits in the U.S. biodiesel market in 2014 helped lead to a reinstatement of the biodiesel tax credit, which had expired earlier in the year. This study also examines potential factors affecting the future of U.S. biofuel exports, including the trajectory of gasoline prices, mandates including additionally proposed low-carbon fuel standards, and the blend wall.
Blending Biofuels and Flex-Fuel Cars
One constraint to the use of biofuels is the amount that can be blended with traditional trans-portation fuels; hence, flex-fuel cars can be very important to the stability of the biofuel industry. Flex-fuel cars are associated with ethanol use because any diesel engine can use biodiesel entirely or in a blend with diesel (Pacific Biodiesel, 2014). In Brazil, flex-fuel cars can use a fuel product of 100-percent ethanol, 100-percent gasoline, or a blend of both; however, in North America and Europe, flex-fuel vehicles can only run on a blend of ethanol (commonly referred to as E85). This blend is between 51- and 83-percent ethanol. The U.S. Energy Information Administration uses an average of 74 percent for the ethanol percentage.
The United States has the second largest flex-fuel fleet in the world (after Brazil), at a little less than 16 million cars in 2013, or about 7 percent of all U.S. cars (RFA, 2014). However, only 10 percent of these flex-fuel cars use the E85 blend (EIA, 2012). A blend of 10-percent ethanol and 90-percent gasoline is the most common fuel used in U.S. flex-fuel cars. Indeed, less than 1 percent of U.S. ethanol consumption is consumed in the form of E85 (Schnepf, 2011). The U.S. Environmental Protection Agency (EPA) has approved a blend of 15-percent ethanol, 85-percent gasoline for use in vehicles produced after 2000; however, gasoline retailers have been extremely slow to adopt this blend (Wisner, 2012).
One of the main determinants of ethanol consumption is the relative price between gaso-line and ethanol. In Brazil, consumers react to price differentials, generally applying the 70-percent rule when selecting a fuel. That is, ethanol has approximately 70 percent of the energy content of gasoline and provides approximately 70 percent of the mileage. In general, if the price of ethanol is more than 70 percent of the price of gasoline, a Brazilian consumer will select gasoline; if the price is less than 70 percent, the consumer will select ethanol (Fagundes de Almeida and Bomtempo, 2007). In the United States, E85 needs to be priced at least 25 percent lower than gasoline to attract consumers; however, the lack of readily avail-able E85 gas stations and the limited number of flex-fuel cars are also barriers for widespread ethanol use (Wisner, 2012).
In the United States, biodiesel is also often consumed in blends (B2, 2-percent biodiesel; B20, 20), but it can also be consumed solely (as is done more often in the EU). Overall, B20 is the most common biodiesel blend in the United States (DOE-EERE, 2014).

3 Biofuel Use in International Markets: The Importance of Trade, EIB-144
Economic Research Service/USDA
Background
Traditional transportation fuel (gasoline and diesel) prices were relatively stable from 1990 to 2000, before increasing from 2001 to 2013. In particular, gasoline prices rose 65 percent and diesel prices rose 69 percent from January 2001 to December 2010 (fig. 1). While the increases in gasoline and diesel prices boosted demand for biofuels, input prices for biofuels also trended upward, especially from 2001 to 2010 (figs. 2, 3). Still, the increase in gasoline prices was large enough to trigger rapid expansion of ethanol production and consumption (table 1). Over the next several years, however, transportation fuel and biofuel input prices dropped. From January 2011 to December 2013, corn prices declined 36 percent (fig. 2), sugar prices fell 45 percent, and soybean and rapeseed oil prices both fell 34 percent (fig. 3). Although prices for biofuel inputs decreased, profits for ethanol producers were 0 or negative for 15 of the 36 months in the period (Hofstrand, 2015).
The negative returns to producers after 2010 contributed to a slowdown in global biofuel production growth (tables 1 and 2). For example, ethanol production grew 378 percent from 2001 to 2013 but only 1 percent after 2010. Similarly, biodiesel production grew 2,100 percent from 2001 to 2013 but just 30 percent after 2010 (table 2).
A drought in 2012, the removal of the ethanol tax credit, and less favorable export markets contrib-uted to the slowdown in ethanol production in the United States after 2010 (EIA, 2012). The ethanol blend wall, in particular, has also begun to limit growth and could further affect future U.S. produc-tion (DeDecker, 2014). Of all countries consuming ethanol blends, the United States most closely abuts the blend wall.3 Furthermore, the Renewable Fuel Standard (RFS) mandates (app. 1) were
3Wisner (2012) notes that the Canadian ethanol market is also approaching a blend wall. EU blends of ethanol cur-rently are below 5 percent, so a blend wall is unlikely to be a problem in the EU for some time.
Figure 1
U.S. retail price of gasoline (regular grade) and diesel (on-highway), (1982-1984 = 1)
Source: USDA, Economic Research Service using data from U.S. Energy Information Administration, Petroleum and Other Liquids database.
Dollars per gallon
0
2001 2002 2003 2004 2005 2006 2007 2008 2009 2010 2011 2012 2013
1
2
3
4
5
6
Gasoline Diesel

4 Biofuel Use in International Markets: The Importance of Trade, EIB-144
Economic Research Service/USDA
Figure 2
Real prices of corn (no. 2 yellow, Central Illinois) and sugar (ICE Contract 11 nearby futures price)
ICE = Intercontinental Exchange.Source: USDA, Economic Research Service using data from World Bank, GEM Commodities database.
Dollars (real) per metric ton
0
100
200
300
400
500
600
700
2001 2002 2003 2004 2005 2006 2007 2008 2009 2010 2011 2012 2013
Corn Sugar
Figure 3
Real prices of soybean oil (first future contract) and rapeseed oil (FOB Rotterdam)
FOB = Free on board.Source: USDA, Economic Research Service using data from World Bank, GEM Commodities database.
Dollars (real) per metric ton
0
200
400
600
800
1,000
1,200
1,400
1,600
2001 2002 2003 2004 2005 2006 2007 2008 2009 2010 2011 2012 2013
Soybean Rapeseed

5 Biofuel Use in International Markets: The Importance of Trade, EIB-144
Economic Research Service/USDA
set at a time when gasoline consumption was expected to continue increasing. Wisner (2013) notes that U.S. gasoline consumption was expected to reach 150 billion gallons per year; however, the RFS was passed in the peak year (2005) of gasoline consumption (Tyner, 2013). Since then, U.S. consumption has declined from 142 billion gallons in 2005 to 134 billion gallons in 2013.
Brazilian ethanol production and consumption decreased in 2011-12, compared with 2010; however, production and consumption recovered in 2013. The drop in production in 2011 and 2012 (see table 1) stemmed partly from rising sugar prices (see fig. 2) and weather-related reductions in sugarcane yields (EIA, 2012). Policies mandating consumption became increasingly important to the industry in 2010 through 2012, as the mandatory blending amount was decreased from 25 to 20 percent (see app. 1). Sugar prices fell in 2013 (see fig. 2), leading to a rebound in Brazilian ethanol production (see table 1).
For the EU, growth in ethanol production after 2010 slowed because of falling profits (a combi-nation of lower ethanol prices and rising feedstock costs), reduced total fuel consumption, and a reduction in mandates (app. 1, table 1) (FAS, 2013d). However, the EU blending rate for ethanol continues to grow, reaching 5 percent in 2013 (FAS, 2013d).
Table 1
Ethanol production and consumption in selected countries
Production Consumption
U.S. Brazil EU U.S. Brazil EU
Billion gallons
2001 1.765 2.603 0.053 1.741 2.083 0.057
2002 2.140 2.616 0.067 2.073 2.093 0.072
2003 2.804 2.764 0.093 2.826 2.211 0.100
2004 3.404 3.084 0.093 3.552 2.467 0.100
2005 3.904 3.577 0.133 4.059 2.862 0.143
2006 4.884 4.167 0.425 5.481 3.354 0.456
2007 6.521 5.174 0.476 6.886 4.280 0.627
2008 9.309 6.230 0.744 9.683 5.174 0.927
2009 10.938 5.865 0.939 11.037 6.029 1.216
2010 13.298 6.476 1.127 12.858 5.855 1.388
2011 13.929 5.339 1.160 12.893 5.096 1.455
2012 13.218 5.479 1.220 12.882 4.911 1.488
2013 13.312 6.440 1.371 13.205 5.686 1.489
Source: USDA, Economic Research Service using data from U.S. Energy Information Administration (U.S. data) and USDA, Foreign Agricultural Service, various Global Agriculture Information Network reports (Brazil and EU data).

6 Biofuel Use in International Markets: The Importance of Trade, EIB-144
Economic Research Service/USDA
Global biodiesel growth from 2001 to 2013 was much slower than that for ethanol, especially for the United States and Brazil (see table 2). However, positive biodiesel profits from higher soybean oil prices in 2011 (see fig. 3) led to an increase in U.S. biodiesel production of 182 percent in 2011 and continued increases in 2012 and 2013. By 2013, soybean oil prices had fallen, the biodiesel tax credit was still in effect, and the mandated amount was increased, leading to the largest U.S. biodiesel profits since 2011 (Wisner, 2014). Biodiesel, however, accounted for only 9 percent of total U.S. biofuel consumption in 2013, though the share was up from 2 percent in 2010.
Brazilian biodiesel production and consumption continues to be lower than that for ethanol. Although biodiesel consumption in Brazil is also mandated, the mandate for 2014 is 7 percent, which is lower than the ethanol mandate (FAS, 2014a). Growth in biodiesel production also slowed in the EU after 2011, though it remains the world’s largest producer. Declining production capacity due to negative profits and rising imports of biodiesel contributed to the decline in EU biodiesel production (FAS, 2013d), whereas consumption of biodiesel in the EU is almost entirely driven by government mandates.
Table 2
Biodiesel production and consumption in selected countries
Production Consumption
U.S. Brazil EU U.S. Brazil EU
Billion gallons
2001 0.009 0.000 0.213 0.010 0.000 0.225
2002 0.010 0.000 0.253 0.016 0.000 0.267
2003 0.014 0.000 0.380 0.014 0.000 0.400
2004 0.028 0.000 0.507 0.027 0.000 0.534
2005 0.091 0.000 0.919 0.091 0.000 0.968
2006 0.250 0.018 1.429 0.261 0.018 1.448
2007 0.490 0.107 1.762 0.354 0.095 2.042
2008 0.678 0.308 2.523 0.304 0.297 2.747
2009 0.516 0.425 2.605 0.322 0.413 3.241
2010 0.343 0.630 2.829 0.260 0.650 3.506
2011 0.967 0.706 2.916 0.886 0.690 3.717
2012 0.991 0.718 2.767 0.895 0.738 3.537
2013 1.314 0.771 2.877 1.302 0.766 3.228
Source: USDA, Economic Research Service using data from U.S. Energy Information Administration (U.S. data) and USDA, Foreign Agricultural Service, various Global Agriculture Information Network reports (Brazil and EU data).

7 Biofuel Use in International Markets: The Importance of Trade, EIB-144
Economic Research Service/USDA
Global Biofuel Trade
As with any agricultural commodity, trade markets are used to fill the gap between biofuel consumption and production. Several countries are major exporters, such as Brazil and the United States; others countries import to fulfill their domestic mandates, such as the EU. The United States exports corn-based ethanol and imports sugarcane-based ethanol from Brazil. Although the ethanol products are chemically similar, they are not legally similar. Under the U.S. biofuel mandate, sugarcane-based ethanol qualifies under “other advanced biofuels,” and, thus, it is imported to fulfill the mandate even when domestic production of total ethanol is greater than consumption. Because of differences in the makeup of the fuel fleet (diesel versus gasoline consumption) and compara-tive advantages in biodiesel and ethanol production, trade in biofuels can be split into ethanol and biodiesel components. In addition to these biofuels, a trade market is growing for wood pellets. The United States is a leading exporter of wood pellets (see box “Wood Pellets for Trade”).
Ethanol
The United States has been the world’s largest producer of ethanol since 2006; and since 2004, the United States has been the world’s largest consumer of ethanol, partly relying on imports to meet demand. U.S. trade in ethanol can be split into pre- and post-2011 phases. That is, the United States was a net importer until 2010, when it exported 200 million more gallons than it imported (fig. 4). In 2011, the United States became a large exporter of ethanol. The particularly high level of U.S. exports in 2011 is attributed to a decrease in Brazilian ethanol exports (Yano et al., 2013). In addition, the prospect of the blend wall led to U.S. exports as an outlet for record production (EIA, 2012).
The United States has been the world’s largest exporter of ethanol for fuel since 2011. Exports accounted for 8.6 percent of total U.S. ethanol production in 2011, the largest share during 2001-13 (fig. 5). Although U.S. ethanol production exceeded domestic consumption in every year after 2009 (see table 1), the United States still imported ethanol during the period to help meet the mandates (Tyner, 2013; Yano et al., 2013).
Wood Pellets for Trade
The production, consumption, and trade of wood pellets increased substantially during 2001-13. In particular, the EU emerged as a major importer of wood pellets, largely from the United States. As noted in EC (2013), wood pellets are the most economical way to convert biomass materials to fuel to help meet the total Renewable Energy Directive (see app. 1). Although the EU is the world’s largest producer of wood pellets, imports are still needed to meet domestic demand. In 2012, the EU imported about 4.5 million metric tons of wood pellets, of which 39 percent came from the United States (FAS, 2013d). Canada (30 percent) and Russia (14 percent) were the next largest suppliers to the EU. For the United States, 98 percent of total wood pellet exports go to the EU. In 2013, U.S. wood pellet exports to the EU doubled to 2.9 million metric tons (EIA, 2014a).

8 Biofuel Use in International Markets: The Importance of Trade, EIB-144
Economic Research Service/USDA
Figure 4
U.S. ethanol exports and imports
Source: USDA, Economic Research Service using data from U.S. Energy Information Administration, Petroleum and Other Liquids database (2014).
Billion gallons
2001 2002 2003 2004 2005 2006 2007 2008 2009 2010 2011 2012 2013
0
0.2
0.4
0.6
0.8
1.0
1.2
1.4
Exports Imports
Figure 5
U.S. ethanol imports, consumption, exports, and production
Source: USDA, Economic Research Service using data from U.S. Energy Information Administration, Petroleum and Other Liquids database (2014).
Billion gallons
0
2
4
6
8
10
12
14
16ImportsConsumptionExportsProduction
2007 2008 2009 2010 2011 2012 20132005 20062004200320022001

9 Biofuel Use in International Markets: The Importance of Trade, EIB-144
Economic Research Service/USDA
U.S. ethanol imports during the period mostly came from Brazil and the Caribbean Basin (table 3). In 2010, ethanol prices in Brazil ($2.85 per gallon) exceeded those in the United States ($1.93 per gallon), and Canada replaced Brazil as the leading source of U.S. ethanol imports.4 But Canadian ethanol is largely produced from corn and wheat, and because corn is restricted as an advanced biofuels feedstock, Canadian exports to the United States are largely limited (FAS, 2013c). Exports from the Caribbean Basin to the United States originate from Brazil and enter the United States tariff-free; hence, the region’s share of exports to the United States has fallen significantly since the U.S. tariff on Brazilian ethanol was removed in 2012 (Shah et al., 2012).
In 2010, the first year of ethanol exports from the United States, the EU accounted for almost 56 percent of total U.S. exports (see table 3). The EU remained one of the top importers of U.S. ethanol until 2013, when it imposed antidumping and countervailing duties on imports from the United States (FAS, 2013d). These duties are in place for 5 years and are in addition to the tariffs already in place (see app. 1). Brazil imported a large amount of U.S. ethanol in 2011; however, Brazilian ethanol production recovered in 2013, and the need for imports fell. Canada has been a consistent importer of U.S. ethanol and accounted for the largest shares of total U.S. ethanol exports in 2012 and 2013.
Although Brazil has historically been an ethanol net exporter (and the world’s largest), the rise in sugar prices and growing demand for domestic ethanol consumption led to lower ethanol exports in 2009 and 2010 (Wisner, 2012). Although the Brazilian Government previously instituted a tariff on ethanol imports, this tariff was removed in 2010 (temporarily until December 31, 2015), leading to the country’s first imports of ethanol (fig. 6). As in the United States, the biofuel market in Brazil
4Brazilian ethanol prices are from FAS (2011a), and U.S. prices are the Nebraska rack price available at: www.neo.ne.gov/statshtml/66.html. Although Brazilian ethanol faced a $0.54 per gallon tariff in 2010, it is possible that U.S. blend-ers imported Brazilian ethanol through the Caribbean Initiative to avoid the tariff. We have excluded the import tariff from our calculations.
Table 3
U.S. ethanol imports and exports by country
Imports 2004 2005 2006 2007 2008 2009 2010 2011 2012 2013
Percent of total
Brazil 57.93 25.42 61.94 42.09 38.34 2.65 0 46.00 81.81 78.99
Canada 4.18 2.38 1.13 1.71 0.95 5.66 84.18 1.50 0.82 1.77
Caribbean Basin
37.89 72.20 31.15 55.21 60.48 91.69 15.82 52.50 16.00 15.31
Others 0 0 5.78 0.99 0.23 0 0 0 1.37 3.94
Exports 2004 2005 2006 2007 2008 2009 2010 2011 2012 2013
Percent of total
Brazil 0 0 0 0 0 0 5.68 33.10 11.59 7.58
Canada 0 0 0 0 0 0 29.96 24.90 41.92 52.33
EU 0 0 0 0 0 0 55.51 24.35 22.65 4.21
Others 0 0 0 0 0 0 8.84 17.65 23.84 35.87
Note: Caribbean Basin countries include Costa Rica, El Salvador, Guatemala, Jamaica, Trinidad and Tobago, and the Virgin Islands.
Source: USDA, Economic Research Service using data from U.S. Energy Information Administration, Petroleum and Other Liquids database (2014).

10 Biofuel Use in International Markets: The Importance of Trade, EIB-144
Economic Research Service/USDA
underwent changes in 2011 when Brazil started to import much more ethanol than in previous years. In fact, Brazil became a net importer (although at a very small amount) of ethanol used for fuel for the first time. Exports of ethanol recovered in 2012 and 2013, although Brazil continued to import ethanol. For Brazil, 2010 was the year the ethanol share of imports in total domestic use (production plus imports) was highest (5.16 percent) (fig. 7).
Since Brazil started importing ethanol, the United States has been its largest supplier (table 4). The EU was the next largest supplier, but its ethanol exports to Brazil were small in all years but 2011. The United States has been one of the largest destinations for Brazilian ethanol exports, especially in 2011-13 (table 4). Other major destinations for U.S. ethanol exports include the Caribbean Basin (likely due to the lack of a tariff, as explained in the U.S. trade discussion) and the EU.
The EU consumes more ethanol than it produces (fig. 8). Historically, the EU imported ethanol mainly from Brazil. However, the United States accounted for the majority of EU ethanol imports in 2011 (FAS, 2013d). These U.S. exports were destined mainly for Belgium, the Netherlands, Luxembourg, the United Kingdom, Sweden, and Finland. For the EU, the import share is larger than that for the United States or Brazil, with a peak of 35.68 in 2007 (fig. 9).
The EU began imposing an antidumping duty on U.S. ethanol in 2013, claiming that the United States was able to supply EU markets at prices lower than those for EU producers (FAS, 2013d). These duties are expected to end ethanol exports from the United States to the EU; as a result, the EU has designed preferential trade agreements with Guatemala, Peru, and Pakistan to help fill the gap in ethanol imports. Seventy percent of EU ethanol imports in 2013 were expected to come from these three countries, with Brazil expected to account for the rest (FAS, 2013d). Due to the variety and magnitude of EU tariffs on biofuel, the region is becoming an isolated market (FAS, 2013d).
Figure 6
Brazil ethanol imports and exports
Note: Data before 2006 did not include ethanol for fuel use only; thus, they were not included.Source: USDA, Economic Research Service using data from FAS (2014a).
Million gallons
Exports Imports
0
100
200
300
400
500
600
700
800
900
2006 2007 2008 2009 2010 2011 2012 2013

11 Biofuel Use in International Markets: The Importance of Trade, EIB-144
Economic Research Service/USDA
Table 4
Brazil ethanol imports and exports by country
Imports 2009 2010 2011 2012 2013
Percent of total
EU 0 0.08 5.31 0.02 0.10
United States 0 97.97 94.61 99.86 99.63
Others 0 1.95 0.07 0.12 0.28
Exports 2009 2010 2011 2012 2013
Percent of total
Caribbean Basin 20.69 3.97 14.03 14.43 10.53
EU 25.21 12.47 4.90 2.97 2.86
United States 8.17 8.77 34.38 66.77 65.05
Others 45.93 74.79 46.69 15.83 21.55
Note: FAS (2014a) does not report fuel ethanol trade by destination; rather, only total ethanol trade is given.
Source: USDA, Economic Research Service using data from FAS (2014a).
Figure 7
Brazil ethanol imports, consumption, exports, and production
Source: USDA, Economic Research Service using data from FAS (2013b).
Billion gallons
Imports
Consumption
Exports
Production
0
2
4
6
8
10
20072006 2008 2009 2010 2011 2012 2013

12 Biofuel Use in International Markets: The Importance of Trade, EIB-144
Economic Research Service/USDA
Figure 8
European Union ethanol trade
Source: USDA, Economic Research Service using data from FAS (2014b).
Million gallons
Exports Imports
0
50
100
150
200
250
300
350
400
2006 2007 2008 2009 2010 2011 2012 2013
Figure 9
European Union ethanol imports, consumption, exports, and production
Source: USDA, Economic Research Service using data from FAS (2014b).
Billion gallons
Imports
Consumption
Exports
Production
0
0.4
0.8
1.2
1.6
2.0
20072006 2008 2009 2010 2011 2012 2013

13 Biofuel Use in International Markets: The Importance of Trade, EIB-144
Economic Research Service/USDA
Table 5 presents global ethanol trade by partner. The United States and Brazil trade large amounts of ethanol with each other (known as intra-industry trade, discussed later). In addition, intra-industry trade also occurs between the United States and the EU and Brazil and the EU. However, these
amounts are much smaller than that for the United States and Brazil.
Biodiesel
U.S. trade in biodiesel was small before 2007. From 2007 to 2012, and continuing to 2012, the United States was a net exporter of biodiesel (fig. 10). According to EIA (2009), much of the increase in U.S. production in 2007 and 2008 was not consumed within the United States but was exported because of incentives provided by the biodiesel tax credit (see table 2). In a process known as “splash and dash,” biodiesel—including imported biodiesel—was blended with a small amount of diesel to qualify for the tax credit and then exported to the EU, where it would often receive addi-tional subsidies. Splash and dash ended in 2009 when the U.S. Emergency Economic Stabilization Act of 2008 made the reshipment of imported biodiesel illegal, and the World Trade Organization (WTO) ruled that these exports were unfair to the EU. The United States became a net importer of biodiesel in 2013, likely due to the RFS (app. 1).
The United States imported and exported biodiesel every month from 2001 to 2013 (EIA, 2012). In 2013, U.S. biodiesel imports hit a record high, and Argentina supplied the largest share. In other years, Canada was a primary import and export market for U.S. biodiesel (table 6). The United States exported large amounts of biodiesel to other countries during the latter part of the period, but the leading destination in this category varied year to year: India in 2011 (18 percent of all U.S. biodiesel exports); Norway in 2012 (20 percent); and Malaysia in 2013 (17 percent). For the United States, trade played a bigger role for biodiesel than it did for ethanol (fig. 11).
In the nesting of categories for the U.S. RFS mandate (app. 1), diesel produced from other renew-able sources but not co-processed with petroleum qualifies as an advanced biofuel. Production of these products in the United States remains low; however, U.S. imports totaled 25 million gallons in 2012 and almost 210 million gallons in 2013 (EIA, 2014b). Combining conventional biodiesel (fig. 10) with other renewable diesel, “other” renewable diesel accounted for 40 percent of U.S. biodiesel imports in 2013. U.S. import sources included Singapore (78 percent of the U.S. total), Finland (17 percent), and Aruba (3 percent). Canada also exported a small amount of other renewable diesel to the United States in 2013 (EIA, 2014).
Table 5
Ethanol trade by partner, 2011-13 average
To:
U.S. Brazil EU ROW
Million gallons
From
:
U.S. 0 176.22 161.71 514.84
Brazil 275.65 0 37.47 248.95
EU 1.36 3.25 0 18.9
ROW 70.66 8.14 30.82 NA
Note: NA is not available. Rest of the world (ROW) trade beyond that to the United States, Brazil, and the EU is small. The major ROW ethanol-producing countries (e.g., Caribbean Basin, Canada) either export substantially to the main three regions (i.e., United States, EU, and Brazil) or they consume their production domestically (e.g., China, India). Exporters are the rows; importers are the columns.
Source: USDA, Economic Research Service, author calculations.

14 Biofuel Use in International Markets: The Importance of Trade, EIB-144
Economic Research Service/USDA
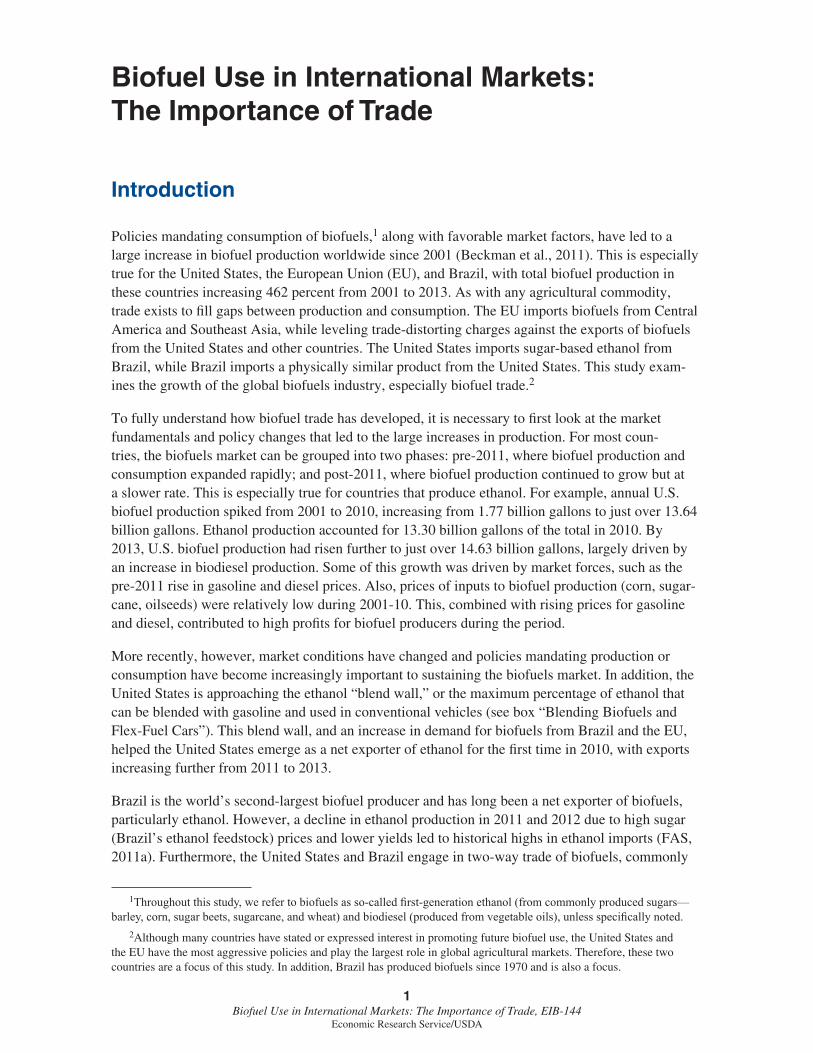
Brazil has traditionally been a net importer of biodiesel (fig. 12). The main sources of Brazil’s biodiesel imports have been the EU, the United States, and Mexico (table 7). Argentina has been the largest destination for Brazil’s biodiesel exports. Other export markets for Brazil include Singapore, China, Chile, and Uruguay. Overall, the amount of biodiesel traded in Brazil is much smaller than the amount produced (less than 12 million gallons per year are traded). Brazil did not import or export biodiesel in 2012 and only exported in 2013 (FAS, 2014a). All 2013 biodiesel exports were to the EU. For Brazil, trade in biodiesel was small (fig. 13).
Table 6
U.S. biodiesel imports and exports by country
Imports 2009 2010 2011 2012 2013
Percent of total
Argentina 21.43 0 0 0 39.06
Canada 78.57 100 53.10 49.71 10.07
EU 0 0 25.41 12.90 24.64
Others 0 0 21.49 37.40 26.24
Exports 2009 2010 2011 2012 2013
Percent of total
Canada 0 0 2.57 55.86 43.27
EU 0 0 46.91 3.96 15.23
Others 0 0 50.51 40.18 41.50
Source: USDA, Economic Research Service using data from U.S. Energy Information Administration, Petroleum and Other Liquids database (2014).
Figure 10
U.S. biodiesel exports and imports
Source: USDA, Economic Research Service using data from U.S. Energy Information Administration, Petroleum and Other Liquids database (2014).
Million gallons
Exports Imports
0
100
200
300
400
500
600
700
800
2001 2002 2003 2004 2005 2006 2007 2008 2009 2010 2011 2012 2013

15 Biofuel Use in International Markets: The Importance of Trade, EIB-144
Economic Research Service/USDA
Figure 11
U.S. biodiesel imports, consumption, exports, and production
Source: USDA, Economic Research Service using data from U.S. Energy Information Administration, Petroleum and Other Liquids database (2014).
Billion gallons
ImportsConsumptionExportsProduction
0
0.2
0.4
0.6
0.8
1.0
1.2
1.4
1.6
1.8
2007 2008 2009 2010 2011 2012 20132005 20062004200320022001
Figure 12
Brazil biodiesel imports and exports
Source: USDA, Economic Research Service using data from FAS (2014a).
Million gallons
Exports Imports
0
3
6
9
12
15
2006 2007 2008 2009 2010 2011 2012 2013
16 Biofuel Use in International Markets: The Importance of Trade, EIB-144
Economic Research Service/USDA
Table 7 Brazil biodiesel imports and exports by country
Imports 2009 2010 2011 2012 2013
Percent of total
EU 36.05 42.40 44.20 0 0
Mexico 25.11 21.61 8.76 0 0
U.S. 33.84 26.05 27.07 0 0
Others 5.00 9.94 19.97 0 0
Exports 2009 2010 2011 2012 2013
Percent of total
Argentina 62.71 79.16 63.57 0 0
Singapore 3.33 4.62 8.98 0 0
Others 33.96 16.23 27.45 0 100.00
Note: Brazil did not import or export biodiesel in 2012.Source: USDA, Economic Research Service using data from FAS (2014a).
Figure 13
Brazil biodiesel imports, consumption, exports, and production
Source: USDA, Economic Research Service using data from FAS (2014a).
Million gallons
Imports
Consumption
Exports
Production
0
200
400
600
800
1,000
2006 2007 2008 2009 2010 2011 2012 2013

17 Biofuel Use in International Markets: The Importance of Trade, EIB-144
Economic Research Service/USDA
Despite being the world’s largest biodiesel producer, the EU imports large amounts of biodiesel to help meet its mandate (fig. 14). Historically, the United States was the largest exporter of biodiesel to the EU. However, the EU levied antisubsidy and antidumping duties (in addition to tariffs) on imports of U.S. biodiesel (blends of 20 percent and above) in 2009, and as discussed earlier, U.S. blenders lost the ability to receive tax credits on re-exported biodiesel. In May 2011, the EU extended the duties to all U.S. biodiesel regardless of blend ratio, which dramatically reduced EU biodiesel imports from the United States (FAS, 2013d). In May 2013, the European Commission instituted antidumping duties on Argentina and Indonesia to further curb biodiesel imports. These measures will likely present opportunities for other biodiesel exporters, such as Brazil and Malaysia (FAS, 2013d). Similar to ethanol, trade was an important part of the EU biodiesel market (fig. 15). The share of imports in total domestic use; however, was highest from 2011 to 2013, peaking at 24.96 percent in 2012.
In addition to the United States, Brazil, and the EU, other countries trade large amounts of biofuels, especially biodiesel (noting that Brazil trades little biodiesel). Argentina, for example, continues to produce much more biodiesel than it consumes and has become a major exporter (fig. 16). Argentina has one of the world’s largest and most efficient vegetable oil crushing industries (using soybeans) and uses 20-25 percent of its soybean crop to produce biodiesel (FAS, 2013a).
Argentina’s main export market for biodiesel exports, the EU, recently instituted antidumping duties on Argentina biodiesel and is considering revoking a preferential trade benefit given to developing countries, including Argentina (FAS, 2013a). If Argentina biodiesel is approved as an advanced biofuel, the United States would be a potential new destination for Argentinian biodiesel (FAS, 2013a).
Figure 14
European Union biodiesel trade
Source: USDA, Economic Research Service using data from FAS (2014b).
Billion gallons
Exports Imports
0
0.1
0.2
0.3
0.4
0.5
0.6
0.7
0.8
0.9
1.0
2006 2007 2008 2009 2010 2011 2012 2013

18 Biofuel Use in International Markets: The Importance of Trade, EIB-144
Economic Research Service/USDA
Figure 15
European Union biodiesel imports, consumption, exports, and production
Source: USDA, Economic Research Service using data from FAS (2014b).
Billion gallons
ImportsConsumptionExportsProduction
0.5
0
1.0
1.5
2.0
2.5
3.0
3.5
4.0
2006 2007 2008 2009 2010 2011 2012 2013
Figure 16
Argentina biodiesel production and exports
Note: There are no data on Argentina’s imports of biodiesel. Source: USDA, Economic Research Service using data from FAS (2013a).
Million gallons
Consumption
ExportsProduction
0
100
200
300
400
500
600
700
800
2006 2007 2008 2009 2010 2011 2012 2013

19 Biofuel Use in International Markets: The Importance of Trade, EIB-144
Economic Research Service/USDA
Indonesia also exports a large share of its production (55 percent in 2013, fig. 17), with the EU accounting for 88 percent of total shipments in 2012 (FAS, 2013e). In 2011, Indonesia accounted for 39 percent of total EU biodiesel imports; however, this share could decrease since the EU imple-mented antidumping duties on Indonesia as well.
Table 8 presents global biodiesel trade by partner. As illustrated, biodiesel trade is about half of that for ethanol. That is, ethanol trade averaged 1.5 billion gallons between 2011 and 2013, while biodiesel averaged 936 million gallons. Intra-industry trade of biodiesel receives much less attention than trade of ethanol; however, table 8 indicates that there is intra-industry trade, especially between the United States and the EU. However, antidumping duties implemented on the United States by the EU limit any future intra-industry trade in biodiesel.
Table 8
Biodiesel trade by partner, 2011-13 average
To:
U.S. Brazil EU ROW
Million gallons
From
:
U.S. 0 0.43 22.72 107.21
Brazil 0 0 0 0.53
EU 29.12 0.70 0 5.84
ROW 94.56 0.46 674.69 NA
Note: NA is not available. Rest of the world (ROW) trade beyond that to the United States, Brazil, and the EU is small beyond Indonesian exports to other Asian countries. This amount averaged 83.65 million gallons between 2011 and 2013. Exporters are the rows; importers are the columns.
Source: USDA, Economic Research Service, author calculations.
Figure 17
Indonesia biodiesel production and exports
Note: There are no data on Indonesia’s imports of biodiesel.Source: USDA, Economic Research Service using data from FAS (2013e).
Million gallons
Consumption
ExportsProduction
0
100
200
300
400
500
600
700
2006 2007 2008 2009 2010 2011 2012 2013

20 Biofuel Use in International Markets: The Importance of Trade, EIB-144
Economic Research Service/USDA
Intra-Industry Trade
International biofuel trade arises from favorable market conditions or as a result of government poli-cies. The United States and Brazil trade physically similar biofuel products with each other. This intra-industry trade occurs because of the confluence of market conditions and government policies.
The United States has traditionally been a net importer of ethanol (see fig. 4) and did not export ethanol until 2010, when U.S. ethanol became competitive due to higher Brazilian ethanol prices and lower U.S. production costs (Yano et al., 2013). Despite being an exporter, the United States still needed to import ethanol to meet the RFS mandates (Yano et al., 2013). Brazil’s ethanol production dropped in 2011 (see table 1), but it was still profitable to export to the United States in 2011 and 2012. Brazil then bought U.S. corn-based ethanol to make up for its own domestic short-fall (Thomson Reuters Foundation, 2013). Trade in ethanol between the United States and Brazil continued into 2013 (see tables 3 and 4).
The literature examines several factors that may drive intra-industry trade (see box “Intra-Industry Trade”); however, Meyer et al. (2013) attribute intra-industry trade in biofuels between Brazil and the United States to policy-induced attributes of ethanol. That is, although first-gener-ation ethanol produced from corn and sugar serves the same function in blending on an ethanol-equivalent basis, the RFS created a mandate for ethanol that leads to product differentiation. Thus, blenders must look to ethanol generated from other processes (which are not done in the United States) to meet their minimum blending obligations (EPA, 2012). This differentiation in ethanol has forced U.S. blenders to often accept higher world prices for sugarcane ethanol in an attempt to comply with the RFS.
Yeh et al. (2013) also examine intra-industry trade in ethanol (they label it as “fuel shuffling”), citing several market-based causes. In addition, they note that weather (e.g., the U.S. drought in 2012 and the lackluster Brazilian sugar harvest caused by insufficient rainfall in 2011) can be a contributing factor in intra-industry trade in biofuels. Their observations from recent market trends are that favorable profits and the blend wall helped drive the increase in U.S. ethanol exports.
The choice by the United States to produce (or import) biodiesel rather than import ethanol from sugar producers such as Brazil is notable since both products qualify as advanced biofuels under the RFS mandate (see app. 1). Irwin and Good (2012, 2013) compare the U.S. biodiesel blending margin to the Brazilian blending margin. The 2012 study was motivated by the increase in U.S. ethanol imports from Brazil and finds that Brazilian biodiesel was almost twice as expensive as Brazilian ethanol, which was partially due to the expiration of the biodiesel tax credit. The updated
Intra-Industry Trade
Intra-industry trade often occurs when products traded between countries are similar but not identical (e.g., cars produced in the United States but sold in the European Union (EU), and vice versa). Consumers that purchase these products may prefer a different brand than that produced domestically. For products that are undifferentiated, Meyer et al. (2013) cite some common causes of intra-industry trade. For one, countries (e.g., the United States and Canada) may find it more practical or less expensive to trade across borders than to ship a product across the country. Seasonality, where differences in climate between the Northern and Southern Hemispheres affect growing periods, also drives intra-industry trade.

21 Biofuel Use in International Markets: The Importance of Trade, EIB-144
Economic Research Service/USDA
study (2013) accounts for the reinstatement of the tax credit and the increase in biodiesel prices for 2013. It finds that both biodiesel and Brazilian ethanol generate negative returns; thus, neither would be blended without the mandate. Irwin and Good note that, despite the negative returns, Brazilian ethanol imports have been more favorable for blending since 2012 than domestically produced biodiesel. This has led to continuation of ethanol imports (see fig. 4), although the U.S. blend wall has become a greater constraint to ethanol consumption.
Lastly, some findings suggest that intra-industry trade may lead to increased greenhouse gas emissions from shipping the products (Meyer et al., 2013). This effect would be opposite the stated goal of differentiating biofuels, which is to allow for lower greenhouse gas emissions from specific processes.

22 Biofuel Use in International Markets: The Importance of Trade, EIB-144
Economic Research Service/USDA
Prospects for U.S. Biofuel Trade Going Forward
The most recent year for which detailed data are available (2014) showed that both market forces and government policies can influence trade in the U.S. biofuels industry. On the market side, the rapid decline in oil prices in the last quarter of 2014 has implications for the U.S. biofuel market. Oil prices were $115 per barrel in June 2014 and less than $50 per barrel by January 2015, a decline of 57 percent. This decline was particularly pronounced in the last quarter of 2014, as prices dropped almost 50 percent from September to December. Lower gasoline prices affect domestic demand for biofuels, with the relationship depending on a variety of factors, some with opposing effects on the ethanol market (see box “Domestic Biofuel Use”); however, monthly data suggest that U.S. ethanol production was fairly uniform in 2014 (fig. 18) but higher than that in 2013 (Marshall et al., 2015). Lower gasoline prices can also affect U.S. ethanol trade because availability for exports depends largely on the amount of ethanol that is produced beyond the RFS (app. 1); it is likely that lower gasoline prices over time could discourage ethanol plant capacity expansion and, hence, dampen potential export availability in the medium or long term. In addition, ethanol imports might also face pressure from lower gasoline prices.
Fig. 18 indicates that U.S. ethanol exports for 2014 totaled 837 million gallons, higher than in any other year except 2011 (1.2 billion gallons), and were up 37 percent from 2013. Canada and Brazil continued to account for the largest share of U.S. exports; however, several other markets (Nigeria, Peru, Mexico, Philippines, Jamaica) may grow their share of U.S. exports in the future (ITA, 2014).
Domestic Biofuel Use
It is difficult to estimate the degree to which lower oil prices affect biofuels (especially ethanol), as gasoline and ethanol can be viewed as both complements and substitutes (Marshall et al., 2015).
• As a complement, ethanol is an octane enhancer (i.e., in a 10-percent blend). At lower gasoline prices, demand for gasoline increases, leading to an increase in demand for ethanol in this role as an octane enhancer.
• Gasoline and ethanol can be used interchangeably as substitutes for each other, at least up to a point (e.g., fuel can be up to 85 percent ethanol [E85] in flex-fuel vehicles). As the price of gasoline goes down relative to the price of ethanol (as it did in 2014), refiners become more reluctant to blend more ethanol with gasoline than is absolutely necessary for the Renewable Fuel Standard (RFS) (app. 1).
• To meet the RFS, blenders must either blend ethanol with gasoline or purchase a Renewable Identification Number (RIN) from other producers to meet their obligations.1 RIN prices are sensitive to RFS amounts and the blend wall limits (Westcott and McPhail, 2013).
1For a more thorough discussion of RINs, see McPhail et al. (2011).

23 Biofuel Use in International Markets: The Importance of Trade, EIB-144
Economic Research Service/USDA
Although changing market conditions did not dampen ethanol exports in 2014, future exports also depend on U.S. ethanol plant capacity and biofuel policies. As of March 2015, installed produc-tion capacity at U.S. plants was a little more than 15 billion gallons (fig. 19), which is 1 billion to 2 billion gallons over the 13- to 14-billion-gallon blend wall limit in the U.S. market.5 Ethanol production in 2014 was 14.34 billion gallons (ERS, 2015); after accounting for stocks, imports, and actual use, just over 1 billion gallons was available for exports or storage. This amount is larger than any amount of past exports; however, plant capacity has slowed since 2011. The average use rate has, however, averaged 92 percent from 2011-14; hence, there is potential for increased production if export markets are favorable.
5The most-often-cited blend-wall amount is 13 billion gallons; however, ethanol consumption has exceeded that level each of the past years. Thus, we specify the blend wall as a range between 13 billion and 14 billion gallons.
Figure 18
U.S. ethanol production and exports, 2014
Source: USDA, Economic Research Service using data from RFA (2015).
Billion gallons
0
0.2
0.4
0.6
0.8
1.0
1.2
1.4
Jan. Feb. Mar. Apr. May Jun. Jul. Aug. Sep. Oct. Nov.
Production Exports

24 Biofuel Use in International Markets: The Importance of Trade, EIB-144
Economic Research Service/USDA
Biofuel policies may also affect the future of U.S. biofuel trade (see app. 1). In every year since the implementation of the standards in 2008, the U.S. Environmental Protection Agency (EPA) has reduced some portion of the mandate, usually the cellulosic portion. However, the standards for 2014 reduce the maximum amount of corn-based ethanol that can be used to meet the RFS from that for the previous year. That is, the proposed volumes would allow 13.25 billion gallons of corn-based ethanol for 2014 (increasing to 13.40 and 14.00 billion gallons in 2015 and 2016), while the 2013 mandate was 13.80 billion gallons. Reducing the amount of ethanol from corn in the mandate could potentially lead to a reduction in production infrastructure in the long run, which could limit the availability of ethanol for exports. Although in the short run, reducing the mandate could actually increase the amount available for export markets to make use of the existing infrastructure.
In addition, the new proposal sets standards for advanced biofuels, of which Brazilian sugarcane ethanol qualifies. The 2014 mandate is actually set below 2013 actual advanced biofuel usage; however, the mandate increases from 2.68 billion gallons in 2014 to 3.40 billion gallons in 2016. U.S. imports of ethanol in 2014 fell to 72 million gallons, the second lowest amount in the past decade (ERS, 2015). However, if domestic production of advanced biofuels is not increased; then the increase in the mandate amounts will need to be met with imports.6 Note that U.S. exports of ethanol also depend on Brazilian biofuel policy, in particular, the blending mandate (app. 1). If the blending rate in Brazil continues to increase (as it has recently), less Brazilian ethanol will be avail-
6U.S. domestic production of advanced biofuels is predominately through biodiesel. U.S. biodiesel production has slowly but steadily increased (see table 2), although it is somewhat dependent on tax credits (Irwin, 2015). U.S. biodiesel production in 2014 was similar to that in 2013.
Figure 19
U.S. ethanol plant capacity and use rates
Source: USDA, Economic Research Service using data from ERS (2015).
Billion gallons Percent
70
80
90
100
110
120
130
6
8
10
12
14
16
18
2008 2009 2010 2011 2012 2013 2014
Capacity (left axis) Use (right axis)

25 Biofuel Use in International Markets: The Importance of Trade, EIB-144
Economic Research Service/USDA
able to compete with U.S. ethanol on the global market. At the same time, Brazil could continue to import U.S. ethanol to help meet the mandate.
One other issue related to the U.S. biofuel market is the low-carbon fuel standard (LCFS) of California, which requires a specified reduction in carbon usage. The net result is that the LCFS favors biodiesel and ethanol imported from Brazil even more than the RFS. However, implemen-tation of the standard is delayed by litigation (CalETC, 2013). Since California consumes more gasoline than any other State, the implementation of the LCFS could potentially push the blend wall amount even lower if corn-based ethanol is unfavorable to other types of biofuels. This could encourage increased imports of ethanol from Brazil and biodiesel globally and boost exports of U.S. ethanol.
Lastly, the Transatlantic Trade and Investment Partnership (TTIP), a potential free-trade agree-ment currently being negotiated between the United States and the EU, may also affect the future of biofuels in the United States. As previously discussed, the EU currently implements antidumping duties on imports of U.S. ethanol and biodiesel. Removing these duties would reopen what was once the largest export market for U.S. biofuels (see tables 3 and 6). Thus, if the EU duties are removed, U.S. biofuel production might increase. However, along with implementing antidumping duties, the EU has taken steps to limit imports of biofuels that are produced from first-generation methods. The current EU proposal would reduce the blending target for first-generation biofuels from 10 to 7 percent of total transportation fuels (FAS, 2014b).

26 Biofuel Use in International Markets: The Importance of Trade, EIB-144
Economic Research Service/USDA
Conclusions
Favorable market conditions, in tandem with renewable energy policies, have led to large increases in biofuel use globally. In particular, high prices for traditional transportation fuels in the early 2000s, combined with relatively lower biofuel feedstock prices, increased the demand for biofuels. Since reaching record highs in 2006, prices of traditional transportation fuels have moderated to a point where policies mandating biofuel production and consump-tion have become critical to the market for renewable fuels. Energy policies, particularly those since 2011, motivate global trade in biofuels. For example, the U.S. mandates set for various sources of feedstock led to ethanol imports, despite a surplus of corn-based ethanol avail-able for consumption. Consumption barriers in the form of a blend wall and favorable export markets have prompted exports of ethanol, sometimes to the very countries exporting ethanol to the United States (e.g., Brazil). Several countries (e.g., Argentina and Indonesia) have become large global exporters of biofuels, especially biodiesel. The desire to protect domestically produced biofuels has prompted the EU to institute trade barriers against the United States, Brazil, and other biofuel exporters.
Mandated biofuel consumption and market conditions in the United States and Brazil spurred trade in biofuels between these two countries. In the face of higher sugar prices, Brazil substantially increased its (corn) ethanol imports from the United States. Meanwhile, the United States imports Brazilian ethanol to fulfill the advanced biofuel mandate in the RFS. Both countries removed tariffs on ethanol, further facilitating intra-industry trade. In the near future, the two countries will likely continue to trade ethanol with each other, especially if the price of sugar remains high and other advanced biofuels are not commercially developed in the United States.
The current state of biofuels in the United States is such that market conditions and polices make it difficult to project future biofuel trade. Availability of exports depends largely on how much more ethanol is produced beyond the RFS; it is likely that lower gasoline prices could reduce the desire to increase ethanol plant capacity, hence export availability. However, as of January 2015, installed production capacity at U.S. plants was a little more than 15 billion gallons, which is 1 billion to 2 billion gallons over the 13- to 14-billion gallon blend wall limit in the U.S. market. In addition, ethanol imports might also face pressure from lower gasoline prices. This is largely dependent on the use of ethanol as a substitute or complement for gasoline and the need to import to satisfy the mandate for advanced biofuels. Nonetheless, the United States continues to import ethanol from Brazil (and other countries) to help meet RFS mandates. Ethanol produced from sugarcane (such as in Brazil) does, however, face competition in the United States with domestically produced biodiesel. Although biodiesel consumption amounts are also mandated, the U.S. biodiesel industry has not grown at a rate similar to that of the U.S. corn-based ethanol industry, inducing Brazilian ethanol to compete with U.S. biodiesel.

27 Biofuel Use in International Markets: The Importance of Trade, EIB-144
Economic Research Service/USDA
References
Beckman, J., T. Hertel, F. Taheripour, and W. Tyner. 2011. “Structural Change in the Biofuels Era,” European Review of Agricultural Economics 40(5): 137-156.
California Electric Transportation Coalition (CalETC). 2013. “California’s Low Carbon Fuel Standard: Compliance Outlook for 2020.” Available at: www.ceres.org/resources/reports/california2019s-low-carbon-fuel-standard-compliance-outlook-for-2020
DeDecker, J. 2014. “Will the Ethanol Blend Wall Block Biofuels Growth?” Michigan State University Extension.
European Commission (EC). 2013. “Forestry Statistics Overview.” Available at: http://epp.eurostat.ec.europa.eu/statistics_explained/index.php/Forestry_statistics_overview
Fagundes de Almeida, E., and J. Bomtempo. 2007. “The Performance of Brazilian Biofuels: An Economic, Environmental and Social Analysis,” OECD/International Transport Forum Discussion Paper No. 2007-5.
Hofstand, D. 2015. “Renewable Energy—Outlook and Prices.” Available at: www.extension.iastate.edu/agdm/reoutlook.html
Irwin, S. 2015. “The Profitability of Biodiesel Production in 2014,” FarmDoc Daily.
Irwin, S. 2014. “2014: A Rough Year for Biodiesel Producers,” FarmDoc Daily.
Irwin, S., and D. Good. 2015. “Further Evidence on the Competitiveness of Ethanol in Gasoline Blends,” FarmDoc Daily.
Irwin, S., and D. Good. 2013. “Brazilian Ethanol Imports—Implications for U.S. Ethanol and Corn Demand,” FarmDoc Daily.
Irwin, S., and D. Good. 2012. “What’s Driving the Surge in Ethanol Imports?” FarmDoc Daily.
Marshall, K., S. Riche, R. Seeley, and P. Westcott. 2015. Effects of Recent Energy Price Reductions on U.S. Agriculture. U.S. Department of Agriculture, Economic Research Service, Outlook No. BIO-04. Available at: www.ers.usda.gov/publications/bio-bioenergy/bio-04.aspx
McPhail, L., P. Westcott, and H. Lutman. 2011. The Renewable Identification Number System and U.S. Biofuel Mandates. U.S. Department of Agriculture, Economic Research Service, Outlook No. BIO-03. Available at: www.ers.usda.gov/publications/bio-bioenergy/bio-03.aspx
Meyer, D., L. Mytelka, R. Press, E. Dall’Oglio, P. Texiera de Sousa Jr, and A. Grubler. 2012. “Brazilian Ethanol: Unpacking a Success Story of Energy Technology Innovation. Historical Case Studies of Energy Technology Innovation.” In A. Grubler, F. Aguayo, K.S. Gallagher, M. Hekkert, K. Jiang, L. Mytelka, L. Neij, G. Nemet and C. Wilson (eds.). The Global Energy Assessment. Chapter 24. Cambridge, UK: Cambridge University Press.
Meyer, S., and R. Johansson. 2013. “Proposed Rules for 2014 RFS—A Volume of Uncertainty,” FarmDoc Daily.

28 Biofuel Use in International Markets: The Importance of Trade, EIB-144
Economic Research Service/USDA
Meyer, S., J. Schidhuber, and J. Barreiro-Hurle. 2013. “Global Biofuel Trade: How Uncoordinated Biofuel Policy Fuels Resource Use and GHG Emissions,” ICTSD Issue Paper No. 48.
Pacific Biodiesel. 2014. “Frequently Asked Questions.” Available at: www.biodiesel.com/index.php/biodiesel/frequently_asked_questions_about_biodiesel
Renewable Fuels Association (RFA). 2014. “E85.” Available at: www.ethanolrfa.org/pages/e-85
Renewable Fuels Association (RFA). 2015. “2014 U.S. Ethanol Exports and Imports.” Available at: www.ethanolrfa.org/page/-/rfa-association-site/studies/2014%20U.S.%20Export-Import%20Report.pdf?nocdn=1
Schnepf, R. 2011. “Agriculture-Based Biofuels: Overview and Emerging Issues,” CRS Report: R41282, Congressional Research Service, R41282.
Shah, K., G. Philippidis, H. Dulal, and G. Brodnig. 2012. “Developing Biofuels Industry in Small Economies: Policy Experiences and Lessons from the Caribbean Basin Intiative,” Mitigation and Adaptation Strategies for Global Change, Vol. 17.
State of Nebraska. 2014. “Ethanol and Unleaded Gasoline Average Rack Prices.” Available at: www.neo.ne.gov/statshtml/66.html
Stratas Advisors. 2015. Biofuel Data. Personal communication.
Thomson Reuters Foundation. 2013. “Ethanol Trade Undermines U.S. Biofuels Policy.”Available at: www.trust.org/item/20130703091935-47h65/.
Tyner, W. 2013. “Pity the Poor Biofuels Policymaker,” Biofuels, Vol. 4(3): 259-261.
U.S. Department of Agriculture, Economic Research Service (ERS). 2015. “Bioenergy Statistics.”
U.S. Department of Agriculture, Economic Research Service (ERS). 2014a. “Bioenergy Statistics.”
U.S. Department of Agriculture, Economic Research Service (ERS). 2014b. “Feed Grains Database.”
U.S. Department of Agriculture, Foreign Agricultural Service (FAS). 2015. “Biofuels- Brazil Raises Federal Taxes and Blend Mandate,” GAIN Report Number: BR15001.
U.S. Department of Agriculture, Foreign Agricultural Service (FAS). 2014a. “Brazil Biofuels Annual,” GAIN Report Number: BR14004.
U.S. Department of Agriculture, Foreign Agricultural Service (FAS). 2014b. “EU-27 Biofuels Annual,” GAIN Report Number: NL4025.
U.S. Department of Agriculture, Foreign Agricultural Service (FAS). 2013a. “Argentina Biofuels Annual,” GAIN Report.
U.S. Department of Agriculture, Foreign Agricultural Service (FAS). 2013b. “Brazil Biofuels Annual,” GAIN Report Number: BR13005.

29 Biofuel Use in International Markets: The Importance of Trade, EIB-144
Economic Research Service/USDA
U.S. Department of Agriculture, Foreign Agricultural Service (FAS). 2013c. “Canada Biofuels Annual,” GAIN Report Number: CA13034.
U.S. Department of Agriculture, Foreign Agricultural Service (FAS). 2013d. “EU-27 Biofuels Annual,” GAIN Report Number: NL3034.
U.S. Department of Agriculture, Foreign Agricultural Service (FAS). 2013e. “Indonesia Biofuels Annual,” GAIN Report Number: ID1337.
U.S. Department of Agriculture, Foreign Agricultural Service (FAS). 2012. “Brazil Biofuels Annual,” GAIN Report Number: BR12013.
U.S. Department of Agriculture, Foreign Agricultural Service (FAS). 2011a. “Brazil Biofuels Annual,” GAIN Report Number: BR110013.
U.S. Department of Agriculture, Foreign Agricultural Service (FAS). 2011b. “EU-27 Biofuels Annual,” GAIN Report Number: NL1013.
U.S. Department of Commerce, International Trade Administration (ITA). 2014. “Renewable Energy Top Markets for U.S. Exports 2014-2015.”
U.S. Department of Energy (DOE), Energy Efficiency & Renewable Energy (EERE). 2014. “Alternative Fuels Data Center.” Available at: www.afdc.energy.gov/fuels/prices.html
U.S. Energy Information Administration (EIA). 2015. Short-Term Energy Outlook.
U.S. Energy Information Administration (EIA). 2014a. “Today in Energy.” Available at: www.eia.gov/todayinenergy/detail.cfm?id=16391
U.S. Energy Information Administration (EIA). 2014b. Petroleum & Other Liquids Database. Available at: www.eia.gov/petroleum/
U.S. Energy Information Administration (EIA). 2012. “Biofuels Issues and Trends.” Available at: www.eia.gov/biofuels/issuestrends/pdf/bit.pdf
U.S. Energy Information Administration (EIA). 2009. “Short-Term Energy Outlook Supplement: Biodiesel Supply and Consumption.” Available at: www.eia.gov/forecasts/steo/special/pdf/2009_sp_01.pdf
U.S. Environmental Protection Agency (EPA). 2012. “Regulation of Fuels and Fuel Additives: Renewable Fuel Standard Program; Final Rule,” Federal Register (Vol. 77).
Westcott, P., and L. McPhail. 2013. “High RIN Prices Signal Constraints to U.S. Ethanol Expansion.” In Feed Outlook, FDS-13d-SA, U.S. Department of Agriculture, Economic Research Service. Available at: www.ers.usda.gov/media/1158986/fds-13d-sa.pdf
Wisner, R. 2014. “Biodiesel Developments and Concerns,” AgMRC Renewable Energy & Climate Change Newsletter, February.
Wisner, R. 2013. “Emerging Ethanol Issues: Blending Mandates, Advanced Biofuels and Other Concerns,” AgMRC Renewable Energy & Climate Change Newsletter, November.

30 Biofuel Use in International Markets: The Importance of Trade, EIB-144
Economic Research Service/USDA
Wisner, R. 2012. “Ethanol Exports: A Way to Scale the Blend Wall?” AgMRC Renewable. Energy & Climate Change Newsletter, February.
World Bank. 2014. “GEM Commodities.” Available at: http://data.worldbank.org/data-catalog/commodity-price-data
Yano, Y., D. Blandford, and Y. Surry. 2013. “From Ethanol Shuffle to Ethanol Tourism—Why the RFS Does Not Make Sense,” Choices.
Yeh, S., J. Witcover, and J. Kessler. 2013. “Status Review of California’s Low Carbon Fuel Standard - Spring 2013 (Revised Version),” Institute of Transportation Studies, University of California, Davis, Research Report UCD-ITS-RR-13-06.

31 Biofuel Use in International Markets: The Importance of Trade, EIB-144
Economic Research Service/USDA
Appendix 1: Government Policy
The top three global biofuel producers and consumers all have government policies that mandate a certain amount or percentage of biofuel consumption. For the United States, the Renewable Fuel Standard (RFS) mandates annual blending targets, which gradually increase over time. The blending targets are broken out into different categories: other advanced biofuels, cellulosic biofuels, and biodiesel. Meyer et al. (2013) refer to these three categories as the “advanced portion.” Although ethanol from first-generation methods (e.g., corn) is not directly specified in the RFS, it is assumed to fill the gap between the total renewable fuels amount and the advanced portion (Myers et al., 2013). The quantities of first-generation ethanol assumed and biodiesel mandated in the RFS are shown in appendix table 1. Both biodiesel consumed beyond the biodiesel mandate and ethanol from sugarcane count in the other advanced biofuels portion of the mandate. This is especially important because the amount of the mandate attributable to other advanced biofuels grows in 2013 and beyond (app. fig 1).
In addition to the RFS, there was a tax credit of 54 cents per gallon for conventional ethanol (2001-04), reduced to 51 cents for 2005 and 45 cents for 2008. However, this tax credit was removed in 2012. In addition, a tariff on ethanol imports of 54 cents per gallon was allowed to expire in 2012, although there is still a small ad valorem tax on imports. There is also recent history of a tax credit for biodiesel of around $1.00 per gallon for biodiesel; however, this credit is often allowed to lapse. It has often been reinstated, after expiring in 2010 and 2012.
Brazil’s ethanol program (ProAlcool) began in 1975, as high oil prices and the collapse of sugar prices led to the use of sugarcane for ethanol (Meyer et al., 2012). This program provided favor-able financial support to expand ethanol production and flex-fuel car purchases and also mandated a percentage of ethanol to be blended with gasoline. As of March 2015, the mandate amount is 27 percent, an increase from the 18- to 20-percent mandate in 2010 and 2011 (FAS, 2015). In addition, in April 2010, the Brazilian Government eliminated the ethanol import tariff until the end of 2015 (FAS, 2011a). Brazil also has a 7-percent blending mandate for biodiesel (FAS, 2014a). However, a 14-percent tariff on biodiesel imports still remains in effect (FAS, 2011a).
Appendix table 1
Mandated consumption amounts for the United States, Brazil, and the EU
Ethanol Biodiesel
U.S. Brazil EU U.S. Brazil EU
Billion gallons
2008 9.000 1.663 1.439 0.237 2.601
2009 10.500 1.678 1.628 0.500 0.351 3.006
2010 12.000 1.498 1.760 0.650 0.650 3.520
2011 12.600 1.781 1.757 0.800 0.690 3.560
2012 13.200 2.097 1.753 1.000 0.704 3.594
2013 13.800 2.642 1.750 1.280 0.725 3.628
Note: The Brazilian and EU amounts are calculated by multiplying gasoline (diesel) consumed by the biofuel blending mandate amount. The United States had no mandate for biodiesel in 2008.
Source: USDA, Economic Research Service using data from Schnepf and Yacobucci (2013), FAS (2013b), and FAS (2013d).

32 Biofuel Use in International Markets: The Importance of Trade, EIB-144
Economic Research Service/USDA
EU biofuel policy is guided by the Renewable Energy Directive (RED), as part of the Climate and Energy Package that began in June 2009. The directive includes the goal of 20-percent renewable energy consumption as a fraction of total energy consumed along with a 20-percent improvement in energy efficiency, both by the year 2020. This “20/20/20” goal is an overall EU goal, and the RED sets different targets for different countries within this overall target, based on each country’s energy capacity.7 In addition, there is a 10-percent renewable energy target for energy consumed in transportation, known as the Biofuel Directive. Recently (September 2013), the EU voted to cap the portion of the directive that could be met with first-generation biofuels at 6 percent (Tyner, 2014).
Imports of biofuels to the EU face tariffs. Ethanol for fuel is charged a tariff of $0.50 per gallon (based on an exchange rate of €1 = $1.30), while the import tariff for biodiesel is 6.5 percent (FAS, 2013d). In addition to these tariffs, the EU levies antidumping and countervailing duty8 measures on imports of biodiesel from the United States and most Canadian companies. These extra measures equate to $0.89 to $1.70 per gallon (depending on the company). In addition, the EU recently insti-tuted similar measures on Argentina (it has an additional duty of 24.6 percent) and Indonesia (18.9 percent). Further, the EU also has in place antidumping and countervailing duties on U.S. ethanol. The extra duty applied to U.S. ethanol is $0.24 per gallon (FAS, 2013d).
7As part of the Renewable Energy Directive, the EU consumes a large amount of wood pellets for home heating or for generating electricity. The United States and Canada supplied 27 percent of total EU wood pellet consumption in 2013 (FAS, 2014). Future research could consider the total suite of renewable energy for both the EU and the United States.
8The World Trade Organization defines antidumping as the selling of a product on the world market at a price lower than the price the country normally charges on its own home market. The extra duty charged is known as the countervailing duty.
Appendix figure 1
Renewable Fuel Standard mandates by category
Source: USDA, Economic Research Service using data from DOE EERE (2014).
Billion gallons
Conventional Cellulosic
Biodiesel Other advanced
0
5
10
15
20
25
30
35
40
2008 2009 2010 2011 2012 2013 2014 2015 2016 2017 2018 2019 2020 2021 2022
Related Documents