Department of Science, Information Technology and Innovation Service Delivery Statements Queensland Budget 2015-16

Welcome message from author
This document is posted to help you gain knowledge. Please leave a comment to let me know what you think about it! Share it to your friends and learn new things together.
Transcript
Queensland Budget 2015-16 Service Delivery Statements www.budget.qld.gov.au
Department of Science, Information Technology and Innovation
Service Delivery Statements
Queensland Budget 2015-16

2015-16 Queensland Budget Papers1. Budget Speech
2. Budget Strategy and Outlook
3. Capital Statement
4. Budget Measures
5. Service Delivery Statements
Appropriation Bills
Jobs Now, Jobs for the Future - Queensland Government employment plan
Budget Highlights
The suite of Budget Papers is similar to that published in 2014-15.
The Budget Papers are available online at www.budget.qld.gov.au
© Crown copyright All rights reservedQueensland Government 2015
Excerpts from this publication may be reproduced, with appropriate acknowledgement, as permitted under the Copyright Act.
Service Delivery Statements
ISSN 1445-4890 (Print)ISSN 1445-4904 (Online) Queensland Budget 2015-16 Service Delivery Statements www.budget.qld.gov.au

Department of Science, Information Technology and Innovation
Summary of portfolio
Page Department of Science, Information Technology and Innovation
3 Department of Science, Information Technology and Innovation - controlled
Department of Science, Information Technology and Innovation - administered
34 CITEC
45 Queensland Shared Services
55 Library Board of Queensland
Portfolio overview
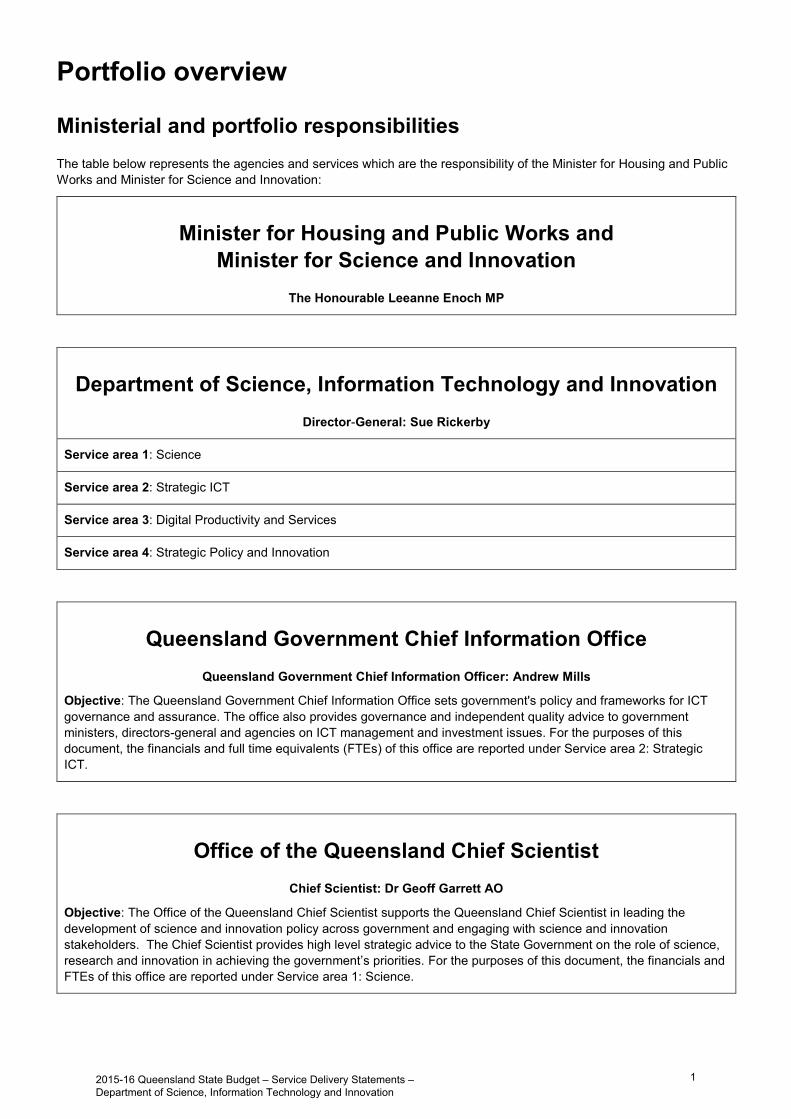
Ministerial and portfolio responsibilities The table below represents the agencies and services which are the responsibility of the Minister for Housing and Public Works and Minister for Science and Innovation:
Minister for Housing and Public Works and Minister for Science and Innovation
The Honourable Leeanne Enoch MP
Department of Science, Information Technology and Innovation Director-General: Sue Rickerby
Service area 1: Science
Service area 2: Strategic ICT
Service area 3: Digital Productivity and Services
Service area 4: Strategic Policy and Innovation
Queensland Government Chief Information Office Queensland Government Chief Information Officer: Andrew Mills
Objective: The Queensland Government Chief Information Office sets government's policy and frameworks for ICT governance and assurance. The office also provides governance and independent quality advice to government ministers, directors-general and agencies on ICT management and investment issues. For the purposes of this document, the financials and full time equivalents (FTEs) of this office are reported under Service area 2: Strategic ICT.
Office of the Queensland Chief Scientist Chief Scientist: Dr Geoff Garrett AO
Objective: The Office of the Queensland Chief Scientist supports the Queensland Chief Scientist in leading the development of science and innovation policy across government and engaging with science and innovation stakeholders. The Chief Scientist provides high level strategic advice to the State Government on the role of science, research and innovation in achieving the government’s priorities. For the purposes of this document, the financials and FTEs of this office are reported under Service area 1: Science.
2015-16 Queensland State Budget – Service Delivery Statements – Department of Science, Information Technology and Innovation
1

CITEC General Manager CITEC ICT: Peter Buchan
Executive Director CITEC Information Brokerage: Suzanne Stone
Objective: CITEC (including CITEC ICT and CITEC Information Brokerage) delivers consolidated data centre, network and infrastructure services, including solutions integration and aggregation services for the whole of Government, in addition to delivering information brokerage services.
Queensland Shared Services Assistant Director-General Dianne Jeans
Objective: Shared Corporate Services, through Queensland Shared Services, delivers corporate services to a range of government agencies, allowing them to focus on their core service delivery roles, and providing economies of scale to government back office services.
Library Board of Queensland State Librarian: Janette Wright
Objective: The State Library of Queensland (SLQ) provides free access to a wide range of print, digital and original resources, partners with local government to fund and support Queensland public libraries and Indigenous Knowledge Centres, offers public programs and exhibitions to schools, public libraries, museums and other community organisations and is committed to engaging new audiences through the development of partnerships and use of innovative technologies.
Additional information can be sourced from:
www.qld.gov.au/dsiti
www.chiefscientist.qld.gov.au
www.qgcio.qld.gov.au
www.slq.qld.gov.au.
2015-16 Queensland State Budget – Service Delivery Statements – Department of Science, Information Technology and Innovation
2
Departmental overview The Department of Science, Information Technology and Innovation (DSITI) brings together science, information technology and innovation into one portfolio to create the jobs of the future and to enable an innovative, clever and connected Queensland.
Our strategic objectives, as stated in DSITI's 2015-19 strategic plan, are:
to lead science, ICT, innovation and digital and customer services policy to deliver excellent specialist and support services to be a high performing innovative, clever and connected organisation.
Our strategic objectives contribute to the Queensland Government's objectives for the community to create jobs and a diverse economy, deliver quality frontline services, protect the environment and build safe, caring and connected communities. We do this by providing better outcomes for Queenslanders through a variety of initiatives in science, innovation, information and communication technology and front-line service delivery.
It is important for Queensland to diversify its economy to reduce unemployment and to create new jobs – now and in the future. For Queensland’s economy to diversify and grow, we need to create jobs in new and emerging industries; build the capacity and sustainability of Queensland businesses; and ensure our young people gain the skills and knowledge they need to succeed in a future job market. Enabling and providing the foundations for these are key areas of focus for DSITI. Through our policies and services, we help attract and retain the best and brightest minds to Queensland and build our reputation as a knowledge economy that supports and drives research and innovation.
The department is at a critical intersection in the knowledge economy between science, information technology and innovation, and will play a major role in encouraging economic growth through scientific research and development, digital services, information technology, startups support, commercialisation and innovation.
The Advance Queensland initiative has a number of programs which will be progressed by the department including establishing a high-level expert panel to provide advice and direction to the Advance Queensland initiative, a Knowledge Transfer Partnerships Program and a Women’s Academic Fund.
The Queensland Government is committed to Open Data to create economic value for Queensland businesses and to ensure a transparent and accessible Government. DSITI will ensure Queensland Government information is publicly available through open data, providing Queenslanders with the opportunity to create apps, establish research programs, start new businesses and assist with improving government service delivery.
The department also has a continuing role to support ongoing efficient and effective service delivery for Queensland Government departments and employees through process and systems improvement and ICT modernisation.
The department delivers its policy initiatives and programs within a complex operating environment that is influenced by a range of factors including:
creating the jobs of the future centred on knowledge intensive occupations and industries to contribute to theGovernment’s Working Queensland reform agenda
protecting Queensland’s environment including the Great Barrier Reef the rapid pace of technological change, particularly the exponential growth of digital technologies and digitally driven
services meeting citizen demand for access to digitally-driven, innovative government services addressing the digital divide – inconsistent ICT connectivity across Queensland’s regions.
2015-16 Queensland State Budget – Service Delivery Statements – Department of Science, Information Technology and Innovation
3

Service performance
Service approach The service area structure presented reflects the machinery-of-government changes effective 1 March 2015, under which the department was renamed from the Department of Science, Information Technology, Innovation and the Arts to the Department of Science, Information Technology and Innovation (DSITI).
The structure of the department was altered to transfer Arts Queensland, Queensland Art Gallery, Queensland Museum, Queensland Performing Arts Trust and the Corporate Administration Agency to the Department of the Premier and Cabinet.
Our current service areas are:
Science Strategic ICT Digital Productivity and Services Strategic Policy and Innovation.
Performance statement
Science
Service area objective
To provide support for science and research partnerships in Queensland and provide trusted scientific services to support the achievement of Queensland Government priorities including the delivery of the science research related programs of the Advance Queensland initiative and protection of the Great Barrier Reef.
Service area description
The Science service area works in partnership with government agencies, universities and other research groups, industry and natural resource management groups, to provide scientific services and science grants management services.
Services
Scientific Services: provides trusted scientific services and technical advice to government agencies, industry and thecommunity to underpin environmental and natural resource management, decision making and policy setting.
Contract and Investment Management: co-invests, promotes and facilitates science and research partnershipsthrough the contract management of the Queensland Government’s science related grants programs.
2015-16 service area highlights
During 2015-16 Science will:
coordinate the first round of funding under the Advance Queensland initiative to drive opportunities in science andinnovation that will grow the Queensland economy and create jobs
coordinate cross-agency reef science projects to inform land management practices and understand water qualityimpacts on the Great Barrier Reef. This includes projects as part of the Paddock to Reef Integrated Monitoring,Modelling and Reporting Program and the Department of Environment and Heritage Protection’s Reef Water QualityScience Program
continue to provide scientific and technical services, information and advice to support disaster response,management and recovery
2015-16 Queensland State Budget – Service Delivery Statements – Department of Science, Information Technology and Innovation
4

deliver the 2012-14 State-wide Land and Trees Study that will include Queensland land clearing rates to supportnatural resource management and property planning
redesign the Long Paddock website to continue to provide the best climate advice tailored for Queensland to enablelandholders, graziers and the general community to sustainably manage their stock, crops and pastures
maintain the air quality monitoring network across locations in Queensland and continue to support environmentalinvestigations
complete Groundwater Dependent Ecosystem Mapping for forty per cent of Queensland to provide baselineinformation to inform planning and development decision making.
Department of Science, Information Technology and Innovation Notes
2014-15 Target/Est.
2014-15 Est. Actual
2015-16 Target/Est.
Service area: Science
Service: Scientific Services
Service standards Effectiveness measures
Percentage of customers from other government agencies satisfied with the natural resource and environmental science services and information provided (overall satisfaction) 1 85% 89% 85%
Percentage of laboratory tests completed and made available within agreed timeframes and quality specifications to support Reef Plan 2013-18 and the government’s Agricultural Strategy 2 85% 92% 85%
Efficiency measure
Co-investment as a percentage of the Scientific Services budget 3 New measure New measure 25%
Service: Contract and Investment Management
Service standards Effectiveness measure
Percentage of science funding recipients satisfied with contract management services provided for science related grant programs (overall satisfaction) 1 85% 92% 85%
Efficiency measures 4
Notes: 1. The survey has standard questions for overall satisfaction and the five key drivers of satisfaction (timeliness, ease of access, staff, quality,
outcome/outputs). The method of calculating the results remains unchanged.2. The timeframes involved are negotiated per sample submission and quality will be measured by maintenance of accreditation with the
National Association Testing Authorities Australia and performance in national and international laboratory proficiency trials.3. This is a new measure of proxy efficiency. Appropriated funding is leveraged by performing services for other State Government agencies
and by partnering with external organisations.4. An efficiency measure is being developed for this service and will be included in a future Service Delivery Statement.
2015-16 Queensland State Budget – Service Delivery Statements – Department of Science, Information Technology and Innovation
5

Strategic ICT
Service area objective
To support Queensland Government service delivery by managing whole-of-government ICT initiatives, providing agencies with specialist ICT advice and procurement services and making it easier for the ICT industry, including small to medium enterprises, to engage with the Queensland Government.
Service area description
The Strategic ICT service area supports whole-of-government initiatives by providing strategic advice on ICT programs and projects. This is supported through ICT strategic sourcing and procurement arrangements, facilitation of engagement between the ICT industry and government, management of whole-of-government infrastructure and information brokerage. Activities conducted by Strategic ICT play an integral role in the transformation envisaged in the Queensland Government ICT strategy 2013-17 including whole-of-government initiatives such as the Small to Medium Enterprise (SME) policy.
2015-16 service area highlights
During 2015-16 Strategic ICT will:
continue to lead and embed ICT category management across the Queensland Government to ensure whole-of-government needs are met
implement the Government Wireless Network throughout South East Queensland to increase network capability,functionality and security for public safety and emergency service agencies
refresh the ICT Services Panel to ensure the most current and innovative suppliers are available to the QueenslandGovernment
continue to actively engage with the ICT industry and support small to medium enterprises (SMEs) to work with theQueensland Government, including implementing a co-designed ICT Industry Engagement Action Plan
continue to deliver the Queensland Government ICT modernisation agenda to support a connected, integratedgovernment that uses modern, innovative and cost-effective ICT
finalise the review of the Government Information Technology Contracting (GITC) Framework and implementaccepted recommendations to simplify ICT procurement for government and industry
advance information management capability and work practices to improve the way information is shared withcustomers and across government
continue to develop the public sector ICT workforce to support a growing digital and knowledge economy.
Department of Science, Information Technology and Innovation Notes
2014-15 Target/Est.
2014-15 Est. Actual
2015-16 Target/Est.
Service area: Strategic ICT
Service standards Effectiveness measure
Percentage of whole-of-government spend awarded to Small to Medium sized enterprises (transactions over $10,000). 1 New measure New measure >11%
Efficiency measures 2
Notes: 1. ICT strategic sourcing delivered the ICT SME participation scheme policy to ensure effective engagement with the ICT industry and
specifically with SMEs by ensuring departments adopt a consistent procurement process. This service standard assesses the ongoingeffectiveness of the ICT SME participation scheme policy by measuring the percentage of whole-of-government spend on transactionsover $10,000 awarded to SMEs for ICT products and services.
2. An efficiency measure is being developed for this service and will be included in a future Service Delivery Statement.
2015-16 Queensland State Budget – Service Delivery Statements – Department of Science, Information Technology and Innovation
6

Digital Productivity and Services
Service area objective
To revitalise Queensland Government services, increase Queensland’s digital capability, preserve Queensland public records and enhance the whole-of-government customer experience.
Service area description
Digital Productivity and Services comprises the Digital Economy and Productivity Office, Queensland State Archives, One-Stop Shop and Smart Service Queensland. Key services include: provision, expansion and improvement of customer access to a wide range of government information and services, collaborative projects and events to promote the adoption of digitally enabled technologies and services across Queensland, and management, preservation and facilitation of access to Queensland’s permanent archival public records.
Services
Government Recordkeeping and Archives: Lead Queensland public authorities in making, keeping, managing andpreserving Queensland public records in a useable form for the benefit of present and future generations, andimprove public access to the collection.
Digital Capability and Digital Economy Development: Drive ‘digital-first’ delivery of government services and createconditions for community and business participation in the digital economy.
Whole-of-government Customer Experience: Revitalise front-line services making government services andinformation simpler, clearer and faster for the community to access on-line or by phone and counter channels.
2015-16 service area highlights
During 2015-16 Digital Productivity and Services will:
further progress a digital economy policy and service agenda that promotes the increased use of digital technologies,applications and open data
continue to implement the One-Stop Shop program by expanding the single customer log-in, proof of ID and myaccount concept; continuing to optimise high volume online services and improve online customer experience; andevaluate the results of the local service outlet pilots
lead the review of the Public Records Act 2002. Queensland State Archives (QSA) will also undertake a review of thestrategic direction of QSA in the context of digital readiness, and will plan the design of a digital archives solution
continue to provide service excellence to Queenslanders via phone 13QGOV and in person at QueenslandGovernment Agent Program locations and Queensland Government Service Centres.
Department of Science, Information Technology and Innovation Notes
2014-15 Target/Est.
2014-15 Est. Actual
2015-16 Target/Est.
Service area: Digital Productivity and Services
Service: Government Recordkeeping and Archives
Service standards Effectiveness measure
Overall Customer Satisfaction with QSAs delivery of services to the public 1 ≥93% 94% …
Efficiency measures 2
Service: Digital Capability and Economy Development
2015-16 Queensland State Budget – Service Delivery Statements – Department of Science, Information Technology and Innovation
7

Department of Science, Information Technology and Innovation Notes
2014-15 Target/Est.
2014-15 Est. Actual
2015-16 Target/Est.
Service standards Effectiveness measures
Percentage of initiatives in the digital economy strategy action plan completed on time and on budget 3 New measure New measure 90%
Percentage of projects/initiatives involving partners in the digital economy strategy action plan completed on time and on budget. 4 New measure New measure 90%
Efficiency measures 2
Service: Whole-of-Government
Customer Experience
Service standards
Effectiveness measures
Percentage of One-Stop Shop projects being managed or delivered which meet committed timeframes and budget 5 New measure New measure 90%
Percentage of clients satisfied with the One-Stop Shop Program 6 New measure New measure 70%
Percentage of customers satisfied with the services provided by Smart Service Queensland on behalf of government agencies 6,7 ≥85% 92% ≥85%
Percentage of clients satisfied with the services provided by Smart Service Queensland on their behalf 6,8 ≥80% 77.8% 80%
Efficiency measure
Cost per customer service interaction (all interaction) 6,9 New measure New measure $3.24
Notes: 1. This is the result from the biennial customer satisfaction survey conducted for Queensland State Archives in March 2015. The next survey
will be conducted in 2017.2. An efficiency measure is being developed for this service and will be included in a future Service Delivery Statement.3. This is a new measure of effectiveness that reflects the digital economy strategy action plan (a plan that supports Queensland's three year
Digital Economy Strategy) approved projects that are completed on time and on budget.4. This is a new measure of effectiveness that reflects the initiatives involving partners in the digital economy strategy action plan (a plan that
supports Queensland's three year Digital Economy Strategy) completed on time and on budget.5. This is a new measure of effectiveness that reflects the percentage of One-Stop Shop projects being delivered which meet the committed
timeframes and budget.6. The term ‘client’ is used to identify other government departments or agencies, whilst the term ‘customer’ identifies members of the public
or community. It is a measure of overall satisfaction. The method of calculating the results remains unchanged.7. The overall satisfaction score for Smart Service Queensland increased by 4 percentage points in 2014-15. The increase was
predominantly due to an increase for the phone channel from 91% satisfaction in 2013-14 to 93% in 2014-15.8. The client satisfaction rating increased from 76.9% in 2013-14. The results highlighted further opportunity to improve communication with
client agencies.9. Customer service interactions are measured across all channels including: 13QGOV, www.qld.gov.au and the Queensland Government
Agent Program and Queensland Government Service Centres. The cost is calculated based on the total operating cost of Smart ServiceQueensland across all channels.
2015-16 Queensland State Budget – Service Delivery Statements – Department of Science, Information Technology and Innovation
8

Strategic Policy and Innovation
Service area objective
Strategic Policy and Innovation (SPI) aims to drive Queensland's productivity and build a more resilient and diversified economy by fostering an innovative private and public sector, and boosting commercialisation outcomes and entrepreneurial success.
Service area description
SPI leads the innovation and entrepreneurship agenda, with a primary focus on increasing levels of innovation in business, and supporting the commercialisation of ideas in research organisations, startups and SMEs. SPI also supports innovation across government to facilitate innovative thinking for government services and challenges.
The division coordinates the department’s strategic policy and customer and market insights activity, to ensure departmental services and strategies align to customer needs and the Queensland Government priorities.
2015-16 service area highlights
During 2015-16 Strategic Policy and Innovation will:
Startup Queensland Fund – the continuation of $300,000 per annum in funding will assist in building capability withinthe Queensland startup community, including regional areas, by delivering practical information and advice;increased collaboration and networking opportunities, connectivity and transformational entrepreneurship
launch and run the first round of the Knowledge Transfer Partnerships program utilising up to $2 million in fundingthat is available for Queensland business in 2015-16 as part of the Advance Queensland initiative
continue to support Queensland startups by providing early-stage, high-growth potential businesses with access toexperienced entrepreneurs and incubator services, including an enhanced focus on delivering outreach programs toregional entrepreneurs
recognise local 'grass roots' innovators and science champions across Queensland through the Science andInnovation Champions Program
facilitate the placement of PhD students from participating Queensland universities in Queensland businessesthrough the PhD Employment Experience Program, to enable collaboration and knowledge sharing and deliver workready PhD students to benefit Queensland business and industry.
Department of Science, Information Technology and Innovation Notes
2014-15 Target/Est.
2014-15 Est. Actual
2015-16 Target/Est.
Service area: Strategic Policy and Innovation
Service standards Effectiveness measures
Proportion of stakeholders who are satisfied with innovation and commercialisation, consultative and engagement processes. 1 85% 87% 85%
Percentage of potential collaboration opportunities identified by participants of innovation and collaboration programs/events. 2 New measure New measure 15%
Efficiency measure
Ratio of investment leveraged as a result of Queensland Government funding invested. 3 New measure New measure 2:1
2015-16 Queensland State Budget – Service Delivery Statements – Department of Science, Information Technology and Innovation
9

Notes: 1. This effectiveness measure is based on customer satisfaction surveys and includes questions on timeliness, quality, access, staff and
outcome. It is a measure of overall satisfaction. The method of calculating the results remains unchanged.2. This is a new measure of effectiveness. It is a percentage that correlates the number of potential collaboration opportunities identified with
the number of participant responses as a direct output from enabling/facilitating innovation and commercialisation programs. The data forthis measure is obtained by surveying each customer after the event to identify if they are likely to form a new collaboration as a result ofthe event.
3. This is a new measure of efficiency. This is an indicator of the efficient use of Government funding to leverageprivate/commercial/philanthropic/Australian Government sector investments. The data is obtained from funding recipients as part of theirreporting standards. Queensland Government (DSITI) data is as per divisional funds administered and obtained from the GrantsAdministration System.
2015-16 Queensland State Budget – Service Delivery Statements – Department of Science, Information Technology and Innovation
10

Administered items Administered activities are those undertaken by departments on behalf of the Queensland Government.
The Department of Science, Information Technology and Innovation administers funds on behalf of the State to CITEC, Queensland Shared Services and the Library Board of Queensland.
CITEC will receive $2 million in 2015-16 budget to deliver GovNet services to the rest of the Queensland Government.
Queensland Shared Services will receive $16.4 million in 2015-16 budget mainly in relation to system and process improvement activity.
The Library Board of Queensland will receive $61.8 million in 2015-16 budget for its objectives to improve access to library services, co-create Queensland's memory and extend the reach of learning and creative programs.
Administered assets, liabilities, revenues and expenses, as well as variance explanations in relation to these administered items, appear in the department's financial statements.
2015-16 Queensland State Budget – Service Delivery Statements – Department of Science, Information Technology and Innovation
11
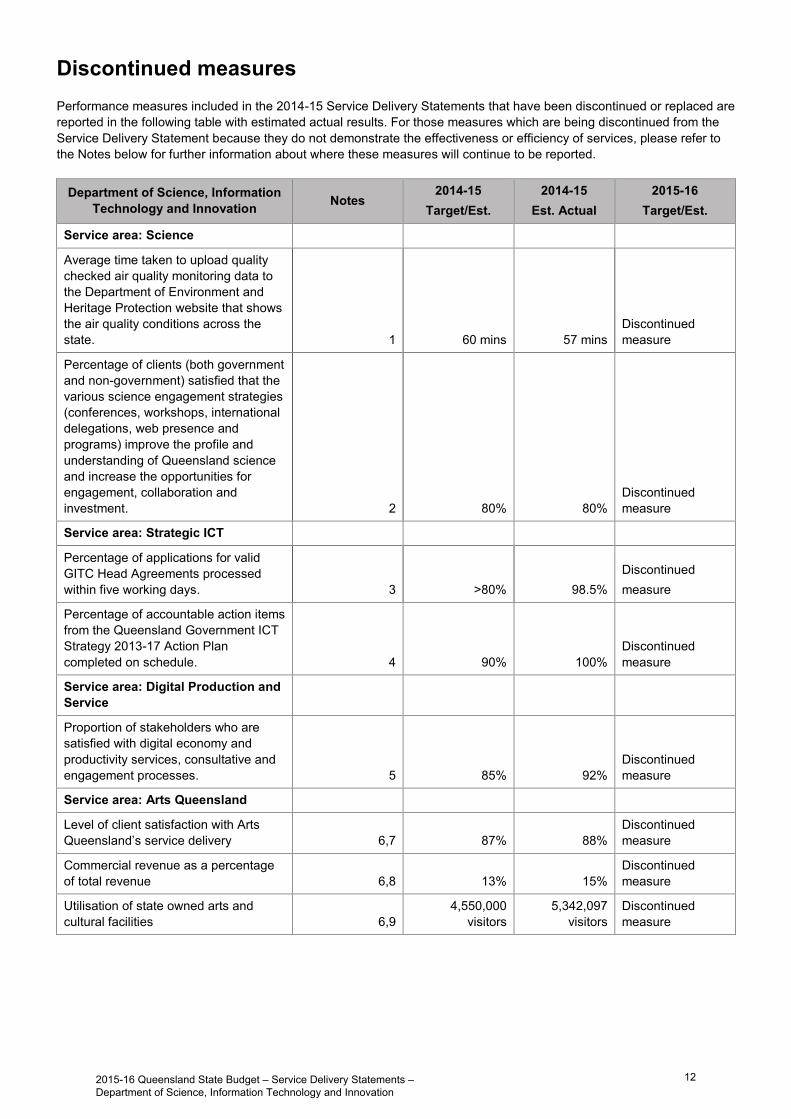
Discontinued measures Performance measures included in the 2014-15 Service Delivery Statements that have been discontinued or replaced are reported in the following table with estimated actual results. For those measures which are being discontinued from the Service Delivery Statement because they do not demonstrate the effectiveness or efficiency of services, please refer to the Notes below for further information about where these measures will continue to be reported.
Department of Science, Information Technology and Innovation Notes
2014-15 Target/Est.
2014-15 Est. Actual
2015-16 Target/Est.
Service area: Science
Average time taken to upload quality checked air quality monitoring data to the Department of Environment and Heritage Protection website that shows the air quality conditions across the state. 1 60 mins 57 mins
Discontinued measure
Percentage of clients (both government and non-government) satisfied that the various science engagement strategies (conferences, workshops, international delegations, web presence and programs) improve the profile and understanding of Queensland science and increase the opportunities for engagement, collaboration and investment. 2 80% 80%
Discontinued measure
Service area: Strategic ICT
Percentage of applications for valid GITC Head Agreements processed within five working days. 3 >80% 98.5%
Discontinued measure
Percentage of accountable action items from the Queensland Government ICT Strategy 2013-17 Action Plan completed on schedule. 4 90% 100%
Discontinued measure
Service area: Digital Production and Service
Proportion of stakeholders who are satisfied with digital economy and productivity services, consultative and engagement processes. 5 85% 92%
Discontinued measure
Service area: Arts Queensland
Level of client satisfaction with Arts Queensland’s service delivery 6,7 87% 88%
Discontinued measure
Commercial revenue as a percentage of total revenue 6,8 13% 15%
Discontinued measure
Utilisation of state owned arts and cultural facilities 6,9
4,550,000 visitors
5,342,097 visitors
Discontinued measure
2015-16 Queensland State Budget – Service Delivery Statements – Department of Science, Information Technology and Innovation
12
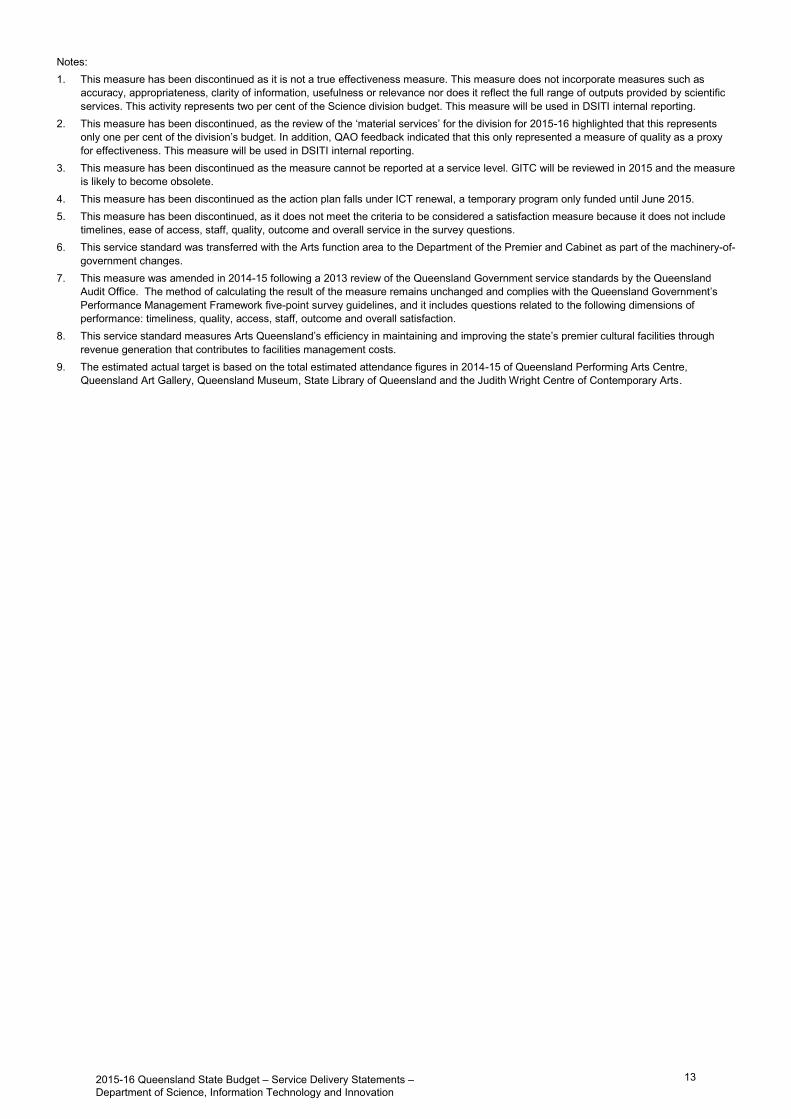
Notes: 1. This measure has been discontinued as it is not a true effectiveness measure. This measure does not incorporate measures such as
accuracy, appropriateness, clarity of information, usefulness or relevance nor does it reflect the full range of outputs provided by scientificservices. This activity represents two per cent of the Science division budget. This measure will be used in DSITI internal reporting.
2. This measure has been discontinued, as the review of the ‘material services’ for the division for 2015-16 highlighted that this representsonly one per cent of the division’s budget. In addition, QAO feedback indicated that this only represented a measure of quality as a proxyfor effectiveness. This measure will be used in DSITI internal reporting.
3. This measure has been discontinued as the measure cannot be reported at a service level. GITC will be reviewed in 2015 and the measureis likely to become obsolete.
4. This measure has been discontinued as the action plan falls under ICT renewal, a temporary program only funded until June 2015.5. This measure has been discontinued, as it does not meet the criteria to be considered a satisfaction measure because it does not include
timelines, ease of access, staff, quality, outcome and overall service in the survey questions.6. This service standard was transferred with the Arts function area to the Department of the Premier and Cabinet as part of the machinery-of-
government changes.7. This measure was amended in 2014-15 following a 2013 review of the Queensland Government service standards by the Queensland
Audit Office. The method of calculating the result of the measure remains unchanged and complies with the Queensland Government’sPerformance Management Framework five-point survey guidelines, and it includes questions related to the following dimensions ofperformance: timeliness, quality, access, staff, outcome and overall satisfaction.
8. This service standard measures Arts Queensland’s efficiency in maintaining and improving the state’s premier cultural facilities throughrevenue generation that contributes to facilities management costs.
9. The estimated actual target is based on the total estimated attendance figures in 2014-15 of Queensland Performing Arts Centre,Queensland Art Gallery, Queensland Museum, State Library of Queensland and the Judith Wright Centre of Contemporary Arts.
2015-16 Queensland State Budget – Service Delivery Statements – Department of Science, Information Technology and Innovation
13
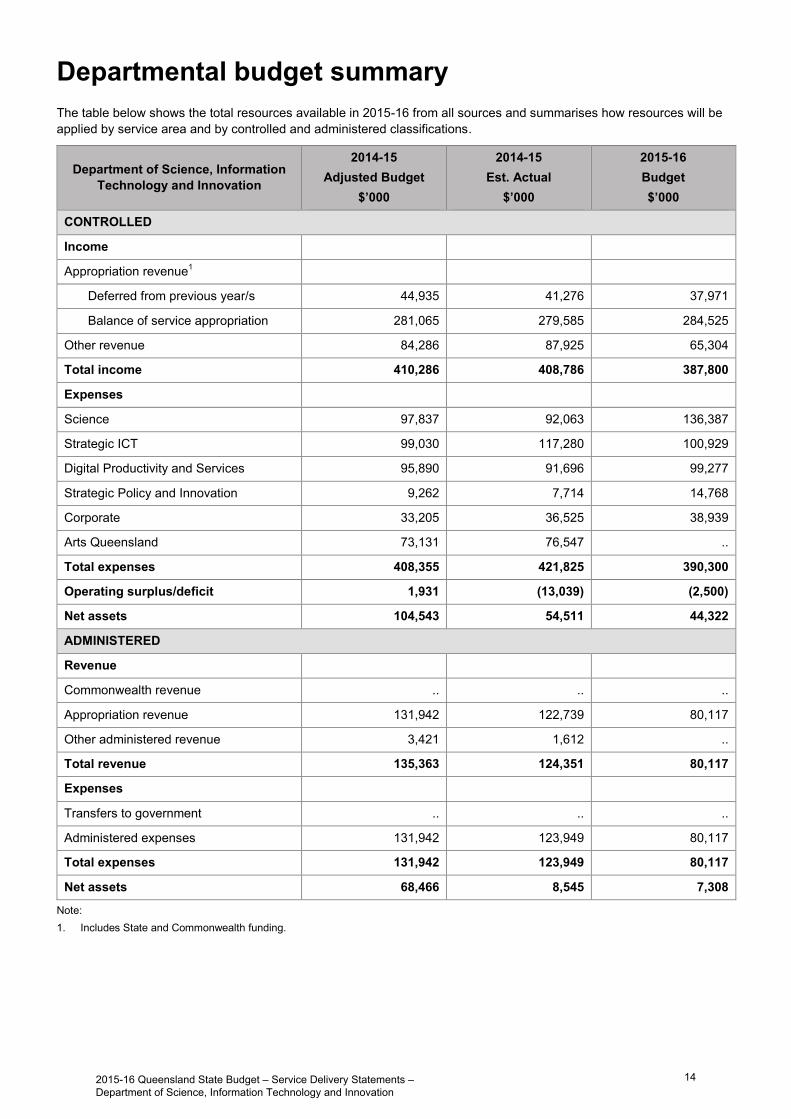
Departmental budget summary The table below shows the total resources available in 2015-16 from all sources and summarises how resources will be applied by service area and by controlled and administered classifications.
Department of Science, Information Technology and Innovation
2014-15 Adjusted Budget
$’000
2014-15 Est. Actual
$’000
2015-16 Budget $’000
CONTROLLED
Income
Appropriation revenue1
Deferred from previous year/s 44,935 41,276 37,971
Balance of service appropriation 281,065 279,585 284,525
Other revenue 84,286 87,925 65,304
Total income 410,286 408,786 387,800
Expenses
Science 97,837 92,063 136,387
Strategic ICT 99,030 117,280 100,929
Digital Productivity and Services 95,890 91,696 99,277
Strategic Policy and Innovation 9,262 7,714 14,768
Corporate 33,205 36,525 38,939
Arts Queensland 73,131 76,547 ..
Total expenses 408,355 421,825 390,300
Operating surplus/deficit 1,931 (13,039) (2,500)
Net assets 104,543 54,511 44,322
ADMINISTERED
Revenue
Commonwealth revenue .. .. ..
Appropriation revenue 131,942 122,739 80,117
Other administered revenue 3,421 1,612 ..
Total revenue 135,363 124,351 80,117
Expenses
Transfers to government .. .. ..
Administered expenses 131,942 123,949 80,117
Total expenses 131,942 123,949 80,117
Net assets 68,466 8,545 7,308
Note: 1. Includes State and Commonwealth funding.
2015-16 Queensland State Budget – Service Delivery Statements – Department of Science, Information Technology and Innovation
14
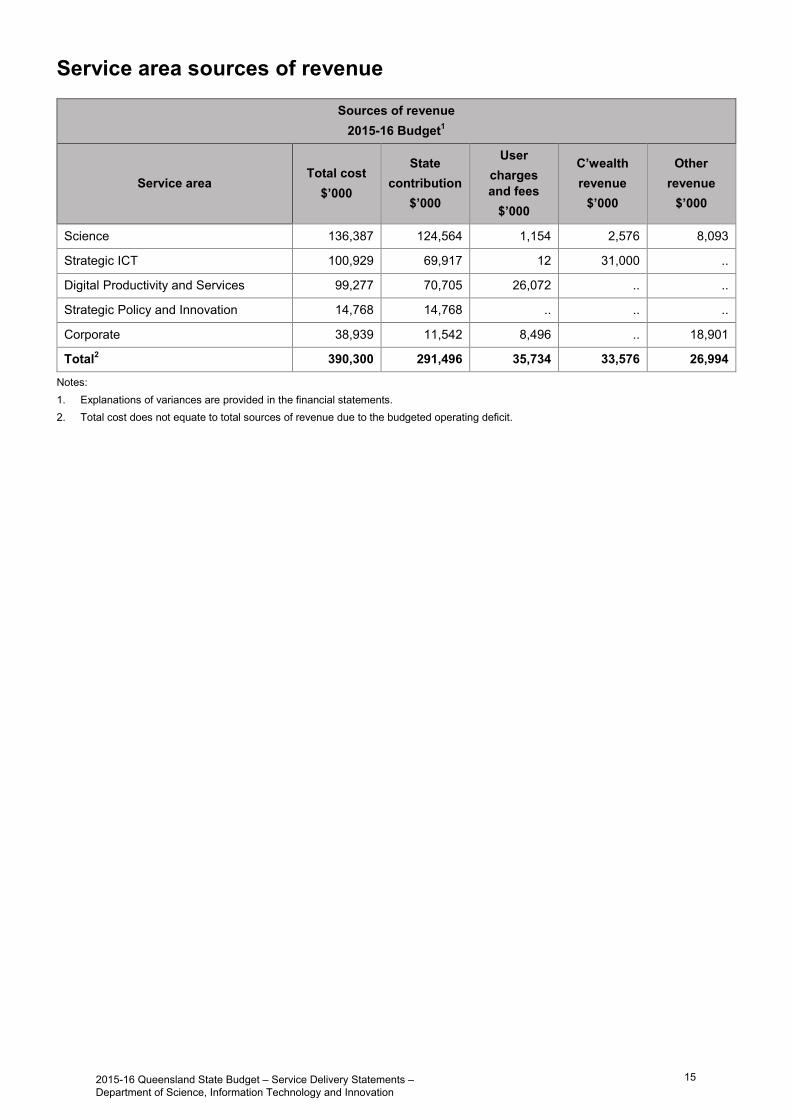
Service area sources of revenue
Sources of revenue 2015-16 Budget1
Service area Total cost
$’000
State contribution
$’000
User charges and fees
$’000
C’wealth revenue
$’000
Other revenue
$’000
Science 136,387 124,564 1,154 2,576 8,093
Strategic ICT 100,929 69,917 12 31,000 ..
Digital Productivity and Services 99,277 70,705 26,072 .. ..
Strategic Policy and Innovation 14,768 14,768 .. .. ..
Corporate 38,939 11,542 8,496 .. 18,901
Total2 390,300 291,496 35,734 33,576 26,994
Notes: 1. Explanations of variances are provided in the financial statements.2. Total cost does not equate to total sources of revenue due to the budgeted operating deficit.
2015-16 Queensland State Budget – Service Delivery Statements – Department of Science, Information Technology and Innovation
15
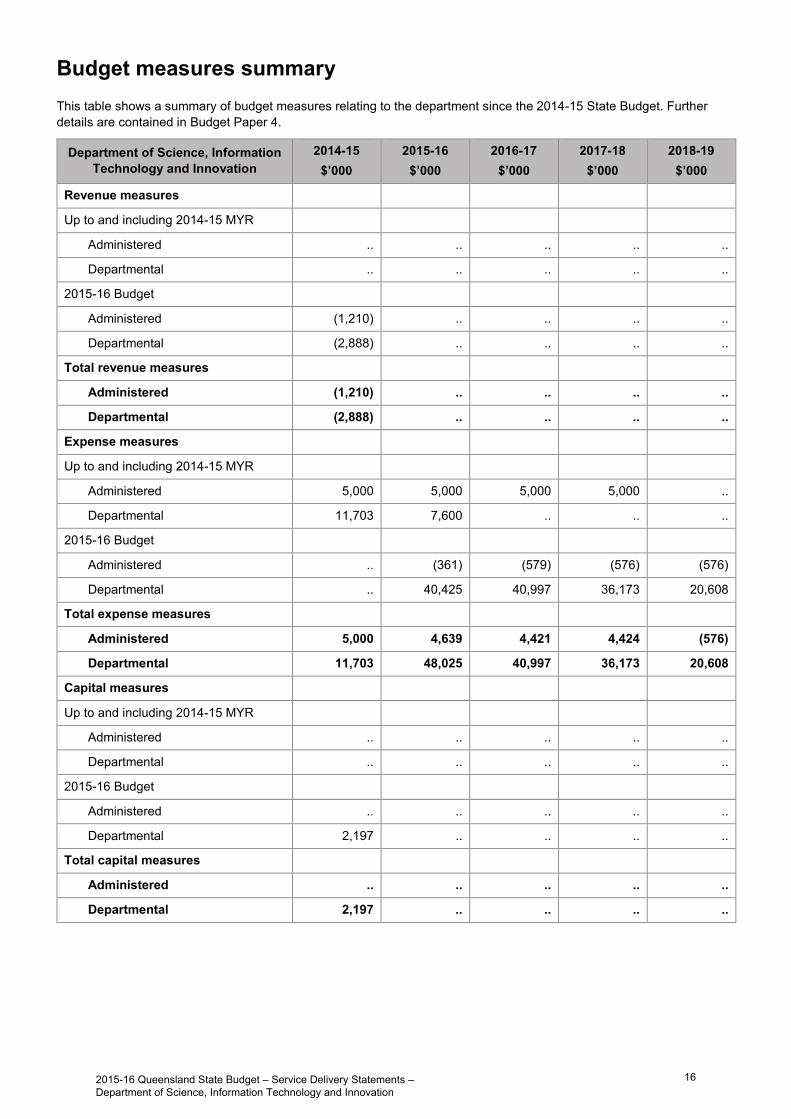
Budget measures summary This table shows a summary of budget measures relating to the department since the 2014-15 State Budget. Further details are contained in Budget Paper 4.
Department of Science, Information Technology and Innovation
2014-15 $’000
2015-16 $’000
2016-17 $’000
2017-18 $’000
2018-19 $’000
Revenue measures
Up to and including 2014-15 MYR
Administered .. .. .. .. ..
Departmental .. .. .. .. ..
2015-16 Budget
Administered (1,210) .. .. .. ..
Departmental (2,888) .. .. .. ..
Total revenue measures
Administered (1,210) .. .. .. ..
Departmental (2,888) .. .. .. ..
Expense measures
Up to and including 2014-15 MYR
Administered 5,000 5,000 5,000 5,000 ..
Departmental 11,703 7,600 .. .. ..
2015-16 Budget
Administered .. (361) (579) (576) (576)
Departmental .. 40,425 40,997 36,173 20,608
Total expense measures
Administered 5,000 4,639 4,421 4,424 (576)
Departmental 11,703 48,025 40,997 36,173 20,608
Capital measures
Up to and including 2014-15 MYR
Administered .. .. .. .. ..
Departmental .. .. .. .. ..
2015-16 Budget
Administered .. .. .. .. ..
Departmental 2,197 .. .. .. ..
Total capital measures
Administered .. .. .. .. ..
Departmental 2,197 .. .. .. ..
2015-16 Queensland State Budget – Service Delivery Statements – Department of Science, Information Technology and Innovation
16
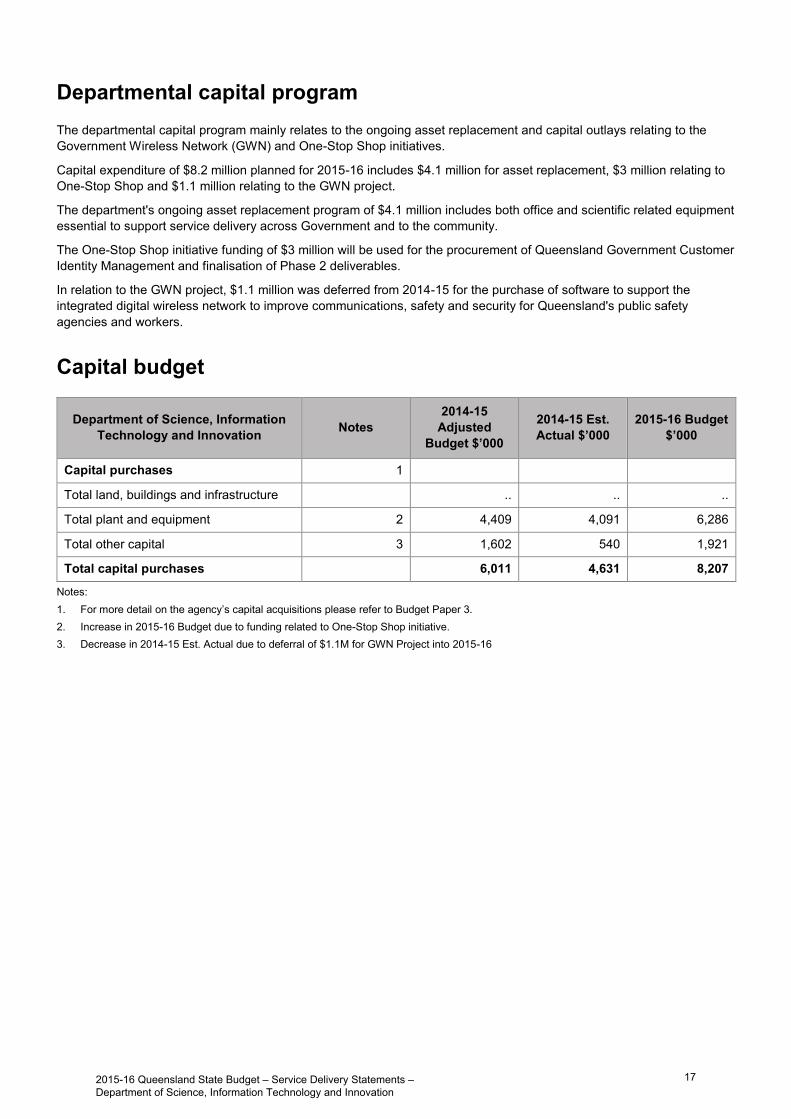
Departmental capital program The departmental capital program mainly relates to the ongoing asset replacement and capital outlays relating to the Government Wireless Network (GWN) and One-Stop Shop initiatives.
Capital expenditure of $8.2 million planned for 2015-16 includes $4.1 million for asset replacement, $3 million relating to One-Stop Shop and $1.1 million relating to the GWN project.
The department's ongoing asset replacement program of $4.1 million includes both office and scientific related equipment essential to support service delivery across Government and to the community.
The One-Stop Shop initiative funding of $3 million will be used for the procurement of Queensland Government Customer Identity Management and finalisation of Phase 2 deliverables.
In relation to the GWN project, $1.1 million was deferred from 2014-15 for the purchase of software to support the integrated digital wireless network to improve communications, safety and security for Queensland's public safety agencies and workers.
Capital budget
Department of Science, Information Technology and Innovation Notes
2014-15 Adjusted
Budget $’000
2014-15 Est. Actual $’000
2015-16 Budget $’000
Capital purchases 1
Total land, buildings and infrastructure .. .. ..
Total plant and equipment 2 4,409 4,091 6,286
Total other capital 3 1,602 540 1,921
Total capital purchases 6,011 4,631 8,207
Notes: 1. For more detail on the agency’s capital acquisitions please refer to Budget Paper 3.2. Increase in 2015-16 Budget due to funding related to One-Stop Shop initiative.3. Decrease in 2014-15 Est. Actual due to deferral of $1.1M for GWN Project into 2015-16
2015-16 Queensland State Budget – Service Delivery Statements – Department of Science, Information Technology and Innovation
17

Staffing1
Service areas Notes 2014-15
Adjusted Budget
2014-15 Est. Actual
2015-16 Budget
Science 2 407 380 384
Strategic ICT 3 103 123 131
Digital Productivity and Services 4 583 546 561
Strategic Policy and Innovation 43 43 42
Corporate 5,6 254 275 262
TOTAL 1,390 1,367 1,380
Notes: 1. FTEs as at 30 June.2. Decrease in 2014-15 Est. Actuals is mainly due to a reduction in staff delivering externally funded projects.3. Increase is due to ICT Modernisation project and transfer of resources from CITEC.4. Decrease in 2014-15 Est. Actuals is due to reduction in user charge revenue for Smart Service Queensland. Increase in 2015-16 Budget is
due to Whole of Government Digital Archiving Solution Project.5. Corporate reflects the number of FTEs engaged in providing corporate services including finance, procurement, human resource
management, information technology and communications to the department including CITEC and Queensland Shared Services.6. Increase in 2014-15 Est. Actuals due to establishing change and portfolio management capabilities within the department. Decrease in
2015-16 Budget due to finalisation of Service Delivery Renewal project.
.
2015-16 Queensland State Budget – Service Delivery Statements – Department of Science, Information Technology and Innovation
18

Chart: Total departmental expenses across the Forward Estimates period
The department's total controlled assets are expected to amount to $136.9 million at the end of 2014-15 increasing to $211.6 million by the end of 2015-16. The increase in assets is mainly due to the recognition of additional finance assets relating to the implementation of the Government Wireless Network.
The department's liabilities are estimated to be $82.4 million at the end of 2014-15 increasing to $167.3 million by the end of 2015-16. The increase in liabilities is mainly due to the recognition of additional finance leases relating to the implementation of the Government Wireless Network.
Budgeted financial statementsAnalysis of budgeted financial statementsAn analysis of the department's budgeted financial statements (excluding its statutory body, commercialised business unit and shared service provider) is provided below.
Departmental income statementTotal expenses are estimated to be $390.3 million in 2015-16, a decrease of $31.5 million from 2014-15. The decrease is mainly due to the impact of the machinery-of-Government transfer of Arts Queensland to the Department of the Premier and Cabinet in February 2015. The decrease is partially offset by funding for new initiatives of Advance Queensland and the Mobile Blackspot program.
The decrease in 2016-17 includes to the completion of Science initiatives including the Australian Institute of Tropical Health and Medicine, GWN implementation and One-Stop Shop Phase 2 initiative.
The decrease over the remaining outyears is commensurate with funding for budget measures provided to the department for initiatives such as the Advance Queensland and Mobile Blackspot program.
Departmental balance sheet
0
50,000
100,000
150,000
200,000
250,000
300,000
350,000
400,000
450,000
2014-15 2015-16 2016-17 2017-18 2018-19
$'0
00
Financial year
Total expenses
Total expenses
2015-16 Queensland State Budget – Service Delivery Statements – Department of Science, Information Technology and Innovation
19

Controlled income statementDepartment of Science, Information Technology and Innovation Notes
2014-15 Adjusted Budget
$'000
2014-15 Est. Act.
$'000
2015-16 Budget
$'000
INCOMEAppropriation revenue 326,000 320,861 322,496 Taxes .. .. .. User charges and fees 8,15 53,256 52,417 35,734 Royalties and land rents .. .. .. Grants and other contributions 1,16 10,636 13,118 10,649 Interest 2,9,17 1,931 914 .. Other revenue 3,18 18,463 21,476 18,921 Gains on sale/revaluation of assets .. .. ..
Total income 410,286 408,786 387,800 EXPENSES
Employee expenses 128,764 135,067 130,992 Supplies and services 10,19 182,755 184,650 143,703 Grants and subsidies 4,11,20 62,772 55,886 86,385 Depreciation and amortisation 5,12,21 32,733 39,947 23,914 Finance/borrowing costs 6,13,22 52 1,623 4,479 Other expenses 14,23 1,279 1,236 827 Losses on sale/revaluation of assets 7,24 .. 3,416 ..
Total expenses 408,355 421,825 390,300 OPERATING SURPLUS/(DEFICIT) 1,931 (13,039) (2,500)
2015-16 Queensland State Budget – Service Delivery Statements – Department of Science, Information Technology and Innovation
20

Controlled balance sheetDepartment of Science, Information Technology and Innovation Notes
2014-15 Adjusted Budget
$'000
2014-15 Est. Act.
$'000
2015-16 Budget
$'000
CURRENT ASSETSCash assets 2,960 2,842 2,857 Receivables 25,37 7,701 31,603 29,370 Other financial assets .. .. .. Inventories .. .. .. Other 26,38 6,968 9,022 9,022 Non financial assets held for sale .. .. ..
Total current assets 17,629 43,467 41,249 NON-CURRENT ASSETS
Receivables 27,39 36,752 .. .. Other financial assets .. .. .. Property, plant and equipment 28,40,49 62,090 82,809 158,513 Intangibles 29,41,50 12,425 9,768 10,973 Other 30,42 .. 901 901
Total non-current assets 111,267 93,478 170,387 TOTAL ASSETS 128,896 136,945 211,636 CURRENT LIABILITIES
Payables 31,43 21,320 38,936 38,936 Accrued employee benefits 32,44 2,740 3,714 3,714 Interest bearing liabilities and derivatives .. .. .. Provisions .. .. .. Other 33,45 293 803 803
Total current liabilities 24,353 43,453 43,453 NON-CURRENT LIABILITIES
Payables 34,46 .. 901 901 Accrued employee benefits .. .. .. Interest bearing liabilities and derivatives 35,47,51 .. 38,080 122,960 Provisions .. .. .. Other .. .. ..
Total non-current liabilities .. 38,981 123,861 TOTAL LIABILITIES 24,353 82,434 167,314 NET ASSETS/(LIABILITIES) 104,543 54,511 44,322 EQUITYTOTAL EQUITY 36,48,52 104,543 54,511 44,322
2015-16 Queensland State Budget – Service Delivery Statements – Department of Science, Information Technology and Innovation
21

Controlled cash flow statementDepartment of Science, Information Technology and Innovation Notes
2014-15 Adjusted Budget
$'000
2014-15 Est. Act.
$'000
2015-16 Budget
$'000
CASH FLOWS FROM OPERATING ACTIVITIESInflows:
Appropriation receipts 326,000 326,527 324,729 User charges and fees 62,76 54,578 53,739 35,734 Royalties and land rent receipts .. .. .. Grants and other contributions 53,77 10,636 13,118 10,649 Interest received .. .. .. Taxes .. .. .. Other 54,63,78 21,823 24,836 18,921
Outflows:Employee costs (128,682) (134,985) (130,992)Supplies and services 64,79 (184,183) (186,078) (143,703)Grants and subsidies 55,65,80 (62,935) (53,161) (86,385)Borrowing costs 56,66,81 (2) (1,573) (4,479)Other 67,82 (2,358) (2,315) (827)
Net cash provided by or used in operating activities 34,877 40,108 23,647 CASH FLOWS FROM INVESTING ACTIVITIESInflows:
Sales of non financial assets 17 17 16 Investments redeemed .. .. .. Loans and advances redeemed 57,68,83 5,300 38,912 ..
Outflows:Payments for non financial assets 58,69,84 (6,387) (5,007) (8,207)Payments for investments .. .. .. Loans and advances made 70,85 (1,068) (1,068) ..
Net cash provided by or used in investing activities (2,138) 32,854 (8,191)CASH FLOWS FROM FINANCING ACTIVITIESInflows:
Borrowings 71,86 1,068 1,068 .. Equity injections 59,72,87 3,076 4,783 12,207
Outflows:Borrowing redemptions 73,88 (5,275) (5,275) .. Finance lease payments 60,74,89 .. (2,009) (7,752)Equity withdrawals 61,75,90 (24,824) (67,222) (19,896)
Net cash provided by or used in financing activities (25,955) (68,655) (15,441)Net increase/(decrease) in cash held 6,784 4,307 15 Cash at the beginning of financial year 5,659 7,053 2,842
Cash transfers from restructure (9,483) (8,518) .. Cash at the end of financial year 2,960 2,842 2,857
2015-16 Queensland State Budget – Service Delivery Statements – Department of Science, Information Technology and Innovation
22
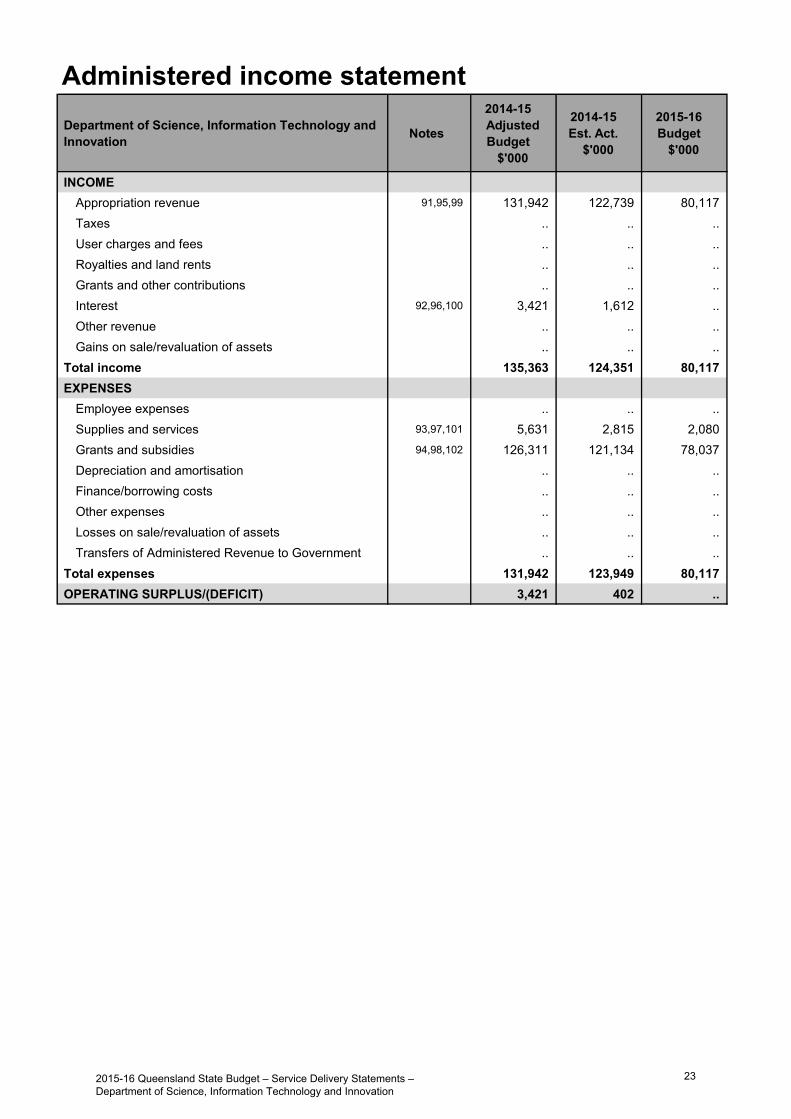
Administered income statementDepartment of Science, Information Technology and Innovation Notes
2014-15 Adjusted Budget
$'000
2014-15 Est. Act.
$'000
2015-16 Budget
$'000
INCOMEAppropriation revenue 91,95,99 131,942 122,739 80,117 Taxes .. .. .. User charges and fees .. .. .. Royalties and land rents .. .. .. Grants and other contributions .. .. .. Interest 92,96,100 3,421 1,612 .. Other revenue .. .. .. Gains on sale/revaluation of assets .. .. ..
Total income 135,363 124,351 80,117 EXPENSES
Employee expenses .. .. .. Supplies and services 93,97,101 5,631 2,815 2,080 Grants and subsidies 94,98,102 126,311 121,134 78,037 Depreciation and amortisation .. .. .. Finance/borrowing costs .. .. .. Other expenses .. .. .. Losses on sale/revaluation of assets .. .. .. Transfers of Administered Revenue to Government .. .. ..
Total expenses 131,942 123,949 80,117 OPERATING SURPLUS/(DEFICIT) 3,421 402 ..
2015-16 Queensland State Budget – Service Delivery Statements – Department of Science, Information Technology and Innovation
23

Administered balance sheetDepartment of Science, Information Technology and Innovation Notes
2014-15 Adjusted Budget
$'000
2014-15 Est. Act.
$'000
2015-16 Budget
$'000
CURRENT ASSETSCash assets 103,106,109 4,003 5,795 4,558 Receivables .. .. .. Other financial assets .. .. .. Inventories .. .. .. Other .. .. .. Non financial assets held for sale .. .. ..
Total current assets 4,003 5,795 4,558 NON-CURRENT ASSETS
Receivables 104,107 64,463 2,750 2,750 Other financial assets .. .. .. Property, plant and equipment .. .. .. Intangibles .. .. .. Other .. .. ..
Total non-current assets 64,463 2,750 2,750 TOTAL ASSETS 68,466 8,545 7,308 CURRENT LIABILITIES
Payables .. .. .. Transfers to Government payable .. .. .. Accrued employee benefits .. .. .. Interest bearing liabilities and derivatives .. .. .. Provisions .. .. .. Other .. .. ..
Total current liabilities .. .. .. NON-CURRENT LIABILITIES
Payables .. .. .. Accrued employee benefits .. .. .. Interest bearing liabilities and derivatives .. .. .. Provisions .. .. .. Other .. .. ..
Total non-current liabilities .. .. .. TOTAL LIABILITIES .. .. .. NET ASSETS/(LIABILITIES) 68,466 8,545 7,308 EQUITYTOTAL EQUITY 105,108,110 68,466 8,545 7,308
2015-16 Queensland State Budget – Service Delivery Statements – Department of Science, Information Technology and Innovation
24

Administered cash flow statementDepartment of Science, Information Technology and Innovation Notes
2014-15 Adjusted Budget
$'000
2014-15 Est. Act.
$'000
2015-16 Budget
$'000
CASH FLOWS FROM OPERATING ACTIVITIESInflows:
Appropriation receipts 111,117,120 131,942 122,739 80,117 User charges and fees 112,121 .. 4,200 .. Royalties and land rent receipts .. .. .. Grants and other contributions .. .. .. Interest received .. .. .. Taxes .. .. .. Other .. .. ..
Outflows:Employee costs .. .. .. Supplies and services 113,118,122 (5,631) (2,954) (2,080)Grants and subsidies 114,119,123 (126,311) (119,924) (78,037)Borrowing costs .. .. .. Other .. .. .. Transfers to Government .. .. ..
Net cash provided by or used in operating activities .. 4,061 .. CASH FLOWS FROM INVESTING ACTIVITIESInflows:
Sales of non financial assets .. .. .. Investments redeemed .. .. .. Loans and advances redeemed 115,124 150 56,577 ..
Outflows:Payments for non financial assets .. .. .. Payments for investments .. .. .. Loans and advances made .. .. ..
Net cash provided by or used in investing activities 150 56,577 .. CASH FLOWS FROM FINANCING ACTIVITIESInflows:
Borrowings .. .. .. Equity injections 125 7,906 8,198 7,255
Outflows:Borrowing redemptions .. .. .. Finance lease payments .. .. .. Equity withdrawals 116,126 (8,056) (64,775) (8,492)
Net cash provided by or used in financing activities (150) (56,577) (1,237)Net increase/(decrease) in cash held .. 4,061 (1,237)Cash at the beginning of financial year 4,003 1,734 5,795
Cash transfers from restructure .. .. .. Cash at the end of financial year 4,003 5,795 4,558
2015-16 Queensland State Budget – Service Delivery Statements – Department of Science, Information Technology and Innovation
25

Income statementMajor variations between 2014-15 Adjusted Budget and 2014-15 Estimated Actual include:
1. Increase mainly due to higher than expected grant funding received for science projects.
2. Decrease relates to early repayment of Innovation Building Fund loans in 2014-15.
3. Increase relates to contributions from Queensland Shared Services (QSS) and CITEC towards whole of department activities.
4. Decrease mainly due to deferral of science grants in line with contractual commitments.
5. Increase mainly due to higher than anticipated amortisation relating to the Government Wireless Network (GWN) finance asset.
6. Increase reflects GWN finance lease costs.
7. Increase due to write off of work in progress.
Major variations between 2014-15 Adjusted Budget and 2015-16 Budget include:
8. Decrease mainly due to machinery-of-Government transfer of Arts Queensland to Department of the Premier and Cabinet in February 2015.
9. Decrease relates to early repayment of Innovation Building Fund loans in 2014-15.
10. Decrease mainly due to machinery-of-Government transfer of Arts Queensland to Department of the Premier and Cabinet in February 2015 and lower managed service payments for the GWN.
11. Increase due to Advance Queensland funding partially offset by machinery-of-Government transfer of Arts Queensland to Department of the Premier and Cabinet in February 2015.
12. Decrease mainly due to machinery-of-Government transfer of Arts Queensland to Department of the Premier and Cabinet in February 2015 partially offset by higher than anticipated amortisation relating to the GWN finance asset.
13. Increase reflect full year cost of GWN finance lease.
14. Decrease mainly due to machinery-of-Government transfer of Arts Queensland to Department of the Premier and Cabinet in February 2015.
Major variations between 2014-15 Estimated Actual and the 2015-16 Budget include:
15. Decrease mainly due to machinery-of-Government transfer of Arts Queensland to Department of the Premier and Cabinet in February 2015.
16. Decrease mainly due to a forecast reduction in grant funding received for science projects.
17. Decrease relates to early repayment of Innovation Building Fund loans in 2014-15.
18. Decrease due to reduction in contributions from QSS and CITEC towards whole of department activities.
19. Decrease mainly due to machinery-of-Government transfer of Arts Queensland to Department of the Premier and Cabinet in February 2015 and lower managed service payments for the GWN.
20. Increase due to Advance Queensland funding offset by machinery-of-Government transfer of Arts Queensland to Department of the Premier and Cabinet in February 2015.
21. Decrease mainly due to machinery-of-Government transfer of Arts Queensland to Department of the Premier and Cabinet in February 2015.
22. Increase reflects GWN finance lease costs.
23. Decrease mainly due to machinery-of-Government transfer of Arts Queensland to Department of the Premier and Cabinet in February 2015.
24. Decrease reflects write off of work in progress in 2014-15.
Explanation of variances in the financial statements
2015-16 Queensland State Budget – Service Delivery Statements – Department of Science, Information Technology and Innovation
26

Balance sheetMajor variations between 2014-15 Adjusted Budget and 2014-15 Estimated Actual include:
25. Increase mainly relates to intra-departmental recoveries from QSS and CITEC and recoveries relating to the annual leave central scheme.
26. Increase due to the prepayment associated with whole of government ICT contracts.
27. Decrease relates to early repayment of Innovation Building Fund loans in 2014-15.
28. Increase mainly relates to the finance asset for the G20 component of the GWN.
29. Decrease relates to deferral of software purchase associated with GWN project to 2015-16 together with amortisation on internally generated systems within Smart Service Queensland.
30. Increase reflects recognition of lease incentives associated with Smart Service Queensland.
31. Increase mainly due to the accrual of managed service payments relating to the GWN.
32. Increase is due to the timing of salary and wages payments.
33. Increase is mainly due to unearned revenue for services yet to be delivered.
34. Increase due to lease incentive liability associated with Smart Service Queensland.
35. Increase mainly relates to the finance lease for the G20 component of the GWN.
36. Decrease mainly due to early repayment of Innovation Building Fund loans in 2014-15 and the 2014-15 operating deficit.
Major variations between 2014-15 Adjusted Budget and 2015-16 Budget include:
37. Increase mainly relates to intra-departmental recoveries from QSS and CITEC and recoveries relating to the annual leave central scheme.
38. Increase due to the prepayment associated with whole of government ICT contracts.
39. Decrease relates to early repayment of Innovation Building Fund loans in 2014-15.
40. Increase mainly relates to the finance asset for the G20 and SEQ component of the GWN.
41. Decrease relates to amortisation on internally generated systems within Smart Service Queensland partially offset by deferral of software purchases associated with GWN into 2015-16.
42. Increase reflects recognition of lease incentives associated with Smart Service Queensland.
43. Increase mainly due to the accrual of managed service payments relating to the GWN.
44. Increase is due to the timing of salary and wages payments.
45. Increase is mainly due to unearned revenue for services yet to be delivered.
46. Increase due to lease incentive liability associated with Smart Service Queensland.
47. Increase mainly relates to the finance lease for G20 and SEQ component of the GWN.
48. Decrease mainly due to early repayment of Innovation Building Fund loans in 2014-15 and the 2014-15 operating deficit.
Major variations between 2014-15 Estimated Actual and the 2015-16 Budget include:
49. Increase mainly relates to the recognition of finance asset for SEQ component of the GWN.
50. Increase relates to software associated with GWN project.
51. Increase mainly relates to recognition of the finance lease for SEQ component of the GWN.
52. Decrease mainly due to return of depreciation funding to Consolidated Fund.
Cash flow statementMajor variations between 2014-15 Adjusted Budget and 2014-15 Estimated Actual include:
53. Increase mainly due to higher than expected grant funding received for science projects.
54. Increase due to contributions from QSS and CITEC towards whole of department activities.
55. Decrease mainly due to deferral of science grants in line with contractual commitments.
2015-16 Queensland State Budget – Service Delivery Statements – Department of Science, Information Technology and Innovation
27

56. Increase reflects GWN finance lease costs for the G20 component.
57. Increase mainly due to early repayment of Innovation Building Fund loans in 2014-15.
58. Decrease relates to deferral of software purchase associated with GWN project into 2015-16 and amortisation on internally generated systems within Smart Service Queensland.
59. Increase mainly due to One-Stop Shop Service Outlets and GWN Managed Service Payment to reflect G20 finance lease.
60. Increase mainly relates to the finance asset for the G20 component of the GWN.
61. Increase relates to the early repayment of Innovation Building Fund loans in 2014-15 and adjustment to depreciation of finance asset for the G20 component of the GWN.
Major variations between 2014-15 Adjusted Budget and 2015-16 Budget include:
62. Decrease mainly due to machinery-of-Government transfer of Arts Queensland to Department of the Premier and Cabinet in February 2015.
63. Decrease due to reduction in contributions from QSS and CITEC towards whole of department activities.
64. Decrease mainly due to machinery-of-Government transfer of Arts Queensland to Department of the Premier and Cabinet in February 2015 and lower managed service payments for the GWN.
65. Increase due to Advance Queensland funding offset by machinery-of-Government transfer of Arts Queensland to Department of the Premier and Cabinet in February 2015.
66. Increase reflects GWN finance lease costs for the SEQ component.
67. Decrease mainly due to machinery-of-Government transfer of Arts Queensland to Department of the Premier and Cabinet in February 2015.
68. Decrease relates to early repayment of Innovation Building Fund loans in 2014-15.
69. Increase relates to deferral of software purchase associated with GWN project and asset purchases for One-Stop Shop into 2015-16.
70. Decrease due to machinery-of-Government transfer of Arts Queensland to Department of the Premier and Cabinet in February 2015.
71. Decrease due to machinery-of-Government transfer of Arts Queensland to Department of the Premier and Cabinet in February 2015.
72. Increase mainly due to change in the GWN Managed Service Payment to reflect the SEQ finance lease starting in 2015-16.
73. Decrease mainly due to no planned QTC borrowing in 2015-16.
74. Increase mainly relates to the finance asset for the G20 and SEQ components of the GWN.
75. Decrease relates to an adjustment to the finance asset for the G20 component of the GWN.
Major variations between 2014-15 Estimated Actual and the 2015-16 Budget include:
76. Decrease mainly due to machinery-of-Government transfer of Arts Queensland to Department of the Premier and Cabinet in February 2015.
77. Decrease mainly due to a forecast reduction in grant funding received for science projects.
78. Decrease due to reduction in contributions from QSS and CITEC towards whole of department activities.
79. Decrease mainly due to machinery-of-Government transfer of Arts Queensland to Department of the Premier and Cabinet in February 2015 and lower managed service payments for the GWN.
80. Increase due to Advance Queensland funding offset by machinery-of-Government transfer of Arts Queensland to Department of the Premier and Cabinet in February 2015.
81. Increase reflects GWN finance lease costs for the G20 and SEQ components.
82. Decrease mainly due to machinery-of-Government transfer of Arts Queensland to Department of the Premier and Cabinet in February 2015.
83. Decrease relates to early repayment of Innovation Building Fund loans in 2014-15.
84. Increase relates to deferral of software purchase associated with GWN project into 2015-16.
85. Decrease due to machinery-of-Government transfer of Arts Queensland to Department of the Premier and Cabinet in February 2015.
2015-16 Queensland State Budget – Service Delivery Statements – Department of Science, Information Technology and Innovation
28
86. Decrease due to machinery-of-Government transfer of Arts Queensland to Department of the Premier and Cabinet in February 2015.
87. Increase mainly due to change in the GWN Managed Service Payment to reflect the SEQ finance lease starting in 2015-16.
88. Decrease mainly due to no planned QTC borrowing in 2015-16.
89. Increase mainly relates to the finance asset for the SEQ component of the GWN.
90. Decrease relates to the early repayment of Innovation Building Fund loans in 2014-15, machinery-of-Government transfer of Arts Queensland to Department of the Premier and Cabinet in February 2015 and GWN SEQ leased asset adjustment.
Administered income statementMajor variations between 2014-15 Adjusted Budget and 2014-15 Estimated Actual include:
91. Decrease mainly due to QSS deferrals, a reduction in subsidy to account for payroll tax exemption for QSS and the transfer of Chief Technology Officer funding and functions to the Department from CITEC.
92. Decrease relates to early repayment of Smart State Research Fund loans in 2014-15.
93. Decrease mainly due to the transfer of Chief Technology Officer funding and functions to the Department from CITEC.
94. Decrease mainly due to QSS deferrals, a reduction in subsidy to account for payroll tax exemption for QSS and the transfer of Chief Technology Officer funding and functions to the Department from CITEC.
Major variations between 2014-15 Adjusted Budget and 2015-16 Budget include:
95. Decrease mainly due to machinery-of-Government transfer of Arts statutory bodies to Department of the Premier and Cabinet in February 2015.
96. Decrease relates to early repayment of Smart State Research Fund loans in 2014-15.
97. Decrease mainly due to the transfer of Chief Technology Officer funding and functions to the Department from CITEC and a reduction in subsidies to QSS.
98. Decrease mainly due to machinery-of-Government transfer of Arts statutory bodies to Department of the Premier and Cabinet in February 2015.
Major variations between 2014-15 Estimated Actual and the 2015-16 Budget include:
99. Decrease mainly due to machinery-of-Government transfer of Arts statutory bodies to Department of the Premier and Cabinet in February 2015 offset by deferrals relating to QSS.
100. Decrease relates to early repayment of Smart State Research Fund loans in 2014-15.
101. Decrease mainly due to a reduction in subsidies to QSS.
102. Decrease mainly due to machinery-of-Government transfer of Arts statutory bodies to Department of the Premier and Cabinet in February 2015 offset by deferrals relating to QSS.
Administered balance sheetMajor variations between 2014-15 Adjusted Budget and 2014-15 Estimated Actual include:
103. Increase mainly due to repayment of Queensland Centre for Advanced Technology (QCAT) loans to be remitted to Consolidated Fund.
104. Decrease relates to early repayment of Smart State Research Fund loans in 2014-15.
105. Decrease mainly due to early repayment of Smart State Research Fund loans in 2014-15.
Major variations between 2014-15 Adjusted Budget and 2015-16 Budget include:
106. Increase mainly due to repayment of QCAT loans to be remitted to Consolidated Fund.
107. Decrease relates to early repayment of Smart State Research Fund loans in 2014-15.
108. Decrease mainly due to early repayment of Smart State Research Fund loans in 2014-15.
2015-16 Queensland State Budget – Service Delivery Statements – Department of Science, Information Technology and Innovation
29

Major variations between 2014-15 Estimated Actual and the 2015-16 Budget include:
109. Decrease mainly due to transfer of cash to Consolidated Fund.
110. Decrease mainly due to transfer of cash to Consolidated Fund.
Administered cash flow statementMajor variations between 2014-15 Adjusted Budget and 2014-15 Estimated Actual include:
111. Decrease mainly due to QSS deferrals, a reduction in subsidy to account for payroll tax exemption for QSS and the transfer of Chief Technology Officer funding and functions to the Department from CITEC.
112. Increase due to payment of receivable raised at the end of the prior financial year.
113. Decrease mainly due to the transfer of Chief Technology Officer funding and functions to the Department from CITEC.
114. Decrease mainly due to QSS deferrals, a reduction in subsidy to account for payroll tax exemption for QSS and the transfer of Chief Technology Officer funding and functions to the Department from CITEC.
115. Increase relates to early repayment of Smart State Research Fund loans in 2014-15.
116. Increase mainly due to early repayment of Smart State Research Fund loans.
Major variations between 2014-15 Adjusted Budget and 2015-16 Budget include:
117. Decrease mainly due to machinery-of-Government transfer of Arts statutory bodies to Department of the Premier and Cabinet in February 2015.
118. Decrease mainly due to the transfer of Chief Technology Officer funding and functions to the Department from CITEC and a reduction in subsidies to QSS.
119. Decrease mainly due to machinery-of-Government transfer of Arts statutory bodies to Department of the Premier and Cabinet in February 2015.
Major variations between 2014-15 Estimated Actual and the 2015-16 Budget include:
120. Decrease mainly due to machinery-of-Government transfer of Arts statutory bodies to Department of the Premier and Cabinet in February 2015 offset by deferrals relating to QSS.
121. Decrease due to reduction in receivables.
122. Decrease mainly due to a reduction in subsidies to QSS.
123. Decrease mainly due to machinery-of-Government transfer of Arts statutory bodies to Department of the Premier and Cabinet in February 2015 offset by deferrals relating to QSS.
124. Decrease relates to early repayment of Smart State Research Fund loans in 2014-15.
125. Decrease is due CITEC's ICTC loan being fully repaid in 2014-15 offset by an increase in amortisation on QSS systems.
126. Decrease mainly due to early repayment of Smart State Research Fund loans in 2014-15.
2015-16 Queensland State Budget – Service Delivery Statements – Department of Science, Information Technology and Innovation
30

Reporting Entity Financial StatementsReporting Entity comprises: • Department of Science, Information Technology and Innovation (excluding Administered); • Corporate Administration Agency; • CITEC; • Queensland Shared Services.
Reporting entity income statementDepartment of Science, Information Technology and Innovation Notes
2014-15 Adjusted Budget
$'000
2014-15 Est. Act.
$'000
2015-16 Budget
$'000
INCOMEAppropriation revenue 326,000 320,861 322,496 Taxes .. .. .. User charges and fees 338,082 334,682 280,124 Royalties and land rents .. .. .. Grants and other contributions 28,217 18,731 26,904 Interest 2,195 1,248 369 Other revenue 1,138 6,688 4,094 Gains on sale/revaluation of assets .. .. ..
Total income 695,632 682,210 633,987 EXPENSES
Employee expenses 267,023 268,711 260,452 Supplies and services 321,523 310,665 261,590 Grants and subsidies 62,717 55,886 86,385 Depreciation and amortisation 44,449 53,264 34,359 Finance/borrowing costs 338 1,930 4,602 Other expenses 3,428 3,577 3,049 Losses on sale/revaluation of assets 8 3,416 ..
Total expenses 699,486 697,449 650,437 Income tax expense/revenue (1,786) .. ..
OPERATING SURPLUS/(DEFICIT) (2,068) (15,239) (16,450)
2015-16 Queensland State Budget – Service Delivery Statements – Department of Science, Information Technology and Innovation
31
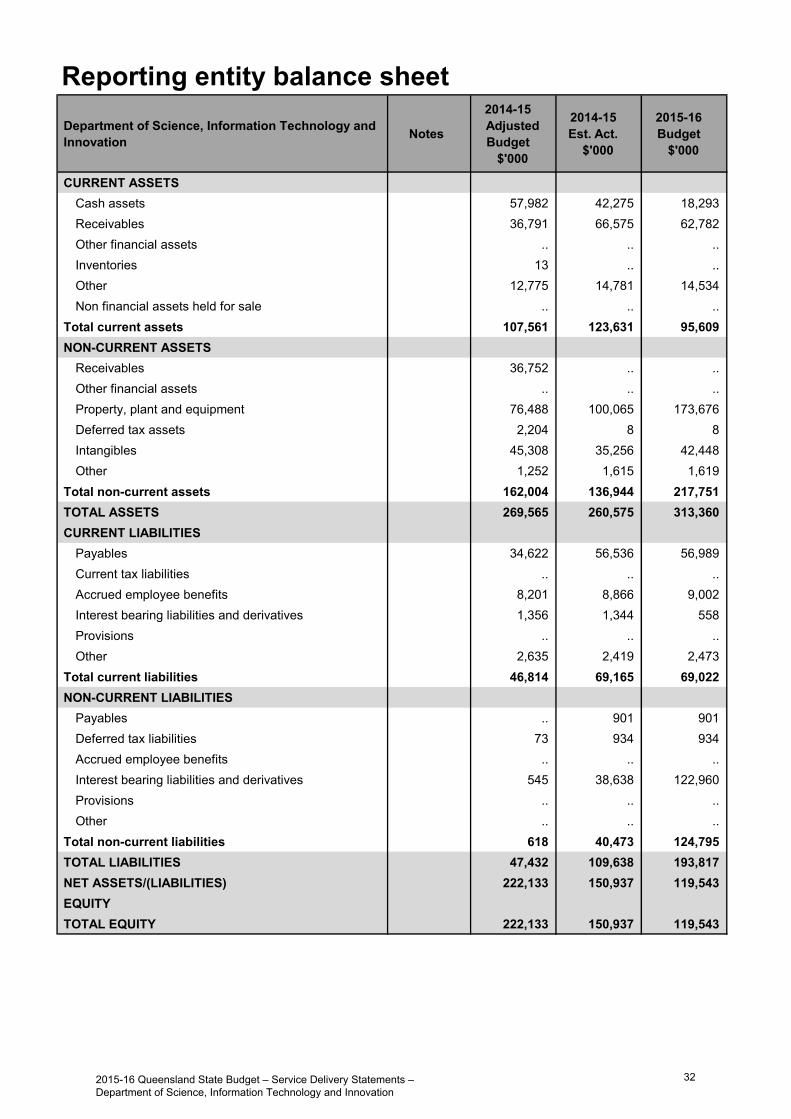
Reporting entity balance sheetDepartment of Science, Information Technology and Innovation Notes
2014-15 Adjusted Budget
$'000
2014-15 Est. Act.
$'000
2015-16 Budget
$'000
CURRENT ASSETSCash assets 57,982 42,275 18,293 Receivables 36,791 66,575 62,782 Other financial assets .. .. .. Inventories 13 .. .. Other 12,775 14,781 14,534 Non financial assets held for sale .. .. ..
Total current assets 107,561 123,631 95,609 NON-CURRENT ASSETS
Receivables 36,752 .. .. Other financial assets .. .. .. Property, plant and equipment 76,488 100,065 173,676 Deferred tax assets 2,204 8 8 Intangibles 45,308 35,256 42,448 Other 1,252 1,615 1,619
Total non-current assets 162,004 136,944 217,751 TOTAL ASSETS 269,565 260,575 313,360 CURRENT LIABILITIES
Payables 34,622 56,536 56,989 Current tax liabilities .. .. .. Accrued employee benefits 8,201 8,866 9,002 Interest bearing liabilities and derivatives 1,356 1,344 558 Provisions .. .. .. Other 2,635 2,419 2,473
Total current liabilities 46,814 69,165 69,022 NON-CURRENT LIABILITIES
Payables .. 901 901 Deferred tax liabilities 73 934 934 Accrued employee benefits .. .. .. Interest bearing liabilities and derivatives 545 38,638 122,960 Provisions .. .. .. Other .. .. ..
Total non-current liabilities 618 40,473 124,795 TOTAL LIABILITIES 47,432 109,638 193,817 NET ASSETS/(LIABILITIES) 222,133 150,937 119,543 EQUITYTOTAL EQUITY 222,133 150,937 119,543
2015-16 Queensland State Budget – Service Delivery Statements – Department of Science, Information Technology and Innovation
32

Reporting entity cash flow statementDepartment of Science, Information Technology and Innovation Notes
2014-15 Adjusted Budget
$'000
2014-15 Est. Act.
$'000
2015-16 Budget
$'000
CASH FLOWS FROM OPERATING ACTIVITIESInflows:
Appropriation receipts 326,000 326,527 324,729 User charges and fees 371,396 364,679 309,676 Royalties and land rent receipts .. .. .. Grants and other contributions 28,217 18,731 26,904 Interest received 261 331 369 Taxes .. .. .. Other 18,187 25,004 17,521
Outflows:Employee costs (266,204) (268,645) (260,367)Supplies and services (336,235) (333,167) (274,450)Grants and subsidies (62,880) (53,161) (86,385)Borrowing costs (288) (1,880) (4,602)Taxation equivalents paid .. .. .. Other (37,124) (34,380) (30,807)
Net cash provided by or used in operating activities 41,330 44,039 22,588 CASH FLOWS FROM INVESTING ACTIVITIESInflows:
Sales of non financial assets 17 17 16 Investments redeemed .. .. .. Loans and advances redeemed 5,300 38,912 ..
Outflows:Payments for non financial assets (11,091) (8,369) (22,546)Payments for investments .. .. .. Loans and advances made (1,068) (1,068) ..
Net cash provided by or used in investing activities (6,842) 29,492 (22,530)CASH FLOWS FROM FINANCING ACTIVITIESInflows:
Borrowings 1,068 1,068 .. Equity injections 8,533 20,240 12,207
Outflows:Borrowing redemptions (11,848) (11,848) (1,344)Finance lease payments .. (2,009) (7,752)Equity withdrawals (27,273) (106,509) (27,151)Dividends paid .. .. ..
Net cash provided by or used in financing activities (29,520) (99,058) (24,040)Net increase/(decrease) in cash held 4,968 (25,527) (23,982)Cash at the beginning of financial year 64,740 79,173 42,275
Cash transfers from restructure (11,726) (11,371) .. Cash at the end of financial year 57,982 42,275 18,293
2015-16 Queensland State Budget – Service Delivery Statements – Department of Science, Information Technology and Innovation
33
Commercialised business unit
CITEC
Overview CITEC is a key supplier to the Queensland Government for ICT services, and acts as the primary information broker for Queensland Government delivering information solutions to businesses, government and individuals Australia-wide on a fully commercial basis.
CITEC ICT runs two secure data centres on behalf of Government, which provide highly resilient infrastructure for government systems. CITEC also runs a secure government network that allows government departments to exchange information easily and securely.
CITEC Information Brokerage provides a number of protected, unique and commercial information services to the legal, banking, insurance and commercial sector Australia-wide in relation to property, vehicle, Police and Courts (legal documents) information.
CITEC uses “Earnings Before Interest and Tax, less Depreciation and Amortisation” (EBITDA) as its key financial performance measure to indicate operational performance.
Service performance Over the past two years, CITEC has implemented a business and financial transformation that resulted in a $34.6 million financial turnaround for the business. These transformation activities generated lower costs on a number of CITEC services including data storage and protection; mainframe upgrades that provided clients with up to 30 per cent in technology efficiency gains; and development of an Infrastructure-as-a-Service (iCloud) product that provides improvements and savings for departments.
During 2014-15, CITEC continued to perform better than the 2014-15 published budget primarily due to reduction of technology costs and slower than anticipated reductions in revenue. For 2015-16, CITEC is forecasting an operating deficit for the financial year with a negative EBITDA. This is primarily due to projected declines in revenues compared to 2014-15 as a result of market trends and market uncertainty around CITEC's future.
In 2014-15, CITEC achieved a number of key objectives including the establishment of robust whole-of-government internet services providing the government’s prime line of defence against cyber-attack during the G20; and successfully providing continued uninterrupted service to front-line Queensland Government services.
The decision that CITEC will remain a Queensland Government owned information and communication technology provider will mean that in 2015-16, CITEC will continue to transition to the most appropriate business model to ensure efficiency, sustainability and continued delivery of excellent services that meet the needs of agencies and clients.
2015-16 Queensland State Budget – Service Delivery Statements – Department of Science, Information Technology and Innovation
34

Service performance
Performance statement
CITEC
Service area objective
To deliver effective and innovative ICT services to Queensland Government departments and statutory bodies, and to deliver similar services, on a commercial basis, to customers in business and the community.
Service area description
CITEC delivers consolidated ICT infrastructure services for the Queensland Government, covering data centre, network, storage, data protection, and ICT platform and solution integration services. CITEC also delivers information solutions to customers in business and the community Australia-wide on a fully commercial basis.
Services
CITEC ICT: provides whole-of-government and agency-specific ICT services that contribute to the Government'sfrontline service-delivery priorities.
CITEC Information Brokerage: enables accessibility to services for consumers, enhancing the efficiency of theirbusiness processes, and making information services available.
CITEC Notes 2014-15
Target/Est. 2014-15
Est. Actual 2015-16
Target/Est.
Service area: CITEC
Service: CITEC ICT
Service standards Effectiveness measure
CITEC ICT Customer satisfaction 1 New measure New measure 65%
Efficiency measure
CITEC ICT EBITDA 2 New measure New measure ($6.199M)
Service: CITEC Information Brokerage
Service standards Effectiveness measure
CITEC Information Brokerage Customer Satisfaction 3 New measure New measure >80%
Efficiency measure
CITEC Information Brokerage EBITDA 4 New measure New measure ($0.778M)
Notes: 1. This is a new measure of effectiveness covering overall satisfaction. It meets the criteria for customer satisfaction surveys. CITEC ICT
customer satisfaction will be benchmarked in 2014-15 and it will be measured on an annual basis.2. As of 2 June 2014, CITEC has created two separate entities: CITEC ICT and Information Brokerage. Full financial reporting separation was
achieved from 1 July 2014. For 2015-16 CITEC ICT is forecasting a negative EBITDA result due to reduced funding for the ChiefTechnology Office, lower agency demand and a reduction in commercial revenues. There will also be an increase in costs due to the re-negotiated contracts for the IBM Mainframe and EMC Storage Solution.
2015-16 Queensland State Budget – Service Delivery Statements – Department of Science, Information Technology and Innovation
35

3. Previous CITEC Customer satisfaction surveys covered only Information Brokerage. The measure of effectiveness is reinstated as newand CITEC will continue to benchmark Information Brokerage customer satisfaction on an annual basis. The customer survey provides anoverall customer satisfaction and meets the criteria for customer surveys.
4. This is a new measure of efficiency due to the separation of CITEC ICT and Information Brokerage as of 2 June 2014. Full financialreporting separation was achieved from 1 July 2014. The target is based on the budgeted financials as directed by Treasury. For 2015-16,CITEC Information Brokerage is forecasting a negative EBITDA result due to the exiting of key clients as a result of the uncertaintycreated by the former Government’s potential divestment and competitors aggressively targeting its customers.
2015-16 Queensland State Budget – Service Delivery Statements – Department of Science, Information Technology and Innovation
36

Staffing1
CITEC Notes 2014-15
Adjusted Budget
2014-15 Est. Actual
2015-16 Budget
Information Brokerage 36 36 36
CITEC ICT 2 345 310 310
TOTAL 381 346 346
Notes: 1. FTEs as at 30 June.2. The decrease in FTEs for CITEC ICT is due to workforce rationalisation and the transfer of procurement and legal functions to the
Department and payroll disbursements function to QSS during 2014-15.
2015-16 Queensland State Budget – Service Delivery Statements – Department of Science, Information Technology and Innovation
37

Discontinued measures Performance measures included in the 2014-15 Service Delivery Statements that have been discontinued or replaced are reported in the following table with estimated actual results. For those measures which are being discontinued from the Service Delivery Statement because they do not demonstrate the effectiveness or efficiency of services, please refer to the Notes below for further information about where these measures will continue to be reported.
CITEC Notes 2014-15
Target/Est. 2014-15
Est. Actual 2015-16
Target/Est.
Service area: CITEC
CITEC EBITDA 1, 2 $2.673M $7.337M Discontinued measure
Notes: 1. This measure has been discontinued as it is now split between CITEC ICT and CITEC Information Brokerage.2. CITEC's 2014-15 Est. Actual is better than the Approved Budget primarily due to reduction of technology costs through negotiation of new
contracts, slower than anticipated reduction of revenue from Queensland Government agencies, and reduction in FTE compared to theSDS.
2015-16 Queensland State Budget – Service Delivery Statements – Department of Science, Information Technology and Innovation
38

Income statement
CITEC Notes2014-15 Budget
$'000
2014-15 Est. Act.
$'000
2015-16 Budget
$'000
INCOMEUser charges and fees 5,12 160,895 157,949 133,053 Grants and other contributions .. .. .. Interest 264 334 369 Other revenue .. .. .. Gains on sale/revaluation of assets .. .. ..
Total income 161,159 158,283 133,422 EXPENSES
Employee expenses 6 45,323 43,419 42,025 Supplies and services 1,7,13 112,262 106,512 96,951 Grants and subsidies .. .. .. Depreciation and amortisation 2,8,14 8,617 9,398 7,222 Finance/borrowing costs 9,15 286 307 123 Other expenses 3,10 617 1,016 1,051 Losses on sale/revaluation of assets 8 .. ..
Total expenses 167,113 160,652 147,372 Income tax expense/revenue 4,11 (1,786) .. ..
OPERATING SURPLUS/(DEFICIT) (4,168) (2,369) (13,950)
2015-16 Queensland State Budget – Service Delivery Statements – Department of Science, Information Technology and Innovation
39
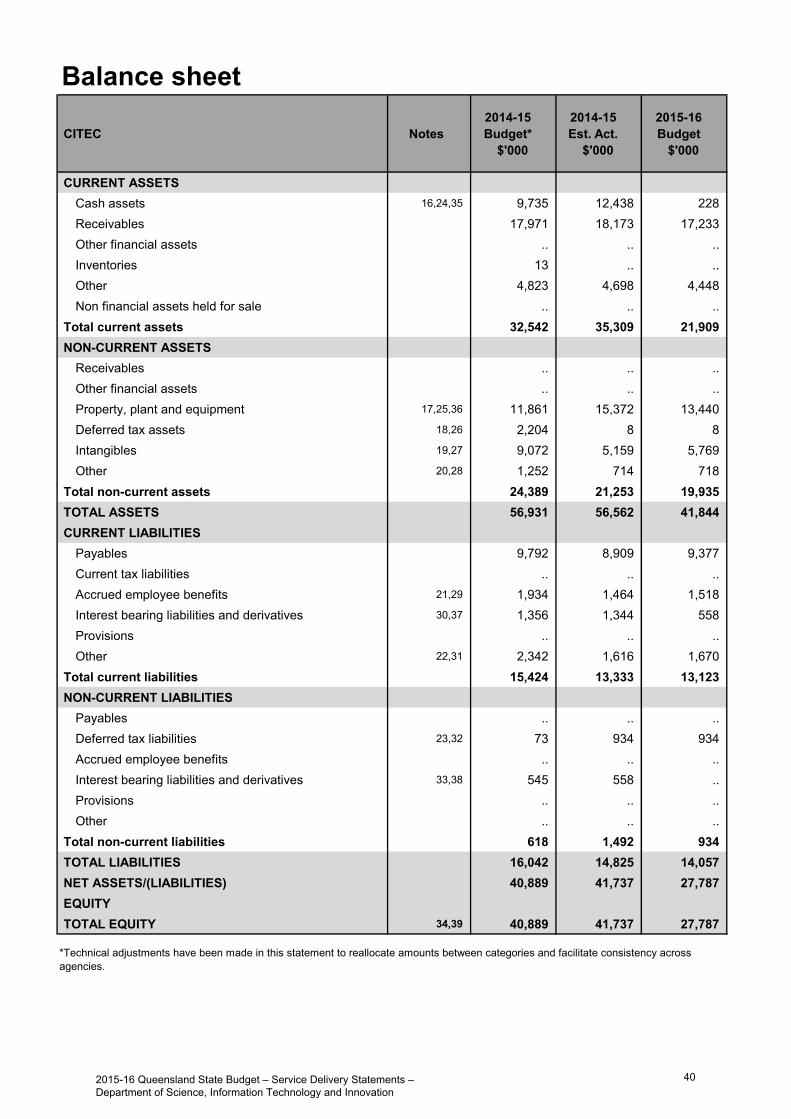
Balance sheet
CITEC Notes2014-15 Budget*
$'000
2014-15 Est. Act.
$'000
2015-16 Budget
$'000
CURRENT ASSETSCash assets 16,24,35 9,735 12,438 228 Receivables 17,971 18,173 17,233 Other financial assets .. .. .. Inventories 13 .. .. Other 4,823 4,698 4,448 Non financial assets held for sale .. .. ..
Total current assets 32,542 35,309 21,909 NON-CURRENT ASSETS
Receivables .. .. .. Other financial assets .. .. .. Property, plant and equipment 17,25,36 11,861 15,372 13,440 Deferred tax assets 18,26 2,204 8 8 Intangibles 19,27 9,072 5,159 5,769 Other 20,28 1,252 714 718
Total non-current assets 24,389 21,253 19,935 TOTAL ASSETS 56,931 56,562 41,844 CURRENT LIABILITIES
Payables 9,792 8,909 9,377 Current tax liabilities .. .. .. Accrued employee benefits 21,29 1,934 1,464 1,518 Interest bearing liabilities and derivatives 30,37 1,356 1,344 558 Provisions .. .. .. Other 22,31 2,342 1,616 1,670
Total current liabilities 15,424 13,333 13,123 NON-CURRENT LIABILITIES
Payables .. .. .. Deferred tax liabilities 23,32 73 934 934 Accrued employee benefits .. .. .. Interest bearing liabilities and derivatives 33,38 545 558 .. Provisions .. .. .. Other .. .. ..
Total non-current liabilities 618 1,492 934 TOTAL LIABILITIES 16,042 14,825 14,057 NET ASSETS/(LIABILITIES) 40,889 41,737 27,787 EQUITYTOTAL EQUITY 34,39 40,889 41,737 27,787
*Technical adjustments have been made in this statement to reallocate amounts between categories and facilitate consistency across agencies.
2015-16 Queensland State Budget – Service Delivery Statements – Department of Science, Information Technology and Innovation
40
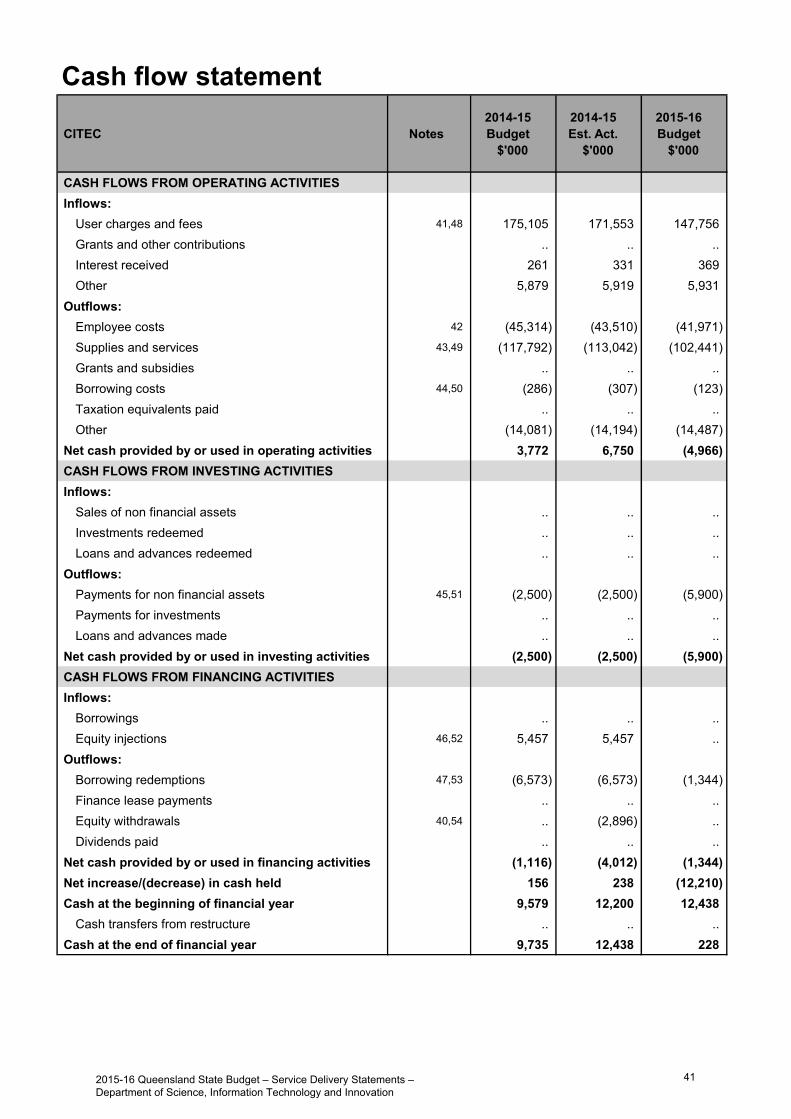
Cash flow statement
CITEC Notes2014-15 Budget
$'000
2014-15 Est. Act.
$'000
2015-16 Budget
$'000
CASH FLOWS FROM OPERATING ACTIVITIESInflows:
User charges and fees 41,48 175,105 171,553 147,756 Grants and other contributions .. .. .. Interest received 261 331 369 Other 5,879 5,919 5,931
Outflows:Employee costs 42 (45,314) (43,510) (41,971)Supplies and services 43,49 (117,792) (113,042) (102,441)Grants and subsidies .. .. .. Borrowing costs 44,50 (286) (307) (123)Taxation equivalents paid .. .. .. Other (14,081) (14,194) (14,487)
Net cash provided by or used in operating activities 3,772 6,750 (4,966)CASH FLOWS FROM INVESTING ACTIVITIESInflows:
Sales of non financial assets .. .. .. Investments redeemed .. .. .. Loans and advances redeemed .. .. ..
Outflows:Payments for non financial assets 45,51 (2,500) (2,500) (5,900)Payments for investments .. .. .. Loans and advances made .. .. ..
Net cash provided by or used in investing activities (2,500) (2,500) (5,900)CASH FLOWS FROM FINANCING ACTIVITIESInflows:
Borrowings .. .. .. Equity injections 46,52 5,457 5,457 ..
Outflows:Borrowing redemptions 47,53 (6,573) (6,573) (1,344)Finance lease payments .. .. .. Equity withdrawals 40,54 .. (2,896) .. Dividends paid .. .. ..
Net cash provided by or used in financing activities (1,116) (4,012) (1,344)Net increase/(decrease) in cash held 156 238 (12,210)Cash at the beginning of financial year 9,579 12,200 12,438
Cash transfers from restructure .. .. .. Cash at the end of financial year 9,735 12,438 228
2015-16 Queensland State Budget – Service Delivery Statements – Department of Science, Information Technology and Innovation
41
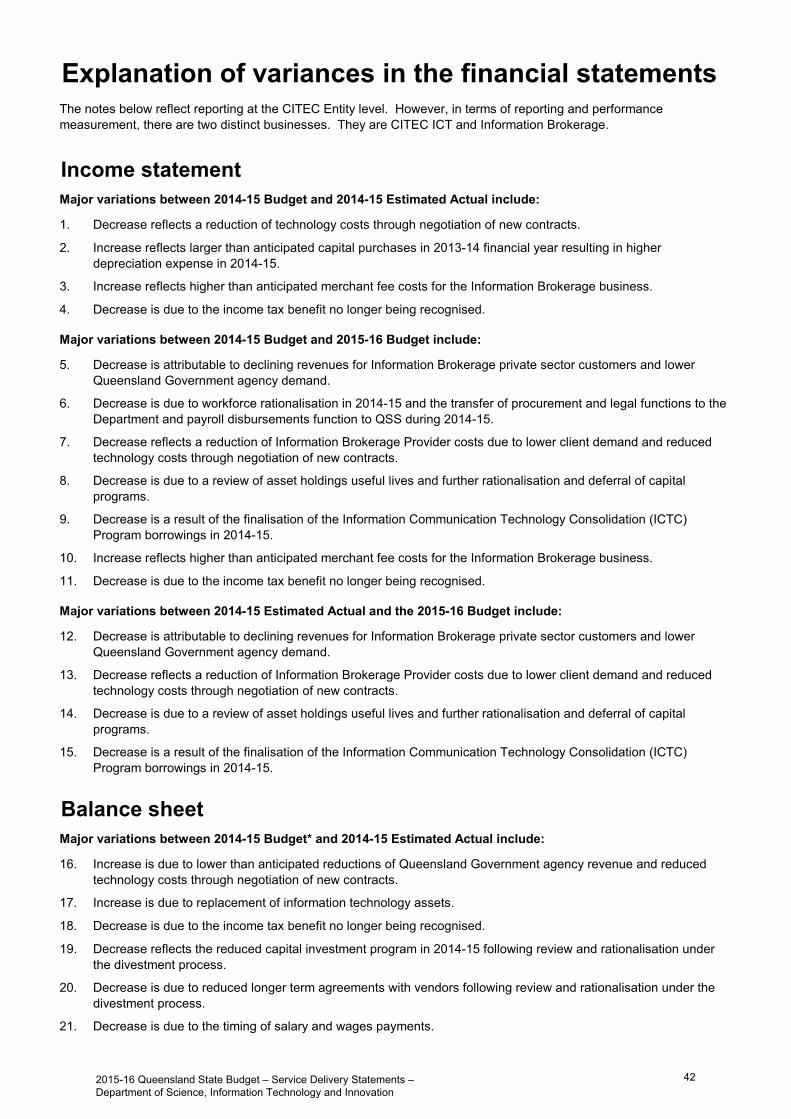
Income statementMajor variations between 2014-15 Budget and 2014-15 Estimated Actual include:
1. Decrease reflects a reduction of technology costs through negotiation of new contracts.
2. Increase reflects larger than anticipated capital purchases in 2013-14 financial year resulting in higherdepreciation expense in 2014-15.
3. Increase reflects higher than anticipated merchant fee costs for the Information Brokerage business.
4. Decrease is due to the income tax benefit no longer being recognised.
Major variations between 2014-15 Budget and 2015-16 Budget include:
5. Decrease is attributable to declining revenues for Information Brokerage private sector customers and lowerQueensland Government agency demand.
6. Decrease is due to workforce rationalisation in 2014-15 and the transfer of procurement and legal functions to theDepartment and payroll disbursements function to QSS during 2014-15.
7. Decrease reflects a reduction of Information Brokerage Provider costs due to lower client demand and reducedtechnology costs through negotiation of new contracts.
8. Decrease is due to a review of asset holdings useful lives and further rationalisation and deferral of capitalprograms.
9. Decrease is a result of the finalisation of the Information Communication Technology Consolidation (ICTC)Program borrowings in 2014-15.
10. Increase reflects higher than anticipated merchant fee costs for the Information Brokerage business.
11. Decrease is due to the income tax benefit no longer being recognised.
Major variations between 2014-15 Estimated Actual and the 2015-16 Budget include:
12. Decrease is attributable to declining revenues for Information Brokerage private sector customers and lowerQueensland Government agency demand.
13. Decrease reflects a reduction of Information Brokerage Provider costs due to lower client demand and reducedtechnology costs through negotiation of new contracts.
14. Decrease is due to a review of asset holdings useful lives and further rationalisation and deferral of capitalprograms.
15. Decrease is a result of the finalisation of the Information Communication Technology Consolidation (ICTC)Program borrowings in 2014-15.
Balance sheetMajor variations between 2014-15 Budget* and 2014-15 Estimated Actual include:
16. Increase is due to lower than anticipated reductions of Queensland Government agency revenue and reducedtechnology costs through negotiation of new contracts.
17. Increase is due to replacement of information technology assets.
18. Decrease is due to the income tax benefit no longer being recognised.
19. Decrease reflects the reduced capital investment program in 2014-15 following review and rationalisation underthe divestment process.
20. Decrease is due to reduced longer term agreements with vendors following review and rationalisation under thedivestment process.
21. Decrease is due to the timing of salary and wages payments.
Explanation of variances in the financial statementsThe notes below reflect reporting at the CITEC Entity level. However, in terms of reporting and performance measurement, there are two distinct businesses. They are CITEC ICT and Information Brokerage.
2015-16 Queensland State Budget – Service Delivery Statements – Department of Science, Information Technology and Innovation
42
22. Decrease reflects a lower level of unearned revenue due to reduced advanced billing to Queensland Governmentagencies.
23. Increase is mainly due to the tax effect of the temporary differences relating to assets.
Major variations between 2014-15 Budget* and 2015-16 Budget include:
24. Decrease reflects CITEC's decline in operating performance and an increased capital program in 2015-16.
25. Increase is due to replacement of information technology assets.
26. Decrease is due to the income tax benefit no longer being recognised.
27. Decrease reflects the reduced capital investment program in 2014-15 following review and rationalisation underthe divestment process.
28. Decrease is due to reduced longer term agreements with vendors following review and rationalisation under thedivestment process.
29. Decrease is due to the timing of salary and wages payments.
30. Decrease reflects expected repayment of loan debt and reduced borrowing requirements in respect to CITEC'sinternal ICT capital program.
31. Decrease reflects a lower level of unearned revenue due to reduced advance billing to Queensland Governmentagencies.
32. Increase is mainly due to the tax effect of the temporary differences relating to assets.
33. Decrease reflects expected repayment of loan debt and reduced borrowing requirements in respect to CITEC'sinternal ICT capital program.
34. Decrease reflects CITEC's decline in operating performance.
Major variations between 2014-15 Estimated Actual and the 2015-16 Budget include:
35. Decrease reflects CITEC's decline in operating performance and an increased capital program in 2015-16.
36. Decrease is due to a review of asset holdings useful lives, further rationalisation of information technology assetsand a reduced capital program.
37. Decrease reflects expected repayment of loan debt and reduced borrowing requirements in respect to CITEC'sinternal ICT capital program.
38. Decrease reflects expected repayment of loan debt and reduced borrowing requirements in respect to CITEC'sinternal ICT capital program.
39. Decrease reflects CITEC's decline in operating performance.
Cash flow statementMajor variations between 2014-15 Budget and 2014-15 Estimated Actual include:
40. Increase is due to an equity withdrawal from CITEC to the Department for unfunded divestment costs incurred in2013-14 and 2014-15.
Major variations between 2014-15 Budget and 2015-16 Budget include:
41. Decrease is attributable to declining revenues for Information Brokerage private sector customers and lowerQueensland Government agency demand.
42. Decrease is due to workforce rationalisation in 2014-15 and the transfer of procurement and legal functions to theDepartment and payroll disbursements function to QSS during 2014-15.
43. Decrease reflects a reduction of Information Brokerage Provider costs due to lower client demand and reducedtechnology costs through negotiation of new contracts.
44. Decrease is a result of the finalisation of the Information Communication Technology Consolidation (ICTC)Program borrowings in 2014-15.
45. Increase reflects the larger capital investment program in 2015-16, which includes provision for a refresh of theInformation Brokerage legacy software asset.
46. Decrease is a result of the finalisation of the Information Communication Technology Consolidation (ICTC)Program borrowings in 2014-15.
2015-16 Queensland State Budget – Service Delivery Statements – Department of Science, Information Technology and Innovation
43

47. Decrease reflects expected repayment of loan debt and reduced borrowing requirements in respect to CITEC'sinternal ICT capital program.
Major variations between 2014-15 Estimated Actual and the 2015-16 Budget include:
48. Decrease is attributable to declining revenues for Information Brokerage private sector customers and lowerQueensland Government agency demand.
49. Decrease reflects a reduction of Information Brokerage Provider costs due to lower client demand and reducedtechnology costs through negotiation of new contracts.
50. Decrease is a result of the finalisation of the Information Communication Technology Consolidation (ICTC)Program borrowings in 2014-15.
51. Increase reflects the larger capital investment program in 2015-16, which includes provision for a refresh of theInformation Brokerage legacy software asset.
52. Decrease is a result of the finalisation of the Information Communication Technology Consolidation (ICTC)Program borrowings in 2014-15.
53. Decrease reflects expected repayment of loan debt and reduced borrowing requirements in respect to CITEC'sinternal ICT capital program.
54. Decrease is due to an equity withdrawal from CITEC to the Department for unfunded divestment costs incurred in2013-14 and 2014-15.
2015-16 Queensland State Budget – Service Delivery Statements – Department of Science, Information Technology and Innovation
44
Shared service provider
Queensland Shared Services
Overview Queensland Shared Services supports government agencies to get on with their business by ensuring they have access to modern, value for money corporate services and trusted advice. Queensland Shared Services delivers a range of corporate support services including transactional activities, consultancy and advice, service integration and coordination, knowledge brokerage and quality assurance on a fee for service basis. Through our current business transformation program we are growing into a modern, progressive business, underpinned by a philosophy of operational excellence.
Service performance In 2014-15, Queensland Shared Services:
managed fortnightly payroll for 67,000 staff across 24 agencies provided financial transactions and advisory services for agencies including over 500,000 accounts payable
transactions.Queensland Shared Services is currently undertaking an ambitious business transformation agenda to overhaul the way it delivers products and services, modernise the underpinning systems, provide greater opportunity for automation and self-service; and significantly improve productivity and efficiency. Achievements include: commenced upgrade of those agencies' finance systems on out of support SAP version 4.6C to a standard SAP
ECC5 environment transitioned all agencies on at risk SAP4.6C payroll systems to the fully supported Aurion Version 10 platform commenced a pilot to support the move to digital mail implemented new forms and processes to automate financial processes and enhance self-service in payroll practices introduced tools and practices to improve productivity and performance.
In 2015-16, Queensland Shared Services will continue the business transformation agenda, including ongoing work to:
transition remaining out-of-support payroll systems to a modern supported environment with standardised processes. automate payroll processes with greater self-service for employees and managers. reduce transaction costs in the finance area with automation and e-forms. undertake finance system upgrades to achieve modern, in-support and standardised environments.
2015-16 Queensland State Budget – Service Delivery Statements – Department of Science, Information Technology and Innovation
45

Service performance
Performance statement
Queensland Shared Services
Service area objective
To provide modern, value for money corporate services and trusted advice to other government departments and statutory bodies to enable them to meet government policies and objectives.
Service area description
Queensland Shared Services facilitates a range of corporate services including finance, human resource (HR) management and mail support services to government departments and statutory bodies, excluding Queensland Health and the Department of Education and Training.
Services
HR Services: delivery of payroll and human resource advisory services to customers. These services include payroll,recruitment, senior executive service and workforce services.
Finance Services: delivery of a range of finance transactional and advisory services to customers. These servicesinclude accounts payable, corporate card, operational procurement, accounts receivable, debt administration, assets,general ledger and reporting including bank reconciliations, taxation, and telecommunications.
Performance statement
Queensland Shared Services Notes 2014-15
Target/Est. 2014-15
Est. Actual 2015-16
Target/Est.
Service area: Queensland Shared Services
Service: HR Services
Service standards Effectiveness measure
Percentage of HR Services delivered within Service Level Agreement standards 1 New measure New measure 95%
Efficiency measure
Number of pays processed per FTE per fortnight 2 New measure New measure 350
Service: Finance Services
Service standards Effectiveness measure
Percentage of Finance Services delivered within Service Level Agreement standards 3 New measure New measure 95%
2015-16 Queensland State Budget – Service Delivery Statements – Department of Science, Information Technology and Innovation
46

Queensland Shared Services Notes 2014-15
Target/Est. 2014-15
Est. Actual 2015-16
Target/Est.
Efficiency measure
Number of accounts payable transactions processed per FTE per annum 4 New measure New measure 7,500
Notes: 1. New measure consistent with the HR service group measurement. This measure was previously reported at Queensland Shared Services
level. 2. This new measure of efficiency is an indicator of the productivity of the FTEs at the HR service group level.3. New measure of effectiveness consistent with the Finance service group measurement. This measure was previously reported at
Queensland Shared Services level.4. This new measure of efficiency is an indicator of the productivity of the FTEs at Finance service group level.
2015-16 Queensland State Budget – Service Delivery Statements – Department of Science, Information Technology and Innovation
47

Staffing1
Queensland Shared Services Notes 2014-15
Adjusted Budget
2014-15 Est. Actual
2015-16 Budget
Queensland Shared Services 2 1,090 1,031 1,031
Notes: 1. FTEs as at 30 June.2. Reductions due to the former Government’s voluntary redundancies, natural attrition and increased efficiencies due to automation and
process improvements.
2015-16 Queensland State Budget – Service Delivery Statements – Department of Science, Information Technology and Innovation
48

Discontinued measures
Queensland Shared Services Notes 2014-15
Target/Est. 2014-15
Est. Actual 2015-116
Target/Est.
Service area: Queensland Shared Services
Labour as a percentage of total QSS costs 1 56% 53%
Discontinued measure
Overheads as a percentage of total QSS costs 1 <10% 9.5%
Discontinued measure
Percentage of client services delivery within budget and within agreed timeframes (time and cost) 2 95% 98%
Discontinued measure
Client satisfaction 3 ≥80% 48% Discontinued measure
Notes: 1. These two measures were previously reported at divisional level (Queensland Shared Services) and not at service level so they are no
longer considered useful measures.2. This measure was replaced by similar measures for HR services and Finance services (e.g. Percentage of HR services delivered within
service level agreement standards).3. The customer satisfaction measure is reported at QSS level and reflects overall customer satisfaction. This service standard cannot be
broken down into HR services and Finance services as it will not be considered meaningful to the organisation and there will be nocontinuity. This measure will continue to be reported in the annual report.
2015-16 Queensland State Budget – Service Delivery Statements – Department of Science, Information Technology and Innovation
49
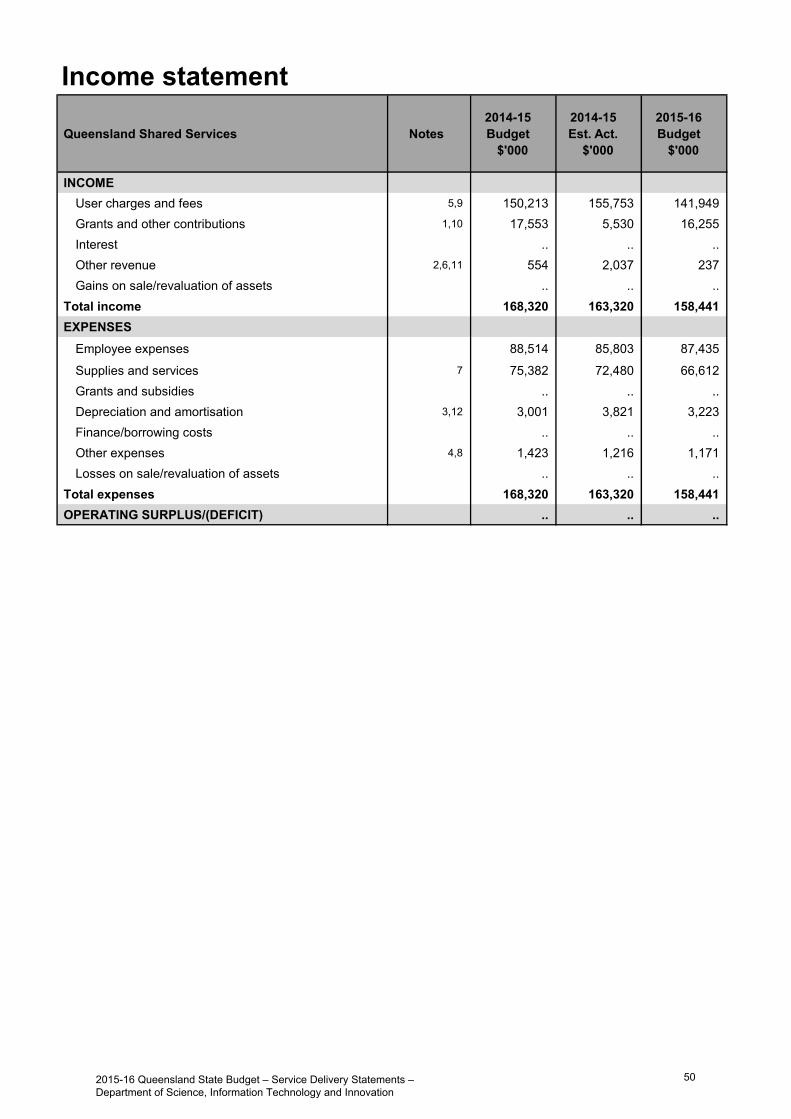
Income statement
Queensland Shared Services Notes2014-15 Budget
$'000
2014-15 Est. Act.
$'000
2015-16 Budget
$'000
INCOMEUser charges and fees 5,9 150,213 155,753 141,949 Grants and other contributions 1,10 17,553 5,530 16,255 Interest .. .. .. Other revenue 2,6,11 554 2,037 237 Gains on sale/revaluation of assets .. .. ..
Total income 168,320 163,320 158,441 EXPENSES
Employee expenses 88,514 85,803 87,435
Supplies and services 7 75,382 72,480 66,612 Grants and subsidies .. .. .. Depreciation and amortisation 3,12 3,001 3,821 3,223 Finance/borrowing costs .. .. .. Other expenses 4,8 1,423 1,216 1,171 Losses on sale/revaluation of assets .. .. ..
Total expenses 168,320 163,320 158,441 OPERATING SURPLUS/(DEFICIT) .. .. ..
2015-16 Queensland State Budget – Service Delivery Statements – Department of Science, Information Technology and Innovation
50

Balance sheet
Queensland Shared Services Notes2014-15 Budget
$'000
2014-15 Est. Act.
$'000
2015-16 Budget
$'000
CURRENT ASSETSCash assets 13,17,20 45,287 26,995 15,208 Receivables 17,128 16,799 16,179 Other financial assets .. .. .. Inventories .. .. .. Other 984 1,061 1,064 Non financial assets held for sale .. .. ..
Total current assets 63,399 44,855 32,451 NON-CURRENT ASSETS
Receivables .. .. .. Other financial assets .. .. .. Property, plant and equipment 14,18 2,537 1,884 1,723 Intangibles 15,21 23,811 20,329 25,706 Other .. .. ..
Total non-current assets 26,348 22,213 27,429 TOTAL ASSETS 89,747 67,068 59,880 CURRENT LIABILITIES
Payables 9,519 8,691 8,676 Accrued employee benefits 3,527 3,688 3,770 Interest bearing liabilities and derivatives .. .. .. Provisions .. .. .. Other .. .. ..
Total current liabilities 13,046 12,379 12,446 NON-CURRENT LIABILITIES
Payables .. .. .. Accrued employee benefits .. .. .. Interest bearing liabilities and derivatives .. .. .. Provisions .. .. .. Other .. .. ..
Total non-current liabilities .. .. .. TOTAL LIABILITIES 13,046 12,379 12,446 NET ASSETS/(LIABILITIES) 76,701 54,689 47,434 EQUITYTOTAL EQUITY 16,19,22 76,701 54,689 47,434
2015-16 Queensland State Budget – Service Delivery Statements – Department of Science, Information Technology and Innovation
51
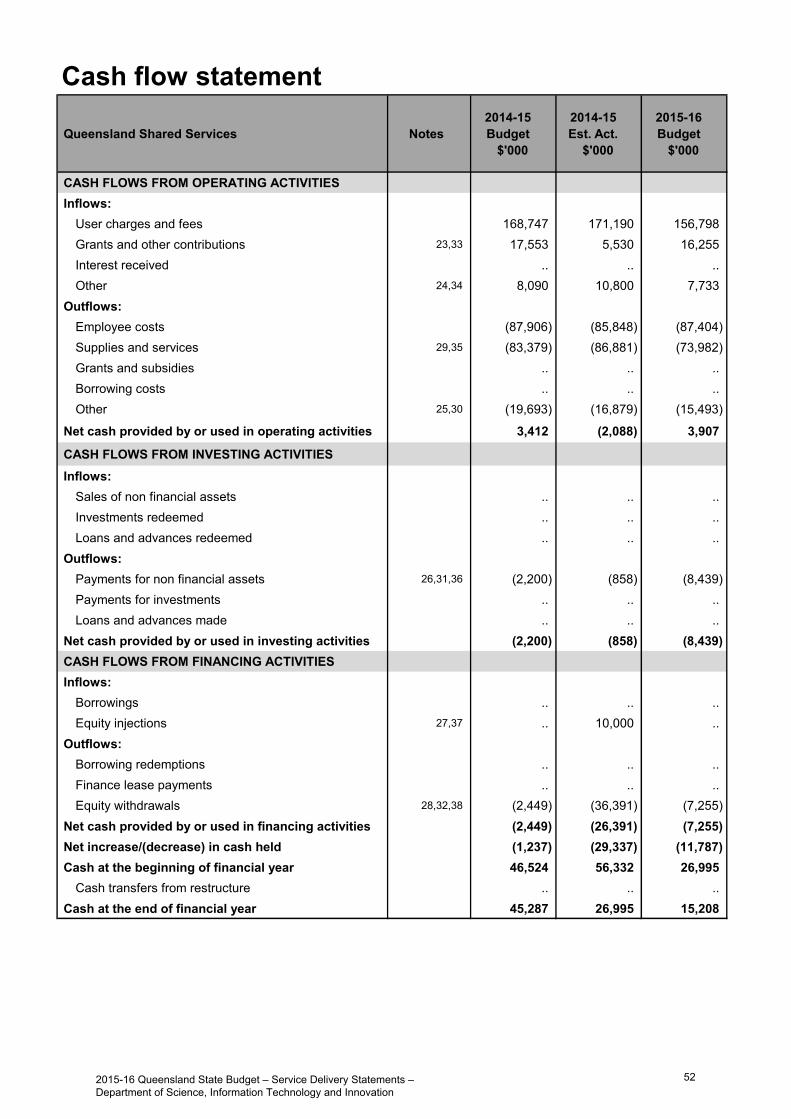
Cash flow statement
Queensland Shared Services Notes2014-15 Budget
$'000
2014-15 Est. Act.
$'000
2015-16 Budget
$'000
CASH FLOWS FROM OPERATING ACTIVITIESInflows:
User charges and fees 168,747 171,190 156,798 Grants and other contributions 23,33 17,553 5,530 16,255 Interest received .. .. .. Other 24,34 8,090 10,800 7,733
Outflows:Employee costs (87,906) (85,848) (87,404)Supplies and services 29,35 (83,379) (86,881) (73,982)Grants and subsidies .. .. .. Borrowing costs .. .. .. Other 25,30 (19,693) (16,879) (15,493)
Net cash provided by or used in operating activities 3,412 (2,088) 3,907
CASH FLOWS FROM INVESTING ACTIVITIESInflows:
Sales of non financial assets .. .. .. Investments redeemed .. .. .. Loans and advances redeemed .. .. ..
Outflows:Payments for non financial assets 26,31,36 (2,200) (858) (8,439)Payments for investments .. .. .. Loans and advances made .. .. ..
Net cash provided by or used in investing activities (2,200) (858) (8,439)CASH FLOWS FROM FINANCING ACTIVITIESInflows:
Borrowings .. .. .. Equity injections 27,37 .. 10,000 ..
Outflows:Borrowing redemptions .. .. .. Finance lease payments .. .. .. Equity withdrawals 28,32,38 (2,449) (36,391) (7,255)
Net cash provided by or used in financing activities (2,449) (26,391) (7,255)Net increase/(decrease) in cash held (1,237) (29,337) (11,787)Cash at the beginning of financial year 46,524 56,332 26,995
Cash transfers from restructure .. .. .. Cash at the end of financial year 45,287 26,995 15,208
2015-16 Queensland State Budget – Service Delivery Statements – Department of Science, Information Technology and Innovation
52
Income statementMajor variations between 2014-15 Budget and 2014-15 Estimated Actual include:
1. Decrease is due to funding deferrals relating to business capability and capacity projects and Shared SystemsReform program of work.
2. Increase is due to recoveries for software licences paid on behalf of other agencies.
3. Increase is mainly due to leasehold improvements accelerated depreciation and capitalisation of systems costs.
4. Decrease relates to audit fees.
Major variations between 2014-15 Budget and 2015-16 Budget include:
5. Decrease is mainly due to transfer of responsibility for the Whole-of-Government SAP contract to the departmentand volume reductions due to service efficiencies.
6. Decrease relates to supplies and services subsidies.
7. Decrease is mainly due to accommodation savings and transfer of responsibility for the Whole-of-GovernmentSAP contract to the department.
8. Decrease relates to audit fees.
Major variations between 2014-15 Estimated Actual and the 2015-16 Budget include:
9. Decrease is mainly due to transfer of responsibility for the Whole-of-Government SAP contract to the departmentand volume reductions due to service efficiencies.
10. Increase is due to funding deferrals relating to business capability and capacity projects and Shared SystemsReform program of work.
11. Decrease relates to recoveries for software licences paid on behalf of other agencies.
12. Decrease mainly relates to 2014-15 leasehold improvements accelerated depreciation.
Balance sheetMajor variations between 2014-15 Budget and 2014-15 Estimated Actual include:
13. Decrease is due to transfer of cash to Consolidated Fund.
14. Decrease is due to leasehold improvements accelerated depreciation and disposals.
15. Decrease is due to 2013-14 software impairment due to client system upgrade.
16. Decrease is due to transfer of cash to Consolidated Fund and cash for software amortisation offset by the 2013-14 actual operating surplus.
Major variations between 2014-15 Budget and 2015-16 Budget include:
17. Decrease is due to transfer of cash to Consolidated Fund and outlays for Shared Systems Reform program ofwork.
18. Decrease is due to leasehold improvements accelerated depreciation and disposals.
19. Decrease is due to transfer of cash to Consolidated Fund, cash for software amortisation and Shared SystemsReform equity to output swap offset by the 2013-14 actual operating surplus.
Major variations between 2014-15 Estimated Actual and the 2015-16 Budget include:
20. Decrease is due to outlays for Shared Systems Reform program of work.
21. Increase is due to capitalisation of system costs.
22. Decrease is due to cash for software amortisation and Shared Systems Reform equity to output swap.
Explanation of variances in the financial statements
2015-16 Queensland State Budget – Service Delivery Statements – Department of Science, Information Technology and Innovation
53

Cash flow statementMajor variations between 2014-15 Budget and 2014-15 Estimated Actual include:
23. Decrease is due to funding deferrals relating to business capability and capacity projects and Shared SystemsReform program of work.
24. Increase is due to recoveries for software licences paid on behalf of other agencies and GST input tax credits.
25. Decrease is mainly due to GST remitted to the Australian Taxation Office.
26. Decrease is due to delays in Shared Systems Reform program of work.
27. Increase is due to return of cash transfer from the department for remittance to Consolidated Fund.
28. Increase is due to transfer of cash to Consolidated Fund and cash for software amortisation.
Major variations between 2014-15 Budget and 2015-16 Budget include:
29. Decrease is mainly due to accommodation savings and transfer of responsibility for the Whole-of-GovernmentSAP contract to the department.
30. Decrease is mainly due to GST remitted to the Australian Taxation Office.
31. Increase is due to outlays for Shared Systems Reform program of work.
32. Increase is due to Shared Systems Reform equity to output swap.
Major variations between 2014-15 Estimated Actual and the 2015-16 Budget include:
33. Increase is due to funding deferrals relating to business capability and capacity projects and Shared SystemsReform program of work.
34. Decrease relates to recoveries for software licences paid on behalf of other agencies and GST input tax credits.
35. Decrease is mainly due to transfer of responsibility for the Whole-of-Government SAP contract to the department.
36. Increase is due to outlays for Shared Systems Reform program of work.
37. Decrease is due to return of cash transfer from the department for remittance to Consolidated Fund.
38. Decrease is due to transfer of cash to Consolidated Fund offset by Shared Services Reform equity to outputswap.
2015-16 Queensland State Budget – Service Delivery Statements – Department of Science, Information Technology and Innovation
54

Statutory body
Library Board of Queensland
Overview The State Library of Queensland (SLQ) is a vital community resource, inspiring creativity by ensuring more Queenslanders can participate in cultural life. SLQ's legislated role is to collect and preserve Queensland's cultural heritage and ensure the intellectual and historical record is preserved for the future. Its objectives are to enable access, engage the community and build capability. SLQ supports the Government’s objectives for the community: delivering quality frontline services (achieving better education and training options and supporting disadvantaged Queenslanders); building safe, caring and connected communities (encouraging safer and inclusive communities and building regions); creating jobs and a diverse economy (increasing workforce participation and stimulating economic growth and innovation) and protecting the environment (conserving heritage).
SLQ is accelerating the transition to digital to make content, services and programs accessible to everyone. The quantity of digital materials coming into the collection is increasing rapidly. SLQ is working with National and State Libraries Australasia on a shared solution to preserve digital collections in the long term. Inconsistent ICT connectivity across Queensland is a key challenge as it creates greater barriers to access for those in regional and remote areas.
With a multidisciplinary responsibility, SLQ supports a broad agenda across education, science, innovation, information technology and enterprise and works in partnership to increase the value it delivers. SLQ works with local government, public libraries and regional communities to create programs that help strengthen communities. It supports the partnership with the Arts Statutory Bodies across the Cultural Precinct, and with Queensland State Archives and other local, state and national institutions collecting cultural heritage material. It is also transitioning to sustainable business models through its work with the mining sector in regional Queensland and its innovative work in philanthropy.
Service performance
During 2014-15 SLQ: launched the exhibition Distant Lines: Queensland voices of the First World War and the Historypin hub Q ANZAC
100: Memories for a New Generation, held the Serving Country Forum and awarded four research fellowships,enabling people from different generations, cultures and places to explore and build on the stories of the Queenslandexperience of the First World War
invested $22.8 million in public library collections and services and launched access to lynda.com, providing freeonline access to over 3,000 courses and 136,000 video tutorials in commercial software, creative and business skills
launched the First Five Forever family literacy initiative, a $20 million program over four years to give families theinformation and tools they need to help children develop early language and literacy skills through public libraries
engaged the community in creative programs, including CUSP: Designing into the Next Decade and Hot Modernismexhibitions, the Queensland Literary Awards, black&write! Indigenous writing and editing program, the Edge'sFabrication Lab and the release of 60,000 historic and contemporary Queensland images for creative reuse
won the Premier’s Cultural Diversity Award in the Public Sector category for a broad range of culturally diverseprograms including the collection of over 90,000 items in 50 languages for loan through public libraries.
During 2015-16 SLQ will: invest $23.3 million in public library collections and services provide early childhood literacy programs, including First Five Forever, Dad's Read and the National Summer
Reading Club lead a broad community of interest to deliver year two of Q ANZAC 100, including an interactive timeline, community
programs, research fellowships, open data hack competition and digitising SLQ and community collections pilot a new enterprise centre to support business, social enterprise and creative industries lead the National and State Libraries Australasia Digital Infrastructure Collaboration project, piloting infrastructure for
long term digital preservation.
2015-16 Queensland State Budget – Service Delivery Statements – Department of Science, Information Technology and Innovation
55

Service performance
Performance statement
State Library of Queensland (SLQ)
Service area objective
To strengthen Queensland’s arts and education sectors and contribute to the cultural, social and intellectual development of all Queenslanders.
Service area description
SLQ is a place for sharing, learning, collaborating and creating, both within the cultural precinct facilities and our ever expanding online offer. SLQ provides free access to print, digital and original resources, with a focus on collecting and preserving Queensland’s unique documentary heritage. SLQ provides information and research services, events and exhibitions and centres of engagement with: children and young people; Aboriginal and Torres Strait Islanders peoples; arts, science, technology, enterprise; and design. SLQ partners with local government to fund and support 320 public libraries and Indigenous Knowledge Centres including collection services and professional development. SLQ plays a particular leadership role to ensure the sustainability of small rural and remote libraries and Indigenous Knowledge Centres, including the purchase of bulk collections that are shared across the network.
State Library of Queensland Notes 2014-15
Target/Est. 2014-15
Est. Actual 2015-16
Target/Est.
Service area: State Library of Queensland
Service standards Effectiveness measure
Customer satisfaction with services and programs
1 85% 96% 90%
Efficiency measure
Percentage increase in the efficiency of service delivery 2 2% 3.3% 2.5%
Notes: 1. This is a measure of overall customer satisfaction with the State Library's services and programs. The wording of the measure has been
amended to align with government’s public service value of Customers first. The methodology remains unchanged.2. This is a measure of percentage improvement from the previous year in the ratio of total visits to the State Library (onsite and online)
compared to the State Government budget appropriation (excluding public library grant funds). The measure provides an indication ofimprovement in the efficient use of public funds in providing services and programs to the public. The 2014-15 Est. Actual is higher than the2014-15 Target/Est. because customer use of a broad range of online collections, programs and services increased at a higher rate thanforecast.
2015-16 Queensland State Budget – Service Delivery Statements – Department of Science, Information Technology and Innovation
56

Staffing1
State Library of Queensland Notes 2014-15
Adjusted Budget
2014-15 Est. Actual
2015-16 Budget
State Library of Queensland 295 296 296
Note: 1. FTEs as at 30 June.
2015-16 Queensland State Budget – Service Delivery Statements – Department of Science, Information Technology and Innovation
57

Income statement
Library Board of Queensland Notes2014-15 Budget
$'000
2014-15 Est. Act.
$'000
2015-16 Budget
$'000
INCOMETaxes .. .. .. User charges and fees 6 3,391 3,455 3,579 Grants and other contributions 1,7 59,431 64,826 64,016 Interest 778 796 800 Other revenue .. .. .. Gains on sale/revaluation of assets .. .. ..
Total income 63,600 69,077 68,395 EXPENSES
Employee expenses 2,8 28,773 27,006 27,276
Supplies and services 3,9,12 14,540 17,399 15,816
Grants and subsidies 4,10 19,338 23,682 24,457 Depreciation and amortisation 5,11 594 558 537 Finance/borrowing costs .. .. .. Other expenses 198 195 195 Losses on sale/revaluation of assets 37 37 37
Total expenses 63,480 68,877 68,318 OPERATING SURPLUS/(DEFICIT) 120 200 77
2015-16 Queensland State Budget – Service Delivery Statements – Department of Science, Information Technology and Innovation
58
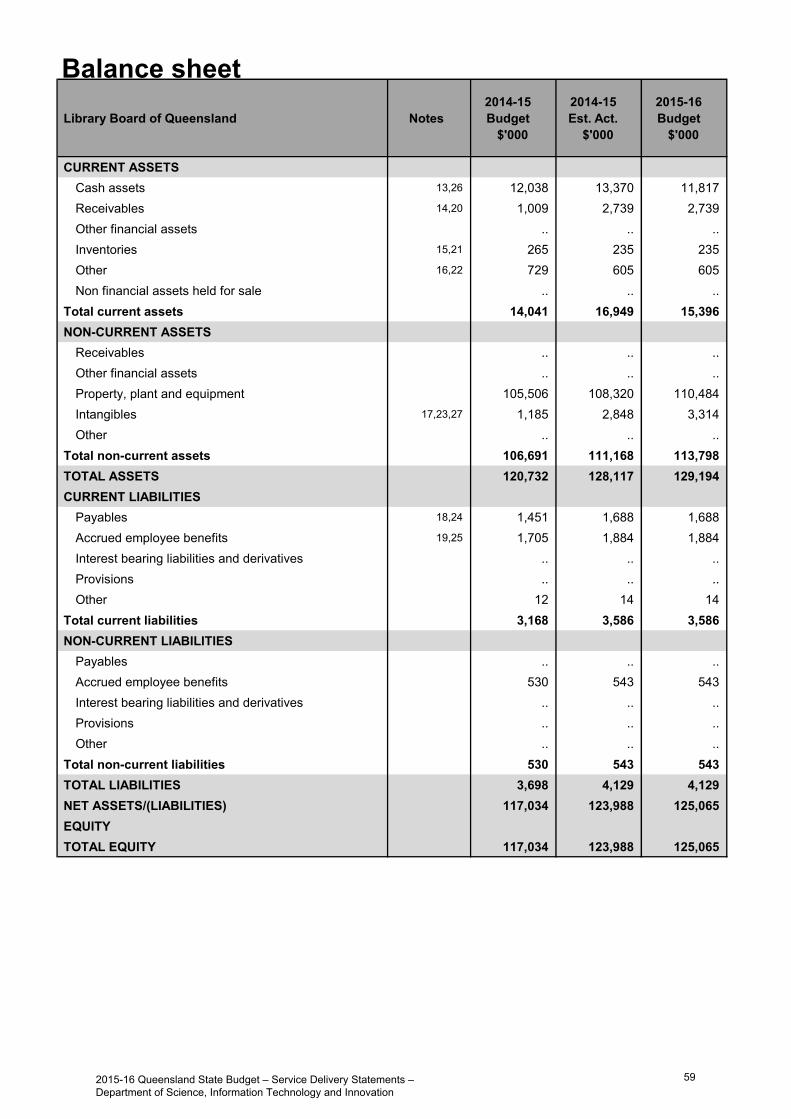
Balance sheetLibrary Board of Queensland Notes
2014-15 Budget
$'000
2014-15 Est. Act.
$'000
2015-16 Budget
$'000
CURRENT ASSETSCash assets 13,26 12,038 13,370 11,817 Receivables 14,20 1,009 2,739 2,739 Other financial assets .. .. .. Inventories 15,21 265 235 235 Other 16,22 729 605 605 Non financial assets held for sale .. .. ..
Total current assets 14,041 16,949 15,396 NON-CURRENT ASSETS
Receivables .. .. .. Other financial assets .. .. .. Property, plant and equipment 105,506 108,320 110,484 Intangibles 17,23,27 1,185 2,848 3,314 Other .. .. ..
Total non-current assets 106,691 111,168 113,798 TOTAL ASSETS 120,732 128,117 129,194 CURRENT LIABILITIES
Payables 18,24 1,451 1,688 1,688 Accrued employee benefits 19,25 1,705 1,884 1,884 Interest bearing liabilities and derivatives .. .. .. Provisions .. .. .. Other 12 14 14
Total current liabilities 3,168 3,586 3,586 NON-CURRENT LIABILITIES
Payables .. .. .. Accrued employee benefits 530 543 543 Interest bearing liabilities and derivatives .. .. .. Provisions .. .. .. Other .. .. ..
Total non-current liabilities 530 543 543 TOTAL LIABILITIES 3,698 4,129 4,129 NET ASSETS/(LIABILITIES) 117,034 123,988 125,065 EQUITYTOTAL EQUITY 117,034 123,988 125,065
2015-16 Queensland State Budget – Service Delivery Statements – Department of Science, Information Technology and Innovation
59
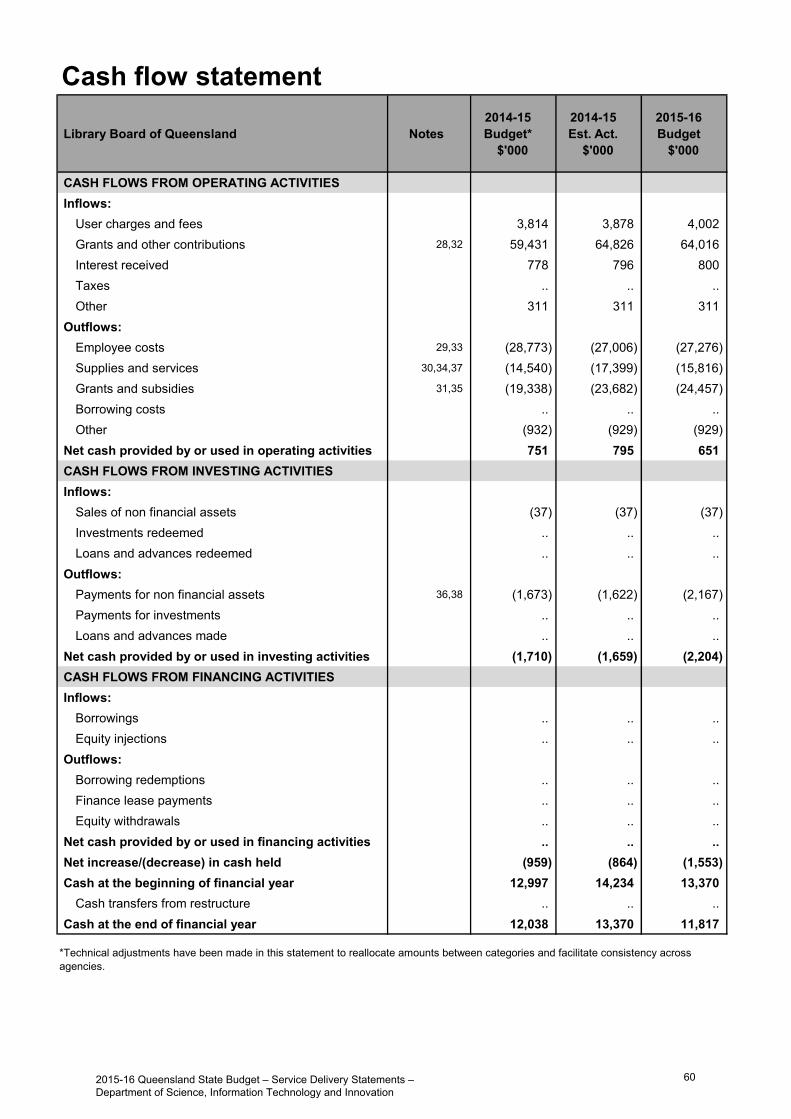
Cash flow statement
Library Board of Queensland Notes2014-15 Budget*
$'000
2014-15 Est. Act.
$'000
2015-16 Budget
$'000
CASH FLOWS FROM OPERATING ACTIVITIESInflows:
User charges and fees 3,814 3,878 4,002 Grants and other contributions 28,32 59,431 64,826 64,016 Interest received 778 796 800 Taxes .. .. .. Other 311 311 311
Outflows:Employee costs 29,33 (28,773) (27,006) (27,276)Supplies and services 30,34,37 (14,540) (17,399) (15,816)Grants and subsidies 31,35 (19,338) (23,682) (24,457)Borrowing costs .. .. .. Other (932) (929) (929)
Net cash provided by or used in operating activities 751 795 651 CASH FLOWS FROM INVESTING ACTIVITIESInflows:
Sales of non financial assets (37) (37) (37)Investments redeemed .. .. .. Loans and advances redeemed .. .. ..
Outflows:Payments for non financial assets 36,38 (1,673) (1,622) (2,167)Payments for investments .. .. .. Loans and advances made .. .. ..
Net cash provided by or used in investing activities (1,710) (1,659) (2,204)CASH FLOWS FROM FINANCING ACTIVITIESInflows:
Borrowings .. .. .. Equity injections .. .. ..
Outflows:Borrowing redemptions .. .. .. Finance lease payments .. .. .. Equity withdrawals .. .. ..
Net cash provided by or used in financing activities .. .. .. Net increase/(decrease) in cash held (959) (864) (1,553)Cash at the beginning of financial year 12,997 14,234 13,370
Cash transfers from restructure .. .. .. Cash at the end of financial year 12,038 13,370 11,817
*Technical adjustments have been made in this statement to reallocate amounts between categories and facilitate consistency acrossagencies.
2015-16 Queensland State Budget – Service Delivery Statements – Department of Science, Information Technology and Innovation
60

Income statementMajor variations between 2014-15 Budget and 2014-15 Estimated Actual include:
1. Increase mainly due to additional funding for the First Five Forever (Best Start) early literacy program.
2. Decrease due to reallocation of project funding to supplies and services and staff vacancy rate held throughoutthe year.
3. Increase mainly due to additional project costs and higher ICT support costs.
4. Increase due to new grants paid to public libraries across the state as part of the First Five Forever (Best Start)early literacy program.
5. Decrease due to gradual reduction in plant and equipment and software as cloud-based solutions are introduced.
Major variations between 2014-15 Budget and 2015-16 Budget include:
6. Increase due to higher expected income from venue hire and sub-leasing arrangements.
7. Increase mainly due to additional funding for the four year First Five Forever (Best Start) early literacy program,population growth funding for public library grants and enterprise bargaining arrangements.
8. Decrease mainly due to reallocation of project funding to supplies and services.
9. Increase mainly due to additional Q ANZAC 100 project costs and higher ICT support costs.
10. Increase due to new grants paid to public libraries across the state from the First Five Forever (Best Start) earlyliteracy program and On-line Public Access in Public Libraries (OPAL) program, and population growth funding forpublic library grants.
11. Decrease due to gradual reduction in plant and equipment and software as cloud-based solutions are introduced.
Major variations between 2014-15 Estimated Actual and the 2015-16 Budget include:
12. Decrease due to timing of some project payments and cessation of some limited life funding.
Balance sheetMajor variations between 2014-15 Budget and 2014-15 Estimated Actual include:
13. Increase due to higher than anticipated prior year surplus resulting from timing delays to projects.
14. Increase due to later than expected receipts for some grant funded projects.
15. Decrease due to reduction in preservation materials inventory held.
16. Decrease due to reduction in prepayments for annual subscriptions.
17. Increase due to additional digital collections items purchased and physical collection items digitised.
18. Increase due to higher anticipated year-end accruals for goods or services received but not yet paid.
19. Increase due to increase in FTEs for the Q ANZAC 100 and First Five Forever (Best Start) projects.
Major variations between 2014-15 Budget and 2015-16 Budget include:
20. Increase due to expected late payments to be received for some grant funded projects
21. Decrease due to reduction in preservation materials inventory held.
22. Decrease due to reduction in prepayments for annual subscriptions.
23. Increase due to additional digital collections items purchased and physical collection items digitised.
24. Increase due to higher anticipated year-end accruals for goods or services received but not yet paid.
25. Increase due to increase in FTEs for the Q ANZAC 100 and First Five Forever (Best Start) projects.
Explanation of variances in the financial statements
2015-16 Queensland State Budget – Service Delivery Statements – Department of Science, Information Technology and Innovation
61
Major variations between 2014-15 Estimated Actual and the 2015-16 Budget include:
26. Decrease due to expenditure of project funds unspent from 2014-15 as well as planned asset purchases.
27. Increase due to planned additional digital collections items purchased and physical collection items digitised.
Cash flow statementMajor variations between 2014-15 Budget* and 2014-15 Estimated Actual include:
28. Increase due to new grants paid to public libraries across the state as part of the First Five Forever (Best Start)early literacy program.
29. Decrease due to reallocation of project funding to supplies and services and staff vacancy rate held throughoutthe year.
30. Increase mainly due to additional project costs and higher ICT support costs.
31. Increase due to new grants paid to public libraries across the state as part of the four year First Five Forever (Best Start) early literacy program.
Major variations between 2014-15 Budget* and 2015-16 Budget include:
32. Increase mainly due to additional funding for the four year First Five Forever (Best Start) early literacy program,population growth funding for public library grants and enterprise bargaining arrangements.
33. Decrease due to reallocation of project funding to supplies and services.
34. Increase mainly due to additional project costs and higher ICT support costs.
35. Increase mainly due to additional funding for the four year First Five Forever (Best Start) early literacy program,population growth funding for public library grants, On-line Public Access in Public Libraries (OPAL) program andenterprise bargaining arrangements.
36. Increase due to increase in digitised collection images and timing of ICT equipment replacement.
Major variations between 2014-15 Estimated Actual and the 2015-16 Budget include:
37. Decrease due to timing of some project payments and cessation of some limited life funding.
38. Increase due to increase in digitised collection images and timing of ICT equipment replacement.
2015-16 Queensland State Budget – Service Delivery Statements – Department of Science, Information Technology and Innovation
62

Glossary of terms
Accrual accounting Recognition of economic events and other financial transactions involving revenue, expenses, assets, liabilities and equity as they occur and reporting in financial statements in the period to which they relate, rather than when a flow of cash occurs.
Administered items Assets, liabilities, revenues and expenses an entity administers, without discretion, on behalf of the Government.
Agency/entity Used generically to refer to the various organisational units within Government that deliver services or otherwise service Government objectives. The term can include departments, commercialised business units, statutory bodies or other organisations established by Executive decision.
Appropriation Funds issued by the Treasurer, under Parliamentary authority, to agencies during a financial year for: delivery of agreed services administered items adjustment of the Government’s equity in agencies, including acquiring of capital.
Balance sheet A financial statement that reports the assets, liabilities and equity of an entity as at a particular date.
Capital A term used to refer to an entity’s stock of assets and the capital grants it makes to other agencies. Assets include property, plant and equipment, intangible items and inventories that an entity owns/controls and uses in the delivery of services.
Cash Flow Statement A financial statement reporting the cash inflows and outflows for an entity’s operating, investing and financing activities in a particular period.
Controlled Items Assets, liabilities, revenues and expenses that are controlled by departments. These relate directly to the departmental operational objectives and arise at the discretion and direction of that department.
Depreciation The periodic allocation of the cost of physical assets, representing the amount of the asset consumed during a specified time.
Equity Equity is the residual interest in the assets of the entity after deduction of its liabilities. It usually comprises the entity’s accumulated surpluses/losses, capital injections and any reserves.
Equity injection An increase in the investment of the Government in a public sector agency.
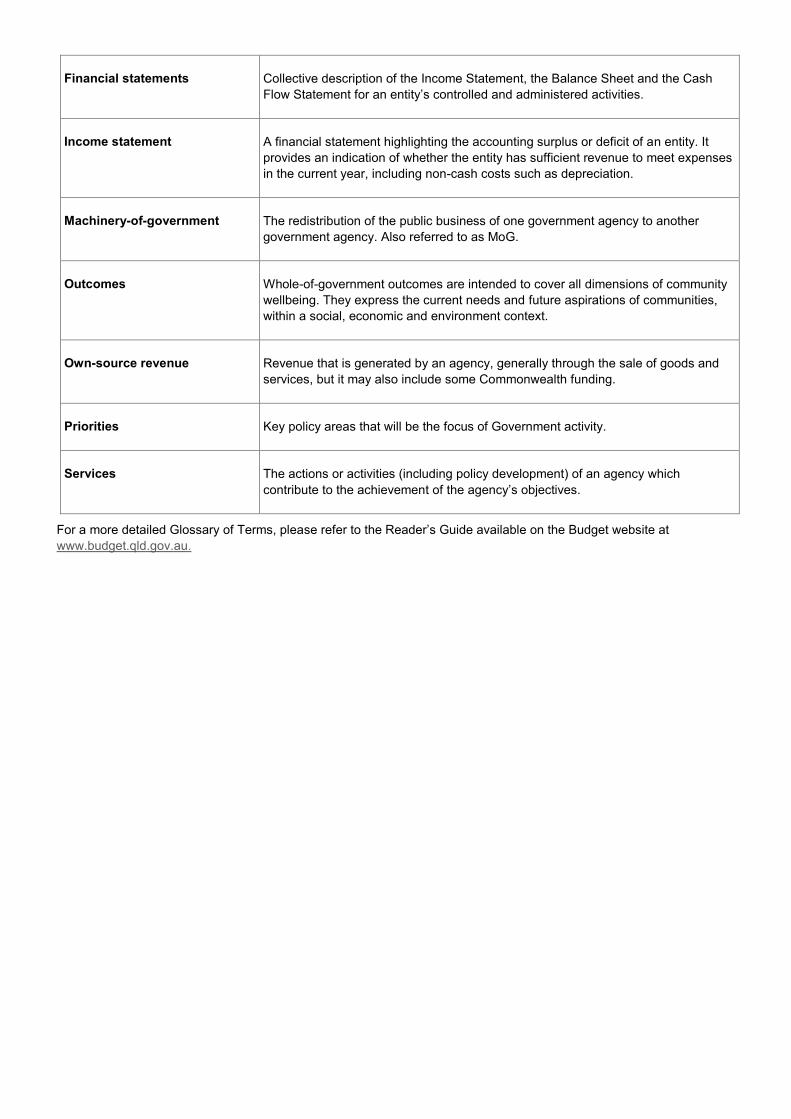
Financial statements Collective description of the Income Statement, the Balance Sheet and the Cash Flow Statement for an entity’s controlled and administered activities.
Income statement A financial statement highlighting the accounting surplus or deficit of an entity. It provides an indication of whether the entity has sufficient revenue to meet expenses in the current year, including non-cash costs such as depreciation.
Machinery-of-government The redistribution of the public business of one government agency to another government agency. Also referred to as MoG.
Outcomes Whole-of-government outcomes are intended to cover all dimensions of community wellbeing. They express the current needs and future aspirations of communities, within a social, economic and environment context.
Own-source revenue Revenue that is generated by an agency, generally through the sale of goods and services, but it may also include some Commonwealth funding.
Priorities Key policy areas that will be the focus of Government activity.
Services The actions or activities (including policy development) of an agency which contribute to the achievement of the agency’s objectives.
For a more detailed Glossary of Terms, please refer to the Reader’s Guide available on the Budget website at www.budget.qld.gov.au.

2015-16 Queensland Budget Papers1. Budget Speech
2. Budget Strategy and Outlook
3. Capital Statement
4. Budget Measures
5. Service Delivery Statements
Appropriation Bills
Jobs Now, Jobs for the Future - Queensland Government employment plan
Budget Highlights
The suite of Budget Papers is similar to that published in 2014-15.
The Budget Papers are available online at www.budget.qld.gov.au
© Crown copyright All rights reservedQueensland Government 2015
Excerpts from this publication may be reproduced, with appropriate acknowledgement, as permitted under the Copyright Act.
Service Delivery Statements
ISSN 1445-4890 (Print)ISSN 1445-4904 (Online) Queensland Budget 2015-16 Service Delivery Statements www.budget.qld.gov.au

Queensland Budget 2015-16 Service Delivery Statements www.budget.qld.gov.au
Department of Agriculture and FisheriesService Delivery Statements
Queensland Budget 2015-16
Related Documents