OC13108/OC13109 Service delivery and business growth among banks in Ghana using the SPC. 1. Mr. Adu Gyamfi (Head Of Department - Marketing) Accra Polytechnic Accra 2. Mr. Isaac Acheampong (Lecturer - Marketing) Accra Polytechnic Accra 3. Mr. Kwabena Asiedu Asamoah (Lecturer - Marketing) Accra Polytechnic Accra Abstract The service-profit chain establishes relationships between a firm’s profitability on one hand and their customer loyalty, employee satisfaction and loyalty on the other hand. The links in the chain are as follows: Profit and growth, stimulated by customer satisfaction and loyalty which results from employee satisfaction and loyalty. Loyalty is a direct result of customer satisfaction. Satisfaction is influenced by the value of services provided by employees and the value is created by satisfied and loyal employees. A growing number of banks in Ghana are getting to know that they have to place emphasis on employees and customers and make them their principal focus. The banks have realized that when they equip the employees well enough for quality service delivery, a drastic shift occurs in the management and success of their banks. With banks adopting these philosophies, there is a need to study the link between what they do and their successes. This paper studied employee satisfaction and loyalty on the delivery of services at the banks and its impact on customer satisfaction and loyalty. Customer surveys from five banks, with five branches of each bank. Twenty customers were sampled from each branch resulting in one hundred customers for each bank. In all five hundred customers were interviewed. Twenty five branch managers, one from each branch were also interviewed for management operational inputs. The paper further looked at how managers can build on both the customer and employee satisfaction and loyalty and assess the corresponding impact on profitability and growth. Key words: Service-profit chain, satisfaction, loyalty, customers and employees 1.0. INTRODUCTION

Welcome message from author
This document is posted to help you gain knowledge. Please leave a comment to let me know what you think about it! Share it to your friends and learn new things together.
Transcript

OC13108/OC13109
Service delivery and business growth among banks in Ghana using the SPC.
1. Mr. Adu Gyamfi (Head Of Department - Marketing)
Accra Polytechnic
Accra
2. Mr. Isaac Acheampong (Lecturer - Marketing)
Accra Polytechnic
Accra
3. Mr. Kwabena Asiedu Asamoah (Lecturer - Marketing)
Accra Polytechnic
Accra
Abstract
The service-profit chain establishes relationships between a firm’s profitability on one hand and
their customer loyalty, employee satisfaction and loyalty on the other hand. The links in the
chain are as follows: Profit and growth, stimulated by customer satisfaction and loyalty which
results from employee satisfaction and loyalty. Loyalty is a direct result of customer satisfaction.
Satisfaction is influenced by the value of services provided by employees and the value is
created by satisfied and loyal employees. A growing number of banks in Ghana are getting to
know that they have to place emphasis on employees and customers and make them their
principal focus. The banks have realized that when they equip the employees well enough for
quality service delivery, a drastic shift occurs in the management and success of their banks.
With banks adopting these philosophies, there is a need to study the link between what they do
and their successes. This paper studied employee satisfaction and loyalty on the delivery of
services at the banks and its impact on customer satisfaction and loyalty. Customer surveys from
five banks, with five branches of each bank. Twenty customers were sampled from each branch
resulting in one hundred customers for each bank. In all five hundred customers were
interviewed. Twenty five branch managers, one from each branch were also interviewed for
management operational inputs. The paper further looked at how managers can build on both the
customer and employee satisfaction and loyalty and assess the corresponding impact on
profitability and growth.
Key words: Service-profit chain, satisfaction, loyalty, customers and employees
1.0. INTRODUCTION
OC13108/OC13109
According to Heskett et al. (1997), the service-profit chain is based on the principle that
profitability to a firm is as a result of customer satisfaction and loyalty which, in turn, are as a
result of a customer’s sense of value received, and the capability, productivity, satisfaction and
loyalty of employees. A customer’s sense of value, according to this model is based on the
perceived quality of service they receive and the perceived quality of how these have been
delivered, balanced against the total costs to the customer of availing themselves of the service.
This idea provided by the Service Profit Chain model is supported by the work of Parasuraman,
Zeithaml and Berry (1985and 1988) which proposes that service quality is determined by the
customer, not the service provider. In other words, service quality is an extrinsically perceived
attribution based on the customer’s experience in and through the service encounter or the
Moment of Truth.
The new economies of quality service delivery as indicated by the Service Profit Chain Model
are front line workers and customer needs to be the center of management concern. It continues
that successful manager pay attention to the factors that drive profitability. These factors are
investment in people and the Technology that supports them, revamp recruiting and training
practices as well as linking compensation to performance. Studies show that when companies
manage their employees and customers very well, a radical shift occurs for success occurs.
The Service Profit Chain establishes relationship between profitability, Customer loyalty and
employee satisfaction, loyalty and productivity. The various propositions by Service Profit Chain
are that, profitability and growth are stimulated by customer loyalty which results from customer
satisfaction which is also influenced by the value of the service to the customer. Value is derived
from satisfied, loyal and productive employees and the employees satisfaction also comes from
high quality support systems and how their superiors interact with them.
Research Problem The service industry has currently moved towards the use of technologies, mainly the internet, as
an additional option for remote services to their customers instead of only traditional face-to-face
service delivery (Curran et al., 2003). This has increases the service delivery outreach to
geographically distant and previously remote parts of the world. Thus creating global
competition and setting organizations at the verge of constant drive for more accurate, timely and
relevant decisions.
While there is extensive research linking attribute-level performance perceptions to service
quality (Parasuraman et al., 1988), service quality perceptions to customer behaviors (Bolton
1998) and customer behaviors to revenues (Carr, 1999), Soteriou et al (1999) noted that no study
has comprehensively modeled the SPC and most studies have only tested the links among factors
in isolation, giving inconsistent findings. Further, according to Kamakura et al (2002), these
studies have been unable to identify the causal and mediating mechanisms that managers need to
understand to implement the SPC. This paper however is concerned with studying the impact of
the drivers service quality delivery on business growth in the Banking Industry. The investment
decisions managers make on the service quality drivers have an impact on the bottom-line profits
and the market penetration of the organization.
The Service-Profit Chain (SPC) as a theoretical approach brings together the drivers of the
service delivery system to evaluate investments.
OC13108/OC13109
Some of the drivers are:
• Operational attributes like number of tellers in a bank;
• Customer perceptions like service quality, value, satisfaction;
• Customer behavioral intentions3 to refer/recommend and/or return;
• Customer loyalty including referrals/recommendations that were fruitful and actual behavior
(e.g. returns) that indicate loyalty and finally,
• Financial component including expenses, revenue, surplus/profits.
According to Kamakura et al. (2002), the SPC approach appears to solve most of the problems
associated with the evaluation of service operations. However some challenges still exist:
• Most of the strategic analyses of the factors that affect the bottom line emerge from the
statistical analysis of the complex relationships in the chain at a given point in time. This
approach does not address the issue of what will happen in subsequent time periods and in
particular the long-term dynamic behavior of the organization and its customers.
• Other external factors such as market size, dispersion, competition, etc. that might influence the
SPC are not considered.
2.0. LITERATURE REVIEW The service profit chain
Heskett et al. (1994) in their original framework hypothesized that revenues are driven by service
quality perceptions, which in turn are driven by operational inputs and employee efforts. Thus,
the SPC is a framework for linking service operations to customer’s assessments and in turn
linking those customers’ assessments to the organization’s bottom line – profitability in most
cases. The objective of the SPC is to provide an integrated framework for understanding how an
organization’s operational investments in service quality are linked to customer perceptions and
behaviors, and how these translate into profits. Investments in operational inputs are categorized
as any of the organization’s interventions for improving the way services are delivered (i.e.
investments in technology, additional points of delivery, more waiters in a restaurant, more
cashiers in a supermarket, more ATMs in bank branches, etc.) Hence, the SPC framework can
provide guidance about the complex interrelationships among operational infrastructure,
customer perceptions, and the bottom line (Kamakura et al., 2002). Moreover, the SPC
framework can become useful in helping organizations improve their operations.
Research indicates that the link between the employee’s work experiences and financial
performance holds that, in the service sector, customer satisfaction is a critical intervening
variable. According to Management theorists, this view of organizational performance is referred
to as the service profit chain (Heskett et al., 1997). The service profit chain asserts that satisfied
and motivated employees produce satisfied customers and satisfied customers tend to purchase
more, increasing the revenue and profits of the organization. It is defined the service profit chain
as ‘involving direct and strong relationships between profit; growth; customer loyalty; customer
satisfaction; the value of goods and services delivered to customers; and employee capability,
satisfaction, loyalty and productivity.’ These authors recommend the service profit chain as a
OC13108/OC13109
framework for constructing a strategic organizational vision, and suggest that, provided service
profit chain concepts are carefully interpreted and adapted to an organization’s specific situation,
they are capable of delivering ‘remarkable results’.
Allen and Grisaffe (2001) opined that, ideas like the service profit chain have had considerable
influence in management circles, and it is, therefore, important for occupational and
organizational psychologists to examine them critically.
Customer value in the service-profit chain framework
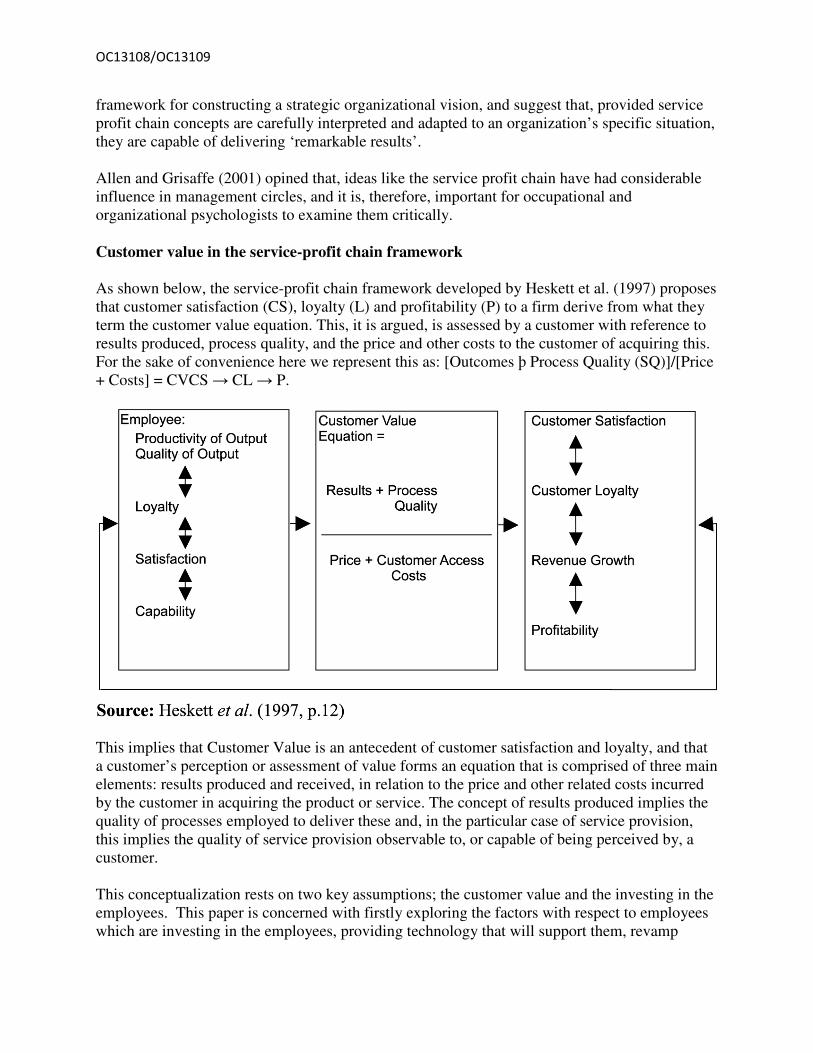
As shown below, the service-profit chain framework developed by Heskett et al. (1997) proposes
that customer satisfaction (CS), loyalty (L) and profitability (P) to a firm derive from what they
term the customer value equation. This, it is argued, is assessed by a customer with reference to
results produced, process quality, and the price and other costs to the customer of acquiring this.
For the sake of convenience here we represent this as: [Outcomes þ Process Quality (SQ)]/[Price
+ Costs] = CVCS → CL → P.
This implies that Customer Value is an antecedent of customer satisfaction and loyalty, and that
a customer’s perception or assessment of value forms an equation that is comprised of three main
elements: results produced and received, in relation to the price and other related costs incurred
by the customer in acquiring the product or service. The concept of results produced implies the
quality of processes employed to deliver these and, in the particular case of service provision,
this implies the quality of service provision observable to, or capable of being perceived by, a
customer.
This conceptualization rests on two key assumptions; the customer value and the investing in the
employees. This paper is concerned with firstly exploring the factors with respect to employees
which are investing in the employees, providing technology that will support them, revamp
OC13108/OC13109
recruiting and training practices as well as linking their compensation to performance. Secondly,
customer perceived value (CPV), that this perception of value is grounded in the customer’s
perception of the quality of what has been provided and how. We refer to this as customer
perceived service quality (CPSQ). This is consistent with the position taken by Parasuraman et
al. (1988) who argue that perceived service [process] quality is determined by five main factors
(reliability, assurance, empathy, responsiveness and tangible evidence) experienced in the course
of the personal service encounter.
The service profit chain and models of organizational functioning
We first consider how the service profit chain model fits within a more general framework of
organizational theory. Our staring point is the conceptual model of organizational functioning
proposed by Ostroff and Bowen (2000). In the Ostroff and Bowen model, contextual social
factors and the human resource system lie at the start of a hypothesized causal chain. According
to Ostroff and Bowen, a fair and consistent HR system communicates positive and clear signals
to employees and fosters the development of positive perceptions of what the organization is
like, and a favourable shared climate. Climate, in turn, influences employee attributes (referred
to as collective attitudes by Ostroff & Bowen, 2000, and as cognitive and affective states by
Kopleman et al.) such as commitment, motivation, and identification with the organization.
Positive attitudes lead to salient employee behaviours such as attachment (attendance and staying
with the organization), performance (execution of in-role tasks), and citizenship (discretionary
pro-social behaviours), that increase organizational productivity (Kopelman et al., p 299).
Empirical evidence for such linkages has been reported by Simons and Roberson (2003).
Within this framework, the service profit chain may be described as follows: climate influences
employee commitment, and employee commitment influences both customer satisfaction and
sales. Furthermore, because the service profit chain model claims that sales achievement results
from increased customer satisfaction, it follows that customer satisfaction should mediate the
relationship between commitment and sales.
Employee experiences and customer satisfaction
As usually conceived of by its proponents, the service profit chain is thought to involve an
association between employee satisfaction and customer satisfaction (see e.g. Heskett et al.,
1997; Wiley & Brooks, 2000; Rucci et al., 1998). Research supports such an association.
Reported correlations between customer satisfaction and a wide range of employee perceptions
provide ample evidence to suggest that favourable employee experiences, as reflected by
attitudes such as satisfaction and commitment, and by positive evaluations of organizational
climate, are associated with elevated levels of customer satisfaction. Citing the work of Wiley
(1991), Tornow and Wiley (1991), and Ulrich, Halbrook, Meder, Stuchlik, and Thorpe (1991),
Schneider et al (2000) state that ‘job satisfaction and commitment surveys when aggregated to
the unit level reveal significant relationships with customer satisfaction.
Furthermore, Ryan et al. (1996) and Koys (2001) have reported correlations between customer
satisfaction and measures of employee satisfaction. Further evidence comes from research on
climate by Schneider and others. Schneider and his co-workers (e.g. Schneider & Bowen, 1985;
OC13108/OC13109
Schneider & owen, 1992; Schneider, Parkington, & Buxton, 1980; Schneider, White, & Paul,
1998) have demonstrated that employees’ perceptions of the climate for service predict levels of
customer satisfaction. Studies by Schmit and Allscheid (1995), and Johnson (1996) also support
the notion of a link between favourable climates and enhanced customer satisfaction at the
business unit level. Although climate constructs are clearly to be distinguished from more
affective attitudinal dimensions (such as job and company satisfaction and organizational
commitment; La Follette & Sims, 1975; Parker, 1999), there is considerable evidence that
favourable climates are associated with high levels of satisfaction and commitment (Gunter &
Furnham, 1996; Muchinsky, 1977; Ostroff, Kinicki, & Clark, 2002).
Harter et al. (2002), also found their employee engagement measure was correlated with
customer satisfaction. In general, it appears that favourable experiences in the workplace are
frequently associated with favourable experiences for the customer. Consumer researchers have
suggested that such results could be explained by the mechanism of emotional contagion
(Hatfield, Cacioppo, & Rapson, 1993; Schoenewolf, 1990). This is a process whereby the
expressed affect of a sender influences the affect of a receiver. According to this conception,
employees who feel positive about their workplace radiate positive affect in the course of
conducting their work. These emotions are perceived and absorbed by customers, who, as a
result, experience pleasant service encounters. For example, Pugh (2001) demonstrated that the
display of positive emotion by bank employees is positively related to customers’ positive affect
following service encounters, and to their evaluations of service quality. If employee
behaviours within a business unit are correlated, such processes could account for correlations
between collective attitudes and customer satisfaction at the business unit level of analysis.
However, other mechanisms are equally plausible. Customer satisfaction and financial performance
The second crucial element of the service profit chain is the link between customer satisfaction
and financial performance. Management theorists and chief executives have often argued that
superior business performance depends critically on satisfying the customer (e.g. Heskett et al.,
1997; Peters & Waterman, 1982; Watson, 1963).
Additionally, consumer researchers have established that customers who are satisfied with a
supplier report stronger intentions to purchase from that supplier than do dissatisfied customers
(Mittal, Kumar, & Tsiros, 1999; Zeithaml, Berry, & Parasuraman, 1996). Service quality is often
conceptualised as the comparison of service expectations with actual performance perceptions
(Zeithaml and Bitner, 2003). Emphasis is placed on the combined attitudinal construct of service
quality, highlighting constituents of both cognitive and affective components. Parasuraman et al.
(1998) tend to delineate service quality using more cognitive items, whereas Edwards (1990)
found that the affective attitudes exhibited more change under affective means of persuasion than
under cognitive means of persuasion. Teas (1993), however, argues that service quality is a
combination of transaction and overall attitude. The Capabilities-Service-Quality-Performance (C-SQ-P) Triad
OC13108/OC13109
Rucci et al (1998) studied the employee-customer model, which emphasizes the optimization of
employee skills to satisfy customers. The authors claim that this study brought about a change in
the business culture at Sears, Roebuck and Company and brought the organization from big
losses to big profits. The authors use total performance indicators to analyze, model and
experiment on employee-customer relations. The authors talk about how employee attitudes
affect employee retention, which affects the drivers of customer satisfaction, and finally how the
financial performance is affected. The operational strategy evolves from the concept. For Sears
to be a compelling place to invest, it had to be both – a compelling place to work and a
compelling place to shop, not just one, or the other. The authors express that rule as the
following formula: Work x Shop = Invest
Conceptually speaking, both Heskett et al. (1994) and Rucci et al. (1998) have the same theory
behind the models and in fact, both the models are strikingly similar. Both capture aspects
internal to the organization, like the job of the individual employees, the workplace, rewards and
recognition, etc., and the effect of these on both employee satisfaction and the behavior that
drives employee retention and productivity. Such a motivated employee in either model has high
productivity and has increased service value to customers. This increased service value in turn
drives customer satisfaction and prompts the customer to refer or recommend the service.
Furthermore, this behavior can be translated into customer loyalty/retention, which is converted
into revenue growth and profits. However speaking from a methodology standpoint, Heskett et
al. (1994) do not explain how the various links are quantified or validated. Rucci et al. (1998) on
the other hand, talk about causal pathway modeling which is used in analyzing the causal links.
Causal pathway modeling also known as Path analysis as opposed to multiple regression analysis
seeks causal pathways and not just correlations without causations. Kamakura et al. (2002) built on the Service-Profit chain model proposed by Heskett et al. (1994)
and came up with a model that has the following; operational inputs which include employee
perceptions, attitudes, and satisfaction. Attribute performance perceptions are actually the
perceived service quality. They included behavioral intentions between the perceived service
quality and the actual behavior of the customers. Whereas other models look at just customer
satisfaction driving the behavior, Kamakura et al. (2002) combine the overall evaluations
(assumed to the equivalent of overall customer satisfaction) with behavioral intentions. Overall
evaluations are measures of overall consumers’ evaluations of the service (overall service quality
rating, overall satisfaction rating, or an overall behavioral intent rating). Behavioral intent rating
is the customers stated intention to come back for repeated business in the future.
The Conceptual Model
The Service Profit Chain (SPC) originally formulated by Heskett et al. (1994) has had several
modifications (Roth and Jackson, 1995; Rust et al., 1995; Rucci et al., 1998; Kamakura et al.,
2002). Although different researchers concentrated on various components of the chain, the
essence is to look at how revenues are driven by service quality perceptions, which in turn are
driven by investments in operational attributes or enhancements. The various components of the
SPC are elaborated as follows:
Operational Attributes

OC13108/OC13109
These are features or characteristics of the internal operations of a service organization. This
component of the SPC includes all the attributes of the internal operations that enable the
organization to provide services to the customers. Kamakura et al. (2002) use the term
“operational inputs” to refer to these attributes, e.g. number of employees, number of equipment,
etc. Any interventions in these attributes are expected to enable the organization to provide better
services. These interventions can be in the form of investments to hire more people, employee
training, improving their quality of work, acquiring more tools or equipment, better workplace
design, etc.
Other authors have looked at attributes inside the organization like employee satisfaction
(Heskett et al., 1994), employee behavior (Rucci et al., 1998), employee retention (Heskett et al.,
1994; Rucci et al., 1998). Roth and Jackson (1995) refer to operational attributes as operational
capabilities. Rust et al. (1995) look specifically into service quality improvement efforts. Some
operational attributes can be referred to as capacity or the capability or potential sitting within an
organization to be used in providing services. Customer Perceptions
Customers perceive the quality and the value of the services provided. This section discusses the
literature in perceived service quality, perceived value and their relationship to customer
satisfaction as it relates to the PC. Customer perceptions as it relates to the SPC could be seen as
perceptions of the personnel and other attributes providing the service. Courteousness,
helpfulness, knowledge, ability to answer questions are examples of perceptions a customer may
have of the personnel. Rucci et al. (1998) look at the service helpfulness of the employees and
the value gained from the service. These dimensions feed into what they call customer mpression
which is more commonly known as “customer satisfaction” (Medina-Borja, 2002). Medina-Borja
(2002) uses perceived service quality as a predictor of overall satisfaction (of customers).
Kamakura et al. (2002) refer to it as “attribute performance perceptions.” Interventions, and hence investments made in operational attributes will have no effect on the
behavior of the customers and eventually on the revenues, if the customers do not perceive the
changes in the operational attributes in the first place. Kamakura et al. (2002) reinforce this when
they say that acquiring additional ATMs or more tellers and eventually achieving lesser waiting
times should be perceived by the customer to have an effect on their satisfaction, and their
positive intentions, etc. Hence, service quality is included as an important dimension of customer
perceptions. Customer Behavioral Intentions
Kamakura et al. (2002) add to the SPC a component on behavioral intentions. Based on the
perceptions and the overall satisfaction levels, customers have certain intentions regarding their
future relationship with the service, (Kamakura et al. 2002). However, these authors group the
behavioral intentions with overall evaluations (which is the same as overall satisfaction). Several
authors do not have this link in the SPC. Heskett et al. (1994), Rust et al. (1995) and Rucci et al.
(1998) jump directly from perceptions to retention. A customer’s behavioral intention is an

OC13108/OC13109
important component of the SPC because the time lag between the end of the provision of the
service and the actual return of the customer makes likely that not all customers who had the
intention to return actually would. The component customer behavioral intentions are a vital
element of the SPC as it ties closely with customer perceptions. As Kamakura et al. (2002)
explain, the behavioral intentions are the only way of determining if the positive perceptions end
up in actual retentions. This element will remain in the conceptual model and defined as
intentions that the customer forms about his/her future behavior based on the perceptions of the
service received.
Customer Loyalty
This is a key component that ties what happens now to what can happen in the future. Customers
that come back for more business and others that came because of referrals are measured by this
component which ties to more revenues for the organization in the future. Reichheld (1996)
study the relationship linking customer retention and profitability over a period of time. The
author concludes that the ability of an organization to retain customers is what generates stronger
cash flows.
According to Heskett et al., (1994) Customer loyalty can be captured as retentions rates and
referrals Although, Edvardsson et al. (2000) define loyalty as a customer’s predisposition to
repurchase from the same organization again and retention as whether the customer has actually
repurchased from the organization. However, the definition by Heskett et al. (1994) will be
followed. In other words, how many people are coming back for repeat business or how many
were referred by others that have used the service.
Heskett et al. (1994) look at both referrals and returns, while Rucci et al. (1998) restrict
themselves to just customer retention. Customer loyalty remains in the conceptual model and is
defined as the dependability or faithfulness of the customer to act in a manner that is beneficial
to the organization.
Surplus
Having customer loyalty and attracting new customers will increase the revenue (Reichheld,
1996). Greater customer retention rates have been claimed to have a significant positive effect on
profits (Rust et al. 1995). If the expenses are fixed, this will lead to a surplus (revenues-
expenses) increase. The initial investments made in the operational attributes tend to decrease the
surplus by increasing the expenses.
3. METHODOLOGY As part of designing the methodology for this study, first insights from Academics who have
experience in conducting surveys on banks in Ghana on various topics were sought. The research
proposals and the sampling plan for gathering data were presented to them. These were critically
examined and suggestions were made for us to improve on our work. The refined work included
setting the parameters for the study clearly and also explaining further the means of data
collection.
OC13108/OC13109
The study was carried in Accra the capital of Ghana using five reputable banks. For each of the
banks, five branches were selected based on their locations and patronage by people. Twenty
customers were selected and interviewed randomly at each branch. This resulted in interviewing
one hundred customers from each of the five banks. In all a total of five hundred customers were
surveyed. Data from management perspective was solicited from the various branch managers of
each of the selected branches for this study. As a result, twenty five managers were interviewed
on their operational inputs. Data analysis was done using the Statistical Package for Social
Sciences (SPSS) tool. A frequency analysis was run and the various interpretations were made.
The findings from the analysis were then juxtaposed with the financial performance of the five
banks that were surveyed. The study looked at the grow trends in the banks profit for the years
understudy as well as the growth trends in their total incomes and that of their total Assets. This
made the researchers analyzed the linkages between the findings of the survey and the growth
and profitability of the banks. This also would help in studying further into the impact of
management operational inputs on customer satisfaction and loyalty and their eventual impact of
the growth and profitability of the banks.
4.0 Analyzing and interpreting Data from Respondents
Analyzing the Operational Inputs of Management
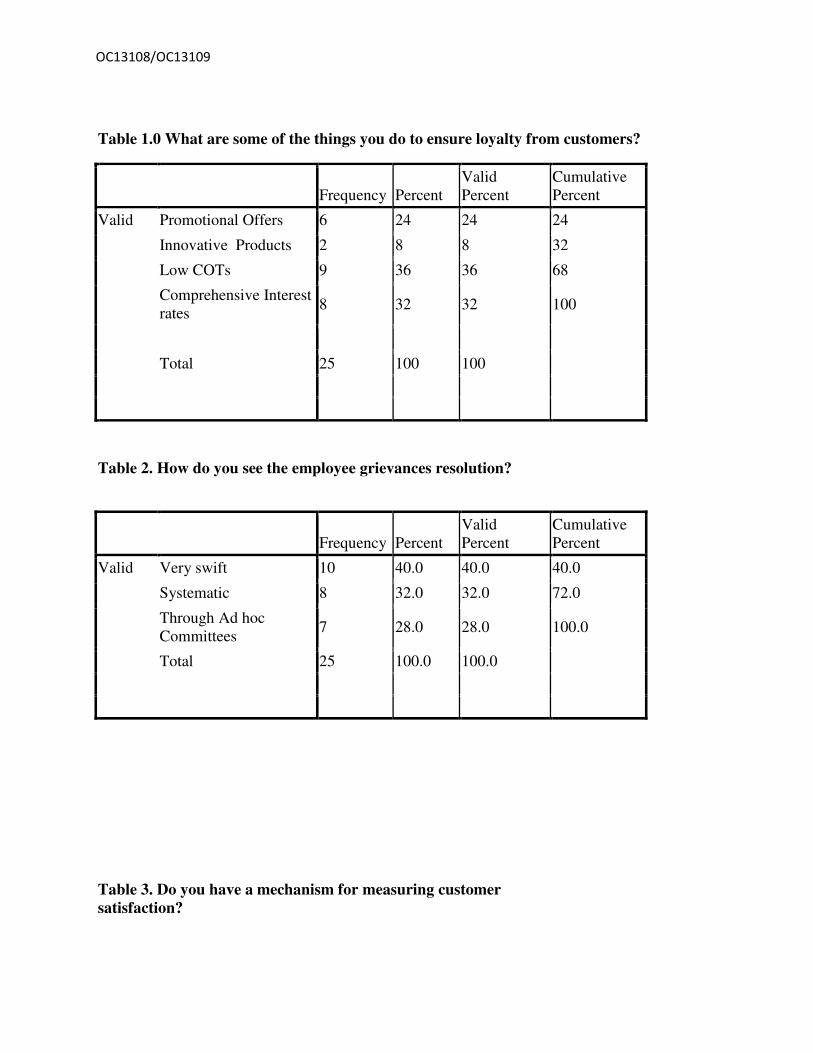
As indicated in Table 1 (Appendix), Most of the branch managers indicated that they must do
something about the cost of doing business with customers. Nine respondents (24%) mentioned
Low cost on transactions as what will ensure loyalty from them. Eight of them (32%) also
indicated competitive interest rates. Only two respondents (24%) stated the provision of
innovative products with six respondents (24%) mentioning Promotional Offers.
As indicated in Table 2 (Appendix), generally management was of the view that, the resolution
of employee grievances was good. Out of the twenty five branch managers, ten (40%) indicated
that employee grievance resolution is very swift. Eight respondents (32%) indicated that it is
systematically done and the remaining seven managers representing 28.0% also stated that they
use ad hoc committees in resolving employee resolution.
Analyzing Employee Loyalty and Satisfaction
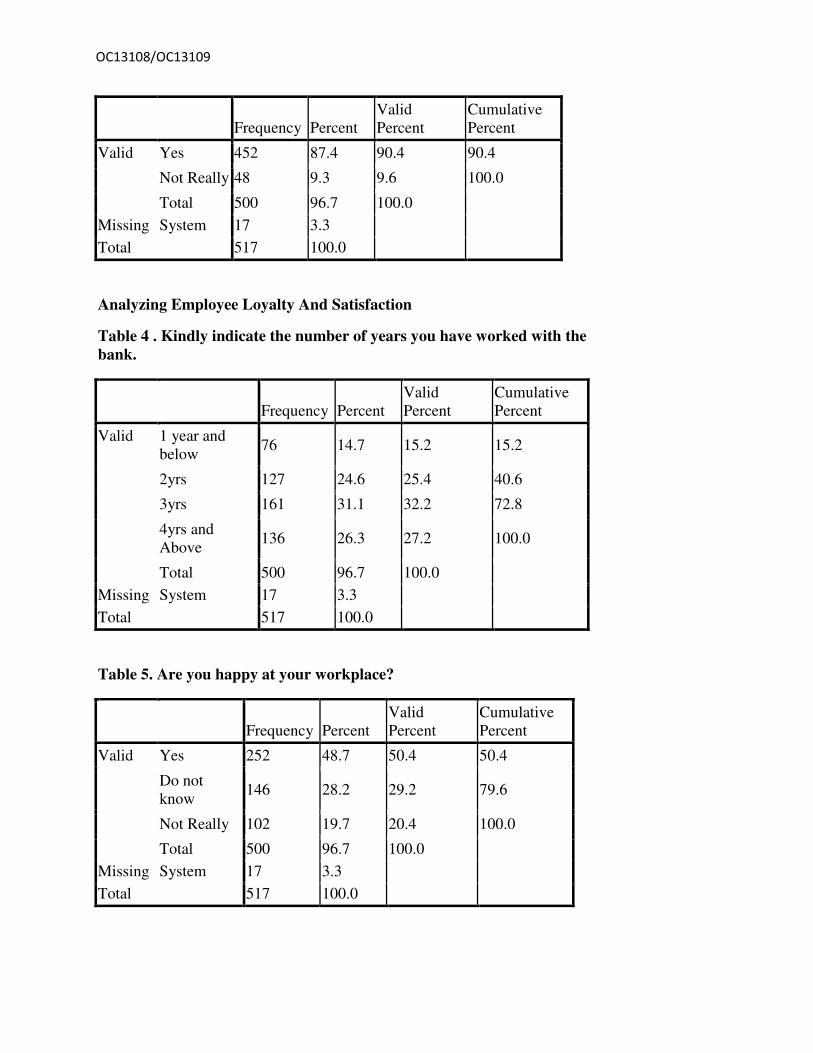
As indicated in Table 3 (Appendix), most of the employees were found to have been with the
bank for at least three years. One hundred and thirty six employees (26.3%) indicated that they
have worked with their banks for four years and above. One hundred and sixty one (31.1%) also
said they have worked for three years. A smaller number of seventy six respondents had worked
for one year and below with their banks.
As indicated in Table 4 (Appendix), how do you see the employee grievances resolution?
Interestingly most of the employees did not know whether they were happy or not. As many as
Two hundred and fifty two representing (48.7%) did not know whether they were happy or not.
One hundred and forty six (28.2%) said they are happy. However, one hundred and two indicated
that they are not really happy.

OC13108/OC13109
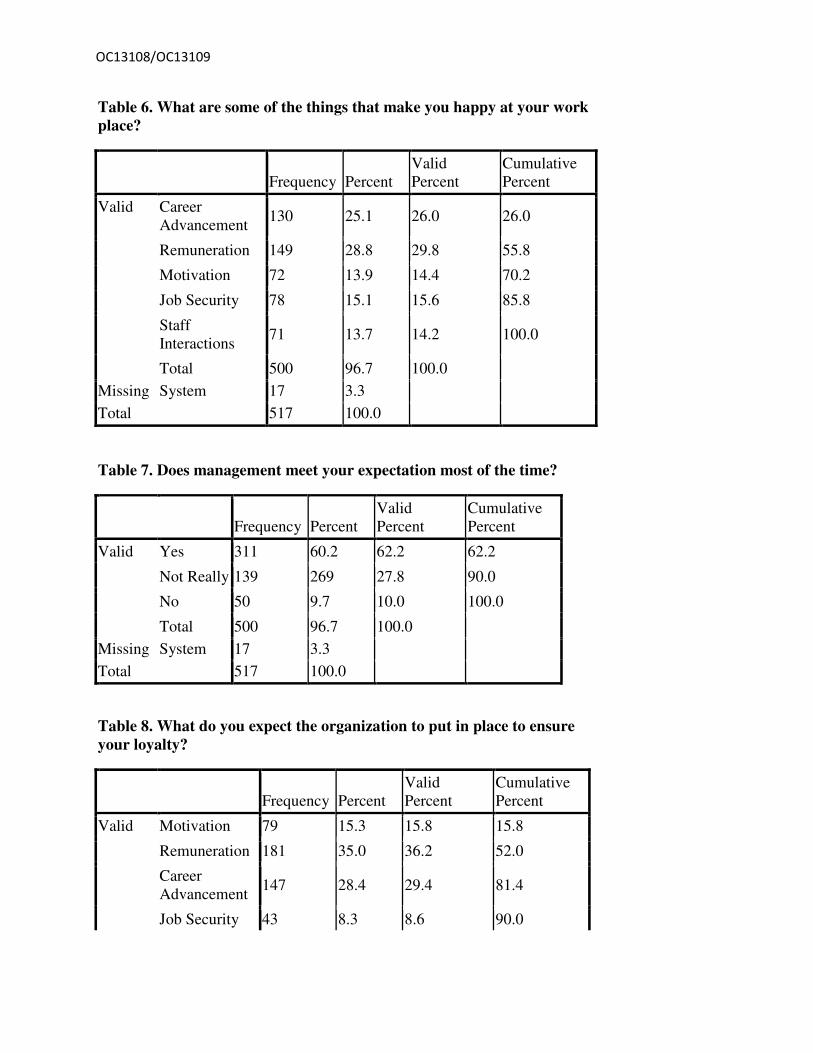
As indicated in Table 5 (Appendix), on the issue of what makes them happy, most of them
indicated remuneration. One hundred and forty nine (28.8%) attested to this fact. One hundred
and thirty respondents stated career Advancement as what makes them happy. Seventy eight
employees (15.1%) mentioned Job security and another seventy two mentioned Motivation as
what makes them happy.
As indicated in Table 6 (Appendix), majority of the employees indicated that management does
not meet their expectations most of the times. Three hundred and eleven (60.2%) said they
expectations are not really met by management. One hundred and thirty nine (26.9%) of them
said their expectations are met most of the times. Only fifty employees (9.7%) were emphatic
that their expectations are not met.
As indicated in Table 7 (Appendix), in suggesting what they would want the organisation to do,
one hundred and eighty one (35.0%) mentioned remuneration. This was followed by one
hundred and forty seven other respondents (28.4%) who also suggested Career Advancement.
Seventy nine employees (15.3%) mentioned motivation as what will ensure loyalty.
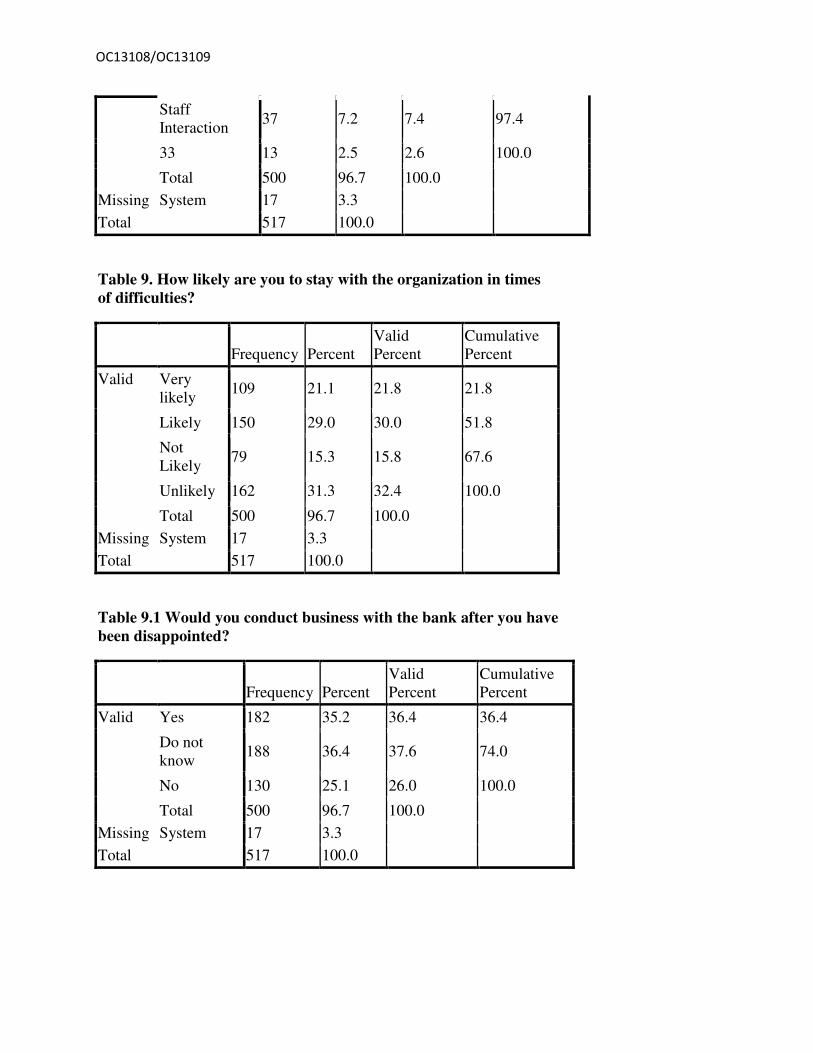
As indicated in Table 8 (Appendix), majority of the employees not withstanding whatever they
have indicated that they are likely to stay with their banks in times of difficulty. One hundred and
fifty (29.0%) said they are likely to stay and another one hundred and nine said they are very
likely to stay. However, a sizeable number of one hundred and sixty two (31.3%) were unlikely
to stay and seventy nine (15.3%) said it is not likely they will stay in times of difficulty.
Analyzing Customer Satisfaction and Loyalty
As indicated in Table 9 (Appendix), the respondents gave their opinions in case of being
disappointed by the bank. One hundred and eighty two respondents (35.2%) indicated that they
will still transact business even if they are disappointed. Another One hundred and eighty eight
respondents also were of the view that they didn’t know whether they will or not. However, one
hundred and thirty (25.1%) emphatically said they will not transact business again when they are
disappointed.
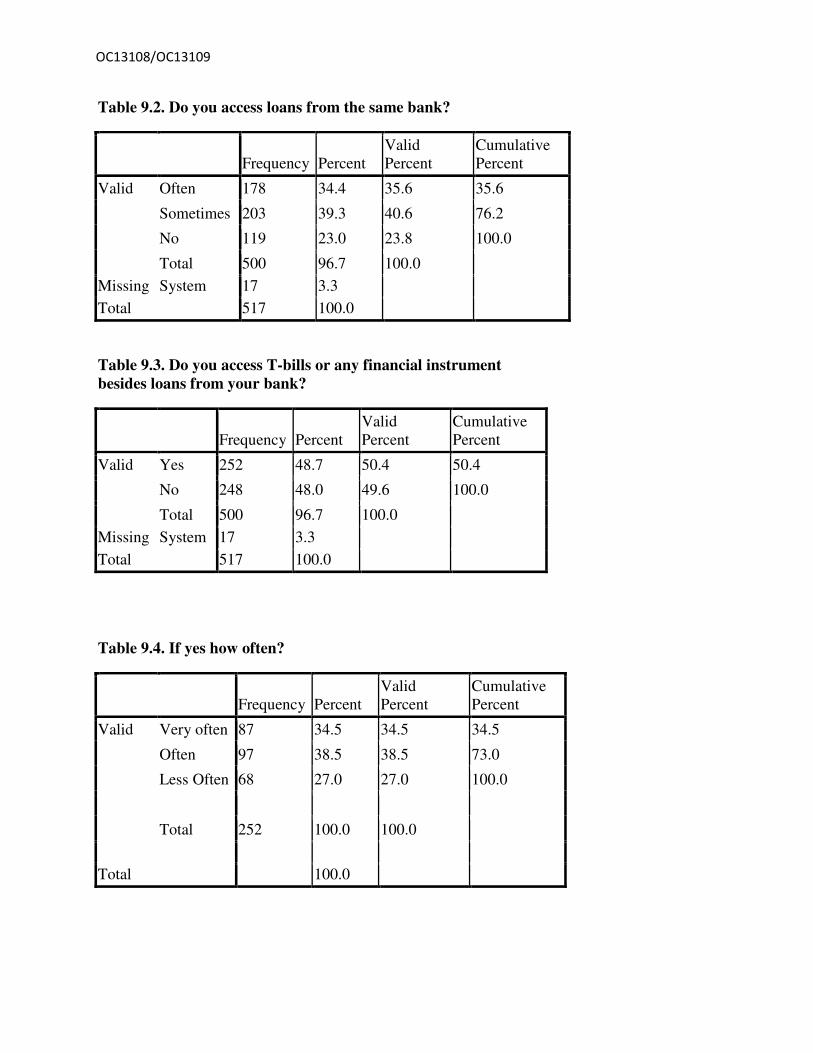
As indicated in Table 9.1 (Appendix), majority of them indicated that they access loans from
their banks. However, the frequency of the access differed. Two hundred and three one of them
(39.3%) said they do so sometimes whereas One hundred and seventy eight of them (34.4%)
indicated that they do so often times.
As indicated in Table 9.2 (Appendix), on the issue of patronizing other financial instruments
such as T-Bills, loans etc, majority of the respondents two hundred and fifty two which
represents (48.7%) said they do and another two hundred and forty eight of them (48.0%) said
they do not.
OC13108/OC13109
As indicated in Table 9.3 (Appendix), of the two hundred and fifty two respondents who
indicated that they access T-Bills, eighty seven respondents representing 34.5% indicated that
they access the T-Bills very often with another Ninety seven (38.5%) indicating that they do it
often times. Sixty eight also said they do this less often.
As indicated in Table 9.4 (Appendix), the Two hundred and forty eight respondents who were
not patronizing the T-Bills also intimated as to why they do not. One hundred and Thirty six
respondents (54.8%) stated that they are not because of High Rates and another seventy seven
respondents (31.0%) said because of cumbersome processes. The remaining thirty five
respondents indicated they don’t just access anything because they don’t want it.
As indicated in Table 9.5 (Appendix), the study brought to the fore that most people stay with
their banks based on security of their money. Majority of the respondents Two hundred and fifty
four (49.1%) mentioned security as the reason for staying with their banks. One hundred and
fifty seven respondents (30.4%) also indicated that they stay because of high interest rates on
their money. A fewer number however stated prompt customer service.
5. SUMMARY OF FINDINGS FROM THE SURVEY
5.1. Findings from the Operational Inputs of Management
Management indicated what they are doing to ensure satisfaction and subsequent loyalty from
customers. They mentioned the provision of low Cost on Transactions, instituting competitive
interest rates on both loans and deposits. They also mentioned embarking on various promotional
offers.
On employee’s grievance resolution, some managers indicated that they are swiftly dealt with,
other also indicated that they are systematically resolved with the remaining saying they put in
place ad hoc committees to look at them.
5.2. Findings from Employee Satisfaction and Loyalty
Most of the employees were found to have stayed for longer periods with their banks.
Additionally, majority of them indicated that they are happy at the banks. On this most of them
said it is about their remunerations, this was followed by those who also mentioned Career
Advancement programs at banks as what makes them happy. Others also mentioned motivational
packages.
Majority of the employees also mentioned that most of their expectations are met by
management. This is an indication that most of them are satisfied at their work. The employees
further made some observations as to what management can put in place to ensure their loyalty.
Most of them mentioned further adjustments in their remuneration. Others mentioned Career
Advancement and motivation. In view of these positive responses, most of them indicated that
they are likely to stay at their banks in times of difficulties.
OC13108/OC13109
5.3. Findings from Customer Satisfaction and Loyalty
On whether customers will still stay with the banks or not in case they are disappointed, there
was a split in the responses. Some indicated they will stay whereas others also said they will not.
Management must therefore put in place some plans to minimize this situation.
Majority of the customers were also found to be accessing T-Bills, Loans and other financial
instruments at their banks more often. This indicates that they are satisfied and show loyalty
towards their banks. Others however, indicated that they do not access financial instruments
from their banks. They gave reasons such as high interest rates charged on them and
cumbersome processes in accessing the facilities.
The satisfaction and subsequent loyalty of customers was further explained when most of them
indicated that they are will be staying with their banks. This they said is because, their banks
provide high rates on their monies, the provision of prompt services and security for investments.
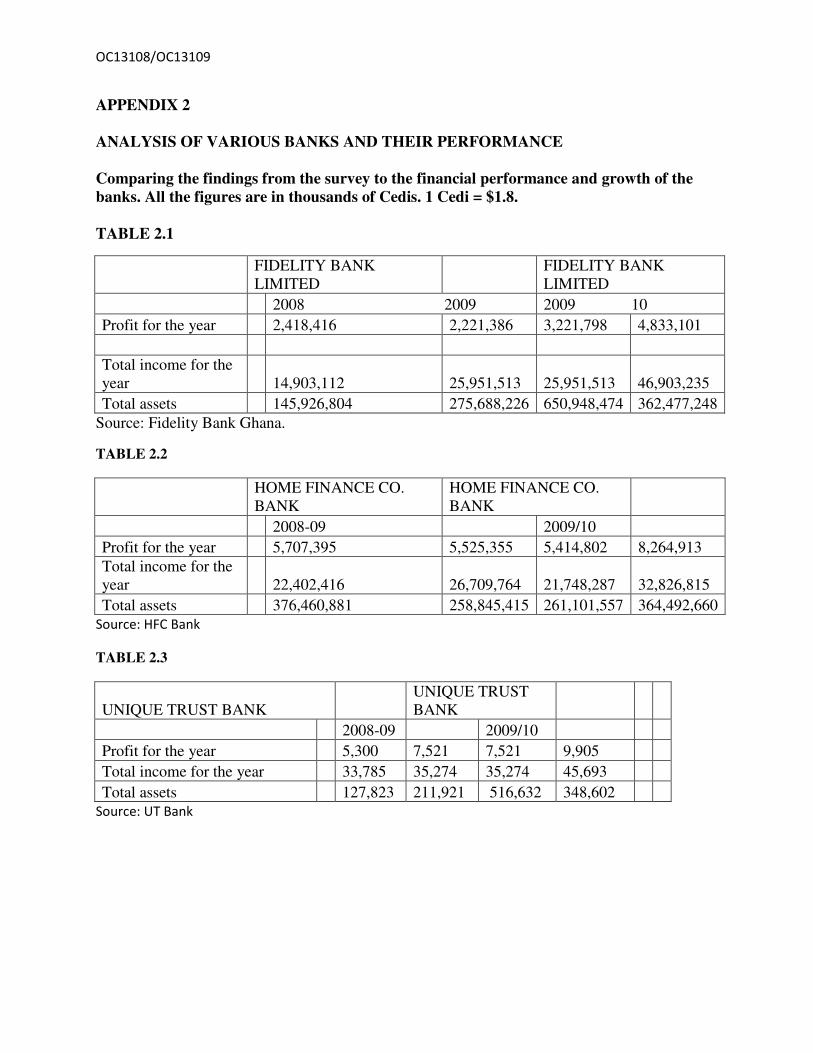
6.0. ANALYSIS OF VARIOUS BANKS AND THEIR PERFORMANCE
Comparing the findings from the survey to the financial performance and growth of the banks.
The various findings from the survey were then compared to the financial performance of the
banks. The financial reports of the five banks under study were analyzed for a three year period
from 2008 – 2010. From the analysis of the survey data, it was found out that there are generally
positive responses from customers in terms of their satisfaction and loyalty to their banks. The
impact of these responses on the profitability and growth of the banks were determined by
analyzing the banks financial reports. They are as follows:
As the first and only Ghanaian bank to be ISO certified in2010 for information protection,
Fidelity bank has proven that they are serving and also preserving customer information in a
trustworthy and secured manner. This has also resulted in the increase of the Bank’s Branches
from 25 to 45 over a period of two years reflected in the increase of their total Assets (Table 2.1
Appendix). The ultimate effect is exhibited by the increase in staff strength from 340 to 469 over
the period under consideration. All this goes to show that the bank is providing satisfaction from
quality service delivery and is being rewarded in terms of profits and is also attractive to
prospective and existing customers and employees.
Coming out from a successful rebranding of corporate image, operations and name change from
HOME FINANCE COMPANY to HFC BANK in 2008, this bank has come far. From the
analysis, there are indicators of a successful company pursuing service quality in its operations
OC13108/OC13109
for both customers and employees. As indicated in table 2.1 (Appendix), both Profit and total
assets of this Bank have risen steadily from the period under consideration. This improvement
can be attributed to exceptional service quality provided by the bank.
As indicated in Table 2.3 (Appendix), another bank that is a high riser in terms of its
performance in the industry is UT BANK. Over the years under consideration the Bank has
managed to increase its Assets and profitability through the increase of branches, and employees
(346) as well as its profits and income. All the above operational activities suggest that UT
BANK is also perfecting service quality, as this can also be manifested in the numerous awards
ranging from the best company in Ghana, business and financial service excellence award (Gold
award), Marketing man of the year (CEO) among others. These awards came from reputable
institutions like the Chartered Institute of Marketing –Ghana (CIMG), Ghana Investment
Promotion Council (GIPC). These reputable organizations also take their inputs from customers
of the various Banks in the industry which goes to prove Zeithaml and Berry’s (1985 and 1988)
perspective that service quality is the preserve of customers whether internal (employees) or
external (customers) as they are the ones who will experience the service.
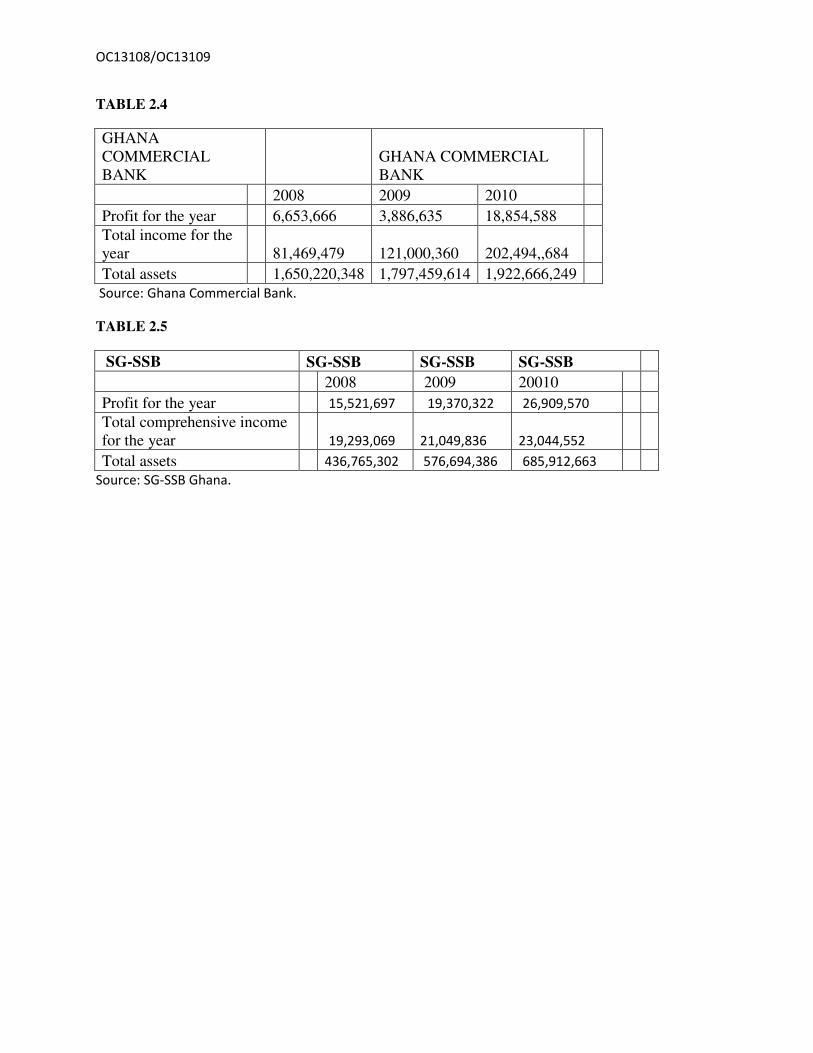
As the bank with the highest number of branches (157) the national Bank is certainly on the right
track with respect to providing service quality over the years. From 2008-2010 GCB has risen
steadily in their operations and this is a result of the service they deliver to their customers.
Reasons for their quality service delivery could be attributed to their product and service
innovation coupled with improved customer service over the years. This is manifested in the
enormous Assets and profitability they have garnered over the period under consideration as
indicated in Table 2.4 (Appendix)
SG-SSB has also proved to be a force to reckon with in the banking industry. From the analytical
standpoint, the bank has grown with superior customer service and, employee empowerment.
This has expanded their Asset base –as indicated in Table 2.5 (Appendix) year on year. This goes
to prove that they (SG-SSB) has been able to hold onto their customers by serving them well and
this resulted in improved fortunes.
APPENDIX 1.
The Analysis of the Survey
OC13108/OC13109
Table 1.0 What are some of the things you do to ensure loyalty from customers?
Frequency Percent
Valid
Percent
Cumulative
Percent
Valid Promotional Offers 6 24 24 24
Innovative Products 2 8 8 32
Low COTs 9 36 36 68
Comprehensive Interest
rates 8 32 32 100
Total 25 100 100
Table 2. How do you see the employee grievances resolution?
Frequency Percent
Valid
Percent
Cumulative
Percent
Valid Very swift 10 40.0 40.0 40.0
Systematic 8 32.0 32.0 72.0
Through Ad hoc
Committees 7 28.0 28.0 100.0
Total 25 100.0 100.0
Table 3. Do you have a mechanism for measuring customer satisfaction?
OC13108/OC13109
Frequency Percent
Valid
Percent
Cumulative
Percent
Valid Yes 452 87.4 90.4 90.4
Not Really 48 9.3 9.6 100.0
Total 500 96.7 100.0
Missing System 17 3.3
Total 517 100.0
Analyzing Employee Loyalty And Satisfaction
Table 4 . Kindly indicate the number of years you have worked with the bank.
Frequency Percent
Valid
Percent
Cumulative
Percent
Valid 1 year and
below 76 14.7 15.2 15.2
2yrs 127 24.6 25.4 40.6
3yrs 161 31.1 32.2 72.8
4yrs and
Above 136 26.3 27.2 100.0
Total 500 96.7 100.0
Missing System 17 3.3
Total 517 100.0
Table 5. Are you happy at your workplace?
Frequency Percent
Valid
Percent
Cumulative
Percent
Valid Yes 252 48.7 50.4 50.4
Do not
know 146 28.2 29.2 79.6
Not Really 102 19.7 20.4 100.0
Total 500 96.7 100.0
Missing System 17 3.3
Total 517 100.0
OC13108/OC13109
Table 6. What are some of the things that make you happy at your work place?
Frequency Percent
Valid
Percent
Cumulative
Percent
Valid Career
Advancement 130 25.1 26.0 26.0
Remuneration 149 28.8 29.8 55.8
Motivation 72 13.9 14.4 70.2
Job Security 78 15.1 15.6 85.8
Staff
Interactions 71 13.7 14.2 100.0
Total 500 96.7 100.0
Missing System 17 3.3
Total 517 100.0
Table 7. Does management meet your expectation most of the time?
Frequency Percent
Valid
Percent
Cumulative
Percent
Valid Yes 311 60.2 62.2 62.2
Not Really 139 269 27.8 90.0
No 50 9.7 10.0 100.0
Total 500 96.7 100.0
Missing System 17 3.3
Total 517 100.0
Table 8. What do you expect the organization to put in place to ensure your loyalty?
Frequency Percent
Valid
Percent
Cumulative
Percent
Valid Motivation 79 15.3 15.8 15.8
Remuneration 181 35.0 36.2 52.0
Career
Advancement 147 28.4 29.4 81.4
Job Security 43 8.3 8.6 90.0
OC13108/OC13109
Staff
Interaction 37 7.2 7.4 97.4
33 13 2.5 2.6 100.0
Total 500 96.7 100.0
Missing System 17 3.3
Total 517 100.0
Table 9. How likely are you to stay with the organization in times of difficulties?
Frequency Percent
Valid
Percent
Cumulative
Percent
Valid Very
likely 109 21.1 21.8 21.8
Likely 150 29.0 30.0 51.8
Not
Likely 79 15.3 15.8 67.6
Unlikely 162 31.3 32.4 100.0
Total 500 96.7 100.0
Missing System 17 3.3
Total 517 100.0
Table 9.1 Would you conduct business with the bank after you have been disappointed?
Frequency Percent
Valid
Percent
Cumulative
Percent
Valid Yes 182 35.2 36.4 36.4
Do not
know 188 36.4 37.6 74.0
No 130 25.1 26.0 100.0
Total 500 96.7 100.0
Missing System 17 3.3
Total 517 100.0
OC13108/OC13109
Table 9.2. Do you access loans from the same bank?
Frequency Percent
Valid
Percent
Cumulative
Percent
Valid Often 178 34.4 35.6 35.6
Sometimes 203 39.3 40.6 76.2
No 119 23.0 23.8 100.0
Total 500 96.7 100.0
Missing System 17 3.3
Total 517 100.0
Table 9.3. Do you access T-bills or any financial instrument besides loans from your bank?
Frequency Percent
Valid
Percent
Cumulative
Percent
Valid Yes 252 48.7 50.4 50.4
No 248 48.0 49.6 100.0
Total 500 96.7 100.0
Missing System 17 3.3
Total 517 100.0
Table 9.4. If yes how often?
Frequency Percent
Valid
Percent
Cumulative
Percent
Valid Very often 87 34.5 34.5 34.5
Often 97 38.5 38.5 73.0
Less Often 68 27.0 27.0 100.0
Total 252 100.0 100.0
Total 100.0

OC13108/OC13109
Table 9.5. If no why
Frequency Percent
Valid
Percent
Cumulative
Percent
Valid High Rates 136 54.8 54.8 54.8
Cumbersome processes 77 31.0 31.0 85.8
Just don’t want it 35 14.2 14.2 100.0
Total 248 100.0 100.0
Total 100.0
Table 9.6 What are some of the reasons you will give for staying with the bank?
Frequency Percent
Valid
Percent
Cumulative
Percent
Valid High rates 157 30.4 31.4 31.4
Security 254 49.1 50.8 82.2
Prompt
Service 89 17.2 17.8 100.0
Total 500 96.7 100.0
Missing System 17 3.3
Total 517 100.0
OC13108/OC13109
APPENDIX 2 ANALYSIS OF VARIOUS BANKS AND THEIR PERFORMANCE
Comparing the findings from the survey to the financial performance and growth of the banks. All the figures are in thousands of Cedis. 1 Cedi = $1.8.
TABLE 2.1
FIDELITY BANK
LIMITED
FIDELITY BANK
LIMITED
2008 2009 2009 10
Profit for the year 2,418,416 2,221,386 3,221,798 4,833,101
Total income for the
year 14,903,112 25,951,513 25,951,513 46,903,235
Total assets 145,926,804 275,688,226 650,948,474 362,477,248
Source: Fidelity Bank Ghana.
TABLE 2.2
HOME FINANCE CO.
BANK
HOME FINANCE CO.
BANK
2008-09 2009/10
Profit for the year 5,707,395 5,525,355 5,414,802 8,264,913
Total income for the
year 22,402,416 26,709,764 21,748,287 32,826,815
Total assets 376,460,881 258,845,415 261,101,557 364,492,660
Source: HFC Bank
TABLE 2.3
UNIQUE TRUST BANK
UNIQUE TRUST
BANK
2008-09 2009/10
Profit for the year 5,300 7,521 7,521 9,905
Total income for the year 33,785 35,274 35,274 45,693
Total assets 127,823 211,921 516,632 348,602
Source: UT Bank
OC13108/OC13109
TABLE 2.4
GHANA
COMMERCIAL
BANK
GHANA COMMERCIAL
BANK
2008 2009 2010
Profit for the year 6,653,666 3,886,635 18,854,588
Total income for the
year 81,469,479 121,000,360 202,494,,684
Total assets 1,650,220,348 1,797,459,614 1,922,666,249
Source: Ghana Commercial Bank.
TABLE 2.5
SG-SSB SG-SSB SG-SSB SG-SSB
2008 2009 20010
Profit for the year 15,521,697 19,370,322 26,909,570
Total comprehensive income
for the year 19,293,069 21,049,836 23,044,552
Total assets 436,765,302 576,694,386 685,912,663
Source: SG-SSB Ghana.
OC13108/OC13109
Reference
Allen, Nathalie J. and Douglas B. Grisaffe. (2001). Employee Commitment to the Organization
and Customer Reactions: Mapping the Linkages. Human Resource Management Review 11 (3):
209-236.
Bolton, R. N. (1998). A dynamic model of the duration of the customer’s relationship with a
continuous service provider: The role of satisfaction. Marketing Science, 17, 1, 45-65.
Bowen, D. E., & Schneider, B. (1985). Boundary spanning role employees and the service
encounter: Some guidelines for management and research. The service encounter: 127-147.
Lexington, MA: D. C. Heath.
Brief, A., Butcher, A. N., & Roberson, L. (1995). Cookies, dispositions, and job attitudes: The
effects of positive mood-inducing events and negative affectivity on job satisfaction in a field
experiment. Organizational Behavior & Human Decision Processes, 62: 55-62.
Carr, N. G. (1999). Marketing: The economics of customer satisfaction. Harvard Business
Review, March-April, 15-18.
Curran, J. M., Meuter, M. L. and Surprenant, C. F. (2003). Intentions to Use Self-Service
Technologies: A Confluence of Multiple Attitudes. Journal of Service Research, 5, 3, 209-224.
Edwards, K. (1990), The interplay of affect and cognition in attitude formation and change.
Journal of Personality and Social Psychology, Vol. 59 pp.202-16.
Edvardsson, B., Johnson, M. D., Gustafsson, A., Strandvik, T. (2000). The Effects of
Satisfaction and Loyalty on Profits and Growth: Products and Services”, Total Quality
Management, 11, 7, S917-S927.
OC13108/OC13109
Harker, L., & Keltner, D. (2001). Expressions of positive emotion in women's college yearbook
pictures and their relationship to personality and life outcomes across adulthood. Journal of
Personality and Social Psychology, 80: 112-124.
Hatfield, E., Cacioppo, J., & Rapson, R. L. (1994). Emotional contagion. New York: Cambridge
University Press.
Heskett, J. L., Jones, T. O., Loveman, G. W., Sasser, Jr., W. E., Schlesinger, L., (1994).
Putting the service-profit chain to work, Harvard Business Review, 72, 2, 164-174.
Heskett, J.L., Sasser, W.E., Schlesinger, L. (1997), The Service Profit Chain, Free Press, New
York, NY.
Kamakura, W. A., Mittal, V., de Rosa, F., Mazzon, J. A., (2002). Assessing the Service-
Profit Chain. Marketing Science, 21, 3, 294-317.
Tornow, W.W. & Wiley, J.W. (1991). Service Quality and Management Practices: A Look at
Employee Attitudes, Customer Satisfaction and Bottom-Line Consequences. Human Resource
Planning, 14(2), 105-115
Kopelman, R. E., Brief, A.P., (1990). In B. Schneider (Ed.), Organizational Climate and
Culture: 282-318. San Francisco: Jossey-Bass.
Koys, D. J. (2001). The Effects of Employee Satisfaction, Organizational Citizenship Behavior,
and Turnover on Organizational Effectiveness: A Unit-level Longitudinal Study. Personnel
Psychology, 54 (1), 101-114.
Medina-Borja, A., (2002). A Non-Parametric Approach to Evaluate the Performance of
Social Service Organizations, Dissertation, Virginia Tech, Falls Church, VA.

OC13108/OC13109
Mittal, V., Kumar, P., and Tsiros M. (1999). Attribute-level Performance, Satisfaction, and
Behavioral Intentions Overtime: a Consumption-System Approach. Journal of Marketing, 63 (2),
88-101.
Ostroff, C., & Bowen, D.E. (2000). Moving HR to a higher level: Human Resource Practices
and Organizational Effectiveness. San Francisco: Jossey-Bass.
Ostroff, C., and Kinicki. (2002). Organizational Culture and Climate. Industrial and
Organizational Psychology: 565-594. New York: Wiley.
Parasuraman, A., Zeithaml, V.A. and Berry, L.L. (1985). A Conceptual Model of Service
Quality and Its Implications for Future Research. Journal of Marketing, Fall 1985, 41-50.
Paul M. Muchinsky (1997), Psychology applied to work: an introduction to industrial and
organizational psychology, Cornell University. Dorsey Press.
Peters, Thomas J., and Jr. Waterman, Robert H. (1984). In Search of Excellence: Lessons from
America’s Best-Run Companies. New York: Harper & Row.
Pugh, S. D. (2001). Service with a smile: Emotional contagion in the service encounter.
Academy of Management Journal, 44: 1018-1027.
Reichheld, F. F. (1996). The Loyalty Effect – The Hidden Force Behind Growth, Profits
and Lasting Value, Boston, Harvard Business School Press.
Roth, A. V. and Jackson III, W. E. (1995). Strategic determinants of service quality and
performance: Evidence from the banking industry. Management Science, 41, 11,
1720-1733.
Rucci, A. J., Kirn, S. P. and Quinn, R. T. (1998). The employee-customer-profit chain at
Sears, Harvard Business Review, Jan-Feb, 83-97.

OC13108/OC13109
Rust, R. T., Zahorik, A. J., Keiningham, T. L. (1995). Return on Quality (ROQ): Making
service quality financially accountable, Journal of Marketing, 59, April, 58-70.
Schneider, B. & Bowen, D. E. (1985). Employee and customer perceptions of service in banks:
Replication and extension. Journal of Applied Psychology, 70, 423-433.
Schneider, B., Parkington, J. J., & Buxton, V. M. (1980). Employee and customer perceptions of
service in banks. Administrative Science Quarterly, 25, 252-267.
Simons, R. (1990). Rethinking the role of systems in controlling strategy. Harvard Business
School, note 9-191-091.
Soteriou, A. and Zenios, S. A. (1999). Operations, Quality and Profitability in the Provision of
Banking Services. Management Science, 45, 9, 1221-1238.
Teas, R.K. (1993), Expectations, performance, evaluation, and consumers' perceptions of
quality, Journal of Marketing, Vol. 57 No.4, pp.18-34.
Ulrich, D., Halbrook, R., Meder, D., Stuchlik, M., & Thorpe, S. (1991). Employee and customer
attachment: Synergies for competitive advantage. Human Resource Planning, 14, 89–103.
Wiley, J. W., & Brooks, S. M. (2000). The high performance organizational climate: How
workers describe top performing units. In N. S. Ashkanasy, C. Wilderom, & M. F. Peterson
(Eds.), The handbook of organizational culture and climate (pp. 177-191). Thousand Oaks, CA:
Sage Publications.
Zeithaml, V.A., Bitner, M.J. (2003), Services Marketing, Integrating Customer Focus across the
Firm, 3rd ed., McGraw-Hill-Irwin, New York, NY.
Related Documents