Alliance Center for Global Research and Education Service Competition and Product Quality in the U.S. Automobile Industry _______________ Jose A. GUAJARDO Morris A. COHEN Serguei NETESSINE 2012/54/TOM/ACGRE

Welcome message from author
This document is posted to help you gain knowledge. Please leave a comment to let me know what you think about it! Share it to your friends and learn new things together.
Transcript

Alliance Center
for Global Research
and Education
Service Competition and Product Quality
in the U.S. Automobile Industry
_______________
Jose A. GUAJARDO
Morris A. COHEN
Serguei NETESSINE
2012/54/TOM/ACGRE

Service Competition and Product Quality in the U.S.
Automobile Industry
Jose A. Guajardo*
Morris A. Cohen**
Serguei Netessine***
May 23, 2012
* Doctoral Student at Wharton School, University of Pennsylvania, 3730 Walnut Street
533.3 Jon M. Huntsman Hall, Philadelphia, PA19104, USA.
Email: [email protected]
** Panasonic Professor of Manufacturing & Logistics, Professor of Operations and Information
Management, Co-Director, Fishman-Davidson Center for Service and Operations
Management at Wharton School, University of Pennsylvania, 3730 Walnut Street
533.3 Jon M. Huntsman Hall, Philadelphia, PA19104, USA.
Email: [email protected]
*** The Timken Chaired Professor of Global Technology and Innovation, Professor of
Technology and Operations Management, Research Director of the INSEAD-Wharton
Alliance at INSEAD Boulevard de Constance 77305 Fontainebleau, France.
E-mail: [email protected]
A Working Paper is the author’s intellectual property. It is intended as a means to promote research to
interested readers. Its content should not be copied or hosted on any server without written permission
from [email protected]
Click here to access the INSEAD Working Paper collection

Abstract
We formulate a structural econometric model to analyze the impact of service attributes
(warranty length, after-sales service quality) on consumer demand in the U.S.automobile
industry. Our results indicate that service attributes play a compensatory role with respect to
product quality, i.e., the impact of warranty length and service quality on demand increases
when product quality decreases. Conversely, both service metrics are complementary with
respect to demand, i.e., the better the service quality, the higher the marginal effect of longer
warranties. Our results estimate a median willingness to pay for one year of warranty of about
$850, which is equivalent to 2.5% of the average vehicle price in our sample. We find that,
for an average car in our sample, the effect on demand of a 1% price decrease is equivalent to
increasing product quality by 3%, which is in turn equivalent to increasing the warranty
length by 9%.
Keywords: Services in Manufacturing; Competition; Differentiated Products; Pricing; Product
Quality; Service Quality; Warranty; Automobiles; Econometrics

1. Motivation
A fundamental trend in manufacturing industries is the movement from a “pure manufactur-
ing”paradigm to a business model in which a central role is assigned to the service component
of products based on the value they provide to consumers (Cohen et al. 2006). The move-
ment towards a service-based economy has coincided with this change and has encouraged
many manufacturing firms to put more emphasis on the delivery of services associated with
their product offerings (Shankar et al. 2009). It has been reported that the sales of after-
sales services and spare parts represent 8% of the annual gross domestic product in the U.S.
(Cohen et al. 2006). In the automotive sector, in particular, recent industry reports indicate
that for manufacturers in this industry, service and parts operations are on average 54%
more profitable than the main business of producing and selling vehicles, and account for
an average of 36% of revenues (Koudal 2008). In the technology sector, companies like IBM
that traditionally sold manufactured goods, today derive more than 50% of their revenue
from services (Suarez et al. 2008). In short, services have become an important part of an
OEM’s competitive strategy in traditional manufacturing industries. While existing models
of product differentiation in manufacturing industries have provided some insights in ex-
plaining the consequences of pricing and other product characteristics on demand, they have
mostly ignored the impact of services. This paper takes a step in addressing this issue, by
formulating an empirical model to analyze the role of services as part of a firm’s competitive
strategy in the U.S. automobile industry, and the joint effect that service attributes and
product quality have on consumer demand.
The automobile industry has served as a preferred setting for empirical studies on product
differentiation (e.g. Berry et al. 1995 and 2004, Sudhir 2001, Train and Winston 2007, among
many others), and constitutes a natural choice for our research. Indeed, Standard & Poor’s
(2011) reports that in this industry “product quality and design are becoming less of an issue
in differentiating foreign and domestic manufacturers,” as a result of the actions taken by
Detroit automakers to improve their designs and to streamline their manufacturing processes
in recent decades. Services, on the other hand, represent an important differentiating factor
for automakers, especially given the high level of competition and low concentration in the
U.S. automobile market (Koudal 2008). The fact that auto OEM’s have been adjusting
their service strategies in recent years, as we describe shortly, provides some support for this
notion.
We focus on services during the in-warranty period. In particular, we measure the service
dimension of a brand by the length of its warranty, along with a metric of the after-sales
service quality delivered during the in-warranty period. The warranty period covered by
2

OEM’s has steadily increased over time, from about three months in the 1930’s, to as much as
ten years in recent years (Murthy and Blischke 2006). The length of the warranty defines the
period in which repair services are provided by the OEM as part of the value that consumers
obtain with the purchase of the car, and therefore is a managerial decision that partially
reflects the service intensity provided by OEM’s. Firms have been active on adjusting the
length of their warranties in the last decade: Ford, Chevrolet, Acura, Mazda, Mitsubishi,
Audi and Kia are just some examples of brands that have increased the length of their
warranties in that period. For example, Ford increased their powertrain warranty from 3
years/36,000 miles to 5 years/60,000 miles in 2007. In the words of a spokeperson from Ford
when asked about the reasons behind the warranty length increase: “We think that some
people weren’t considering Ford products because we didn’t have an extended powertrain
warranty versus some of our competition. We hope that it will increase our competitiveness...
We think that customers do want it, and do care about it” (Warranty Week 2006). On
the other hand, Chrysler and Volkswagen both decreased their warranty length at least
once during the same period. Indeed, company sources have suggested that the increase in
warranty length by Chrysler for the 2008 model year “wasn’t as valuable to consumers as
we might have hoped” (Automotive News 2009), and as a result the company cut it back in
2009.
Firms face an important trade-off when defining their warranty period: while longer
warranties may potentially increase product demand, they also generate significant costs.
For U.S.-based automakers, these costs have typically been in the range of $10 billion per
year, which represents roughly 2-4% of their yearly revenue (Warranty Week 2011). These
data, along with the aforementioned managerial actions and the attention of the trade press
to them, reflect the importance of improving our understanding of the role of warranties and
service attributes as drivers of demand, the conditions under which they influence demand,
and the magnitude of these effects.
In this paper we formulate and estimate a structural model to measure the impact of
service attributes on consumer demand in the U.S. automobile industry. Combining data
from multiple sources, we propose an empirical model using market-level data for new light
cars sold in the U.S. between 2001 and 2007, a period in which firms actively adjusted their
service and warranty strategies. Our analysis is based on a random coefficients logit demand
model that allows for customer heterogeneity in tastes for different car attributes and, unlike
most existing models, incorporates the two aforementioned variables to characterize firm
service strategies, i.e. warranty length and the quality of after-sales service. Our results
provide new evidence to explain the influence of warranty length and service quality on the
demand for a given model, relative to the influence of other characteristics such as price and
3

product quality. Most existing empirical models of competition in this and other industries
deal with the endogeneity of prices while assuming that all other characteristics in the demand
specification are exogenous. Our model is different in that we not only endogenize pricing but
also the warranty length decision. We do so by generating instruments based on the factors
driving firm decision-making for the warranty length. Our findings indicate that, when the
endogeneity of warranties is ignored, service attributes do not have a significant impact on
demand. Once the endogeneity of warranties is considered, however, there is a significant
effect of warranty length on demand, while service quality does not have a significant effect
when this variable is considered in isolation. Our estimates imply a median willingness to pay
for one year of warranty of about $850, and that for a vehicle with average characteristics in
our sample, a 1% price decrease has the same effect on consumer demand as an improvement
in warranty length of 9% or as a 3% improvement in the vehicle’s product quality.
We also investigate complementarities and substitution effects between warranty length,
service quality and product quality. Indeed, the following example from a survey by CNW
Marketing Research1 illustrates that there may be important differences in warranty effects
across firms. The company conducted a survey (September-November 2006) with shoppers
of GM, Hyundai, and Toyota, asking them how important the length of the warranty was
in their shopping decision. The results of the survey revealed that 45.1% of all intenders
considered the warranty length to be “extremely or very important” in order to have these
companies on their shopping list. Breaking down the results at the company level, however,
showed important differences, i.e., the percentage of intenders that considered the length of
the warranty extremely or very important was 54.6% for Hyundai intenders, 53.4% for GM
intenders, and only 28.4% for Toyota intenders. To our knowledge, the existing literature
has not offered an explanation consistent with these data. While multiple hypotheses can
be proposed to explain the difference in these specific cases, our research conducts a system-
atic analysis to understand the joint influence of service attributes and product quality on
consumer demand. We propose that warranty length, service quality and product quality,
interact in a non-trivial way in the consumer’s value function, and we investigate the nature
of these interactions. In particular, we test whether the effect of service attributes on con-
sumer demand is independent of, or is a complement or substitute for product quality. The
theory of compensatory effects on consumer decision-making (e.g. Dieckmann et al. 2009)
support the hypothesis that both dimensions act as substitutes, i.e., good service serves the
main purpose of compensating consumers for poor product quality. Alternatively, service
attributes could be complements with product quality if consumers see both dimensions as
reinforcing their brand preference, i.e., if the primary effect of offering good product quality
1Available at http://www.cnwbyweb.net (subscription required to access data)
4
and good service is to create better brand image. Our results indicate that the value that
consumers derive from warranty length and service quality in the U.S. automobile industry
increases when product quality decreases, i.e. service attributes have a bigger impact on
demand when product quality is low, providing evidence for a compensatory rather than a
complementary role of services relative to product quality. Similarly, we test whether both
service attributes have independent, complementary or substitution effects on demand, and
find evidence for a complementary relationship in this case, which is contrary to our find-
ings for the case of product quality. This suggests that a firm that increases its warranty
length would make the most out of this investment (in terms of its impact on demand) by
simultaneously investing in providing better service quality. The results of our analysis thus
indicate that the joint consideration of product and service is essential for the development
of an effective competitive strategy.
2. Related Literature
Service competition is a major topic of interest in operations management (OM). In tra-
ditional service industries, theoretical models have examined competition when consumer
demand depends on price and service levels (So 2000, Cachon and Harker 2002, Allon and
Federgruen 2007 and 2009, Bernstein and Federgruen 2007), and in empirical OM research
several studies have tested some of these and related theories in, e.g., the fast food industry
(Allon et al. 2011) and the banking industry (Buell et al. 2011). In manufacturing indus-
tries, in contrast, service competition has been the subject of theoretical models in OM,
e.g., service competition between a manufacturer and a retailer (Cohen and Whang 1997),
between retailers that interact strategically with a manufacturer (Tsay and Agrawal 2000),
and between manufacturers (Lu et al. 2011). The empirical evidence in the case of manu-
facturing industries, however, is scarce, and indeed we are not aware of any OM papers that
analyze the impact of service competition on consumer demand in manufacturing industries
empirically. In the economics literature, on the other hand, theoretical models of product
differentiation (e.g. Shaked and Sutton 1982, Caplin and Nalebuff 1991), have prompted
numerous empirical studies, especially in the automobile industry where researchers have
studied different aspects of firm competition and consumer demand (e.g. Berry et al. 1995
and 2004, Train and Winston 2007, among many others). Similar to the OM literature, these
economic models of demand have omitted the role of supporting services by automakers. Our
paper thus attempts to fill this gap by analyzing the role of service attributes as drivers of
consumer demand in the U.S. automobile industry. Moreover, as our results illustrate, con-
sidering the interaction between service attributes and product quality is essential in order
5

to disentangle the effects of service attributes on demand in this industry, and thus analyzing
service competition in a manufacturing industry offers new evidence that goes beyond what
has been done in service industries.
One of the service variables we focus on is length of warranty. Four main rationales re-
garding the economic role of warranties have been proposed in the literature (see e.g. Emons
1989 for a comprehensive discussion): protection against product failures (insurance role),
provision of product quality information to consumers (signaling role), a mechanism to dis-
criminate consumer risk preferences if customer heterogeneity is not fully observable by the
seller (sorting role), and to incentivize the seller to improve product quality (incentives role).
These theories would thus be consistent with consumer preferences for longer warranties,
all else being equal. Regarding the insurance role (e.g. Heal 1977), warranties provide con-
sumers with some security against poor product quality and are often used by manufacturers
as a value-added feature to promote their products (Thomas 2006). The signaling argument,
on the other hand, predicts that higher quality products will have longer warranties, and is
perhaps the one that has received the most attention. Since Spence’s model of perfect com-
petition in which warranties serve as signals of reliability (Spence 1977), several theoretical
models have qualified this finding in alternative settings (e.g. Cooper and Ross 1985, Gal-Or
1989). Empirical tests of the signaling role of warranties are also numerous. While early
papers like Wiener (1985) showed a positive association between warranty length and prod-
uct quality providing support for the signaling argument, others like Douglas et al. (1993)
showed that the opposite is possible. More recently -and more broadly- Chu and Chintagunta
(2011) empirically tested for the different roles of warranties in the U.S. automobile and PC
server industries, finding support for the insurance and sorting role of warranties, but not
for the signaling and incentives roles. Given the numerous papers studying the economic
role of warranties, we do not address this question and rather build our model upon some of
the findings in this literature, to study how service attributes such as warranty length and
service quality, along with product quality, jointly influence consumer demand.
Empirical models of demand related to ours that include consumer response to warranties
include Menezes and Currim (1992) and Chu and Chintagunta (2009). Menezes and Currim
(1992) formulate a theoretical model to define the appropriate warranty length for firms,
and they also perform some empirical testing in the automobile industry. Their empirical
analysis is based on a sales response model (aggregate demand function), for which OLS
analysis is performed, and in which several attributes (including aggregate functions of other
firms’ actions) are used to explain total sales for a given model. They do not deal with
the endogeneity of either the price or the warranty length in the demand specification. In a
paper more closely related to our study, Chu and Chintagunta (2009) empirically analyze the
6

value of warranties in the U.S. server market. Their research in this B2B setting quantifies
the value of warranties for manufacturers, intermediaries and customers, and finds a positive
value for warranties in all cases. As in our case, their demand model is based on a random
coefficients logit model that allows for customer heterogeneity and that is based on market
data, but they only account for the endogeneity of the pricing decision.
While past empirical studies are certainly relevant for our analysis, we establish at least
three important differences. First, these papers focus on warranties exclusively, while our in-
terest is in services more broadly defined, which includes not only the firm’s warranty length
but also its service quality in the demand specification. Second, our focus is on understand-
ing the effect on demand of the interaction between service attributes and product quality,
in order to enlighten firm decision-making regarding both of them. To our knowledge, our
findings in this regard have not been established in previous empirical literature. Third,
from a methodological perspective, unlike past papers, note that we explicitly deal with
the endogeneity of both pricing and warranties, and our identification strategy for warranty
effects could be used in other settings2. With respect to the third aspect, most existing
models of product differentiation have accounted for the endogeneity of prices in the de-
mand specification, under the assumption of exogeneity of all other product characteristics.
This assumption has been recognized as an important shortcoming in this literature (Berry
1994). As a response, a recent and growing stream of research on endogenous product choice
has considered models in which some product characteristics other than price are treated as
endogenous (see Crawford 2012 for a recent review of this research stream; good examples in-
clude Draganska et al. 2009 and Fan 2011). Our research thus also relates to the endogenous
product choice literature, as we deal with the endogeneity of both pricing and the warranty
length decision by firms. Finally, our research is also related to the numerous empirical
studies in OM that examine the automobile industry, including Fisher et al. (1999), Ramdas
and Randall (2008), Olivares and Cachon (2009), and Gallino et al. (2012), among many
others, that as ours attempt to examine some aspect that contribute to an understanding of
factors influencing the matching between what firms supply and what consumers demand in
this industry.
In short, this paper contributes to the aforementioned streams of research by being one
of the first to empirically analyze the value of service attributes as drivers of demand in
manufacturing industries, and by being (to our knowledge) the first study to empirically
analyze complementarities between service attributes and product quality in the context of
demand models in a competitive manufacturing setting. Product quality, service quality
2See section 4.3 for a discussion of the required assumptions under which our identification strategy isvalid.
7

and warranty length are variables of longstanding importance in OM research. The new
empirical evidence of their impact on demand in a competitive setting provided in this paper,
contributes to a better understanding of the strategic implications of the joint management
of these variables by firms.
3. Data and Industry Background
Market-level data was collected from different sources for our analysis. We obtained data
on sales and product characteristics from Ward’s Automotive, for all new light cars sold
in the U.S. in the period 2001-2007. Vehicle specifications include miles-per-gallon, length,
width, height, horsepower and weight, among other features. Data about warranty length
were obtained from Automotive News for the period 2003-2007; we completed and validated
the data for the period 2001-2007 from the manufacturers’ websites and the 2009 Official
Warranty Guide (J&L Warranty Pros). Data on product quality and service quality at
the brand level were obtained from J.D. Power’s press releases. Aggregate yearly data on
transactional prices were obtained from a secondary source, based on J.D. Power data. Below,
we discuss some characteristics of these data sources in more detail, along with aspects of
the industry that help to clarify our analysis.
Warranty data: Automakers include manufacturer warranties bundled with the pur-
chase of every new car, to protect consumers against defects for a certain period of time/usage.
There are three main types of warranties bundled with a new car: basic, powertrain, and
corrosion. The basic warranty (a.k.a. bumper-to-bumper) is the most comprehensive and
covers most parts of a vehicle. The powertrain warranty (a.k.a drivetrain) covers the major
cost components of the car such as the engine, transmission, etc., usually for an extended
period of time (for some brands in some years, the coverage period is the same for basic
and powertrain warranties). The corrosion warranty covers the vehicle against rust. For ex-
ample, the Acura 2007 model year vehicles had basic, powertrain, and corrosion warranties
of 4/50,000, 6/70,000, and 5/unlimited [years/miles], respectively. For a given brand, there
is a high correlation between the warranty terms for these three types of warranties, and
also between the years/miles metrics. Most of the existing studies on warranties have fo-
cused on the duration of the powertrain warranty for several reasons. First, the powertrain
warranty covers the most expensive parts of the vehicle. Second, most of the changes in war-
ranty strategies by OEM’s refer to powertrain warranty duration and therefore is the richer
source of longitudinal variation, e.g., Acura from 4/50,000 to 5/70,000 in 2006, Chevrolet
from 3/36,000 to 5/100,000 in 2007, Kia from 5/60,000 to 10/100,000 in 2001, Mazda from
3/50,000 to 4/50,000 in 2003, Mitsubishi from 5/60,000 to 10/100,000 in 2004, among many
8

others. Finally, the powertrain warranty is the warranty that automakers advertise the most.
Consistent with these arguments, we use the length of the powertrain warranty in years as
our warranty variable.
Quality data: J.D. Power publishes yearly reports on product quality and service sat-
isfaction at the brand level. Here we provide a brief description of the data used in our
analysis, further details can be obtained via http://www.jdpower.com/.
Our product quality metric is based on J.D. Power’s Initial Quality Study (IQS), which
determines the number of problems per 100 vehicles in the first 90 days of ownership. The
study examines 217 vehicle attributes, and reports on a broad range of problems reported by
owners, including defects/malfunctions (complete breakdown or malfunction of any compo-
nent, feature, or item) and design problems (components or features that may be functioning
as designed, but are perceived to be difficult to use or understand, or are in a poor location).
Every year this information is summarized in a brand-level metric. For example, in 2004 the
best brand was Lexus with 87 problems per 100 vehicles, the worst was Hummer with 173
problems per 100 vehicles, and the industry average was 119 problems per 100 vehicles. In
2007, the best brand was Porsche with 91 problems per 100 vehicles, the worst was Land
Rover with 170 problems per 100 vehicles, and the industry average was 125 problems per
100 vehicles. We take the negative of the number of problems per vehicle as our product
quality metric PQjt, such that a higher value for PQjt (smaller number of problems per
vehicle) denotes higher product quality.
Similarly, J.D. Power’s Customer Service Index (CSI) measures the satisfaction of vehicle
owners who visited the dealer service department for maintenance or repair work during the
first three years of ownership. According to the J.D. Power’s description, the CSI study“pro-
vides an overall customer satisfaction index score based on six measures: service initiation,
service advisor, in-dealership experience, service delivery, service quality, and user-friendly
service.” The score is based on a 1000 point scale. For example, in 2004 the best brand was
Lincoln with a score of 912, the worst was Daewoo with a score of 754, and the industry
average was 862. Similarly, in 2007 the best brand was Jaguar with a score of 925, the
worst was Isuzu with a score of 780, and the industry average was 876. We note that this
metric refers to after-sales service at dealers during the first three years of ownership, which
is coincident with the minimum warranty period observed in the industry. This metric thus
reflects services that occurred during the in-warranty period, and in conjunction with the
warranty length, defines the variables that we use to characterize the service dimension of
a brand. Specifically, our service quality variable SQjt is a scaled version of the customer
service index (CSI score/1000).
Figure 1 displays the relationship between the IQS and CSI metrics for 2004 and 2007, for
9

the brands in our sample. Figures 2 and 3 do the same for the relationship between warranty
length and IQS and CSI, respectively. We note several interesting observations. Pooling the
data for our period of analysis at the brand level (2001-2007), we obtain a correlation of -0.64
between IQS and CSI, denoting a positive relationship between product quality and service
quality (recall that the IQS index reflects negative product quality). As illustrated in Figure
1, most brands are located on the diagonal of the graph. The graph from 2004 suggests some
exceptions, like Saturn (low product quality, high service quality), and Hyundai and Toyota
(high product quality, low service quality). Similarly, we obtain correlations of 0.13 between
warranty and IQS, and -0.29 between warranty and CSI. These statistics reflect a negative
correlation between warranty length and both product quality and service quality. Note that
the negative correlation between warranty and product quality counters the signaling role of
warranties.
Finally, we note that, while the service experience at dealers is not fully determined by
OEM’s, they can and do influence the service process in several ways (see e.g. Cohen et
al. 2000). First, OEM’s impose guidelines and service standards on their dealers. Sec-
ond, they can facilitate the quality of service delivered by dealers through a wide range of
managerial interventions, e.g., by setting up parts pooling mechanisms, sharing information,
using vendor-managed inventory and implementing a generous parts return policy for deal-
ers. Third, OEM’s usually set up incentive programs, whereby a dealer’s compensation is, in
part, based on service performance. Finally, the design of the service network, for example,
the definition of the number of dealers, is ultimately defined by the OEM.
Sales, prices and product characteristics: We obtained data on sales and product
characteristics from Ward’s Automotive for all new light cars sold in the U.S. between 2001
and 2007. This includes cars belonging to the segments small, middle, large and luxury, as
categorized by Ward’s. Sales data is available at the make-model level (e.g. Toyota Corolla)
monthly. Data on product characteristics (e.g. miles-per-gallon, length) is available for each
model year and for each of the versions of a given make-model. As noted in existing studies
(e.g. Berry et al. 1995, Sudhir 2001), a certain level of aggregation is required to match
sales data with the respective product characteristics. For a given product characteristic,
e.g. length, we consider the average length of the options of a given model year as the length
associated with that model year (an approach also taken by Balachander et al. 2009).
10

Figure 1: CSI vs. IQS (2004: left, 2007: right)
Figure 2: IQS vs. warranty length (2004: left, 2007: right)
Figure 3: CSI vs. warranty length (2004: left, 2007: right)
11

In addition, we obtained yearly data on transactional prices at the make-model by model
year level from a secondary source based on J.D. Power data3. These data are collected at
the daily level by J.D. Power from a sample of dealers in the U.S. covering about 70% of the
geographical areas and 15-20% of total U.S. sales. These data reflect transactional prices paid
by consumers after rebates and as such, are more informative of actual consumer expenses
than the manufacturer suggested retail price which is usually used in research papers due to
the unavailability of information about transactional prices. We only have access to these
data at the aggregate yearly level, more precisely, the average across time of the transactional
prices paid by consumers for a given make-model by model year in the period September-
August of each year, which is the definition used for calendar year in our analysis. Note that
sales data from Ward’s do not distinguish between different model years of a given make-
model sold in the same calendar year. In practice, however, in a given calendar year different
model years of the same make-model are sold simultaneously. The pricing data set contains
sales at the model year level for each calendar year for the sample of dealers described above.
We use the distribution of sales in this data set and apply it to the market level sales data
from Ward’s to obtain sales at the make-model by model year level. A similar approach to
matching both data sets was taken by Copeland et al. (2011).
Sample: We match all data sources as described above. Our final sample consists of
2122 yearly observations for all new light cars sold in the U.S. in calendar years 2001-2007,
which includes model years from 2000 to 2008. Our unit of analysis is a make-model by
model year and calendar year, e.g. 2005 Toyota Corolla in calendar year 2005.
4. Model
In this section we describe the structural model formulated to study the role of service
attributes as drivers of demand in the automobile industry. It considers decision-making by
both consumers (demand model) and firms (supply model). In what follows, we describe
the demand model in detail, and provide a high level discussion of the underlying supply
model. As will be shown, while we do not estimate supply side parameters in our analysis,
our empirical formulation does make extensive use of the underlying supply model to derive
identification conditions for demand parameters. Thus, the formulation of this supply model
and its assumptions allow us to deal with the endogeneity of the warranty length decision
by firms in the demand specification. We do discuss the identification strategy in detail, and
finalize the section with a brief outline of the estimation procedure.
3We thank Adam Copeland for making these data available to us.
12

4.1 Demand
We consider a random coefficients logit demand model, where the utility that consumer i
derives from purchasing vehicle j (j = 1, ..., J) in calendar year t (t = 1, ..., T ) depends on
the vehicle price pjt, warranty duration wjt, product quality PQjt, service quality SQjt, and
a vector of observable vehicle characteristics (size, horsepower to weight ratio, etc.) xjt, as
follows:
uijt = αipjt + x′jtβi + h(wjt, PQjt, SQjt)γ + ξjt + εijt (1)
The term ξjt represents unobserved product attributes common to all consumers, and
εijt is a type I extreme value idiosyncratic shock. Consumers maximize utility, and purchase
vehicle j in calendar year t if and only if uijt≥ uirt for all r = 0, 1, ..., J . Here, r = 0 defines
the outside good, i.e. the option of not purchasing a new light car in year t, where ui0t= εi0t.
The individual-level coefficients αi and βi are decomposed into a mean effect common to
all consumers (β′s) and individual deviations from that mean (σ′s), as is common in the
literature (e.g. Berry et al. 1995, Sudhir 2001). The total effect of attribute xkjt on the
utility of consumer i is thus modeled as (βk + σkυik)xkjt, where βk and σk are parameters to
be estimated, and υik is a shock from a standard normal distribution; the same holds for αi.
It is useful to note that uijt can be thus expressed more compactly as a function of the mean
utility δjt common across all consumers, and the heterogeneity terms µijt and εijt as:
uijt = δjt(pjt, xjt, wjt, PQjt, SQjt; θ1) + µijt(pjt, xjt, wjt, PQjt, SQjt, υi; θ2) + εijt (2)
Here, θ1 is a vector containing all parameters of the mean utility (α, β, and γ), and θ2
all the heterogeneity parameters (σ). Let djt contain all M vehicle characteristics. δjt and
µijt are thus defined as:
δjt = αpjt + x′jtβ + h(wjt, PQjt, SQjt)γ + ξjt (3)
µijt =∑
m=1,...,M
σmdmjtυim (4)
The function h(wjt, PQjt, SQjt) defines the way in which warranty length, product quality
and service quality enter into the utility function. Under the linearity assumption for these
variables, the utility function would take the following form:
uijt = αipjt + x′jtβi + γ1wjt + γ2PQjt + γ3SQjt + ξjt + εijt (5)
13

This formulation is useful to capture the main effects of the variables of interest, and is
also consistent with the linearity assumption made for the rest of the covariates. We refer
to the model derived from the utility function in Eq. 5 as the main effects model.
We are also interested in testing, however, whether service attributes and product qual-
ity act as complements, substitutes or independently in the demand function. For this
purpose, we consider an enhanced formulation in which the function h(wjt, PQjt, SQjt) not
only includes the main effects for these three variables -as described in Eq. 5- but also their
two-way interaction terms wjt ∗PQjt, wjt ∗SQjt, and PQjt ∗SQjt. These interactions reflect
the non-linearities of interest, i.e., the complementarity/substitution effects between service
attributes and product quality. A recent study by Guajardo and Cohen (2012) has shown
that service quality and product quality act as complements in terms of how they determine
the likelihood to recommend the brand in an application in the consumer electronics indus-
try, i.e., the better the perceptions of product quality of a person, the higher the impact of
better perception about service quality on the person’s likelihood to recommend the brand.
In the context of our demand model, we would expect service attributes and product quality
also to be complements if the dominating mechanism by which they affect consumer demand
is through their impact on brand image. On the other hand, service attributes could act as
substitutes for product quality if the main mechanism by which they affect consumer demand
is by compensating consumers for poor product quality, i.e., if the car purchase process can
be described as a compensatory process with respect to these attributes. In a compensatory
decision process (e.g. Dieckmann et al. 2009), strengths along one or more dimensions of
product or service quality can compensate for weaknesses along others. This is in contrast
to the case of non-compensatory processes, in which no compensation is possible if certain
attributes of a product or service are weak, even if it possesses strengths along other dimen-
sions. The role of compensatory effects on consumer decision-making would thus provide
a basis for characterizing our service attributes as substitutes for product quality. Similar
arguments can be hypothesized for the interaction between warranty and service quality, i.e.,
a negative interaction under the hypothesis of compensatory attributes, or a complementary
(positive) relationship not only if they both contribute to better brand image, but also if
the main mechanism by which they affect consumer demand is by providing complemen-
tary functionality (longer and better service support). In the case of warranties and product
quality, their insurance role (Heal 1977, Emons 1989) implies that warranties should be more
important for consumers when the product is expected to fail more often, i.e. when product
quality is lower, which would provide additional support for the hypothesis of a negative co-
efficient for the term wjt ∗ PQjt. Alternatively, all three attributes may exhibit independent
effects on consumer decision-making, in which case no significance would be obtained for
14

the interaction terms. In this scenario of competing theories, whether service attributes act
as complements, substitutes, or independently of product quality in the demand function is
ultimately an empirical question, which we test in our analysis.
4.2 Supply
We assume that firms compete on prices and warranties. This assumption is consistent with
some prior theoretical models (e.g. Spence 1977, Gal-Or 1989), which have modeled compe-
tition based on these two variables, taking other factors such as product quality as given.4
As noted, by offering warranties, firms incur important warranty costs. We incorporate these
costs in our formulation, and define the profit function for firm f in period t as follows:
πf =∑j∈Jf
(pjt −mcjt − wcjt)Msjt(pt,wt,PQt,SQt,xt, ξt; θ) (6)
In Eq. 6, Jf represents the set of vehicles produced by firm f, mcjt the marginal costs of
production of vehicle j, wcjt the expected per-unit warranty costs, M is the size of the market,
and sjt the market share of vehicle j (market-level variables are in bold). As in most existing
models, (e.g. Berry et al. 1995, Sudhir 2001), we consider a marginal cost function g1 based
on the projection of costs onto observable vehicle characteristics xSjt (e.g., horsepower, size)
and unobservable cost shifters ϕjt, i.e.,
mcjt = g1(xSjt, ϕjt) (7)
Next, we consider the warranty cost function. Generically, let N(t) be the stochastic process
for the number of failures of a vehicle by time t, and Yn(t) the cost of failure n at time t,
independent of N(t). A standard formulation for expected warranty costs (e.g. Thomas 2006
pp. 67) if the warranty length is set to W is thus wc(W ) = E[∑
n=1,...,N(W ) Yn(t)]. If the time
between failures is iid, the expected warranty costs are given by wc(W ) = E[N(W )]E[Yn(t)].
The term E[N(W )] represents the expected number of failures during the warranty period,
which depends on the warranty length and the failure process. For example, if N(t) is
assumed to be a homogeneous Poisson process and λ is the failure rate per time unit, then
E[N(W )]=λW ; if the failure process is more complex, in general N(t) will not necessarily
have a tractable closed-form solution. For our purposes (and using our notation), however, it
4Naturally, firms choose not only prices and warranties, but also vehicle characteristics and positioningwith respect to product quality and service quality. The main argument behind our formulation is based onthe nature of the model and the timing of firm decisions. While firms can easily adjust prices and warranties,decisions on vehicle characteristics as well as actions influencing product quality and service quality occurover a longer time horizon than the one we consider here. We discuss this issue more extensively in subsequentsections.
15

suffices to note that E[N(W )] is a function of product quality PQjt and the warranty length
wjt. With respect to the expected cost per event, E[Yn(t)] , we must consider heterogeneity
across brands. In particular, and in line with the previous literature (e.g. Cohen and Whang
1997), providing a certain level of service quality is costly, and thus the cost per event will
depend on the quality of service provided when servicing the vehicle, for which our SQjt
variable can serve as a proxy. Let xbjt denote other observable characteristics that capture
part of the brand heterogeneity in warranty costs, and ςjt unobservable factors. The warranty
costs function g2 can be thus represented conceptually as:
wcjt = g2(wjt, PQjt, SQjt, xbjt, ςjt) (8)
Finally, we turn to firm behavior. The vast majority of studies on product differentiation
focus exclusively on firms’ pricing behavior. In our case, we assume that firms compete on
both prices and warranties, and make their decisions in order to maximize profits in each
period, according to the profit function (6). While we do not estimate supply side parameters,
the supply model presented here, and the drivers of marginal costs and warranty costs in
particular, provide the fundamentals for our identification strategy for the parameters in the
demand model.
4.3 Identification and instruments
In practice, all the observed variables in our demand specification (pjt, xjt, wjt, PQjt, SQjt)
are determined or influenced by firm decisions. On the other hand, ξjt reflects characteristics
or shocks not observed in the data, such as style, prestige, and reputation, that affect the
demand for different products. An endogeneity problem for the demand parameters emerges
if some of the observed variables are set by firms upon observing the demand shocks ξjt.
As noted, most existing studies have accounted for the endogeneity of prices in the demand
specification under the assumption of exogeneity for all other product characteristics. While
this assumption has been widely acknowledged as a shortcoming since Berry (1994), the
underlying argument for it relies on the fact that, while the prices are easily adjustable by
firms according to the market conditions and therefore pjt is likely to be correlated with
ξjt (i.e. price endogeneity), other product characteristics captured by xjt (e.g. horsepower,
size) are defined by firms well in advance of the time when a model is sold in the market,
and thus are assumed to be uncorrelated with ξjt. To account for the endogeneity of prices,
instrumental variables can be used in the estimation. A well-known example is Berry et al.
(1995)’s model for the auto industry involving prices pjt and product characteristics xjt in the
demand specification. Their supply model considers firms competing on prices, and makes
16

a Bertrand-Nash equilibrium assumption. Under these assumptions, they propose a set of
instruments to deal with price endogeneity: the sum (or average) of product characteristics
xjt for (i) other cars of the same firm, and (ii) cars of other firms. Product characteristics xjt
are exogenous by assumption, and are thus also used as instruments. This set of instruments
has been widely used to deal with price endogeneity since then (e.g., Sudhir et al. 2001,
Train and Winston 2007, Balachander et al. 2009). We use this set of instruments to deal
with price endogeneity; as in Sudhir (2001), instead of considering the average characteristics
for cars of all other firms, we compute the average characteristics of other firms’ cars in the
same market segment (small, middle, large, luxury), which refines the set of instruments by
using cars that are closer to each other in terms of characteristics.
Our specification of the demand model involves not only prices and vehicle characteristics,
but also brand level attributes wjt, PQjt, and SQjt. As in the case of prices, firms can
easily set the length of the warranty wjt in response to the unobserved factors in ξjt. A
similar observation was made by Menezes and Currim (1992), who noted that in contrast to
changes in product quality, changes in warranty length and price could be carried out almost
instantaneously. Thus, warranties are expected to be endogenous in the demand specification
in the same way (in terms of timing) as prices. Conversely, let us consider firm actions to
influence PQjt and SQjt. Note that firms can affect product quality by introducing changes
in product design, using better parts/components (Ramdas and Randall 2008), redesigning
their processes, etc. All of these factors will be reflected over a term longer than our yearly
period of analysis. The time-to-market of a vehicle, for example, can take several years from
the beginning of the design stage to product launch. Similarly, factors influencing service
quality such as the implementation of optimization-based technologies for the management
of parts inventories, more investment in spare parts inventory, the design of a more efficient
service network, and a higher focus on services more generally, will usually involve long-term
efforts and cultural changes by firms (see e.g. Cohen et al. 2000). We thus argue that
the observed PQjt and SQjt are not easily adjustable contemporaneously by firms upon
observing the shocks ξjt, and therefore will consider PQjt and SQjt to be exogenous in the
demand specification. We derive instruments for the warranty length based on the exogeneity
assumption for PQjt and SQjt and the structure of our supply model as follows. Consider
vehicles j and r, produced by different brands. Note that given our model in which firms
compete on prices and warranties, wjt and wrt are the result of the strategic interaction of
firms and are therefore correlated. If firms set their warranties optimally (or at least, take
into account the expected warranty costs), wjt will be correlated with the drivers of warranty
costs, e.g. PQjt (see Eq.8). Similarly, wrt will be correlated with PQrt. Noting that uijt
does not depend on the attributes of vehicle r, then PQrt is a valid (source of) instruments
17
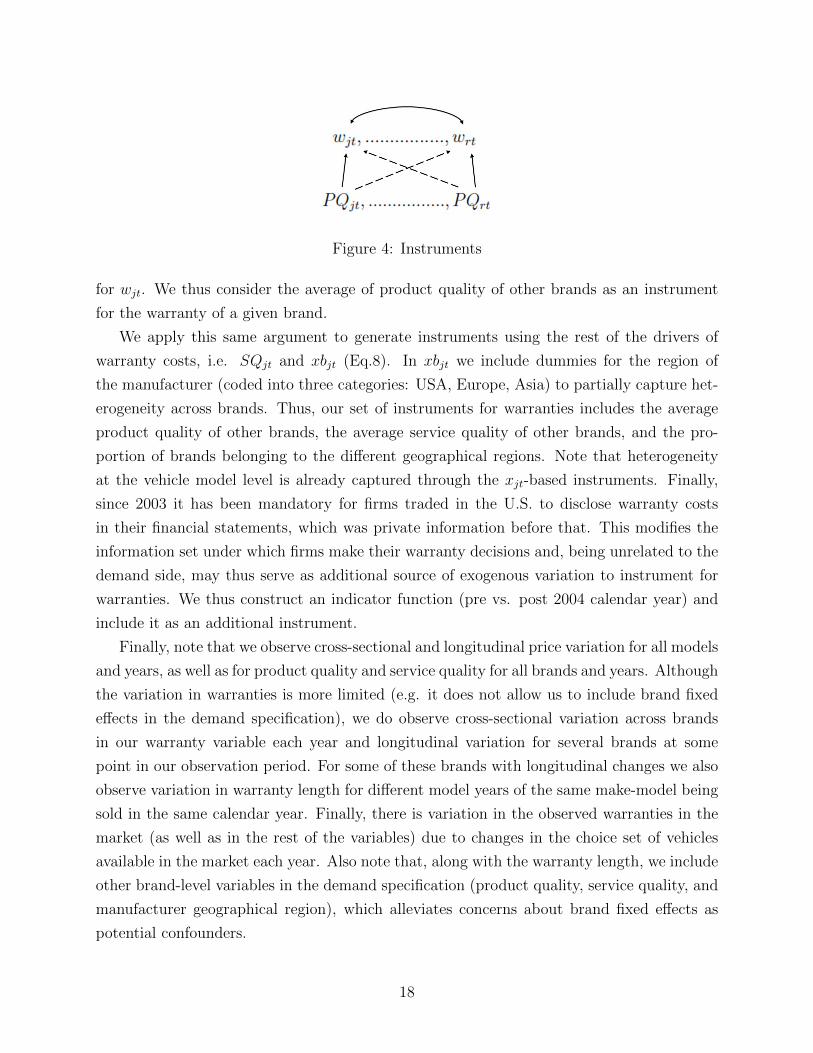
Figure 4: Instruments
for wjt. We thus consider the average of product quality of other brands as an instrument
for the warranty of a given brand.
We apply this same argument to generate instruments using the rest of the drivers of
warranty costs, i.e. SQjt and xbjt (Eq.8). In xbjt we include dummies for the region of
the manufacturer (coded into three categories: USA, Europe, Asia) to partially capture het-
erogeneity across brands. Thus, our set of instruments for warranties includes the average
product quality of other brands, the average service quality of other brands, and the pro-
portion of brands belonging to the different geographical regions. Note that heterogeneity
at the vehicle model level is already captured through the xjt-based instruments. Finally,
since 2003 it has been mandatory for firms traded in the U.S. to disclose warranty costs
in their financial statements, which was private information before that. This modifies the
information set under which firms make their warranty decisions and, being unrelated to the
demand side, may thus serve as additional source of exogenous variation to instrument for
warranties. We thus construct an indicator function (pre vs. post 2004 calendar year) and
include it as an additional instrument.
Finally, note that we observe cross-sectional and longitudinal price variation for all models
and years, as well as for product quality and service quality for all brands and years. Although
the variation in warranties is more limited (e.g. it does not allow us to include brand fixed
effects in the demand specification), we do observe cross-sectional variation across brands
in our warranty variable each year and longitudinal variation for several brands at some
point in our observation period. For some of these brands with longitudinal changes we also
observe variation in warranty length for different model years of the same make-model being
sold in the same calendar year. Finally, there is variation in the observed warranties in the
market (as well as in the rest of the variables) due to changes in the choice set of vehicles
available in the market each year. Also note that, along with the warranty length, we include
other brand-level variables in the demand specification (product quality, service quality, and
manufacturer geographical region), which alleviates concerns about brand fixed effects as
potential confounders.
18
4.4 Estimation
The estimation of random coefficients demand models is discussed in detail in Berry (1994),
Berry et al. (1995), and elsewhere. Here we briefly review the key aspects of the estimation
procedure5.
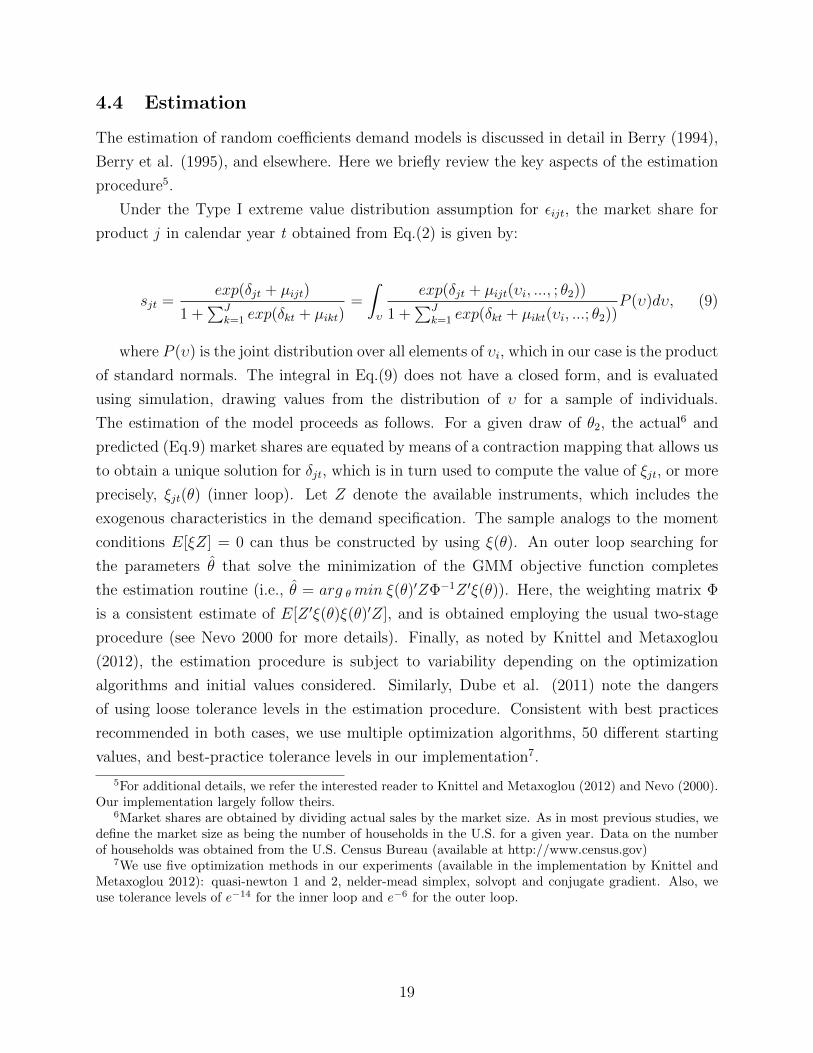
Under the Type I extreme value distribution assumption for εijt, the market share for
product j in calendar year t obtained from Eq.(2) is given by:
sjt =exp(δjt + µijt)
1 +∑J
k=1 exp(δkt + µikt)=
ˆυ
exp(δjt + µijt(υi, ..., ; θ2))
1 +∑J
k=1 exp(δkt + µikt(υi, ...; θ2))P (υ)dυ, (9)
where P (υ) is the joint distribution over all elements of υi, which in our case is the product
of standard normals. The integral in Eq.(9) does not have a closed form, and is evaluated
using simulation, drawing values from the distribution of υ for a sample of individuals.
The estimation of the model proceeds as follows. For a given draw of θ2, the actual6 and
predicted (Eq.9) market shares are equated by means of a contraction mapping that allows us
to obtain a unique solution for δjt, which is in turn used to compute the value of ξjt, or more
precisely, ξjt(θ) (inner loop). Let Z denote the available instruments, which includes the
exogenous characteristics in the demand specification. The sample analogs to the moment
conditions E[ξZ] = 0 can thus be constructed by using ξ(θ). An outer loop searching for
the parameters θ̂ that solve the minimization of the GMM objective function completes
the estimation routine (i.e., θ̂ = arg θmin ξ(θ)′ZΦ−1Z ′ξ(θ)). Here, the weighting matrix Φ
is a consistent estimate of E[Z ′ξ(θ)ξ(θ)′Z], and is obtained employing the usual two-stage
procedure (see Nevo 2000 for more details). Finally, as noted by Knittel and Metaxoglou
(2012), the estimation procedure is subject to variability depending on the optimization
algorithms and initial values considered. Similarly, Dube et al. (2011) note the dangers
of using loose tolerance levels in the estimation procedure. Consistent with best practices
recommended in both cases, we use multiple optimization algorithms, 50 different starting
values, and best-practice tolerance levels in our implementation7.
5For additional details, we refer the interested reader to Knittel and Metaxoglou (2012) and Nevo (2000).Our implementation largely follow theirs.
6Market shares are obtained by dividing actual sales by the market size. As in most previous studies, wedefine the market size as being the number of households in the U.S. for a given year. Data on the numberof households was obtained from the U.S. Census Bureau (available at http://www.census.gov)
7We use five optimization methods in our experiments (available in the implementation by Knittel andMetaxoglou 2012): quasi-newton 1 and 2, nelder-mead simplex, solvopt and conjugate gradient. Also, weuse tolerance levels of e−14 for the inner loop and e−6 for the outer loop.
19

5. Empirical analysis
5.1 Main effects model
Our specification for xjt builds upon existing literature, using variables similar to those used
by Berry et al. (1995), Sudhir (2001) and Balachander et al. (2009). We include the size
of the car measured as the product between the length and the width (SIZE), the ratio of
horsepower to weight (HPWT), and the miles per dollar (MPD) of the vehicle as product
characteristics in xjt. The MPD variable is obtained by dividing the miles-per-gallon by
the dollars-per-gallon in a given year. We obtained monthly average prices for gasoline
from the U.S. Department of Energy (http://www.eia.doe.gov), which are aggregated at the
calendar year level to calculate the MPD variable. Fuel prices are expressed in 2007 dollars
using the CPI index for the respective year, and the same is done for the vehicle price pjt
(PRICE), i.e., all monetary variables in our analysis are expressed in 2007 dollars (data
on CPI’s were obtained from the U.S. Department of Labor, Bureau of Labor Statistics,
available at http://www.bls.gov/cpi/cpirsdc.htm). We also include in xjt dummy variables
to indicate whether a model year is from the previous year (PREVY MY) or the next year
(NEXTY MY), dummy variables for manufacturer region (MANUF EUR, MANUF ASIA),
dummy variables to indicate whether the model was launched in the last 2 years (INTRO2Y)
or is soon (2 years) to be out of the market (EXIT2Y), and a time trend (TREND). Table
1 displays descriptive statistics for the relevant variables in our sample of 2122 observations,
including statistics for the warranty length (WARR), product quality (PQ), and service
quality (SQ). Table 2 displays the correlation matrix for these variables.
Table 1: Descriptive statisticsVariable Mean Std. Dev. Min Max
PRICE ($1,000) 34.938 22.161 10.286 170.689
WARR (years) 4.7 1.9 3 10
PQ (-1 x problems per vehicle) -1.289 0.235 -2.670 -0.760
SQ (CSI score/1000) 0.863 0.032 0.781 0.925
MPD ([miles/$]/10) 1.028 0.336 0.439 3.770
HPWT (100 x hp/lb) 0.643 0.171 0.203 1.578
SIZE (sq. inches/10,000) 1.314 0.145 0.792 1.708
We start our discussion of the results with the estimation of the main effects model (Eq.
5). The random coefficients model -which allows for customer heterogeneity and accounts for
the endogeneity of prices and warranties- is obtained by performing the estimation procedure
described in section (4.4).8 If customer heterogeneity is ignored (i.e. µijt = 0), the model
8In our implementation, we include random coefficients for variables for which we observe most substantial
20

Table 2: Correlation MatrixVariable PRICE WARR PQ SQ MPD HPWT SIZE
WARR -0.19***
PQ 0.29*** -0.10***
SQ 0.26*** -0.24*** 0.66***
MPD -0.39*** 0.02 -0.18*** -0.41***
HPWT 0.76*** -0.18*** 0.24*** 0.30*** -0.56***
SIZE 0.28*** -0.22*** 0.21*** 0.32*** -0.44*** 0.24***
Note: *, **, ***, Significant at the 0.1, 0.05, 0.01, confidence levels, respectively.
(Eq. 3) can be estimated by OLS regression (if the endogeneity of prices and warranties is
not accounted for) or by using instrumental variable techniques (e.g. 2SLS). We refer to the
latter case as IV LOGIT. Table 3 displays the results obtained in each of the aforementioned
cases.
The results in Table 3 show that the coefficient for the price moves in the expected
direction, i.e., demand becomes most sensitive to price as the price endogeneity is accounted
for. Indeed, sensitivity to price more than doubles, similar to the findings in Berry et al.
(1995) and Petrin (2002). Similarly, the coefficient of the warranty variable has a negative
sign in the OLS regression (-0.034). However, once the endogeneity of the warranty length is
accounted for using the instrumental variables described in the discussion of our identification
strategy (IV LOGIT and Random coefficients model), we obtained a positive and significant
effect of warranty length on demand9. Note that the fact that a positive coefficient for
warranty (0.082 in the random coefficients model, 0.132 in the IV LOGIT) is only obtained
after correcting for the endogeneity of the warranty variable and that a negative coefficient
is obtained otherwise, is consistent with a scenario in which brand reputation (which is
part of the unobservable) is negatively correlated with the warranty length, which in turn
explains the bias in the warranty coefficient if we do not employ our strategy for endogeneity
correction. Other variables with a significant effect on demand are PQ, HPWT, SIZE, and
dummy control variables for vehicle model year, manufacturer region (significant effect for
European automakers only), model exit, and the time trend. The results displayed for the
random coefficients model also include the magnitude of the estimates for the heterogeneity
parameters, which indeed reveals significant heterogeneity effects for price, the horsepower
to weight ratio, and the vehicle size.
variation at the make-model level, i.e. PRICE, HPWT, SIZE and MPD.9We also estimated the model accounting only for the endogeneity of price, ignoring the endogeneity of
warranty length (not reported in the text). We obtained a negative coefficient of warranty length in thatcase.
21
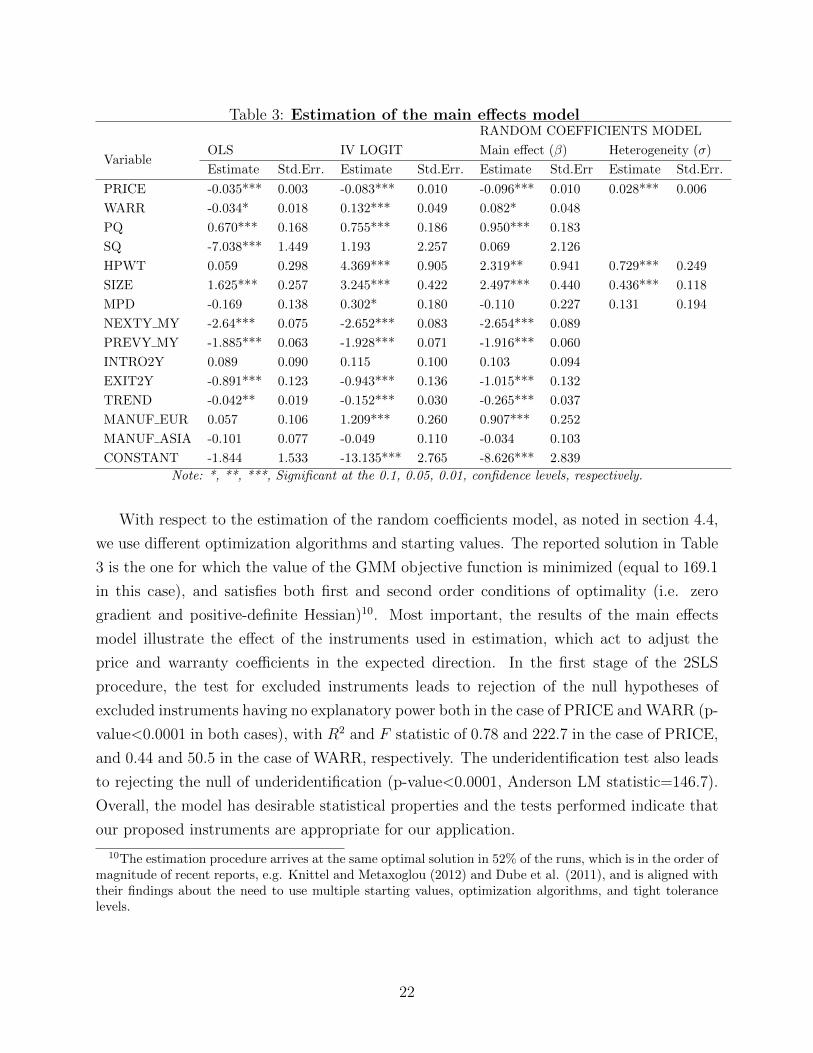
Table 3: Estimation of the main effects modelRANDOM COEFFICIENTS MODEL
VariableOLS IV LOGIT Main effect (β) Heterogeneity (σ)
Estimate Std.Err. Estimate Std.Err. Estimate Std.Err Estimate Std.Err.
PRICE -0.035*** 0.003 -0.083*** 0.010 -0.096*** 0.010 0.028*** 0.006
WARR -0.034* 0.018 0.132*** 0.049 0.082* 0.048
PQ 0.670*** 0.168 0.755*** 0.186 0.950*** 0.183
SQ -7.038*** 1.449 1.193 2.257 0.069 2.126
HPWT 0.059 0.298 4.369*** 0.905 2.319** 0.941 0.729*** 0.249
SIZE 1.625*** 0.257 3.245*** 0.422 2.497*** 0.440 0.436*** 0.118
MPD -0.169 0.138 0.302* 0.180 -0.110 0.227 0.131 0.194
NEXTY MY -2.64*** 0.075 -2.652*** 0.083 -2.654*** 0.089
PREVY MY -1.885*** 0.063 -1.928*** 0.071 -1.916*** 0.060
INTRO2Y 0.089 0.090 0.115 0.100 0.103 0.094
EXIT2Y -0.891*** 0.123 -0.943*** 0.136 -1.015*** 0.132
TREND -0.042** 0.019 -0.152*** 0.030 -0.265*** 0.037
MANUF EUR 0.057 0.106 1.209*** 0.260 0.907*** 0.252
MANUF ASIA -0.101 0.077 -0.049 0.110 -0.034 0.103
CONSTANT -1.844 1.533 -13.135*** 2.765 -8.626*** 2.839
Note: *, **, ***, Significant at the 0.1, 0.05, 0.01, confidence levels, respectively.
With respect to the estimation of the random coefficients model, as noted in section 4.4,
we use different optimization algorithms and starting values. The reported solution in Table
3 is the one for which the value of the GMM objective function is minimized (equal to 169.1
in this case), and satisfies both first and second order conditions of optimality (i.e. zero
gradient and positive-definite Hessian)10. Most important, the results of the main effects
model illustrate the effect of the instruments used in estimation, which act to adjust the
price and warranty coefficients in the expected direction. In the first stage of the 2SLS
procedure, the test for excluded instruments leads to rejection of the null hypotheses of
excluded instruments having no explanatory power both in the case of PRICE and WARR (p-
value<0.0001 in both cases), with R2 and F statistic of 0.78 and 222.7 in the case of PRICE,
and 0.44 and 50.5 in the case of WARR, respectively. The underidentification test also leads
to rejecting the null of underidentification (p-value<0.0001, Anderson LM statistic=146.7).
Overall, the model has desirable statistical properties and the tests performed indicate that
our proposed instruments are appropriate for our application.
10The estimation procedure arrives at the same optimal solution in 52% of the runs, which is in the order ofmagnitude of recent reports, e.g. Knittel and Metaxoglou (2012) and Dube et al. (2011), and is aligned withtheir findings about the need to use multiple starting values, optimization algorithms, and tight tolerancelevels.
22

5.2 Model with complementarities
The model in the previous section is useful to study the main effects of our variables of
interest and to illustrate the way in which our instrumentation strategy works. As noted
earlier, however, we are also interested in investigating complementarities/substitution ef-
fects between service attributes and product quality. We now turn to the discussion of the
results of the model involving two-way interactions between warranty length, service quality
and product quality. We “mean center” the variables involved in interaction terms (WARR,
PQ and SQ), i.e. we subtract the mean from each individual observation, such that the
individual coefficients for the single terms of these variables reflect the effect when the other
two variables are set to their average values. The results of the random coefficients model
are displayed in Table 4. The GMM function in the optimal solution is 128.6 in this case, the
solution satisfies both first and second order conditions for optimality, and the estimation
procedure led to the reported optimal solution in 52% of the runs. Similarly to the main
effects model, the model has the desirable statistical properties and the tests performed indi-
cate that our proposed instruments are appropriate. In the first stage of the 2SLS procedure,
the test for excluded instruments leads to rejection of the null hypotheses of excluded instru-
ments having no explanatory power in all cases of PRICE, WARR, WARRxPQ, WARRxSQ
(p-value<0.0001 in all cases), with R2 and F statistic of 0.78 and 217.8 in the case of PRICE,
0.45 and 50.1 for WARR, 0.27 and 22.6 for WARRxPQ, and 0.21 and 16.7 for WARRxSQ,
respectively. The underidentification test leads to rejecting the null of underidentification
(p-value<0.0001, Anderson LM statistic=113.9). Again, the instruments exhibit reasonable
statistical properties.
Next, we concentrate on the results obtained for our variables of interest, i.e., the joint
effect of WARR, PQ, and SQ. The negative and significant coefficient for the interaction
term WARRxPQ indicates that the marginal effect of an additional year of warranty cover-
age on demand decreases with product quality, or, conversely, is higher when product quality
is lower. A longer warranty acts as a partial substitute for product quality, which is consis-
tent with the insurance role of warranties. Similarly, we obtain a negative and significant
coefficient for the term PQxSQ. Noting that the effect of service quality is not significant
when treated in isolation in the main effects model (Table 3), this result suggests that service
quality is of value for consumers only when the product quality is low. Jointly, these results
provide support for the compensatory role of service attributes with respect to product qual-
ity, ruling out potential complementarities between product and service attributes in the
demand function. In contrast, we obtain a positive and significant coefficient for the term
WARRxSQ, indicating that the marginal effect on demand of an additional year of warranty
coverage increases with service quality, i.e. there is a complementary relationship between
23

Table 4: Estimation of the model with complementarities (Random coefficientsmodel)
VariableMain effect (β) Heterogeneity (σ)
Estimate Std.Err. Estimate Std.Err.
PRICE -0.101*** 0.011 0.035*** 0.006
WARR 0.142* 0.079
PQ 1.369*** 0.326
SQ -2.123 3.089
WARR x PQ -1.217*** 0.331
WARR x SQ 7.465*** 2.871
PQ x SQ -29.236*** 6.943
HPWT 1.021 1.071 1.119*** 0.291
SIZE 2.204*** 0.527 0.353*** 0.106
MPD -0.562* 0.330 0.318 0.233
NEXTY MY -2.728*** 0.093
PREVY MY -1.889*** 0.064
INTRO2Y 0.058 0.098
EXIT2Y -0.982*** 0.147
TREND -0.341*** 0.045
MANUF EUR 0.708** 0.310
MANUF ASIA -0.048 0.107
CONSTANT -7.281*** 1.314
Note: *, **, ***, Significant at the 0.1, 0.05, 0.01, confidence levels, respectively.
the length of the warranty and service quality.
5.3 Discussion
Our results indicate that warranties have a significant effect on consumer demand, and that
the marginal value of an additional year of warranty decreases with product quality and
increases with service quality. Further analysis of our main effects model reveals that the
median implied willingness to pay for an additional year of warranty, obtained as the ratio of
the marginal utility of warranty length to the marginal disutility of price, is approximately
$850 which is equivalent to about 2.5% of the average vehicle price in our sample. In other
words, and all else being equal, for an average vehicle in our sample, increasing the length of
the warranty by one year is equivalent to decreasing the vehicle price by about $850, in terms
of their effect on consumer demand. This estimate seems reasonable by industry standards.
Indeed, a similar number was quoted in a recent industry report which mentioned that
“consumers pay about 2 percent of the vehicle price per year of extended service” (Consumer
Reports 2008).
Also, if we focus on the mean utility implied by the main effects model, we note that, for
24

Figure 5: Marginal effect of warranty on utility function
a car with average characteristics in our sample, the effect on demand of a 1% price decrease
is equivalent to increasing product quality by 3%, and is in turn equivalent to increasing the
warranty length by 9%. These benchmarks are useful for understanding the relative impact of
different managerial interventions with respect to consumer demand. Indeed, these demand
estimates can inform managerial decision-making by allowing managers to anticipate the
effect of alternative interventions on consumer demand, which together with their usually
good knowledge about the costs involved for each of these interventions, could be used to
quantify trade-offs involved in managerial decision-making regarding these variables.
Further analysis of our model with complementarities also reveals that the value of one
year of warranty is on average about two times more important for U.S. manufacturers than
for foreign firms during our period of analysis. Our analysis provides an explanation for this
observation, i.e., that U.S.-based brands had on average lower product quality and higher
service quality than their foreign counterparts in that period. According to the results of our
model, both of these factors imply a higher marginal effect of warranty length on consumer
demand. Figure 5 illustrates the relationship obtained for the marginal effect of warranty
length on consumer utility as a function of PQ and SQ (the grid surface), and also displays
some of the brands in our sample.
As an illustration of the implications of our results, we return to the example in sec-
tion 1 (survey data Sept-Nov 2006) in which remarkable differences were observed for the
importance of the warranty length for customers of Hyundai, GM and Toyota. Our results
25

provide an explanation for these differences which is consistent with the data observed in
that case. While the main brands of GM and Toyota both had a 5 year powertrain warranty
in the survey period, GM had worse product quality and better service quality than Toyota.
The results of our model suggest that both lower product quality and higher service quality
increase the effect of warranty length on demand, consistent with the observation from the
survey that the warranty length was considered extremely or very important for 53% of GM
customers, in contrast to only 28% of Toyota customers, even though the warranty length
was 5 years in both cases. Similarly, while Hyundai had slightly better product quality and
worse service quality than GM, the fact that Hyundai’s warranty was 10 years makes the
overall impact of its warranty length on consumer utility higher than in the case of GM and
Toyota according to our model, consistent with the observation from the survey that Hyundai
customers are those for whom warranty length was of higher importance when considering
the brand in the shopping list, among the three brands considered in the survey. Overall,
these observations offer face validity of our estimates.
Finally, another interesting implication of our results concerns the complementarity be-
tween service attributes. Consider, for example, the case of Kia, a brand that was char-
acterized as having both low product quality and low service quality during our period of
analysis. Kia increased the length of their powertrain warranty from 5 years/60,000 miles
to 10 years/100,000 miles in 2001, i.e., the brand offered “America’s No. 1 warranty” in
conjunction with Hyundai. Our results imply that Kia would have benefited the most out of
this great warranty coverage (in terms of the effect of this policy on consumer demand), if it
had contemporaneously invested in providing better service quality, along with the warranty
length increase. In short, being good at one service dimension (service quality), amplifies
the effect of being good at another service dimension (warranty length).
5.4 Robustness
We briefly discuss some of the relevant modeling choices and examine the robustness of our
main findings with respect to variations in some model constructs.
First, in section 3, we discussed a number of reasons why we use the length of the power-
train warranty in years as our warranty variable. We performed experiments using alternative
definitions, and our main findings remain robust if, for example, we consider miles instead
of years, or if we consider a weighted average between powertrain and basic warranty as our
warranty variable. Perhaps a more sensitive issue is the definition of our product quality
variable. Arguably, there is no perfect way to measure quality. We believe, however, that
the metric of problems per vehicle based on the initial quality study by J.D. Power is a rea-
sonable choice. Indeed this metric captures a relatively objective metric of product quality,
26

that has been widely available in the past, and that has had lots of visibility for consumers
historically. J.D. Power also publishes data on vehicle dependability, which measures quality
problems after 3 years of ownership. We collected some of these data and found a high
correlation (0.75) between the vehicle dependability metric and our initial quality variable,
which suggest some consistency in both product quality metrics. Furthermore, we think that
quality problems in the first three months of ownership may be much more disruptive than
quality problems after three years, which is one reason to prefer the initial quality variable
used in our study (in addition, considering initial quality instead of vehicle dependability
allows us to perform the analysis with a larger sample size). Nevertheless, we estimated the
model using the vehicle’s 3-year dependability metric to construct the product quality vari-
able, and found results that are largely consistent with our main results (with the exception
of the coefficient for the WARRxSQ variable that became marginally non-significant).
Another concern is related to the potential role of brand fixed effects as confounders.
As noted in section 4.3, the level of variation in our warranty variable does not allow us to
control for brand fixed effects in the model specification, and thus the role of omitted brand
fixed effects is certainly a valid concern. We noted, however, that the warranty is not the
only brand-level variable in our model, and indeed, we are including product quality, service
quality and an indicator of the manufacturer region as brand level variables. We make the
following two observations in this regard. First, note that omitted brand-level factors are part
of the unobservable term, and accordingly this is part of the reason behind our identification
strategy for warranties, i.e. in our formulation we are implicitly accounting for them in the
estimation of warranty effects. Second, we collected some additional brand-level variables,
like the number of dealers of each brand (obtained from Automotive News’s market data
books) and the brand age, and estimated our models including these variables in the model
specification as a way to partially control for some brand effects not captured in the main
formulation, and our main findings remained robust to these variations.
Finally, one could postulate a three-way interaction effect between product quality, service
quality and warranty, meaning that the two-way interaction effects postulated by our model
could in turn be moderated by the remaining variable as a third factor. We extended our
model specification by adding the three-way interaction term WARRxPQxSQ and our main
findings remain robust to this variation.
Table 5 displays the results obtained for some of the robustness checks discussed in this
section. For ease of display, we only show results for the mean utility estimates in each case.
27

Table 5: Selected Robustness checks
Variable(1) (2) (3) (4)
Estimate Std.Err. Estimate Std.Err. Estimate Std.Err. Estimate Std.Err.
PRICE -0.101*** 0.012 -0.084*** 0.011 -0.077*** 0.013 -0.102*** 0.012
WARR 0.125* 0.066 0.135* 0.080 0.116 0.073 0.154* 0.083
PQ 1.805*** 0.369 0.477*** 0.146 0.971*** 0.327 1.415*** 0.346
SQ -4.416 3.048 -0.507 3.120 -0.585 2.811 -1.373 3.242
WARR x PQ -1.856*** 0.415 -0.572*** 0.171 -0.956*** 0.308 -2.052*** 0.437
WARR x SQ 9.788*** 2.368 6.467 4.098 4.875* 2.701 6.597** 2.916
PQ x SQ -35.018*** 8.100 -20.725*** 4.203 -26.718*** 6.593 -23.633*** 7.015
NDEALERS 0.201*** 0.057
WARRxPQxSQ -18.446** 7.197
Notes: All columns display results for the mean utility estimates of the random coefficients model, for themost relevant variables (All models include the same control variables as in Table 4, estimates not reported).(1): Powertrain warranty in (10,000’s) miles instead of years; (2): PQ in demand specification measured usingthe problems per vehicle metric of J.D. Power’s dependability study instead of the initial quality study; (3):Including NDEALERS (number of franchised dealers, measured in 1000’s) in the model specification; (4):Including the 3-way interaction WARRxPQxSQ.
*, **, ***, Significant at the 0.1, 0.05, 0.01, confidence levels, respectively.
6. Conclusion
In this paper we formulate and estimate a model to study the impact of service attributes
on demand, and the moderating role of product quality in that relationship. We focus on
services for the in-warranty period, and characterize the service strategy of a firm by both
its warranty length and its after-sales service quality. Our results indicate that both service
metrics are complementary, i.e., the better the service quality of a brand, the higher the
marginal effect of offering longer warranties on demand, and vice versa. Thus, these two
service attributes reinforce each other. In contrast, no complementarities are observed for
service attributes and product quality, and services play, rather, a compensatory role with
respect to product quality, i.e., the impact of both service variables on demand increases when
product quality decreases. Collectively, our results suggest that competing on services is more
effective (in terms of its effect on demand) for firms that have lower product quality, and that
a firm that increases its warranty length would benefit most by simultaneously investing in
improving its service quality. These findings illustrate that firms would benefit by defining
their product and service strategies jointly rather than independently, i.e. they show that
the joint consideration of product and service is essential for the development of an effective
competitive strategy. In particular, the positioning of a firm with respect to product/service
quality dimensions directly influences the marginal effect of its warranty length on consumer
demand (Figure 5). Our model thus also provides a tool for managers to evaluate the
impact of offering different warranty lengths on consumer demand (for a given positioning in
28
product quality and service quality), which if complemented with actual warranty cost data
(which are internally available), would help companies to define optimal warranty levels.
More generally, we illustrated how our model can inform decision-making regarding how
alternative managerial interventions (e.g. price decrease, quality increase, warranty increase)
impact consumer demand, e.g. for an average vehicle our model suggests that reducing the
price by 1% is equivalent (in terms of its impact on consumer demand) to improving product
quality by 3%, which is in turn equivalent to increasing the length of the warranty by 9%.
We believe that the demand-side estimates derived from our analysis constitute a critical
missing component for managerial decision-making in practice, as managers are usually very
good at estimating the implied costs of different managerial interventions, while demand
effects are much more difficult to isolate.
Our analysis of the service strategy of firms focused exclusively on the in-warranty period.
In practice, firm service strategies also include the out-of-warranty period, and thus the
definition of the warranty length could have implications in terms of the profits that firms
derive from selling extended warranties. If appropriate data becomes available, modeling
the interaction between in-warranty and out-of-warranty policies offers a promising avenue
for future research. Also, our identification strategy requires the exogeneity of product
quality and service quality in the demand specification, which, as noted, is justified by the
timing of our model, in which firms and consumers make decisions within a one-year horizon.
While appropriate to capture short-term effects, our model does not capture longer-term
dynamic aspects involved in firm decision-making and consumer demand. The formulation
of a dynamic model that endogenizes long-term effects of firm investment in product quality
and service quality is thus a natural -and much more complex- extension of our analysis.
Finally, as noted throughout the document, to our knowledge this is the first paper to
empirically study how firm service strategies interact with product quality in a demand model
of firm competition. The formulation of similar studies in other manufacturing industries
would allow for a broader understanding of the value of services as part of firms’ competitive
strategies. We hope to conduct further research in these areas.
References
Allon, G., A. Federgruen. 2007. Competition in service industries. Operations Research,
55(1) 37–55.
Allon, G., A. Federgruen. 2009. Competition in service industries with segmented mar-
kets. Management Science, 55(4) 619–634.
Allon, G., A. Federgruen, M. Pierson. 2011. How much is a reduction of your customers’
29

wait worth? An empirical study of the fast-food drive-thru industry based on structural
estimation methods. MSOM, 13(4) 489-507.
Automotive News. 2009. Chrysler drops lifetime warranty, (August 24), (accessed July
22, 2011), [available at http://www.autonews.com/article/20090824/RETAIL03/308249890]
Balachander, S., Y. Liu, A. Stock. 2009. An empirical analysis of scarcity strategies in
the automobile industry. Management Science, 55(10) 1623-1637.
Bernstein, F., A. Federgruen. 2007. Coordination mechanisms for supply chains under
price and service competition. MSOM, 9(3) 242–262.
Berry, S. 1994. Estimating discrete choice models of product differentiation. RAND
Journal of Economics, 25(2) 242-262.
Berry, S., J. Levinsohn, A. Pakes. 1995. Automobile prices in market equilibrium.
Econometrica, 63(4) 841-890.
Berry, S., J. Levinsohn, A. Pakes. 2004. Differentiated products demand systems from
a combination of micro and macro data: The new vehicle market. Journal of Political
Economy, 112(1) 68-104.
Buell, R.W., D. Campbell, F.X. Frei. 2011. How do incumbents fare in the face of
increased service competition? Working paper, Harvard Business School.
Cachon, P.C., P.T. Harker. 2002. Competition and outsourcing with scale economies.
Management Science, 48(10) 1314–1333.
Caplin, A., B. Nalebuff. 1991. Aggregation and imperfect competition: On the existence
of equilibrium. Econometrica, 59(1) 25-59.
Chu, J., P. Chintagunta. 2009. Quantifying the economic value of warranties in the U.S.
server market. Marketing Science, 28(1) 99-121.
Chu, J., P. Chintagunta. 2011. An empirical test of warranty theories in the U.S.
computer server and automobile markets. Journal of Marketing, 75(3) 75-92.
Cohen, M.A., S. Whang. 1997. Competing in product and service: A product life-cycle
model. Management Science, 43(4) 535-545.
Cohen, M.A., H. Lee, C. Cull, D. Willen. 2000. Saturn’s Supply Chain innovation: High
value in after-sales service. Sloan Management Review, 41(4) 93-101.
Cohen, M.A., N. Agrawal, V. Agrawal. 2006. Winning in the aftermarket. Harvard
Business Review, 84(5) 129-138.
Cooper, R., T. Ross. 1985. Warranties and double moral hazard. The RAND Journal of
Economics, 16(1) 103-113.
Consumer Reports. 2008. Extended warranties: A high-priced gamble, (April 2008), (ac-
cessed February 15, 2012), [available at http://www.consumerreports.org/cro/2012/05/extended-
warranties-a-high-priced-gamble/index.htm]
30

Copeland, A., W. Dunn, G. Hall. 2011. Inventories and the automobile market. The
RAND Journal of Economics, 42(1) 121-149.
Crawford, G.S. 2012. Endogenous product choice: A progress report. International
Journal of Industrial Organization, 30(3) 315-320.
Dieckmann, A., K. Dippold, H. Dietrich. 2009. Compensatory versus non compensatory
models for predicting consumer preferences. Judgment and decision-making , 4(3) 200–213.
Douglas, E.J., D.C. Gelnnon, J.I. Lane. 1993. Warranty, quality and price in the US
automobile market. Applied Economics, 25(1) 135-141.
Draganska, M., M. Mazzeo, K. Seim. 2009. Beyond plain vanilla: Modeling joint product
assortment decisions. Quantitative Marketing and Economics, 7(2) 105-146.
Dube, J-P., J.T. Fox, C-L. Su. 2011. Improving the numerical performance of BLP
static and dynamic discrete choice random coefficients demand estimation. Econometrica,
forthcoming.
Emons, W. 1989. The theory of warranty contracts. Journal of Economics Surveys, 3(1)
43-57.
Fan, Y. 2011. Ownership consolidation and product characteristics: A study of the U.S.
daily newspaper market. Working paper.
Fisher, M.L., K. Ramdas, K.T. Ulrich. 1999. Components sharing in the management
of product variety: A study of automotive braking systems. Management Science, 45(5)
297-315.
Gallino, S., G.P. Cachon, M. Olivares. 2012. Does inventory increase sales? The billboard
and scarcity effect in U.S. automobile dealerships. Working paper.
Gal-Or, E. 1989. Warranties as a signal of quality. The Canadian Journal of Economics,
22(1) 50-61.
Guajardo, J.G., M.A. Cohen. 2012. Product quality or service quality? The impact of
customer heterogeneity. Working paper.
Heal, G. 1977. Guarantees and risk-sharing. The Review of Economic Studies, 44(3)
549-560.
Knittel, C.R., K. Metaxoglou. 2012. Estimation of random coefficient demand models:
Two empiricists’ perspective. Working paper.
Koudal, P. 2008. Ladies and gentlemen, start your service engines: Competing on service
excellence in the automotive industry. Deloitte Research, (July 22), (accessed July 22, 2011),
[available at http://www.deloitte.com]
Lu, J-C., Y-C. Tsao, C. Charoensiriwath. 2011. Competition under manufacturer service
and retail price. Economic Modelling, 28(3) 1256-1264.
Menezes, M.A.J., I.S. Currim. 1992. An approach for determination of warranty length.
31

International Journal of Research in Marketing, 9(2) 177-195.
Murthy, D.N.P., W.R. Blischke. 2006. Warranty management and product manufacture.
Springer-Verlag, London.
Nevo, A. 2000. A practitioner’s guide to estimation of random-coefficients logit models
of demand. Journal of Economics & Management Strategy, 9(4) 513-548.
Olivares, M., G.P. Cachon. 2009. Competing retailers and inventory: An empirical
investigation of General Motors’ dealerships in isolated markets. Management Science, 55(9)
1586-1604.
Petrin, A. 2002. Quantifying the benefits of new products: The case of the minivan. The
Journal of Political Economy, 110(4) 705-729.
Ramdas, K., T. Randall. 2008. Does component sharing help or hurt reliability? An
empirical study in the automotive industry. Management Science, 54(5) 922–938.
Shaked, A., J. Sutton. 1982. Relaxing price competition through product differentiation.
The Review of Economic Studies, 49(1) 3-13.
Shankar, V., L. Berry, T. Dotzel. 2009. A practical guide to combining products and
services. Harvard Business Review, 87(11) 94-99.
So, K.C. 2000. Price and time competition for service delivery. MSOM, 2(4) 329-409.
Spence, M. 1977. Consumer misperceptions, product failure and producer liability. The
Review of Economic Studies, 44(3) 561-572.
Standard & Poor’s. 2011. Industry surveys: Autos & auto parts. June 23.
Suarez, F.F., M.A. Cusumano, S. Kahl. 2008. Services and the business models of
product firms: An empirical analysis of the software industry. Working paper.
Sudhir, K. 2001. Competitive pricing behavior in the auto market: a structural analysis.
Marketing Science, 20(1) 42-60.
Thomas, M.U. 2006. Reliability and warranties: Methods for product development and
quality improvement. CRC Press, Florida, USA.
Train, K.E., C. Winston. 2007. Vehicle choice behavior and the declining market share
of U.S. automakers. International Economic Review, 48(4) 1469-1496.
Tsay, A.A., N. Agrawal. 2000. Channel dynamics under price and service competition.
MSOM, 2(4) 372-391.
Warranty Week. 2006. Ford’s powertrain warranties, (July 25), (accessed July 22, 2011),
[available at http://www.warrantyweek.com/archive/ww20060725.html]
Warranty Week. 2011. Automotive warranty report, (April 7), (accessed July 22, 2011),
[available at http://www.warrantyweek.com/archive/ww20110407.html]
Wiener, J. L. 1985. Are warranties accurate signals of product reliability? The Journal
of Consumer Research, 12(2) 245-250.
32

Related Documents

![How to Improve the Competitiveness of Automobile Maintenance … · 2021. 5. 15. · Automobile Maintenance Quality [J]. Automobile & Driving Maintenance (Repair Edition),2019(04):107-108.](https://static.cupdf.com/doc/110x72/6141e5ca2035ff3bc76252a8/how-to-improve-the-competitiveness-of-automobile-maintenance-2021-5-15-automobile.jpg)


