Citation: Goetzman, E.; Gong, Z.; Rajasundaram, D.; Muzumdar, I.; Goodchild, T.; Lefer, D.; Muzumdar, R. Serum Metabolomics Reveals Distinct Profiles during Ischemia and Reperfusion in a Porcine Model of Myocardial Ischemia–Reperfusion. Int. J. Mol. Sci. 2022, 23, 6711. https:// doi.org/10.3390/ijms23126711 Academic Editor: Hartmut Schlüter Received: 5 May 2022 Accepted: 11 June 2022 Published: 16 June 2022 Publisher’s Note: MDPI stays neutral with regard to jurisdictional claims in published maps and institutional affil- iations. Copyright: © 2022 by the authors. Licensee MDPI, Basel, Switzerland. This article is an open access article distributed under the terms and conditions of the Creative Commons Attribution (CC BY) license (https:// creativecommons.org/licenses/by/ 4.0/). International Journal of Molecular Sciences Article Serum Metabolomics Reveals Distinct Profiles during Ischemia and Reperfusion in a Porcine Model of Myocardial Ischemia–Reperfusion Eric Goetzman 1,2,† , Zhenwei Gong 1,2,† , Dhivyaa Rajasundaram 1,2 , Ishan Muzumdar 3 , Traci Goodchild 4 , David Lefer 4 and Radhika Muzumdar 1,2, * 1 Children’s Hospital of Pittsburgh of UPMC, Pittsburgh, PA 15260, USA; [email protected] (E.G.); [email protected] (Z.G.); [email protected] (D.R.) 2 Department of Pediatrics, University of Pittsburgh, Pittsburgh, PA 15260, USA 3 School of Undergraduate Study, Penn State University, State College, PA 16802, USA; [email protected] 4 Cardiovascular Center of Excellence, Louisiana State University Health Sciences Center, New Orleans, LA 70112, USA; [email protected] (T.G.); [email protected] (D.L.) * Correspondence: [email protected] † These authors contributed equally to this work. Abstract: Acute myocardial infarction (MI) is one of the leading causes of death worldwide. Early identification of ischemia and establishing reperfusion remain cornerstones in the treatment of MI, as mortality and morbidity can be significantly reduced by establishing reperfusion to the affected areas. The aim of the current study was to investigate the metabolomic changes in the serum in a swine model of MI induced by ischemia and reperfusion (I/R) injury, and to identify circulating metabolomic biomarkers for myocardial injury at different phases. Female Yucatan minipigs were subjected to 60 min of ischemia followed by reperfusion, and serum samples were collected at baseline, 60 min of ischemia, 4 h of reperfusion, and 24 h of reperfusion. Circulating metabolites were analyzed using an untargeted metabolomic approach. A bioinformatic approach revealed that serum metabolites show distinct profiles during ischemia and during early and late reperfusion. Some notable changes during ischemia include accumulation of metabolites that indicate impaired mitochondrial function and N-terminally modified amino acids. Changes in branched-chain amino- acid metabolites were noted during early reperfusion, while bile acid pathway derivatives and intermediates predominated in the late reperfusion phases. This indicates a potential for such an approach toward identification of the distinct phases of ischemia and reperfusion in clinical situations. Keywords: myocardial ischemia–reperfusion; metabolomics; mitochondrial dysfunction; serum biomarkers 1. Introduction Coronary artery disease is a major cause of morbidity and mortality in the world. In the US, heart disease remains the number one cause of death across all ages and accounts for >25% of the deaths in people 65 years and older. (https://www.cdc.gov/nchs/data/nvsr/ nvsr70/nvsr70-09-508.pdf) (accessed on 1 March 2022). According to the American Heart Association (AHA), it is estimated that an American will have a heart attack approximately every 40 s [1]. In an analysis of 23 published studies in which 14,211 patients were followed prospectively following a myocardial infarction (MI), it was reported that, on average, 23% of patients died before reaching the hospital following the first MI, and another 13% died during hospital admission [2]. Causes of death in these patients include ventricular arrythmias, stroke, cardiac rupture, and acute cardiac failure. Those who survive an MI typically exhibit subsequent myocardial remodeling through excessive myofibroblast proliferation, extracellular matrix deposition, and cardiac hypertrophy, causing significant morbidity and mortality [3]. Post-myocardial infarction heart failure is common and is Int. J. Mol. Sci. 2022, 23, 6711. https://doi.org/10.3390/ijms23126711 https://www.mdpi.com/journal/ijms

Welcome message from author
This document is posted to help you gain knowledge. Please leave a comment to let me know what you think about it! Share it to your friends and learn new things together.
Transcript

Citation: Goetzman, E.; Gong, Z.;
Rajasundaram, D.; Muzumdar, I.;
Goodchild, T.; Lefer, D.; Muzumdar,
R. Serum Metabolomics Reveals
Distinct Profiles during Ischemia and
Reperfusion in a Porcine Model of
Myocardial Ischemia–Reperfusion. Int.
J. Mol. Sci. 2022, 23, 6711. https://
doi.org/10.3390/ijms23126711
Academic Editor: Hartmut Schlüter
Received: 5 May 2022
Accepted: 11 June 2022
Published: 16 June 2022
Publisher’s Note: MDPI stays neutral
with regard to jurisdictional claims in
published maps and institutional affil-
iations.
Copyright: © 2022 by the authors.
Licensee MDPI, Basel, Switzerland.
This article is an open access article
distributed under the terms and
conditions of the Creative Commons
Attribution (CC BY) license (https://
creativecommons.org/licenses/by/
4.0/).
International Journal of
Molecular Sciences
Article
Serum Metabolomics Reveals Distinct Profiles during Ischemiaand Reperfusion in a Porcine Model of MyocardialIschemia–ReperfusionEric Goetzman 1,2,†, Zhenwei Gong 1,2,†, Dhivyaa Rajasundaram 1,2, Ishan Muzumdar 3, Traci Goodchild 4,David Lefer 4 and Radhika Muzumdar 1,2,*
1 Children’s Hospital of Pittsburgh of UPMC, Pittsburgh, PA 15260, USA; [email protected] (E.G.);[email protected] (Z.G.); [email protected] (D.R.)
2 Department of Pediatrics, University of Pittsburgh, Pittsburgh, PA 15260, USA3 School of Undergraduate Study, Penn State University, State College, PA 16802, USA; [email protected] Cardiovascular Center of Excellence, Louisiana State University Health Sciences Center,
New Orleans, LA 70112, USA; [email protected] (T.G.); [email protected] (D.L.)* Correspondence: [email protected]† These authors contributed equally to this work.
Abstract: Acute myocardial infarction (MI) is one of the leading causes of death worldwide. Earlyidentification of ischemia and establishing reperfusion remain cornerstones in the treatment of MI,as mortality and morbidity can be significantly reduced by establishing reperfusion to the affectedareas. The aim of the current study was to investigate the metabolomic changes in the serum in aswine model of MI induced by ischemia and reperfusion (I/R) injury, and to identify circulatingmetabolomic biomarkers for myocardial injury at different phases. Female Yucatan minipigs weresubjected to 60 min of ischemia followed by reperfusion, and serum samples were collected atbaseline, 60 min of ischemia, 4 h of reperfusion, and 24 h of reperfusion. Circulating metaboliteswere analyzed using an untargeted metabolomic approach. A bioinformatic approach revealed thatserum metabolites show distinct profiles during ischemia and during early and late reperfusion.Some notable changes during ischemia include accumulation of metabolites that indicate impairedmitochondrial function and N-terminally modified amino acids. Changes in branched-chain amino-acid metabolites were noted during early reperfusion, while bile acid pathway derivatives andintermediates predominated in the late reperfusion phases. This indicates a potential for such anapproach toward identification of the distinct phases of ischemia and reperfusion in clinical situations.
Keywords: myocardial ischemia–reperfusion; metabolomics; mitochondrial dysfunction; serumbiomarkers
1. Introduction
Coronary artery disease is a major cause of morbidity and mortality in the world. Inthe US, heart disease remains the number one cause of death across all ages and accounts for>25% of the deaths in people 65 years and older. (https://www.cdc.gov/nchs/data/nvsr/nvsr70/nvsr70-09-508.pdf) (accessed on 1 March 2022). According to the American HeartAssociation (AHA), it is estimated that an American will have a heart attack approximatelyevery 40 s [1]. In an analysis of 23 published studies in which 14,211 patients were followedprospectively following a myocardial infarction (MI), it was reported that, on average,23% of patients died before reaching the hospital following the first MI, and another 13%died during hospital admission [2]. Causes of death in these patients include ventriculararrythmias, stroke, cardiac rupture, and acute cardiac failure. Those who survive anMI typically exhibit subsequent myocardial remodeling through excessive myofibroblastproliferation, extracellular matrix deposition, and cardiac hypertrophy, causing significantmorbidity and mortality [3]. Post-myocardial infarction heart failure is common and is
Int. J. Mol. Sci. 2022, 23, 6711. https://doi.org/10.3390/ijms23126711 https://www.mdpi.com/journal/ijms

Int. J. Mol. Sci. 2022, 23, 6711 2 of 24
strongly associated with mortality in patients. In the elderly patients who underwentpercutaneous coronary intervention for ST-elevation myocardial infarction (STEMI), the8 year mortality of patients was as high as 49% [4].
The goal in the treatment of myocardial infarction is to preserve the myocardium.Current treatment paradigms involve restoring blood flow (reperfusion) as quickly aspossible to limit permanent ischemic damage to the cardiac tissue. Time is a critical factorin the prognosis, and “time to table” is an important concept in management of acutecoronary vascular events. An earlier diagnosis and prompt restoration of circulation arecrucial for a better prognosis. While effective in this regard, reperfusion itself can lead tosignificant injury of myocardium. Hence, there exists a continued need to identify earlymarkers of coronary events and effective treatment options.
Deprivation of supply of oxygen and nutrition results in biochemical and metabolicchanges in the myocardium. In a well-perfused heart, almost all (>95%) ATP formation isderived from oxidative phosphorylation in the mitochondria. Approximately 60–90% ofthe acetyl CoA that enters the TCA cycle is derived from fatty-acid oxidation (FAO), while10–40% is from oxidation of pyruvate derived either from glycolysis or from oxidationof lactate. In the ischemic myocardium, there is an increase in anaerobic glycolysis and,therefore, lactate production, in an attempt to meet the energy needs for contraction [5].Glycolytic ATP is critical in the post-ischemic/reperfused (IR) myocardium for optimaldiastolic relaxation [5]. There are inherent advantages in carbohydrate utilization underthese conditions as glycolysis is quicker and uses less oxygen than FAO. During reperfusion,there is increased free fatty acid (FFA) supply to the heart and a reliance on FAO, whichexacerbates myocardial injury through generation of free radicals and increased oxidativestress [6]. FFAs increase calcium, and the effort at Ca cycling to maintain homeostasisincreases the rate of ATP hydrolysis, leading to “wastage” of ATP [5]. These are some of thephase-specific changes that occur in the ischemic and reperfused myocardium. Althoughthese changes are intended to maintain cardiac function and meet the myocardium’smetabolic needs, they could have adverse consequences.
Many metabolic approaches have been tried in the management of myocardial is-chemia with variable success. Increasing glucose metabolism through infusion of insulin,pyruvate infusion, use of glucagon-like peptide-1 (GLP-1)-based therapies, and AMP-activated protein kinase (AMPK) activation using metformin and cardiac-specific gain offunction of glucose transporter GLUT 1 have all been shown to decrease infarct size in IRmodels through stimulation of myocardial glucose metabolism [7,8] and suppression ofFFA release from adipocytes [5,9,10]. In the glucose–insulin–potassium (GIK) clinical trials,even though there were no changes in 30-day mortality or progression to MI, there was adecrease in infarct size and in-house mortality, as well as an improvement in compositeoutcome following cardiac arrest [11]. Infusion of insulin improved LV ejection fractionin patients with LV dysfunction following ischemic heart disease [12]. Dichloroacetate(DCA), a compound that increases glucose oxidation by stimulating pyruvate dehydro-genase (PDH) through inhibition of pyruvate dehydrogenase kinase (PDK) activity, hasbeen shown to decrease infarct size and improve cardiac efficiency in IR, potentially byswitching the heart toward the more efficient fuel, i.e., glucose [13]. Similarly, approachesto decrease FAO with either enzyme inhibitors or genetic approaches have been shownto decrease infarct size [14]. Partial inhibitors of myocardial FAO have been shown tobe effective in animal models of IR, as well as in patients with chronic stable angina [15],through increased pyruvate oxidation and decreased lactate accumulation. In addition, thecontractile performance of the heart is better with glucose oxidation compared to fatty acidsat a given myocardial oxygen consumption. Increased plasma FFA concentration has beenassociated with a decrease in cardiac mechanical efficiency in humans [16], pigs [17], anddogs [18]. The FAO inhibitor ranolazine has been shown to decrease myocardial oxygenconsumption and improve mechanical efficiency of the LV in dogs [18]. These studieshighlight a potential benefit in decreasing FAO in conditions of IR to improve cardiac sur-vival and function post MI/R. While it is clear that therapeutic options to switch substrate

Int. J. Mol. Sci. 2022, 23, 6711 3 of 24
metabolism could improve cardiac survival and function, many pharmacological agentstargeting these mechanisms, such as dichloroacetate or etomoxir, albeit very effective inanimal models, have not translated to the clinic due to side-effects [19–21]. In addition tometabolic changes, both ischemia and reperfusion injury are associated with ROS-relateddamage to the mitochondrial respiratory chain machinery and other metabolic components.This leads to further ROS production and bioenergetic decline, which ultimately leadsto cell death [22,23]. While newer options are being evaluated for their ability to offercardioprotection, early diagnosis remains critical to initiate available modalities to improvethe coronary circulation, minimize the damage, and prevent long-term morbidity.
Could we leverage the changes in metabolites toward timely diagnosis? While somemetabolite changes are the result of fuel shortage and metabolic adaptations, others reflectprocesses including cell damage, inflammation, and other compensatory responses. Using ametabolomics-based approach to study coordinated changes in metabolic pathways duringthe various phases of MI/R such as ischemia, early or late reperfusion may identify earlybiomarkers unique to the specific phases. Indeed, many animal studies have focused onthe specific changes in the myocardium in these various phases. While those studies areextremely informative, the tissues are not available during routine clinical care of patients.Serum metabolomics offers the ability to map all the changes in the network in circulationand could provide important clinical, translatable insights into potential key changes thatcan serve as true biomarkers. Therefore, we performed untargeted metabolomics in theserum at baseline, at end of ischemia, and at early and late reperfusion in a porcine modelof myocardial ischemia–reperfusion.
2. Methods2.1. Swine MI/R Model
MI/R injury on mini swine was performed using the Consortium for Preclinical As-sessment of Cardioprotective Therapies (CAESAR) model as described previously [24–26].Myocardial ischemia was induced by angioplasty balloon occlusion of the proximal LADcoronary artery for 60 min, followed by balloon deflation and confirmed reperfusion viacoronary angiography that demonstrated complete LAD patency. Serum samples werecollected at baseline, after 60 min of ischemia, and at 4 and 24 h after reperfusion, beforeimmediately storing them at −80 ◦C until further analysis. All procedures were approvedby the Institutional Animal Care and Use Committee of Louisiana State University HealthScience Center.
2.2. Metabolomic Profiling
Pig serum samples were snap-frozen in liquid nitrogen and maintained at −80 ◦Cuntil analysis by Metabolon, Inc. (Morrisville, NC, USA) as described [27]. To preventaccidental sample misidentification, the Metabolon Laboratory Information ManagementSystem (LIMS) was utilized. Each sample received a unique identifier through whichit was tracked throughout sample handling and mass spectrometry analysis. Sampleswere prepped for analysis using an automated system (MicroLab STAR system, Hamilton,Reno, NV, USA). First, recovery standards were added, and then the serum sampleswere deproteinized by methanol precipitation. The extract was divided into five portions:two for analysis by reverse-phase ultra-performance liquid (UPLC)–MS/MS with positiveion mode electrospray ionization (ESI), one for analysis by reverse-phase UPLC–MS/MSwith negative ion mode ESI, one for analysis by hydrophilic interaction (HILIC) UPLC–MS/MS with negative ion mode ESI, and one stored as backup material. The purposeof the four analytical runs under different conditions was to ensure unbiased, maximalcoverage across different classes of metabolites.
Metabolon utilizes several layers of quality control as described previously [27]. Inaddition to the recovery standards added to each sample during processing/extraction,several quality control samples were run concomitantly with the experimental samples:(1) small volumes of the experimental samples were pooled and used as a technical repli-
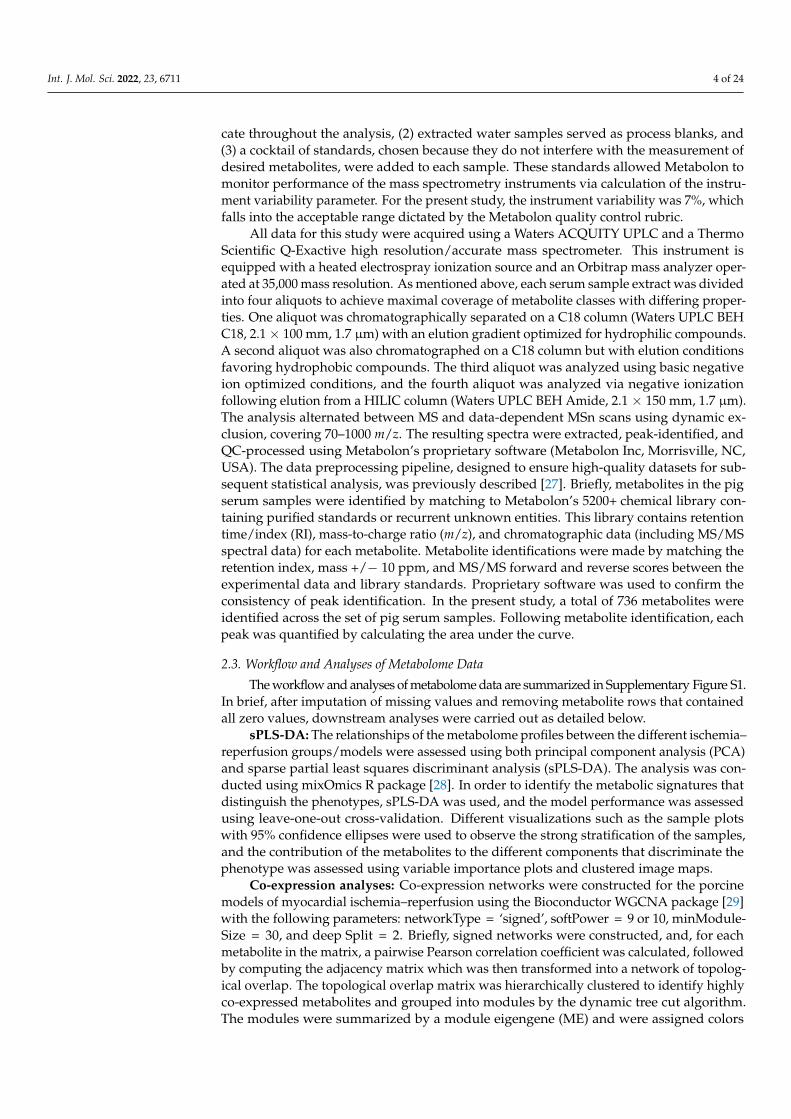
Int. J. Mol. Sci. 2022, 23, 6711 4 of 24
cate throughout the analysis, (2) extracted water samples served as process blanks, and(3) a cocktail of standards, chosen because they do not interfere with the measurement ofdesired metabolites, were added to each sample. These standards allowed Metabolon tomonitor performance of the mass spectrometry instruments via calculation of the instru-ment variability parameter. For the present study, the instrument variability was 7%, whichfalls into the acceptable range dictated by the Metabolon quality control rubric.
All data for this study were acquired using a Waters ACQUITY UPLC and a ThermoScientific Q-Exactive high resolution/accurate mass spectrometer. This instrument isequipped with a heated electrospray ionization source and an Orbitrap mass analyzer oper-ated at 35,000 mass resolution. As mentioned above, each serum sample extract was dividedinto four aliquots to achieve maximal coverage of metabolite classes with differing proper-ties. One aliquot was chromatographically separated on a C18 column (Waters UPLC BEHC18, 2.1 × 100 mm, 1.7 µm) with an elution gradient optimized for hydrophilic compounds.A second aliquot was also chromatographed on a C18 column but with elution conditionsfavoring hydrophobic compounds. The third aliquot was analyzed using basic negativeion optimized conditions, and the fourth aliquot was analyzed via negative ionizationfollowing elution from a HILIC column (Waters UPLC BEH Amide, 2.1 × 150 mm, 1.7 µm).The analysis alternated between MS and data-dependent MSn scans using dynamic ex-clusion, covering 70–1000 m/z. The resulting spectra were extracted, peak-identified, andQC-processed using Metabolon’s proprietary software (Metabolon Inc, Morrisville, NC,USA). The data preprocessing pipeline, designed to ensure high-quality datasets for sub-sequent statistical analysis, was previously described [27]. Briefly, metabolites in the pigserum samples were identified by matching to Metabolon’s 5200+ chemical library con-taining purified standards or recurrent unknown entities. This library contains retentiontime/index (RI), mass-to-charge ratio (m/z), and chromatographic data (including MS/MSspectral data) for each metabolite. Metabolite identifications were made by matching theretention index, mass +/− 10 ppm, and MS/MS forward and reverse scores between theexperimental data and library standards. Proprietary software was used to confirm theconsistency of peak identification. In the present study, a total of 736 metabolites wereidentified across the set of pig serum samples. Following metabolite identification, eachpeak was quantified by calculating the area under the curve.
2.3. Workflow and Analyses of Metabolome Data
The workflow and analyses of metabolome data are summarized in Supplementary Figure S1.In brief, after imputation of missing values and removing metabolite rows that containedall zero values, downstream analyses were carried out as detailed below.
sPLS-DA: The relationships of the metabolome profiles between the different ischemia–reperfusion groups/models were assessed using both principal component analysis (PCA)and sparse partial least squares discriminant analysis (sPLS-DA). The analysis was con-ducted using mixOmics R package [28]. In order to identify the metabolic signatures thatdistinguish the phenotypes, sPLS-DA was used, and the model performance was assessedusing leave-one-out cross-validation. Different visualizations such as the sample plotswith 95% confidence ellipses were used to observe the strong stratification of the samples,and the contribution of the metabolites to the different components that discriminate thephenotype was assessed using variable importance plots and clustered image maps.
Co-expression analyses: Co-expression networks were constructed for the porcinemodels of myocardial ischemia–reperfusion using the Bioconductor WGCNA package [29]with the following parameters: networkType = ‘signed’, softPower = 9 or 10, minModule-Size = 30, and deep Split = 2. Briefly, signed networks were constructed, and, for eachmetabolite in the matrix, a pairwise Pearson correlation coefficient was calculated, followedby computing the adjacency matrix which was then transformed into a network of topolog-ical overlap. The topological overlap matrix was hierarchically clustered to identify highlyco-expressed metabolites and grouped into modules by the dynamic tree cut algorithm.The modules were summarized by a module eigengene (ME) and were assigned colors

Int. J. Mol. Sci. 2022, 23, 6711 5 of 24
as indicated in the horizontal bar of the dendrogram, and the module stability was testedusing the module preservation function in order to provide rigorous quantitative statisticsof module preservation. After co-expressed metabolite module identification, we linkedthe modular metabolite expression with the phenotypes that helped us discover modulesignatures functioning under a specific condition of the ischemia–reperfusion. Functionalannotation of the network modules was performed using the enrichment analysis featurefrom MetaboAnalyst 5.0 [30] with Homo sapiens (SMPDB) as the pathway library of choice.
Statistical analysis: The in vivo studies were performed with seven animals. Allvalues shown are presented as the means ± SEM. An independent two-tailed t-test wasused when comparing two groups between baseline and ischemia phase only. One-wayANOVA was used when more than three conditions were involved. For each statisticallysignificant F-value observed for the main effect or interaction, a two-tailed post hoc test(Tukey’s) was applied to determine individual differences between means. The differencewas considered to be statistically significant when p ≤ 0.05.
3. Results and Discussion3.1. The Stages of IR Injury Show Distinct Serum Metabolite Profiles
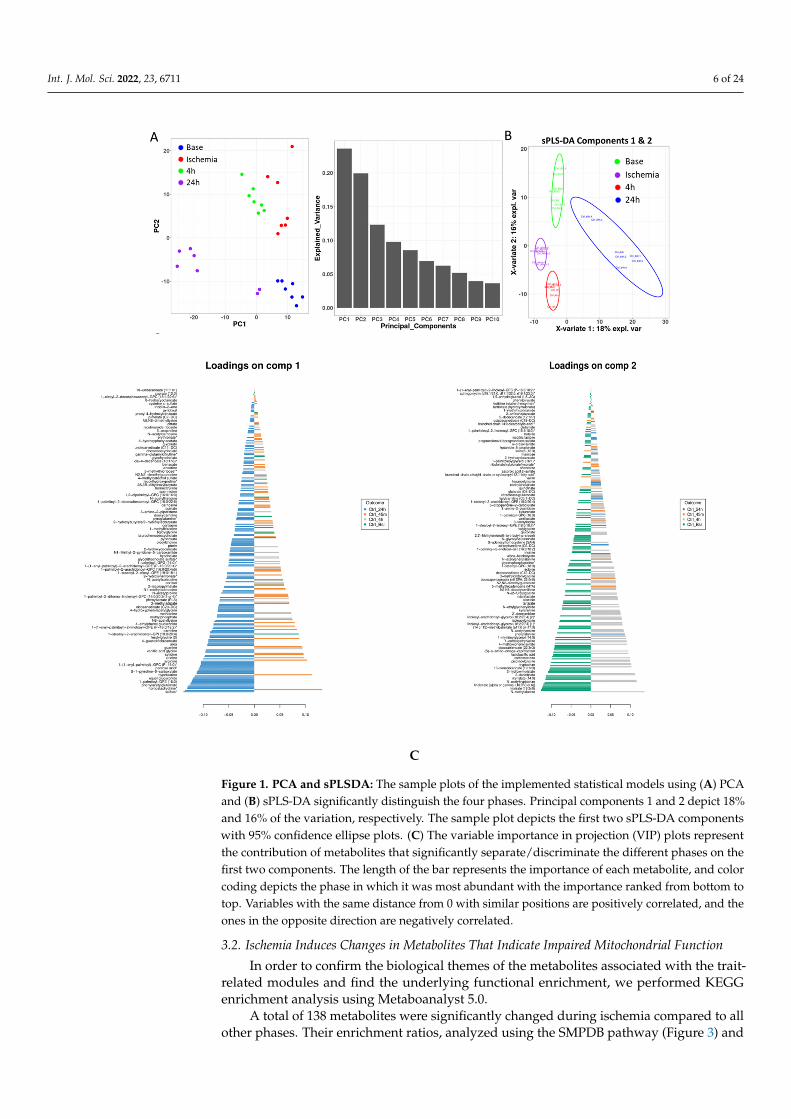
Principal component analysis (PCA) was performed to illustrate the metabolite alter-ations as an effect of time (phase) in pigs using serum samples. The unbiased PCA analysisexhibited a high degree of individual variation and showed the samples profiled at baseline,during ischemia, and at two recovery points as unique and distinct clusters, confirmingthat the sample size was sufficient to conduct further downstream analysis. To identify thetime-phase-associated metabolites, we performed a supervised sparse partial least squaresdiscriminant analysis (sPLSDA), which also confirmed the distinct clustering of the samples,warranting a noticeable metabolic difference that can be attributed to the discriminatedeffect of time. The score plot of the sample shows that the PC1 and PC2 values explained19% and 16% of the data variation, respectively, highlighting the metabolic alterationsamong the base, ischemia, 4 h and 24 h samples (Figure 1). We employed complementarymeasures such as repeated cross-fold validation to avoid overfitting the data, and theresults are consistent with a string characteristic metabolite signal that distinguishes thedifferent phases. Variable importance in projection (VIP) scores were calculated to identifythe most discriminating metabolites between the time (phase)-separated samples.
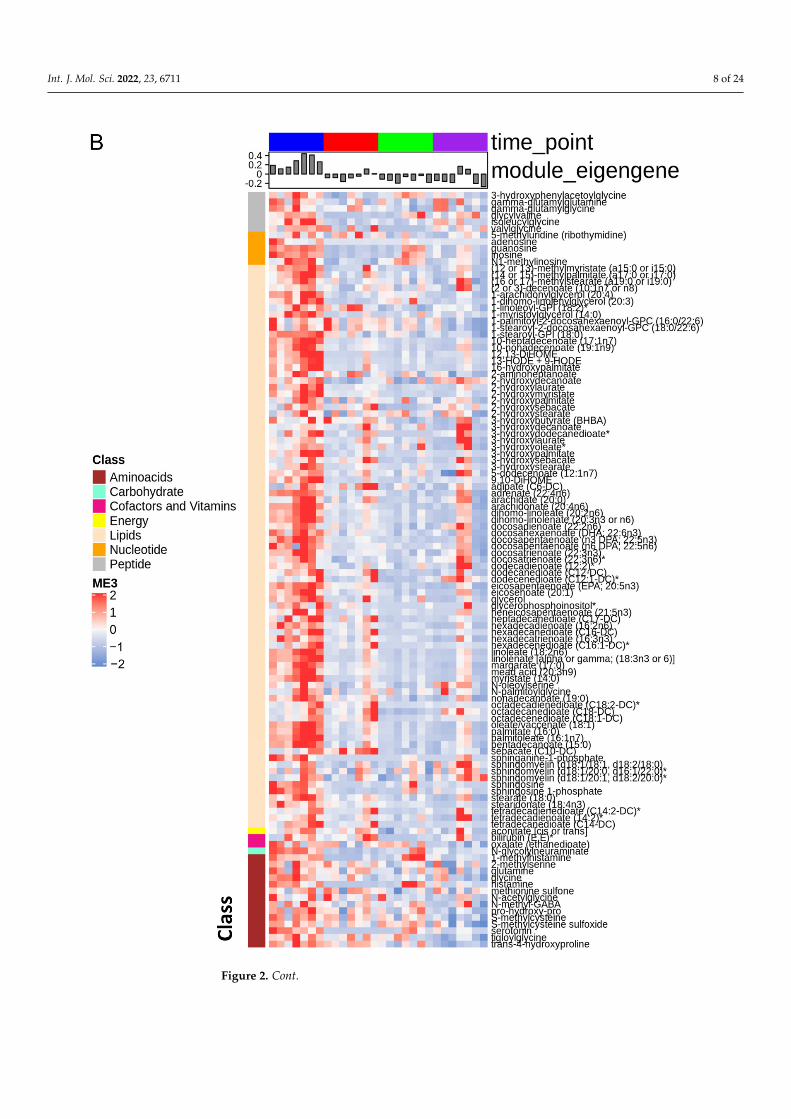
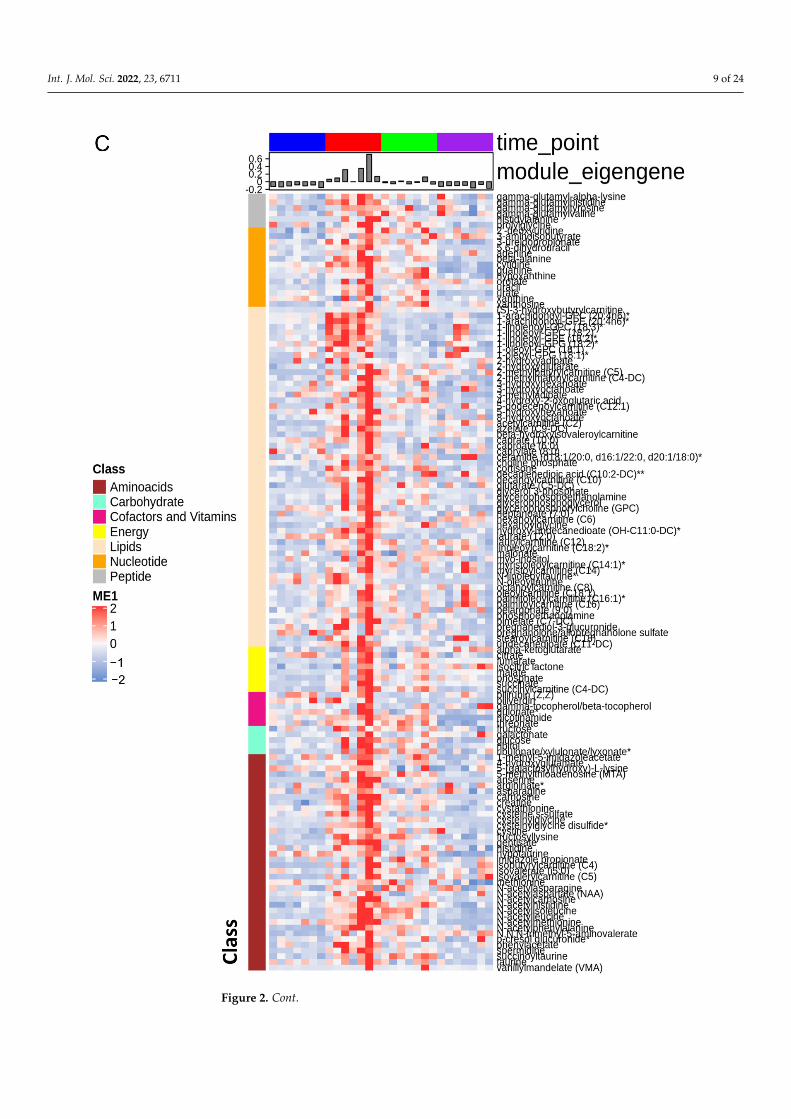
Consequently, we used the WGCNA package to construct co-expression networksusing the metabolite profiles of the four groups of samples. We selected the power value,which is one of the critical parameters, such that the independence and average connectivitywas higher. A total of seven modules containing all metabolites were identified, and themetabolites of each module are demonstrated as a clustering dendrogram that depicts thetopological overlap, together with module assigned colors and numbers (Figure 2A). Theclinical traits of our samples included samples profiled at baseline, during ischemia, and attwo recovery points (4 h and 24 h), and we calculated the correlation coefficients betweenthe modules and the traits. The results elucidated that the brown, turquoise, yellow,and blue modules displayed highest correlation with baseline, ischemia, 4 h reperfusion,and 24 h reperfusion traits (Figure 2A). Figure 2B–E demonstrate the heatmaps of theco-expressed metabolites in the ME3, ME1, ME4, and ME5 modules depicting the base,ischemia, and 4 h and 24 h serum samples, respectively. In these heatmaps, the rowscorrespond to the different metabolites, while the column annotation indicates eigengenemetabolite abundance at different phases. The metabolite values are centered and scaled,and low abundance is indicated by blue, while high abundance is indicated by red.
Int. J. Mol. Sci. 2022, 23, 6711 6 of 24Int. J. Mol. Sci. 2022, 23, x FOR PEER REVIEW 6 of 26
C
Figure 1. PCA and sPLSDA: The sample plots of the implemented statistical models using (A) PCA and (B) sPLS-DA significantly distinguish the four phases. Principal components 1 and 2 depict 18% and 16% of the variation, respectively. The sample plot depicts the first two sPLS-DA components with 95% confidence ellipse plots. (C) The variable importance in projection (VIP) plots represent the contribution of metabolites that significantly separate/discriminate the different phases on the first two components. The length of the bar represents the importance of each metabolite, and color coding depicts the phase in which it was most abundant with the importance ranked from bottom to top. Variables with the same distance from 0 with similar positions are positively correlated, and the ones in the opposite direction are negatively correlated.
Consequently, we used the WGCNA package to construct co-expression networks using the metabolite profiles of the four groups of samples. We selected the power value, which is one of the critical parameters, such that the independence and average connec-tivity was higher. A total of seven modules containing all metabolites were identified, and the metabolites of each module are demonstrated as a clustering dendrogram that depicts the topological overlap, together with module assigned colors and numbers (Figure 2A). The clinical traits of our samples included samples profiled at baseline, during ischemia,
Figure 1. PCA and sPLSDA: The sample plots of the implemented statistical models using (A) PCAand (B) sPLS-DA significantly distinguish the four phases. Principal components 1 and 2 depict 18%and 16% of the variation, respectively. The sample plot depicts the first two sPLS-DA componentswith 95% confidence ellipse plots. (C) The variable importance in projection (VIP) plots representthe contribution of metabolites that significantly separate/discriminate the different phases on thefirst two components. The length of the bar represents the importance of each metabolite, and colorcoding depicts the phase in which it was most abundant with the importance ranked from bottom totop. Variables with the same distance from 0 with similar positions are positively correlated, and theones in the opposite direction are negatively correlated.
3.2. Ischemia Induces Changes in Metabolites That Indicate Impaired Mitochondrial Function
In order to confirm the biological themes of the metabolites associated with the trait-related modules and find the underlying functional enrichment, we performed KEGGenrichment analysis using Metaboanalyst 5.0.
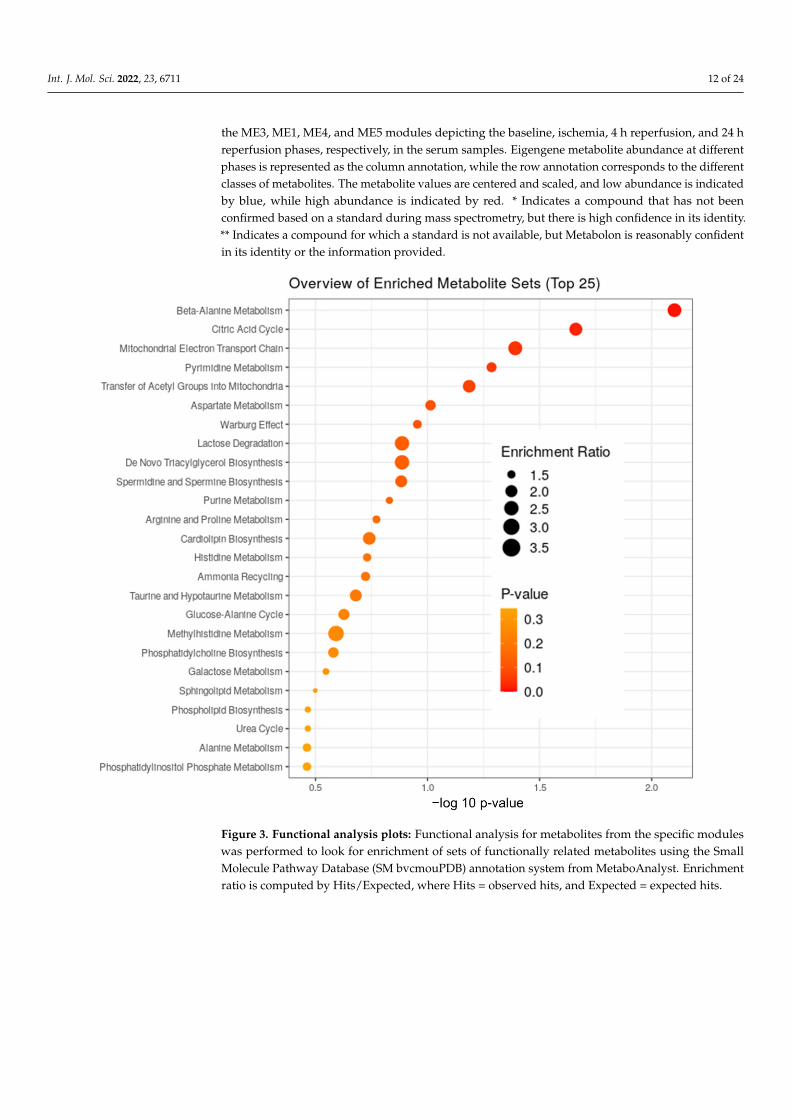
A total of 138 metabolites were significantly changed during ischemia compared to allother phases. Their enrichment ratios, analyzed using the SMPDB pathway (Figure 3) and

Int. J. Mol. Sci. 2022, 23, 6711 7 of 24
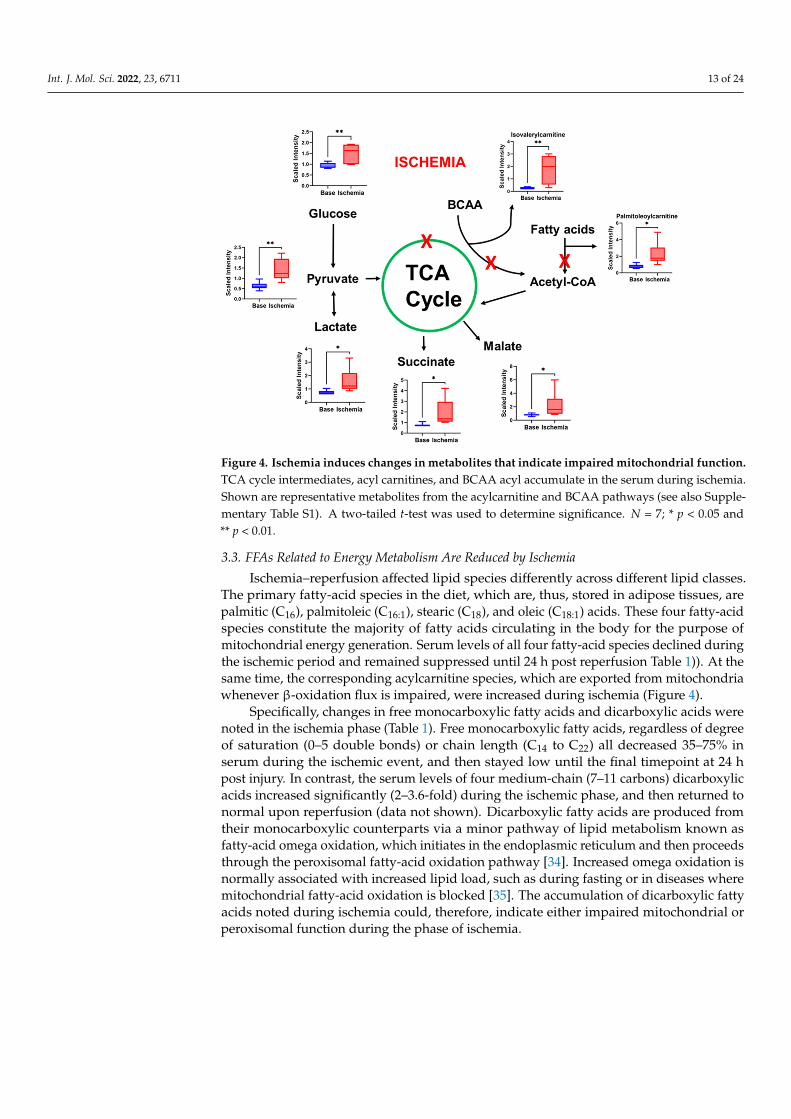
heatmap analysis (Figure 2B), show that some of the major changes noted during ischemiaincluded TCA cycle intermediates, acyl carnitines, polyamine pathway, branched-chainamino-acid metabolites, and modified amino acids (Figure 4). In addition, there was asignificant decrease in polyunsaturated fatty acids.
Blood glucose levels increased during the early phase of acute MI. This could be aconsequence of stress; however, it could also serve as a major energy source for the heart.During myocardial ischemia, an increase in the rate of glycolysis and a switch to lactateproduction have been described. Indeed, our data showed increased levels of pyruvateand lactate in the serum during ischemia and early reperfusion phases. Citrate levels werelower (data not shown), and this could increase glycolysis because citrate is a negativeregulator of glycolysis by inhibiting phosphofructokinase [31].
TCA cycle intermediates including isocitric lactone, alpha-ketoglutarate, succinate,fumarate, and malate were elevated during ischemia, while citrate, the entry point of theTCA cycle, was lower. This suggests mitochondrial stunning and impaired functioning ofTCA cycle during ischemia. In addition to the TCA cycle, mitochondria are the site of FAOand branched-chain amino-acid (BCAA) oxidation (valine, leucine, and isoleucine). Weobserved an increase in BCAA metabolites and acyl carnitines, a well-known indicator ofimpaired FAO. In fact, TCA cycle intermediates and acyl carnitines accounted for ~23%of the changes in metabolites during ischemia. BCAAs promote unfavorable substrateswitches especially in the ischemic or reperfused myocardium; they suppress cardiacglucose oxidation via inhibiting PDH activity and increase FAO through peroxisomeproliferator-activated receptor (PPAR) alpha [32]. While specific impairment of BCAAoxidation could be a feature of the specific phases of the insult as noted in our study, theseverity and/or persistence of this abnormality can lead to long term morbidity. Indeed,Uddin et al. showed that BCAA metabolites are higher in the hearts of subjects withdilated cardiomyopathy [33]. Furthermore, stimulation of BCAA oxidation improves thepercentage ejection fraction (% EF) without altering cardiac hypertrophy. To what extentthe source of serum BCAA metabolites in our model was the cardiac muscle versus othertissue needs to be clarified in future studies.
Int. J. Mol. Sci. 2022, 23, x FOR PEER REVIEW 7 of 26
and at two recovery points (4 h and 24 h), and we calculated the correlation coefficients between the modules and the traits. The results elucidated that the brown, turquoise, yel-low, and blue modules displayed highest correlation with baseline, ischemia, 4 h reperfu-sion, and 24 h reperfusion traits (Figure 2A). Figure 2B–E demonstrate the heatmaps of the co-expressed metabolites in the ME3, ME1, ME4, and ME5 modules depicting the base, ischemia, and 4 h and 24 h serum samples, respectively. In these heatmaps, the rows cor-respond to the different metabolites, while the column annotation indicates eigengene metabolite abundance at different phases. The metabolite values are centered and scaled, and low abundance is indicated by blue, while high abundance is indicated by red.
(A)
Figure 2. Cont.
Int. J. Mol. Sci. 2022, 23, 6711 8 of 24
Int. J. Mol. Sci. 2022, 23, x FOR PEER REVIEW 8 of 26
Figure 2. Cont.
Int. J. Mol. Sci. 2022, 23, 6711 9 of 24
Int. J. Mol. Sci. 2022, 23, x FOR PEER REVIEW 9 of 26
Figure 2. Cont.

Int. J. Mol. Sci. 2022, 23, 6711 10 of 24
Int. J. Mol. Sci. 2022, 23, x FOR PEER REVIEW 10 of 26
Figure 2. Cont.

Int. J. Mol. Sci. 2022, 23, 6711 11 of 24
1
Figure 2. Co-expression heatmaps: (A) Heatmap of module–trait relationship depicting the correla-tion between module eigen metabolites and timepoints. The module eigen metabolite is defined asthe first principal component of a given module and considered a representative of the metaboliteprofile in a module. The grid is color-coded by correlation according to the color bar of the correlation:red for positive and blue for negative correlation. (B–E) Heatmaps of the co-expressed metabolites in
Int. J. Mol. Sci. 2022, 23, 6711 12 of 24
the ME3, ME1, ME4, and ME5 modules depicting the baseline, ischemia, 4 h reperfusion, and 24 hreperfusion phases, respectively, in the serum samples. Eigengene metabolite abundance at differentphases is represented as the column annotation, while the row annotation corresponds to the differentclasses of metabolites. The metabolite values are centered and scaled, and low abundance is indicatedby blue, while high abundance is indicated by red. * Indicates a compound that has not beenconfirmed based on a standard during mass spectrometry, but there is high confidence in its identity.** Indicates a compound for which a standard is not available, but Metabolon is reasonably confidentin its identity or the information provided.
Int. J. Mol. Sci. 2022, 23, x FOR PEER REVIEW 13 of 26
Figure 3. Functional analysis plots: Functional analysis for metabolites from the specific modules was performed to look for enrichment of sets of functionally related metabolites using the Small Molecule Pathway Database (SM bvcmouPDB) annotation system from MetaboAnalyst. Enrich-ment ratio is computed by Hits/Expected, where Hits=observed hits, and Expected = expected hits.
Figure 4. Ischemia induces changes in metabolites that indicate impaired mitochondrial function. TCA cycle intermediates, acyl carnitines, and BCAA acyl accumulate in the serum during ischemia.
Figure 3. Functional analysis plots: Functional analysis for metabolites from the specific moduleswas performed to look for enrichment of sets of functionally related metabolites using the SmallMolecule Pathway Database (SM bvcmouPDB) annotation system from MetaboAnalyst. Enrichmentratio is computed by Hits/Expected, where Hits = observed hits, and Expected = expected hits.
Int. J. Mol. Sci. 2022, 23, 6711 13 of 24
Int. J. Mol. Sci. 2022, 23, x FOR PEER REVIEW 13 of 26
Figure 3. Functional analysis plots: Functional analysis for metabolites from the specific modules was performed to look for enrichment of sets of functionally related metabolites using the Small Molecule Pathway Database (SM bvcmouPDB) annotation system from MetaboAnalyst. Enrich-ment ratio is computed by Hits/Expected, where Hits=observed hits, and Expected = expected hits.
Figure 4. Ischemia induces changes in metabolites that indicate impaired mitochondrial function. TCA cycle intermediates, acyl carnitines, and BCAA acyl accumulate in the serum during ischemia. Figure 4. Ischemia induces changes in metabolites that indicate impaired mitochondrial function.TCA cycle intermediates, acyl carnitines, and BCAA acyl accumulate in the serum during ischemia.Shown are representative metabolites from the acylcarnitine and BCAA pathways (see also Supple-mentary Table S1). A two-tailed t-test was used to determine significance. N = 7; * p < 0.05 and** p < 0.01.
3.3. FFAs Related to Energy Metabolism Are Reduced by Ischemia
Ischemia–reperfusion affected lipid species differently across different lipid classes.The primary fatty-acid species in the diet, which are, thus, stored in adipose tissues, arepalmitic (C16), palmitoleic (C16:1), stearic (C18), and oleic (C18:1) acids. These four fatty-acidspecies constitute the majority of fatty acids circulating in the body for the purpose ofmitochondrial energy generation. Serum levels of all four fatty-acid species declined duringthe ischemic period and remained suppressed until 24 h post reperfusion Table 1)). At thesame time, the corresponding acylcarnitine species, which are exported from mitochondriawhenever β-oxidation flux is impaired, were increased during ischemia (Figure 4).
Specifically, changes in free monocarboxylic fatty acids and dicarboxylic acids werenoted in the ischemia phase (Table 1). Free monocarboxylic fatty acids, regardless of degreeof saturation (0–5 double bonds) or chain length (C14 to C22) all decreased 35–75% inserum during the ischemic event, and then stayed low until the final timepoint at 24 hpost injury. In contrast, the serum levels of four medium-chain (7–11 carbons) dicarboxylicacids increased significantly (2–3.6-fold) during the ischemic phase, and then returned tonormal upon reperfusion (data not shown). Dicarboxylic fatty acids are produced fromtheir monocarboxylic counterparts via a minor pathway of lipid metabolism known asfatty-acid omega oxidation, which initiates in the endoplasmic reticulum and then proceedsthrough the peroxisomal fatty-acid oxidation pathway [34]. Increased omega oxidation isnormally associated with increased lipid load, such as during fasting or in diseases wheremitochondrial fatty-acid oxidation is blocked [35]. The accumulation of dicarboxylic fattyacids noted during ischemia could, therefore, indicate either impaired mitochondrial orperoxisomal function during the phase of ischemia.

Int. J. Mol. Sci. 2022, 23, 6711 14 of 24
Table 1. List of fold changes of FFAs during ischemia and reperfusion phases.
Ischemia 4 h 24 h p-Value Effect Size
Saturated Fatty Acids
Myristate (14:0) 0.29 0.22 0.24 1.4 × 10⁻¹¹ 0.67
Pentadecanoate (15:0) 0.64 0.53 0.57 5.5 × 10⁻¹¹ 0.65
Palmitate (16:0) 0.44 0.30 0.31 6.5 × 10⁻¹¹ 0.66
Margarate (17:0) 0.46 0.29 0.27 1.0 × 10⁻¹¹ 0.67
Monounsaturated Fatty Acids
Palmitoleate (16:1n7) 0.25 0.15 0.18 2.0 × 10⁻¹² 0.69
10-Heptadecenoate (17:1n7) 0.25 0.14 0.16 2.0 × 10⁻¹² 0.70
Oleate/vaccenate (18:1) 0.40 0.22 0.22 3.4 × 10⁻¹¹ 0.72
10-Nonadecenoate (19:1n9) 0.36 0.24 0.28 1.0 × 10⁻¹⁰ 0.65
Polyunsatured Fatty Acids
Linoleate (18:2n6) 0.34 0.19 0.24 7.0 × 10⁻¹² 0.69
Linolenate (alpha or gamma; (18:3n3 or 6)) 0.27 0.15 0.20 8.0 × 10⁻¹² 0.65
Mead acid (20:3n9) 0.36 0.21 0.21 3.7 × 10⁻¹¹ 0.58
Dihomo-linolenate (20:3n3 or n6) 0.37 0.27 0.26 1.2 × 10⁻¹⁰ 0.68
Arachidonate (20:4n6) 0.47 0.30 0.36 6.6 × 10⁻¹⁰ 0.70
Eicosapentaenoate (EPA; 20:5n3) 0.51 0.25 0.25 1.0 × 10⁻¹¹ 0.66
Adrenate (22:4n6) 0.44 0.32 0.44 1.0 × 10⁻⁷ 0.61
Docosapentaenoate (n3 DPA; 22:5n3) 0.41 0.29 0.37 1.5 × 10⁻⁹ 0.66
Fold change denote a decrease from baseline.
Some changes were also noted in lysophospholids (Supplementary Table S1). Lysophos-pholipids are phospholipids where one acyl chain has been removed by hydrolysis, andthis could indicate membrane damage during ischemia. While the biological roles oflysophospholipids are complex and poorly understood, increased serum lysophospho-lipids have been linked to several disease states [36]. Here, we observed differential effectsof ischemia–reperfusion depending upon the saturation of the lysophospholipid acyl chain.Specifically, we detected five species with unsaturated acyl chains (18–20 carbons in length,2–4 double bonds) that increased about twofold during ischemia, and then fell to eithernormal or below normal levels during reperfusion. Lastly, one lysophospholipid specieswith a saturated acyl-chain (1-stearoyl-GPI) decreased during ischemia and stayed lowthroughout reperfusion, while two other saturated species containing palmitoyl acyl-chains(C16:0) were unaffected by ischemia but showed significantly elevated levels in serum after24 h of reperfusion.
3.4. Polyunsaturated Fatty Acids (PUFAs) Are Suppressed by I–R Injury
PUFA, particularly those of chain lengths C20 and C22, are key components of bothcellular membranes and immune signaling pathways. There are two major series of PUFA,dubbed n-3 (omega-3) and n-6 (omega-6) depending upon the position of the double bonds.The n-3 series is derived through elongation and desaturation of the essential fatty acidlinolenic acid (C18:3), while the n-6 series is derived from the essential fatty acid linoleicacid (C18:2). Many studies have established the cardioprotective effects of n-3 PUFAs,particularly EPA and DHA, while n-6 PUFAs are considered detrimental [37]. While themechanisms behind this have not been fully established, the most invoked explanationis that downstream metabolites generated from n-3 PUFAs are anti-inflammatory (i.e.,resolvins and protectins) while those generated from n-6 PUFAs are proinflammatory

Int. J. Mol. Sci. 2022, 23, 6711 15 of 24
(HETE, eicosanoids, leukotrienes, prostaglandins, etc.). Interestingly, all C20/C22 PUFAsdetected in our study, regardless of series, were significantly decreased in serum duringthe ischemic period, as were the essential fatty-acid precursors C18:2 and C18:3 (Figure 5A,B;Table 1). At present, the determinants of serum PUFA are not clear. One recent rodentstudy of synthesis and degradation kinetics suggested that it is the rate of catabolism thatdetermines serum PUFA. The low serum PUFA following ischemia in pigs could be due tosiphoning off C20 and C22 PUFA species for generation of second messenger lipid speciessuch as eicosanoids and resolvins. Unfortunately, most of these signaling lipid species werenot captured in our analysis. However, three species of the C18 signaling lipids HODEand DiHOME were detected, and all showed a similar degree of suppression to the PUFAspecies (Figure 5A). This suggests a potential role of these metabolites as biomarkers forthe ischemic phase.
Int. J. Mol. Sci. 2022, 23, x FOR PEER REVIEW 16 of 26
PUFA, dubbed n-3 (omega-3) and n-6 (omega-6) depending upon the position of the dou-ble bonds. The n-3 series is derived through elongation and desaturation of the essential fatty acid linolenic acid (C18:3), while the n-6 series is derived from the essential fatty acid linoleic acid (C18:2). Many studies have established the cardioprotective effects of n-3 PUFAs, particularly EPA and DHA, while n-6 PUFAs are considered detrimental [37]. While the mechanisms behind this have not been fully established, the most invoked ex-planation is that downstream metabolites generated from n-3 PUFAs are anti-inflamma-tory (i.e., resolvins and protectins) while those generated from n-6 PUFAs are proinflam-matory (HETE, eicosanoids, leukotrienes, prostaglandins, etc.). Interestingly, all C20/C22
PUFAs detected in our study, regardless of series, were significantly decreased in serum during the ischemic period, as were the essential fatty-acid precursors C18:2 and C18:3 (Fig-ure 5A,B; Table 1). At present, the determinants of serum PUFA are not clear. One recent rodent study of synthesis and degradation kinetics suggested that it is the rate of catabo-lism that determines serum PUFA. The low serum PUFA following ischemia in pigs could be due to siphoning off C20 and C22 PUFA species for generation of second messenger lipid species such as eicosanoids and resolvins. Unfortunately, most of these signaling lipid species were not captured in our analysis. However, three species of the C18 signaling li-pids HODE and DiHOME were detected, and all showed a similar degree of suppression to the PUFA species (Figure 5A). This suggests a potential role of these metabolites as biomarkers for the ischemic phase.
Figure 5. I–R injury suppresses serum level of PUFAs. (A) Pro-inflammatory N-3 PUFAs are syn-thesized through elongation and desaturation of linoleic acid (C18:2). (B) Anti-inflammatory N-6 PUFAs are synthesized through elongation and desaturation of alpha = linolenic acid (18:3). One-way ANOVA was run to determine significance, all are statistically significant. N = 7.
3.5. Ischemia Increases Serum Levels of N-Acetylated Amino Acids Another interesting observation noted during ischemia was the increase in N-termi-
nal acetylation (NTA) in many amino acids (AA). Metabolomic profiling demonstrated NTA of 19 AA and their metabolites (total of 27). Furthermore, eight of the top statistically
Figure 5. I–R injury suppresses serum level of PUFAs. (A) Pro-inflammatory N-3 PUFAs aresynthesized through elongation and desaturation of linoleic acid (C18:2). (B) Anti-inflammatory N-6PUFAs are synthesized through elongation and desaturation of alpha = linolenic acid (18:3). One-wayANOVA was run to determine significance, all are statistically significant. N = 7.
3.5. Ischemia Increases Serum Levels of N-Acetylated Amino Acids
Another interesting observation noted during ischemia was the increase in N-terminalacetylation (NTA) in many amino acids (AA). Metabolomic profiling demonstrated NTAof 19 AA and their metabolites (total of 27). Furthermore, eight of the top statisticallysignificant 100 metabolites that showed an effect size of >0.5 were N-acetylated amino acids(Table 2). Of the 27, 18 of the metabolites showed significant changes during the ischemicperiod. While NTA increased in most amino acids, some decreased. Specifically, changes inN-acetyl leucine, isoleucine, methionine, and histidine accounted for the separation of thegroups during ischemia. They were significantly increased, leading us to speculate thatNTA could be a protective mechanism intended to lower BCAA, which can adversely affectcardiac function, or to shift away from FAO. NTA is considered generally irreversible andwas discovered to be a degradation signal in a distinct branch of the N-end rule pathway,ubiquitin-mediated proteolysis. Although we cannot predict the impact of NTA on a targetprotein, a function for cytosolic NTA during stress responses has been proposed in plants.
Int. J. Mol. Sci. 2022, 23, 6711 16 of 24
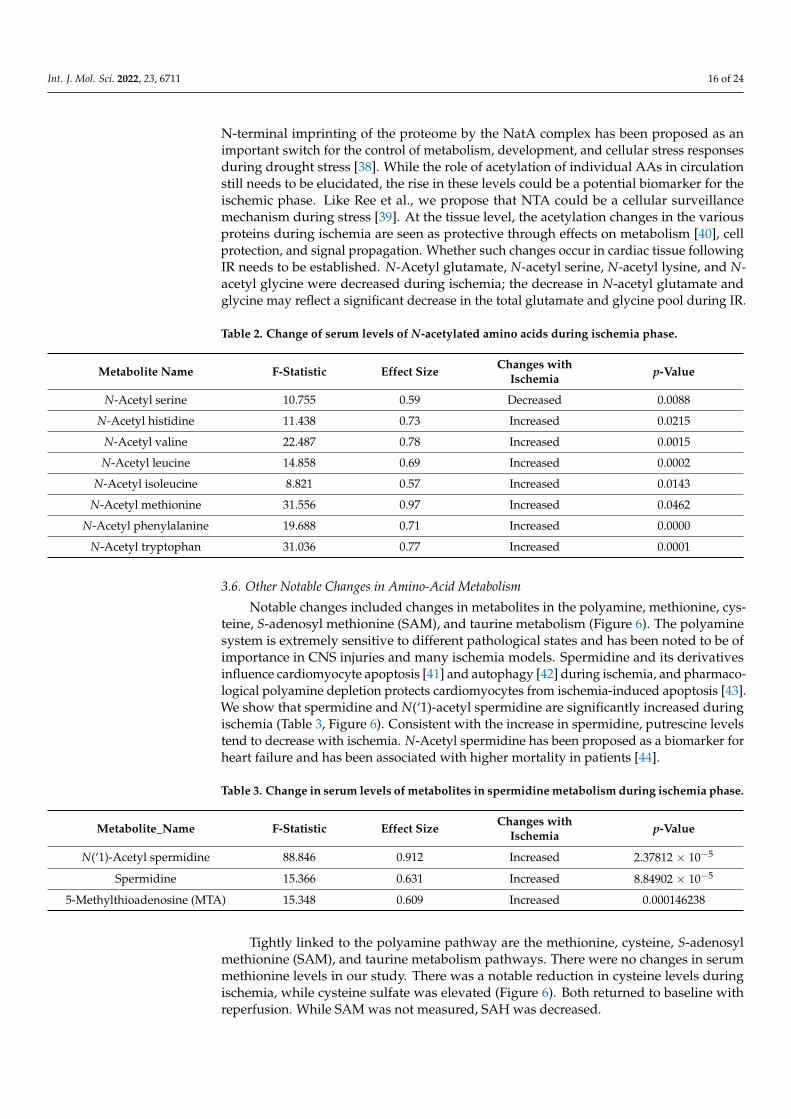
N-terminal imprinting of the proteome by the NatA complex has been proposed as animportant switch for the control of metabolism, development, and cellular stress responsesduring drought stress [38]. While the role of acetylation of individual AAs in circulationstill needs to be elucidated, the rise in these levels could be a potential biomarker for theischemic phase. Like Ree et al., we propose that NTA could be a cellular surveillancemechanism during stress [39]. At the tissue level, the acetylation changes in the variousproteins during ischemia are seen as protective through effects on metabolism [40], cellprotection, and signal propagation. Whether such changes occur in cardiac tissue followingIR needs to be established. N-Acetyl glutamate, N-acetyl serine, N-acetyl lysine, and N-acetyl glycine were decreased during ischemia; the decrease in N-acetyl glutamate andglycine may reflect a significant decrease in the total glutamate and glycine pool during IR.
Table 2. Change of serum levels of N-acetylated amino acids during ischemia phase.
Metabolite Name F-Statistic Effect Size Changes withIschemia p-Value
N-Acetyl serine 10.755 0.59 Decreased 0.0088
N-Acetyl histidine 11.438 0.73 Increased 0.0215
N-Acetyl valine 22.487 0.78 Increased 0.0015
N-Acetyl leucine 14.858 0.69 Increased 0.0002
N-Acetyl isoleucine 8.821 0.57 Increased 0.0143
N-Acetyl methionine 31.556 0.97 Increased 0.0462
N-Acetyl phenylalanine 19.688 0.71 Increased 0.0000
N-Acetyl tryptophan 31.036 0.77 Increased 0.0001
3.6. Other Notable Changes in Amino-Acid Metabolism
Notable changes included changes in metabolites in the polyamine, methionine, cys-teine, S-adenosyl methionine (SAM), and taurine metabolism (Figure 6). The polyaminesystem is extremely sensitive to different pathological states and has been noted to be ofimportance in CNS injuries and many ischemia models. Spermidine and its derivativesinfluence cardiomyocyte apoptosis [41] and autophagy [42] during ischemia, and pharmaco-logical polyamine depletion protects cardiomyocytes from ischemia-induced apoptosis [43].We show that spermidine and N(‘1)-acetyl spermidine are significantly increased duringischemia (Table 3, Figure 6). Consistent with the increase in spermidine, putrescine levelstend to decrease with ischemia. N-Acetyl spermidine has been proposed as a biomarker forheart failure and has been associated with higher mortality in patients [44].
Table 3. Change in serum levels of metabolites in spermidine metabolism during ischemia phase.
Metabolite_Name F-Statistic Effect Size Changes withIschemia p-Value
N(‘1)-Acetyl spermidine 88.846 0.912 Increased 2.37812 × 10⁻⁵
Spermidine 15.366 0.631 Increased 8.84902 × 10⁻⁵
5-Methylthioadenosine (MTA) 15.348 0.609 Increased 0.000146238
Tightly linked to the polyamine pathway are the methionine, cysteine, S-adenosylmethionine (SAM), and taurine metabolism pathways. There were no changes in serummethionine levels in our study. There was a notable reduction in cysteine levels duringischemia, while cysteine sulfate was elevated (Figure 6). Both returned to baseline withreperfusion. While SAM was not measured, SAH was decreased.

Int. J. Mol. Sci. 2022, 23, 6711 17 of 24
Int. J. Mol. Sci. 2022, 23, x FOR PEER REVIEW 18 of 26
Table 3. Change in serum levels of metabolites in spermidine metabolism during ischemia phase.
Metabolite_Name F- Statistic Effect Size Changes with Ischemia p-Value N(‘1)-Acetyl spermidine 88.846 0.912 Increased 2.37812 × 10⁻⁵
Spermidine 15.366 0.631 Increased 8.84902 × 10⁻⁵ 5-Methylthioadenosine
(MTA) 15.348 0.609 Increased 0.000146238
Tightly linked to the polyamine pathway are the methionine, cysteine, S-adenosyl methionine (SAM), and taurine metabolism pathways. There were no changes in serum methionine levels in our study. There was a notable reduction in cysteine levels during ischemia, while cysteine sulfate was elevated (Figure 6). Both returned to baseline with reperfusion. While SAM was not measured, SAH was decreased.
Figure 6. Significantly altered metabolites in the polyamine, methionine, cysteine, SAM, and taurine metabolism in serum induced by I–R. One-way ANOVA was run to determine significance. N = 7.
3.7. BCAA Metabolites and Glycerols Are Predominant during the Early Reperfusion Phase While the metabolomics profile at the end of ischemia reflects changes that occurred
following ischemia, the profiles during reperfusion include changes that occurred follow-ing ischemia and reperfusion. From the metabolomics analysis performed at 4 and 24 h post reperfusion, we noted that some metabolite changes were specific to early (4 h) or late (24 h) reperfusion phases. One of the striking changes in metabolites noted in the early reperfusion phase was the accumulation of unusual intermediates of branched-chain amino-acid (BCAA) metabolism in the serum. These metabolites were the most prevalent and accounted for ~17% of the changes noted. Some of the unique BCAA metabolites are derived from the microbiome; the specific significance of these biochemical modifications in the context of ischemia–reperfusion needs to be studied. The other class of metabolites that was significantly increased during early reperfusion was represented by glycerols. Diacylglycerols (DAGs) are important lipid intermediates in triacylglycerol (TAG) biosyn-thesis and play a role as key signaling lipids. Here, we observed a strong, transient in-crease in several DAG species during early reperfusion (4 h), which became resolved by late reperfusion (24 h) (Figure 7). These DAG species were enriched in polyunsaturated
Figure 6. Significantly altered metabolites in the polyamine, methionine, cysteine, SAM, and taurinemetabolism in serum induced by I–R. One-way ANOVA was run to determine significance. N = 7.
3.7. BCAA Metabolites and Glycerols Are Predominant during the Early Reperfusion Phase
While the metabolomics profile at the end of ischemia reflects changes that occurredfollowing ischemia, the profiles during reperfusion include changes that occurred followingischemia and reperfusion. From the metabolomics analysis performed at 4 and 24 hpost reperfusion, we noted that some metabolite changes were specific to early (4 h) orlate (24 h) reperfusion phases. One of the striking changes in metabolites noted in theearly reperfusion phase was the accumulation of unusual intermediates of branched-chain amino-acid (BCAA) metabolism in the serum. These metabolites were the mostprevalent and accounted for ~17% of the changes noted. Some of the unique BCAAmetabolites are derived from the microbiome; the specific significance of these biochemicalmodifications in the context of ischemia–reperfusion needs to be studied. The other class ofmetabolites that was significantly increased during early reperfusion was represented byglycerols. Diacylglycerols (DAGs) are important lipid intermediates in triacylglycerol (TAG)biosynthesis and play a role as key signaling lipids. Here, we observed a strong, transientincrease in several DAG species during early reperfusion (4 h), which became resolved bylate reperfusion (24 h) (Figure 7). These DAG species were enriched in polyunsaturated acylchains in the 1,2 positions, particularly C18:2 (linoleic) and C20:4 (arachidonic) acids. BecauseDAGs related to TAG synthesis typically contain mostly saturated acyl chains optimizedfor energy metabolism (i.e., C16:0, C18:0), the source of the elevated DAGs observed herewas most likely the hydrolysis of plasma membrane phosphoinositides. A signalingpathway was previously well delineated [45] in which cardiac injury stimulates activityof phospholipase-C (PLC) at the plasma membrane, which hydrolyzes phosphoinositidessuch as phosphatidylinositol 4,5-bisphosphate (PIP2) into 1,2-DAG and inositol 1,4,5-trisphosphate (IP3). Both 1,2-DAGs and IP3 are powerful second messengers. IP3 inducesthe release of intracellular calcium stores with many downstream consequences. DAGsactivate protein kinase C (PKC), which plays a significant role in mediating subsequenttissue injury in the heart [46]. Of note, only 1,2-DAGs, and not 2,3 or 1,3-DAG species, arecapable of activating PKC [47]. Additionally, 1,2-DAGs can be further metabolized to either1- or 2-monoacylglycerols (MAGs) by the enzyme DAG lipase. Indeed, in our study, the

Int. J. Mol. Sci. 2022, 23, 6711 18 of 24
abundance of five unsaturated 1-MAG and 2-MAG species was observed to follow thesame pattern as DAGs during reperfusion (Figure 7).
Int. J. Mol. Sci. 2022, 23, x FOR PEER REVIEW 19 of 26
acyl chains in the 1,2 positions, particularly C18:2 (linoleic) and C20:4 (arachidonic) acids. Be-cause DAGs related to TAG synthesis typically contain mostly saturated acyl chains opti-mized for energy metabolism (i.e., C16:0, C18:0), the source of the elevated DAGs observed here was most likely the hydrolysis of plasma membrane phosphoinositides. A signaling pathway was previously well delineated [45] in which cardiac injury stimulates activity of phospholipase-C (PLC) at the plasma membrane, which hydrolyzes phosphoinositides such as phosphatidylinositol 4,5-bisphosphate (PIP2) into 1,2-DAG and inositol 1,4,5-trisphosphate (IP3). Both 1,2-DAGs and IP3 are powerful second messengers. IP3 induces the release of intracellular calcium stores with many downstream consequences. DAGs activate protein kinase C (PKC), which plays a significant role in mediating subsequent tissue injury in the heart [46]. Of note, only 1,2-DAGs, and not 2,3 or 1,3-DAG species, are capable of activating PKC [47]. Additionally, 1,2-DAGs can be further metabolized to ei-ther 1- or 2-monoacylglycerols (MAGs) by the enzyme DAG lipase. Indeed, in our study, the abundance of five unsaturated 1-MAG and 2-MAG species was observed to follow the same pattern as DAGs during reperfusion (Figure 7).
Figure 7. DAGs and MAGs increase during early reperfusion (4 h) and drop back to baseline level at late reperfusion (24 h). Shown are representative DAG and MAG species (see Supplemen-tary Table S1 for full dataset). One-way ANOVA was run to determine significance. N = 7.
3.8. Bile Acids Are Key Metabolites during Late Reperfusion Phase One of the key groups of metabolites that marked the late reperfusion phase was
represented by the primary and secondary bile acids (Figures 8 and 9). Primary and sec-ondary bile acids increased during the ischemic phase by 2–10-fold, and they decreased significantly during early reperfusion, but increased significantly during late reperfusion phase, with levels reaching as high as 80-fold higher than those observed during early reperfusion (Table 4). Liver enzymes (ALT, AST) were also significantly increased at 24 h (AST of 5920 IU/L and ALT of 544 IU/L compared to AST of 15–53 IU/L and ALT of 20–48 IU/L reported in healthy miniature swine (Yucatan, Hanford minipig)), indicating signif-icant liver ischemia [48]. The elevated secondary bile acids could reflect bowel microbiota and perfusion during the reperfusion phases.
Figure 7. DAGs and MAGs increase during early reperfusion (4 h) and drop back to baseline levelat late reperfusion (24 h). Shown are representative DAG and MAG species (see SupplementaryTable S1 for full dataset). One-way ANOVA was run to determine significance. N = 7.
3.8. Bile Acids Are Key Metabolites during Late Reperfusion Phase
One of the key groups of metabolites that marked the late reperfusion phase wasrepresented by the primary and secondary bile acids (Figures 8 and 9). Primary andsecondary bile acids increased during the ischemic phase by 2–10-fold, and they decreasedsignificantly during early reperfusion, but increased significantly during late reperfusionphase, with levels reaching as high as 80-fold higher than those observed during earlyreperfusion (Table 4). Liver enzymes (ALT, AST) were also significantly increased at 24 h(AST of 5920 IU/L and ALT of 544 IU/L compared to AST of 15–53 IU/L and ALT of20–48 IU/L reported in healthy miniature swine (Yucatan, Hanford minipig)), indicatingsignificant liver ischemia [48]. The elevated secondary bile acids could reflect bowelmicrobiota and perfusion during the reperfusion phases.
Bile acids have recently attracted attention for their effects on the heart throughfarnesoid X receptor (FXR), TRG5 receptors, and muscarinic receptors. Various bile acidsuse different receptors. For example, chenodeoxy cholic acid (CDCA), deoxycholic acid(DCA), and lithocholicacid (LCA) use FXR and TRG5 for signaling, while ursodexoycholicacid (UDCA) uses only TRG5 for signaling. Activation of FXR and TRG5 has been shownto slow the atheroma formation and decrease plaque size and inflammation [49]. Lowerfasting serum total bile acids levels (including total levels of cholic acid, CDCA, DCA,and UDCA) are independently associated with severe coronary artery disease and MI [32],and they have been proposed as a biomarker to predict the presence and severity ofcoronary artery disease. Feng et al. showed that, in a select group of patients. i.e.,menopausal women with type 2 diabetes mellitus, myocardial infarction and coronaryartery disease were negatively correlated with total serum bile acids [50]. Consistent withthe above, Huang et al. showed that increased admission serum total bile acids could beassociated with decreased 3 month mortality in patients with acute ischemic stroke [51].However, in asymptomatic individuals, Zhang et al. showed that higher serum total bileacid level was associated with the severe coronary artery stenosis and high-risk coronaryartery plaques [52].

Int. J. Mol. Sci. 2022, 23, 6711 19 of 24Int. J. Mol. Sci. 2022, 23, x FOR PEER REVIEW 21 of 26
Figure 8. Enrichment of bile acids and amino-acid metabolites during late reperfusion (24 h). The functional analysis for metabolites from the late reperfusion module was performed using the Small Molecule Pathway Database (SMPDB) annotation system from MetaboAnalyst.
The effects of bile acids on the cardiac function are based on the hydrophilicity of the bile acid, with hydrophobic bile acids being more cardiotoxic. LCA is the most hydropho-bic bile acid; hence, only a small amount of LCA is usually reabsorbed back into the en-terohepatic circulation. However, in our porcine I–R model, the levels of LCA increased 12-fold during late reperfusion compared to early reperfusion (Table 4). The least toxic bile acid is UDCA. UDCA, synthesized by dehydroxylation of the free bile acid CDCA, is the most hydrophilic bile acid and has been shown in many studies to be cardioprotective. In rodent models of I–R, UDCA was shown to improve contractile function during reper-fusion, inhibit the opening of the mitochondria permeability transition pore (MPTP) and Bcl-2 via the PI3K/Akt pathway, and improve endothelium- and NO-independent vaso-dilatation, maintaining the arterial flow in patients with heart failure. Unfortunately, our metabolic analytes profile did not include UDCA. The alterations in bile acids are similar to what has been observed in humans following cardiac arrest and resuscitation [53]. The taurine conjugates of bile acids were found to be increased in humans, compared to a decrease in mice.
Figure 8. Enrichment of bile acids and amino-acid metabolites during late reperfusion (24 h). Thefunctional analysis for metabolites from the late reperfusion module was performed using the SmallMolecule Pathway Database (SMPDB) annotation system from MetaboAnalyst.
Int. J. Mol. Sci. 2022, 23, x FOR PEER REVIEW 22 of 26
Figure 9. Metabolites in primary and secondary bile acid synthesis increase during ischemia and late reperfusion. Taurochenodeoxycholate (A), taurohyocholate (B), taurohyodeoxycholic acid (C), taurolithocholate (D), and glyochenodeoxycholate (E) were induced by both ischemia and late reperfusion, whereas lithocholate (F) was only induced by late reperfusion. One-way ANOVA was run to determine significance. N = 7.
3.9. Serum Plasmalogens Increase during the Reperfusion Phase Plasmalogens are primarily synthesized by the liver and circulated to the periphery
in the blood as a component of lipoproteins. Synthesis of plasmalogens involves initial steps in the peroxisome followed by completion in the endoplasmic reticulum. Phospha-tidylcholine (PC) plasmalogen species, with a choline head group, are a minor fraction of total plasmalogens but are enriched in the heart [54], while phosphatidylethanolamine (PE) plasmalogens are found throughout the body. Exogenous plasmalogens adminis-tered prior to ischemic injury are cardioprotective [55]. Here, we observed increasing se-rum PC and PE plasmalogens with increasing reperfusion time (Figure 10), likely reflect-ing increased synthesis by the liver to replace membrane plasmalogens depleted by the cardiac injury. During cardiac ischemia, it is believed that phospholipases specific for membrane plasmalogens are activated, which cleave acyl chains from plasmalogens and release lysoplasmalogens containing only one acyl-chain [56]. Indeed, lysoplasmalogens increased with reperfusion in our model (Figure 10). Depletion of plasmalogens from the plasma membrane has been shown to stimulate biosynthesis of new plasmalogens [57]; thus, increased degradation during the ischemic period due to phospholipases may trig-ger biosynthesis during reperfusion.
Figure 9. Metabolites in primary and secondary bile acid synthesis increase during ischemiaand late reperfusion. Taurochenodeoxycholate (A), taurohyocholate (B), taurohyodeoxycholic acid(C), taurolithocholate (D), and glyochenodeoxycholate (E) were induced by both ischemia and latereperfusion, whereas lithocholate (F) was only induced by late reperfusion. One-way ANOVA wasrun to determine significance. N = 7.

Int. J. Mol. Sci. 2022, 23, 6711 20 of 24
Table 4. List of fold change of metabolites in bile acid metabolism during ischemia and reperfu-sion phases.
Biochemical Name 45 min 4 h 24 hPrimary bile acid
metabolismGlycochenodeoxycholate 6.46 0.61 13.60Taurochenodeoxycholate 8.39 0.52 21.49
Secondary bileacid metabolism
Deoxycholate 0.77 0.74 1.556-beta-Hydroxylithocholate 0.48 0.29 11.03
Lithocholate 1.00 1.00 12.05Glycolithocholate 2.63 0.74 11.33
Glycolithocholate sulfate * 1.19 0.91 4.68Taurolithocholate 1.99 0.86 7.456-Oxolithocholate 0.36 0.22 7.41
Hyocholate 1.06 0.46 7.09Glycohyocholate 4.17 0.24 7.80
Taurohyocholate * 10.22 0.49 20.89Hyodeoxycholate 0.76 0.57 20.39
Taurohyodeoxycholic acid 4.47 0.33 26.68glycohyodeoxycholate 3.08 0.34 12.54
Dark green denotes a decrease from baseline, while red denotes an increase from baseline (p < 0.05), *-indicates acompound that has not been confirmed based on a standard, but Metabolon is confident in its identity.
The effects of bile acids on the cardiac function are based on the hydrophilicity of thebile acid, with hydrophobic bile acids being more cardiotoxic. LCA is the most hydrophobicbile acid; hence, only a small amount of LCA is usually reabsorbed back into the enterohep-atic circulation. However, in our porcine I–R model, the levels of LCA increased 12-foldduring late reperfusion compared to early reperfusion (Table 4). The least toxic bile acid isUDCA. UDCA, synthesized by dehydroxylation of the free bile acid CDCA, is the mosthydrophilic bile acid and has been shown in many studies to be cardioprotective. In rodentmodels of I–R, UDCA was shown to improve contractile function during reperfusion,inhibit the opening of the mitochondria permeability transition pore (MPTP) and Bcl-2 viathe PI3K/Akt pathway, and improve endothelium- and NO-independent vasodilatation,maintaining the arterial flow in patients with heart failure. Unfortunately, our metabolicanalytes profile did not include UDCA. The alterations in bile acids are similar to whathas been observed in humans following cardiac arrest and resuscitation [53]. The taurineconjugates of bile acids were found to be increased in humans, compared to a decreasein mice.
3.9. Serum Plasmalogens Increase during the Reperfusion Phase
Plasmalogens are primarily synthesized by the liver and circulated to the periphery inthe blood as a component of lipoproteins. Synthesis of plasmalogens involves initial stepsin the peroxisome followed by completion in the endoplasmic reticulum. Phosphatidyl-choline (PC) plasmalogen species, with a choline head group, are a minor fraction of totalplasmalogens but are enriched in the heart [54], while phosphatidylethanolamine (PE)plasmalogens are found throughout the body. Exogenous plasmalogens administeredprior to ischemic injury are cardioprotective [55]. Here, we observed increasing serumPC and PE plasmalogens with increasing reperfusion time (Figure 10), likely reflectingincreased synthesis by the liver to replace membrane plasmalogens depleted by the cardiacinjury. During cardiac ischemia, it is believed that phospholipases specific for membraneplasmalogens are activated, which cleave acyl chains from plasmalogens and release lyso-plasmalogens containing only one acyl-chain [56]. Indeed, lysoplasmalogens increased withreperfusion in our model (Figure 10). Depletion of plasmalogens from the plasma mem-brane has been shown to stimulate biosynthesis of new plasmalogens [57]; thus, increaseddegradation during the ischemic period due to phospholipases may trigger biosynthesisduring reperfusion.

Int. J. Mol. Sci. 2022, 23, 6711 21 of 24Int. J. Mol. Sci. 2022, 23, x FOR PEER REVIEW 23 of 26
Figure 10. Serum plasmalogens increase during the reperfusion phase. Plasmalogen species were grouped by class and combined. Phosphatidylcholine (PC) plasmalogens (A), phosphatidylethano-lamine (PE) plasmalogens (B), and lysoplasmalogen (C) were all increased with reperfusion. One-way ANOVA was run to determine significance. N = 7.
4. Strengths and Limitations This study had several unique strengths and some limitations. Studies were per-
formed in pigs that were young, healthy, and without comorbidities; therefore, the meta-bolic profile was a clear reflection of the phases of I–R. The metabolites offered unique insights into the pathophysiological changes in the various phases and helped segregate the various phases: ischemia, early reperfusion, and late reperfusion. Changes in the me-tabolites during ischemia reflected the ischemic phase only, while analysis in other phases included the changes seen in ischemia along with early and late reperfusion. Nevertheless, we found interesting metabolic shifts in each of the reperfusion phases. The metabolomic analysis conducted in serum offered the advantage of being more practical and translata-ble. While these were some of the strengths, there were also some limitations. The serum metabolites reflected not only the changes from cardiac tissue but also those changes re-lated to poor perfusion. Future studies should compare the changes in serum metabolom-ics to changes in cardiac tissue metabolomics. No gender differences were analyzed in the present study. Furthermore, since the pigs were otherwise healthy, the effects of various comorbidities that exist in patients who experience MI and, therefore, could affect serum metabolites were not studied. A much larger sample size will be needed to assess changes with various phases in humans as those who experience MI have multiple comorbidities that could affect the metabolic profile. Studies in humans have focused on serum levels of key metabolites that could provide prognostic information. While these are important, changes in metabolite profiles during I–R are dependent on the baseline status of these key metabolites.
In conclusion, metabolomics in young, healthy pigs with no comorbidities offered a unique insight into the changes in serum metabolites during the different phases. These findings need to be leveraged in the future toward the identification of biomarkers and prognostic markers that can be translated to clinical practice.
Supplementary Materials: The following supporting information can be downloaded at: www.mdpi.com/xxx/s1.
Author Contributions: Conceptualization, E.G., Z.G., and R.M.; data curation, T.G.; formal analysis, E.G., D.R., I.M., and R.M.; funding acquisition, D.L. and R.M.; investigation, Z.G., D.R., T.G., and D.L.; methodology, E.G., Z.G., and T.G.; resources, D.L. and R.M.; software, D.R. and I.M.; valida-tion, I.M.; visualization, D.R.; writing—original draft, E.G., Z.G., and R.M.; writing—review and editing, E.G., Z.G., D.R., I.M., T.G., D.L., and R.M. All authors have read and agreed to the published version of the manuscript.
Funding: This research was funded by NIH grants HL137711 (R.M.), AG069399 (R.M.), and DK090242 (E.G.), as well as by the UPMC Children’s Hospital of Pittsburgh.
Figure 10. Serum plasmalogens increase during the reperfusion phase. Plasmalogen specieswere grouped by class and combined. Phosphatidylcholine (PC) plasmalogens (A), phos-phatidylethanolamine (PE) plasmalogens (B), and lysoplasmalogen (C) were all increased withreperfusion. One-way ANOVA was run to determine significance. N = 7.
4. Strengths and Limitations
This study had several unique strengths and some limitations. Studies were performedin pigs that were young, healthy, and without comorbidities; therefore, the metabolic profilewas a clear reflection of the phases of I–R. The metabolites offered unique insights intothe pathophysiological changes in the various phases and helped segregate the variousphases: ischemia, early reperfusion, and late reperfusion. Changes in the metabolitesduring ischemia reflected the ischemic phase only, while analysis in other phases includedthe changes seen in ischemia along with early and late reperfusion. Nevertheless, we foundinteresting metabolic shifts in each of the reperfusion phases. The metabolomic analysisconducted in serum offered the advantage of being more practical and translatable. Whilethese were some of the strengths, there were also some limitations. The serum metabolitesreflected not only the changes from cardiac tissue but also those changes related to poorperfusion. Future studies should compare the changes in serum metabolomics to changesin cardiac tissue metabolomics. No gender differences were analyzed in the present study.Furthermore, since the pigs were otherwise healthy, the effects of various comorbidities thatexist in patients who experience MI and, therefore, could affect serum metabolites were notstudied. A much larger sample size will be needed to assess changes with various phasesin humans as those who experience MI have multiple comorbidities that could affect themetabolic profile. Studies in humans have focused on serum levels of key metabolites thatcould provide prognostic information. While these are important, changes in metaboliteprofiles during I–R are dependent on the baseline status of these key metabolites.
In conclusion, metabolomics in young, healthy pigs with no comorbidities offered aunique insight into the changes in serum metabolites during the different phases. Thesefindings need to be leveraged in the future toward the identification of biomarkers andprognostic markers that can be translated to clinical practice.
Supplementary Materials: The following supporting information can be downloaded at: https://www.mdpi.com/article/10.3390/ijms23126711/s1.
Author Contributions: Conceptualization, E.G., Z.G., and R.M.; data curation, T.G.; formal analysis,E.G., D.R., I.M. and R.M.; funding acquisition, D.L. and R.M.; investigation, Z.G., D.R., T.G. and D.L.;methodology, E.G., Z.G. and T.G.; resources, D.L. and R.M.; software, D.R. and I.M.; validation, I.M.;visualization, D.R.; writing—original draft, E.G., Z.G. and R.M.; writing—review and editing, E.G.,Z.G., D.R., I.M., T.G., D.L. and R.M. All authors have read and agreed to the published version ofthe manuscript.
Funding: This research was funded by NIH grants HL137711 (R.M.), AG069399 (R.M.), and DK090242(E.G.), as well as by the UPMC Children’s Hospital of Pittsburgh.
Int. J. Mol. Sci. 2022, 23, 6711 22 of 24
Institutional Review Board Statement: The animal studies were approved by the InstitutionalAnimal Care and Use Committee at the Cardiovascular Center for Excellence, Louisiana StateUniversity (IACUC # 3302).
Informed Consent Statement: Not applicable.
Data Availability Statement: Original data appears in Table S1 of the Supplement.
Conflicts of Interest: The authors declare no conflict of interest.
References1. Benjamin, E.J.; Muntner, P.; Alonso, A.; Bittencourt, M.S.; Callaway, C.W.; Carson, A.P.; Chamberlain, A.M.; Chang, A.R.; Cheng,
S.; Das, S.R.; et al. Heart Disease and Stroke Statistics-2019 Update: A Report From the American Heart Association. Circulation2019, 139, e56–e528. [CrossRef] [PubMed]
2. Law, M.R.; Watt, H.C.; Wald, N.J. The Underlying Risk of Death After Myocardial Infarction in the Absence of Treatment. Arch.Intern. Med. 2002, 162, 2405–2410. [CrossRef] [PubMed]
3. Aghajanian, H.; Kimura, T.; Rurik, J.G.; Hancock, A.S.; Leibowitz, M.S.; Li, L.; Scholler, J.; Monslow, J.; Lo, A.; Han, W.; et al.Targeting cardiac fibrosis with engineered T cells. Nature 2019, 573, 430–433. [CrossRef] [PubMed]
4. Kochar, A.; Chen, A.Y.; Sharma, P.P.; Pagidipati, N.J.; Fonarow, G.C.; Cowper, P.A.; Roe, M.T.; Peterson, E.D.; Wang, T.Y. Long-TermMortality of Older Patients with Acute Myocardial Infarction Treated in US Clinical Practice. J. Am. Heart Assoc. 2018, 7, e007230.[CrossRef]
5. Jaswal, J.S.; Keung, W.; Wang, W.; Ussher, J.R.; Lopaschuk, G.D. Targeting fatty acid and carbohydrate oxidation—A noveltherapeutic intervention in the ischemic and failing heart. Biochim. Biophys. Acta 2011, 1813, 1333–1350. [CrossRef]
6. Dambrova, M.; Zuurbier, C.J.; Borutaite, V.; Liepinsh, E.; Makrecka-Kuka, M. Energy substrate metabolism and mitochondrialoxidative stress in cardiac ischemia/reperfusion injury. Free Radic. Biol. Med. 2021, 165, 24–37. [CrossRef]
7. Lopaschuk, G.D.; Stanley, W.C. Glucose Metabolism in the Ischemic Heart. Circulation 1997, 95, 313–315. [CrossRef]8. Abel, E.D. Glucose transport in the heart. Front. Biosci. 2004, 9, 201–215. [CrossRef]9. Vik-Mo, H.; Mjøs, O.D.; Neely, J.R.; Maroko, P.R.; Ribeiro, L.G. Limitation of myocardial infarct size by metabolic interventions
that reduce accumulation of fatty acid metabolites in ischemic myocardium. Am. Heart J. 1986, 111, 1048–1054. [CrossRef]10. Pell, V.R.; Chouchani, E.T.; Frezza, C.; Murphy, M.P.; Krieg, T. Succinate metabolism: A new therapeutic target for myocardial
reperfusion injury. Cardiovasc. Res. 2016, 111, 134–141. [CrossRef]11. Mehta, S.R.; Yusuf, S.; Diaz, R.; Zhu, J.; Pais, P.; Xavier, D.; Paolasso, E.; Ahmed, R.; Xie, C.; Kazmi, K.; et al. Effect of glucose-
insulin-potassium infusion on mortality in patients with acute ST-segment elevation myocardial infarction: The CREATE-ECLArandomized controlled trial. JAMA 2005, 293, 437–446. [PubMed]
12. Klein, L.J.; van Campen, C.M.C.; Kamp, O.; Visser, F. Effects of high-dose insulin infusion on left ventricular function in normalsubjects. Neth. Heart J. 2010, 18, 183–189. [CrossRef] [PubMed]
13. Ussher, J.R.; Wang, W.; Gandhi, M.; Keung, W.; Samokhvalov, V.; Oka, T.; Wagg, C.S.; Jaswal, J.S.; Harris, R.A.;Clanachan, A.S.; et al. Stimulation of glucose oxidation protects against acute myocardial infarction and reperfusion in-jury. Cardiovasc. Res. 2012, 94, 359–369. [CrossRef] [PubMed]
14. Lionetti, V.; Stanley, W.C.; Recchia, F.A. Modulating fatty acid oxidation in heart failure. Cardiovasc. Res. 2011, 90, 202–209.[CrossRef] [PubMed]
15. Walters, A.M.; Porter, G.; Brookes, P.S. Mitochondria as a Drug Target in Ischemic Heart Disease and Cardiomyopathy. Circ. Res.2012, 111, 1222–1236. [CrossRef]
16. Bersin, R.M.; Wolfe, C.; Kwasman, M.; Lau, D.; Klinski, C.; Tanaka, K.; Khorrami, P.; Henderson, G.N.; de Marco, T.; Chatterjee, K.Improved hemodynamic function and mechanical efficiency in congestive heart failure with sodium dichloroacetate. J. Am. Coll.Cardiol. 1994, 23, 1617–1624. [CrossRef]
17. Korvald, C.; Elvenes, O.P.; Myrmel, T. Myocardial substrate metabolism influences left ventricular energetics in vivo. Am. J.Physiol. Circ. Physiol. 2000, 278, H1345–H1351. [CrossRef]
18. Chandler, M.P.; Stanley, W.C.; Morita, H.; Suzuki, G.; Roth, B.A.; Blackburn, B.; Wolff, A.; Sabbah, H.N. Short-Term Treatmentwith Ranolazine Improves Mechanical Efficiency in Dogs with Chronic Heart Failure. Circ. Res. 2002, 91, 278–280. [CrossRef]
19. Zacharowski, K.; Blackburn, B.; Thiemermann, C. Ranolazine, a partial fatty acid oxidation inhibitor, reduces myocardial infarctsize and cardiac troponin T release in the rat. Eur. J. Pharmacol. 2001, 418, 105–110. [CrossRef]
20. Sesti, C.; Simkhovich, B.Z.; Kalvinsh, I.; Kloner, R.A. Mildronate, a novel fatty acid oxidation inhibitor and antianginal agent,reduces myocardial infarct size without affecting hemodynamics. J. Cardiovasc. Pharmacol. 2006, 47, 493–499. [CrossRef]
21. Aksentijevic, D.; McAndrew, D.J.; Karlstädt, A.; Zervou, S.; Sebag-Montefiore, L.; Cross, R.; Douglas, G.; Regitz-Zagrosek, V.;Lopaschuk, G.D.; Neubauer, S.; et al. Cardiac dysfunction and peri-weaning mortality in malonyl-coenzyme A decarboxylase(MCD) knockout mice as a consequence of restricting substrate plasticity. J. Mol. Cell. Cardiol. 2014, 75, 76–87. [CrossRef][PubMed]
22. Kantor, P.F.; Dyck, J.R.; Lopaschuk, G.D. Fatty acid oxidation in the reperfused ischemic heart. Am. J. Med. Sci. 1999, 318, 3–14.[CrossRef]

Int. J. Mol. Sci. 2022, 23, 6711 23 of 24
23. Kuznetsov, A.V.; Javadov, S.; Margreiter, R.; Grimm, M.; Hagenbuchner, J.; Ausserlechner, M.J. The Role of Mitochondria in theMechanisms of Cardiac Ischemia-Reperfusion Injury. Antioxidants 2019, 8, 454. [CrossRef] [PubMed]
24. Sharp, T.E., 3rd; Polhemus, D.J.; Li, Z.; Spaletra, P.; Jenkins, J.S.; Reilly, J.P.; White, C.J.; Kapusta, D.R.; Lefer, D.J.; Goodchild, T.T.Renal Denervation Prevents Heart Failure Progression Via Inhibition of the Renin-Angiotensin System. J. Am. Coll. Cardiol. 2018,72, 2609–2621. [CrossRef]
25. Jones, S.P.; Tang, X.L.; Guo, Y.; Steenbergen, C.; Lefer, D.J.; Kukreja, R.C.; Kong, M.; Li, Q.; Bhushan, S.; Zhu, X.; et al. TheNHLBI-sponsored Consortium for preclinicAl assESsment of cARdioprotective therapies (CAESAR): A new paradigm forrigorous, accurate, and reproducible evaluation of putative infarct-sparing interventions in mice, rabbits, and pigs. Circ. Res.2015, 116, 572–586. [CrossRef] [PubMed]
26. Sharp, T.E., 3rd; Gong, Z.; Scarborough, A.; Goetzman, E.S.; Ali, M.J.; Spaletra, P.; Lefer, D.J.; Muzumdar, R.H.; Goodchild, T.T.Efficacy of a Novel Mitochondrial-Derived Peptide in a Porcine Model of Myocardial Ischemia/Reperfusion Injury. JACC BasicTransl. Sci. 2020, 5, 699–714. [CrossRef]
27. Evans, A.M.; Bridgewater, B.R.; Liu, Q.; Mitchell, M.W.; Robinson, R.J.; Dai, H.; Stewart, S.J.; DeHaven, C.D.; Miller, L.A.D. HighResolution Mass Spectrometry Improves Data Quantity and Quality as Compared to Unit Mass Resolution Mass Spectrometry inHigh-Throughput Profiling Metabolomics. Metabolomics 2014, 4, 32.
28. Rohart, F.; Gautier, B.; Singh, A.; Lê Cao, K.-A. mixOmics: An R package for ‘omics feature selection and multiple data integration.PLoS Comput. Biol. 2017, 13, e1005752. [CrossRef]
29. Langfelder, P.; Horvath, S. WGCNA: An R package for weighted correlation network analysis. BMC Bioinform. 2008, 9, 559.[CrossRef]
30. Pang, Z.; Chong, J.; Zhou, G.; de Lima Morais, D.A.; Chang, L.; Barrette, M.; Gauthier, C.; Jacques, P.-É.; Li, S.; Xia, J. MetaboAnalyst5.0: Narrowing the gap between raw spectra and functional insights. Nucleic Acids Res. 2021, 49, W388–W396. [CrossRef]
31. Kemp, R.G.; Fox, R.W.; Latshaw, S.P. Amino acid sequence at the citrate allosteric site of rabbit muscle phosphofructokinase.Biochemistry 1987, 26, 3443–3446. [CrossRef] [PubMed]
32. Li, Y.; Xiong, Z.; Yan, W.; Gao, E.; Cheng, H.; Wu, G.; Liu, Y.; Zhang, L.; Li, C.; Wang, S.; et al. Branched chain amino acidsexacerbate myocardial ischemia/reperfusion vulnerability via enhancing GCN2/ATF6/PPAR-alpha pathway-dependent fattyacid oxidation. Theranostics 2020, 10, 5623–5640. [CrossRef] [PubMed]
33. Uddin, G.M.; Zhang, L.; Shah, S.; Fukushima, A.; Wagg, C.S.; Gopal, K.; Al Batran, R.; Pherwani, S.; Ho, K.L.; Boisvenue, J.; et al.Impaired branched chain amino acid oxidation contributes to cardiac insulin resistance in heart failure. Cardiovasc. Diabetol. 2019,18, 1–12. [CrossRef] [PubMed]
34. Ferdinandusse, S.; Denis, S.; Van Roermund, C.W.; Wanders, R.J.; Dacremont, G. Identification of the peroxisomal beta-oxidationenzymes involved in the degradation of long-chain dicarboxylic acids. J. Lipid Res. 2004, 45, 1104–1111. [CrossRef] [PubMed]
35. Zhang, X.; Gao, T.; Deng, S.; Shang, L.; Chen, X.; Chen, K.; Li, P.; Cui, X.; Zeng, J. Fasting induces hepatic lipid accumulation bystimulating peroxisomal dicarboxylic acid oxidation. J. Biol. Chem. 2021, 296, 100622. [CrossRef] [PubMed]
36. Tan, S.T.; Ramesh, T.; Toh, X.R.; Nguyen, L.N. Emerging roles of lysophospholipids in health and disease. Prog. Lipid Res. 2020,80, 101068. [CrossRef]
37. Desnoyers, M.; Gilbert, K.; Rousseau, G. Cardioprotective Effects of Omega-3 Polyunsaturated Fatty Acids: Dichotomy betweenExperimental and Clinical Studies. Mar. Drugs 2018, 16, 234. [CrossRef]
38. Linster, E.; Stephan, I.; Bienvenut, W.V.; Maple-Grødem, J.; Myklebust, L.M.; Huber, M.; Reichelt, M.; Sticht, C.; Møller, S.G.;Meinnel, T.; et al. Downregulation of N-terminal acetylation triggers ABA-mediated drought responses in Arabidopsis. Nat.Commun. 2015, 6, 7640. [CrossRef]
39. Ree, R.; Varland, S.; Arnesen, T. Spotlight on protein N-terminal acetylation. Exp. Mol. Med. 2018, 50, 1–13. [CrossRef]40. Herr, D.J.; Singh, T.; Dhammu, T.; Menick, D.R. Regulation of metabolism by mitochondrial enzyme acetylation in cardiac
ischemia-reperfusion injury. Biochim. Biophys. Acta (BBA)—Mol. Basis Dis. 2020, 1866, 165728. [CrossRef]41. Wei, C.; Wang, Y.; Li, M.; Li, H.; Lu, X.; Shao, H.; Xu, C. Spermine inhibits Endoplasmic Reticulum Stress—Induced Apoptosis: A
New Strategy to Prevent Cardiomyocyte Apoptosis. Cell. Physiol. Biochem. 2016, 38, 531–544. [CrossRef] [PubMed]42. Duan, Q.; Yang, W.; Jiang, D.; Tao, K.; Dong, A.; Cheng, H. Spermine ameliorates ischemia/reperfusion injury in cardiomyocytes
via regulation of autophagy. Am. J. Transl. Res. 2016, 8, 3976–3985. [PubMed]43. Tantini, B.; Fiumana, E.; Cetrullo, S.; Pignatti, C.; Bonavita, F.; Shantz, L.M.; Giordano, E.; Muscari, C.; Flamigni, F.;
Guarnieri, C.; et al. Involvement of polyamines in apoptosis of cardiac myoblasts in a model of simulated ischemia. J. Mol. Cell.Cardiol. 2006, 40, 775–782. [CrossRef] [PubMed]
44. Nayak, A.; Liu, C.; Mehta, A.; Ko, Y.; Tahhan, A.S.; Dhindsa, D.S.; Uppal, K.; Jones, D.P.; Butler, J.; Morris, A.A.; et al. N8-Acetylspermidine: A Polyamine Biomarker in Ischemic Cardiomyopathy with Reduced Ejection Fraction. J. Am. Heart Assoc.2020, 9, e016055. [CrossRef]
45. Miyamae, M.; Domae, N.; Zhou, H.-Z.; Sugioka, S.; Diamond, I.; Figueredo, V.M. Phospholipase C activation is required forcardioprotection by ethanol consumption. Exp. Clin. Cardiol. 2003, 8, 184–188.
46. Kong, L.; Andrassy, M.; Chang, J.S.; Huang, C.; Asai, T.; Szabolcs, M.J.; Homma, S.; Liu, R.; Zou, Y.S.; Leitges, M.; et al. PKCbetamodulates ischemia-reperfusion injury in the heart. American journal of physiology. Heart Circ. Physiol. 2008, 294, H1862–H1870.[CrossRef]

Int. J. Mol. Sci. 2022, 23, 6711 24 of 24
47. Boni, L.T.; Rando, R.R. The nature of protein kinase C activation by physically defined phospholipid vesicles and diacylglycerols.J. Biol. Chem. 1985, 260, 10819–10825. [CrossRef]
48. Ekser, B.; Gridelli, B.; Cooper, D.K. Porcine alanine transaminase after liver allo-and xenotransplantation. Xenotransplantation2012, 19, 52–55. [CrossRef]
49. Nguyen, C.C.; Duboc, D.; Rainteau, D.; Sokol, H.; Humbert, L.; Seksik, P.; Bellino, A.; Abdoul, H.; Bouazza, N.; Treluyer, J.-M.; et al.Circulating bile acids concentration is predictive of coronary artery disease in human. Sci. Rep. 2021, 11, 1–10. [CrossRef]
50. Feng, X.; Zhai, G.; Yang, J.; Liu, Y.; Zhou, Y.; Guo, Q. Myocardial Infarction and Coronary Artery Disease in Menopausal Womenwith Type 2 Diabetes Mellitus Negatively Correlate with Total Serum Bile Acids. Front. Endocrinol. 2021, 12, 754006. [CrossRef]
51. Huang, L.; Xu, G.; Zhang, R.; Wang, Y.; Ji, J.; Long, F.; Sun, Y. Increased admission serum total bile acids can be associated withdecreased 3-month mortality in patients with acute ischemic stroke. Lipids Health Dis. 2022, 21, 1–9. [CrossRef] [PubMed]
52. Zhang, B.-C.; Chen, J.-H.; Xiang, C.-H.; Su, M.-Y.; Zhang, X.-S.; Ma, Y.-F. Increased serum bile acid level is associated withhigh-risk coronary artery plaques in an asymptomatic population detected by coronary computed tomography angiography. J.Thorac. Dis. 2019, 11, 5063–5070. [CrossRef] [PubMed]
53. Shoaib, M.; Choudhary, R.C.; Choi, J.; Kim, N.; Hayashida, K.; Yagi, T.; Yin, T.; Nishikimi, M.; Stevens, J.F.; Becker, L.B.; et al.Plasma metabolomics supports the use of long-duration cardiac arrest rodent model to study human disease by demonstratingsimilar metabolic alterations. Sci. Rep. 2020, 10, 1–14. [CrossRef] [PubMed]
54. Bozelli, J.C.J.; Azher, S.; Epand, R.M. Plasmalogens and Chronic Inflammatory Diseases. Front. Physiol. 2021, 12. [CrossRef]55. Maulik, N.; Tosaki, A.; Engelman, R.M.; Cordis, G.A.; Das, D.K. Myocardial Salvage by Chimyl Alcohol: Possible Role of
Peroxisomal Dysfunction in Reperfusion Injury. Ann. N. Y. Acad. Sci. 1994, 723, 380–384. [CrossRef]56. Davies, N.J.; Schulz, R.; Olley, P.M.; Strynadka, K.D.; Panas, D.L.; Lopaschuk, G.D. Lysoplasmenylethanolamine accumulation in
ischemic/reperfused isolated fatty acid-perfused hearts. Circ. Res. 1992, 70, 1161–1168. [CrossRef]57. Honsho, M.; Abe, Y.; Fujiki, Y. Plasmalogen biosynthesis is spatiotemporally regulated by sensing plasmalogens in the inner
leaflet of plasma membranes. Sci. Rep. 2017, 7, srep43936. [CrossRef]
Related Documents