003 1-3998/86/20 1 1-1 122$02.00/0 PEDIATRIC RESEARCH Copyright O 1986 International Pediatric Research Foundation, Inc. Vol. 20, No. 11, 1986 Printed in U.S. A. Serum Insulin-Like Growth Factors I and I1 Concentrations and Growth Hormone and Insulin Responses to Arginine Infusion in Children with Protein-Energy Malnutrition before and after Nutritional Rehabilitation ASHRAF T. SOLIMAN, ABD EL HAD1 1. HASSAN, MOHAMED K. AREF, RAYMOND L. HINTZ, RON G. ROSENFELD, AND ALAN D. ROGOL Dc~partment of pediatric^, Alexandria University School ofMdicine, Alexandria, Egypt /A. T.S., A.B.E.I.H, M.K.A.]; Stanford University School o f Medicine, Palo Alto, California 94305 [R.L.H., R.G.R.]; and University of Virginia School of Medicine and Department Q [ Pharmacology, University of Virginia School ofMedicine, Charlottesville, Virginia 22908 [A.D.R.] ABSTRACT. Serum insulin, growth hormone (GH), insu- lin-like growth factors (IGFs) I and 11, cortisol, and albu- min concentrations were measured in 15 children with kwashiorkor, 15 with marasmic-kwashiorkor, and 21 with marasmus, before and in the survivors, after nutritional rehabilitation, as well as in 10 underweight and eight normal Egyptian children. We also evaluated arginine- induced insulin and GH secretion. IGF-I concentrations were reduced in the three severely malnourished groups (0.07 2 0.03, 0.05 + 0.03, and 0.09 f 0.09 U/ml, respec- tively) but returned to normal after refeeding. IGF-I1 con- centrations were low in the kwashiorkor (175 f 79 ng/ml), marasmic-kwashiorkor (1 11 2 57 ng/ml), and marasmic children (128 2 70.9 ng/ml) and returned to normal after nutritional rehabilitation. Basal G H levels were high in the three severely malnourished groups (21.9, 28.8, and 16.6 ng/ml, respectively) and returned to normal after refeeding (8.1, 6.5, and 6.0 ng/ml, respectively). GH responses to arginine were depressed in the three malnourished groups and improved significantly in marasmic-kwashiorkor and marasmic children after nutritional rehabilitation. Insulin responses to arginine were impaired in kwashiorkor, and marasmic-kwashiorkor children and improved significantly after refeeding. IGF-I levels correlated significantly with percent of expected weight (r = 0.52, p < 0.001), percent of expected height (r = 0.42, p < 0.001), and weight/ (height)' index ( r = 0.34,~ < 0.01). IGF-I levels correlated positively with insulin levels (r = 0.421, p < 0.001) and negatively with cortisol concentrations (r = -0.400, p < 0.001). It is suggested that effective lipolysis mediated by high GH and possibly low IGF levels, is an important adaptive mechanism to assure fuel (fatty acids) supply for metabolism of brain and peripheral tissues during nutri- tional deprivation. (Pediatr Res 20: 1122-1 130, 1986) Abbreviations IGFs, insulin-like growth factors PEM, protein-energy malnutrition GH, growth hormone BMI, body mass index IGFs or somatomedins are essential anabolic hormones that direct a broad range of biological activities. Their actions are not restricted to the regulation of growth, but subserve the mainte- nance of mature cells (1). Recent data from in vivo studies support the concept that IGF-I/somatomedin-C (IGF-I) is the major anabolic hormone responsible for long-term effects on tissue growth (2). Growth failure in patients with PEM has been attributed to a deficiency in the generation of the somatomedins (3, 4). Thus, measurements of somatomedin concentration may be an accu- rate index of nitrogen balance (flux) in such patients (5). Al- though there is general agreement that serum IGF-I concentra- tions are low in patients with kwashiorkor (3, 4, 6), there is still controversy concerning the circulating IGF-I levels (or activity) in marasmic (6, 7) individuals. Somatomedin production and activities are influenced by many factors including growth hormone (GH) (8-lo), insulin (1 1 - 13), prolactin (1 4, 15), and cortisol (1 6, 17), in addition to an important effect of nutritional balance (18-21). Since nutri- tional status influences secretion of these several hormones, one should consider that the observed changes in IGF-I concentra- tions might reflect alterations in the levels of these hormones (6, 18,22). Thus, their effects upon skeletal growth may be mediated through their effects upon IGF generation. Basal G H levels in PEM have been studied extensively (6, 23- 26). There is a general agreement that despite impaired growth rates in children with kwashiorkor, GH concentrations are ele- Received March 12, 1986; accepted June 9. 1986. vated. In marasmic children the results are conflicting with Address for reprints Alan D. Rogol, M.D., Ph.D., Department of Pediatrics, of low (27), (28, 29), and high GH levels (6, 30, BOX 386, University of Virginia, Charlottesville, VA 22908. Telephone: (804) 924- 3 1). In addition, there remains disagreement regarding pituitary 5895 reserve in children with PEM. Statistically significant responses This work was supported by the following resources: USPHS General Clinical to arginine hydrochloride in patients with marasmus (z7, 30, 32) Research Center Grant RR-00847; Diabetes Research and Training Center Grant 5-P60-AM-21 125: AM 28299 and a Research Career Development Award (RR); and kwashiorkor (27, 33) have been in some, but not AM 24185 (RH); and the Egyptian Government Channel sys;ern (ATS). all, studies.

Welcome message from author
This document is posted to help you gain knowledge. Please leave a comment to let me know what you think about it! Share it to your friends and learn new things together.
Transcript

003 1-3998/86/20 1 1-1 122$02.00/0 PEDIATRIC RESEARCH Copyright O 1986 International Pediatric Research Foundation, Inc.
Vol. 20, No. 1 1, 1986 Printed in U.S. A.
Serum Insulin-Like Growth Factors I and I1 Concentrations and Growth Hormone and Insulin Responses to Arginine Infusion in Children with
Protein-Energy Malnutrition before and after Nutritional Rehabilitation
ASHRAF T . SOLIMAN, ABD EL HAD1 1. HASSAN, MOHAMED K. AREF, RAYMOND L. HINTZ, RON G. ROSENFELD, AND ALAN D. ROGOL
Dc~partment of pediatric^, Alexandria University School o fMdicine , Alexandria, Egypt /A. T.S., A.B.E.I.H, M.K.A.]; Stanford University School o f Medicine, Palo Alto, California 94305 [R.L.H., R.G.R.]; and University of
Virginia School of Medicine and Department Q[ Pharmacology, University of Virginia School ofMedicine, Charlottesville, Virginia 22908 [A.D.R.]
ABSTRACT. Serum insulin, growth hormone (GH), insu- lin-like growth factors (IGFs) I and 11, cortisol, and albu- min concentrations were measured in 15 children with kwashiorkor, 15 with marasmic-kwashiorkor, and 21 with marasmus, before and in the survivors, after nutritional rehabilitation, as well as in 10 underweight and eight normal Egyptian children. We also evaluated arginine- induced insulin and GH secretion. IGF-I concentrations were reduced in the three severely malnourished groups (0.07 2 0.03, 0.05 + 0.03, and 0.09 f 0.09 U/ml, respec- tively) but returned to normal after refeeding. IGF-I1 con- centrations were low in the kwashiorkor (175 f 79 ng/ml), marasmic-kwashiorkor (1 11 2 57 ng/ml), and marasmic children (128 2 70.9 ng/ml) and returned to normal after nutritional rehabilitation. Basal GH levels were high in the three severely malnourished groups (21.9, 28.8, and 16.6 ng/ml, respectively) and returned to normal after refeeding (8.1, 6.5, and 6.0 ng/ml, respectively). GH responses to arginine were depressed in the three malnourished groups and improved significantly in marasmic-kwashiorkor and marasmic children after nutritional rehabilitation. Insulin responses to arginine were impaired in kwashiorkor, and marasmic-kwashiorkor children and improved significantly after refeeding. IGF-I levels correlated significantly with percent of expected weight ( r = 0.52, p < 0.001), percent of expected height ( r = 0.42, p < 0.001), and weight/ (height)' index ( r = 0 . 3 4 , ~ < 0.01). IGF-I levels correlated positively with insulin levels ( r = 0.421, p < 0.001) and negatively with cortisol concentrations ( r = -0.400, p < 0.001). It is suggested that effective lipolysis mediated by high GH and possibly low IGF levels, is an important adaptive mechanism to assure fuel (fatty acids) supply for metabolism of brain and peripheral tissues during nutri- tional deprivation. (Pediatr Res 20: 1122-1 130, 1986)
Abbreviations
IGFs, insulin-like growth factors PEM, protein-energy malnutrition GH, growth hormone BMI, body mass index
IGFs or somatomedins are essential anabolic hormones that direct a broad range of biological activities. Their actions are not restricted to the regulation of growth, but subserve the mainte- nance of mature cells (1). Recent data from in vivo studies support the concept that IGF-I/somatomedin-C (IGF-I) is the major anabolic hormone responsible for long-term effects on tissue growth (2).
Growth failure in patients with PEM has been attributed to a deficiency in the generation of the somatomedins (3, 4). Thus, measurements of somatomedin concentration may be an accu- rate index of nitrogen balance (flux) in such patients (5). Al- though there is general agreement that serum IGF-I concentra- tions are low in patients with kwashiorkor (3, 4, 6), there is still controversy concerning the circulating IGF-I levels (or activity) in marasmic (6, 7) individuals.
Somatomedin production and activities are influenced by many factors including growth hormone (GH) (8-lo), insulin (1 1 - 13), prolactin (1 4, 15), and cortisol (1 6, 17), in addition to an important effect of nutritional balance (18-21). Since nutri- tional status influences secretion of these several hormones, one should consider that the observed changes in IGF-I concentra- tions might reflect alterations in the levels of these hormones (6, 18,22). Thus, their effects upon skeletal growth may be mediated through their effects upon IGF generation.
Basal G H levels in PEM have been studied extensively (6, 23- 26). There is a general agreement that despite impaired growth rates in children with kwashiorkor, G H concentrations are ele-
Received March 12, 1986; accepted June 9. 1986. vated. In marasmic children the results are conflicting with
Address for reprints Alan D. Rogol, M.D., Ph.D., Department of Pediatrics, of low (27), (28, 29), and high GH levels (6, 30, BOX 386, University of Virginia, Charlottesville, VA 22908. Telephone: (804) 924- 3 1). In addition, there remains disagreement regarding pituitary 5895 reserve in children with PEM. Statistically significant responses
This work was supported by the following resources: USPHS General Clinical to arginine hydrochloride in patients with marasmus (z7, 30, 32) Research Center Grant RR-00847; Diabetes Research and Training Center Grant 5-P60-AM-21 125: AM 28299 and a Research Career Development Award (RR); and kwashiorkor (27, 33) have been in some, but not AM 24185 (RH); and the Egyptian Government Channel sys;ern (ATS). all, studies.

IGFS, GH, AND INSULIN IN PEM 1123
Measurements of basal insulin levels in children with kwa- shiorkor have yielded inconsistent results: high (34), low (6, 35, 36), and normal (37) values have been reported. In marasmic children insulin levels have been reported to be normal (38) or low (6, 39). Moreover, there is no general consensus concerning insulin reserve in children with PEM as measured by applying various stimuli-including glucose, glucagon, and arginine hydro- chloride. Satisfactory and poor responses have been obtained both in children with marasmus (32, 40, 41) and kwashiorkor (41-43). In addition to a direct action on skeletal growth, it has also been proposed that insulin influences growth via stimulation of IGF-I synthesis and/or affecting somatotropic tissue receptors (44, 45).
To attempt to clarify these controversies, the present study was designed to determine: 1) the basal serum levels of IGF-I and IGF-11, GH, insulin, and cortisol in the different types of PEM before and after nutritional rehabilitation; 2) the responses of circulating GH and insulin to stimulation with an infusion of arginine hydrochloride before and after nutritional rehabilitation; and 3) the relationship among skrum GH, insulin, cortisol, albumin, and IGF-I and IGF-I1 concentrations in the different types of PEM.
PATIENTS AND METHODS
Sixty-one patients between the ages of 3 and 36 months with PEM were the subjects of this study. They were admitted to the Nutritional Ward of Alexandria University Children's Hospital, Alexandria, Egypt for clinical management and nutritional re- habilitation. All were examined thoroughly with special emphasis on nutritional history, weight, age, height, head and mid-arm circumferences; biceps, triceps, and subscapular skinfold thick- nesses, muscle diameters, and arm cross-sectional fat (46); and clinical signs of malnutrition including: edema, hair and skin changes, mental changes, and hepatomegaly. The children were divided into four groups: 15 patients with kwashiorkor, 15 with marasmic-kwashiorkor, 21 with marasmus, and 10 underweight for age according to the differences in body weight for age and presence or absence of edema as judged by Wellcome Trust Working Party (47). Eight age-matched normal children (height and weight within the 95% confidence limits for Egyptian chil- dren) served as controls. Informed consent for the testing pro- cedure was obtained from the parents of all children.
On the day of admission to the hospital the children were fed diets similar to those that they had consumed at home. All patients were treated with antibiotics, vitamins, and when indi- cated, intravenous fluids. After an overnight fast and prior to the initiation of protein feeding, a fasting venous blood sample was withdrawn through a polyethylene catheter inserted in a forearm vein. The serum was separated from the formed elements by centrifugation and kept frozen at -20" C until analyzed for GH (48), insulin (49), IGF-I and IGF-I1 (50, 51) by radioimmuno- assay, albumin by a bromocresyl green method, and glucose by a glucose oxidase method. Intraassay coefficients of variation averaged 8% in the range of insulin values detected and 7% in the range of GH measured. The intraassay CV for the IGF-I assay was 8% in the usual range but 16% for values less than 0.3 U/ml. Those for the IGF-I1 assay were 7% in the normal range and 15 % for values below 100 ng/ml. One unit of somatomedin C is equivalent to 180 ng. The data are presented in U/ml since this is the more common notation.
After withdrawal of the fasting sample, 10% (w/v) arginine hydrochloride (0.5 g/kg) was infused intravenously for 30 min and blood samples were obtained at 0, 30, 45, and 60 min after the end of the infusion for the determination of GH, insulin, and glucose concentrations. After 4 to 8 wk of nutritional reha- bilitation with a diet containing 100-150 kcal/kg/day and 4 g protein/kg/day (depending on the time necessary to bring them to a "normal" state) all the previous anthropometric measure- ments were repeated and the laboratory tests redone on the
available (living) children (nine of 15 from the kwashiorkor group, 10 of 15 from the marasmic-kwashiorkor group, and nine of 15 from the marasmic group as shown in Appendix Table 1).
Data are presented as means f SD. Statistical analyses were done using the paired t test before and after treatment, when normally distributed, and paired Wilcoxon test when they were not normally distributed. Unpaired t test with Bonferonni's correction was used for the comparison of the malnourished groups to the control group, when the data were normally distributed and the Wilcoxon test when they were not.
RESULTS
Anthropometric data for the malnourished and control chil- dren are presented by diagnostic category in Table l . The BMI [~eight/(height)~] increased significantly after nutritional reha- bilitation in children with kwashiorkor ( p = 0.02), marasmic- kwashiorkor ( p = 0.005), and marasmus ( p = 0.0 1).
Table 2 shows the albumin and hormonal data. Before nutri- tional rehabilitation serum albumin levels were significantly lower in the kwashiorkor (2.3 f 0.8 g/dl, mean f SD), and marasmic-kwashiorkor groups (2.3 f 0.9 g/dl) than the control group (3.1 f 0.5 g/dl; p = 0.003 and 0.006, respectively); however, the differences did not reach significance between the marasmic (3.5 f 1.2 g/dl) or the underweight (3.8 f 0.6 g/dl) groups and the control group. After refeeding, albumin levels increased significantly in those children with kwashiorkor (3.7 5 0.8 g/dl; p = 0.003) and marasmic-kwashiorkor (3.7 f 0.8 g/dl; p = 0.002).
Mean levels of serum IGF-I before refeeding were significantly decreased in the kwashiorkor [0.07 f 0.03 U/ml (U = 180 ng)], marasmic-kwashiorkor (0.05 f 0.03 U/ml), and marasmic (0.09 f 0.09 U/ml) groups when compared to the control children (0.20 f 0.10 U/ml; p = 0.009, 0.004, and 0.020, respectively). No significant differences were detected among children in any of the three malnourished groups before nutritional rehabilita- tion. After refeeding, IGF-I levels increased significantly in the three malnourished groups (0.2 1 f 0.15, 0.15 f 0.13, and 0.25 f 0.16 U/ml, respectively) ( p = 0.0 1,0.02, and 0.02, respectively) to become indistinguishable from the levels in the control chil- dren. The IGF-I levels in the underweight group (0.19 U/ml) did not differ from those for the control group. There were no significant differences in the IGF-I levels between the children who lived and those who died in the kwashiorkor ( p = 0.89), marasmic-kwashiorkor ( p = 0.75) or marasmic ( p = 0.15) groups. Statistically significantly lower basal IGF-I and IGF-I1 levels were found in the malnourished children even after the children who died were deleted from the analysis.
Before nutritional rehabilitation the levels of IGF-I1 in children with marasmic-kwashiorkor (1 1 1 f 58 ng/ml) and marasmus (128 5 7 1 ng/ml) were significantly lower than the levels for the control children (224 f 75 ng/ml; p = 0.002 and 0.008, respec- tively), but the differences were not significant between the kwashiorkor (I 75 f 75 ng/ml) or the underweight (1 65 f 62 ng/ ml) groups and the control group. After refeeding, IGF-I1 levels increased significantly in the kwashiorkor (230 f 88 ng/ml; p = 0.007), marasmic-kwashiorkor (195 f 79 ng/ml; p = 0.032), and marasmic (287 + 1 12 ng/ml; p = 0.01) groups.
The basal GH concentrations were significantly higher before treatment in the kwashiorkor (2 1.9 f 10.0 ng/ml), marasmic- kwashiorkor (28.8 f 5.9 ng/ml), and marasmic (16.6 f 5.9 ng/ ml) groups than those for the control group (5.9 f 2.3 ng/ml; p < 0.00 1, <0.00 1, and 0.003, respectively). No significant differ- ence was found between the underweight (6.5 f 5.1 ng/ml) and control groups. After refeeding, the basal GH levels decreased significantly in the kwashiorkor (8.1 f 3.7 ng/ml; p = 0.007), marasmic-kwashiorkor (6.5 f 3.0 ng/ml; p = 0.002), and maras- mic (6.0 f 5.1 ng/ml; p < 0.00 1) groups to become indistinguish- able from the levels in the control group.
1124 SOLIMAN ET AL.
Table 1. Anthropometric data for the malnourished and control children
Mid-arm % of average - % of average % of average circumference mid-arm Muscle diameter Wt/(ht)'
Age (mo) Wt (kg) wt Ht (cm) ht (cm) circumference (mm) x (10)~
Kwashiorkor* Mean 13.43 6.38 71.74 65.85 89.55 10.5 68.32 27.06 1.5 SD 8.36 1.64 6.22 8.7 6.18 1.8 10.06 4.9 0.2
Kwashiorkor? Mean 14.83 7.5 81.43 67.76 92.18 12.06 76.93 3 1 .O 1.6 SD 6.65 1.73 7.86 7.77 4.16 2.0 1 1.04 5.63 0.15 p value 0.18 0.62 0.10 0.17 0.03$
Marasmic-kwashiorkor* Mean 12.00 4.75 55.49 64.68 92.44 8.76 59.54 25.16 1.14 SD 8.64 1.43 5.22 8.7 6.94 1.74 10.1 3.74 0.14
Marasmic-kwashiorkort Mean 13.6 6.25 62.4 67.07 95.2 10.39 6 1.45 27.75 1.3 SD 6.1 1.41 2 1.28 6.13 12.17 1.64 19.99 4.3 0.2 p value ~ 0 . 0 1 0.4 1 0.04 0.06 <O.O 1 $
Marasmus* Mean 10.81 4.61 56.77 62.14 90.18 8.5 56.67 22.69 1 .O SD 8.69 1.57 5.88 8.5 4.39 1.32 8.08 5.45 0.25
Marasmust Mean 16.44 6.74 71.77 67.01 90.18 1 1.33 72.6 30.33 1.48 SD 11.22 2.08 7.23 10.41 4.35 2.02 10.27 5.47 0.18 p value 0.15 0.66 0.0 1 0.03 0.0 1 $
Underweight Mean 23.1 7.78 71.51 77.08 96.17 12.64 78.06 32.86 1.3 SD 8.88 1.35 2.5 8.05 3.5 1 1.37 7.27 3.64 0.0 1
Controls Mean 8.9 8.36 110.29 68.26 101.42 12.66 85.2 1 33.12 1.7 SD 6.5 2.5 10.09 10.61 5.79 1.98 9.53 5.97 . 0.01 p value 0.56 0.07 0.97 0.9 1 0.00 1 $
.~
* Before nutritional rehabilitation. t Aftcr nutritional rehabilitation. $ Significant.
The GH responses to arginine infusion before and after nutri- tional rehabilitation are shown in Figure 1 A and B. Before refeeding the maximal percent increase in GH concentration above the basal levels was significantly lower in the kwashiorkor (40 f 74%), marasmic-kwashiorkor (2.8 + 44%), and marasmic groups (57 + 85%) than in the control children (2 1 1 + 270%; p = 0.008, <0.001, and 0.015, respectively). After nutritional re- habilitation the responses did not differ between the marasmic- kwashiorkor (I91 f 196%) or marasmic children (95 + 100%) and the normal children, but were still significantly below normal for the children in the kwashiorkor group (26 f 4 8 % ; ~ = 0.004).
The fasting insulin levels in the marasmic-kwashiorkor (7.3 + 5.8 pU/ml) and marasmic groups (10.3 + 13.2 pU/ml) did not differ significantly from the levels of the control children (13.2 + 10.4 pU/ml) before refeeding, but they were marginally lower than normal in children with kwashiorkor (7.0 + 512 pU/ml; p = 0.035, Table 2). After nutritional rehabilitation, no significant differences in fasting insulin levels between the three severely malnourished groups (10.3 f 12.2, 18.9 f 15.4, 17.4 + 14.1 pU/ ml) and the control group were noted.
The insulin responses to arginine infusion before and after nutritional rehabilitation are shown in Figure 2 A and B. Before nutritional rehabilitation, the insulin responses to arginine infu- sion, as measured by the percent increase of the peak levels above the-basal levels, were significantly lower in the kwashiorkor (I 15
a 226%) and marasmic-kwashiorkor ( 144 + 350%) groups than in the control group (577 + 423%; p = 0.004 and 0.010, respec- tively). The insulin responses in marasmic children (292 + 301 %) were significantly higher than those for the kwashiorkor and marasmic-kwashiorkor children ( p = 0.0 18 and 0.0 1 1, respec- tively), but did not differ from the control group ( p = 0.079). After nutritional rehabilitation there were no differences between the insulin responses of the kwashiorkor (205 + 224%), or the marasmic-kwashiorkor (266 & 175%) groups and the response of the control children ( p = 0.09 and 0.08, respectively).
Before treatment there were no significant differences in the fasting glucose concentrations between any of the malnourished groups and the control group. The peak responses after arginine infusion were significantly greater than the basal levels in all the studied groups (data not shown).
In all the children before refeeding IGF-I and IGF-I1 levels correlated significantly with the percent of expected weight for age ( r = 0.52 and 0.50; p < 0.001), and the ~eight/(height)~ ratio ( r = 0.34 and 0.50; p < 0.001) (Fig. 3 A and B). IGF levels correlated significantly with the percent of height deficit (r = -0.42, p < 0.001). Insulin levels correlated significantly with IGF-I (r = 0.46, p < 0.00 l), albumin concentration ( r = 0.49, p < 0.001), and arm muscle diameter ( r = 0.28, p < 0.001).
GH levels correlated inversely with IGF-I concentrations ( r = -0.50, p < 0.00 1) and with the calculated arm cross-sectional fat

IGFS, GH, AND INSULIN IN PEM 1125
Table 2. Hormor~al data (means) for the malnourished and control children before and after nutritional rehabilitation G H Peak
(ng/ml)
29.5 + 18.0
Insulin peak (dJ /ml )
14.8 k 17.5
Cortisol (/Jg/ml)
27.1 1 c22.7
14.8* f 3.7
3 1.9$ f24.1
13.9* -1 5.6
24.81: k15.6
14.2* rt_ 4.6
11.4 + 4.9
11.1 + 7.0
Albumin (g/dl)
2.3 1 f 0 . 8
3.7* a0.79
2.3-1: k0.9
3.7* r0.76
3.5 c1.2
3.8 k0.6
3.8 C1.3
3.13 k0.50
IGF-I (U/ml)
Insulin Groups
Kwashiorkor (n = 15) 11
Kwashiorkor (n = 9)11
Marasmic-kwashiorkor (n = 15)
Marasmic-kwashiorkor (n = 10)
Marasmus (n = 2 1 )
Marasmus (n = 9)
Underweight (n = 10)
Control ( n = 8)
0.153* SO. 126
Before treatment v s after treatment * p < 0.05, t p < 0.0 I. Normal v s children with PEM $p < 0.0 I, 9p < 0.001. 11 Before nutritional rehabilitation. 11 After nutritional rehabilitation.
40
0.. .... 30 ......... Insulin ( ~ U / m l )
70r After Refeeding
.... 0
0 20 40 60 80 100 Time (mid
Fig. 1. Serum GH concentrations during and after an intravenous infusion of I.-arginine hydrochloride 0.5 g/kg from 0 to 30 min. A before Time (min) and B after nutritional rehabilitation. Fifteen children with kwashiorkor Fig. 2. Serum insulin concentrations during and after an intravenous M; 15 with marasmic-kwashiorkor 0----0; 2 1 with marasmus infusion of L-arginine hydrochloride, 0.5 g/kg from 0 to 30 min. A before A---A: 10 underweight M-*-*A: and eight control children A--- and B after nutritional rehabilitation. The symbols are the same as in A. For B the number of children are nine with kwashiorkor, 10 with Figure 1. marasmic kwashiorkor, and nine with marasmus.
tween cortisol levels and the percent height deficit ( r = 0.22, p = ( r = -0.27, p = 0.028). IGF-I levels correlated inversely with the 0.07). cortisol levels ( r = -0.40, p < 0.001), and positively with the The insulin/cortisol ratio correlated significantly with IGF-I calculated muscle diameter ( r = 0.46, p < 0.00 I) , and the arm concentrations ( r = 0.64, p < 0.00 1, Fig. 4), and with the percent cross-sectional fat ( r = 0.46, p < 0.00 1). Cortisol concentrations weight deficit ( r = 0.42, p < 0.00 1, data not shown). A significant correlated inversely with the arm muscle diameter ( r = -0.32, p positive correlation with refeeding was detected between incre- < 0.001); however, no significant correlation was detected be- ments in insulin levels and muscle diameters (r = 0.46, p = 0.0 I).
SOLIMA
. . -:*:*" 0 I
-20 0 20 40 60
We~ght Deficiency (%)
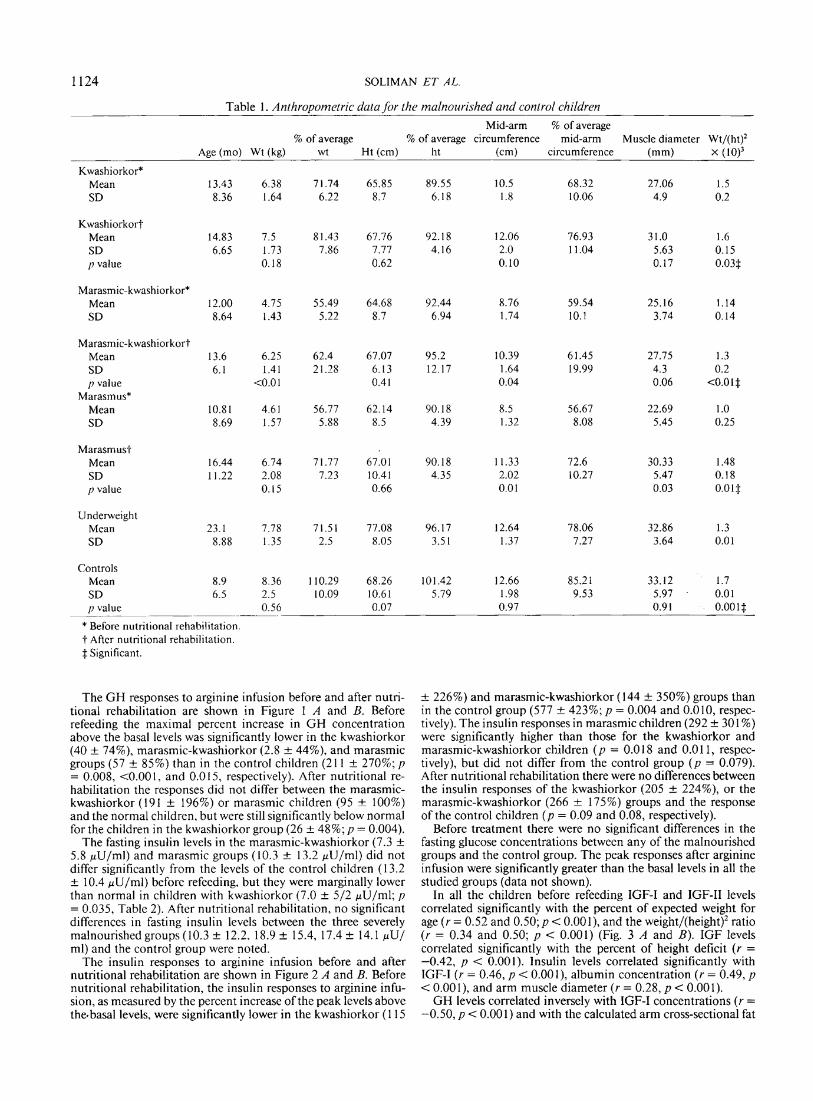
Fig. 3. Correlation of serum IGF concentrations and percent weight deficit in malnourished (e) and control children (0) before IGF-I nutri- tional rehabilitation. A, IGF-I; 1 U equals 180 ng. B, IGF-11.
(U/ml)
Fig. 4. Correlation of the insulin to cortisol ratio and IGF-I concen- tration in malnourished and control children before nutritional rehabil- itation. One U IGF-I equals 180 ng.
DISCUSSION
We have shown that circulating IGF-I levels are lower than control values in children who have any of the three types of severe PEM: kwashiorkor, marasmic-kwashiorkor, and maras- mus, and rise to normal with nutritional rehabilitation. IGF-I1 levels were also decreased compared to control children and increased significantly in the three severely malnourished groups after refeeding. IGF-I and IGF-I1 levels correlated significantly with the percent of expected weight for age and the weight/ (height)' ratio. Thus, measurement of IGF-I concentration is a more sensitive indicator of the nutritional status of children than are serum albumin levels, since the latter do not correlate with either percent of expected weight or weight/(height)* ratios in malnourished children (data not shown), and were normal in our marasmic patients. Moreover, the presence of normal serum albumin concentrations with low IGF-I levels in the marasmic group implies that the decrement in IGF-I is not a part of a generalized decrease in hepatic protein synthesis as suggested by other investigators (7, 52). The insignificant differences in the IGF-I concentrations between the children who lived and those who died in each of the severely malnourished groups suggested that reasons other than the severity of malnutrition per se were the cause of death in the decedents.
The low serum albumin levels in kwashiorkor and marasmic- kwashiorkor can be explained by the adequate energy, but pro- tein-deficient diets. Such diets have been shown in experimental animals to cause hypoalbuminemia, whereas the energy- and protein-deficient diets, similar to those consumed by the maras- mic children, did not lead to hypoalbuminemia (53).
The fasting insulin levels were normal in the marasmic and marasmic-kwashiorkor children and only marginally lower in children with kwashiorkor when compared to normal children. The biological significance of this small difference is unclear. The insulin secretory responses to arginine infusion as measured by the percent increase of the peak value above basal level were impaired in kwashiorkor and marasmic-kwashiorkor groups when compared to the control group. There was no significant difference in insulin responses between the marasmic and normal children. After refeeding, the insulin responses did not differ in kwashiorkor and marasmic-kwashiorkor children from those in the control group. The insulin responses before nutritional re- habilitation were significantly higher in marasmic children than in those in the kwashiorkor and marasmic-kwashiorkor groups. The low basal insulin levels in kwashiorkor, and the impaired insulin reserve in kwashiorkor and marasmic-kwashiorkor pa- tients can be attributed to the effect of their unbalanced high energy-low protein diet. In support of this view, in experimental animals maintained on low protein diets where the carbohydrate content is necessarily high, plasma insulin levels are consistently low (54, 55).
Insulin levels correlated significantly with IGF-I concentra- tions in all the children before refeeding (r = 0.42, p < 0.001). This may reflect a causal relationship between insulin and IGF- I secretion (13). In addition, the positive correlation between insulin and albumin concentrations in these children ( r = 0.52, p < 0.001) may reflect an important role played by insulin to support hepatic protein synthesis.
Fasting serum GH values were significantly higher in the three severely malnourished groups, with no significant differences among them, and returned to normal with nutritional rehabili- tation. These findings are in contrast to those of Mohan el al. (7) who have reported normal GH and somatomedin activity in marasmic children. The impaired release of G H after arginine stimulation in children in the three severely malnourished groups in the presence of the high basal G H levels may indicate that their pituitaries may be near maximally stimulated in the basal state. After refeeding, the response of G H to arginine infusion improved in all the malnourished groups to become indistin- guishable from that of the normal children. The significantly negative correlation between GH and IGF-I suggests an intact negative feedback effect IGF-I concentrations on the hypotha- lamic-pituitary release of GH, but the reasons why the high levels of GH do not stimulate IGF-I synthesis are not clear. However, the highly significant correlation between the IGF-I levels on the one hand and the insulin and cortisol levels on the other hand indicate that the impaired insulin secretion and the elevated cortisol levels in malnourished children in addition to the defi- cient diet, may ovemde the effect of high GH levels on IGF-I and IGF-I1 production during nutritional deprivation.
The insulin/cortisol ratio correlated well with the IGF-I con- centration as well as with the percent of expected weight, sug- gesting that insulin and cortisol may exert their actions on nitrogen balance, at least partially, through their effect on IGF-I synthesis.
The significant positive correlation between IGF-I levels and the calculated arm cross-sectional fat as well as the negative correlation between G H and cross-sectional fat are in agreement with the hypothesis that high GH levels in the presence of low somatomedin concentrations is an important adaptive mechan- ism to provide the organism with fuel (fatty acids), through lipolysis, during nutritional deprivation (56).
IGF-I, cortisol (negatively), and insulin levels correlated sig- nificantly with the calculated arm muscle diameter in all the

IGFS, GH, AND INSULIN IN PEM 1127
children before refeeding. In addition, there is a significant correlation between the increments in insulin levels and muscle diameters with refeeding. These findings suggest that the in- creased catabolic action mediated by the high cortisol levels in addition to the low anabolic activities due to low IGF and insulin levels during nutritional deprivation allow proper breakdown of muscle protein necessary to provide the liver with the amino acids for gluconeogenesis and protein synthesis.
Although physiologically high levels of circulating cortisol have been shown to inhibit the stimulatory action of IGF-I on epiphy- seal cartilage (56-58), we have found a significant negative correlation between IGF-I levels and the percent height deficit, but no significant correlation has been detected between cortisol levels and the percent height deficit. This finding may indicate a more important role of low IGF-I levels than of excessive cortisol levels on the impairment of growth of epiphyseal cartilage during periods of malnutrition.
In summary, various alterations in hormonal levels and their responsiveness to secretagogues act to defend the body against PEM. The elevated GH levels stimulate lipolysis, whereas the low IGF-I concentrations and impaired insulin secretion inhibit lipogenesis. Both processes assure fuel supply (fatty acids) to the brain and peripheral tissues through effective breakdown of adipose tissue. Moreover, the increased muscle protein catabo- lism mediated by elevated basal cortisol levels and depressed anabolic activity due to the selective decrease in somatomedin levels assure an adequate supply of amino acids to the liver. This metabolic intermediate allows gluconeogenesis and protein syn- thesis to proceed and guards against the development of hypo- glycemia and hypoalbuminemia in children with PEM. Thus, there is coordinated regulation of metabolism in PEM to defend the organism against hypoglycemia and to provide alternate substrates to subserve the essential energy and biosynthetic re- quirements.
Acknowledgments. The authors thank the nurses and house- staff in the nutritional ward of the Alexandria University Chil- dren's Hospital for superb care of these severely ill patients. Dr. John Savory and Ms. Susan Lee of the Division of Clinical Chemistry performed the serum albumin determinations. Re- becca Weaver and E. Elizabeth Taylor carried out the cortisol assays. We thank Ms. Muffy McLeod and Dr. Arthur Freedlender of the Radioimmunoassay Laboratory of the Diabetes Research and Training Center for the insulin assay. Mr. David Boyd and Dr. Donald Kaiser are acknowledged for their contribution to the statistical analysis of the data . -~rs . Leslie Powell skillfully prepared the manuscript. Data handling and analysis were made possible in part using CLINFO hardware and software, at the Clinical Research Center Laboratories at The University of Vir- ginia.
REFERENCES
I . Hall K, Sara VR 1983 Growth and somatomedins. Vitamin Hormone 40: 175- 233
2. Zapf J, Schoenle E. Froesch ER 1985 In-vivo effects of insulin-like growth factors I and 11. In: Somatomedins and Other Peptide Growth Factors: Relevance to Pediatrics. Report of Eighty-ninth Ross Conferenceon Pediatric Research. Ross Laboratories. Columbus. OH, pp 47-53
3. Grant DB. Hambley JB. Becker D. Pimstone BL 1975 Reduced sulphation factor in undernourished children. Arch Dis Child 48596
4. Hintz RL. Suskind R, Amatayakul K 1978 Plasma somatomedin and growth hormone values in children with protein caloric malnutrition. J Pediatr 92: 153
5. Clemmons DR, Underwood LE, Dickerson RN 1985 Use of plasma somato- medin-C/insulin like growth factor I measurements to monitor the response to nutritional repletion in malnourished patients. Am J Clin Nutr 41:191- 198
6. Smith IF. Latham MC, Azubuike JA, Butler WR, Phillips LS, Pond WG. Enwonwe CO 198 1 Blood plasma levels of cortisol, insulin, growth hormone and somatomedin in children with marasmus. kwashiorkor. and intermedi- ate forms of protein energy malnutrition. Proc Soc Exp Biol Med 167:607- 61 1
7. Mohan PS. Kamala S. Rao J 1979 Plasma somatomedin activity in protein calorie malnutrition. Arch Dis Child 54:62-64
8. Hall K 1971 Effect of intravenous administration of human growth hormone on sulfation factor activity in serum of hypopituitary subjects. Acta Endo- crinol (Copenh) 66:49 1-497
9. Copeland KC, Underwood LE, Van Wyk JJ 1980 Induction of immunoreactive somatomedin-C in human serum by growth hormone. J Clin Endocrinol Metab 50:690-697
10. Daughaday WH, Laron Z, Pertzelan A, Heins JN 1969 Defective sulfation factor generation: a possible etiological link in dwarfism. Trans Assoc Am Phys 82:129-138
I I . Green OC, Winter RJ, Traisman HS, Phillips LS 1978 Somatomedin deficiency in the Mauriac Syndrome. Diabetes 27 (suppl 2): 193
12. Phillips LS, Young HS 1977 Nutrition and somatomedin I1 serum somato- medin activity and cartilage growth activity in streptozotocin-diabetic rats. Diabetes 26:864-869.
13. Eigenmann JE, Becker M, Kammermann B 1977 Decrease of non-suppressible insulin-like activity after pancreatectomy and normalization by insulin ther- apy. Acta Endocrinol (Copenh) 85:8 18-822.
14. Francis MJC, Hill DJ 1975 Prolactin stimulation production of somatomedin by rat liver. Nature 255:167-168.
15. Bala RM, Bohnet HG, Carter JN, Friesen HG 1976 Effects of prolactin on serum somatomedin activity in hypophysectomized rats. Clin Rcs 24:655(abstr)
16. Elders MJ, Wingfield BS, McNatt ML, Clarke JS 1975 Glucocorticoid therapy in children: effect on somatomedin secretion. Am J Dis Child 129:1393- 1396
17. Phillips LS, Vassilopoulou SR 1980 Somatomedins (second of two parts). N Engl J Med 302:438-446
18. Isley WL, Underwood LE, Clemmons DR 1983 Dietary components that regulate serum somatomedin-C concentrations in humans. J Clin Invest 71:175-182
19. Phillips LS, Young HS 1976 Nutrition and somatomedin I: effect of fasting and refeeding on serum somatomedin activity and cartilage growth activity in rats. Endocrinology 99:304-314.
20. Unterman TG, Vasquez RM, Slas AJ, Martyn PA, Phillips LS 1985 Nutrition and somatomedin XIII. Usefulness of somatomedin C in nutritional assess- ment. Am J Med 78:228-234
21. Isley WL, Underwood LE, Clemmons DR 1983 Dietary components that regulate serum somatomedin C concentrations in humans. J Clin Invest 71:175-182
22. Phillips LS 1986 Nutrition, somatomedins, and the brain. Metabolism 35:78- 87
23. Pimstone BL, Wittman W, Hansen JDL 1966 Growth hormone and kwashior- kor. Lancet 2:779-780
24. Hadden DR, Rutishauser IH 1967 Effect of human growth hormone In kwashiorkor and marasmus. Arch Dis Child 42:29-33
25. Godard C 1974 Review: the endocrine glands in infantile malnutrition. Helv Paediatr Acta 29:5-26
26. Graham GC, Cordano A, Blizzard RM 1969 Infantile malnutrition: changes in body composition during rehabilitation. Pediatr Res 3:579
27. Beas F, Contreras I, Maccioni A, Arenas S 197 1 Growth hormone in infant malnutrition: the arginine test in marasmus and kwashiorkor. Br J Nutr 26: 169- 175
28. Parra A, Garza C, Klish W 1973 Insulin-growth hormone adaptations in marasmus and kwashiorkor as seen in Mexico. In: Gardner LI, Amacher P (eds) Endocrine Aspects of Malnutrition. Kroc Foundation, Santa Ynez, CA, pp 3 1-43
29. ~aghuramnlu N, Kamala S, Jaya Rao C 1974 Growth hormone secretion in protein calorie malnutrition. J Clin Endocrinol Metab 38: 176
30. Pimstone BL, Barbezat G, Hansen JDL 1968 Studies on growth hormone secretion in protein calorie malnutrition. Am J Clin Nutr 21:482-487
31. Suskind RM, Olson LC, Olson RE 1973 Interrelationships between growth hormone and amino acid metabolism in protein calorie malnutrition. In: Gardner LI, Amacher P (eds) Endocrine Aspects of Malnutrition. Kroc Foundation, Santa Ynez, CA, pp 99-1 13
32. Parra A, Garza C, Garza Y 1973 Changes in growth hormone, insulin, thyroxine values and energy metabolism in marasmic children. J Pediatr 82:133-142
33. Smith SR, Edgar PJ, Pozefsky T 1974 Growth hormone in adults with protern calorie malnutrition. J Clin Endocrinol Metab 3953-62
34. Hadden DR 1967 Glucose, free fatty acids, and insulin interrelations in kwashiorkor and marasmus. Lancet 2589-592
35. Baig HA, Edozien JC 1965 Carbohydrate metabolism in kwashiorkor. Lancet 2:662-665
36. Milner RDG 197 1 Metabolic and hormonal responses to glucose and glucagon in patients with infantile malnutrition. Pediatr Res 5:33-39
37. Parra A, Klish W, Cuellar A, Serrano PA 1975 Energy metabolism and hormonal profile in children with edematous protein calorie malnutrition. J Pediatr 87:307-3 14
38. Godard C, Zahnd GR 1971 Growth hormone and insulin in severe infantile malnutrition. 11. Plasma insulin and growth hormone during intravenous glucose tolerance test. Helv Paediat Acta 26:276-285
39. Robinson H, Picou D 1977 A comparison of fasting plasma insulin and growth hormone concentrations in marasmic. kwashiorkor, marasmic-kwashiorkor and underweight children. Pediatr Res 11:637-640
40. Alleyne GAO, Trust PM, Flores H, Robinson H 1972 Glucose tolerance and insulin sensitivity in malnourished children. Br J Nutr 27582
4 1. Milner RDG 197 I Metabolic and hormonal responses to glucose and glucagon
1128 S O L I M A N ET A L
in patients with infantile malnutrition. Pediatr Res 5:33-39 42. Rao J, Kamala S, Raghuramulu N 1972 Insulin secretion in kwashiorkor. J
Clin Endocrinol Metab 35:63-66 43. Becker DJ, Pimstone BL, Hansen JDL 1971 Insulin secretion in protein calorie
malnutrition. Diabetes 20:542-55 1 44. Hill DJ 1985 Insulin as a growth factor. In: Somaomedins and Other Peptide
Growth Factors: Relevance to Pediatrics. Report of the Eighty-ninth Ross Conference on Pediatric Research. Ross Laboratories, Columbus, OH, pp 75-80
45. Maes M, Underwood LE, Ketelslegers JM 1984 Low serum somatomedin C in protein deficiency: relationship with changes in liver somatogenic and lactogenic binding sites. Mol Cell Endocrinol 37:301-309
46. Frishancho AR 1978 Triceps skin fold and upper arm size norms for assessment of nutritional status. Am J Clin Nutr 27: 1054-1058
47. Wellcome Trust Working Party 1970 Classification of infantile malnutrition. Lancet 2:302-303
48. Hunter WM 1971 The preparation and assessment of iodinated antigens. In: Kirkham KE. Hunter WM (eds). Radioimmunoassay Methods. Churchill Livingstone, London. p 3
49. Freedlander AE. Vandenhoff GE. Macleod MS, Malcolm RR 1984 Radio- immunoassay of insulin. In: Larner J Phol SL (eds) Method in Diabetes Research, Vol. I, Part B. A Wiley Interscience Publication, New York, p 295
50. Copeland KC. Underwood LE, Van Wyk JJ 1980 Induction ofimrnunoreactive
somatomedin-C in human serum by growth hormone: dose-response rela- tionships and effect on chromatographic profile. J Clin Endocrinol Metab 50:690-697
5 1. Hintz RL, Liu F 1980 A radioimmunoassay for insulin-like growth factor I1 specific for the C-peptide region. J Clin Endocrinol Metab 54:442-446
52. Becker DJ 1983 The endocrine responses to protein calorie malnutrition. Ann Rev Nutr 3: 187-2 12
53. Lunn PG, Austin S 1983 Excess energy intake promotes the development of hypoalbuminemia in rats fed on low protein diets. Br J Nutr 49:9-17
54. Levine LS, Wright PG, Marcus F 1983 Failure to secrete immunoreactive insulin by rats fed a low protein diet. Acta Endocrinol 102:240-245
55. Weinkove D, Weinkove EA, Pimstone BL 1976 Glucose tolerance and insulin release in malnourished rats. Clin Sci Mol Med 50: 153-163
56. Parra A, Klish W, Cuellar A 1975 Energy metabolism and hormonal profile in children with edematous protein-calorie malnutrition. Trop Pediatr 57:307-3 14
57. Clarke JS, Wingfield BS, McNatt ML, Elders MJ, Hughes ER 1973 Studies on the mechanism of growth retardation by glucocorticoids. Clin Res 2 1: 109(abstr)
58. Tessler RH, Salmon WD 1975 Glucocorticoid inhibition of sulfate incorpora- tion by cartilage of normal rats. Endocrinology 96:898-902
59. Phillips LS, Hemngton AC, Mueller MD, Daughaday WH 1973 Cortisol inhibition of growth hormone-induced somatomedin generation. Clin Res 2 1:68
Appendix Table 1 . Anthropometric data for the malnourished and control children Mid-arm % o f exp.
% of exp. % of exp. circumference mid-arm Muscle Wt/(ht)2 Age ( m o ) W t (kg) wt Ht ( cm) h t ( cm) circumference diameter X (
Kwashiorkor (before) I 2 3 4 5 6 7 8 9
10 1 1 12 13 14 15 Mean SD
Marasmic-kwashiorkor (before) 1 2 3 4 5 6 7 8 9
10 1 1 12 13 14 15 Mean SD
Marasmus (before) 1 20 6.1 59.2 72.9 93.3 9.5 59.3 26.0 1.1 2 4 3.7 60.7 55.5 90.2 7.2 51.0 19.3 1.2 3 5 3.6 54.6 56 88.7 8.2 56.5 23.1 1.1 4 18 5.8 59.0 69.2 90.6 9.7 59.8 27.4 1.2 5 4 3.1 50.2 51.2 83.2 7.5 54.7 21.4 1.1
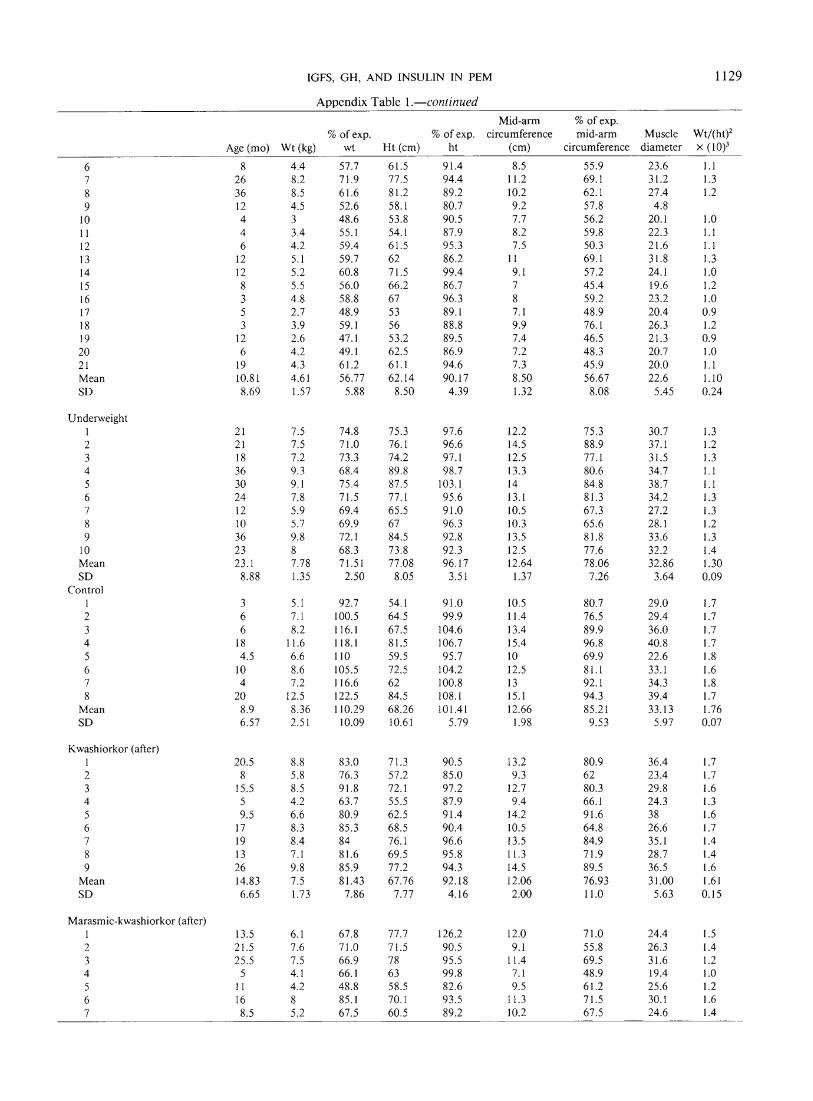
IGFS, GH, AND INSULIN IN PEM 1129
Avvendix Table I .-continued Mid-arm % of exp.
% of exp. % of exp. circumference mid-arm Muscle Wt/(ht)' Age (mo) Wt (kg) wt Ht (cm) ht (cm) circumference diameter x ( 10)'
6 7 8 9
10 I I 12 13 14 15 16 17 18 19 20 2 1 Mean SD
Underweight 1 2 3 4 5 6 7 8 9
10 Mean SD
Control 1 2 3 4 5 6 7 8
Mean SD
Kwashiorkor (after) I 2 3 4 5 6 7 8 9
Mean SD
Marasmic-kwashiorkor (after) I 13.5 6.1 67.8 77.7 126.2 12.0 7 1 .O 24.4 1.5 2 2 1.5 7.6 71.0 71.5 90.5 9.1 55.8 26.3 1.4 3 25.5 7.5 66.9 78 95.5 11.4 69.5 3 1.6 1.2 4 5 4.1 66.1 63 99.8 7.1 48.9 19.4 1 .O 5 11 4.2 48.8 58.5 82.6 9.5 6 1.2 25.6 1.2 6 16 8 85.1 70.1 93.5 11.3 7 1.5 30.1 1.6 7 8.5 5.2 67.5 60.5 89.2 10.2 67.5 24.6 1.4

1130 SOLIMAN ET AL.
A ~ ~ e n d i x Table I .-continued - -
Mid-arm % of exp. % of exp. % of exp. circumference mid-am Muscle ~ t / ( h t ) '
Age (mo) Wt (kg) wt Ht (cm) ht (cm) circumference diameter X (
8 9
10 Mean SD
Marasmus (after) 1 2 3 4 5 6 7 8 9
Mean SD
Related Documents