Series www.thelancet.com Published online July 14, 2016 http://dx.doi.org/10.1016/S0140-6736(16)30466-4 1 HIV and related infections in prisoners 1 Global burden of HIV, viral hepatitis, and tuberculosis in prisoners and detainees Kate Dolan, Andrea L Wirtz, Babak Moazen, Martial Ndeffo-mbah, Alison Galvani, Stuart A Kinner, Ryan Courtney, Martin McKee, Joseph J Amon, Lisa Maher, Margaret Hellard, Chris Beyrer, Fredrick L Altice The prison setting presents not only challenges, but also opportunities, for the prevention and treatment of HIV, viral hepatitis, and tuberculosis. We did a comprehensive literature search of data published between 2005 and 2015 to understand the global epidemiology of HIV, hepatitis C virus (HCV), hepatitis B virus (HBV), and tuberculosis in prisoners. We further modelled the contribution of imprisonment and the potential impact of prevention interventions on HIV transmission in this population. Of the estimated 10·2 million people incarcerated worldwide on any given day in 2014, we estimated that 3·8% have HIV (389 000 living with HIV), 15·1% have HCV (1 546 500), 4·8% have chronic HBV (491 500), and 2·8% have active tuberculosis (286 000). The few studies on incidence suggest that intraprison transmission is generally low, except for large-scale outbreaks. Our model indicates that decreasing the incarceration rate in people who inject drugs and providing opioid agonist therapy could reduce the burden of HIV in this population. The prevalence of HIV, HCV, HBV, and tuberculosis is higher in prison populations than in the general population, mainly because of the criminalisation of drug use and the detention of people who use drugs. The most effective way of controlling these infections in prisoners and the broader community is to reduce the incarceration of people who inject drugs. Introduction From the beginning of the AIDS epidemic in 1981, the association between HIV, tuberculosis, and prisons was apparent, 1 with HIV responsible for a steep rise in tuberculosis in US prison populations. 2 This is important because the prevalence of HIV in prisons in many countries is high, with one review reporting levels greater than 10% in 20 low-income and middle-income countries. 3 Several factors have a role in the epidemics of HIV, tuberculosis, and related infections in prisons. 4 Many individuals who are most likely to be incarcerated are at greatest risk of these infections, whether because of injection drug use for HIV and viral hepatitis or poverty and overcrowding for tuberculosis. Drug injection is common in prison inmates, ranging from 2% to 38% in Europe, 34% in Canada, and up to 55% in Australia, in stark contrast with the percentage in the general population, estimated at 0·3% in the European Union and 0·2% in Australia. 5 Prisons provide many opportunities both for the spread 4 and prevention of these infections. 6 The situation is complicated further by the expansion of parallel prison systems for those suspected of drug use in at least 27 countries. These compulsory drug detention centres operate extrajudicially and often under the guise of drug treatment (panel 1). 20 Punishment and inhumane conditions are widespread, but evidence-based treatment for drug dependence and infectious diseases is rare or non-existent. 7,21 However, prisons not only pose a threat to the health of people incarcerated within them. They also pose a risk to staff and to the population at large, because detainees are not a static population, but move around the prison system and back and forth from the outside world. The risks particularly lie at the interface between prisons and society outside. In the USA, HIV incidence is highest in detainees who were released and re-incarcerated compared with continuously incarcerated prisoners, people who inject drugs with no history of incarceration, and men who have sex with men (MSM; panel 2). 4 The period immediately after release is especially risky for receptive syringe sharing, acquisition of HIV and hepatitis C virus (HCV), and mortality. 29–32 Thus, the transition between the prison and community settings represents a high-risk Published Online July 14, 2016 http://dx.doi.org/10.1016/ S0140-6736(16)30466-4 This is the first in a Series of six papers on HIV and related infections in prisoners National Drug and Alcohol Research Centre (Prof K Dolan PhD, R Courtney PhD), and Kirby Institute (Prof L Maher PhD), University of New South Wales, Sydney, NSW, Australia; Center for Public Health and Human Rights, and Department of Epidemiology, Johns Hopkins School of Public Health, Baltimore, MD, USA (A L Wirtz PhD, Prof C Beyrer MD); Non-Communicable Diseases Research Center, Endocrinology and Metabolism Population Sciences Institute, Tehran University of Medical Sciences, Tehran, Iran (B Moazen MScIH); Center for Infectious Disease Modeling and Analysis (M Ndeffo-mbah PhD, Prof A Galvani PhD), and Epidemiology and Public Health (Prof F L Altice MD), Yale University, New Haven, CT, USA; Griffith Criminology Institute & Menzies Health Institute Queensland, Griffith University, Brisbane, QLD, Australia (Prof S A Kinner PhD); Department of Health Services Research and Policy, London School of Hygiene & Tropical Medicine, London, UK (Prof M McKee DSc); Health and Human Rights Division, Human Rights Watch, New York, NY, USA (J J Amon PhD); and Centre for Population Health, Burnet Institute, Melbourne, VIC, Australia (Prof M Hellard PhD) Correspondence to: Prof Kate Dolan, National Drug and Alcohol Research Centre, University of New South Wales, Sydney, NSW 2052, Australia [email protected] Key messages • Prevalence of HIV, HCV, HBV, and tuberculosis is higher in prison populations than in the general population, mainly because of the criminalisation of drug use and the detention of people who inject or use drugs • We strongly support the UN’s 2012 call to close compulsory drug detention centres and expand voluntary, evidence-based treatment in the community • Mathematical modelling suggests that incarceration and re-incarceration of people who inject drugs contributes to the overall HIV epidemic and a reduction in incarceration of this population will reduce the incidence of HIV • Evidence-based prevention and treatment such as opioid agonist therapy and antiretroviral therapy can substantially reduce the incidence of HIV, HCV, and HBV, and reduce drug dependence in this population • Responses to co-infection with HIV and tuberculosis should include an integrated, patient-centred model of prevention and care, with systematic screening of high-risk groups and equitable access to effective treatment • The most effective way of controlling infection in prisoners and the broader community is to reduce mass incarceration of people who inject drugs

Welcome message from author
This document is posted to help you gain knowledge. Please leave a comment to let me know what you think about it! Share it to your friends and learn new things together.
Transcript

Series
www.thelancet.com Published online July 14, 2016 http://dx.doi.org/10.1016/S0140-6736(16)30466-4 1
HIV and related infections in prisoners 1
Global burden of HIV, viral hepatitis, and tuberculosis in prisoners and detaineesKate Dolan, Andrea L Wirtz, Babak Moazen, Martial Ndeffo-mbah, Alison Galvani, Stuart A Kinner, Ryan Courtney, Martin McKee, Joseph J Amon, Lisa Maher, Margaret Hellard, Chris Beyrer, Fredrick L Altice
The prison setting presents not only challenges, but also opportunities, for the prevention and treatment of HIV, viral hepatitis, and tuberculosis. We did a comprehensive literature search of data published between 2005 and 2015 to understand the global epidemiology of HIV, hepatitis C virus (HCV), hepatitis B virus (HBV), and tuberculosis in prisoners. We further modelled the contribution of imprisonment and the potential impact of prevention interventions on HIV transmission in this population. Of the estimated 10·2 million people incarcerated worldwide on any given day in 2014, we estimated that 3·8% have HIV (389 000 living with HIV), 15·1% have HCV (1 546 500), 4·8% have chronic HBV (491 500), and 2·8% have active tuberculosis (286 000). The few studies on incidence suggest that intraprison transmission is generally low, except for large-scale outbreaks. Our model indicates that decreasing the incarceration rate in people who inject drugs and providing opioid agonist therapy could reduce the burden of HIV in this population. The prevalence of HIV, HCV, HBV, and tuberculosis is higher in prison populations than in the general population, mainly because of the criminalisation of drug use and the detention of people who use drugs. The most effective way of controlling these infections in prisoners and the broader community is to reduce the incarceration of people who inject drugs.
IntroductionFrom the beginning of the AIDS epidemic in 1981, the association between HIV, tuberculosis, and prisons was apparent,1 with HIV responsible for a steep rise in tuberculosis in US prison populations.2 This is important because the prevalence of HIV in prisons in many countries is high, with one review reporting levels greater than 10% in 20 low-income and middle-income countries.3 Several factors have a role in the epidemics of HIV, tuberculosis, and related infections in prisons.4 Many individuals who are most likely to be incarcerated are at greatest risk of these infections, whether because of injection drug use for HIV and viral hepatitis or poverty and overcrowding for tuberculosis. Drug injection is common in prison inmates, ranging from 2% to 38% in Europe, 34% in Canada, and up to 55% in Australia, in stark contrast with the percentage in the general population, estimated at 0·3% in the European Union and 0·2% in Australia.5 Prisons provide many opportunities both for the spread4 and prevention of these infections.6
The situation is complicated further by the expansion of parallel prison systems for those suspected of drug use in at least 27 countries. These compulsory drug detention centres operate extrajudicially and often under the guise of drug treatment (panel 1).20 Punishment and inhumane conditions are widespread, but evidence-based treatment for drug dependence and infectious diseases is rare or non-existent.7,21 However, prisons not only pose a threat to the health of people incarcerated within them. They also pose a risk to staff and to the population at large, because detainees are not a static population, but move around the prison system and back and forth from the outside world.
The risks particularly lie at the interface between prisons and society outside. In the USA, HIV incidence is highest
in detainees who were released and re-incarcerated compared with continuously incarcerated prisoners, people who inject drugs with no history of incarceration, and men who have sex with men (MSM; panel 2).4 The period immediately after release is especially risky for receptive syringe sharing, acquisition of HIV and hepatitis C virus (HCV), and mortality.29–32 Thus, the transition between the prison and community settings represents a high-risk
Published Online July 14, 2016 http://dx.doi.org/10.1016/S0140-6736(16)30466-4
This is the first in a Series of six papers on HIV and related infections in prisoners
National Drug and Alcohol Research Centre (Prof K Dolan PhD, R Courtney PhD), and Kirby Institute (Prof L Maher PhD), University of New South Wales, Sydney, NSW, Australia; Center for Public Health and Human Rights, and Department of Epidemiology, Johns Hopkins School of Public Health, Baltimore, MD, USA (A L Wirtz PhD, Prof C Beyrer MD); Non-Communicable Diseases Research Center, Endocrinology and Metabolism Population Sciences Institute, Tehran University of Medical Sciences, Tehran, Iran (B Moazen MScIH); Center for Infectious Disease Modeling and Analysis (M Ndeffo-mbah PhD, Prof A Galvani PhD), and Epidemiology and Public Health (Prof F L Altice MD), Yale University, New Haven, CT, USA; Griffith Criminology Institute & Menzies Health Institute Queensland, Griffith University, Brisbane, QLD, Australia (Prof S A Kinner PhD); Department of Health Services Research and Policy, London School of Hygiene & Tropical Medicine, London, UK (Prof M McKee DSc); Health and Human Rights Division, Human Rights Watch, New York, NY, USA (J J Amon PhD); and Centre for Population Health, Burnet Institute, Melbourne, VIC, Australia (Prof M Hellard PhD)
Correspondence to: Prof Kate Dolan, National Drug and Alcohol Research Centre, University of New South Wales, Sydney, NSW 2052, Australia [email protected]
Key messages
• PrevalenceofHIV,HCV,HBV,andtuberculosisishigherinprison populations than in the general population, mainly because of the criminalisation of drug use and the detention of people who inject or use drugs
• WestronglysupporttheUN’s2012calltoclosecompulsory drug detention centres and expand voluntary, evidence-based treatment in the community
• Mathematicalmodellingsuggeststhatincarcerationandre-incarceration of people who inject drugs contributes to the overall HIV epidemic and a reduction in incarceration of this population will reduce the incidence of HIV
• Evidence-basedpreventionandtreatmentsuchasopioidagonist therapy and antiretroviral therapy can substantially reduce the incidence of HIV, HCV, and HBV, and reduce drug dependence in this population
• Responsestoco-infectionwithHIVandtuberculosisshouldinclude an integrated, patient-centred model of prevention and care, with systematic screening of high-risk groups and equitable access to effective treatment
• Themosteffectivewayofcontrollinginfectioninprisoners and the broader community is to reduce mass incarceration of people who inject drugs

Series
2 www.thelancet.com Published online July 14, 2016 http://dx.doi.org/10.1016/S0140-6736(16)30466-4
environment, especially for people with substance use disorders.31 This is important because, although an estimated 10·2 million people were incarcerated at any time in 2014, over 30 million individuals transition from prison to the community each year.33 Prisons act as incubators for tuberculosis and HIV, because they are associated with higher levels of infection than in the surrounding populations,3,34 yet many countries have parallel and vertical systems, with fragmented policy responses to these interlinked issues—prisons, HIV, viral hepatitis, and tuberculosis—and interruptions of surveillance and treatment during transitions. This Series paper encourages a coordinated response by reviewing the global epidemiology of HIV, HCV, HBV, and tuberculosis in prison populations.35,36
Disease burden in prisoners and detaineesWe did a comprehensive review of studies of prevalence and incidence data on HIV, HCV, HBV, tuberculosis, and co-infection with tuberculosis and HIV in prisoners and detainees, published between Jan 1, 2005, and Nov 30, 2015, for 196 countries in 2015 (appendix p 2, 4).37
We searched for studies with biological markers of each infection in general prisoners and in people who inject drugs, MSM, female sex workers, and transgender people, in prisons, jails, and compulsory drug detention centres.
Of 11 000 publications identified, 299 met inclusion criteria for the meta-analysis of infections (appendix p 7). These data show substantial heterogeneity in disease burden across regions (figure 1).
Global estimates of prisoners with HIV, HCV, HBV, and tuberculosis infectionOf an estimated 10·2 million people incarcerated worldwide on any given day in 2013,22 we estimated the midpoint of the number infected was 389 000 with HIV (3·8%), 1 546 500 with HCV (15·1%), 491 500 with chronic HBV infection (4·8%), and 286 000 with active tuberculosis (2·8%; appendix pp 9, 15, 20, 24).
Overall, prevalence of all infections was substantially higher in prison populations than in surrounding communities, especially where there are generalised HIV epidemics, such as in sub-Saharan Africa,38 and where there is a high prevalence of injection drug use, such as in eastern Europe and central Asia (figure 1, 2, appendix p 9).39
HIV infectionPooled estimated HIV prevalence in prisoners74 of 196 countries37 had HIV prevalence data in 2015 (200 datapoints) in prisoners (appendix p 8). The regions most affected were the two African regions (east and southern Africa and west and central Africa), which have a high prevalence in the general population, and the two European regions (eastern Europe and central Asia and west Europe), reflecting the over-representation of people who inject drugs in prison—a group with a high prevalence of HIV infection. Transmission via injection drug use also contributes to the HIV epidemic in the Middle East and north Africa and Asia Pacific regions.
While injection drug use is rare in the Caribbean and Latin America, HIV prevalence in prisoners is generally higher than in North America, possibly reflecting the concentrated epidemic of HIV in MSM40 and cocaine users in Latin America.41
Female inmates had a slightly higher prevalence of HIV than male prisoners in six regions (both African regions, Asia Pacific, both European regions, and North America) and lower than male inmates in Latin America and the Middle East and north Africa (appendix p 9). Notable differences were found in west and central Africa, where the prevalence of HIV in women was almost double that of men (13·1% vs 7·1%), and in eastern Europe and central Asia, where it was almost three times higher than in men (22·1% vs 8·5%). HIV prevalence was higher in prisoners than in the general population in eastern Europe and central Asia (4·1% vs 0·5%) and western Europe (4·6% vs 0·2%).38
Panel 1: Compulsory drug detention centres
Some 27 countries detain drug users, or suspected drug users, in compulsory drug detention centres for the purpose of treatment or rehabilitation. In east and southeast Asia, an estimated 600 000 drug users are detained in roughly 1000 (mostly government-run) centres.7 In Latin America,8,9 and sub-Saharan Africa,10–12 an unknown number of individuals are detained in hundreds of faith-based and unregulated residential treatment centres. Abuses in these facilities include being shackled to trees and starved.13 Similar unregistered treatment centres operate in central Asia.14
Detainees are typically held in forms of administrative detention, often without due legal process,assessmentofdrugdependency,orinformedconsent.Evidence-baseddrugdependency treatment such as opioid agonist therapy is rarely provided,15 while physical abuse—including torture, forced prayer, forced exercise to sweat drugs out of the body, and manual labour (sometimes forced labour)—are common.16Estimatesofdiseaseburden in compulsory drug detention centres are given in the appendix (p 31).
In Vietnam, one formerly detained child described punishment in a compulsory drug detention centre, where the staff beat him on the arm and back with a truncheon. He reported being held in a small punishment room for 3 months. Another ex-detainee served his 2-year sentence only to have it extended by 5 years with no reason given.16
In Cambodia, one former detainee reported having his head bashed against a wall until he lost consciousness.16 One child, detained in a compulsory drug detention centre in Cambodia, said he saw a doctor after he was beaten. After the doctor treated the child, the doctor told the child to not try and escape again.17 In Thailand, individuals detained in compulsory drug detention centres reported being beaten or made to roll on gravel as a punishment.18
Ex-detaineeshavelimitedornoaccesstohealthcare.InChina,oneindividualdetainedinGuangxi province reported that he was unable to continue taking his antiretroviral drugs once placed in (compulsory) detoxification. Another person, detained in Yunnan province, reported that many incarcerated people have tuberculosis and many acquire tuberculosis while incarcerated, yet there is no treatment.19
These unregulated and abusive forms of detention in the name of drug treatment do not meet minimum health or human rights standards and should be closed.
See Online for apppendix

Series
www.thelancet.com Published online July 14, 2016 http://dx.doi.org/10.1016/S0140-6736(16)30466-4 3
HIV prevalence in imprisoned people who inject drugsOf the 200 HIV datapoints, only 47 were related to people who inject drugs in 16 countries. Prevalence estimates from Iran ranged from 0·7% in 2002 to 18·2% in 2003 and fell to 2·3% in 2007. After two large outbreaks of HIV in prisons (panel 3), Iran increased opioid agonist therapy coverage from 100 to over 25 000 drug users, provided condoms and conjugal visits, and piloted six needle and syringe programmes in prisons from 2002.47,49 Australia’s HIV infection prevalence of almost zero in people who inject drugs in and out of prison can be traced back to very early introduction of community-based needle and syringe programmes in 1986, which prevented an estimated 25 000 HIV cases in people who inject drugs.58
Hepatitis C infectionPooled estimated HCV prevalence in prisoners46 of 196 countries had HCV prevalence data (171 data-points; hepatitis C antibody) in prisoners from 2005 to 201537 (appendix p 8). HCV infection in prisoners is high worldwide, exceeding 10% in six regions (figure 1, 3, appendix p 15). This finding reflects the increased infectivity and earlier HCV entry into populations of people who inject drugs compared with HIV.59
Epidemic patterns of HCV infection related to injection drug use persist in Europe. HCV prevalence estimates were high in the eastern Europe and central Asia region at 20·2% (95% CI 11·8–30·1), in west Europe at 15·5% (12·2–19·1), and in North America at 15·3% (13·1–17·7). Injection drug use is rare in the Caribbean, which probably accounts for the absence of HCV data (and possibly infection) in prison populations. In Latin America, HCV prevalence was 4·7% (3·1–6·7), also reflecting the low level of drug injection in this region. Insufficient data, particularly for female inmate populations, precluded gender comparisons of the prevalence of HCV.
HCV prevalence in imprisoned people who inject drugsOf the 171 datapoints on HCV infection, only 53 related to people who inject drugs in 19 countries. As expected, the prevalence of HCV in imprisoned people who inject drugs was high or very high, ranging from 8% to 95%, most of which were above 40% (appendix p 28). Only six countries had multiple datapoints from which trends could be surmised. With ten datapoints, Iran showed a clear reduction in prevalence from 78·3% (2001) to 43·4% (2009).49 No data were identified for HCV in people who inject drugs for either African regions or Latin America.
Hepatitis B infectionPooled estimated HBV prevalence in prisoners43 of 196 countries had HBV prevalence data (56 data-points) in prisoners from 2005 to 2015 (figure 3, appendix pp 8, 20).37 The prevalence of HBsAg in
prisoners in west and central Africa was very high at 23·5% (95% CI 19·8–27·5)—the highest burden of all four types of infection and across the nine regions. High levels of chronic HBV infection were also reported in east and southern Africa (5·7%, 95% CI 2·9–9·4) and in eastern Europe and central Asia (10·4%, 1·9–24·6). In other regions, HBV prevalence was below 5% and unsafe injection drug use and unprotected sex remain important modes of transmission.60
HBsAg prevalence in prisoners relative to the general populationThe burden of HBV in the general population is highest in sub-Saharan Africa, with a meta-analysis estimate of HBsAg prevalence at 8·8%, which was primarily attributed to vertical transmission from mother to child,
Panel 2: Mass incarceration and the HIV epidemic in the USA
The US incarceration rate of 716 per 100 000 population is almost five times the global average of 146 per 100 000.22 This translates into 2·2 million people, or almost 1% of the US population behind bars on any given day in 2013. In the 1970s, this rate was a meagre 75 per 100 000. However, the Rockefeller Drug Laws, introduced in 1973, caused the incarceration rate to increase by five times in a decade.23 Specifically designed to target heroin and crack cocaine users, these laws mandated lengthy minimum sentences for many drug offences, including the possession and sale of small quantities of drugs, which matched sentences for rape, assault, and robbery. These laws took account of previous offences and culminated in the three-strikes law (ie, three strikes and you are in for life), for minor, but multiple offences.
By 1985, drug offenders comprised one-third of all inmates in New York state. The burden of incarceration fell heavily on young black men, who were 40 times more likely to be incarcerated than their white peers, and Hispanic men, who were 30 times more likely to beimprisonedthantheirwhitepeers.NewYorkCity’sRikersIslandprisononcehadthelargest concentration of HIV-positive people in the USA.
HIV prevalence is roughly three times higher in incarcerated individuals than in the general US population.24 HIV prevalence in the state prisons of Florida, Maryland, and New York exceeds 3%, which is higher than the national prevalence of any country outside of sub-Saharan Africa.25 At least one in six HIV-positive American people passes through a correctional centre each year.23 HIV infection has been linked to a history of incarceration; however, proving the infection occurred in prison is difficult. Although cases of intraprison HIV and HBV transmission have been recorded (panel 3), evidence suggests that most HIV-positive people were infected before prison entry. For people in detention with HIV infection, treatment outcomes have been good, but retention in treatment after release is more challenging.26
The post-release period can also be especially dangerous for treatment interruptions, fatal andnon-fataloverdose,andinfectionacquisition.TheALIVEstudy27 reported that the risk of HIV transmission increases, rather than decreases, on release from prison. Incarceration plays a role in delaying recovery from drug dependence. Incarceration also has an impact on those in the community, most probably through the return of prisoners who have been released and are infectious, who have interruptions in antiretroviral treatment. The main risk behaviour for newly diagnosed, heterosexually acquired HIV infection in African-American women was having sex with a partner who had a history of incarceration.28 The approach to drug policy and the mass incarceration of drug users in the USA is counterproductive, expensive, and increases the risk of HIV treatment interruption and subsequent transmission.23

Series
4 www.thelancet.com Published online July 14, 2016 http://dx.doi.org/10.1016/S0140-6736(16)30466-4
low HBV vaccine coverage (including birth dose), and unsafe medical products and procedures.61 In Australia, the prevalence of HBsAg was 2·3% in prison and 1·0% in the community.62
HBsAg prevalence in imprisoned people who inject drugsOf the 56 HBV datapoints, 24 related to people who inject drugs in ten countries. Iran and Australia were the only countries with multiple datapoints (appendix p 28). In Iran, HBV prevalence was significantly and positively associated with the frequency and duration of imprisonment.49 Despite a reduction in the proportion of Australian prisoners reporting injection drug use, evidence of HBV infection remains high in
prison entrants, with many unaware of their infection status.62
Tuberculosis and co-infection with HIVPrevalence of active tuberculosis and co-infection with HIV in prisonersEstimates of active tuberculosis in prison populations were higher than in the general population in almost all settings, with investigators of one study, from the Dourados prison in Brazil, estimating that prevalence of tuberculosis was 40 times higher than in the general population.63
25 of 196 countries reported tuberculosis prevalence data (46 datapoints) and 17 of 196 countries prevalence data on co-infection with HIV and tuberculosis (25 data-points) in prisoners from 2005 to 2015 (figure 4, appendix pp 8, 27).37 In the three regions with the highest prevalence of HIV and viral hepatitis, active tuberculosis was also common (appendix pp 24, 27): 5·3% (95% CI 2·1–10·0) in east and southern Africa, 2·9% (2·4–3·6) in west and central Africa, and 4·9% (1·8–9·3) in eastern Europe and central Asia. In the African regions, active tuberculosis infection was associated with overcrowding, high inmate turnover, and increased frequency or duration of incarceration.64–66 Disease burden was lower in other regions, though only one study was identified in the Middle East and north Africa, two in the western European region, and none in the Caribbean.
A systematic review67 found that the incidence of tuberculosis is 23 times higher in prison populations than in the general community, and that the prevalence of drug-resistant tuberculosis is also substantially higher. Increased prevalence of HIV infection exacerbates the effect of incarceration on tuberculosis incidence, highlighting the importance of a coordinated approach to prevent and treat these two infections.34 Important for tuberculosis control in prisons is case-finding to ensure early detection and treatment, case isolation and infection control measures,
0–1·01·1–5·05·1–10·010·1–15·015·1–20·0>20·0No data meeting inclusion criteria
North America1·3% (95% CI 1·0–1·7)
Latin America2·3% (95% CI 1·5–3·4)
Caribbean3·3% (95% CI 2·7–4·0)
East and southern Africa15·6% (95% CI 11·8–19·8)
Eastern Europe and central Asia4·1% (95% CI 1·4–8·0)
Middle East and north Africa1·3% (95% CI 0·2–3·3)
West andcentral Africa8·2% (95% CI 6·2–10·5)
Asia Pacific1·4% (95% CI 0·9–1·9)
Western Europe4·2% (95% CI 2·7–6·1)
Figure 2: Global and regional burden of HIV in prison inmates, published between 2005 and 2015
East andsouthern
Africa
West andcentralAfrica
Middle Eastand north
Africa
AsiaPacific
EasternEurope andcentral Asia
WesternEurope
NorthAmerica
Caribbean LatinAmerica
0
5
10
15
20
25
35
30
40
Prev
alen
ce (%
)
HIVHCVHBsAgActive tuberculosis
Figure 1: Regional prevalence of HIV, hepatitis C, HBsAg, and active tuberculosis in prisoners, published between 2005 and 2015HCV=hepatitis C antibodies.

Series
www.thelancet.com Published online July 14, 2016 http://dx.doi.org/10.1016/S0140-6736(16)30466-4 5
initiation of tuberculosis treatment followed soon after by HIV treatment, and treatment of latent tuberculosis infection, especially in patients with HIV.
Studies investigating HIV and tuberculosis co-infection are of two types (appendix p 27). The first study type measures HIV and tuberculosis co-infection in all prisoners, which typically finds prevalence estimates that are less than 10% of the prison population, ranging from 1·6% (Zambia) and 5·1% (South Africa) in east and southern Africa to 0·3% (Guinea) and 8·9% (Nigeria) in west and central Africa. The figures were less than 1% in studies from Latin America and western Europe. The second type of study measures HIV prevalence in inmates with tuberculosis infection and vice versa. Studies of HIV in individuals with tuberculosis done in Africa typically report a prevalence of 40% and higher (Burkina Faso 75%, Uganda 57%, Zambia 45·8%, and South Africa 42–58%). Prevalence estimates of tuberculosis in people with HIV infection tend to be lower (Burkina Faso 20%, Ethiopia 47%, and Malaysia 17%; appendix p 27).
Incidence of HIV, HCV, HBV, and tuberculosis in prisonersFew incidence studies were found on HIV (three countries), HCV (four), HBV (two), and tuberculosis (14; appendix p 32). Spain had detailed annual HIV incidence data from 2000 to 2014 that revealed a steady decline from 0·70% to 0·04% per year over 14 years.68 A large prospective study of hepatitis C incidence in prisons in Australia reported an annual incidence of 14·1%,69 which was high compared with Scotland (0·9%),70 the USA (0·4%),71 and Spain (1·7%).72
Of the 14 countries with tuberculosis data, only seven had multiple incidence rates. Countries that had a decrease in incidence were Colombia,73,74 Argentina,75 Hong Kong,76 Macedonia,77 and Romania.78 An increase in tuberculosis cases in prison was observed in the USA (figure 5).79
The potential effect of increased incarceration on tuberculosis in Europe and central Asia was modelled.34 For each percentage point increase in incarceration rates, there was a corresponding increase in tuberculosis incidence of 0·34% (population attributable risk; 95% CI 0·10–0·58, p<0·01). Mathematical modelling of tuberculosis transmission in Ukraine further suggests that incarceration contributes to 75% of new tuberculosis infections in people who inject drugs.80
Infectious disease prevalence in key populations HIV, HCV, HBV, and tuberculosis in imprisoned MSM, female sex workers, and transgender peopleEstimates of infectious diseases in key populations who become imprisoned (eg, MSM, female sex workers, and transgender people) are less frequently reported than in people who inject drugs. In 2008, HIV prevalence in Ghana in imprisoned female sex
workers (n=73) was 11% and 8·9% in MSM (n=403).81 HIV prevalence in imprisoned MSM was 43·8% in Nigeria (n=32 in 2009), 2·6% in Iran (n=113), and 5·5–34·0% in the USA.82–90 The only study of transgender prisoners was done in Argentina, in which half of transgender prisoners (six of 11 people) were HIV positive.75 US studies provided estimates of HIV prevalence in female sex workers from 2·0% to 5·6%.89,91
Imprisoned MSM in the USA and Iran had high levels of exposure to HCV (50%)82,92 compared with imprisoned MSM in Nigeria (12·5%).83 Imprisoned MSM had high levels of HBV in Ghana (40·2%)81 and Nigeria (56·3%).83 Female sex workers in Ghana also had high levels of HBV infection at 37·0%.81
Panel 3: Outbreaks of infectious diseases in prisoners
One of the first recognised HIV outbreaks occurred in a Bangkok prison in 1988.42 The outbreak was only detected once infected inmates were released and HIV in people who inject drugs escalated from 2% to 43% over the course of several months. An investigation revealed that HIV incidence in prison was very high at 35 per 100 person-years.43,44 In Lithuania, a policy of segregation saw a prisoner who was seroconverting to HIV infection housed with individuals who were HIV negative. At least 284 prisoners were identified as infected with HIV in a few months, which doubled the number of diagnosed HIV cases in Lithuania.3,45 Two outbreaks in Russian prisons saw more than 400 (of 1824) prisoners infected in Nizhnekamsk and 260 inmates infected in the Tatarstan region in 2001.3,46 Large outbreaks have occurred in prisons in Iran and Ukraine, with hundreds of prisoners infected.47,48 Iran increased opioid agonist therapy places from 100 to over 25 000, provided condoms and conjugal visits, and piloted six needle and syringe programmes in prison from 2002.47,49 Small HIV outbreaks have even occurred in areas where prevalence was very low, such as in Australia (four prisoners) and Scotland (ten prisoners), which also had intraprison hepatitis B virus (HBV) transmission.50–52 In 2000, two Australian prisoners were caught sharing syringes and an investigation found that four inmates had acquired hepatitis C virus infection, but none had acquired HIV in prison.53
IntheUSA,Georgia’sstateprisonsystemrecordedanoutbreakofsevencasesofhepatitisBin 2000 and 2001, which were attributed to sex. 52% of 907 susceptible inmates who completed a questionnaire reported at least one risk behaviour for hepatitis B virus infection (including 48% who reported tattooing, sharing a razor [8%], having sex [4%], or injecting drugs [2%]). HBV vaccination was offered only to inmates in the dormitory where the outbreak originated, leaving over 90% of inmates potentially at risk. In the second outbreak, an audit of prison medical records revealed 41 (72%) of 57 HBV cases had occurred in prison. Routine HBV vaccination was recommended for all new prisoners.54–56
In 2006, two ex-inmates in the USA were diagnosed with tuberculosis sparking an investigation.57 Despite one inmate having prolonged symptoms and abnormal chest radiographs, he went undiagnosed while incarcerated. Of 910 exposed inmates who were tested, 53 inmates (5·8%) had newly positive tuberculin skin tests. This included 11 (of 204) new cases of tuberculosis who had been released and re-incarcerated. Of 485 prison employees tested, ten (2·1%) were identified as tuberculin skin test converters.
Although the study of the transmission of these infections prospectively in prison populations has been challenging, these outbreaks illustrate the role that prisons might play in continuing these epidemics beyond the prison wall. It is good public health policy to screen at-risk new prisoners for infectious diseases and to provide inmates with free, easy, and confidential access to prevention programmes such as opioid agonist therapy, antiretroviral therapy, condoms, and HBV vaccination to reduce the risk of outbreaks.6

Series
6 www.thelancet.com Published online July 14, 2016 http://dx.doi.org/10.1016/S0140-6736(16)30466-4
Prevalence of HIV, HCV, and HBV in compulsory drug detention centre detainees in China, Taiwan, Vietnam, and IranIn 2012, an estimated 235 000–600 0007,20 drug users were detained for compulsory drug treatment in over 1000 compulsory drug detention centres.20 While the number of compulsory drug detention centres remained the same, the numbers of drug users detained in those centres had increased by 2015. In China, HIV prevalence ranged from 0·2% to 9·5% in general detainees and was 10·3% in people who inject drugs, whereas HCV prevalence was 44% in general detainees (appendix p 31). In Taiwan, HIV prevalence was 6·9% in general detainees and 25·5% in people who inject drugs in detention. Viral hepatitis was also common with HCV prevalence estimated at 30·5% in general detainees and 89·6% in people who inject drugs; HBsAg prevalence was estimated at 16·9% in general detainees and 16·7% in people who inject drugs in detention. In Vietnam, HIV prevalence was 19·8% and
HCV prevalence was 76·9% in people who inject drugs in detention. Iran reported that 24·4% of detained people who inject drugs were HIV positive, 80% were anti-HCV antibody positive, and 5·8% were HBsAg positive (appendix p 31).
Mathematical modelling of HIV transmission and prevention in people who inject drugsWe modelled the contribution of incarceration and re-incarceration on HIV incidence in people who inject drugs and examined the effects of a reduced rate of incarceration, introduction of prison-based opioid agonist therapy followed by post-release opioid agonist therapy, and post-release antiretroviral treatment retention on HIV incidence.
In our model, the increased risk for HIV transmission was captured by behaviour change in people who inject drugs who temporarily receptively share syringes in prison and a combination of interruption of antiretroviral treatment and behaviour change in people who inject
A
B
North America15·3% (95% CI 13·1–17·7)
Latin America4·7% (95% CI 3·1–6·7)
Caribbean
East and southern Africa1·8% (95% CI 0·2–9·5)
Eastern Europe and central Asia20·2% (95% CI 11·8–30·1)
Middle East and north Africa11·9% (95% CI 5·8–19·8)
West and central Africa16·9% (95% CI 13·1–21·1)
Asia Pacific20·6% (95% CI 15·4–26·4)
Western Europe15·5%(95% CI 12·2–19·1)
North America1·4% (95% CI 0·3–3·1)
Latin America2·3% (95% CI 0·1–8·3)
Caribbean
East and southern Africa5·7% (95% CI 2·9–9·4)
Eastern Europe and central Asia10·4% (95% CI 1·9–24·6)
Middle Eastand north Africa3·3% (95% CI 2·4–4·5)
West and central Africa23·5% (95% CI 19·8–27·5)
Asia Pacific4·4% (95% CI 1·4–9·0)
Western Europe2·4% (95% CI 1·6–3·3)
0–5·05·1–10·010·1–15·015·1–20·020·1–30·0>30·0No data meeting inclusion criteria
0–1·01·1–5·05·1–10·010·1–15·015·1–20·0>20·0No data meeting inclusion criteria
Figure 3: Global and regional prevalence of viral hepatitis in prison inmates, published between 2005 and 2015(A) Prevalence of HCV antibodies. (B) Prevalence of HBsAg.

Series
www.thelancet.com Published online July 14, 2016 http://dx.doi.org/10.1016/S0140-6736(16)30466-4 7
drugs who temporarily receptively share syringes during transient post-release period, which was assumed to last between 1 and 6 months (panel 4, appendix p 33). We quantified the contribution of discontinuation of antiretroviral treatment and temporary syringe sharing to cumulative HIV incidence in people who inject drugs for varying proportions of people who continue this high-risk behaviour for a transient period after release (figure 6). Antiretroviral treatment discontinuation was shown to contribute to less than 5% of cumulative HIV incidence during the epidemic, from epidemic onset to 2015 (figure 7A). This small contribution of discontinuation of antiretroviral treatment to HIV
incidence was due to the small proportion of HIV cases discontinuing antiretroviral treatment at a given time and the short duration of discontinuation.
Specifically, our results show that for people who inject drugs from communities with high HIV prevalence (over 20%), the relative contribution of antiretroviral treatment discontinuation to HIV transmission varies from 0·12% (95% credible interval [CrI] 0·02–0·62) to 0·15% (0·02–1·0), which depends on whether individuals who engage in temporary syringe sharing behaviour only do so during incarceration or continue to do so after release (figure 7A). In communities with moderate HIV prevalence (5–20%), the relative contribution of antiretroviral
North America
Latin America1977(95% CI 1347–2726)
Caribbean
WesternEurope
10–10001001–20002001–50005001–80008001–10 000>10 000No data meeting inclusion criteria
East and southern Africa5330 (95% CI 2066–9998)
Middle East and north AfricaWest and
central Africa2946(95% CI 2362–3591)
Asia Pacific1173 (95% CI 712–1747)
Eastern Europe and central Asia4903 (95% CI 1846–9321)
Figure 4: Global and regional prevalence of active tuberculosis in prison inmates, published between 2005 and 2015Data are per 100 000.
1998 1999 2000 2001 2002 2003 2004 2005 2006 2007 2008 2010 201220112009
500
0
1000
1500
2000
2500
3000
3500
4000
Incid
ence
per
100
000
per
son-
year
s
Year of data collection
Argentina
Australia (New South Wales)‡
Brazil (Rio Grande do Sul)*
Cameroon
Colombia (Medellin)
Colombia (Pereira)
Georgia (Tbilisi)*
Hong Kong
Israel† Macedonia
Romania
Uganda*
USA (Texas)* USA
Figure 5: Incidence of tuberculosis in prisons and closed settings*Cumulativeoverthisperiod.†Averageoverthisperiod.‡Estimatedannualrisk1996–2001.

Series
8 www.thelancet.com Published online July 14, 2016 http://dx.doi.org/10.1016/S0140-6736(16)30466-4
treatment discontinuation varies from 0·10% (0·01–1·1) to 0·23% (0·03–3·3), which also depends on whether individuals who engage in temporary sharing behaviour only do so while incarcerated (figure 7A). The contribution of temporary syringe sharing to HIV transmission varies from 7·0% (0·1–41·6) to 12·0% (0·5–51·8) in communities with high HIV prevalence, and from 5·8% (0·2–31·7) to
21·1% (0·4–53·0) in communities with moderate prevalence (figure 7B). The contribution of temporary syringe sharing to HIV transmission was higher in communities with lower HIV prevalence than in communities with high HIV prevalence (figure 7B).
To identify the contribution of each model parameter to the variability of temporary syringe sharing to HIV transmission, we calculated the partial rank correlation coefficients (PRCCs), which quantify the magnitude of increase or decrease of the value of an outcome measure predicted by the model as a given input model parameter varies.99
PRCCs indicated that the effect of temporary syringe sharing increases with the rate of re-incarceration for people who inject drugs, the proportion of people who inject drugs who share syringes in prison, and the risk of HIV transmission per episode of syringe sharing (appendix p 41). Conversely, the effect of temporary syringe sharing decreases with the proportion of people who inject drugs who share syringes outside prison, the mortality rate of people who inject drugs who do not have HIV, and the proportion of people who inject drugs and have never been incarcerated (appendix p 41). Given that the rate of first incarceration in people who inject drugs was defined as a non-monotonic functional relationship between the average non-HIV mortality rate for people who inject drugs and the proportion of people who inject drugs who have never been incarcerated (appendix p 33), we deduced from the PRCC results that the rate of first incarceration has a substantial contribution to the effect of temporary syringe sharing. However, that effect could not be captured by the PRCC analysis because of the non-monotonic relationship.
We assessed the effectiveness of three interventions in reducing HIV incidence after 5 years of initial implementation: the incarceration rate of people who inject drugs, prison-based opioid agonist therapy followed by post-release retention, and prison-based opioid agonist therapy followed by post-release opioid agonist therapy combined with antiretroviral treatment retention. We showed that lowering incarceration rates (both first-time incarceration and re-incarceration) by 10–50%, corresponding to a 4·6% (95% CrI 2·6–6·6) to 25·9% (16·9–35·4) reduction of incarcerated people who inject drugs over 5 years, could potentially reduce community-wide cumulative HIV incidence in people who inject drugs by 0·9% (–0·1 to 3·6) to 7·6% (0–26·5) over a 5-year period in communities with high HIV prevalence, and by 1·1% (0·1–3·1) to 15·4% (1·4–29·9) in communities with moderate HIV prevalence (appendix p 42). We found that prison-based opioid agonist therapy followed by post-release retention in treatment during the transitory period of elevated risk behaviour could reduce cumulative HIV incidence by 1·6% (95% CrI 0·1–7·3) for a 20% coverage and by 12·0% (1·4–45·3) as an upper bound of complete (100%) coverage in communities with high HIV prevalence. In
Panel 4: Mathematical model for HIV transmission in people who inject drugs
To assess the fundamental dynamics that govern the interplay between HIV transmission in people who inject drugs in the community and in prison around the world, we developed a deterministic compartmental model of drug injection transmission of HIV in the general community and incarcerated populations (figure 6). Individuals were structured in the model according to their HIV infection history, disease progression, and antiretroviral treatment status (1=susceptible, 2=acute infection, 3=latent infection with CD4 cell count ≥350 cells per µL, 4=latent infection with CD4 cell count <350 cells per µL, 5=pre-AIDS with elevated viraemia, 6=AIDS, 7=initiated antiretroviral treatment with CD4 cell count ≥350 cells per µL, 8=initiated antiretroviral treatment with low CD4 cell count or pre-AIDS, 9=initiated antiretroviral treatment with AIDS), incarceration status (1=currently incarcerated, 2=recently released [in the past 6 months], 3=previously incarcerated, 4=never incarcerated), and drug injection risk behaviour (1=people who do not inject drugs, 2=people who inject drugs who do not share syringes, 3=people who inject drugs who share syringes, 4=people who inject drugs and share syringes temporarily). As our analysis focused on HIV epidemics in people who inject drugs, we only considered injection drug use as transmission mode. Rather than focusing on a specific setting, we considered a wide range of scenarios by stratifying the rates of HIV transmission in people who inject drugs into communities with moderate HIV prevalence in people who inject drugs (ranging from 5% to 20%), and communities with high HIV prevalence in people who inject drugs (over 20%).93 Our model accounted for the elevated frequency of needle sharing in prison as well as discontinuation of antiretroviral treatment during a transitory period after prison release.31,94–97 We parameterise our model using epidemiological and clinical data from the scientific literature about HIV infectiousness, disease progression, demographic, injection drug behaviour data on the incarcerated population, proportion of people who inject drugs, syringe sharing in and out of prison, and incarceration history in people who inject drugs and people who do not share syringes (appendix p 33). To address empirical uncertainty regarding model parameters, we used a Bayesian inference approach to fit our model to epidemiological data of HIV prevalence in people who inject drugs in and out of prisons and HIV incidence in prison.
Given the scarcity of data on the impact of this post-release behaviour change on HIV transmission, we did a sensitivity analysis to evaluate the contribution of the frequency of post-release needle sharing and percentage discontinuation of antiretroviral treatment on HIV incidence in people who inject drugs in the community and in prison. We denoted people who inject drugs who share syringes while incarcerated as temporary sharers, a proportion of whom share for a transient duration after release, but not beyond. This post-release transient period of temporary syringe sharing and antiretroviral treatment discontinuation was assumed to vary between 1 and 6 months.31,95
Finally, we used the fitted model to evaluate the impact of demand reduction programmes, such as prison-based opioid agonist therapy followed by post-release retention, reduced rates of incarceration for non-violent drug users, and antiretroviral treatment retention in care post-release for curtailing HIV incidence in people who inject drugs. Consistent with empirical studies, we assumed that people who inject drugs who continue opioid agonist therapy after incarceration have a 20% (95% CI 10–30) reduced risk of re-incarceration while they are given treatment.98

Series
www.thelancet.com Published online July 14, 2016 http://dx.doi.org/10.1016/S0140-6736(16)30466-4 9
communities with moderate HIV prevalence, the reduction in HIV incidence is predicted to vary from 3·9% (0·9–13·4) for 20% coverage to 28·5% (9·4–57·5) for complete coverage (appendix p 42). Combining opioid agonist therapy with post-release antiretroviral treatment retention could achieve a further reduction of HIV incidence ranging from 0·3% to 1·8% in communities with high HIV prevalence and from 0·7% to 4·2% in communities with moderate HIV prevalence as coverage is expanded from 20% to 100% (appendix p 42).
Our estimates of the contribution of incarceration to HIV transmission and the potential effect of interventions depends on the general HIV prevalence in communities of people who inject drugs, which varies substantially between and within countries (figure 7, appendix p 42). Our results show that prison-based opioid agonist therapy followed with post-release retention could be an effective strategy for the reduction of HIV in people who inject drugs, at least in the short term (appendix p 42). Lowering the rate of incarceration of people who inject drugs might be effective in reducing HIV transmission in addition to opioid agonist therapy. The contribution of incarceration and effectiveness of intervention were higher in communities of lower HIV prevalence, where transmission because of incarceration is most substantial relative to that in the community, compared with communities with high HIV prevalence.
Summary of findingsThis Series paper provides clear evidence that the findings, replicated in many individual studies, that higher prevalence of HIV in individuals who are detained than in the population from which they arise, is almost universal. However, it also shows that the detailed epidemiology of HIV in people who are detained varies
A HIV infection diagram B Incarceration dynamics diagram C Subpopulation and incarceration impact diagram
Susceptible
Acute infection
Pre-AIDS
AIDS
Latent infection CD4 cell count ≥350
Latent infection CD4 cell count <350
Never incarcerated
Currently incarcerated
Recently released
Previously released
ART treatedPre-AIDS
ART treatedAIDS
ART treated
Non-PWID PWID non-sharers
PWID sharers
Community
Prison
Non-PWID PWID non-sharers
PWID sharers
Prison-induced riskProportion of non-sharers temporarily sharing in prison and in a 1–6 month transient post-release period
Incarceration rate for non-PWIDElevated incarceration rate for PWIDTemporal transition between sharers and non-sharers due to incarceration
Figure 6: Deterministic compartmental model of drug injection transmission of HIV in the general community and incarcerated populationsART=antiretroviral therapy. PWID=people who inject drugs.
0
1
2
3
4
Cont
ribut
ion
to H
IV in
ciden
ce (%
)
0 0·25 0·50 0·75 1·000
10
20
40
60
A
B
50
30
Cont
ribut
ion
to H
IV in
ciden
ce (%
)
Proportion of temporary sharers sharing syringe post-release
Moderate HIV prevalenceHigh HIV prevalence
Figure 7: Contribution of antiretroviral therapy discontinuation and temporary sharers to cumulative HIV incidence in people who inject drugs(A) Contribution of ART discontinuation. (B) Contribution of temporary sharers. Contribution accounts for transmission in prison and during the transitory period of elevated risk behaviour after release from prison. Contributions were evaluated relative to the scenario of no antiretroviral therapy discontinuation or no temporary sharers, and were assessed for a varying proportion of temporary sharers who share syringes after incarceration versus those who only share syringes while incarcerated, from epidemic onset to 2015. Bars show median (middle cross line) and range of contribution estimated for different HIV epidemics modelled (error bars show upper and lower 95% credible interval). Prevalence of HIV in people who inject drugs was varied from 5–20% (moderate prevalence communities) and 20–60% (high prevalence communities).

Series
10 www.thelancet.com Published online July 14, 2016 http://dx.doi.org/10.1016/S0140-6736(16)30466-4
considerably, reflecting the disease burden, the dominant mode of transmission in the population as a whole, and the role of incarceration. In most regions of the world, HIV prevalence is higher in detained women than detained men. However, although we have shown great variation in the pattern of HIV infection in prisons, the ability to draw general conclusions is limited by the scarcity of data, with data in some regions restricted to one or a few countries. The studies that do exist are often restricted to individual prisons (even subgroups of detainees in them) and are heterogeneous in reporting quality.
There are several reasons for the scarcity of data. First, many countries with the highest disease burden have very weak systems for health research and surveillance. Second, where health systems in prisons are organisationally separate from systems serving the general population, capacity that exists in prison systems might be deployed elsewhere. Consistent with the UN’s Mandela Rules, the WHO recommends that prisoner health care be consistent with community standards of care, and under the direction of the ministry of health.100 Third, secrecy and fear of exposing human rights abuses might cause governments to be unwilling to permit studies in their prisons, or if they are done, researchers are often prohibited from published results.101,102 Compulsory drug detention centres are a particular concern. In 2012, 12 UN agencies called for their immediate closure15 and since then, international funding for compulsory drug detention centres has stopped. However, they remain in operation in several regions, although largely hidden from those undertaking HIV surveillance.7
A particular problem is the scarcity of data on women detainees, even though they comprise about 10% of prison populations, they are more likely to have a substance abuse disorder, and are less likely to receive treatment than male prisoners.103
Most studies are cross-sectional, providing only snapshots of the situation at a particular moment in time. Cross-sectional studies, however, fail to capture the dynamic nature of the prison population, because the number of individuals passing through prisons each year can be up to three times higher than the estimated prison census. This discrepancy causes an especially important gap in our knowledge, given the role that the transition in and out of prison has in interruption of both antiretroviral treatment and opioid agonist therapy, with implications for both transmission and the emergence of drug-resistant HIV and tuberculosis infections.104
So what should be done to address the problem of HIV and related infections in prisons? One obvious response is to reduce the prison population, as our model showed. Measures that can reduce the population in detention include evidence-based treatment in and out of prison. Non-violent drug offenders and especially women15 should particularly be offered treatment, as an alternative, where appropriate.105 Our model further showed that
opioid agonist therapy given in prison can reduce HIV transmission within prison and reduce post-release HIV transmission.
Other infectious diseases might also be mitigated in prison settings. Interferon-free HCV therapies using direct-acting antiviral agents are rapidly becoming available and HCV treatment as prevention strategies, particularly in the prison setting, are now feasible.106 These treatments can produce 90–95% rates of HCV eradication.107
Routine screening and vaccination for HBV in prison settings108 is likely to produce considerable savings to the broader health system through prevention of cirrhosis of the liver and hepatocellular carcinoma,109 even though only around 5% of adults infected with HBV develop chronic infection110 because of the comparatively high prevalence in prison settings. Such programmes should be linked to a wider strategy to reduce HBV infection in countries where it is prevalent, through early childhood immunisation. A safe and efficacious vaccine for HBV has existed since 1986.111
A review of the evidence base for the management of tuberculosis and HIV and tuberculosis co-infection in prisons provides a useful framework including universal drug susceptibility testing, systematic screening of contacts in high-risk groups, access to high-quality treatment, and adequate coordination.112 Other specific measures include identification, isolation, and treatment of patients who are infected with tuberculosis as early as possible. In many countries, prisoners with symptoms suggestive of tuberculosis experience long delays in obtaining a diagnosis.113 Isolation of infectious prisoners is rare; many prisoners who are isolated might not receive treatment, and conditions are frequently appalling.114
Tuberculosis treatment completion rates in prisoners are often low, exacerbated by their movement within and in and out of the prison system. Prisoners in eastern Europe are unlikely to receive adequate treatment for HIV and tuberculosis.80 A study in Uganda found a default treatment prevalence of 12% in people staying in the same prison and 53% for those transferred to another prison, and 81% of prisoners who were on treatment and released were subsequently lost to follow-up.115
Pooled estimates of HIV prevalence and incidence, collected for the purpose of this review, were used to develop and calibrate a model for people who inject drugs for HIV transmission in and out of prison. Given that our focus was the evaluation of the contribution of incarceration to injection-related HIV transmission in people who inject drugs and the potential effect of interventions on the HIV epidemic in people who inject drugs, we did not address sexual, tattoo-related, or mother-to-child transmission of HIV. Inclusion of these transmission routes would further increase the predicted effect of the interventions considered by accounting for the substantial indirect benefits to people who do not

Series
www.thelancet.com Published online July 14, 2016 http://dx.doi.org/10.1016/S0140-6736(16)30466-4 11
inject drugs. Another limitation of our modelling analysis is the fact that the model was not developed for a specific setting; rather we investigated a range of plausible scenarios. This approach resulted in large uncertainty about model parameter values and model outcomes. Additionally, our model assumed constant antiretroviral treatment coverage during the course of the epidemic, which does not capture the effect of increased antiretroviral treatment coverage on HIV transmission. However, the effect of this assumption was mitigated by using a wide range of values for antiretroviral treatment coverage. Finally, our model was restricted to inmates who inject heroin, because most research and prevention has focused on these individuals.
ConclusionWe found a consistently higher prevalence of HIV, HCV, HBV, and tuberculosis in prisoners than in the general population across all regions and especially in imprisoned people who inject drugs.38,61,116 Interventions to prevent, identify, and treat these infections in prisons are poorly implemented, particularly in low-income and middle-income countries and in populations such as people who inject drugs, where care and treatment remain challenging in community settings. Investment in surveillance infrastructure is needed to improve country-level data on the prevalence of these infections and to inform policy and programmatic responses. This is particularly important in regions where injection drug use is increasing and the burden of HIV is already high. Mass incarceration of people who inject drugs is a key driver of the ever-growing population of prisoners. Decriminalising drug use and possession or providing alternatives to imprisonment for people who use drugs, and ensuring access to opioid agonist therapy, tuberculosis treatment, and antiretroviral treatment for prisoners will reduce the burden of these infections in the world’s prison population.ContributorsKD and CB developed the manuscript concept. ALW led the comprehensive search and data extraction and did the meta-analysis. KD developed the initial draft of the manuscript. BM wrote the sections on imprisonment data. BM and ALW calculated the number of inmates with each infection. JJA wrote the Compulsory Drug Detention Centres section. LM provided a revised structure for the manuscript, edited it, and addressed reviewers’ comments. MH analysed and wrote the section on incidence data. ALW, AG, MN-m, KD, and FLA conceived of the mathematical modelling analysis, MN-m conducted the mathematical modelling, and MN-m and AG wrote the modelling section. MM wrote the section on tuberculosis data and provided the final edit. SAK wrote the section on hepatitis B data. RC wrote the section on hepatitis C data. All authors had full access to the data, reviewed and edited the manuscript, and take responsibility for its integrity and the accuracy of the analysis.
Declaration of interestsWe declare no competing interests.
AcknowledgmentsThis paper was supported by grants to the Center for Public Health and Human Rights at Johns Hopkins Bloomberg School of Public Health from the National Institute on Drug Abuse; the Open Society Foundations; the United Nations Population Fund; Mac AIDS Fund;
the Bill & Melinda Gates Foundation; and the Johns Hopkins University Center for AIDS Research, a National Institute of Health (NIH)-funded programme 1P30AI094189. KD was supported by Australia’s National Drug and Alcohol Research Centre. RC is supported by a Cancer Institute New South Wales Early Career Research Fellowship (GNT14/ECF/1–46). SAK is supported by Australian National Health and Medical Research Council (NHMRC) Senior Research Fellowship (APP1078168). LM is supported by an NHMRC Senior Research Fellowship (APP1060443). The content is solely the responsibility of the authors and does not necessarily represent the official views of the NIH. We thank Lori Rosman, Informationist at Johns Hopkins School Medicine, who assisted with the development of the systematic review; Teresa Ping Yeh and Natalie Flath, Johns Hopkins School of Public Health, who reviewed the identified articles and extracted data for the systematic review and meta-analysis; and Mary Kumvaj, Librarian, National Drug and Alcohol Research Centre, University of New South Wales who assisted with the grey literature search. We thank colleagues at the UN Office on Drugs and Crime, the European Monitoring Centre for Drugs and Drug Addiction, WHO, Glasgow Caledonian University, Health Protection Surveillance Centre (Ireland), Luxembourg Division de l’Inspection Sanitaire, National Advisory Committee on Drugs and Alcohol (Ireland), The National AIDS Centre (Poland), Public Health Agency of Catalonia, Trimbos Instituut, The University of Texas at Austin, Brandon Marshall, Brown University School of Public Health, Anna Bowring, Burnet Institute, and The UK Collaborating Centre for WHO Health in Prisons who contributed relevant reports and articles to the comprehensive review.
References1 Wormser GP, Krupp LB, Hanrahan JP, Gavis G, Spira TJ,
Cunningham-Rundles S. Acquired immunodeficiency syndrome in male prisoners. New insights into an emerging syndrome. Ann Intern Med 1983; 98: 297–303.
2 Braun MM, Truman BI, Maguire B, et al. Increasing incidence of tuberculosis in a prison inmate population. Association with HIV infection. JAMA 1989; 261: 393–97.
3 Dolan K, Kite B, Black E, et al. HIV in prison in low-income and middle-income countries. Lancet Infect Dis 2007; 7: 32–41.
4 Gough E, Kempf MC, Graham L, et al. HIV and hepatitis B and C incidence rates in US correctional populations and high risk groups: a systematic review and meta-analysis. BMC Public Health 2010; 10: 777.
5 European Monitoring Centre for Drugs and Drug Addiction. Prisons and drugs in Europe: the problem and responses. Luxembourg: Publications Office of the European Union, 2012. http://www.emcdda.europa.eu/attachements.cfm/att_191812_EN_TDSI12002ENC.pdf (accessed Sept 1, 2015).
6 Kamarulzaman A, Reid S, Schwitters A, et al. Prevention of transmission of HIV, hepatitis B virus, hepatitis C virus, and tuberculosis in prisoners. Lancet 2016; published online July 14. http://dx.doi.org/10.1016/S0140-6736(16)30769-3.
7 Dolan K, Worth H, Wilson D. Compulsory treatment of drug users in Asia: designed to torture? Int J Prison Health 2015; 11: 255–68.
8 Colectivo por una Política Integral Hacia las Drogas. ¡Ay Padrino, no me ayudes! Abusos en centros de tratamiento con internamiento para usuarios de drogas in México. Mexico City, 2015. http://www.cupihd.org/portal/publicaciones_documentos/abuso-en-vez-de-asistencia-realidad-centros-tratamiento (accessed Sept 15, 2015).
9 Wolfe D. Death, drug treatment, and Christ’s love. Feb 14, 2012. https://www.opensocietyfoundations.org/voices/death-drug-treatment-and-christ-s-love (accessed Sept 15, 2015).
10 Open Society Foundation. Human rights abuses in the name of drug treatment: reports from the field. March, 2009. https://www.opensocietyfoundations.org/publications/human-rights-abuses-name-drug-treatment-reports-field (accessed Sept 15, 2015).
11 YouthRise, OSIWA, CiSHRWIN. We are people: the unintended consequences of the Nigerian drug law on the health and human rights of young people who use drugs. January, 2015. https://dl.dropboxusercontent.com/u/16336789/We-Are-People-Final.pdf (accessed Sept 15, 2015).
12 Messersmith L, Beard J, Adjei R, et al. HIV vulnerability of Men and women who inject drugs in Kumasi, Ghana. July 23, 2014. http://www.bu.edu/cghd/files/2014/10/PWID_Report_Final.pdf (accessed Sept 15, 2015).
Series
12 www.thelancet.com Published online July 14, 2016 http://dx.doi.org/10.1016/S0140-6736(16)30466-4
13 Human Rights Watch. “Like a death sentence”: abuses against persons with mental disabilities in Ghana. New York, NY: Human Rights Watch, 2012.
14 Vagenas P, Azbel L, Polonsky M, et al. A review of medical and substance use co-morbidities in Central Asian prisons: implications for HIV prevention and treatment. Drug Alcohol Depend 2013; 132 (suppl 1): S25–31.
15 United Nations. Joint statement on compulsory drug detention and rehabilitation centres. March, 2012. https://www.unodc.org/documents/southeastasiaandpacific/2012/03/drug-detention-centre/JC2310_Joint_Statement6March12FINAL_En.pdf (accessed Sept 15, 2015).
16 Amon J, Pearshouse R, Cohen J, Schleifer R. Compulsory drug detention centers in China, Cambodia, Vietnam, and Laos: health and human rights abuses. Health Hum Rights 2013; 15: 124–37.
17 Human Rights Watch. Skin on the cable: the illegal arrest, arbitrary detention and torture of people who use drugs in Cambodia. New York, NY: Human Rights Watch, 2010.
18 Pearshouse R. “Patients, not criminals”? An assessment of Thailand’s compulsory drug dependence treatment system. HIV AIDS Policy Law Rev 2009; 2009: 11–17.
19 Cohen JE, Amon JJ. Health and human rights concerns of drug users in detention in Guangxi Province, China. PLoS Med 2008; 5: e234.
20 Amon JJ, Pearshouse R, Cohen JE, Schleifer R. Compulsory drug detention in East and Southeast Asia: evolving government, UN and donor responses. Int J Drug Policy 2014; 25: 13–20.
21 Fu JJ, Bazazi AR, Altice FL, Mohamed MN, Kamarulzaman A. Absence of antiretroviral therapy and other risk factors for morbidity and mortality in Malaysian compulsory drug detention and rehabilitation centers. PLoS One 2012; 7: e44249.
22 Walmsley R. World prison population list (tenth addition). London: International Centre for Prison Studies, 2013. http://www.prisonstudies.org/sites/default/files/resources/downloads/wppl_10.pdf (accessed Dec 21, 2015).
23 Drucker E. Population impact of mass incarceration under New York’s Rockefeller drug laws: an analysis of years of life lost. J Urban Health 2002; 79: 434–35.
24 Maruschak LM. HIV in prisons, 2001–2010. US Department of Justice, Bureau of Justice Statistics, September, 2012. http://www.bjs.gov/content/pub/pdf/hivp10.pdf (accessed Sept 1, 2015).
25 UNAIDS. UNAIDS report on the global AIDS epidemic, 2010. Geneva: Joint United Nations Programme on HIV/AIDS, 2010. http://www.unaids.org/globalreport/documents/20101123_GlobalReport_full_en.pdf (accessed Sept 1, 2015).
26 Westergaard RP, Kirk GD, Richesson DR, Galai N, Mehta SH. Incarceration predicts virologic failure for HIV-infected injection drug users receiving antiretroviral therapy. Clin Infect Dis 2011; 53: 725–31.
27 Genberg BL, Astemborski J, Vlahov D, Kirk GD, Mehta SH. Incarceration and injection drug use in Baltimore, Maryland. Addiction 2015; 110: 1152–59.
28 Adimora A, Schoenbach V, Stancil T, et al. Incarceration and heterosexual HIV infection among rural African Americans 7th Conference on Retroviruses and Opportunistic Infections; San Fransico, CA; Jan 30–Feb 2, 2000. 486.
29 Tyndall MW, Currie S, Spittal P, et al. Intensive injection cocaine use as the primary risk factor in the Vancouver HIV-1 epidemic. AIDS 2003; 17: 887–93.
30 Allen EJ, Palmateer NE, Hutchinson SJ, Cameron S, Goldberg DJ, Taylor A. Association between harm reduction intervention uptake and recent hepatitis C infection among people who inject drugs attending sites that provide sterile injecting equipment in Scotland. Int J Drug Policy 2012; 23: 346–52.
31 Cepeda JA, Niccolai LM, Lyubimova A, Kershaw T, Levina O, Heimer R. High-risk behaviors after release from incarceration among people who inject drugs in St. Petersburg, Russia. Drug Alcohol Depend 2015; 147: 196–202.
32 Spaulding AC, Sharma A, Messina LC, Zlotorzynska M, Miller L, Binswanger IA. A comparison of liver disease mortality with HIV and overdose mortality among Georgia prisoners and releasees: a 2-decade cohort study of prisoners incarcerated in 1991. Am J Public Health 2015; 105: e51–57.
33 Open Society Foundations. Improving health in pretrial detention: pilot interventions and the need for evaluation. May, 2011. https://www.opensocietyfoundations.org/sites/default/files/pretrial-detention-health-20110531.pdf (accessed June 8, 2016).
34 Stuckler D, Basu S, McKee M, King L. Mass incarceration can explain population increases in TB and multidrug-resistant TB in European and central Asian countries. Proc Natl Acad Sci USA 2008; 105: 13280–85.
35 Rubenstein LS, Amon JJ, McLemore M, et al. HIV, prisoners, and human rights. Lancet 2016; published online July 14. http://dx.doi.org/10.1016/S0140-6736(16)30663-8.
36 Telisinghe L, Charalambous S, Topp SM, et al. HIV and tuberculosis in prisons in sub-Saharan Africa. Lancet 2016; published online July 14. http://dx.doi.org/10.1016/S0140-6736(16)30578-5.
37 UNAIDS. Countries. 2013. http://www.unaids.org/en/regionscountries/countries/ (accessed July 1, 2014).
38 UNAIDS. UNAIDS report on the AIDS global epidemic 2013 (appendix). Geneva: Joint United Nations Programme on HIV/AIDS, 2013.
39 Azbel L, Wickersham JA, Grishaev Y, Dvoryak S, Altice FL. Burden of infectious diseases, substance use disorders, and mental illness among Ukrainian prisoners transitioning to the community. PLoS One 2013; 8: e59643.
40 Beyrer C, Baral SD, van Griensven F, et al. Global epidemiology of HIV infection in men who have sex with men. Lancet 2012; 380: 367–77.
41 Aceijas C, Stimson GV, Hickman M, Rhodes T. Global overview of injecting drug use and HIV infection among injecting drug users. AIDS 2004; 18: 2295–303.
42 Dolan K, Moazen B, Noori A, Rahimzadeh S, Farzadfar F, Hariga F. People who inject drugs in prison: HIV prevalence, transmission and prevention. Int J Drug Policy 2015; 26 (suppl 1): S12–15.
43 Choopanya K, Des Jarlais DC, Vanichseni S, et al. Incarceration and risk for HIV infection among injection drug users in Bangkok. J Acquir Immune Defic Syndr 2002; 29: 86–94.
44 Choopanya K, Vanichseni S, Des Jarlais DC, et al. Risk factors and HIV seropositivity among injecting drug users in Bangkok. AIDS 1991; 5: 1509–13.
45 Caplinskiene I, Caplinskas S, Griskevicius A. Narcotic abuse and HIV infection in prisons. Medicina (Kaunas) 2003; 39: 797–803 (in Lithuanian).
46 Bobrik A, Danishevski K, Eroshina K, McKee M. Prison health in Russia: the larger picture. J Public Health Policy 2005; 26: 30–59.
47 Farnia M, Ebrahimi B, Shams A, Zamani S. Scaling up methadone maintenance treatment for opioid-dependent prisoners in Iran. Int J Drug Policy 2010; 21: 422–24.
48 Gunchenko A, Kozhan N. HIV infection in the penitentiaries of Ukraine. Zh Mikrobiol Epidemiol Immunobiol 1999; 1: 31–33.
49 Dana D, Zary N, Peyman A, Behrooz A. Risk prison and hepatitis B virus infection among inmates with history of drug injection in Isfahan, Iran. ScientificWorldJournal 2013; 2013: 735761.
50 Dolan K, Hall W, Wodak A, Gaughwin M. Evidence of HIV transmission in an Australian prison. Med J Aust 1994; 160: 734.
51 Taylor A, Goldberg D, Emslie J, et al. Outbreak of HIV infection in a Scottish prison. BMJ 1995; 310: 289–92.
52 Hutchinson SJ, Goldberg DJ, Gore SM, et al. Hepatitis B outbreak at Glenochil prison during January to June 1993. Epidemiol Infect 1998; 121: 185–91.
53 O’Sullivan BG, Levy MH, Dolan KA, et al. Hepatitis C transmission and HIV post-exposure prophylaxis after needle-and syringe-sharing in Australian prisons. Med J Aust 2003; 178: 546–49.
54 Centers for Disease Control and Prevention. Hepatitis B outbreak in a state correctional facility, 2000. MMWR Morb Mortal Wkly Rep 2001; 50: 529–32.
55 Centers for Disease Control and Prevention. Transmission of hepatitis B virus in correctional facilities—Georgia, January 1999–June 2002. MMWR Morb Mortal Wkly Rep 2004; 53: 678–81.
56 Khan AJ, Simard EP, Bower WA, et al. Ongoing transmission of hepatitis B virus infection among inmates at a state correctional facility. Am J Public Health 2005; 95: 1793–99.
57 Sosa LE, Lobato MN, Condren T, Williams MN, Hadler JL. Outbreak of tuberculosis in a correctional facility: consequences of missed opportunities. Int J Tuberc Lung Dis 2008; 12: 689–91.
58 Commonwealth of Australia. Return on investment in needle and syringe programs in Australia. Canberra: Commonwealth Department of Health and Aging, 2002.

Series
www.thelancet.com Published online July 14, 2016 http://dx.doi.org/10.1016/S0140-6736(16)30466-4 13
59 Hagan H, Des Jarlais DC. HIV and HCV infection among injecting drug users. Mt Sinai J Med 2000; 67: 423–28.
60 Alter MJ. Epidemiology of viral hepatitis and HIV co-infection. J Hepatol 2006; 44 (suppl 1): S6–S9.
61 Schweitzer A, Horn J, Mikolajczyk RT, Krause G, Ott JJ. Estimations of worldwide prevalence of chronic hepatitis B virus infection: a systematic review of data published between 1965 and 2013. Lancet 2015; 386: 1546–55.
62 Reekie JM, Levy MH, Richards AH, et al. Trends in HIV, hepatitis B and hepatitis C prevalence among Australian prisoners—2004, 2007, 2010. Med J Aust 2014; 200: 277–80.
63 Sacchi F, Praça R, Tatara M, et al. Prisons as reservoir for community transmission of tuberculosis, Brazil. Emerg Infect Dis 2015; 21: 452–55.
64 Noeske J, Kuaban C, Amougou G, Piubello A, Pouillot R. Pulmonary tuberculosis in the Central Prison of Douala, Cameroon. East Afr Med J 2006; 83: 25–30.
65 Noeske J, Mbondi Mfondih S, Kuaban C. Surveillance of HIV infection in new prison entries in Cameroon, 2008–10. 6th IAS Conference on HIV Pathogenesis and Treatment; Rome; July 17–20, 2011. MOPE296.
66 Diendere EA, Tieno H, Bognounou R, et al. Prevalence and risk factors associated with infection by human immunodeficiency virus, hepatitis B virus, syphilis and bacillary pulmonary tuberculosis in prisons in Burkina Faso. Med Trop (Mars) 2011; 71: 464–67 (in French).
67 Baussano I, Williams BG, Nunn P, Beggiato M, Fedeli U, Scano F. Tuberculosis incidence in prisons: a systematic review. PLoS Med 2010; 7: e1000381.
68 Ministerio del Interior, Secretaria General de Instituciones Penitenciarias. Prevalencia de las infecciones VIH y VHC en instituciones penitentciarias 2014. Madrid: Ministerio del Interior, 2015.
69 Luciani F, Bretana NA, Teutsch S, et al. A prospective study of hepatitis C incidence in Australian prisoners. Addiction 2014; 109: 1695–706.
70 Taylor A, Munro A, Allen E, et al. Low incidence of hepatitis C virus among prisoners in Scotland. Addiction 2013; 108: 1296–304.
71 Macalino GE, Vlahov D, Sanford-Colby S, et al. Prevalence and incidence of HIV, hepatitis B virus, and hepatitis C virus infections among males in Rhode Island prisons. Am J Public Health 2004; 94: 1218–23.
72 Marco A, Gallego C, Cayla JA. Incidence of hepatitis C infection among prisoners by routine laboratory values during a 20-year period. PLoS One 2014; 9: e90560.
73 Castaneda-Hernandez DM, Martinez-Ramirez JE, Bolivar-Mejia A, Rodriguez-Morales AJ. Differences in TB incidence between prison and general populations, Pereira, Colombia, 2010–2011. Tuberculosis (Edinb) 2013; 93: 275–76.
74 Rueda ZV, Lopez L, Velez LA, et al. High incidence of tuberculosis, low sensitivity of current diagnostic scheme and prolonged culture positivity in four colombian prisons. A cohort study. PLoS One 2013; 8: e80592.
75 Hariga F. Evaluation and recommendations for the improvement of the health programmes, including for the prevention and treatment of drug dependence and of HIV and AIDS, implemented in the establishments under the responsibility of the Federal Penitentiary Service in Argentina: a follow-up of the 2008 assessment. Vienna: United Nations Office on Drugs and Crime, 2011.
76 Wong MY, Leung CC, Tam CM, Kam KM, Ma CH, Au KF. TB surveillance in correctional institutions in Hong Kong, 1999–2005. Int J Tuberc Lung Dis 2008; 12: 93–98.
77 Poposka BI, Zakoska M, Atanasova S, Milanovski N, Doneva P. Tuberculosis in prisons in the Republic of Macedonia. Eur Respir J 2013; 42 (suppl 57): 3903 (abstr).
78 Cioran N, Popescu G, Mihailescu L, Didilescu C, Cocei H, Chiotan D. TB among prisoners in Romania, 2009–2011. Eur Respir J 2013; 42 (suppl 57): 4039 (abstr).
79 Miller TL, Hilsenrath P, Lykens K, McNabb SJ, Moonan PK, Weis SE. Using cost and health impacts to prioritize the targeted testing of tuberculosis in the United States. Ann Epidemiol 2006; 16: 305–12.
80 Altice F, Azbel L, El-Bassel N, et al. The perfect storm: incarceration and the high-risk environment perpetuating transmission of HIV, hepatitis C virus, and tuberculosis in Eastern Europe and Central Asia. Lancet 2016; published online July 14. http://dx.doi.org/10.1016/S0140-6736(16)30856-X.
81 Adjei AA, Armah HB, Gbagbo F, et al. Correlates of HIV, HBV, HCV and syphilis infections among prison inmates and officers in Ghana: a national multicenter study. BMC Infect Dis 2008; 8: 33.
82 Pourahmad M, Javady A, Karimi I, Ataei B, Kassaeian N. Seroprevalence of and risk factors associated with hepatitis B, hepatitis C, and human immunodeficiency virus among prisoners in Iran. Infect Dis Clin Pract 2007; 15: 368–72.
83 Adoga MP, Banwat EB, Forbi JC, et al. Human immunonodeficiency virus, hepatitis B virus and hepatitis C virus: sero-prevalence, co-infection and risk factors among prison inmates in Nasarawa State, Nigeria. J Infect Dev Ctries 2009; 3: 539–47.
84 Beckwith C, Rick J, Flanigan T, et al. Routine jail-based HIV testing—Rhode Island, 2000–2007. MMWR Morb Mortal Wkly Rep 2010; 59: 742–45.
85 Begier EM, Bennani Y, Forgione L, et al. Undiagnosed HIV infection among New York City jail entrants, 2006: results of a blinded serosurvey. J Acquir Immune Defic Syndr 2010; 54: 93–101.
86 Burt RD, Thiede H, Barash ET, Sabin K. Recent condom use by arrested injection drug users in King County, Washington, USA. Int J Drug Policy 2006; 17: 222–29.
87 Javanbakht M, Murphy R, Harawa NT, et al. Sexually transmitted infections and HIV prevalence among incarcerated men who have sex with men, 2000–2005. Sex Transm Dis 2009; 36 (suppl 2): S17–21.
88 MacGowan R, Margolis A, Richardson-Moore A, et al. Voluntary rapid human immunodeficiency virus (HIV) testing in jails. Sex Transm Dis 2009; 36 (suppl 2): S9–13.
89 Rosen DL, Schoenbach VJ, Wohl DA, White BL, Stewart PW, Golin CE. Characteristics and behaviors associated with HIV infection among inmates in the North Carolina prison system. Am J Public Health 2009; 99: 1123–30.
90 VanHandel M, Beltrami JF, MacGowan RJ, Borkowf CB, Margolis AD. Newly identified HIV infections in correctional facilities, United States, 2007. Am J Public Health 2012; 102 (suppl 2): S201–04.
91 Javanbakht M, Boudov M, Anderson LJ, et al. Sexually transmitted infections among incarcerated women: findings from a decade of screening in a Los Angeles County Jail, 2002–2012. Am J Public Health 2014; 104: e103–09.
92 Fox RK, Currie SL, Evans J, et al. Hepatitis C virus infection among prisoners in the California State correctional system. Clin Infect Dis 2005; 41: 177–86.
93 Beyrer C, Malinowska-Sempruch K, Kamarulzaman A, Kazatchkine M, Sidibe M, Strathdee SA. Time to act: a call for comprehensive responses to HIV in people who use drugs. Lancet 2010; 376: 551–63.
94 Milloy MJ, Buxton J, Wood E, Li K, Montaner JS, Kerr T. Elevated HIV risk behaviour among recently incarcerated injection drug users in a Canadian setting: a longitudinal analysis. BMC Public Health 2009; 9: 156.
95 Wood E, Li K, Small W, Montaner JS, Schechter MT, Kerr T. Recent incarceration independently associated with syringe sharing by injection drug users. Public Health Rep 2005; 120: 150–56.
96 Althoff AL, Zelenev A, Meyer JP, et al. Correlates of retention in HIV care after release from jail: results from a multi-site study. AIDS Behav 2013; 17 (suppl 2): S156–70.
97 Iroh PA, Mayo H, Nijhawan AE. The HIV care cascade before, during, and after incarceration: a systematic review and data synthesis. Am J Public Health 2015; 105: e5–16.
98 Larney S, Toson B, Burns L, Dolan K. Effect of prison-based opioid substitution treatment and post-release retention in treatment on risk of re-incarceration. Addiction 2012; 107: 372–80.
99 Marino S, Hogue IB, Ray CJ, Kirschner DE. A methodology for performing global uncertainty and sensitivity analysis in systems biology. J Theor Biol 2008; 254: 178–96.
100 United Nations Office on Drugs and Crime, WHO (Europe). Good governance for prison health in the 21st century. A policy brief on the organization of prison health. Copenhagen: World Health Organization, 2013.
101 Thomson N, Reid G, Dolan K. Examining HIV, drug use and risk behaviours: a case study in the custodial settings of Thailand and Indonesia. Int J Prison Health 2009; 5: 180–91.
102 Avelino F, Feliciano J, Macabaya A. HIV, hepatitis B, hepatitis C and syphilis among inmates in Cebu City Jails, Philippines: seroprevalence and risk behaviours. Manila: Philippine National AIDS Council, Department of Health, 2014.

Series
14 www.thelancet.com Published online July 14, 2016 http://dx.doi.org/10.1016/S0140-6736(16)30466-4
103 Strathdee SA, West BS, Reed E, Moazan B, Azim T, Dolan K. Substance use and HIV among female sex workers and female prisoners: risk environments and implications for prevention, treatment, and policies. J Acquir Immune Defic Syndr 2015; 69: S110–17.
104 Beyrer C, Kamarulzaman A, McKee M, for the Lancet HIV in Prisoners Group. Prisoners, prisons, and HIV: time for reform. Lancet 2016; published online July 14. http://dx.doi.org/10.1016/S0140-6736(16)30829-7.
105 United Nations Office on Drugs and Crime. Handbook of basic principles and promising practices on Alternatives to Imprisonment. Vienna: United Nations Office on Drugs and Crime, 2007.
106 Martin NK, Vickerman P, Dore GJ, Hickman M. The hepatitis C virus epidemics in key populations (including people who inject drugs, prisoners and MSM): the use of direct-acting antivirals as treatment for prevention. Curr Opin HIV AIDS 2015; 10: 374–80.
107 Naggie S, Cooper C, Saag M, et al. Ledipasvir and sofosbuvir for HCV in patients coinfected with HIV-1. N Engl J Med 2015; 373: 705–13.
108 Shamliyan TA, Johnson JR, MacDonald R, et al. Systematic review of the literature on comparative effectiveness of antiviral treatments for chronic hepatitis B infection. J Gen Intern Med 2011; 26: 326–39.
109 Pisu M, Meltzer MI, Lyerla R. Cost-effectiveness of hepatitis B vaccination of prison inmates. Vaccine 2002; 21: 312–21.
110 Nelson PK, Mathers BM, Cowie B, et al. Global epidemiology of hepatitis B and hepatitis C in people who inject drugs: results of systematic reviews. Lancet 2011; 378: 571–83.
111 WHO. Hepatitis B vaccines WHO position paper. Geneva: World Health Organization, 2009.
112 Dara M, Acosta CD, Melchers NV, et al. Tuberculosis control in prisons: current situation and research gaps. Int J Infect Dis 2015; 32: 111–17.
113 Todrys KW, Amon JJ. Criminal justice reform as HIV and TB prevention in African prisons. PLoS Med 2012; 9: e1001215.
114 Todrys KW, Amon JJ, Malembeka G, Clayton M. Imprisoned and imperiled: access to HIV and TB prevention and treatment, and denial of human rights, in Zambian prisons. J Int AIDS Soc 2011; 14: 8.
115 Schwitters A, Kaggwa M, Omiel P, Nagadya G, Kisa N, Dalal S. Tuberculosis incidence and treatment completion among Ugandan prison inmates. Int J Tuberc Lung Dis 2014; 18: 781–86.
116 WHO. Global tuberculosis report. Geneva: World Health Organization, 2015.

Supplementary appendixThis appendix formed part of the original submission and has been peer reviewed. We post it as supplied by the authors.
Supplement to: Dolan K, Andrea L W, Moazen B, et al. Global burden of HIV, viral hepatitis, and tuberculosis in prisoners and detainees. Lancet 2016; published online July 14. http://dx.doi.org/10.1016/S0140-6736(16)30466-4.

1
Global burden of HIV, viral hepatitis and tuberculosis among prisoners and detainees
Authors: Kate Dolan, PhD; Andrea L Wirtz, PhD; Babak Moazen, MsCIH; Alison Galvani,
PhD; Martial Ndeffo-mbah, PhD; Stuart Kinner, PhD; Ryan Courtney, PhD; Martin Mckee, DSc;
Joseph J Amon, PhD; Lisa Maher, PhD; Margaret Hellard, PhD; Chris Beyrer, MD.; Fredrick
Altice, MD
Web Supplementary Appendix
Table of Contents
A1. Comprehensive search methods and meta-analysis ................................................................................................ 2
A2. Search strategy & terms .......................................................................................................................................... 4
A3. PRISMA search diagram ........................................................................................................................................ 7
A4. Prevalence data located for HIV, HCV, HBV TB and HIV/TB co infection among prison populations, published
between 2005-2015........................................................................................................................................................ 8
A5. National and regional HIV prevalence among prison populations, published between 2005-2015 ....................... 9
A6. National and regional estimates of anti-HCV prevalence among prison populations, published between 2005-
2015 ............................................................................................................................................................................. 15
A7. National and regional prevalence of HBV among prison populations, published between 2005-2015 ................ 20
A8. National and regional prevalence of active tuberculosis, published between 2005-2015 ..................................... 24
A9. HIV/TB Co-infection among prison populations, published 2005 - 2015 ............................................................ 27
A10. Infectious disease prevalence among imprisoned people who inject drugs, published 2005-2015 ................... 28
A11. HIV and viral hepatitis among inmates in Compulsory Drug Detention Centers (CDDCs) published between
2005 - 2015 .................................................................................................................................................................. 31
A12. Incidence of HIV and viral hepatitis among prisoners, published 2005 – 201592,97,162,279,280 .............................. 32
A13. Modeling the interplay between prison and community HIV transmission among PWIDs ............................... 33
A14. Partial rank correlation coefficients (PRCCs) of model parameters. .................................................................. 41
A15. Model Results: Effect of different incarceration-based interventions on HIV incidence after 5 years. .............. 42
Web Appendix References: ......................................................................................................................................... 43

2
A1. Comprehensive search methods and meta-analysis
Our search focused on identifying recent studies that utilized biologic measures to assess prevalence and/or
incidence of HIV, HCV, HBV, TB, and co-infections among people living in prisons and other closed facilities. The
search strategy was developed in collaboration with an informationist at Johns Hopkins University. Searches
followed controlled vocabulary and keywords, which were used in combination for the concepts of HIV, HCV,
HBV, TB, prisons, jail, and compulsory drug detention. Index specific terms are provided in Web Appendix 2
(below). We searched Pubmed, Embase, CINAHL, and Criminal Justice Abstracts with Full Text to identify peer
reviewed publications that published in any language from January 1, 2005 through July 15, 2015. Identified
publications were compiled in Refworks reference manager (version 2.0, ProQuest, Ann Arbor, MI) and duplicates
were removed. Additional reports published between 2005 and 2015 by the World Health Organization and the UN
Office on Drug and Crime were identified and also included in the literature review. Identified literature was then
independently reviewed by two research assistants, with faculty oversight and final determination, for eligibility
using a title and abstract review followed by a full text review of publications with data abstraction. Supplementary
Web Appendix 3 provides the PRISMA search flow diagram.
In the instance that no data was extracted from the systematic review search for countries on either HIV, HCV,
HBV, or TB in prisons and other closed settings, the authors called for papers and reports through potential grey
literature sources and via an email request sent to experts and researchers from the UN and/or working or affiliated
with prison systems. This invitation email requested further data on either HIV, HCV, HBV or TB from each
country. Emails were sent in October-November, 2015. In the first instance we searched the prisonstudies.org
website for email contact details of the Prison/Corrective Services Department for each country. If there was an
email contact listed, they were emailed an invitation letter. Additionally, when no Prison Department or Correct
Service contact was listed on the prisonstudies.org website we searched Google to ensure a Prison/Corrective
Services contact was ascertained and sent an email for each country, whenever possible. We also searched Google
for email contacts relevant to Health Department’s in each country and sent emails to not-for-profit/NGO agencies,
where relevant in each country. At a minimum one email was sent per country with an upper limit of five emails
sent. This call for data yielded only 17 countries that provided data and this was from the Barbados, Dominican
Republic, Estonia, Ethiopia, Ireland, Japan, Latvia, Lithuania, Luxembourg, Netherlands, the Philippines, Ukraine,
United Kingdom, Catalonia, Spain, Tanzania and Zanzibar,. In addition, we received an email alert from the
Correctional Services Department in Hong Kong and the French Monitoring Center for Drugs and Drug Addiction
in France indicating that our request was receiving attention but only electronic links or bibliography to national
surveillance were provided. Data from Catalonia were excluded due to language, from Dominican Republic due to
lack of HIV and other infectious disease data.
Peer reviewed publications and reports were included if the article met all of the following criteria: original /
primary research; study of any design that included individuals living in prisons, detention facilities, correctional
facilities, jails, compulsory drug detention/rehabilitation, and forced labor camps; included biologically confirmed
HIV, HCV, HBV, and/or TB infection; were published in a peer-reviewed journal or presented as an abstract at a
scientific conference after January 1, 2005. Data from all countries and settings that were published in were included
and there were no language restrictions used during the search. The following types of studies were excluded from
the review if they include any one of the following characteristics: case studies of one patient/participant; studied of
individuals in voluntary drug treatment/ rehabilitation/detox programs; studied individuals who were formerly
prisoners but have been outside of the prison setting for some period of time; included only self-reported HIV, HCV,
HBV, or TB diagnoses with no biologic test results; or were secondary publications (reviews, commentaries).
We extracted key data from articles that were published in English, Russian, Spanish, and French and were
independently determined to be eligible for inclusion following full text review. Abstracted data were specific to
publication data (year of publication, author); study data (geographical location and setting, year(s) of conduct,
study design, sampling or recruitment method, facility type, and diagnostic method(s); and total and gender-specific
prison population prevalence and incidence for each disease of interest (total sample size (N), gender, total cases of
infection or new infections (n), reported prevalence (%), reported incidence rate, % co-infection).
Data were analysed according to infection by total population and in disaggregated form by gender and key
population sub-group. Pooled estimates were calculated to produce country (included in maps) and regional level
estimates for each infection. Analyses were conducted in Stats Direct 3 using a meta-analysis with random effects

3
that incorporates inverse double arcsine square root to calculate the pooled prevalence estimates. Given the
expected heterogeneity between studies, all meta-analyses were performed using random effects models, which
account for interstudy variation. Heterogeneity was assessed using the I2 statistic, which describes the percentage of
variation between studies that is due to heterogeneity rather than chance. Scarcity of data precluded pooled
estimates for key population subgroup, however, data for PWID was substantial enough to summarize but not pool.
We present the summarized data for PWID by country and the available data nonetheless provide insights into the
increased burden of infectious disease among imprisoned PWID (Web Appendix 10).

4
A2. Search strategy & terms
Search terms for PUBMED:
#1 HIV
HIV [MeSH] OR "Acquired Immunodeficiency Syndrome Virus"[MeSH] OR "AIDS-Related Complex"[MeSH]
OR "AIDS-Related Opportunistic Infections"[MeSH] OR "HIV Infections"[MeSH] OR "HIV
Seropositivity"[MeSH] OR "AIDS-Related Complex"[MeSH] OR "HIV Seroprevalence"[MeSH] OR "HIV-
1"[MeSH] OR "HIV-2"[MeSH] OR “human immunodeficiency virus" [tw] OR “human immune deficiency virus"
OR HIV[tw] OR “HIV/AIDS”[tw] OR “HIV-infected”[tw] OR AIDS [tw]
#2 HCV
“Hepatitis C”[MesH] OR “Hepatitis C virus” [MeSH] OR “HCV”[tw] OR “Hepatitis C”[tw] OR “liver fibrosis”[tw]
OR “viral hepatitis” [tw]
#3 HBV
“Hepatitis B”[MesH] OR “Hepatitis B virus” [MeSH] OR “HBV”[tw] OR “Hepatitis B”[tw]
#4 TB
Tuberculosis [MeSH] OR “Mycobacterium tuberculosis”[MeSH] OR “Mycobacterium tuberculosis” [tw] OR
Tuberculosis [tw] OR “TB”[MeSH] OR “MDR-TB”[tw] OR “XDR-TB”[tw] OR “Mtb”[tw]
#5 Prison
Prisons [MeSH] OR Prisoners [MeSH] OR Criminals [MesH] OR Prison* [tw] OR "Concentration Camps" [MeSH]
OR Incarcerat* [tw] OR Penitentiar* [tw] OR imprison* [tw] OR penal institute* [tw] OR Jail* [tw] OR inmate*
[tw] OR "Correctional setting" [tw] OR "Correctional settings" [tw] OR detain*[tw] OR detention* [tw] OR
"Correctional Centre" [tw] OR "Correctional Centres" [tw] OR incarcerat* [tw] OR inmate* [tw]
#6 Compulsory Drug Detention Centers
“compulsory drug detention center” [tw] “compulsory drug detention” [tw] OR “compulsory drug treatment” OR
compulsory rehabil* OR “correction center” [tw] correction* facilit* [tw] OR “re-education through labor” [tw]
“laojiaosuo”[tw] OR “long-term detention” [tw] OR labor camp* [tw]
(#1 OR #2 OR #3 OR #4) AND (#5 OR #6)
Search terms for Embase
#1 HIV
'Human immunodeficiency virus'/exp OR 'acquired immune deficiency syndrome'/exp OR 'AIDS related
complex'/exp OR ‘AIDS-Related Opportunistic Infections’ OR 'Human immunodeficiency virus infection'/exp OR
‘HIV Seropositivity’ OR ‘AIDS-Related Complex’ OR ‘HIV Seroprevalence’ OR 'Human immunodeficiency virus
1'/exp OR 'Human immunodeficiency virus 2'/exp OR 'human immune deficiency virus' OR ‘HIV’ OR ‘HIV/AIDS’
OR ‘HIV-infected’ OR ‘AIDS’
#2 HCV
'hepatitis C'/exp OR 'Hepatitis C virus'/exp OR ‘HCV’ OR (Hepatitis NEXT/1 C) OR (liver NEXT/1 fibrosis) OR
(viral NEXT/1 hepatitis)
#3 HBV
'hepatitis B'/exp OR 'Hepatitis B virus'/exp OR ‘HBV’ OR (Hepatitis NEXT/1 B)
#4 TB
'tuberculosis'/exp OR 'Mycobacterium tuberculosis'/exp OR 'drug resistant tuberculosis'/exp OR 'extensively drug
resistant tuberculosis'/exp OR (Mycobacterium NEXT/1 tuberculosis) OR ‘Tuberculosis’ OR ‘TB’ OR ‘MDR-TB’
OR ‘XDR-TB’ OR ‘Mtb’

5
#5 Prison
'prison'/exp OR 'prisoner'/exp OR 'offender'/exp OR Prison* OR (Concentration NEXT/1 Camp*) OR Incarcerate*
OR Penitentiar* OR imprison* OR (penal NEXT/1 institute*) OR Jail* OR inmate* OR (Correctional AND
setting*) OR detain* OR detention* OR (Correctional AND Centre*) OR inmate*
#6 Compulsory Drug Detention Centers
'detention camp'/exp OR ‘compulsory drug detention’ OR ‘compulsory drug detention’ OR ‘compulsory drug
treatment’ OR (compulsory NEXT/1 rehabil*) OR (correction* AND center*) OR (correction* NEXT/1 facilit*)
OR ‘re-education through labor’ OR ‘laojiaosuo’ OR (‘long-term’ NEXT/1 detention) OR (labor NEXT/1 camp*)
(#1 OR #2 OR #3 OR #4) AND (#5 OR #6)
Search terms for CINAHL
#1 HIV
MH “Human immunodeficiency virus” OR MH “HIV-1” OR MH “AIDS Serodiagnosis” OR MH “HIV Infections”
OR MH “HIV Seropositivity” OR MH “Acquired Immunodeficiency Syndrome” OR TX “acquired immune
deficiency syndrome” OR TX “AIDS related complex” OR TX “AIDS-Related Opportunistic Infections” OR TX
“Human immunodeficiency virus infection” OR TX “HIV Seropositivity” OR TX “AIDS-Related Complex” OR
TX “HIV Seroprevalence” OR TX “Human immunodeficiency virus 1” OR TX “Human immunodeficiency virus 2”
OR TX “human immune deficiency virus” OR TX “HIV” OR TX “HIV/AIDS” OR TX “HIV-infected” OR TX
“AIDS”
#2 HCV
MH “hepatitis C” OR TX “Hepatitis C virus” OR TX “HCV” OR TX “Hepatitis C” OR TX “liver fibrosis” OR TX
“viral hepatitis”
#3 HBV
MH “hepatitis B” OR TX “Hepatitis B virus” OR TX “HBV” OR TX “Hepatitis B”
#4 TB
MH “tuberculosis” OR MH “Mycobacterium tuberculosis” OR MH “Tuberculosis, Multidrug-Resistant” OR TX
“drug resistant tuberculosis” OR TX “extensively drug resistant tuberculosis” OR TX “Mycobacterium
tuberculosis” OR TX “Tuberculosis” OR TX “TB” OR TX “MDR-TB” OR TX “XDR-TB” OR TX “Mtb”
#5 Prison
MH “Correctional Facilities” OR MH “prisoners” OR TX “Prison*” OR TX “Incarcerate*” OR TX “Penitentiary”
OR TX “Penitentiaries” OR TX “imprisonment” OR TX “penal institute*” OR TX “Jail” OR “Jails” OR TX
“inmate” OR TX “inmates” OR TX “correctional setting” OR “Correctional settings” OR TX “detain” OR TX
“detention” OR TX “detainees” OR TX Correctional Centre” OR TX “Correctional Centres”
#6 Compulsory Drug Detention Centers
TX “compulsory drug detention center” OR TX “compulsory drug detention” OR TX “compulsory drug treatment”
OR TX “compulsory rehabilitation” OR TX “correctional facility” OR TX “corrections facility” OR TX
“correctional facilities” OR TX “corrections facilities” OR TX “re-education through labor” OR TX “laojiaosuo”
OR TX “long-term detention” OR TX “labor camp” OR TX “labor camps”
(S1 OR S2 OR S3 OR S4) AND (S5 OR S6)
Criminal Justice Abstracts with Full Text
#1 HIV
MH “Human immunodeficiency virus” OR MH “HIV-1” OR MH “AIDS Serodiagnosis” OR MH “HIV Infections”
OR MH “HIV Seropositivity” OR MH “Acquired Immunodeficiency Syndrome” OR TX “acquired immune
deficiency syndrome” OR TX “AIDS related complex” OR TX “AIDS-Related Opportunistic Infections” OR TX

6
“Human immunodeficiency virus infection” OR TX “HIV Seropositivity” OR TX “AIDS-Related Complex” OR
TX “HIV Seroprevalence” OR TX “Human immunodeficiency virus 1” OR TX “Human immunodeficiency virus 2”
OR TX “human immune deficiency virus” OR TX “HIV” OR TX “HIV/AIDS” OR TX “HIV-infected” OR TX
“AIDS”
#2 HCV
MH “hepatitis C” OR TX “Hepatitis C virus” OR TX “HCV” OR TX “Hepatitis C” OR TX “liver fibrosis” OR TX
“viral hepatitis”
#3 HBV
MH “hepatitis B” OR TX “Hepatitis B virus” OR TX “HBV” OR TX “Hepatitis B”
#4 TB
MH “tuberculosis” OR MH “Mycobacterium tuberculosis” OR MH “Tuberculosis, Multidrug-Resistant” OR TX
“drug resistant tuberculosis” OR TX “extensively drug resistant tuberculosis” OR TX “Mycobacterium
tuberculosis” OR TX “Tuberculosis” OR TX “TB” OR TX “MDR-TB” OR TX “XDR-TB” OR TX “Mtb”
#5 Prison
MH “Correctional Facilities” OR MH “prisoners” OR TX “Prison*” OR TX “Incarcerate*” OR TX “Penitentiary”
OR TX “Penitentiaries” OR TX “imprisonment” OR TX “penal institute*” OR TX “Jail” OR “Jails” OR TX
“inmate” OR TX “inmates” OR TX “correctional setting” OR “Correctional settings” OR TX “detain” OR TX
“detention” OR TX “detainees” OR TX Correctional Centre” OR TX “Correctional Centres”
#6 Compulsory Drug Detention Centers
TX “compulsory drug detention center” OR TX “compulsory drug detention” OR TX “compulsory drug treatment”
OR TX “compulsory rehabilitation” OR TX “correctional facility” OR TX “corrections facility” OR TX
“correctional facilities” OR TX “corrections facilities” OR TX “re-education through labor” OR TX “laojiaosuo”
OR TX “long-term detention” OR TX “labor camp” OR TX “labor camps”

7
A3. PRISMA search diagram
Records identified through database searching
(n =11,482)
PubMed= 2324; Embase= 3,784
CINAHL=1,037; Criminal Justice=4,337
Records after duplicates removed
(n =6,943)
Title and abstracts
screened (n =6,943)
Records excluded
(n =6,046)
Full-text articles assessed
for eligibility (n=897)
Full-text articles excluded,
(n=673)
Reasons for exclusion:
no biological data;
infection only self-reported;
does not report methodology;
sample is biased/non-representative sub-group
duplicate of another publication
Studies included in
quantitative synthesis
(meta-analysis)
(n=299)
Grey literature and email
requested reports (n =75)

8
A4. Prevalence data located for HIV, HCV, HBV TB and HIV/TB co infection among prison populations,
published between 2005-2015
Infection
Total
countries or
territories
with data
Number of data points
Total
prevalence Males Females PWIDs FSW MSM TG
HIV 74 204 70 59 47 6 14 1
HCV
(antiHCV) 46 171 65 49 53 0 7 0
HBV
(HBsAg) 43 56 40 28 24 1 5 0
Active TB 25 46 19 5 0 0 0 0
HIV/TB 17 25 4 1 1 0 0 0

9
A5. National and regional HIV prevalence among prison populations, published between 2005-2015
Region / Country Imprisonment rate
(per 100,000)1
Year
collected
Total HIV
%
Male HIV
%
Female HIV
%
East and Southern Africa
Ethiopia2 129 2013 4.2 4.3 3.8
Kenya3,4
118 2008 5.6 5.6
2009 – 10 5.7
Malawi5,6
73 2011 21.7 23.0 10.0
2011 18.5 19.0 0.0
2011 41.2 41.0 42.0
NR 36.6 29.9 50.0
South Africa7-9
292 2009 25.3
2009 25.5 25.5
2011 7.2
2014 14.0
Swaziland10
289 NR 34.9
Uganda11,12
115 2008 11.0 11.0 13.0
2014 10.9
United Republic of
Tanzania13,14
69 2011 15.0
2012 6.7 5.2 14.7
Zambia15-19
125 2009 27.4 26 43.3
2010 27.4
2011 25
2011 24.1
2011 22.9
Zanzibar20
NR 2.8
Pooled East and Southern Africa
15.6% 19.1% 21.6%
(95%CI)
(11.8-19.8%) (11.7-27.8) (7.3-41.1)
I2
99.5% 97.9% 94.6%
Total Prison Population: 588,000 Total prisoners living with HIV: 92,000 (69,500 – 116,500)
Africa - West and Central
Burkina Faso21
34 2009 5 4.9 6.7
Cameroon22,23
115 2003 11.3
2009 7.8
Côte d'Ivoire24
52 2008 - 10 5.6 5.1 17.1
Democratic Republic of the
Congo25
32 2008 10.2
Ghana26-28
53 2004 5.9 5.0 15.1
2004 19.2
2012 2.3 1.5 11.8
Nigeria29-32
31 2006 8.9 8.9
2007 18.0 18.0
NR 2.4 2.2 6.3
NR 6.7
Togo33,34
64 2011 10.8 10.8
2011 4.3 4.0 14.3

10
Region / Country Imprisonment rate
(per 100,000)1
Year
collected
Total HIV
%
Male HIV
%
Female HIV
%
Pooled West and Central
Africa
8.2% 7.1% 13.1%
(95%CI)
(6.2-10.5) (3.9-10.9) (8.4-18.5)
I2
92.4% 91.5% 10.%
Total Prison Population: 201,500 Total prisoners living with HIV: 16,500 (12,500 – 21,000)
Middle East and North Africa Egypt
35 76 NR 0.0
Islamic Republic of Iran36-40
287 1991 2.8
2008 0.6
0.0
2009 0.0
2009 0.9
Israel41
256 2003 0.2
Lebanon42
120 2007 0.17 0.17
Libya43
99 2006 18.4 18.4
Morocco44
222 2004 2.0
2.0
Pooled Middle East and North Africa
1.3% 6.0% 0.8%
(95%CI)
(0.2-3.3) (1.9-34.9) (0.1-3.7)
I2
99.9% 99.7% 75.6%
Total Prison Population: 645,000 Total prisoners living with HIV: 8,500 (1,500 – 21,500)
Asia and Pacific
Afghanistan45
74 2012 0.5 0.5
2012 0.8 0.8
Australia46-53
151 2003 0.0
2004 1.0 0.7 0.0
2005 0.6
2006 0.0
2008 0.1
2010 0.0
2010 0.0 0.0 0.0
2013 0.0 0.0 0.0
Fiji54
174 2012 1.0
India55
33 NR 0.5
Indonesia56-58
64 2007 29.8
2007 7.2
2009 4.8
2010 2.6 1.1 6.0
Pakistan59-64
43 2006 1.0
2007 0.2
2007 2.0 2.0
2009 0.8 0.8 1.0
2009 2.0 2.1 1.2
2009 2.4 2.4 NR
Philippines65
121 2014 12.8 16.0 3.0

11
Region / Country Imprisonment rate
(per 100,000)1
Year
collected
Total HIV
%
Male HIV
%
Female HIV
%
Pooled Asia and Pacific
1.4% 1.4% 1.9%
(95%CI)
(0.9 - 1.9) (0.8-2.3) (0.6-4.2)
I2
94.9% 94.2% 82.6%
Total Prison Population: 3,361,500 Total prisoners living with HIV: 47,000 (30,500– 64,000)
Eastern Europe and Central Asia Armenia
66 130 NR 2.4 2.4
Azerbaijan67
236 2014 3.7 4.0 1.7
Bosnia and Herzegovina68
73 2011 0.0
Bulgaria69-71
125 2009 0.6
2010 0.8
Estonia72
216 2012 15.8 14.5 38.2
Hungary73
187 2007 0.0
Kazakhstan74
231 2007 2.0
Latvia75
239 2010 6.1
Russian Federation76
445 2014 3.0
Serbia 148 2011
3.0 4.0
The Former Yugoslav
Republic of Macedonia77
147 2011 0.0
Ukraine78-80
194 2005 24.5
2011 19.4 17.3 28.4
2011 14.0 10.0 33.0
Pooled Eastern Europe
Central Asia
4.1 8.5% 22.1%
(95%CI)
(1.4-8.0) (2.7-17.1) (8.2-40.4)
I2
99.% 98.% 93.4%
Total Prison Population: 1,287,000 Total prisoners living with HIV: 53,500 (18,000 – 103,000)
Western Europe
Finland81
57 2006 0.8 0.7 1.1
France82,83
100 2000 0.0 0.0
2010 2.0 2.0 2.6
Ireland84,85
45 2011 1.9 1.5 8.9
Northern Ireland86
87 2004 0.0
Italy 86 2001 7.5
2001 7.5 7.8 5.6
NR 3.8
Luxembourg87
112 2014 2.2
Portugal88,89
138 2005 9.9
9.9
2007 6.6 6.6
Spain90-97
136 1992 1.9 1.9
2001 19.1 19.4 16.7
2002 7.2
2008 10.8
2009 8.5
2010 11.2
2010 1.2
2014 5.8

12
Region / Country Imprisonment rate
(per 100,000)1
Year
collected
Total HIV
%
Male HIV
%
Female HIV
%
United Kingdom98
148 2014 0.6
Pooled Western Europe
4.2% 3.6% 5.6
(95%CI)
(2.7-6.1) (1.1-7.4) (2.2-10.4)
I2
98.5% 97.9% 90.3%
Total Prison Population: 412,000 Total prisoners living with HIV: 17,304 (11,124 – 25,132)
North America
Canada99,100
106 2003 2.0 2.1 1.8
2003 3.4 2.4 8.8
United States of America101-
119 698 1994 7.5
1998 4.0
4
1999 1.8
1.8
2000 0.2
2000 1.1
1.1
2000
3.0 10.7
2003 16.8
16.8
2003
1.6
2003 1.7 2.7 1.0
2003 1.3 1.3 1.4
2003 1.9
2003 1.7
2003 0.7
2003 0.3
2004 3.4 3.6 2.6
2006 0.8
2006 0.1 0.1
2006 0.11 0.11
2006 5.2 4.7 9.8
2007 2.6
2007 0.9 0.8 1.4
2008 0.8
2008 0.3
2008 0.3
2008 0.5
2008 1.5
2009 0.8
2010 1.46 1.4 1.9
2010 0.47 0.47 0.5
2011 0.6
2011 0.4
2011 1.3
2011 1.3
Pooled North America
1.3% 3.1% 3.8%
(95%CI)
(1.0-1.7) (2.2-4.1) (2.4-5.5)
I2
99.5% 99.5% 98.8%
Total Prison Population: 2,255,000 Total prisoners living with HIV: 29,500 (22,500 – 38,500)
Caribbean

13
Region / Country Imprisonment rate
(per 100,000)1
Year
collected
Total HIV
%
Male HIV
%
Female HIV
%
Antigua and Barbuda120
373 2004 3.0
Belize121
449 2005 4.0 4.0
Dominica120
300 2004 2.6
Grenada120
398 2004 2.2
Jamaica122
145 2006 3.3
Saint Kitts and Nevis120
607 2004 2.4
Saint Lucia120
349 2004 2.0
Saint Vincent and the
Grenadines120
387 2004 4.1
Pooled Caribbean
3.3% 4.%
(95%CI)
(2.7 - 4.0) (not pooled) No data
I2
0.1%
Total Prison Population: 109,000 Total prisoners living with HIV: 3,500 (3,000 – 4,500)
Latin America
Argentina123
160 2011 3.3 3.0 4.0
Bolivia124
122 2001 0.1 0.13 0.0
Brazil125-130
301 2001 4.9
2003 5.7
2004 0.3 0.3
2007 1.8
2009 6.6
2013 5.7
Colombia131
244 2010 2.1
Mexico132-134
212 2001 0.6
2010 0.7 0.7 0.7
2010 0.7
Venezuela135
174 1998 4.0
Pooled Latin America
2.3% 1.6% 1.5%
(95%CI)
(1.5-3.4%) (0.6-3.1) (0.3-3.5)
I2
98.0% 98.1% 90.2%
Total Prison Population: 1,401,000 Total prisoners living with HIV: 32,000 (21,000 – 47,500)
GLOBAL
Total prison population: 10,242,000
Global HIV prevalence among prisoners: 3.8% (3.2 – 4.5)
Total prisoners living with HIV: 389,000 (328,000 – 461,000)
Note: Published data include national level and Sub-national reports; NR: Date not reported; N/A:
Imprisonment rate not available; Estimated numbers of prisoners living with HIV are rounded to the nearest 500
Countries that did not have data meeting inclusion criteria (imprisonment rate/100,000): Albania 189;
Algeria 162; Andorra 72; Angola 106; Austria 95; Bahamas 363; Bahrain 301; Bangladesh 43; Barbados 322;
Belarus 306; Belgium 105; Benin 77; Bhutan 145; Botswana 188; Brunei Darussalam 132; Burundi 93;
Cambodia 105; Cape Verde 286; Central African Republic 16; Chad 39; Chile 246; China 119; Comoros 31;
Congo 27; Costa Rica 352; Croatia 81; Cuba 510; Cyprus 94; Czech Republic 195; Democratic People's
Republic of Korea N/A; Denmark 61; Djibouti 68; Dominican Republic 231; Ecuador 162; El Salvador 498;
Equatorial Guinea 129; Eritrea N/A; Federated States of Micronesia 127; Gabon 210; Gambia 58; Georgia 274;
Germany 76; Greece 109; Guatemala 121; Guinea 26; Guinea-Bissau 5; Guyana 259; Haiti 97; Honduras 196;
Iceland 47; Iraq 123; Japan 48; Jordan 150; Kiribati 136; Kuwait 92; Kyrgyzstan 166; Lao People's Democratic
Republic 71; Lesotho 92; Liberia 39; Lithuania 268; Madagascar 83; Malaysia 171; Maldives 341; Mali 33;
Marshall Islands 66; Mauritania 44; Mauritius 159; Mongolia 266; Montenegro 174; Mozambique 61; Myanmar

14
Region / Country Imprisonment rate
(per 100,000)1
Year
collected
Total HIV
%
Male HIV
%
Female HIV
%
113; Namibia 144; Nauru 140; Nepal 59; Netherlands 69; New Zealand 194; Nicaragua 171; Niger 39; Norway
71; Oman 36; Palau 343; Panama 392; Papua New Guinea 43; Paraguay 158; Peru 242; Poland 191; Qatar 53;
Republic of Korea 101; Republic of Moldova 215; Romania 143; Rwanda 434; Sao Tome and Principe 101;
Saudi Arabia 161; Senegal 57; Seychelles 799; Sierra Leone 55; Singapore 227; Slovakia 184; Slovenia 73;
Solomon Islands 56; Somalia N/A; South Sudan c.65; Sri Lanka 92; Sudan 50; Suriname 183; Sweden 55;
Switzerland 84; Syrian Arab Republic 60; Tajikistan 121; Thailand 465; Timor-Leste 50; Tonga 166; Trinidad
and Tobago 258; Tunisia 212; Turkey 222; Turkmenistan 583; Tuvalu 110; United Arab Emirates 229;
Uruguay 291; Uzbekistan 150; Vanuatu 87; Viet Nam 154; Yemen 53; Zimbabwe 145
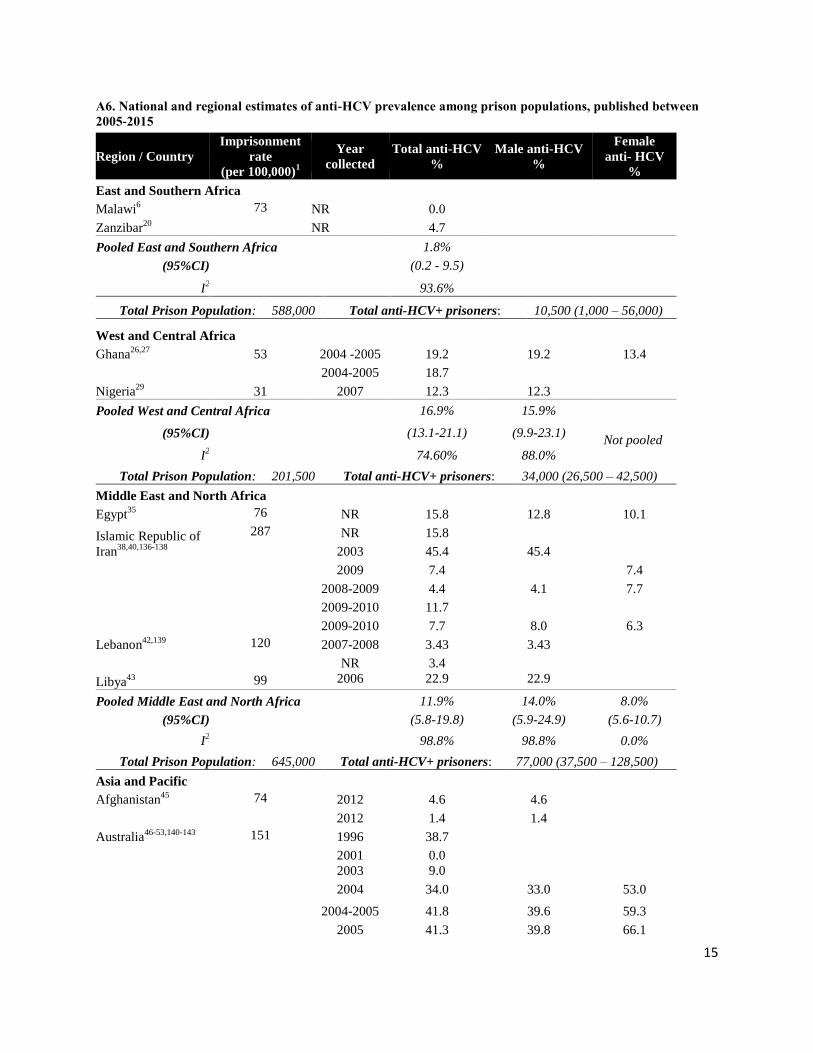
15
A6. National and regional estimates of anti-HCV prevalence among prison populations, published between
2005-2015
Region / Country
Imprisonment
rate
(per 100,000)1
Year
collected
Total anti-HCV
%
Male anti-HCV
%
Female
anti- HCV
%
East and Southern Africa Malawi
6 73 NR 0.0
Zanzibar20
NR 4.7
Pooled East and Southern Africa
1.8%
(95%CI)
(0.2 - 9.5)
I
2 93.6%
Total Prison Population: 588,000 Total anti-HCV+ prisoners: 10,500 (1,000 – 56,000)
West and Central Africa Ghana
26,27 53 2004 -2005 19.2 19.2 13.4
2004-2005 18.7
Nigeria29
31 2007 12.3 12.3
Pooled West and Central Africa 16.9% 15.9%
Not pooled
(95%CI)
(13.1-21.1) (9.9-23.1)
I2 74.60% 88.0%
Total Prison Population: 201,500 Total anti-HCV+ prisoners: 34,000 (26,500 – 42,500)
Middle East and North Africa Egypt
35 76 NR 15.8 12.8 10.1
Islamic Republic of
Iran38,40,136-138
287 NR 15.8
2003 45.4 45.4
2009 7.4
7.4
2008-2009 4.4 4.1 7.7
2009-2010 11.7
2009-2010 7.7 8.0 6.3
Lebanon42,139
120 2007-2008 3.43 3.43
NR 3.4
Libya43
99 2006 22.9 22.9
Pooled Middle East and North Africa 11.9% 14.0% 8.0%
(95%CI)
(5.8-19.8) (5.9-24.9) (5.6-10.7)
I2 98.8% 98.8% 0.0%
Total Prison Population: 645,000 Total anti-HCV+ prisoners: 77,000 (37,500 – 128,500)
Asia and Pacific
Afghanistan45
74 2012 4.6 4.6
2012 1.4 1.4
Australia46-53,140-143
151 1996 38.7
2001 0.0
2003 9.0
2004 34.0 33.0 53.0
2004-2005 41.8 39.6 59.3
2005 41.3 39.8 66.1

16
Region / Country
Imprisonment
rate
(per 100,000)1
Year
collected
Total anti-HCV
%
Male anti-HCV
%
Female
anti- HCV
%
2006 8.7
2005-2007 24.8
2008 32.0
2008-2009 31.7 28.0 45.4
2010 22.0 21.0 34.0
2010 29.8
2013 31.0 28.2 39.8
Indonesia56,57
64 2007-2009 18.6%
2007-2009 26.3%
2009 34.1%
Japan144
48 2014 0.2% 0.2% 0.2%
Pakistan59,61,63,145-147
43 2007-2008 15.2% 15.2%
2007-2008 8.7% 8.7%
2007-2012 12.32%
2008-2009 12.8%
2009-2010 13.2% 13.1% 16.0%
NR 18.4% 18.4%
Philippines65
121 2014 43.6% 56.0% 10.0%
Sri Lanka148
92 NR 6.9% 7.4%
Taiwan149
2004-2005 22.5% 22.5%
Pooled Asia and Pacific 20.6% 17.3% 29.3%
(95%CI)
(15.4-26.4) (10.1-25.9) (12.1-50.3)
I2 99.6% 99.7% 98.9%
Total Prison Population: 3,344,500 Total anti-HCV+ prisoners: 689,000 (515,500 – 883,000)
Eastern Europe and Central Asia Armenia
66 130 NR 23.8 23.8
Azerbaijan67
236 2014 38.2 41.8 10.3
Bosnia and
Herzegovina68
73 2011 14.3
Bulgaria69-71
125 2009 25.6 32.6 20.2
2010 20.4* 24.2* 14.1
NR 28.6
Croatia150
81 2005-2007 12.5 14.4 10.6
Hungary73
187 2007-2009 4.9
Kazakhstan74
231 2007 43.0
Tajikistan74
121 2007 24.3
The Former
Yugoslav Republic
of Macedonia77
147 2011 20.0
Turkey151
222 NR 0.4
Ukraine78
194 2011 60.0

17
Region / Country
Imprisonment
rate
(per 100,000)1
Year
collected
Total anti-HCV
%
Male anti-HCV
%
Female
anti- HCV
%
Pooled Eastern Europe Central Asia 20.2% 26.8% 14.1%
(95%CI)
(11.8-30.1) (16.3-38.9) (9.8-19.2)
I2 99.3% 98.1% 47.6%
Total Prison Population: 1,287,000 Total anti-HCV+ prisoners: 260,000 (152,000 – 387,500)
Western Europe
Finland81
57 2006 45.8 43.9 52.3
France82,83,152-155
100 2003 6.9 4.8
2010 4.8 4.5 11.8
2010 5.3
2012-2013 4.7
2012-2013 6.5
Germany156
76 2002 8.6* 8.6
Ireland85
80 2011 12.9 12.3 22.2
North Ireland86
87 2004 1.1
Italy157-160
86 2000-2002 37.4 37.4
2001-2002 38.0 40.6 20.6
2006 22.4
NR 22.8
Luxembourg87
112 2014 13.4
Netherlands161
69 2010 7.4
Portugal88,89
138 2005 11.0
11.0
2008 34.4 34.4
Scotland162
143 2010-2011 19.0
Spain90,94,95,163
136 2001 38.2 38.9 31.9
2002-2004 8.2
2008 22.7
2009 26.1
2014 20.0
United Kingdom:
England & Wales164-
168
148 2006 50.0
50.0
2006-2007 12.2
12.2
2005-2008 24.2
2010-2011 11.1 11.1
NR 1.3* 1.3*
2014 8.0
Pooled Western Europe 15.5% 18.8% 24.10%
(95%CI)
(12.2-19.1) (9.6-30.2) (15.7-33.6)
I2 99.5% 99.1% 24.10%
Total Prison Population: 412,000 Total anti-HCV+ prisoners: 63,860 (50,264 – 78,692)
North America
Canada100,169
106 2003 18.5 16.6 29.2
2003-2004 17.6 15.9 30.2
2004 25.2 24.8 37.6

18
Region / Country
Imprisonment
rate
(per 100,000)1
Year
collected
Total anti-HCV
%
Male anti-HCV
%
Female
anti- HCV
%
United States of
America108,114,115,170-
186
698 1994-1996 0.8* 0.3 3.7
1996-1997 40.0
40
1998-2000 24.9 23.1 40.5
1999-2000 13.0 12.0
2000-2001 2* 1.8* 2.5*
2001 23.6
2003 15.2
2004 13.7
2005 11.1
2005 23.3
2004-2006 4.3 3.2 7.6
2004-2006 8.1 7.5 9.4
2006 29.7
2006 18.9
2006 11.2 11.2
2007 12.1 11.2 15.7
2006-2008 1.0
2006-2008 22.9
2008 13.0
2008 20.9
2007-2009 16.7
2010 5.53 5.47
2010 41.1
2011 9.6
2009-2011 20.5 19.4 28.2
2010-2011 24 18
2010-2012 16.6 14.8 33.2
2012 11.9 11.8
2012 13.9
2012 18.1 16.8 31.3
2011-12 9.8
2011-12 5.6
2011-2012 3.0 3.1 2.7
2012-2013 16.4
NR 34.3 32.7 38.3
Pooled North America
15.3% 10.6% 17.9%
(95%CI)
(13.1-17.7) (8.2-13.3) (10.0-27.4)
I2 99.9% 99.8% 99.7%
Total Prison Population: 2,255,000 Total anti-HCV+ prisoners: 345,000 (295,500 – 399,000)
Caribbean No data identified or met inclusion criteria for the Caribbean
Latin America

19
Region / Country
Imprisonment
rate
(per 100,000)1
Year
collected
Total anti-HCV
%
Male anti-HCV
%
Female
anti- HCV
%
Argentina123
160 2010 0.8
Brazil127,128,130,187-191
301 2001 8.1
2003 8.7 8.7
2004-2005 6.4* 6.59* 4.17*
2007 5.3
2007-2008 6.1
6.1
2009 4.8 7.0 0.8
2009-2010 3.1
2010 1.0
Mexico132,134
212 2001-2002 10.0
2010 3.2
Venezuela192
174 NR 5.0 5.0
Pooled Latin America 4.7% 7.1% 3.6%
(95%CI)
(3.1-6.7) (5.8-8.6) (0.5-9.4)
I2 97.2% 0.0% 78.8%
Total Prison Population: 1,401,000 Total anti-HCV+ prisoners:: 66,000 (43,500 – 94,000)
GLOBAL
Total prison population: 10,242,000
Global prevalence of anti-HCV: 15.1 (13.7-16.5)
Total anti-HCV+ prisoners: 1,546,500 (1,403,500 – 1,690,000)
Note: Published data include national level and Sub-national reports; NR: Date not reported; N/A:
Imprisonment rate not available; *juvenile; Estimated numbers of prisoners living with HCV are rounded to
the nearest 500
Countries with no anti-HCV data meeting inclusion criteria (Imprisonment rate): Albania 189; Algeria 162;
Andorra 72; Angola 106; Antigua and Barbuda 373; Austria 95; Bahamas 363; Bahrain 301; Bangladesh 43;
Barbados 322; Belarus 306; Belgium 105; Belize 449; Benin 77; Bhutan 145; Bolivia 122; Botswana 188;
Brunei Darussalam 132; Burkina Faso 34; Burundi 93; Cambodia 105; Cameroon 115; Cape Verde 286;
Central African Republic 16; Chad 39; Chile 246; China 119; Colombia 244; Comoros 31; Congo 27; Costa
Rica 352; Côte d'Ivoire 52; Cuba 510; Cyprus 94; Czech Republic 195; Democratic People's Republic of
Korea N/A; Democratic Republic of the Congo 32; Denmark 61; Djibouti 68; Dominica 300; Dominican
Republic 231; Ecuador 162; El Salvador 498; Equatorial Guinea 129; Eritrea N/A; Estonia 216; Ethiopia
129; Federated States of Micronesia 127; Fiji 174; Gabon 210; Gambia 58; Georgia 274; Greece 109;
Grenada 398; Guatemala 121; Guinea 26; Guinea-Bissau 5; Guyana 259; Haiti 97; Honduras 196; Iceland
45; India 33; Iraq 123; Israel 256; Jamaica 145; Jordan 150; Kenya 118; Kiribati 136; Kuwait 92;
Kyrgyzstan 166; Lao People's Democratic Republic 71; Latvia 239; Lesotho 92; Liberia 39; Lithuania 268;
Madagascar 83; Malaysia 171; Maldives 341; Mali 33; Marshall Islands 66; Mauritania 44; Mauritius 159;
Mongolia 266; Montenegro 174; Morocco 222; Mozambique 61; Myanmar 113; Namibia 144; Nauru 140;
Nepal 59; New Zealand 194; Nicaragua 171; Niger 39; Norway 71; Oman 36; Palau 343;Panama 392; Papua
New Guinea 61; Paraguay 158; Peru 242; Poland 191; Qatar 53; Republic of Korea 101; Republic of
Moldova 215; Romania 143; Russian Federation 445; Rwanda 434; Saint Kitts and Nevis 607; Saint Lucia
349; Saint Vincent and the Grenadines 387; Sao Tome and Principe 101; Saudi Arabia 161; Senegal 62;
Serbia 148; Seychelles 799; Sierra Leone 55; Singapore 227; Slovakia 184; Slovenia 73; Solomon Islands
56; Somalia N/A; South Africa 292; South Sudan c.65; Sudan 50; Suriname 183; Swaziland 289; Sweden
55; Switzerland 84; Syrian Arab Republic 60; Thailand 465; Timor-Leste 50; Togo 64; Tonga 166; Trinidad
and Tobago 258; Tunisia 212; Turkmenistan 583; Tuvalu 110; Uganda 115; United Arab Emirates 229;
United Republic of Tanzania 69; Uruguay 291; Uzbekistan 150; Vanuatu 87; Viet Nam 154; Yemen 53;
Zambia 125; Zimbabwe 145.

20
A7. National and regional prevalence of HBV among prison populations, published between 2005-2015
Region / Country
Imprisonment
rate
(per 100,000)1
Year
collected
anti-HBc
%
HBsAg
%
HBV (diagnostic
method unspecified)
%
East and Southern Africa
Malawi6 73 NR
3.5%
Zanzibar20
NR
7.10%
Pooled East and Southern Africa
5.7%
(95%CI)
(2.9-9.4)
I
2
54.9%
Total Prison Population: 588,000 Total HBsAg+ prisoners: 33,500 (17,000 – 55,000)
West and Central Africa
Burkina Faso21
34 2009
27.3
Ghana26,27
53 2004-2005
17.4
2004-2005
22.5
Nigeria29
31 2007
23.0
Pooled West and Central Africa
23.5%
(95%CI)
(19.8-27.5)
I
2
72.2%
Total Prison Population: 201,500 Total HBsAg+ prisoners: 47,500 (40,000 – 55,500)
Middle East and North Africa Egypt
35 76 NR 9.8
Islamic Republic of
Iran36,38,40,193-197
287
2001-2002 4.5
2003 3.0
2008-2009 0.6
2008-2009 4.1
2009 7.4 1.2
2009-2010
2.1
2009-2010
6.9
NR
6.1
Lebanon42,139
120 2007-2008
2.4
2009
1.7
Libya43
99 2006 6.9
Pooled Middle East and North Africa
7.9% 3.3%
(95%CI)
(6.0-10.1) (2.4-4.5)
I
2
63.2% 82.1%
Total Prison Population: 645,000 Total HBsAg+ prisoners: 21,500 (15,500 – 29,000)
Asia and Pacific
Afghanistan45
74 2012
0.06
2012
0.05
Australia46-53,57,141,143,198
151 2001 27.8
2003 11.0

21
Region / Country
Imprisonment
rate
(per 100,000)1
Year
collected
anti-HBc
%
HBsAg
%
HBV (diagnostic
method unspecified)
%
2004 20.0
2006
3.9
2005-2007
4.5
2008
26.0
2008-2009 25.5
2009
3.2
2010 19.0 2.1
2010 17.7 3.0
2010
1.6
2013 18
Indonesia56
64 2007-2009
5.3
2007-2009
1.8
2009
3.2
Japan144
48 2014
0.0
Pakistan59,63,147
43 2007-2008
5.9
2007-2008
3.5
2012
5.3
Philippines65
121 2014
6.8
Sri Lanka148
92 NR
0.25
Taiwan199
1994
21.7
Pooled Asia and Pacific
19.9% 4.4%
(95%CI)
(16.5-23.7) (1.4-9.0)
I
2
86.4% 99.1%
Total Prison Population: 3,361,500 Total HBsAg+ prisoners: 148,000 (47,000 – 302,500)
Eastern Europe and Central
Asia
Armenia66
130 NR 3.7
Azerbaijan67
236 2014
2.7
Bosnia and Herzegovina68
73 2011
1.5
Bulgaria69-71
125 2009 59.2 32.4
2010 49.9 25.3
NR 60.2
Croatia150
81 2005-2007 5.9
Hungary73
187 2007-2009
1.5
The Former Yugoslav
Republic of Macedonia77
147
2011 17.0
Turkey151
222 NR 4.8
Pooled Eastern Europe Central Asia
35.1% 10.4%
(95%CI)
(11.0-64.4) (1.9-24.6)
I
2
99.5% 99.3%
Total Prison Population: 1,287,000 Total HBsAg+ prisoners: 134,000 (24,500 – 316,500)

22
Region / Country
Imprisonment
rate
(per 100,000)1
Year
collected
anti-HBc
%
HBsAg
%
HBV (diagnostic
method unspecified)
%
Western Europe
Finland81
57 2006 0.5
France83,152,155
100 2000-2003
0.3
2012-2013
7.5
2012-2013
1.2
Ireland85
80 2011 0.3
N. Ireland86
87 2004 0.8
Italy157,160
86 2001-2002 52.6
NR
4.4
Luxembourg87
112 2014 2.2
Netherlands161
69 2010 8.5 1.3
Portugal89
138 2008 19.1
Spain90,92,163
136 2008
2.6
2009
2.1
2012
2.6
Switzerland200
84 NR 44.0
United Kingdom: England &
Wales98,165,166,201
148 2005-2008 13.9 2.4
2006-2007 11.4 2.6
2011
0.4
2014 1.5
Pooled Western Europe
14.8% 2.4% 1.4%
(95%CI)
(4.6-29.5%) (1.6-3.3) (1.1-1.8)
I2
99.5% 87.4% 0.5%
Total Prison Population: 412,000 Total HBsAg+ prisoners: 9,888 (6,592 – 13,596)
North America
United States of
America115,140,171,173,177,202
698 1994-1996
2.2
1996-1997 29.0
1999-2000 19.0
2000-2001 20.5
2003-2006 0.8
2007-2009
0.9
2011-12
2.7
2011-12
1.7
Pooled North America
22.0% 1.4%
(95%CI)
(18.2-26.0) (0.3-3.1)
I
2
88.3% 95.0%
Total Prison Population: 2,255,000 Total HBsAg+ prisoners: 31,500 (7,000 – 70,000)
Caribbean No data identified or met inclusion criteria for the Caribbean
Latin America
Argentina123
160 2010
0.6

23
Region / Country
Imprisonment
rate
(per 100,000)1
Year
collected
anti-HBc
%
HBsAg
%
HBV (diagnostic
method unspecified)
%
Brazil127,128,203,204
301 2004-2005 11.1
2007
21.0
2007-2008 18.9
NR 17.9 0.5
Mexico132-134
212 2001-2002 4.4
2010 4.8
2010 3.0
Venezuela135
174 1998-2001 16.2
Pooled Latin America
11.1% 2.3%
(95%CI)
(4.3-20.5) (0.1-8.3)
I
2
99.1% 97.0%
Total Prison Population: 1,400,000 Total HBsAg+ prisoners: 32,000 ( 0 – 116,500)
GLOBAL
Total prison population: 10,242,000
Global HBsAg prevalence among prisoners: 4.8 (3.2-6.8)
Total HBsAg+ prisoners: 491500 (327,500 – 696,500)
Notes: Published data include national level and Sub-national reports; NR: Date not reported; N/A: Imprisonment rate
not available; Estimated numbers of prisoners living with HBsAg are rounded to the nearest 500
Countries with no data meeting HBV inclusion criteria (imprisonment rate): Albania 189; Algeria 162; Andorra 72;
Angola 106; Antigua and Barbuda 373; Austria 95; Bahamas 363; Bahrain 301; Bangladesh 43; Barbados 322;
Belarus 306; Belgium 105; Belize 449; Benin 77; Bhutan 145; Bolivia 122; Botswana 188; Brunei Darussalam 132;
Burundi 93; Cambodia 105; Cameroon 115; Canada 106; Cape Verde 286; Central African Republic 16; Chad 39;
Chile 246; China 119; Colombia 244; Comoros 31; Congo 27; Costa Rica 352; Côte d'Ivoire 52; Cuba 510; Cyprus
94; Czech Republic 195; Democratic People's Republic of Korea N/A; Democratic Republic of the Congo 32;
Denmark 61; Djibouti 68; Dominica 300; Dominican Republic 231; Ecuador 162; El Salvador 498; Equatorial
Guinea 129; Eritrea N/A; Estonia 216; Ethiopia 129; Federated States of Micronesia 127; Fiji 174; Gabon 210;
Gambia 58; Georgia 274; Germany 76; Greece 109; Grenada 398; Guatemala 121; Guinea 26; Guinea-Bissau 5;
Guyana 259; Haiti 97; Honduras 196; Iceland 45; India 33; Iraq 123; Israel 256; Jamaica 145; Jordan 150;
Kazakhstan 231; Kenya 118; Kiribati 136; Kuwait 92; Kyrgyzstan 166; Lao People's Democratic Republic 71; Latvia
239; Lesotho 92; Liberia 39; Lithuania 268; Madagascar 83; Malaysia 171; Maldives 341; Mali 33; Marshall Islands
66; Mauritania 44; Mauritius 159; Mongolia 266; Montenegro 174; Morocco 222; Mozambique 61; Myanmar 113;
Namibia 144; Nauru 140; Nepal 59; New Zealand 194; Nicaragua 171; Niger 39; Norway 71; Oman 36; Palau 343;
Panama 392; Papua New Guinea 61; Paraguay 158; Peru 242; Poland 191; Qatar 53; Republic of Korea 101;
Republic of Moldova 215; Romania 143; Russian Federation 445; Rwanda 434; Saint Kitts and Nevis 607; Saint
Lucia 349; Saint Vincent and the Grenadines 387; Sao Tome and Principe 101; Saudi Arabia 161; Senegal 62; Serbia
148; Seychelles 799; Sierra Leone 55; Singapore 227; Slovakia 184; Slovenia 73; Solomon Islands 56; Somalia N/A;
South Africa 292; South Sudan c.65; Sudan 50; Suriname 183; Swaziland 289; Sweden 55; Syrian Arab Republic 60;
Tajikistan 121; Thailand 465; Timor-Leste 50; Togo 64; Tonga 166; Trinidad and Tobago 258; Tunisia 212;
Turkmenistan 583; Tuvalu 110; Uganda 115; Ukraine 194; United Arab Emirates 229; United Republic of Tanzania
(Mainland) 69; Uruguay 291; Uzbekistan 150; Vanuatu 87; Viet Nam 154; Yemen 53; Zambia 125; Zimbabwe 145

24
A8. National and regional prevalence of active tuberculosis, published between 2005-2015
Imprisonment
rate
(per 100,000)1
Year
collected
Total prevalence
of active TB
% or / 100,000 †
Male prevalence
active TB
% or / 100,000 †
Female
prevalence active
TB
% or / 100,000 †
Region / Country
East and Southern Africa Ethiopia
205-207 129 2008 2.0%
2008 1913/100,000
2011 1482/100,000
Malawi5,208
73 2005 0.7%
2011 2.9% 2.9%
South Africa8,209
292 2009-2010 8.8% 8.8%
2009-2010 3.5% 3.8
Uganda12
115 2008 654/100,000
Zambia16,210
125 2000-2001 22.7% 23.2% 0%
2010-2011 12.1%
Pooled East and Southern Africa
5330/100,000 8886/100,000
(95%CI)
(2066 – 9998
/100,000)
(2292-19188
/100,000) Data not pooled
I2 99.10% 98.5%
Total Prison Population: 587,000 Total prisoners with active TB: 31,000 (12,500 – 59,000)
West and Central Africa
Burkina Faso21
34 2009 1.3%
Cameroon22,23
115 2003-2004 3517 /100,000
2009 3197/100,000
Guinea211
26 2009-2010 2.5% 2.5%
Nigeria30
31 2006 1.8%
Pooled West and Central Africa 2946/100,000
(95%CI)
(2362-3591
/100,000) Data not pooled No data
I2 45.6%
Total Prison Population: 201,500 Total prisoners with active TB: 6,000 (5,000 – 7,500)
Middle East and North Africa Islamic Republic of Iran
212 287 2004-2005 910/100,000 1% 0
Pooled Middle East and North Africa
(95%CI)
Data not pooled Data not pooled Data not pooled
I2
Asia and Pacific*
Bangladesh213,214
43 2005-2007 2227/100,0000 2.40% 0.50%
2005-2010 600 / 100,000
Hong Kong215,216
2001 1.23% 1.23%
2005 337/100000
Malaysia217
171 2012 4.9%
Pakistan59
43 2007-2008 2.2% 2.20%
Thailand218
465 2004-2005 354/100,000 1.30% 0.90%

25
Imprisonment
rate
(per 100,000)1
Year
collected
Total prevalence
of active TB
% or / 100,000 †
Male prevalence
active TB
% or / 100,000 †
Female
prevalence active
TB
% or / 100,000 †
Region / Country
Pooled Asia and Pacific 1,173/100,000 1706/100,000 831/100,000
(95%CI)
(712 – 1747
/100,000)
1027-2553
/100,000)
(504-1238
/100,000)
I2 98.4% 93.5% 0.8%
Total Prison Population: 3,361,500 Total prisoners with active TB: 40,500 (23,500 – 57,000)
Eastern Europe and Central Asia ** Bulgaria
219 125 2004-2013 769/100,000
Poland220
191 2012 1.4%
Russian Federation221,222
445 2003 12.80% 12.80%
2005-2006 14.90% 14.90%
Tajikistan223
121 2010 4.5% 4.50%
Turkey224
222 2006-2007 108/100,000 115/100,000
Ukraine79
194 2011 4.1%
Pooled Eastern Europe Central Asia 4,903/100,000 6268/100,000
(95%CI)
(1846-9321
/100,000)
(510-17730
/100,000) Data not pooled
I2 99.40% 99.5%
Total Prison Population: 1,300,000 Total prisoners with active TB: 64,000 (23,500 – 121,000)
Western Europe*
Netherlands 69 2014 20/100,000
United Kingdom 148 2014 64.3/100,000
Pooled Western Europe Data not pooled Data not pooled Data not pooled
Total Prison Population: Total prisoners with active TB:
North America*
United States of
America225
698 2003 3.2% 3.80% 1.00%
Pooled North America
(95%CI)
Data not pooled Data not pooled Data not pooled
I2
Caribbean No data identified or met inclusion criteria for the Caribbean
Latin America
Argentina123
160 2010 100 / 100,000
Brazil125,226-234
301 2002 2.7% 2.70%
2003-2004 2.5%
2005 2.7% 2.70%
2005-2006 3.8%
2006 1763 / 100,000 1763/100,000
2006 2.8% 2.80%
2007-2008 4960 / 100,000
2008 1029.5 / 100,000
2008 525.7 / 100,000
2009-2013 1044 / 100,000 1044 / 100,000

26
Imprisonment
rate
(per 100,000)1
Year
collected
Total prevalence
of active TB
% or / 100,000 †
Male prevalence
active TB
% or / 100,000 †
Female
prevalence active
TB
% or / 100,000 †
Region / Country
2013 917/100,000 1.00% 0.40%
Colombia131
244 NR 1.6%
Pooled Latin America 1977/100,000 2131/100,000
(95%CI)
(1347-2726
/100,000)
(1336-3105
/100,000) Data not pooled
I2 93.3% 92.0%
Total Prison Population: 1,401,000 Total prisoners with active TB: 28,000 ( 18,000 – 38,000)
GLOBAL
Total prison population: 10,242,000
Global prevalence of active TB among prisoners: 2,790/100,000
(2050-3650/100,000)
Total prisoners with active TB: 286,000 (210,000 – 374,000)
Notes: † Prevalence as reported by the publication; NR: Date not reported; N/A: Imprisonment rate not available;
Published data include national level and Sub-national reports * Latent TB reported by Australia, Malaysia, Taiwan,
Spain, Italy, U.S.; ** MDR-TB reported in Georgia; Estimated numbers of prisoners living with active TB are
rounded to the nearest 500
Countries that did not have data meeting active TB inclusion criteria (imprisonment rate): Afghanistan 74; Albania
189; Algeria 162; Andorra 72; Angola 106; Antigua and Barbuda 373; Armenia 130; Australia* 151; Austria 95;
Azerbaijan 236; Bahamas 363; Bahrain 301; Barbados 322; Belarus 306; Belgium 105; Belize 449; Benin 77; Bhutan
145; Bolivia 122; Bosnia and Herzegovina 73; Botswana 188; Brunei Darussalam 132; Burundi 93; Cambodia 105;
Canada 106; Cape Verde 286; Central African Republic 16; Chad 39; Chile 246; China 119; Comoros 31; Congo 27;
Costa Rica 352; Côte d'Ivoire 52; Croatia 81; Cuba 510; Cyprus 94; Czech Republic 195; Democratic People's
Republic of Korea N/A; Democratic Republic of the Congo 32; Denmark 61; Djibouti 68; Dominica 300; Dominican
Republic 231; Ecuador 162; Egypt 76; El Salvador 498; Equatorial Guinea 129; Eritrea N/A; Estonia 216; Federated
States of Micronesia 127; Fiji 174; Finland 57; France 100; Gabon 210; Gambia 58; Georgia** 274; Germany 76;
Ghana 53; Greece 109; Grenada 398; Guatemala 121; Guinea-Bissau 5; Guyana 259; Haiti 97; Honduras 196;
Hungary 187; Iceland 45; India 33; Indonesia 64; Iraq 123; Ireland 80; Israel 256; Italy* 86; Jamaica 145; Japan 48;
Jordan 150; Kazakhstan 231; Kenya 118; Kiribati 136; Kuwait 92; Kyrgyzstan 166; Lao People's Democratic
Republic 71; Latvia 239; Lebanon 120; Lesotho 92; Liberia 39; Libya 99; Lithuania 268; Luxembourg 112;
Madagascar 83; Maldives 341; Mali 33; Marshall Islands 66; Mauritania 44; Mauritius 159; Mexico 212; Mongolia
266; Montenegro 174; Morocco 222; Mozambique 61; Myanmar 113; Namibia 144; Nauru 140; Nepal 59; New
Zealand 194; Nicaragua 171; Niger 39; Norway 71; Oman 36; Palau 343; Panama 392; Papua New Guinea 61;
Paraguay 158; Peru 242; Philippines 121; Portugal 138; Qatar 53; Republic of Korea 101; Republic of Moldova 215;
Romania 143; Rwanda 434; Saint Kitts and Nevis 607; Saint Lucia 349; Saint Vincent and the Grenadines 387; Sao
Tome and Principe 101; Saudi Arabia 161; Senegal 62; Serbia 148; Seychelles 799; Sierra Leone 55; Singapore 227;
Slovakia 184; Slovenia 73; Solomon Islands 56; Somalia N/A; South Sudan c.65; Spain* 136; Sri Lanka 92; Sudan
50; Suriname 183; Swaziland 289; Sweden 55; Switzerland 84; Syrian Arab Republic 60; Taiwan* ; The Former
Yugoslav Republic of Macedonia 147; Timor-Leste 50; Togo 64; Tonga 166; Trinidad and Tobago 258; Tunisia 212;
Turkmenistan 583; Tuvalu 110; United Arab Emirates 229; United Kingdom: Northern Ireland 87; United Kingdom:
Scotland 143; United Republic of Tanzania 69; Uruguay 291; Uzbekistan 150; Vanuatu 87; Venezuela 174; Viet
Nam 154; Yemen 53; Zimbabwe 145

27
A9. HIV/TB Co-infection among prison populations, published 2005 - 2015
Region / Country
Year(s) of
data
collection
HIV/TB co-
infection
among total
prison sample
(%)
Total
prevalence of
TB among
HIV+
(%)
Total
prevalence of
HIV among
TB+
(%)
East and Southern Africa
Ethiopia207
2011 3.6% 47.4% 34.6%
South Africa7,8,209
2009-2010 1.6% 6.6% 42.4%
2009-2010 NR 6.2% 44.1%
2009-2010 5.1% NR 58.0%
Uganda235
2011-2012 NR NR 57.0%
Zambia16
2010-2011 1.6% 6.4% 45.8%
West and Central Africa
Burkina Faso21
2009 NR 20.0% 75.0%
Cameroon22,236
2003-2004 NR NR 25.0%
2009 NR NR 10.0%
Guinea211
2009-2010 0.3% NR 11.1%
Nigeria30
2006 8.9% NR NR
Middle East and North
Africa
No data identified or met inclusion criteria for the MENA
Region
Asia and Pacific
Australia237
2001 0.1% NR 0.9%
Malaysia217
2010 NR 16.9% NR
Eastern Europe Central Asia
Russia238
2001 NR 12.2% NR
Ukraine239,240
2005-2006 NR NR 17.7%
2006 NR NR 23.7%
Western Europe
Italy241
2001-2002 0.9% 7.4% NR
North America
USA225,242
1998 NR NR 23.1%
2003 NR NR 11.3%
Caribbean No data identified or met inclusion criteria for the Caribbean
Latin America
Brazil226,227,230
2002 0.6% NR 14.6%
2003-2004 0.0% NR NR
2007-2008 0.3% NR 6.9%
Colombia243,244
2010-2011 0.1% NR 14.3%
2010-2012 0.2% 11.5% 4.2%
Notes: Includes national and subnational data; includes latent and active TB infection

28
A10. Infectious disease prevalence among imprisoned people who inject drugs, published 2005-2015
Country Facility Year of
collection
HIV
(%)
Anti-HCV
(%)
HBsAg
(%)
TB
(%)
West and Central Africa
Ghana26
Central Prisons 2004-2005 11.4% 49.3%
East and Southern Africa No data identified or met inclusion criteria for the East and Southern Africa
Middle East and North Africa
Iran136,194,245-256
Prison 2001-2002 NR 78.3% 1.5%
Prison 2002 0.7% 31.5%
Prison 2002 15.1% 64.8% 4.7%
Central Prison 2002-2003 18.2% 13.6%
Central Prison 2002-2003 NR 95.4%
Prison 2003 88.9%
Prison 2003 14.0% 76.0% 4.0%
Detention center 2006 NR 80.0%
Jail 2007 6.6%
Prison 2007 2.3%
Correctional
center
2008-2009 NR 50.0% 3.3%
Prison 2009 6.4%
Prison 2009 NR 41.6%
Prisons 2009 13.9%
Prison 2009-2010 4.5%
Central Prison
and Drop in
Centers
NR NR 43.4%
Asia and Pacific
Australia46,48-50,52,257-260
Prison 2004 0.8% 56.0% 27.0%
Correctional
Center
2005 NR 40.0%
Prison 2006 NR 7.6% 7.6%
Correctional
center
2005-2009 22.6%
Prison 2008-2010 47.4%
Prison 2010 0.0% 51.0% 18.8%
Reception
Prisons
2010 0.0% 18.4%
Prison 2013 0.0% 58.2% 19.0%
Prisons NR 17.0%
Prison NR 20.7%
Prison NR 29.4%
Indonesia57
Prison 2009 13.8% 50.0% 1.1%
Pakistan145
Central Prison NR 84.2%
Taiwan199,261-263
Prisons 1994 26.4%

29
Correction center 1997 59.4% 22.2%
Correctional
institution
2005-2007 42.0%
Jail 2008-2010 52.8% 91.3% 15.3%
Eastern Europe and Central Asia
Bulgaria69,71
Prison 2009 61.4%
Juvenile
correctional
facility
2010 66.7%
Croatia264
Prison 2007 0.0% 44.0% 0.5%
Western Europe
England265
Prison NR 32.6%
Germany266
Prison 1998-1999 18.0% 83.0% 53.0%*
Ireland85
Prison 2011 6.0% 41.5%
Italy157
Prisons 2001-2002 18.2% 57.1%*
Prisons 2001-2002 24.5%
North Ireland86
Prison 2004 0.0% 2.8% 2.8%
Netherlands161
2014 58.0%
Portugal88
Prisons 2005 44.4% 68.9%
Scotland162
Prison 2010-2011 53%
Spain95
Prison 2001 53.2% 92.7%
North America
Canada99,100
Prison 2003 10.2% 55.6%
Remand
Facilities
2003-2004 5.7% 54.7%
USA104,106,108,113,114,118,170,172
,181,267,268
Sentenced and
Pretrial detainees
1994-1996 20.4%
Jail and Prison
facility
1998-2000 84.9%
Jails 1998-2002 2.5%
Juvenile
Detention Center
2000-2001 35.8%
Jail 2003-2006 1.4%
Prison 2004-2006 9.4%
Jail 2006 16.9%
Correctional
facility
2007 1.0%
County
Correctional
Facility
2009-2011 0.3% 38.0%
Correctional
facility
NR 66.2%
Caribbean
Belize121
Central Prison 2005 0.0%
Latin America
Brazil126,127,187,189,191
Prison 2003 34.5% 72.7%
Prison 2007 13.8% 34.5% 51.7%*

30
Prisons 2007-2008 66.7%
Prison 2009-2010 20.6%
Prisons 2010 0.4%
Mexico132
Correctional
facility
2001-2002 66.7%
Notes: NR: Not reported; * anti-HBc

31
A11. HIV and viral hepatitis among inmates in Compulsory Drug Detention Centers (CDDCs) published between 2005 - 2015
HIV Prevalence
anti-HCV Prevalence
HBsAg
Country Location Year(s) of
data
collection
Total CDDC
prevalence
(%)
PWID
prevalence
(%)
Total CDDC
prevalence (%)
PWID
Prevalence
(%)
Total CDDC
prevalence (%)
PWID
Prevalence
(%)
China269-
272
Beijing,
Shanghai,
Guangdong
2009-2010 0.2% NR 44.0% NR NR NR
Dongguan 2008 4.% NR NR NR NR NR
Beijing 2007 5.2% 10.3% NR NR NR NR
Guangxi 2011 9.5% NR NR NR NR NR
Taiwan273
Taoyuan 2005 6.9% 25.5% 30.5% 89.6% 16.9% 16.7%
Vietnam274
Hatay 2007-08 NR 19.8% NR 76.9% NR NR
Iran193,253,2
54,275-278
Tehran 2006 NR 24.4% NR 80.0% NR 5.8%
Tehran 2001-2002 17.% 7.8% NR NR 4.5% 1.5%
Sari 2001-2003 NR NR 30.8% 77.0% NR NR
Note: CDDCs include injecting and non-injecting people who use drugs

32
A12. Incidence of HIV and viral hepatitis among prisoners, published 2005 – 201592,97,162,279,280
Australia (South Australia)
Australia (New South Wales)*
Scotland USA (Rhode Island)
Australia (New South Wales)
Scotland
Australia (Queensland)*
Spain (Barcelona)
Estonia USA (Rhode Island)
Spain
USA (Georgia)
USA (Rhode Island)
0
2000
4000
6000
8000
10000
12000
14000
16000
1999 2001 2003 2005 2007 2009 2011 2013 2015
Inci
de
nce
pe
r 1
00
,00
0 p
ers
on
ye
ars
Year
HCV
HIV
HBV

33
A13. Modeling the interplay between prison and community HIV transmission among PWIDs
Summary:
To evaluate the fundamental dynamics that govern the interplay of HIV transmission within and between prison and
community settings, we developed a model parameterized by data of incarceration history and risk behavior among
PWIDs. Rates of HIV infection among PWIDs were stratified into communities with moderate PWID HIV
prevalence, ranging from 5 to 20%, and communities with high PWID HIV prevalence, over 20%.281
To address
empirical uncertainty regarding model parameters, we used a Bayesian inference approach to fit our model to
epidemiological data of HIV prevalence among PWIDs in and out of prisons, as well as HIV incidence in prison.
We used the fitted model to quantify the contribution of post-release ART discontinuation and behavior change of
PWIDs who temporarily share syringes while incarcerated and during a transitory period on HIV incidence among
PWIDs. Furthermore, we evaluated the impact of harm reduction programs, such as opioid substitution treatment
(OST) and lower rates of incarceration for non-violent drug users, and ART retention in care post-release for
curtailing HIV incidence across a range of epidemics parameterized from different countries.
Our model accounted for the elevated frequency of needle sharing in prison as well as discontinuation of ART
during a transitory period following prison release.282-286
Given the sparsity of data regarding the impact of this post-
release behavior change on HIV transmission, we conducted a sensitivity analysis to evaluate the contribution of the
frequency of post-release needle sharing and percentage discontinuation of ART treatment on HIV incidence among
PWID within the community and prisons. We denoted as ‘temporary sharers’ PWIDs who share syringes while
incarcerated, a proportion of whom share needs a transient duration following release, but not beyond. A detailed
description of our modeling methodology, parameterization, assumptions and limitations are presented in the
following section. We limited our model to inmates who inject heroin, as the majority of research and prevention
has focused on these individuals. To assess the variability of the effectiveness of interventions in settings with
different HIV epidemics among injection drug users, we considered parameters from a range of settings with
communities of PWID.
Model Structure:
To evaluate generalized principles governing the interplay between HIV transmission among people who inject drug
(PWID) in the community and in prison around the world, we developed a deterministic compartmental model of
drug injection transmission of HIV among the general community and incarcerated populations. To determine the
posterior distributions of model parameters through a Bayesian analysis, we used a range of estimates from HIV
prevalence among PWID in the general population, HIV prevalence among PWID in prisons and overall HIV
incidence in prisons. We then used our parameterized model to quantify the relative contribution of incarceration to
HIV incidence among PWID in different communities. Additionally, we evaluated the impact on HIV transmission
of harm reduction programs (opioid substitution treatment), ART retention in care post-release, and lower rates of
incarceration for non-violent drug users.
Model Formulation:
Transmission dynamics among PWID within and between prisons and the community were modeled by differential
equations. The state variables are given by ,
h
k iX , where h is the HIV infection status and stage of progression (1 =
susceptible; 2 = acute infection; 3 = latent infection with CD4 greater than 350 cells / L ; 4 = latent infection with
CD4 less than 350 cells / L ; 5 = pre-AIDS with elevated viremia; 6 = AIDS; 7 = initiated ART with CD4> 350
cells / L ; 8 = initiated ART with low CD4 or pre-AIDS; 9= initiated ART with AIDS), i is the incarceration
status (1 = currently incarcerated, 2 = recently released (within six months), 3 = previously incarcerated, 4 = never
incarcerated), and k is injection risk behavior (1 = non-PWID, 2 = PWID who do not share syringes, 3 = PWID
who share syringes). We stratify incarcerated PWIDs who did not share syringes prior to incarceration between
permanent non-sharers and temporary sharers. Temporary sharers only share syringes in prison, consistent with the
greater proportion of PWIDs who share syringes in prison than out of prison.287-290
Hence, we add a temporary
syringe sharer group to the injection risk behavior ( 4k ). In the description that follows, a dot ( ) in the position
of these indices indicates a sum across that index. To account for a transitory elevation of injection drug risk
behavior and discontinuation of ART treatment following release from incarceration,282,285-287
we distinguish

34
between PWIDs who have been recently released within the last six months and PWIDs released further in the past
who have resumed the relatively lower risk behavior regarding injection drug use and ART treatment exhibited prior
to incarceration. 1
, 1 1 1
, , , , , ,
,
k i
k k i k i k i k k i k i k i
k i
dXR X X X
dt
(1.1)
2
, 1 2 2
, , 2 , , ,
,
( )k i
k i k i k k i k i k i
k i
dXX X X
dt
(1.2)
3
, 4 2 3 3
2 , 3 , , ,
,
(1 ( )) ( )k i hCD
k i k k i k i k i
k i
dXa t X X X
dt
(1.3)
4
, 4 3 4 4
3 , 4 , , ,
,
(1 ( )) ( )k i lCD
k i k k i k i k i
k i
dXa t X X X
dt
(1.4)
5
, 4 4 5 5
4 , 5 , , ,
,
(1 ( )) ( )k i lCD
k i k k i k i k i
k i
dXa t X X X
dt
(1.5)
6
, 5 6 6
5 , 6 , , ,
,
(1 ) ( )k i AIDS
k i k k i k i k i
k i
dXa X X X
dt
(1.6)
7
, 4 2 7 7
2 , 7 , , ,
,
( )k i hCD
k i k k i k i k i
k i
dXa X X X
dt
(1.7)
8
, 4 3 4 8 8
3 , 4 , 8 , , ,
,
( ) ( )k i lCD
i k i k i k k i k i k i
k i
dXa X X X X
dt
(1.8)
9
, 5 9 9
5 , 9 , , ,
,
( )k i AIDS
k i k k i k i k i
k i
dXa X X X
dt
(1.9)
We denote the rate of entering PWID status k as kR , which is set as to maintain a constant population size. For
k=1, 2, 3, 4, respectively, we have
9
1 1 1, 1,
6
j
j
j
R X X
,
3 9
2 , ,
2 6
(1 ) 1idu idu j
k k j k
k j
R X X
,
3 9
3 , ,
2 6
idu j
k k j k
k j
R X X
, and
3 9
2 , ,
2 6
1idu idu j
k k j k
k j
R n X X
, where
idu is the proportion of PWIDs who share syringes in the
general population. The proportion of temporary sharers is denoted as ( ) (1 )idu idu idu idu
inc , where
idu
inc is the proportion of PWIDs who share syringes while incarcerated. To prevent negative values of idu ,
idu
inc
was sampled under the condition of being greater or equal to idu . New individuals enter the model as never having
been incarcerated, with , 1k i for 4i and 0 otherwise. The background death rate unrelated to HIV for PWID
status k is denoted k . To model the impact of expanding coverage of antiretroviral therapy we incorporated
4 4( ), ( ),and ( )HCD LCD AIDSa t a t a t as the proportions of individuals with high CD4 cell count (more than 350
cells / L threshold), low CD4 cell count (less than 350 cells / L threshold), and AIDS (advanced HIV/pre-AIDS

35
stage), respectively, with incarceration status i that are initiated on treatment at that time. We assumed that ART is
initiated at CD4 count threshold of less than 350. Thus, for the base case the status quo analysis, we assumed that 4( ) 0HCDa t . For simplicity, we assumed a uniform ART initiation rate irrespective of incarceration status. The
force of infection for individuals of specific injection drug use status k , and incarceration status i is given by ,k i .
4 9, 0 2 5 6
, , , , , ,
3 7,
( )
idu
k i j j
k i acute k latent k pre aids k aids k art k
j jk
cX X X X X
X
,
where if 1i i (currently incarcerated) and *=sum of never incarcerated, recently released, and previously
incarcerated if 2,3,4i . The transmission rate of HIV per use of contaminated syringes is denoted 0
idu if the
syringe was last used by an individual infected with HIV. The relative infectiousness of individuals in HIV stage h
compared to those with latent infection is denoted h . The frequency of syringe sharing for those of incarceration
status i is denoted ,k ic , where , ,k i k i ic f and where ,k if is the frequency of injection and i is the percentage
of PWIDs sharing syringes. Given our focus on syringe sharing as the route for HIV transmission under
consideration, we set 1, 0i and 2, 0i , such that transmission occurs exclusively between sharers. This is a
conservative assumption given that a sharer could become infected from a contaminated needle from a non-sharer.
Further studies on HIV transmission among PWIDs could explore relaxing this assumption by accounting for
differential infection risk from sharers and non-sharers.
Consistent with epidemiological behavioral studies of PWIDs with a history of incarceration,282-284,291
we assumed
that a proportion idu of recently released PWIDs who shared syringes in prison but not prior to incarceration will
continue to share syringes for a transitory period following release. After this transitory period, the proportion of
PWIDs who share syringes returns to that of PWIDs who have never been incarcerated, given that PWIDs typically
resume the injection behavior they exhibited prior to incarceration.282,284
In addition, epidemiological studies have
shown that more than 40% of the incarcerated individuals on ART would have poor adherence to treatment or even
discontinue entirely within a period of the first six-months post-release.285,286,292,293
We define the movement in and out of prison through k , a transition matrix which includes the rate of first-time
incarceration that depends on PWID status,inc
kr , rate of discharge from prison that depends on PWID status,disc
kr ,
average duration of the post-release transitory period of elevated risk behavior,1 elp
kr , and rate of re-incarceration
that depends on PWID status,rinc
kr .
To assess the benefits that could be gained from expanding harm reduction measures such as opioid substitution
treatment (OST), we incorporated an intervention cofactor within the force of infection ,k i as
, ,(1 (1 ))idu idu
j i j k i , where 0j for no OST and 1j for OST. The proportion increase in intervention j
among individuals of incarceration status i is denoted ,
idu
j i and the relative decrease in the force of infection is
denoted idu
j . The relative force of infection under OST 1
idu was varied in the uncertainty analyses from 0.16 to
0.5, consistent with epidemiological studies.294-296
The mean duration of HIV infection phase h is denoted by 1 h .
Consistent with empirical studies, we assumed that PWIDs who continue OST after incarceration have a 20% (95%
CI: 10-30%) reduced risk of re-incarceration while they are under treatment.297
Baseline coverage of OST was not
explicitly modeled, but assumed to be implicitly included in epidemiological data on HIV prevalence and incidence.
Altogether, the population dynamics of incarceration at equilibrium is given by:

36
,1
inc
n nn ninc
n n
rP A
r
, ,2 ,1 ( )disc elp
n n n n nP P r r , ,3 ,1( ) ( ) ( )elp disc rinc elp
n n n n n n n nP P r r r r ,
,4 ( )inc
n n n nP r ,with ( )( )
( )( )( )
rinc elp
n n n nn disc rinc elp rinc elp disc
n n n n n n n n n
r rA
r r r r r r
,
where ,n iP is the proportion of individuals with injection drug status n ( 1n for non-PWID, and 2n for PWID)
and incarceration status i .The system of differential equations was numerically integrated in continuous time in
MATLAB 8.5® using a fourth-fifth order Runge-Kutta solver (“ode45”).
Model fitting and analysis:
To estimate posterior distributions for the model parameters governing HIV transmission, injection drug behavior
and incarceration, we using a Bayesian melding method to calibrate the model to epidemiological data of HIV
prevalence among PWIDs, HIV prevalence among incarcerated PWIDs and HIV incidence in prison.298
Data were
divided between communities with high PWID HIV prevalence that ranged from 20 to 60% and communities with
moderate PWID HIV prevalence that ranged from 5 to 20%.281,299-301
Empirical estimates of HIV prevalence among
incarcerated PWID ranged from 22 to 80%302,303
for communities with high PWID HIV prevalence and 5.7 to
28.6%106,118,304-306
for communities with moderate PWID HIV prevalence. For annual HIV incidence in prisons, we
derived a pooled estimates from the literature that ranged between 0.01 and 1.8%307,308
for communities with
moderate PWID HIV prevalence, and 0.01–4% 72,307,308
for communities with high PWID HIV prevalence. Model
parameters were randomly sampled from their prior distributions, and each parameter set sampled was then used to
simulate a HIV epidemic which was run for a randomly sampled duration between 10 to 45 years, consistent with
the range of estimates of the durations of injection drug epidemics in different settings worldwide.288
To establish
the baseline in the absence of the improvements in intervention that we are considering here, we simulated status
quo base case epidemics.
To compare model predictions with observed data, we applied a Bayesian melding approach, incorporating a
likelihood function and using all available prior information regarding model inputs to generate posterior
distributions of model parameters. We used prior distributions defined from epidemiological and clinical studies
(Tables S1-S2) for each input model parameter. The likelihood distribution was defined as
prison HIV incidence [Community PWID prev range] [Prison PWID prev range]( ) 1 1Lik Tr which is the product of a triangular
distribution (with mode: 0.1%, and ranges detailed above) for observed HIV incidence data and uniform
distributions for the observed HIV prevalence data among PWIDs in communities and HIV prevalence among
incarcerated PWIDs. The function 1[a,b]
(x) =1,if xÎ [a,b] and 0 otherwise.
To describe the Bayesian melding algorithm, we denote the simulation model (Eqs. 1.1-1.9) by M, the
epidemiological parameters (Tables S1-S2) by and the model-predicted output by ( )M . We denote the
prior distribution for each model parameter by ( )q . We denote the data by W and the associated likelihood of the
model outputs by ( ) Pr( )L W . The posterior distribution of inputs is then proportional to ( ) ( )q L . We
implemented a sample-importance-resample algorithm [32] to generate the posterior distribution. Specifically, we
first generated a set of input parameters, ( )i , by randomly sampling from the respective prior distributions i times.
We then evaluated the model using that set of parameters, ( ) ( ( ))i M i , for each run i. Next, we calculated the
corresponding likelihood for the model run. For each sample ( )j , with non-zero corresponding likelihood, the
sampling weight was
1
( ) ( ( )) ( ( ))nT
k
j L j L k
. To ensure a sufficient sample from the posterior
distributions, we set i=100,000.

37
The number of non-zero likelihood samples, nT , was 2796 for the high PWID HIV prevalence communities and
1341 for the moderate prevalence communities. To generate the posterior distribution for the inputs, we repeated
this sampling procedure 10000 times with replacement, using a probability of selection proportional to the sampling
weights. Output from the simulation resampled most frequently (i.e., the simulation that most closely fit the
empirical prevalence data) represented the estimated mode for the output parameters of interest. The 2.5th
and 97.5th
percentiles of the inputs (and the resulting model outputs) correspond to 95% credible limits.
The fitted model was used to evaluate the contribution of incarceration to HIV infection among PWIDs and the
potential impact of a range of different program interventions involving incarceration and post-incarceration harm
reduction as well as lower incarceration rates. Simulated epidemics cover a wide range of scenarios from endemic
state to slowly increasing early phase epidemic scenarios with low prevalence that are collectively applicable to
different settings (Figure S2). Interventions were assumed to be initiated in 2016, which was the latest year in model
fitting (Figure S2).
Figure S2 Sample of model simulations of HIV epidemics parameterized to correspond to a range of HIV
prevalences. This sample of 250 simulated epidemics are shown for illustration.
Given that our focus was estimation of the contribution of incarceration to injection related HIV transmission among
injection drug users and the possible impact of interventions on the HIV epidemic among PWIDs, we did not
address sexual, tattoo-related or mother-to-child transmission of HIV. As for any modeling study, we made simplify
assumptions that capture the fundamental dynamics pertinent to the objectives of our analyses without including
extraneous details. For simplicity, our model did not incorporate the dynamics of initiation and cessation of injection
drug use, such that the proportion of PWID in the population was assumed to be constant. To assess the robustness
of our model projections to this assumption, we conducted uncertainty analysis to consider the uncertainty and
variability surrounding incarceration and post-incarceration injection drug behaviors and harm reduction
interventions.

38
Table S1: HIV natural history parameters used in our HIV transmission dynamic model.
Variable Meaning (units) Prior distributions refs
Posterior distribution
Median (95% credible interval)
0
idu HIV transmission per use of shared
syringe (if last person to use was
infected)
Uniform(0.0029,0.024) 309,310
M: 0.0032 (95%CrI: 0.003 – 0.013)
H: 0.0092 (95%CrI: 0.003 – 0.013)
acute Relative infectiousness of individuals
in acute phase compared to latent
infection
Uniform(4.5,27) 311,312
M: 18.39 (95%CrI: 4.86 – 26.02)
H: 18.79 (95%CrI: 4.85 – 26.45)
latent Relative infectiousness of individuals
in latent phase compared to latent
infection
1 NA
pre aids Relative infectiousness of individuals
in pre-AIDS phase compared to latent
infection
Triangular(5,7,10) 311
M: 7.16 (95%CrI: 5.52 – 8.11)
H: 6.47 (95%CrI: 5.45 – 8.12)
aids Relative infectiousness of individuals
in AIDS phase compared to latent
infection
0 311
NA
art Relative infectiousness of virally-
suppressed individuals on ART
compared to latent infection
0.08 313
NA
21 Mean duration of acute phase
infection (months)
Triangular(1.23,2.9,6) 311
M: 5.91 (95%CrI: 1.30 – 5.79)
H: 4.88 (95%CrI: 1.35 – 5.8 )
31 Mean latent period with CD4 count
higher or equal to 350 (years)
Triangular(5.3,6.5,7.7) 314-316
M: 7.27 (95% CrI: 5.37 – 7.62)
H: 6.64 (95%CrI: 5.37 – 7.65)
41 Mean latent period with CD4 count
lower than 350 (years)
Triangular(1.7,2.5,3.3) 314-316
M: 2.83 (95%CrI: 1.75 – 3.28)
H: 2.99 (95%CrI: 1.76 – 3.27)
51 Mean duration with elevated viral load
during pre-AIDS phase (months)
Triangular(4.81,9,18) 311,315,317
M: 16.19 (95% CrI: 5.09 – 17.29)
H: 13.19 (95%CrI: 5.18 – 17.6)
61 Mean duration of AIDS before death
(months)
Triangular(6.97,10,28) 311,315
M: 10.59 (95% CrI: 7.52 – 27.37)
H: 25.17 (95%CrI: 7.56 – 27.52)
71 Mean duration of viral suppression for
individuals on ART with high CD4
(years)
Triangular(8,20,40) 288,318
M: 8.35 (95% CrI: 8.20 – 19.64)
H: 11.57 (95%CrI: 8.27 – 19.64)
81 Mean duration of viral suppression for
individuals on ART with low CD4
(years)
Triangular(5,12,20) 288,317-319
M: 16.18 (95% CrI: 5.23 – 19.27)
H: 7.9 (95%CrI: 5.26 – 19.49)
91 Mean duration of viral suppression for
individuals on ART with AIDS
(years)
Triangular(2,4.8,9.7) 318
M: 5.57 (95% CrI: 2.13 – 9.48)
H: 9.13 (95%CrI: 2.21 – 9.46)
rta Annual ART initiation rates for low
CD4 count and AIDS
Calibrated to have ART
coverage between 5 - 60% 320,321
M: 0.44 (95% CrI: 0.03 – 0.66)
H: 0.53 (95%CrI: 0.03 – 0.6)

39
Table S2: IDU and incarceration parameters used in our HIV transmission dynamic model.
Variable Meaning (units) Prior distribution refs
Posterior distribution
Median (95% credible interval)
incP Proportion of incarcerated
population
Uniform(0.0015, 0.012) 322,323
M: 0.009 (95% CrI: 0.002 – 0.0117)
H: 0.007 (95%CrI: 0.002 – 0.0117)
1 Rate of exiting the model for
non-PWID
0.02* NA
2 Average non-HIV mortality rate
for PWID
Uniform(0.009,0.07) 324
M: 0.06 (95% CrI: 0.011 – 0.06)
H: 0.01 (95%CrI: 0.011 – 0.07)
iduJ Proportion of population who
are PWID
Uniform(0.002,0.052) 325
M: 0.009 (9%% CrI: 0.0027 – 0.05)
H: 0.007 (95%CrI: 0.0035 – 0.05)
idu
incJ Proportion of incarcerated who
are PWID
Uniform(0.1,0.75) 287
M: 0.18 (95% CrI: 0.12 – 0.73)
H: 0.50 (95%CrI: 0.12 – 0.73)
idu Proportion of PWID who share
syringes out of prison
Uniform(0.1,0.75)288-290,326,327
M: 0.28 (95% CrI: 0.11 – 0.40)
H: 0.72 (95%CrI: 0.19 – 0.72)
idu
inc Proportion of PWID who share
syringes in prison Max(
idu
,Uniform(0.6,0.95)) 287
M: 0.89 (95% CrI: 0.60 – 0.94)
H: 0.73 (95%CrI: 0.61 – 0.93)
iduf Number of injections per non-
incarcerated PWID annually
Uniform(107,260) 327-329
M: 120 (95% CrI: 112 – 256)
H: 190 (95%CrI:111 – 256)
idu
incf Number of injections per PWID
in prison annually
Uniform(6,100) 330,331
M: 6 (95% CrI: 7 - 79)
H: 64 (95%CrI: 11 - 97)
ART Proportion of recently released
HIV infected individuals who do
not discontinue ART during the
post-release transition
Uniform(0,0.6) 285,286,292,293
M: 0.28 (95% CrI: 0.02 – 0.58 )
H: 0.20 (95%CrI: 0.02 – 0.58)
idu Proportion of injections of
syringe-sharers that are shared
(non-incarcerated)
Uniform(0.49,0.72) 327
M: 0.51 (95% CrI: 0.5 – 0.71)
H: 0.52 (95%CrI: 0.5 – 0.71)
idu
inc Ratio of injections of syringe-
sharers that are shared (in prison
compared to non-incarcerated)
Uniform(1,2)Assumed±
M: 1.02 (95% CrI: 1.01 – 1.88)
H: 1.68 (95%CrI: 1.02 – 1.87)
iduI Proportion of PWID who has
never being incarcerated
Uniform(0.2,0.7) 299,332
M: 0.62 (95% CrI: 0.21 – 0.68)
H: 0.29 (95%CrI: 0.21 – 0.68)
11 discr Average duration of
incarceration for non-PWID
(years)
Uniform(2,10) 333,334
M: 2.52 (95% CrI: 2.15 – 9.76)
H: 4.85 (95%CrI: 2.19 – 9.85)
2 31 ,1disc discr r Average duration of
incarceration for PWID (years)
Uniform(1,4) 333,335
M: 2.28 (95% CrI: 1.06 – 3.90)
H: 2.76 (95%CrI: 1.10 – 3.92)
31 elpr Average duration of post-release
transitory period (months)
Uniform(1,6) 283,284,336,337
M: 5.92 (95% CrI: 1.18 – 5.85)
H: 3.53 (95%CrI: 1.1 – 5.85)
1
rincr Rate of re-incarceration for non-
PWID (years-1
)
Uniform(0.1,0.5) 338
M: 0.42 (95% CrI: 0.1.02 – 0.44)
H: 0.28 (95%CrI: 0.102 – 0.45)
2 3,rinc rincr r Rate of re-incarceration for
PWID (years-1
)
Uniform(0.1,3) 297,338
M: 0.23 (95% CrI: 0.104 – 1.46)
H: 0.22 (95%CrI: 0.103 – 1.48)

40
Variable Meaning (units) Prior distribution refs
Posterior distribution
Median (95% credible interval)
2,1P Fraction of PWID who are
currently in prison 2 2
2
2 2
inc
inc
rA
r
M: 0.16 (95%CrI: 0.06 – 0.39 )
H: 0.21 (95% CrI: 0.07 – 0.49)
1
incr Rate of initial incarceration for
non-PWID 1 1,1 1 1,1 11
( ) ( )P A P A ¥
2 3,inc incr r Rate of initial incarceration for
PWID 2(1 )idu iduI I €
idu Percentage of temporary syringe
sharers who share during the
post-release transitory period
Varied from 0 to 100%
¥ 1,1 (1 )idu
incP P J . € 2,4
iduP I . * We model adult population age 20 to 70 year olds, tracking incarceration
histories of individuals over 50 years. ± Relative percentage of injections by syringe-sharers that are shared (in
prison compared to non-incarcerated) was conditioned upon the percentage of shared injections in prison being less
or equal than 100%. M = communities with moderate PWID HIV prevalence, and H = communities with high
PWID HIV prevalence.
Table S3: Posterior distribution of PWID HIV prevalence in and out of prison.
Transmission setting Temporary sharers HIV prevalence Posterior distribution
Median (95% credible interval)
Moderate PWIDs HIV
prevalence (5 – 20%)
0% sharing during transitory
period
In prison 14.7% (95%CI: 6.9 – 22.6%)
Out of prison 12.0% (95%CI: 5.7 – 19.3%)
50% sharing during
transitory period
In prison 17.5% (95%CI: 9.0 – 26.9%)
Out of prison 13.6% (95%CI: 6.9 – 19.0%)
100% sharing during
transitory period
In prison 19.7% (95%CI: 9.6 – 27.6%)
Out of prison 17.16% (95%CI: 6.8 – 19.4%)
High PWIDs HIV
prevalence (20 – 60%)
0% sharing during transitory
period
In prison 43.5% (95%CI: 25.0 – 68.1%)
Out of prison 35.0% (95%CI: 18.4 – 56.2%)
50% sharing during
transitory period
In prison 43.7% (95%CI: 24.9 – 68.7%)
Out of prison 34.2% (95%CI: 18.0 – 56.2%)
100% sharing during
transitory period
In prison 44.7% (95%CI: 25.8 – 68.2%)
Out of prison 34.3% (96%CI: 18.3 – 55.9%)

41
A14. Partial rank correlation coefficients (PRCCs) of model parameters.
Note: A parameter was considered to be important in affecting the impact of temporary shares on HIV transmission
if |PRCC|>0.4. The figure only shows parameters for which PRCC values were statistically significant (P-value <
0.05). Specifically, the proportion of PWID who share syringes out of prison, non-HIV PWID mortality rate,
proportion of PWID who has never being incarcerated, the rate of re-incarceration for PWID, proportion of PWID
who share syringes in prison and the HIV transmission per use of shared syringe were the most impactful
parameters. 0
idu , HIV transmission per use of shared syringe (if last person to use was infected);acute , Relative
infectiousness of individuals in acute phase compared to latent infection; 21 , Mean duration of acute phase
infection; 51 , Mean duration with elevated viral load during pre-AIDS phase; 81 , Mean duration of viral
suppression for individuals on ART with low CD4; 2 , Average non-HIV mortality rate for PWID; idu ,
Proportion of PWID who share syringes out of prison; idu
inc , Proportion of PWID who share syringes in prison;
iduf , Number of injections per non-incarcerated PWID annually; idu
incf , Number of injections per PWID in prison
annually; idu , Proportion of injections of syringe-sharers that are shared (non-incarcerated);
idu
inc , Ratio of
injections of syringe-sharers that are shared (in prison compared to non-incarcerated); 21 discr , Average duration of
incarceration for PWID; 31 elpr , Average duration of post-release transitory period; 2
rincr , Rate of re-incarceration
for PWID; iduI , Proportion of PWID who has never being incarcerated.

42
A15. Model Results: Effect of different incarceration-based interventions on HIV incidence after 5 years.
Note: RPI = reduction in PWIDs incarceration rates. OST = opioid substitution treatment. For RPI, initial
incarceration and re-incarceration were instantaneously reduced at the same rate. OST was introduced during
incarceration and supplemented by follow-up after release throughout the transitory period of elevated risk. Bounds
for every scenario (A-F) reflect median and range of effect estimates for the range of HIV epidemics modelled
(whiskers are upper and lower 95% confidence interval). (A-C) effectiveness of interventions under the lower-bound
assumption that 0% of ‘temporary sharers’ share syringes post-release, (D-F) the upper-bound assumption that 100%
of ‘temporary sharers’ continue sharing syringes post-release. When OST is used in combination with ART
retention, we assumed the same coverage increase from baseline for both interventions

43
Web Appendix References:
1. Institute for Criminal Policy Research. World Prison Brief: Countries. 2015.
http://www.prisonstudies.org/world-prison-brief (accessed 02 Jan 2016).
2. UNODC. Rapid Assessment of HIV Situation In Prison Settings in Ethiopia: Assessment Report. Geneva,
2013.
3. BensonOtieno U, Chepkonga M, Kibosia J, et al. Increased capacity for integrated HIV/TB services in
Kenyan prisons. 6th IAS Conference on HIV Pathogenesis and Treatment: Abstract no CDD234. Rome;
2011.
4. Kimetu S. Sexual Health and HIV Knowledge, Practice, and Prevalence among Male Inmates in Kenya.
Liverpool: Liverpool VCT Care and Treatment, 2008.
5. Mwapasa V, Chipungu G, Masiye F, Mukaka M. Prevalence and risk factors for HIV, sexually-transmited
infections, and Tuberculosis in Malawian prisons: Malawi Prison Services; UNODC, 2011.
6. Chimphambano C, Komolafe I, Muula A. Prevalence of HIV, HepBsAg and Hep C antibodies among
inmates in Chichiri prison, Blantyre, Malawi. Malawi medical journal 2007; 19(3): 107-10.
7. Hanifa Y, Telisinghe L, Fielding KL, et al. The diagnostic accuracy of urine lipoarabinomannan test for
tuberculosis screening in a South African correctional facility. PLoS ONE 2015; 10(5).
8. Telisinghe L, Fielding KL, Malden JL, et al. High tuberculosis prevalence in a South African prison: The
need for routine tuberculosis screening. PLoS ONE 2014; 9(1).
9. Skiti V, Goodman E, Bribble P, Hausler H. Screening and testing for tuberculosis and HIV in correctional
facilities in the Western Cape, South Africa. 44th World Conference on Lung Health of the International
Union Against Tuberculosis and Lung Disease Paris, France; 2013. p. 188.
10. Dlamini PM, Dlamini P, Minisi MZ, Bertrand S, Hariga F. A situational assessment on TB, HIV, syphilis,
hepatitis C and hepatitis B infections and associated risk behaviour among prisoners and prison officers in
Swaziland. 19th International AIDS Conference: Abstract no THPE564. Washington; 2012.
11. Kinaalwa G, Nabukalu F. Integrated Legal Aid in HIV Programming in Prison Rehabilitation Servicesfor
Better Access and Quality HIV Care 18th International Conference on AIDS and STIs in Africa (ICASA).
Zimbabwe; 2015. p. 93.
12. Uganda Prisons Service, UNODC. A Rapid Situation Assessment of HIV/STI/TB and Drug Abuse among
Prisoners in Uganda Prisons Service: Final report. Kenya: UNODC ROEA; 2009.
13. Tanzania Commission for AIDS. HIV Prevalence and Related Risk Factors in Prison Settings in Mainland
Tanzania: Findings from a Rapid Situational Assessment. Dar es Salaam: TAC AIDS; UNODC; Ministry
of Home Affairs, 2013.
14. Angolwisye J, Kaymobo F, Nichombe F, et al. First survey on TB and HIV prevalence in the prisons of the
Mbeya Region in Tanzania. 42nd Wrold Conference on Lung Health of the International Union Against
Tuberculosis and Lung Disease. Lille, France; 2011. p. 157.
15. Harris JB, Siyambango M, Levitan EB, et al. Derivation of a tuberculosis screening rule for sub-Saharan
African prisons. The international journal of tuberculosis and lung disease 2014; 18(7): 774-80.

44
16. Henostroza G, Topp SM, Hatwiinda S, et al. The high burden of tuberculosis (TB) and human
immunodeficiency virus (HIV) in a large Zambian prison: a public health alert. PLoS One 2013; 8(8):
e67338.
17. Maggard KR, Hatwiinda S, Harris JB, et al. Screening for tuberculosis and testing for human
immunodeficiency virus in Zambian prisons. Bulletin of the World Health Organization 2015; 93(2): 93-
101.
18. Simooya OO, Sanjobo N, Mulenga C, et al. Aggressive awareness campaigns may not be enough for HIV
prevention in prisons-studies in Zambia suggest time for evidence based interventions. Open Infectious
Diseases Journal 2014; 8(1): 1-7.
19. Hatwiinda S, Maggard K, Phiri W, et al. High HIV prevalence in Zambian prisons: need for systematic
scale-up of provider initiated testing and counseling. 19th International AIDS Conference: Abstract no
TUPE765. Washington; 2012.
20. Dahoma M, Mtumbuka E, Othman A, Seha A, Abdullah A. Predisposing sexual and drug related risk
factors among prisoners in Zanzibar (Abstract no. LBPEC10). IAS 2009. Cape Town,; 2009.
21. Diendere EA, Tieno H, Bognounou R, et al. [Prevalence and risk factors associated with infection by
human immunodeficiency virus, hepatitis B virus, syphilis and bacillary pulmonary tuberculosis in prisons
in Burkina Faso]. Med Trop (Mars) 2011; 71(5): 464-7.
22. Noeske J, Kuaban C, Amougou G, Piubello A, Pouillot R. Pulmonary tuberculosis in the Central Prison of
Douala, Cameroon. East Afr Med J 2006; 83(1): 25-30.
23. Noeske J, Mbondi Mfondih S, Kuaban C. Surveillance of HIV infection in new prison entries in Cameroon,
2008-10. 6th IAS Conference on HIV Pathogenesis and Treatment: Abstract no MOPE296 Rome; 2011.
24. Angora B, Assemien J, Laurent A, et al. HIV in prison in low income countries. AIDS 2011; 25(9): 1244-6.
25. Mashako KY, Sebahire V, Murhabazi V. HIV care and prevention in prison in a country in conflict:
community approach in SOFEDI, Bukavu, DR Congo. 19th International AIDS Conference: Abstract no
THPE562 Washington; 2012.
26. Adjei AA, Armah HB, Gbagbo F, et al. Correlates of HIV, HBV, HCV and syphilis infections among
prison inmates and officers in Ghana: A national multicenter study. BMC infectious diseases 2008; 8: 33-
2334-8-33.
27. Adjei AA, Armah HB, Gbagbo F, et al. Prevalence of human immunodeficiency virus, hepatitis B virus,
hepatitis C virus and syphilis among prison inmates and officers at Nsawam and Accra, Ghana. Journal of
medical microbiology 2006; 55(Pt 5): 593-7.
28. Adiibokah E, Hagbe FS, Opoku RA, et al. HIV and HBV Infection, Knowledge and Risk Behaviour in
Ghanaian Prisons. 18th International Conference on AIDS and STIs in Africa (ICASA). Zimbabwe; 2015.
p. 116.
29. Adoga MP, Banwat EB, Forbi JC, et al. Human immunonodeficiency virus, hepatitis B virus and hepatitis
C virus: sero-prevalence, co-infection and risk factors among prison inmates in Nasarawa State, Nigeria.
Journal of infection in developing countries 2009; 3(7): 539-47.
30. Chigbu LN, Iroegbu CU. Incidence and spread of Mycobacterium tuberculosis-associated infection among
Aba Federal prison inmates in Nigeria. J Health Popul Nutr 2010; 28(4): 327-32.

45
31. Dada MO, Akanmu AS, Esan OA. Seroprevalence of HIV among male prisoners in Lagos State, Nigeria.
The Nigerian postgraduate medical journal 2006; 13(1): 6-9.
32. Muhammed OT, Akpa OM, Atilola GO, Komolafe IOO. Seroprevalence of HIV/AIDS and HIV risk
factors among prison inmates in Ogun State, Nigeria. HIV and AIDS Review 2012; 11(1): 25-30.
33. Akakpo AS, Ekouevi DK, Toure AM, et al. Skin disease and HIV infection among inmates in Lome, Togo:
a study of 194 prisoners. Medecine et sante tropicales 2014; 24(3): 326-8.
34. Ekouevi DK, D'Almeida S, Salou M, et al. HIV seroprevalence among inmates in Togo. Medecine et
Maladies Infectieuses 2013; 43(7): 279-85.
35. Mohamed HI, Saad ZM, Abd-Elreheem EM, et al. Hepatitis C, hepatitis B and HIV infection among
Egyptian prisoners: seroprevalence, risk factors and related chronic liver diseases. Journal of infection and
public health 2013; 6(3): 186-95.
36. Ataie M, Nokhodian Z, Ataei B, Kassaian N, Yaran M, Hassannejad R. Seroprevalence of hepatitis B virus
and human immunodeficiency virus among young prisoners. Journal of research in medical sciences 2013;
18(1): 70-2.
37. Haghdoost AA, Mirzazadeh A, Shokoohi M, Sedaghat A, Gouya MM. HIV trend among Iranian prisoners
in 1990s and 2000s; analysis of aggregated data from HIV sentinel sero-surveys. Harm reduction journal
2013; 10: 32-7517-10-32.
38. Nokhodian Z, Yazdani MR, Yaran M, et al. Prevalence and Risk Factors of HIV, Syphilis, Hepatitis B and
C Among Female Prisoners in Isfahan, Iran. Hepatitis monthly 2012; 12(7): 442-7.
39. Shahbazi M, Farnia M, Rahmani K, Moradi G. Trend of HIV/AIDS Prevalence and Related Interventions
Administered in Prisons of Iran -13 Years' Experience. Iranian journal of public health 2014; 43(4): 471-9.
40. Ziaee M, Sharifzadeh G, Namaee MH, Fereidouni M. Prevalence of HIV and Hepatitis B, C, D Infections
and Their Associated Risk Factors among Prisoners in Southern Khorasan Province, Iran. Iranian journal
of public health 2014; 43(2): 229-34.
41. Mor Z, Vider H, Grotto I, Tischler Aurkin D. Universal HIV screening of inmates in israeli prisons: Should
the policy be updated? Sexually transmitted infections 2013; 89.
42. Mahfoud Z, Kassak K, Kreidieh K, Shamra S, Ramia S. Prevalence of antibodies to human
immunodeficiency virus (HIV), hepatitis B and hepatitis C and risk factors in prisoners in Lebanon.
Journal of infection in developing countries 2010; 4(3): 144-9.
43. Elahmer O, Zorgani A, Abudher A, Ziglam H. Prevalence of human immunodeficiency virus, hepatitis B
virus, hepatitis C virus among prison inmates, western Libya. Clinical Microbiology and Infection 2012;
18: 675.
44. El Ghrari K, Terrab Z, Benchikhi H, Lakhdar H, Jroundi I, Bennani M. Prevalence of syphilis and HIV
infection in female prison population in Morocco. Eastern Mediterranean health journal 2007; 13(4): 774-
9.
45. Vu A, Escuadero M, Berry M, Kali J, Mfochive Njindam I, Burnham G. Integrated Behavioral and
Biological Surveillance in Afghanistan: Findings of 2012 IBBS survey and comparison to 2009 IBBS
survey (unpublished), 2013.

46
46. Butler T, Boonwaat L, Hailstone S, et al. The 2004 Australian prisons entrants' bloodborne virus and risk
behaviour survey. Aust N Z J Public Health 2007; 31(1): 44-50.
47. Butler T, Belcher JM, Champion U, Kenny D, Allerton M, Fasher M. The physical health status of young
Australian offenders. Australian and New Zealand Journal of Public Health 2008; 32(1): 73-80.
48. Butler T, Lim D, Callander D. National Prison Entrants' Bloodborne Virus & Risk Behaviour Survey 2004,
2007 and 2010: Prevalence of HIV, HBV, HCV and risk behaviours among Australian prison entrants.
Sydney, NSW: Kirby Institute (University of South Wales) and National Drug Research Institute (Curtin
University), 2011.
49. Butler T. National Prison Entrants' Bloodborne Virus & Risk Behaviour Survey 2004, 2007, 2010 and
2013. Sydney: Kirby Institute (University of South Wales) and National Drug Research Institute (Curtin
University);, 2015.
50. Gilles M, Swingler E, Craven C, Larson A. Prison health and public health responses at a regional prison in
Western Australia. Australian and New Zealand Journal of Public Health 2008; 32(6): 549-53.
51. Indig D, Topp L, Ross B, et al. 2009 NSW Inmate Health Survey: Key Findings Report. Sydney: Justice
Health; 2010.
52. Reekie JM, Levy MH, Richards AH, et al. Trends in HIV, hepatitis B and hepatitis C prevalence among
Australian prisoners - 2004, 2007, 2010. The Medical journal of Australia 2014; 200(5): 277-80.
53. Watkins RE, Mak DB, Connelly C. Testing for sexually transmitted infections and blood borne viruses on
admission to Western Australian prisons. BMC public health 2009; 9: 385-2458-9-385.
54. Winter R, Kinner S, Saxton K. Health in prisoners in Fiji. Research report. Melbourne: Burnet Institute;
Empower Pacific,, 2013.
55. Sabharwal ER, Mathur DR, Mehta P. HIV seroprevalence among prison inmates in Rajasthan, India.
Journal of Clinical and Diagnostic Research 2012; 6(3): 551.
56. Nelwan EJ, Van Crevel R, Alisjahbana B, et al. Human immunodeficiency virus, hepatitis B and hepatitis
C in an Indonesian prison: prevalence, risk factors and implications of HIV screening. Tropical medicine &
international health 2010; 15(12): 1491-8.
57. Prasetyo AA, Dirgahayu P, Sari Y, Hudiyono H, Kageyama S. Molecular epidemiology of HIV, HBV,
HCV, and HTLV-1/2 in drug abuser inmates in central Javan prisons, Indonesia. Journal of infection in
developing countries 2013; 7(6): 453-67.
58. Blogg S, Utomo B, Silitonga N, Hidayati DAN, Sattler G. Indonesian national inmate Bio-Behavioral
Survey for HIV and Syphilis prevalence and risk behaviors in Prisons and Detention Centers, 2010. SAGE
Open 2014; 4(1): 2158244013518924.
59. Kazi AM, Shah SA, Jenkins CA, Shepherd BE, Vermund SH. Risk factors and prevalence of tuberculosis,
human immunodeficiency virus, syphilis, hepatitis B virus, and hepatitis C virus among prisoners in
Pakistan. International journal of infectious diseases 2010; 14 Suppl 3: e60-6.
60. Nafees M, Qasim A, Jafferi G, Anwar MS, Muazzam M. HIV infection, HIV/HCV and HIV/HBV co-
infections among jail inmates of Lahore. Pakistan Journal of Medical Sciences 2011; 27(4): 837-41.

47
61. Pervaiz A, Ghafoor T, Asghar RJ. Screening of prisoners for Human Immunodeficiency Virus (HIV),
Hepatitis C (HCV) and B (HBV) in Punjab Province, Pakistan, 2009. International Journal of Infectious
Diseases 2012; 16: e359.
62. Safdar S, Mehmood A, Abbas SQ. Prevalence of HIV/AIDS among jail inmates in Sindh. The Journal of
the Pakistan Medical Association 2009; 59(2): 111-2.
63. Qadeer MI, Hasnain S, Yasmeen H. P3.367 Sero-Prevalence of Sexually Transmitted Disease (Hiv,
Syphilis, Hepatitis-B and Hepatitis-C) in Volunteer Donors of Gaol Inmates and Student Community in
Punjab Province of Pakistan. Sexually Transmitted Infections 2013; 89(Suppl 1): A264.
64. Shah SSA, Ali M, Ahmad M, Hamadan U. Screening of jail inmates for HIV and tuberculosis. Pakistan
Journal of Medical and Health Sciences 2013; 7(1): 172-5.
65. Avelino F, Feliciano J, Macabaya A. HIV, hepatitis B, hepatitis C and syphilis among inmates in Cebu City
Jails, Philippines: Seroprevalence and risk behaviours. Manila: Philippine National AIDS Council;
Department of Health;, 2014.
66. Weilandt C, Stover H, Eckert J, Grigoryan G. Anonymous survey on infectious diseases and related risk
behaviour among Armenian prisoners and prison staff. International Journal of Prisoner Health 2007;
3(1): 17-28.
67. Azbel L, Wickersham JA, Wegman MP, et al. Burden of substance use disorders, mental illness, and
correlates of infectious diseases among soon-to-be released prisoners in Azerbaijan. Drug and alcohol
dependence 2015; 151: 68-75.
68. Ravlija J, Vasilj I, Marijanovic I, Vasilj M. Risk behaviour of prison inmates in relation to HIV/STI.
Psychiatria Danubina 2014; 26 Suppl 2: 395-401.
69. Popov G, Plochev K. Prevalence and correlates of hepatitis C virus infection among inmates of Bulgarian
prisons. Clinical Microbiology and Infection 2011; 17: S753.
70. Popov G, Plochev K, Pekova L, Pishmisheva M, Popov T, Tchervenyakova T. Prevalence of viral hepatitis,
human immunodeficiency virus and syphilis among inmates of Bulgarian prisons. Journal of hepatology
2013; 58: S406.
71. Popov GT, Plochev KS, Chervenyakova TP. Prevalence of hepatitis C virus infection among juvenile
prisoners. Journal of hepatology 2012; 56: S546.
72. Kivimets K, Uuskula A. HIV testing and counselling in Estonian prisons, 2012 to 2013: aims, processes
and impacts. Euro surveillance 2014; 19(47): 20970.
73. Treso B, Barcsay E, Tarjan A, et al. Prevalence and correlates of HCV, HVB, and HIV infection among
prison inmates and staff, Hungary. Journal of urban health 2012; 89(1): 108-16.
74. UNODC. Accessibility of HIV Prevention, Treatment and Care SErvices for People who Use Drugs and
Incarcerated People in Azerbaijan, Kazakhstan, Kyrgyzstan, Tajikistan, Turkmenistan, and Uzbekistan:
Legislative and Policy Recommentations for Reform. Ashgabat, 2010.
75. (unknown). Testu izlietojums un testēšanas rezultātu ieslodzījuma vietās kopsavilkums (marts - septembris
2010. gads) [Test execution and test results in prisons Summary (March-September 2010)].
http://apvienibahiv.lv/docs/729/projekti_2010/Testu_izlietojums_final.doc (accessed 02 Sept. 2015.

48
76. Yapparov. [The epidemiological situation of HIV infection in the Republic of Bashkortostan in 2014],
2014.
77. Jovanovska T, Kocic B, Stojcevska VP. Prevalence, attitudes and knowledge about HIV HBV and HCV
infections among inmates in prisons Prilep and Bitola--a pilot study. Collegium antropologicum 2014;
38(2): 417-22.
78. Azbel L, Wickersham JA, Grishaev Y, Dvoryak S, Altice FL. Correlates of HIV infection and being
unaware of HIV status among soon-to-be-released Ukrainian prisoners. Journal of the International AIDS
Society 2014; 17: 19005.
79. Balakireva O, Sudakova V, Salabai N, Kryvoruk A. Analysis of HIV/AIDS Response in Penitentiary
System of Ukraine. [Ukraine]: Ukrainian Institute for Social Research after Olexander Yaremenko;
UNODC; 2012.
80. Garcia A, Rybak N, Vasylyev M, Flanigan T, Sluzhynska M. Hiv testing results for adults in Lviv, Ukraine
2005 to 2011: Where is the epidemic? Sexually transmitted diseases 2014; 41: S146.
81. Viitanen P, Vartiainen H, Aarnio J, et al. Hepatitis A, B, C and HIV infections among Finnish female
prisoners--young females a risk group. The Journal of infection 2011; 62(1): 59-66.
82. Semaille C, Le Strat Y, Chiron E, et al. Surveillance and outbreak reports: Prevalence of human
immunodeficiency virus and hepatitis c virus among French prison inmates in 2010: A challenge for public
health policy. Eurosurveillance 2013; 18(28).
83. Verneuil L, Vidal JS, Ze Bekolo R, et al. Prevalence and risk factors of the whole spectrum of sexually
transmitted diseases in male incoming prisoners in France. European journal of clinical microbiology &
infectious diseases 2009; 28(4): 409-13.
84. UCD Dublin, National Advisory Committee on Drugs and Alcohol. Drugs and Health in Irish Prisons: A
Report for Prisoners 2011.
85. Drummond A, Codd M, Donnelly N, et al. Study on the prevalence of drug use, including intravenous drug
use, and blood-borne viruses among the Irish prisoner population. Dublin: National Advisory Committee
on Drugs and Alcohol,, 2014.
86. Danis K, Doherty L, McCartney M, McCarrol J, Kennedy H. Hepatitis and HIV in Northern Ireland
prisons: a cross-sectional study. Eurosurveillance 2007; 12(1).
87. Ministere de la Sante. Data for HIV, HBV, and TBC in prisons of Luxembourg. Luxembourg: Ministere de
la Sante, 2015.
88. Barros H, Ramos E, Lucas R. A survey of HIV and HCV among female prison inmates in Portugal. Central
European Journal of Public Health 2008; 16(3): 116-20.
89. da Silva Marques NM, Margalho R, Melo MJ, da Cunha JGS, Melico-Silvestre AA. Seroepidemiological
survey of transmissible infectious diseases in a Portuguese prison establishment. Brazilian Journal of
Infectious Diseases 2011; 15(3): 272-5.
90. Ferrer-Castro V, Crespo-Leiro MR, Garcia-Marcos LS, et al. Evaluation of needle exchange program at
Pereiro de Aguiar prison (Ourense, Spain): ten years of experience. Revista espanola de sanidad
penitenciaria 2012; 14(1): 3-11.

49
91. Marco A, Gallego C, Blanco XR, Puig A, Arguelles MJ, Moruno L. An analysis of adherence to the
"Recommendations for the treatment of human immunodeficiency virus-infected adults" in a penitentiary in
Barcelona. Enfermedades infecciosas y microbiologia clinica 2013; 31(6): 392-5.
92. Marco A, Gallego C, Cayla JA. Incidence of hepatitis C infection among prisoners by routine laboratory
values during a 20-year period. PloS one 2014; 9(2): e90560.
93. Marco A, Saiz de la Hoya P, Garcia-Guerrero J, Grupo P. Multi-centre study of the prevalence of infection
from HIV and associated factors in Spanish prisons. Revista espanola de sanidad penitenciaria 2012;
14(1): 19-27.
94. Martin Sanchez V, Lopez Caleya JF, Nunez Vasquez MG, Moris Gonzalez ML, Perez Vicente R, Cayla
Buqueras JA. HCV and HIV infection, and coinfection in the Leon health area in the period 1993-2004.
Revista espanola de salud publica 2009; 83(4): 533-41.
95. Saiz De La Hoya P, Bedia M, Murcia J, Cebria J, Sanchez-Paya J, Portilla J. [Predictive markers of HIV
and HCV infection and co-infection among inmates in a Spanish prison]. Enfermedades infecciosas y
microbiologia clinica 2005; 23(2): 53-7.
96. Marco Mourino A, Gallego Castellvi C, Garcia de Olalla P, et al. Late diagnosis of HIV infection among
prisoners. AIDS reviews 2013; 15(3): 146-51.
97. Ministerio del Interior, Secretaria General de Instituciones Penitenciarias. Prevalencia de las infecciones
VIH y VHC en instituciones penitentciarias 2014. Madrid: Ministerio del Interior, , 2015.
98. Public Health England. Public Health England Health & Justice report 2014. London, 2014.
99. Calzavara L, Ramuscak N, Burchell AN, et al. Prevalence of HIV and hepatitis C virus infections among
inmates of Ontario remand facilities. Canadian Medical Association journal 2007; 177(3): 257-61.
100. Poulin C, Alary M, Lambert G, et al. Prevalence of HIV and hepatitis C virus infections among inmates of
Quebec provincial prisons. Canadian Medical Association journal 2007; 177(3): 252-6.
101. Baillargeon JG, Paar DP, Wu H, et al. Psychiatric disorders, HIV infection and HIV/hepatitis co-infection
in the correctional setting. AIDS Care 2008; 20(1): 124-9.
102. Beckwith CG, Atunah-Jay S, Cohen J, et al. Feasibility and acceptability of rapid HIV testing in jail. AIDS
Patient Care and STDs 2007; 21(1): 41-7.
103. Beckwith CG, Bazerman L, Cornwall AH, et al. An evaluation of a routine opt-out rapid HIV testing
program in a Rhode Island jail. AIDS Education and Prevention 2011; 23(3 Suppl): 96-109.
104. Beckwith CG, Liu T, Bazerman LB, et al. HIV risk behavior before and after HIV counseling and testing in
jail: a pilot study. Journal of acquired immune deficiency syndromes (1999) 2010; 53(4): 485-90.
105. Beckwith CG, Nunn A, Baucom S, et al. Rapid HIV testing in large urban jails. American Journal of Public
Health 2012; 102 Suppl 2: S184-6.
106. Begier EM, Bennani Y, Forgione L, et al. Undiagnosed HIV infection among New York City jail entrants,
2006: results of a blinded serosurvey. Journal of acquired immune deficiency syndromes (1999) 2010;
54(1): 93-101.
107. Beckwith C, Rick J, Flanigan T, et al. Routine Jail-Based HIV Testing --- Rhode Island, 2000--2007.
Morbidity and Mortality Weekly Report (MMWR) 2010; 59(24): 742-5.

50
108. Cocoros N, Nettle E, Church D, et al. Screening for Hepatitis C as a Prevention Enhancement (SHAPE) for
HIV: an integration pilot initiative in a Massachusetts County correctional facility. Public health reports
(Washington, DC: 1974) 2014; 129 Suppl 1: 5-11.
109. De Ravello L, Brantley MD, Lamarre M, Qayad MG, Aubert H, Beck-Sague C. Sexually transmitted
infections and other health conditions of women entering prison in Georgia, 1998-1999. Sexually
transmitted diseases 2005; 32(4): 247-51.
110. de Voux A, Spaulding AC, Beckwith C, et al. Early identification of HIV: empirical support for jail-based
screening. PloS one 2012; 7(5): e37603.
111. Harawa NT, Bingham TA, Butler QR, et al. Using arrest charge to screen for undiagnosed HIV infection
among new arrestees: a study in Los Angeles County. Journal of correctional health care 2009; 15(2): 105-
17.
112. Keleekai NL. Patterns and Predictors of HIV, Sexually Transmitted Infections, and Staphylococcus aureus
Co-Infection among New York State Prison Inmates: Columbia University; 2011.
113. MacGowan R, Margolis A, Richardson-Moore A, et al. Voluntary rapid human immunodeficiency virus
(HIV) testing in jails. Sexually transmitted diseases 2009; 36(2 Suppl): S9-13.
114. Rosen DL, Schoenbach VJ, Wohl DA, White BL, Stewart PW, Golin CE. Characteristics and behaviors
associated with HIV infection among inmates in the North Carolina prison system. American Journal of
Public Health 2009; 99(6): 1123-30.
115. Sieck CJ, Dembe AE. Results of a pilot study of pre-release STD testing and inmates' risk behaviors in an
Ohio prison. Journal of urban health 2011; 88(4): 690-9.
116. Spaulding A, Kim MJ, T Corpening K, Carpenter T, Watlington P, J Bowden C. Establishing an HIV
Screening Program Led by Staff Nurses in a County Jail. Journal of public health management and
practice 2014.
117. Strick LB, Macgowan RJ, Margolis A, Belcher L. HIV screening of male inmates during prison intake
medical evaluation - Washington, 2006-2010. Morbidity and Mortality Weekly Report 2011; 60(24): 811-3.
118. VanHandel M, Beltrami JF, MacGowan RJ, Borkowf CB, Margolis AD. Newly identified HIV infections
in correctional facilities, United States, 2007. American Journal of Public Health 2012; 102 Suppl 2: S201-
4.
119. Wohl DA, Golin C, Rosen DL, May JM, White BL. Detection of undiagnosed HIV among state prison
entrants. Jama 2013; 310(20): 2198-9.
120. Boisson EV, Trotman C. HIV seroprevalence among male prison inmates in the six countries of the
Organization of Eastern Caribbean states in the Caribbean (OECS). The West Indian medical journal 2009;
58(2): 106-11.
121. Gough E, Edwards P. HIV seroprevalence and associated risk factors among male inmates at the Belize
Central Prison. Revista panamericana de salud publica 2009; 25(4): 292-9.
122. Andrinopoulos K, Kerrigan D, Figueroa JP, et al. Establishment of an HIV/sexually transmitted disease
programme and prevalence of infection among incarcerated men in Jamaica. International Journal of STD
& AIDS 2010; 21(2): 114-9.

51
123. Hariga F. Evaluation and recommendations for the improvement of the health programmes, including for
the prevention and treatment of drug dependence and of HIV and AIDS, implemented in the establishments
under the responsibility of the Federal Penitentiary Service in Argentina: A follow-up of the 2008
assessment. Vienna: UNODC; 2011.
124. Lambert ML, Torrico F, Billot C, Mazina D, Marleen B, Van Stuyft PD. Street youths are the only high-
risk group for HIV in a low-prevalence South American country. Sexually transmitted diseases 2005;
32(4): 240-2.
125. Carbone Ada S, Paiao DS, Sgarbi RV, et al. Active and latent tuberculosis in Brazilian correctional
facilities: a cross-sectional study. BMC infectious diseases 2015; 15: 24-015-0764-8.
126. Coelho HC, Perdona GC, Neves FR, Passos AD. HIV prevalence and risk factors in a Brazilian
penitentiary. Cadernos de saude publica 2007; 23(9): 2197-204.
127. El Maerrawi I, Carvalho HB. Prevalence and risk factors associated with HIV infection, hepatitis and
syphilis in a state prison of Sao Paulo. International Journal of STD & AIDS 2015; 26(2): 120-7.
128. Fialho M, Messias M, Page-Shafer K, et al. Prevalence and risk of blood-borne and sexually transmitted
viral infections in incarcerated youth in Salvador, Brazil: opportunity and obligation for intervention. AIDS
and behavior 2008; 12(4 Suppl): S17-24.
129. Prellwitz IM, Alves BM, Ikeda ML, et al. HIV behind bars: human immunodeficiency virus cluster analysis
and drug resistance in a reference correctional unit from southern Brazil. PloS one 2013; 8(7): e69033.
130. Burattini MN, Strazza L, Paoliello AA, et al. The change from intravenous to crack cocaine and its impact
on reducing HIV incidence in Brazilian prisons. Int J STD AIDS 2005; 16(12): 836-7.
131. Rueda ZV, Lopez L, Velez LA, et al. High incidence of tuberculosis, low sensitivity of current diagnostic
scheme and prolonged culture positivity in four colombian prisons. A cohort study. PLoS One 2013; 8(11):
e80592.
132. Alvarado-Esquivel C, Sablon E, Martinez-Garcia S, Estrada-Martinez S. Hepatitis virus and HIV infections
in inmates of a state correctional facility in Mexico. Epidemiology and infection 2005; 133(4): 679-85.
133. Bautista S, Fernandez-Cerdeno A, Juarez-Figueroa L, Gonzalez-Rodriguez A, Sierra J, Volkow P. Sexually
transmitted infections in mexicocity's penitentiary centers: The ponte a prueba: Put yourself to the test
nullstudynull. Sexually transmitted infections 2011; 87: A153.
134. Bautista-Arredondo S. Prevalence of transmissible infections and socio-demographic and behavioral risk
factors amongst prisoners in Mexico City: A cross-sectional study of 17,296 inmates. Journal of the
International AIDS Society 2012; 15: 185.
135. Posada A, Diaz Tremarias M. HIV, hepatitis B and syphilis infection in inmates of Venezuela's prisons,
1998-2001. Revista espanola de sanidad penitenciaria 2008; 10(3): 73-9.
136. Mohtasham Amiri Z, Rezvani M, Jafari Shakib R, Jafari Shakib A. Prevalence of hepatitis C virus infection
and risk factors of drug using prisoners in Guilan province. Eastern Mediterranean health journal 2007;
13(2): 250-6.
137. Nokhodian Z, Ataei B, Kassaian N, Yaran M, Hassannejad R, Adibi P. Seroprevalence and Risk Factors of
Hepatitis C Virus among Juveniles in Correctional Center in Isfahan, Iran. International journal of
preventive medicine 2012; 3(Suppl 1): S113-7.

52
138. Sarkari B, Eilami O, Khosravani A, Sharifi A, Tabatabaee M, Fararouei M. High prevalence of hepatitis C
infection among high risk groups in Kohgiloyeh and Boyerahmad Province, Southwest Iran. Archives of
Iranian medicine 2012; 15(5): 271-4.
139. Ramia S, Mahfoud Z, Afifi R, et al. HIV and viral hepatitis (HBV and HCV) among four vulnerable groups
in Lebanon (P1203). 20th European Congress of Clinical Microbiology and Infectious Diseases. Vienna;
2010.
140. Thein HH, Butler T, Krahn M, et al. The effect of hepatitis C virus infection on health-related quality of life
in prisoners. Journal of urban health 2006; 83(2): 275-88.
141. Butler T, Allnutt S, Yang B. Mentally ill prisoners in Australia have poor physical health. International
Journal of Prisoner Health 2007; 3(2): 99-110.
142. Miller ER, Bi P, Ryan P. Hepatitis C virus infection in South Australian prisoners: seroprevalence,
seroconversion, and risk factors. International journal of infectious diseases 2009; 13(2): 201-8.
143. Mina M. Blood-Borne Viruses in New South Wales Prisons: Results from a Multi-Centre Study in
Australia: Category: Clinical lesson. Journal of Infection 2011; 63(6): e3.
144. Ministry of Justice. [Prisoners (sentenced) who became sick, 2014]. 2014.
http://www.moj.go.jp/housei/toukei/toukei_ichiran_kousei.html (accessed 02 Nov 2015).
145. Butt A, Jafri W, Janjua N, Pasha O. Seroprevalence and risk factors for hepatitis C infection among male
prisoners in Karachi, Pakistan. American Journal of Gastroenterology 2010; 105: S112.
146. Gorar ZA, Zulfikar I. Seropositivity of hepatitis C in prison inmates of Pakistan--a cross sectional study in
prisons of Sindh. The Journal of the Pakistan Medical Association 2010; 60(6): 476-9.
147. Memon AR, Shafique K, Memon A, Draz AU, Rauf MU, Afsar S. Hepatitis B and C prevalence among the
high risk groups of Pakistani population. A cross sectional study. Archives of public health 2012; 70(1): 9-
7367-70-9.
148. Niriella MA, Hapangama A, Luke HP, et al. Prevalence of hepatitis B and hepatitis C infections and their
relationship to injectable drug use in a cohort of Sri Lankan prison inmates. Ceylon Medical Journal 2015;
60(1): 18-20.
149. Lai SW, Chang WL, Peng CY, Liao KF. Viral hepatitis among male amphetamine-inhaling abusers.
Internal Medicine Journal 2007; 37(7): 472-7.
150. Burek V, Horvat J, Butorac K, Mikulic R. Viral hepatitis B, C and HIV infection in Croatian prisons.
Epidemiology and infection 2010; 138(11): 1610-20.
151. Sahin AM, Gundu z A, Sahin AR, et al. Prevalence of hepatitis B virus and hepatitis C virus among prison
inmates in Istanbul, Turkey. Hepatology International 2014; 8(1): S361.
152. Bonny C, Lamblin G, Lenat-Guyot A, et al. Alcohol liver disease is more frequent and more severe than
chronic viral hepatitis in jails of a french district. Journal of hepatology 2015; 62: S766-S7.
153. Remy AJ, France Ud. Hepatitis C in prison settings: screening and therapy are improving. Comparative
survey between 2000 and 2003. Presse medicale (Paris, France : 1983) 2006; 35(9 Pt 1): 1249-54.

53
154. Roux P, Sagaon-Teyssier L, Lions C, Fugon L, Verger P, Carrieri MP. HCV seropositivity in inmates and
in the general population: an averaging approach to establish priority prevention interventions. BMJ open
2014; 4(10): e005694-2014-.
155. Vergniol J, Capdepont M, El Aouadi S, et al. Prevalence of viral hepatitis and liver fibrosis in a population
of incomers in French prisons. UCSASCAN study. Hepatology 2014; 60: 922A-3A.
156. Meyer MF, Wedemeyer H, Monazahian M, Dreesman J, Manns MP, Lehmann M. Prevalence of hepatitis
C in a German prison for young men in relation to country of birth. Epidemiology and infection 2007;
135(2): 274-80.
157. Babudieri S, Longo B, Sarmati L, et al. Correlates of HIV, HBV, and HCV infections in a prison inmate
population: Results from a multicentre study in Italy. Journal of medical virology 2005; 76(3): 311-7.
158. Brandolini M, Novati S, De Silvestri A, et al. Prevalence and epidemiological correlates and treatment
outcome of HCV infection in an Italian prison setting. BMC public health 2013; 13: 981-2458-13-981.
159. Montella M, Crispo A, Grimaldi M, et al. Prevalence of hepatitis C virus infection in different population
groups in southern Italy. Infection 2005; 33(1): 9-12.
160. Sagnelli E, Starnini G, Sagnelli C, et al. Blood born viral infections, sexually transmitted diseases and
latent tuberculosis in italian prisons: a preliminary report of a large multicenter study. European review for
medical and pharmacological sciences 2012; 16(15): 2142-6.
161. van Laar M, Cruts A, van Gageldonk A, et al. The Netherlands Drug Situation 2010: Report to the
EMCDDA. Utrecht: Trimos-Instituut, 2011.
162. Taylor A, Munro A, Allen E, et al. Low incidence of hepatitis C virus among prisoners in Scotland.
Addiction (Abingdon, England) 2013; 108(7): 1296-304.
163. Saiz de la Hoya P, Marco A, Garcia-Guerrero J, Rivera A, Prevalhep study g. Hepatitis C and B prevalence
in Spanish prisons. European journal of clinical microbiology & infectious diseases 2011; 30(7): 857-62.
164. Duncan S, Sherrard J. Experience of screening for hepatitis C in an oxfordshire prison. Sexually transmitted
infections 2013; 89.
165. Kirwan P, Evans B, Sentinel Surveillance of Hepatitis Testing Study G, Brant L. Hepatitis C and B testing
in English prisons is low but increasing. Journal of public health (Oxford, England) 2011; 33(2): 197-204.
166. Mahto M, Zia S. Measuring the gap: from Home Office to the National Health Service in the provision of a
one-stop shop sexual health service in a female prison in the UK. International Journal of STD & AIDS
2008; 19(9): 586-9.
167. Murray E, Jones D. Audit into blood-borne virus services in Her Majesty's Prison Service. International
Journal of STD & AIDS 2008; 19(5): 347-8.
168. Samuel I, Ritchie D, McDonald C, Brady M, Taylor C. Should we be testing all inmates in young offender
institutes for hepatitis C? International Journal of STD and AIDS 2013; 24: 46.
169. Patten S. Environmental scan of injection drug use, related infectious diseases, high-risk behaviours, and
relevant programming in Atlantic Canada. Halifax, NS: Public Health Agency of Canada, Atlantic
Regional Office; 2006.

54
170. Bair RM, Baillargeon JG, Kelly PJ, et al. Prevalence and risk factors for hepatitis C virus infection among
adolescents in detention. Archives of Pediatrics & Adolescent Medicine 2005; 159(11): 1015-8.
171. Hennessey KA, Kim AA, Griffin V, Collins NT, Weinbaum CM, Sabin K. Prevalence of infection with
hepatitis B and C viruses and co-infection with HIV in three jails: a case for viral hepatitis prevention in
jails in the United States. Journal of urban health 2009; 86(1): 93-105.
172. Macalino GE, Dhawan D, Rich JD. A missed opportunity: hepatitis C screening of prisoners. American
Journal of Public Health 2005; 95(10): 1739-40.
173. Macalino GE, Vlahov D, Dickinson BP, Schwartzapfel B, Rich JD. Community incidence of hepatitis B
and C among reincarcerated women. Clinical infectious diseases 2005; 41(7): 998-1002.
174. Thomas AR, Keene WE, Cieslak PR. Seroprevalence of hepatitis B and C in juvenile detention entrants,
Oregon, 1994-1996. The Journal of adolescent health 2005; 37(5): 410-3.
175. Rosen DL, Schoenbach VJ, Wohl DA, White BL, Stewart PW, Golin CE. An evaluation of HIV testing
among inmates in the North Carolina prison system. American Journal of Public Health 2009; 99 Suppl 2:
S452-9.
176. Varan AK, Mercer DW, Stein MS, Spaulding AC. Hepatitis C seroprevalence among prison inmates since
2001: still high but declining. Public health reports (Washington, DC: 1974) 2013; 129(2): 187-95.
177. Baillargeon J, Snyder N, Soloway RD, et al. Hepatocellular carcinoma prevalence and mortality in a male
state prison population. Public Health Reports 2009; 124(1): 120.
178. Rhodes AG, Taxman FS, Friedmann PD, Cropsey KL. HCV in incarcerated populations: an analysis of
gender and criminality on risk. Journal of psychoactive drugs 2008; 40(4): 493-501.
179. Scott J, Sampson LA, Clymore JM, Moore PR, Leone PA. Integrated HIV, syphilis, and other STI testing
in North Carolina county jails. Sexually transmitted infections 2011; 87: A207.
180. Wang L, Smith L, Wright LN, et al. Changing dynamics of hepatitis c virus (HCV) and injection drug use
(IDU) as predictors of HIV infection among inmates entering the New York state (NYS) prison system
from 2000 to 2007. American Journal of Epidemiology 2010; 171: S134.
181. Fox RK, Currie SL, Evans J, et al. Hepatitis C virus infection among prisoners in the California State
correctional system. Clinical Infectious Diseases 2005; 41(2): 177-86.
182. Kim AY, Nagami EH, Birch CE, Bowen MJ, Lauer GM, McGovern BH. A simple strategy to identify
acute hepatitis C virus infection among newly incarcerated injection drug users. Hepatology 2013; 57(3):
944-52.
183. Kuncio DE, Newbern EC, Fernandez-Vina MH, Herdman B, Johnson CC, Viner KM. Comparison of risk-
based hepatitis C screening and the true seroprevalence in an urban prison system. Journal of urban health
: bulletin of the New York Academy of Medicine 2015; 92(2): 379-86.
184. Larney S, Mahowald MK, Scharff N, Flanigan TP, Beckwith CG, Zaller ND. Epidemiology of hepatitis C
virus in Pennsylvania state prisons, 2004-2012: limitations of 1945-1965 birth cohort screening in
correctional settings. American Journal of Public Health 2014; 104(6): e69-74.
185. McNamara BC, Losikoff PT, Huguenin L, Macalino GE, Rich JD, Gregory SH. Increasing hepatitis C
prevalence and associated risk behaviors among incarcerated young adults. Journal of urban health :
bulletin of the New York Academy of Medicine 2014; 91(2): 376-82.

55
186. Wenger PJ, Rottnek F, Parker T, Crippin JS. Assessment of hepatitis C risk factors and infection
prevalence in a jail population. American Journal of Public Health 2014; 104(9): 1722-7.
187. Barros LA, Pessoni GC, Teles SA, et al. Epidemiology of the viral hepatitis B and C in female prisoners of
Metropolitan Regional Prison Complex in the State of Goias, Central Brazil. Revista da Sociedade
Brasileira de Medicina Tropical 2013; 46(1): 24-9.
188. Coelho HC, de Oliveira SA, Miguel JC, et al. Predictive markers for hepatitis C virus infection among
Brazilian inmates. Revista da Sociedade Brasileira de Medicina Tropical 2009; 42(4): 369-72.
189. Falquetto TC, Endringer DC, Andrade TU, Lenz D. Hepatitis c in prisoners and non-prisoners in Colatina,
Espirito santo, Brazil. Brazilian Journal of Pharmaceutical Sciences 2013; 49(4): 737-44.
190. Pompilio MA, Pontes ERJC, Castro ARCM, et al. Prevalence and epidemiology of chronic hepatitis c
among prisoners of Mato Grosso do Sul State, Brazil. Journal of Venomous Animals and Toxins Including
Tropical Diseases 2011; 17(2): 216-22.
191. Santos BF, de Santana NO, Franca AV. Prevalence, genotypes and factors associated with HCV infection
among prisoners in Northeastern Brazil. World journal of gastroenterology : WJG 2011; 17(25): 3027-34.
192. Monsalve-Castillo F, Chacin-Bonilla L, Atencio RJ, et al. Low prevalence of hepatitis C virus infection in a
prisoner population from Maracaibo, Venezuela. Biomedica 2009; 29(4): 647-52.
193. Mir-Nasseri MM, Mohammadkhani A, Tavakkoli H, Ansari E, Poustchi H. Incarceration is a major risk
factor for blood-borne infection among intravenous drug users: Incarceration and blood borne infection
among intravenous drug users. Hepatitis monthly 2011; 11(1): 19-22.
194. Pourahmad M, Javady A, Karimi I, Ataei B, Kassaeian N. Seroprevalence of and risk factors associated
with hepatitis B, hepatitis C, and human immunodeficiency virus among prisoners in Iran. Infectious
Diseases in Clinical Practice 2007; 15(6): 368-72.
195. Salem F, Hekmat S, Aghasadeghi MR, Javadi F, Gholamz H, Mostafavi E. Prevalence and risk factors of
hepatitis B virus genotype d amongst inmates in alborz province, Iran: A cross-sectional survey.
Jundishapur Journal of Microbiology 2013; 6(6).
196. Khosravani A, Sarkari B, Negahban H, Sharifi A, Toori MA, Eilami O. Hepatitis B Infection among high
risk population: a seroepidemiological survey in Southwest of Iran. BMC infectious diseases 2012; 12: 378-
2334-12-378.
197. Azarkar Z, Sharifzadeh G. Evaluation of the Prevalence of Hepatitis B, Hepatitis C, and HIV in Inmates
with Drug-Related Convictions in Birjand, Iran in 2008. Hepatitis monthly 2010; 10(1): 26-30.
198. Larney S, Monkley DL, Indig D, Hampton SE. A cross-sectional study of susceptibility to vaccine-
preventable diseases among prison entrants in New South Wales. The Medical journal of Australia 2013;
198(7): 376-9.
199. Lin CF, Twu SJ, Chen PH, Cheng JS, Wang JD. Prevalence and determinants of hepatitis B antigenemia in
15,007 inmates in Taiwan. Journal of epidemiology 2010; 20(3): 231-6.
200. Getaz L, Wolff H. Hepatitis B: Prevalence, risk factors and knowledge of transmission modes among
inmates in a Swiss prison. Journal of General Internal Medicine 2011; 26: S144-S5.
201. Marsh K, Chan S, Wheatley N, Duffell S, Lau R, Hughes G. Missed STI and HIV testing opportunities
among male prisoners in England. Sexually transmitted infections 2013; 89.

56
202. Maruschak L, Berzofsky MPH, Unangst J. Medical Problems of State and Federal Prisoners and Jail
Inmates, 2011-2012. 2015. p. 23.
203. Santos Barros LA, Carolina Pessoni G, Araujo Teles S, et al. Epidemiology of the viral hepatitis B and C in
female prisoners of metropolitan regional prison complex in the State of Goias, Central Brazil. Revista da
Sociedade Brasileira de Medicina Tropical 2013; 46(1): 24-9.
204. Stief AC, Martins RM, Andrade SM, et al. Seroprevalence of hepatitis B virus infection and associated
factors among prison inmates in state of Mato Grosso do Sul, Brazil. Revista da Sociedade Brasileira de
Medicina Tropical 2010; 43(5): 512-5.
205. Abebe DS, Bjune G, Ameni G, Biffa D, Abebe F. Prevalence of pulmonary tuberculosis and associated risk
factors in Eastern Ethiopian prisons. International Journal of Tuberculosis and Lung Disease 2011; 15(5):
668-73.
206. Addis Z, Adem E, Alemu A, et al. Prevalence of smear positive pulmonary tuberculosis in Gondar
prisoners, North West Ethiopia. Asian Pacific Journal of Tropical Medicine 2015; 8(2): 127-31.
207. Moges B, Amare B, Asfaw F, et al. Prevalence of smear positive pulmonary tuberculosis among prisoners
in North Gondar Zone Prison, northwest Ethiopia. BMC Infect Dis 2012; 12: 352.
208. Banda HT, Gausi F, Harries AD, Salaniponi FM. Prevalence of smear-positive pulmonary tuberculosis
among prisoners in Malawi: a national survey. The international journal of tuberculosis and lung disease
2009; 13(12): 1557-9.
209. Nyasulu P, Mogoere S, Umanah T, Setswe G. Determinants of Pulmonary Tuberculosis among Inmates at
Mangaung Maximum Correctional Facility in Bloemfontein, South Africa. Tuberculosis research and
treatment 2015; 2015: 752709.
210. Habeenzu C, Mitarai S, Lubasi D, et al. Tuberculosis and multidrug resistance in Zambian prisons, 2000-
2001. The international journal of tuberculosis and lung disease 2007; 11(11): 1216-20.
211. Bah H, Cisse FA, Camara LM, Diallo OH, Sow OY. Prévalence de la tuberculose en milieu carcéral à
Conakry, République de Guinée. La Revue de Médecine Légale 2012; 3(4): 146-50.
212. Assefzadeh M, Barghi RG, Shahidi S. Tuberculosis case--finding and treatment in the central prison of
Qazvin province, Islamic Republic of Iran. Eastern Mediterranean health journal 2009; 15(2): 258-63.
213. Banu S, Hossain A, Uddin MK, et al. Pulmonary tuberculosis and drug resistance in Dhaka central jail, the
largest prison in Bangladesh. PloS one 2010; 5(5): e10759.
214. Banu S, Rahman MT, Uddin MK, et al. Effect of active case finding on prevalence and transmission of
pulmonary tuberculosis in Dhaka Central Jail, Bangladesh. PloS one 2015; 10(5): e0124976.
215. Leung CC, Chan CK, Tam CM, et al. Chest radiograph screening for tuberculosis in a Hong Kong prison.
International Journal of Tuberculosis and Lung Disease 2005; 9(6): 627-32.
216. Wong MY, Leung CC, Tam CM, Kam KM, Ma CH, Au KF. TB surveillance in correctional institutions in
Hong Kong, 1999-2005. The international journal of tuberculosis and lung disease 2008; 12(1): 93-8.
217. Margolis B, Al-Darraji HA, Wickersham JA, Kamarulzaman A, Altice FL. Prevalence of tuberculosis
symptoms and latent tuberculous infection among prisoners in northeastern Malaysia. Int J Tuberc Lung
Dis 2013; 17(12): 1538-44.
57
218. Jittimanee SX, Ngamtrairai N, White MC, Jittimanee S. A prevalence survey for smear-positive
tuberculosis in Thai prisons. The international journal of tuberculosis and lung disease 2007; 11(5): 556-
61.
219. Milanov V, Zamfirova M, Varleva T, Simeonova T, Trifonova M, Yaneva A. Factors associated with
tuberculosis among prisoners in Bulgaria for the period 2004-2013. European Respiratory Journal 2014;
44.
220. Pendzich J, Maksymowicz-Mazur W, Pawlowska J, et al. Tuberculosis among the homeless and inmates
kept in custody and in penitentiary institutions in the Silesia region. Pneumonologia i alergologia polska
2015; 83(1): 23-9.
221. Aksenova KI, Mishin VI, Chernyshev SI, Iurkevich OA, Sidorova SV. The detection and diagnosis of
pulmonary tuberculosis in an investigatory isolation ward. Problemy tuberkuleza i boleznei legkikh 2008;
(7)(7): 26-9.
222. Kosmak AV, Kopylov IF. Tuberculosis in a penitentiary somatic hospital. Problemy tuberkuleza i boleznei
legkikh 2008; (2)(2): 12-4.
223. Winetsky DE, Almukhamedov O, Pulatov D, Vezhnina N, Dooronbekova A, Zhussupov B. Prevalence,
risk factors and social context of active pulmonary tuberculosis among prison inmates in Tajikistan. PLoS
One 2014; 9(1): e86046.
224. Ongen G, Borekci S, Icmeli OS, et al. Pulmonary tuberculosis incidence in Turkish prisons: importance of
screening and case finding strategies. Tuberkuloz ve toraks 2013; 61(1): 21-7.
225. MacNeil JR, Lobato MN, Moore M. An unanswered health disparity: tuberculosis among correctional
inmates, 1993 through 2003. American Journal of Public Health 2005; 95(10): 1800-5.
226. Kuhleis D, Ribeiro AW, Costa ER, et al. Tuberculosis in a southern Brazilian prison. Memorias do Instituto
Oswaldo Cruz 2012; 107(7): 909-15.
227. Lemos AC, Matos ED, Bittencourt CN. Prevalence of active and latent TB among inmates in a prison
hospital in Bahia, Brazil. Jornal brasileiro de pneumologia 2009; 35(1): 63-8.
228. Nogueira PA, Abrahao RM, Galesi VM. Tuberculosis and latent tuberculosis in prison inmates. Revista de
saude publica 2012; 46(1): 119-27.
229. Sacchi F, Praça R, Tatara M, et al. Prisons as Reservoir for Community Transmission of Tuberculosis,
Brazil Emerging Infectious Diseases 2015; 21(3): 452-5.
230. Sanchez A, Gerhardt G, Natal S, et al. Prevalence of pulmonary tuberculosis and comparative evaluation of
screening strategies in a Brazilian prison. International Journal of Tuberculosis and Lung Disease 2005;
9(6): 633-9.
231. Sanchez A, Huber FD, Massari V, et al. Extensive Mycobacterium tuberculosis circulation in a highly
endemic prison and the need for urgent environmental interventions. Epidemiology and infection 2012;
140(10): 1853-61.
232. Sanchez A, Larouze B, Espinola AB, et al. Screening for tuberculosis on admission to highly endemic
prisons? The case of Rio de Janeiro State prisons. The international journal of tuberculosis and lung
disease 2009; 13(10): 1247-52.

58
233. Sanchez A, Massari V, Gerhardt G, et al. X ray screening at entry and systematic screening for the control
of tuberculosis in a highly endemic prison. BMC public health 2013; 13: 983-2458-13-983.
234. Vieira AA, Ribeiro SA, de Siqueira AM, Galesi VM, dos Santos LA, Golub JE. Prevalence of patients with
respiratory symptoms through active case finding and diagnosis of pulmonary tuberculosis among prisoners
and related predictors in a jail in the city of Carapicuiba, Brazil. Revista brasileira de epidemiologia 2010;
13(4): 641-50.
235. Schwitters A, Kaggwa M, Omiel P, Nagadya G, Kisa N, Dalal S. Tuberculosis incidence and treatment
completion among Ugandan prison inmates. Int J Tuberc Lung Dis 2014; 18(7): 781-6.
236. Noeske J, Ndi N, Mbondi S. Controlling tuberculosis in prisons against confinement conditions: A lost
case? Experience from Cameroon. International Journal of Tuberculosis and Lung Disease 2011; 15(2):
223-7.
237. Levy MH, Butler TG, Zhou J. Prevalence of Mantoux positivity and annual risk of infection for
tuberculosis in New South Wales prisoners, 1996 and 2001. New South Wales public health bulletin 2007;
18(7-8): 119-24.
238. Drobniewski FA, Balabanova YM, Ruddy MC, et al. Tuberculosis, HIV seroprevalence and intravenous
drug abuse in prisoners. The European respiratory journal 2005; 26(2): 298-304.
239. Dubrovina I, Miskinis K, Lyepshina S, et al. Drug-resistant tuberculosis and HIV in Ukraine: a threatening
convergence of two epidemics? The international journal of tuberculosis and lung disease 2008; 12(7):
756-62.
240. Raykhert I, Miskinis K, Lepshyna S, et al. HIV seroprevalence among new TB patients in the civilian and
prisoner populations of Donetsk Oblast, Ukraine. Scandinavian Journal of Infectious Diseases 2008; 40(8):
655-62.
241. Carbonara S, Babudieri S, Longo B, et al. Correlates of Myobacterium tuberculosis infection in a prison
population. European Respiratory Journal 2005; 25(6): 1070-6.
242. Kim S, Crittenden KS. Risk factors for tuberculosis among inmates: A retrospective analysis. Public Health
Nursing 2005; 22(2): 108-18.
243. Rueda ZV, Arroyave L, Marin D, et al. High prevalence and risk factors associated with latent tuberculous
infection in two Colombian prisons. The international journal of tuberculosis and lung disease 2014;
18(10): 1166-71.
244. Castaneda-Hernandez DM, Martinez-Ramirez JE, Bolivar-Mejia A, Rodriguez-Morales AJ. Differences in
TB incidence between prison and general populations, Pereira, Colombia, 2010-2011. Tuberculosis
(Edinburgh, Scotland) 2013; 93(3): 275-6.
245. Alizadeh AHM, Alavian SM, Jafari K, Yazdi N. Prevalence of hepatitis C virus infection and its related
risk factors in drug abuser prisoners in Hamedan - Iran. World Journal of Gastroenterology 2005; 11(26):
4085-9.
246. Ataei B, Babak A, Yaran M, et al. Hepatitis C in intravenous drug users: Seroprevalence and risk factors.
Journal of Isfahan Medical School 2011; 28(SPEC. ISSUE).
247. Behnaz K, Abdollah A, Fateme F, Mohammadreza R. Prevalence and risk factors of HIV, hepatitis B virus
and hepatitis C virus infections in drug addicts among Gorgan prisoners. Journal of Medical Sciences 2007;
7(2): 252-4.

59
248. Dana D, Zary N, Peyman A, Behrooz A. Risk Prison and Hepatitis B Virus Infection among Inmates with
History of Drug Injection in Isfahan, Iran. The Scientific World Journal 2013; 2013: 4.
249. Davoodian P, Dadvand H, Mahoori K, Amoozandeh A, Salavati A. Prevalence of selected sexually and
blood-borne infections in Injecting drug abuser inmates of bandar abbas and roodan correction facilities,
Iran, 2002. The Brazilian journal of infectious diseases 2009; 13(5): 356-8.
250. Dibaj R, Ataei B, Yaran M, Nokhodian Z, Tayeri K, Ali Z. Prevalence of HIV infection in inmates with
history of injection drug use and evaluation of risk factors, in Isfahan, Iran. Pakistan Journal of Medical
Sciences 2013; 29(1 SUPPL.): 399-402.
251. Kassaian N, Adibi P, Kafashaian A, Yaran M, Hassannejad R, Ataei B. Hepatitis C virus and associated
risk factors among prison inmates with history of drug injection in Isfahan, Iran. Hepatology International
2013; 7: S407.
252. Kazerooni PA, Lari MA, Joolaei H, Parsa N. Knowledge and attitude of male intravenous drug users on
HIV/AIDS associated high risk behaviors in Shiraz Pir-Banon jail, Fars Province, Southern Iran. Iranian
Red Crescent Medical Journal 2010; 12(3): 334-6.
253. Kheirandish P, SeyedAlinaghi S, Jahani M, et al. Prevalence and correlates of hepatitis C infection among
male injection drug users in detention, Tehran, Iran. Journal of Urban Health 2009; 86(6): 902-8.
254. Kheirandish P, Seyedalinaghi SA, Hosseini M, et al. Prevalence and correlates of HIV infection among
male injection drug users in detention in Tehran, Iran. Journal of Acquired Immune Deficiency Syndromes
2010; 53(2): 273-5.
255. Mir-Nasseri MM, Poustchi H, Nasseri-Moghadam S, et al. Hepatitis C seroprevalence among intravenous
drug users in Tehran. Journal of Research in Medical Sciences 2008; 13(6): 295-302.
256. Shirani K, Nokhodian Z, Kassaian N, Adibi P, Naeini AE, Ataei B. The prevalence of isolated hepatitis B
core antibody and its related risk factors among male injected drug users in Isfahan prisons. Advanced
biomedical research 2015; 4: 17-9175.148675. eCollection 2015.
257. Cameron B, Galbraith S, Li H, Lloyd A, investigators H. Correlates and characteristics of hepatitis C virus-
specific T-cell immunity in exposed uninfected high-risk prison inmates. Journal of viral hepatitis 2013;
20(4): e96-106.
258. Snow KJ, Young JT, Preen DB, Lennox NG, Kinner SA. Incidence and correlates of hepatitis C virus
infection in a large cohort of prisoners who have injected drugs. BMC public health 2014; 14: 830-2458-
14-830.
259. Teutsch S, Luciani F, Scheuer N, et al. Incidence of primary hepatitis C infection and risk factors for
transmission in an Australian prisoner cohort. BMC public health 2010; 10: 633-2458-10-633.
260. van Dooren K, Kinner SA, Hellard M. A comparison of risk factors for hepatitis C among young and older
adult prisoners. Journal of correctional health care 2014; 20(4): 280-91.
261. Lin CL, Liu CJ, Chen PJ, Lai MY, Chen DS, Kao JH. High prevalence of occult hepatitis B virus infection
in Taiwanese intravenous drug users. Journal of Medical Virology 2007; 79(11): 1674-8.
262. Ko NY, Hsu ST, Chen CH, Lee HC, Ko WC. Heroin dependence and bloodborne virus transmission
behaviors for HIV infection among newly incarcerated injection drug users in Taiwan. Substance use &
misuse 2011; 46(5): 591-8.

60
263. Hsieh HH, Huang JF, Dai CY, Yu ML, Chuang WL. Hepatitis C virus infection among injection drugs
used prisoners with and without human immunodeficiency virus infection. Hepatology International 2013;
7: S410-S1.
264. Kolaric B, Stajduhar D, Gajnik D, Rukavina T, Wiessing L. Seroprevalence of blood-borne infections and
population sizes estimates in a population of injecting drug users in Croatia. Central European journal of
public health 2010; 18(2): 104-9.
265. Abou-Saleh MT, Rice P, Foley S. Hepatitis C testing in drug users using the dried blood spot test and the
uptake of an innovative self-administered DBS test. Addictive Disorders and their Treatment 2013; 12(1):
40-9.
266. Stark K, Herrmann U, Ehrhardt S, Bienzle U. A syringe exchange programme in prison as prevention
strategy against HIV infection and hepatitis B and C in Berlin, Germany. Epidemiology and infection 2006;
134(4): 814-9.
267. Altice FL, Marinovich A, Khoshnood K, Blankenship KM, Springer SA, Selwyn PA. Correlates of HIV
infection among incarcerated women: Implications for improving detection of HIV infection. Journal of
Urban Health 2005; 82(2): 312-26.
268. Burt RD, Thiede H, Barash ET, Sabin K. Recent condom use by arrested injection drug users in King
County, Washington, USA. International Journal of Drug Policy 2006; 17(3): 222-9.
269. Bao YP, Liu ZM, Lian Z, et al. Prevalence and correlates of HIV and HCV infection among amphetamine-
type stimulant users in 6 provinces in China. J Acquir Immune Defic Syndr 2012; 60(4): 438-46.
270. Lin P, Wang M, Li Y, Zhang Q, Yang F, Zhao J. Detoxification center-based sampling missed a subgroup
of higher risk drug users, a case from Guangdong, China. PLoS One 2012; 7(4): e35189.
271. Wang H, Li G, Brown K, et al. The characteristics and risk factors for HIV infection among Beijing drug
users in different settings. Drug Alcohol Depend 2011; 113(1): 37-45.
272. Zhang L, Yap L, Reekie J, et al. Drug Use and HIV Infection Status of Detainees in Re-Education through
Labour Camps in Guangxi Province, China. International journal of environmental research and public
health 2015; 12(5): 4502-19.
273. Chu FY, Chiang SC, Su FH, Chang YY, Cheng SH. Prevalence of human immunodeficiency virus and its
association with hepatitis B, C, and D virus infections among incarcerated male substance abusers in
Taiwan. Journal of medical virology 2009; 81(6): 973-8.
274. Phan H. Hepatitis C and Human Immunodeficiency Virus Infections in Injecting Drug Users in Drug
Treatment Centers in Vietnam. Houston: Univ. of Texas; 2009.
275. Hosseini M, SeyedAlinaghi S, Kheirandish P, et al. Prevalence and correlates of co-infection with human
immunodeficiency virus and hepatitis C virus in male injection drug users in Iran. Archives of Iranian
Medicine 2010; 13(4): 318-23.
276. Seyed Alinaghi S, Kheirandish P, Esmaeili Djavid G, et al. Prevalence and correlates of co-infection with
human immunodeficiency virus and hepatitis C virus in male injection-drug users in Iran. Clinical
Microbiology and Infection 2010; 16: S334-S5.
277. SeyedAlinaghi SA, Kheirandish P, Karami N, et al. High prevalence of chronic hepatitis B infection among
injection drug users in Iran: the need to increase vaccination of adults at risk. Acta Medica Iranica 2010;
48(1): 58-60.

61
278. Zakizad M, Salmeh F, Yaghoobi T, et al. Seroprevalence of hepatitis C infection and associated risk factors
among addicted prisoners in Sari-Iran. Pakistan Journal of Biological Sciences 2009; 12(14): 1012-8.
279. Luciani F, Bretana NA, Teutsch S, et al. A prospective study of hepatitis C incidence in Australian
prisoners. Addiction (Abingdon, England) 2014; 109(10): 1695-706.
280. Macalino GE, Vlahov D, Sanford-Colby S, et al. Prevalence and incidence of HIV, hepatitis B virus, and
hepatitis C virus infections among males in Rhode Island prisons. Am J Public Health 2004; 94(7): 1218-
23.
281. Beyrer C, Malinowska-Sempruch K, Kamarulzaman A, Kazatchkine M, Sidibe M, Strathdee SA. Time to
act: a call for comprehensive responses to HIV in people who use drugs. Lancet 2010; 376(9740): 551-63.
282. Milloy MJ, Buxton J, Wood E, Li K, Montaner JS, Kerr T. Elevated HIV risk behaviour among recently
incarcerated injection drug users in a Canadian setting: a longitudinal analysis. BMC Public Health 2009;
9: 156.
283. Cepeda JA, Niccolai LM, Lyubimova A, Kershaw T, Levina O, Heimer R. High-risk behaviors after
release from incarceration among people who inject drugs in St. Petersburg, Russia. Drug Alcohol Depend
2015; 147: 196-202.
284. Wood E, Li K, Small W, Montaner JS, Schechter MT, Kerr T. Recent incarceration independently
associated with syringe sharing by injection drug users. Public Health Rep 2005; 120(2): 150-6.
285. Althoff AL, Zelenev A, Meyer JP, et al. Correlates of retention in HIV care after release from jail: results
from a multi-site study. AIDS Behav 2013; 17 Suppl 2: S156-70.
286. Iroh PA, Mayo H, Nijhawan AE. The HIV Care Cascade Before, During, and After Incarceration: A
Systematic Review and Data Synthesis. Am J Public Health 2015; 105(7): e5-16.
287. Jurgens R, Ball A, Verster A. Interventions to reduce HIV transmission related to injecting drug use in
prison. Lancet Infect Dis 2009; 9(1): 57-66.
288. Degenhardt L, Mathers B, Vickerman P, Rhodes T, Latkin C, Hickman M. Prevention of HIV infection for
people who inject drugs: why individual, structural, and combination approaches are needed. Lancet 2010;
376(9737): 285-301.
289. Foss AM, Watts CH, Vickerman P, et al. Could the CARE-SHAKTI intervention for injecting drug users
be maintaining the low HIV prevalence in Dhaka, Bangladesh? Addiction 2007; 102(1): 114-25.
290. Vickerman P, Kumaranayake L, Balakireva O, et al. The cost-effectiveness of expanding harm reduction
activities for injecting drug users in Odessa, Ukraine. Sex Transm Dis 2006; 33(10 Suppl): S89-102.
291. Dolan K, Wodak A, Hall W, Gaughwin M, Rae F. HIV risk behaviour of IDUs before, during and after
imprisonment in New South Wales. Addict Res 1996; 4(2): 151-60.
292. Baillargeon J, Giordano TP, Rich JD, et al. Accessing antiretroviral therapy following release from prison.
JAMA 2009; 301(8): 848-57.
293. Lima VD, Graf I, Beckwith CG, et al. The Impact of Implementing a Test, Treat and Retain HIV
Prevention Strategy in Atlanta among Black Men Who Have Sex with Men with a History of Incarceration:
A Mathematical Model. PLoS One 2015; 10(4): e0123482.

62
294. MacArthur GJ, Minozzi S, Martin N, et al. Opiate substitution treatment and HIV transmission in people
who inject drugs: systematic review and meta-analysis. BMJ 2012; 345: e5945.
295. Gowing L, Farrell M, Bornemann R, Sullivan L, Ali R. Substitution treatment of injecting opioid users for
prevention of HIV infection. Cochrane Database Syst Rev 2008; (2): CD004145.
296. Van Den Berg C, Smit C, Van Brussel G, Coutinho R, Prins M, Amsterdam C. Full participation in harm
reduction programmes is associated with decreased risk for human immunodeficiency virus and hepatitis C
virus: evidence from the Amsterdam Cohort Studies among drug users. Addiction 2007; 102(9): 1454-62.
297. Larney S, Toson B, Burns L, Dolan K. Effect of prison-based opioid substitution treatment and post-release
retention in treatment on risk of re-incarceration. Addiction 2012; 107(2): 372-80.
298. Hallett TB, Gregson S, Mugurungi O, Gonese E, Garnett GP. Assessing evidence for behaviour change
affecting the course of HIV epidemics: a new mathematical modelling approach and application to data
from Zimbabwe. Epidemics 2009; 1(2): 108-17.
299. Jolley E, Rhodes T, Platt L, et al. HIV among people who inject drugs in Central and Eastern Europe and
Central Asia: a systematic review with implications for policy. Bmj Open 2012; 2(5).
300. Botescu A, Abagiu A, Mardarescu M, Ursan M. HIV/AIDS among injecting drug users in Romania: Report
of a recent outbreak and initial response policies. Lisbon: European Monitoring Centre for Drugs and Drug
Addiction, 2012.
301. Khajehkazemi R, Osooli M, Sajadi L, et al. HIV prevalence and risk behaviours among people who inject
drugs in Iran: the 2010 National Surveillance Survey. Sexually Transmitted Infections 2013; 89: 29-32.
302. Dolan K, Kite B, Black E, et al. HIV in prison in low-income and middle-income countries. The Lancet
Infectious Diseases 2007; 7(1): 32-41.
303. Morozova O, Azbel L, Grishaev Y, Dvoryak S, Wickersham JA, Altice FL. Ukrainian prisoners and
community reentry challenges: implications for transitional care. Int J Prison Health 2013; 9(1): 5-19.
304. Navadeh S, Mirzazadeh A, Gouya MM, Farnia M, Alasvand R, Haghdoost AA. HIV prevalence and related
risk behaviours among prisoners in Iran: results of the national biobehavioural survey, 2009. Sex Transm
Infect 2013; 89 Suppl 3: iii33-6.
305. Jahani MR, Kheirandish P, Hosseini M, et al. HIV seroconversion among injection drug users in detention,
Tehran, Iran. AIDS (London, England) 2009; 23(4): 538-40.
306. Rahimi-Movaghar A, Amin-Esmaeili M, Haghdoost AA, Sadeghirad B, Mohraz M. HIV prevalence
amongst injecting drug users in Iran: a systematic review of studies conducted during the decade 1998-
2007. Int J Drug Policy 2012; 23(4): 271-8.
307. Hammett TM. HIV/AIDS and other infectious diseases among correctional inmates: transmission, burden,
and an appropriate response. Am J Public Health 2006; 96(6): 974-8.
308. Huang YF, Yang JY, Nelson KE, et al. Changes in HIV incidence among people who inject drugs in
Taiwan following introduction of a harm reduction program: a study of two cohorts. PLoS medicine 2014;
11(4): e1001625.
309. Strathdee SA, Hallett TB, Bobrova N, et al. HIV and risk environment for injecting drug users: the past,
present, and future. Lancet 2010; 376(9737): 268-84.

63
310. Baggaley RF, Boily MC, White RG, Alary M. Risk of HIV-1 transmission for parenteral exposure and
blood transfusion: a systematic review and meta-analysis. AIDS 2006; 20(6): 805-12.
311. Hollingsworth TD, Anderson RM, Fraser C. HIV-1 transmission, by stage of infection. J Infect Dis 2008;
198(5): 687-93.
312. Cohen MS, Dye C, Fraser C, Miller WC, Powers KA, Williams BG. HIV Treatment as Prevention: Debate
and Commentary-Will Early Infection Compromise Treatment-as-Prevention Strategies? Plos Medicine
2012; 9(7).
313. Attia S, Egger M, Muller M, Zwahlen M, Low N. Sexual transmission of HIV according to viral load and
antiretroviral therapy: systematic review and meta-analysis. AIDS 2009; 23(11): 1397-404.
314. Mellors JW, Munoz A, Giorgi JV, et al. Plasma viral load and CD4+ lymphocytes as prognostic markers of
HIV-1 infection. Annals of internal medicine 1997; 126(12): 946-54.
315. Prins M, Brettle RP, Robertson JR, et al. Geographical variation in disease progression in HIV-1
seroconverted injecting drug users in Europe? Int J Epidemiol 1999; 28(3): 541-9.
316. Schneider K, Kerr CC, Hoare A, Wilson DP. Expected epidemiological impacts of introducing an HIV
vaccine in Thailand: a model-based analysis. Vaccine 2011; 29(36): 6086-91.
317. Wolbers M, Babiker A, Sabin C, et al. Pretreatment CD4 cell slope and progression to AIDS or death in
HIV-infected patients initiating antiretroviral therapy--the CASCADE collaboration: a collaboration of 23
cohort studies. PLoS Med 2010; 7(2): e1000239.
318. When To Start Consortium, Sterne JA, May M, et al. Timing of initiation of antiretroviral therapy in AIDS-
free HIV-1-infected patients: a collaborative analysis of 18 HIV cohort studies. Lancet 2009; 373(9672):
1352-63.
319. Hammer SM, Eron JJ, Jr., Reiss P, et al. Antiretroviral treatment of adult HIV infection: 2008
recommendations of the International AIDS Society-USA panel. JAMA 2008; 300(5): 555-70.
320. Mathers BM, Degenhardt L, Ali H, et al. HIV prevention, treatment, and care services for people who
inject drugs: a systematic review of global, regional, and national coverage. Lancet 2010; 375(9719): 1014-
28.
321. Degenhardt L, Mathers BM, Wirtz AL, et al. What has been achieved in HIV prevention, treatment and
care for people who inject drugs, 2010-2012? A review of the six highest burden countries. International
Journal of Drug Policy 2014; 25(1): 53-60.
322. Walmsley R. World Prison Briefs. London: International Centre for Prison Studies,, 2013.
323. United Nations. World population prospects: the 2010 revision. Geneva: UN, 2011.
324. Mathers BM, Degenhardt L, Bucello C, Lemon J, Wiessing L, Hickman M. Mortality among people who
inject drugs: a systematic review and meta-analysis. Bulletin of the World Health Organization 2013;
91(2): 102-23.
325. Mathers BM, Degenhardt L, Phillips B, et al. Global epidemiology of injecting drug use and HIV among
people who inject drugs: a systematic review. The Lancet 2008; 372(9651): 1733-45.
326. Vickerman P, Watts C. The impact of an HIV prevention intervention for injecting drug users in
Svetlogorsk, Belarus: model predictions. International Journal of Drug Policy 2002; 13(3): 149-64.

64
327. Vickerman P, Platt L, Hawkes S. Modelling the transmission of HIV and HCV among injecting drug users
in Rawalpindi, a low HCV prevalence setting in Pakistan. Sex Transm Infect 2009; 85 Suppl 2: ii23-30.
328. Booth RE, Lehman WE, Dvoryak S, Brewster JT, Sinitsyna L. Interventions with injection drug users in
Ukraine. Addiction 2009; 104(11): 1864-73.
329. Perngmark P, Celentano DD, Kawichai S. Risk factors for HIV infection among drug injectors in southern
Thailand. Drug Alcohol Depend 2003; 71(3): 229-38.
330. Boelen L, Teutsch S, Wilson DP, et al. Per-event probability of hepatitis C infection during sharing of
injecting equipment. PLoS ONE 2014; 9(7).
331. Calzavara LM, Burchell AN, Schlossberg J, et al. Prior opiate injection and incarceration history predict
injection drug use among inmates. Addiction 2003; 98(9): 1257-65.
332. Hayashi K, Milloy MJ, Fairbairn N, et al. Incarceration experiences among a community-recruited sample
of injection drug users in Bangkok, Thailand. BMC Public Health 2009; 9: 492.
333. Motivans M. Federal Justice Statistics, 2006: Statistical Tables, 2009.
334. Aebi M, Delgrande N. Council of Eurpoe annual penal statistics: Space 2009 survey on prison populations.
2011.
335. van Horne S, Farrell G. Drug offenders in the global criminal justice system. HEUNI Paper No13; 1999.
336. Winter RJ, Stoove M, Degenhardt L, et al. Incidence and predictors of non-fatal drug overdose after release
from prison among people who inject drugs in Queensland, Australia. Drug Alcohol Depend 2015; 153: 43-
9.
337. Binswanger IA, Stern MF, Deyo RA, et al. Release from prison--a high risk of death for former inmates. N
Engl J Med 2007; 356(2): 157-65.
338. Fazel S, Wolf A. A Systematic Review of Criminal Recidivism Rates Worldwide: Current Difficulties and
Recommendations for Best Practice. PLoS One 2015; 10(6): e0130390.
Related Documents


![The Burden of Serious Fungal Infections in Kyrgyzstan...fungal infections [7], and this research inequity is greater in middle- and low-income countries [8]. J. Fungi 2019, 5, 66 2](https://static.cupdf.com/doc/110x72/5ec8e8321c491574b15ed3c7/the-burden-of-serious-fungal-infections-in-kyrgyzstan-fungal-infections-7.jpg)