Blue-200604-472OC [Revised - Clean] 1 Serial testing of health care workers for tuberculosis using interferon-γ assay Running title : Serial interferon-γ testing for TB Madhukar Pai, MD, PhD 1,2,3 Rajnish Joshi, MD, MPH 1,2 Sandeep Dogra, MD 2 Deepak K. Mendiratta, MD 2 Pratibha Narang, MD 2 Shriprakash Kalantri, MD, MPH 2 Arthur L. Reingold, MD 1 John M. Colford, Jr., MD, PhD 1 Lee W. Riley, MD 1 Dick Menzies, MD, MSc 4 1 Divisions of Epidemiology & Infectious Diseases, School of Public Health, University of California, Berkeley, USA; 2 Departments of Medicine & Microbiology, Mahatma Gandhi Institute of Medical Sciences, Sevagram, India; 3 Division of Pulmonary & Critical Care Medicine, San Francisco General Hospital, University of California, San Francisco, USA; 4 Montreal Chest Institute, McGill University, Montreal, Canada Correspondence: Madhukar Pai, MD, PhD University of California, Berkeley Division of Epidemiology, 140, Warren Hall Berkeley, CA 94720 Email: [email protected] Tel: 510-388-7137 ; Fax: 510-643-4927 Code list : 124 (tuberculosis: diagnostic) Grant support : Supported in part by a training grant from the Fogarty AIDS International Training Program (1-D43-TW00003-17), and Respiratory Epidemiology Unit, Montreal Chest Institute, Canada. Word count : 3294 This article has an online data supplement, which is accessible from this issue’s table of content at www.atsjournals.org AJRCCM Articles in Press. Published on May 11, 2006 as doi:10.1164/rccm.200604-472OC Copyright (C) 2006 by the American Thoracic Society.

Welcome message from author
This document is posted to help you gain knowledge. Please leave a comment to let me know what you think about it! Share it to your friends and learn new things together.
Transcript

Blue-200604-472OC [Revised - Clean]
1
Serial testing of health care workers for tuberculosis using interferon-γ assay
Running title: Serial interferon-γ testing for TB
Madhukar Pai, MD, PhD1,2,3 Rajnish Joshi, MD, MPH1,2 Sandeep Dogra, MD2 Deepak K.
Mendiratta, MD2 Pratibha Narang, MD2 Shriprakash Kalantri, MD, MPH2 Arthur L.
Reingold, MD1 John M. Colford, Jr., MD, PhD1 Lee W. Riley, MD1 Dick Menzies, MD,
MSc4
1Divisions of Epidemiology & Infectious Diseases, School of Public Health, University
of California, Berkeley, USA; 2Departments of Medicine & Microbiology, Mahatma
Gandhi Institute of Medical Sciences, Sevagram, India; 3Division of Pulmonary &
Critical Care Medicine, San Francisco General Hospital, University of California, San
Francisco, USA; 4Montreal Chest Institute, McGill University, Montreal, Canada
Correspondence:
Madhukar Pai, MD, PhD
University of California, Berkeley
Division of Epidemiology, 140, Warren Hall
Berkeley, CA 94720
Email: [email protected]
Tel: 510-388-7137 ; Fax: 510-643-4927
Code list: 124 (tuberculosis: diagnostic)
Grant support: Supported in part by a training grant from the Fogarty AIDS International
Training Program (1-D43-TW00003-17), and Respiratory Epidemiology Unit, Montreal
Chest Institute, Canada.
Word count: 3294
This article has an online data supplement, which is accessible from this issue’s table of
content at www.atsjournals.org
AJRCCM Articles in Press. Published on May 11, 2006 as doi:10.1164/rccm.200604-472OC
Copyright (C) 2006 by the American Thoracic Society.
Blue-200604-472OC [Revised - Clean]
2
ABSTRACT
Rationale: Although interferon-γ assays are promising alternatives to the tuberculin skin
test (TST), their serial testing performance is unknown.
Objective: To compare TST and interferon-γ conversions and reversions in healthcare
workers.
Methods: We prospectively followed-up 216 medical and nursing students in India who
underwent baseline and repeat testing (after 18 months) with TST and QuantiFERON-
TB-Gold In-Tube (QFT). TST conversions were defined as reactions >10 mm, with
increments of 6 or 10 mm over baseline. QFT conversions were defined as baseline
interferon-γ <0.35 and follow-up interferon-γ >0.35 or >0.70 IU/mL. QFT reversions
were defined as baseline interferon-γ >0.35 and follow-up interferon-γ <0.35 IU/mL.
Results: Of the 216 participants, 48 (22%) were TST-positive, and 38 (18%) were QFT-
positive at baseline. Among 147 participants with concordant baseline negative results,
TST conversions occurred in 14 (9.5%; 95% CI 5.3, 15.5) using the 6 mm increment, and
6 (4.1%; 95% CI 1.5, 8.7) using the 10 mm definition. QFT conversions occurred in
17/147 (11.6%; 95% CI 6.9, 17.9) using the definition of interferon-γ >0.35 IU/mL, and
11/147 (7.5%; 95% CI 3.8, 13.0) using interferon-γ >0.70 IU/mL. Agreement between
TST (10 mm increment) and QFT conversions (>0.70 IU/mL) was 96% (κ=0.70). QFT
reversions occurred in 2/28 (7%) participants with baseline concordant positive results, as
compared to 7/10 (70%) with baseline discordant results [P<0.001].
Conclusions: Interferon-γ assay shows promise for serial testing, but repeat results need
to be interpreted carefully. To meaningfully interpret serial results, the optimal thresholds
to distinguish new infections from non-specific variations must be determined.

Blue-200604-472OC [Revised - Clean]
3
Abstract word count: 250
Keywords: tuberculosis, interferon-gamma assay, tuberculin skin test, health care
workers, serial testing

Blue-200604-472OC [Revised - Clean]
4
INTRODUCTION
Tuberculosis (TB) infects an estimated third of the world’s population, and about 9
million cases occur ever year (1, 2). Because these individuals eventually present to
health care providers, health care workers (HCWs) are especially vulnerable to TB
exposure and infection (3, 4). Therefore, in many developed countries (e.g. US and
Canada), HCWs are screened with tuberculin skin testing (TST) to identify and treat
latent TB infection (LTBI) (3-6). However, effective screening requires a test that can
accurately and reliably diagnose LTBI and predict those most likely to progress to
disease. Unfortunately, the TST does not meet all these expectations; interpretation of
serial TST is particularly complicated because of boosting, conversions, and reversions
(7, 8).
With the emergence of interferon-gamma (IFN-γ) release assays (IGRAs) for
LTBI, there is interest in using them for screening contacts, immigrants, and other high-
risk groups (9-11). Available evidence, extensively reviewed elsewhere (9-14), suggests
that IGRAs have higher specificity than TST and are unaffected by previous BCG
vaccination. IGRAs avoid subjective measurements, can be repeated without boosting,
and eliminate the need for repeat visits and two-step testing; these features are ideal for
serial testing (9-12). In addition, IGRAs may actually detect recent as compared to
remote infection, and T-cell responses may be related to bacterial burden (15-18). In that
case, IGRAs may be particularly well suited to detect new infections (i.e. conversions).
Two commercial IGRAs are now available (QuantiFERON-TB Gold®, Cellestis
Limited, Carnegie, Australia; and T-SPOT.TB®, Oxford Immunotec, Oxon, UK), and
institutions in North America and Europe are beginning to replace TST with IGRAs (11,

Blue-200604-472OC [Revised - Clean]
5
12). In December 2005, the US Centers for Disease Control and Prevention (CDC)
published its interim guidelines on the US Food and Drug Administration (FDA)
approved version of QuantiFERON-TB Gold (QFT) assay (11), as well as TB infection
control in health care facilities (5). The CDC recommended that QFT can replace the
TST in all circumstances in which the TST is currently used, including serial testing (5,
11). The infection control guidelines suggest that health facilities can directly switch to
QFT for serial testing (without overlapping with TST), with a single QFT at baseline, and
a QFT conversion was defined as change from negative to positive result (5).
To date, there are no published data on the performance of IGRAs in serial
testing. There is a need to generate evidence on issues such as variability of IFN-γ
responses during serial testing, frequency of conversions and reversions, and thresholds
to distinguish new infection from nonspecific variation. We have conducted a preliminary
study of the performance of a commercial IGRA during serial testing by following up a
cohort of Indian HCWs. Some of the results have been previously reported in the form of
an abstract (19).
Blue-200604-472OC [Revised - Clean]
6
METHODS [word count: 536]
Study population and test procedures
In 2004, we established a cohort of HCWs at the Mahatma Gandhi Institute of
Medical Sciences (MGIMS), a rural hospital in India (20). Between January and May
2004, 726 HCWs underwent TST and IGRA testing. Additional information on this
cohort and baseline results are reported elsewhere (20) and described in the online data
supplement. At baseline, HCWs underwent a one-step TST using 1 TU PPD-RT23, the
standard dose in India (21). They also underwent the QuantiFERON-TB-Gold® In Tube
assay. As recommended by the manufacturer and based on previous studies (22-25), a
positive QFT was defined as IFN-γ >0.35 IU/mL. Because the ELISA cannot accurately
measure absolute IFN-γ values >10 IU/mL, such values were treated as 10 IU/mL.
Details of TST and QFT methods, and distributions of IFN-γ responses (Figure E1) are
described further in the online supplement.
In July 2005, we invited the 353 medical and nursing students who had undergone
baseline testing in January 2004 to undergo follow-up TST and QFT testing. Follow-up
TST was offered only to those who had TST <10 mm at baseline. Follow-up QFT was
offered to everybody. To minimize test-related variability, identical test protocols were
used for baseline and follow-up tests. Follow-up TST and QFT were performed by same
tuberculin reader and technician, respectively, blinded to the previous results.
Definitions of conversions and reversions
We used two definitions for TST conversions: 1) baseline TST <10 mm and
follow-up TST of >10 mm, with an increment of 6 mm; and 2) baseline TST <10 mm,
and follow-up TST of >10 mm, with an increment of 10 mm. While the more sensitive 6
Blue-200604-472OC [Revised - Clean]
7
mm increment has been suggested because random variations will result in differences of
<6 mm (7), the more stringent 10 mm increment threshold will be more specific (4-6).
In contrast to the data available on TST thresholds (3, 4, 6-8), no data exist on
serial IGRA testing in HCWs. Our choice of IFN-γ thresholds, therefore, was
exploratory: 1) baseline IFN-γ <0.35 IU/mL and follow-up IFN-γ >0.35 IU/mL (i.e. CDC
definition of QFT conversion (5)); and 2) baseline IFN-γ <0.35 IU/mL and follow-up
IFN-γ >0.70 IU/mL (twice the manufacturer’s diagnostic cut-point). In addition, we
considered a third definition: baseline IFN-γ <0.35 IU/mL and an absolute increase of at
least 0.35 IU/mL over the baseline value. However, because this definition produced
results similar to the first definition, the data are not reported. QFT reversions were
defined as baseline IFN-γ >0.35 and follow-up IFN-γ <0.35 IU/mL (i.e. change from
positive to negative). Because participants who were TST positive (>10 mm) at baseline
did not undergo repeat testing, TST reversions were not determined.
All participants gave informed consent, and the research was approved by ethics
committees at MGIMS, India, and the University of California, Berkeley, USA.
Participants with TST conversions were evaluated for TB disease and offered isoniazid
(INH) therapy.
Statistical analyses
Statistical analyses involved estimation of incidence of TST and QFT conversions
using varying definitions, and incidence of QFT reversions. Concordance between
dichotomized TST and QFT conversions were evaluated using agreement and kappa (κ)
statistics. We also evaluated association between absolute TST and IFN-γ changes, with
TST (mm induration) and QFT (IFN-γ levels in IU/mL) treated as continuous measures.

Blue-200604-472OC [Revised - Clean]
8
RESULTS
Participant description
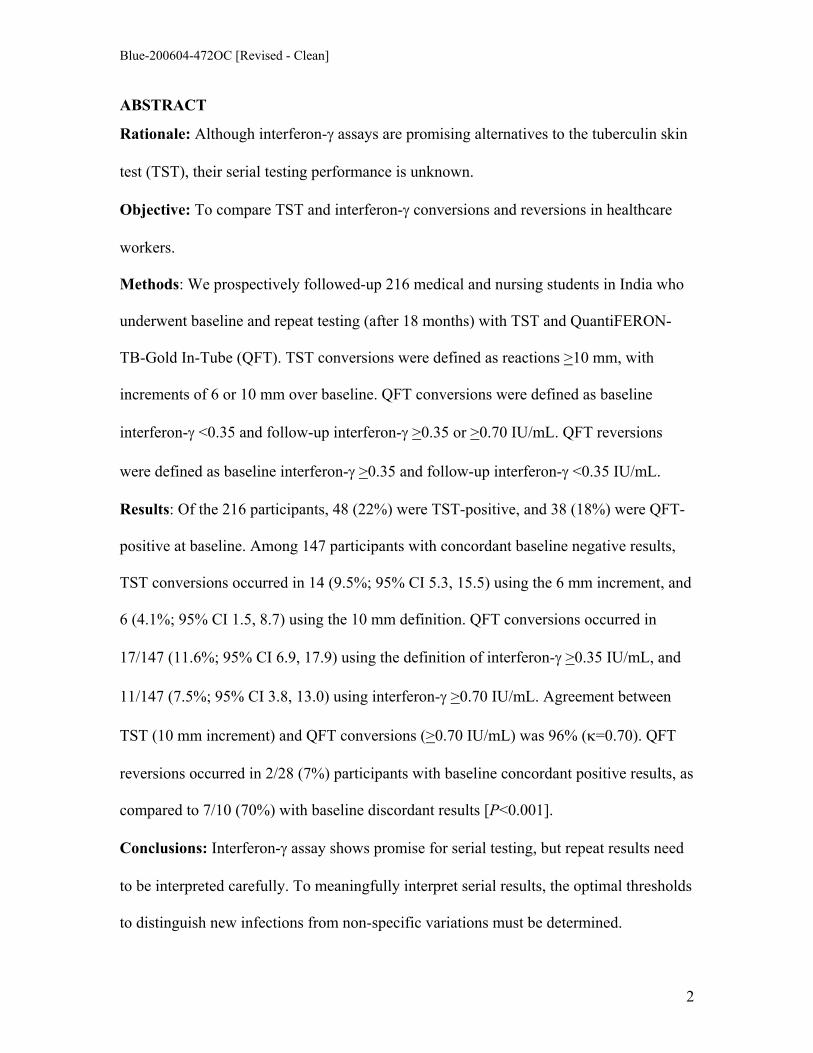
Of the 246 medical and nursing students eligible for follow-up TST and QFT
testing, 216 (88%) participated (Figure 1). The median age of the cohort was 21 years
(range 19 to 27 years), and 138 (64%) were women. 153 of 216 (71%) were medical
students (49% women), and the remaining 63 (29%) were nursing students (100%
women). 153 of 216 (71%) had BCG scars, and 16 of 216 (7%) had received INH therapy
after the baseline survey. 164 of 216 (76%) participants reported direct contact (i.e.
within conversational distance) with smear-positive TB patients since the baseline
survey.
As shown in Figure 1, at baseline, 48 of 216 (22%) HCWs were TST-positive,
and 38 of 216 (18%) were QFT-positive (86% agreement; kappa [κ]=0.57). 28 of 216
(13%) were positive by both TST and QFT (concordant positive). 158 of 216 (73%) were
negative by both (concordant negative). 30 of 216 (14%) were discordant at baseline; 20
were TST+/QFT-, and 10 were TST-/QFT+. The distribution of absolute IFN-γ responses
at baseline and after repeat testing is shown in Figure E1 (online appendix).
TST and QFT conversions
TST and QFT conversions were compared in the baseline concordant negative
group with valid follow-up TST and QFT results (N=147). As seen in Table 1, there were
more QFT than TST conversions, using either set of definitions. The estimated
conversion rates ranged from 4.1% to 14.9%, depending on the definitions used.
As seen in Table 2, when less stringent thresholds were used for both tests, the
agreement between TST and QFT conversions was high (κ=0.53; 95% CI 0.31, 0.76).

Blue-200604-472OC [Revised - Clean]
9
Agreement was higher when stringent thresholds were used for both tests (κ=0.70; 95%
CI 0.44, 0.94).
When stringent thresholds were used for both tests (Table 2, lower panel), every
HCW who had a TST conversion (10 mm increment) had QFT conversion (IFN-γ >0.70
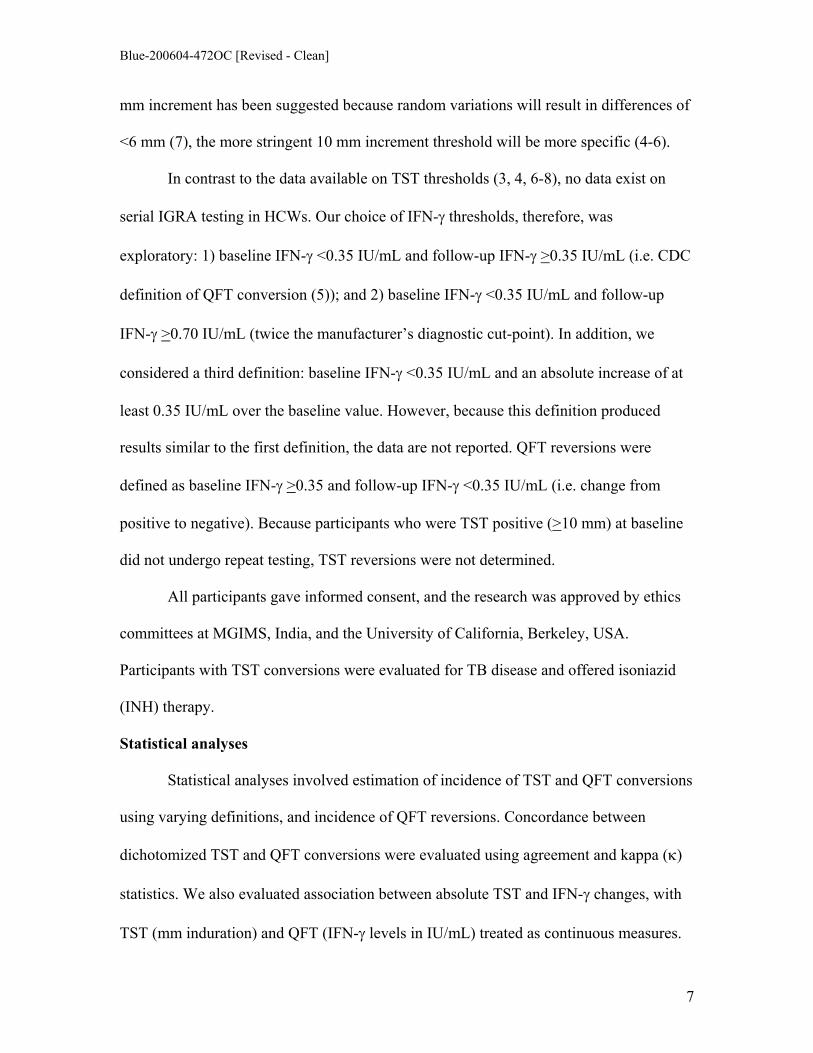
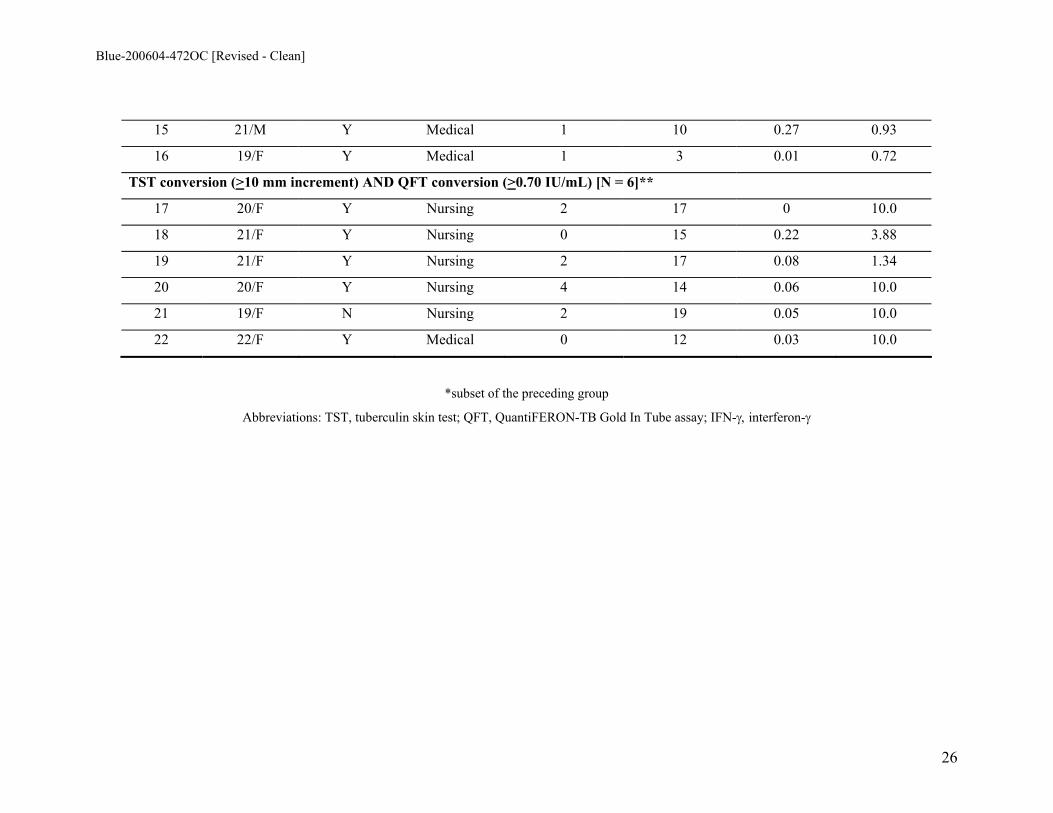
IU/mL). As shown in Table 3 (lowest panel), large increases (10+ mm increases over the
baseline) in TST induration were always accompanied by massive increases in IFN-γ that
were much higher than the diagnostic threshold (Figure E2, online supplement).
However, there were 5 individuals who had QFT conversions, but did not reach the 10
mm increment threshold on TST. As seen in Table 3 (middle panel), of these 5
individuals, 3 had TST increments of 7 - 9 mm, associated with substantial IFN-γ
increases. These may have been new TB infections, but missed by the use of the more
stringent threshold for the TST.
When less stringent thresholds were used for both tests, there was greater
discordance between TST and QFT (Table 2, top panel). There were 5 HCWs who had
TST but not QFT conversion. Table 3 (top panel) shows that most individuals in this
subgroup had modest increases in TST (3 of 5 just reached 10 mm on follow-up testing),
with small or no increases in IFN-γ responses. Another 8 HCWs had QFT conversion but
no TST conversion. Table 3 (top panel) shows that in most individuals in this subgroup,
the increases in IFN-γ were modest (6 of 8 had IFN-γ <0.70 IU/mL in the follow-up
testing), with small or no increases in TST.
Concordance between TST (6 mm increment) and QFT (>0.70 IU/mL)
conversions was 95% (κ=0.69); and concordance between TST (10 mm increment) and
QFT (>0.35 IU/mL) conversions was 92% (κ=0.49). These data are shown in Table E1,

Blue-200604-472OC [Revised - Clean]
10
online data supplement. At baseline and repeat testing, previous BCG vaccination had no
significant effect on either TST or QFT results (data not shown).
QFT reversions
QFT reversions were determined in the groups with baseline concordant positive
(QFT+/TST+), and discordant (QFT+/TST-) results. Reversions occurred in 2 of 28 (7%)
individuals with concordant positive results. In contrast, QFT reversions occurred in a
significantly higher proportion (7 of 10 [70%]) of participants with baseline discordant
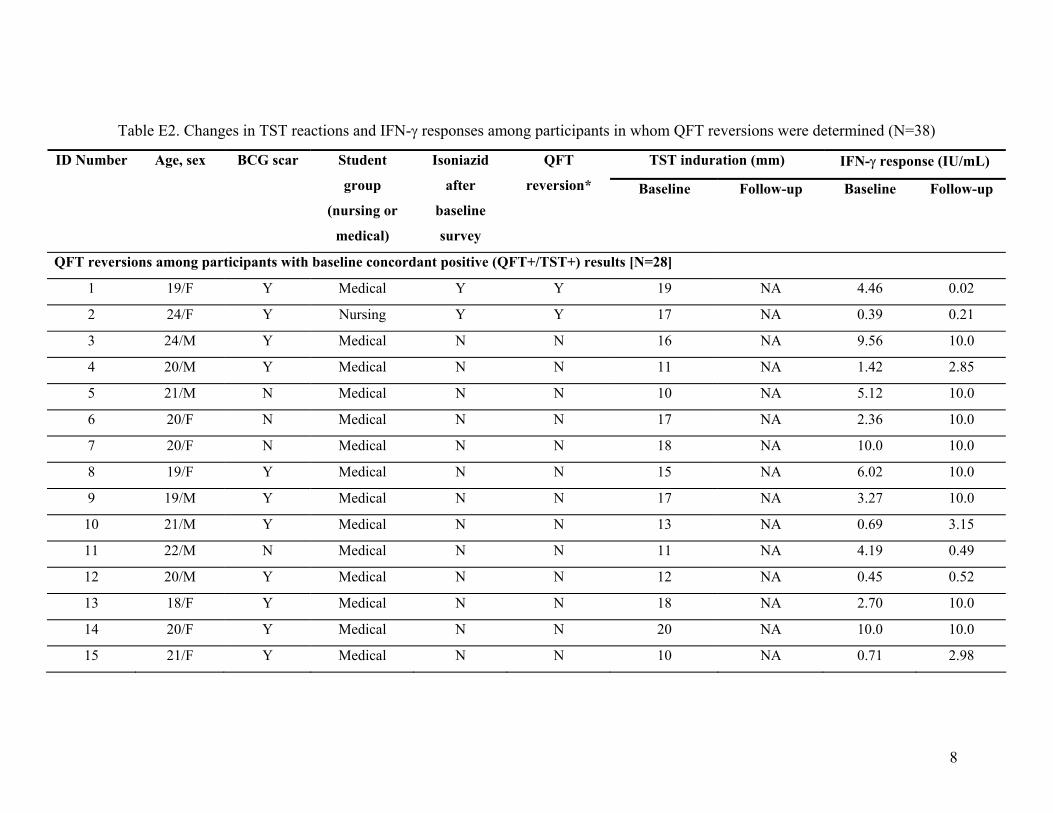
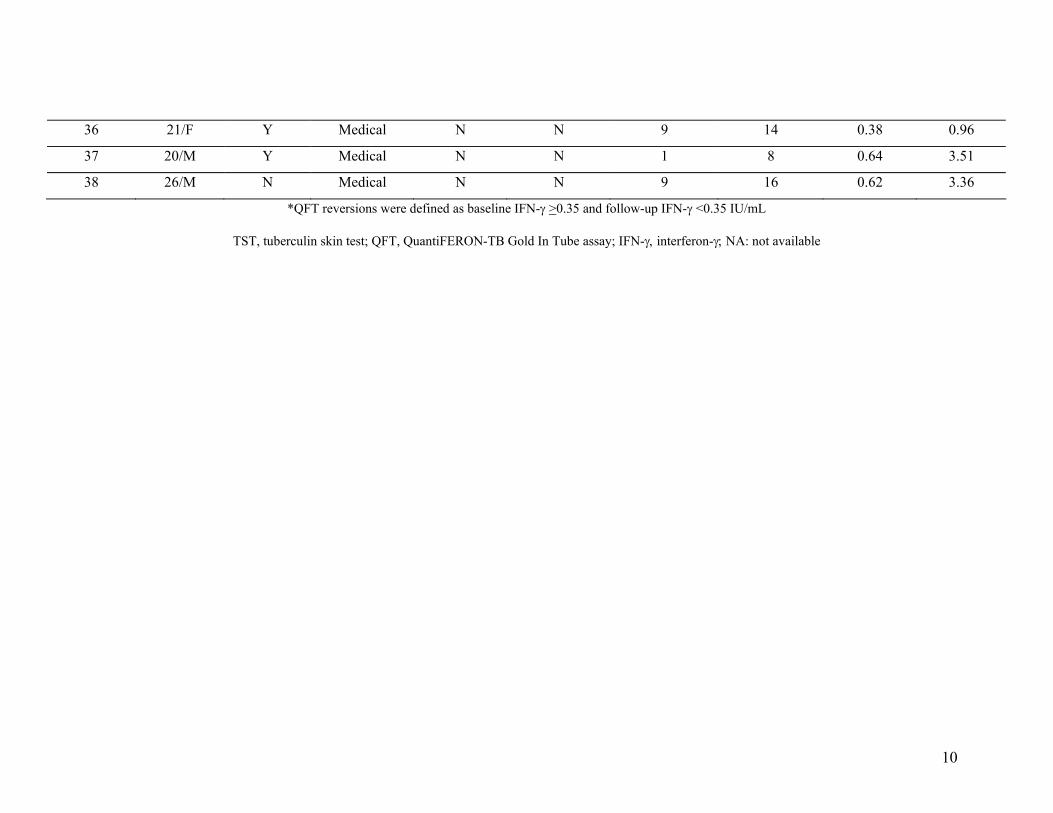
results (P<0.001). The absolute changes in TST and IFN-γ results are shown in Table E2
(online supplement). Overall, QFT reversion rates were significantly higher in those who
had baseline IFN-γ levels close to the cut-point (Table 4). The discordant group had
significantly lower IFN-γ levels (median 0.63 IU/mL) than the concordant group (median
5.6 IU/mL) [P<0.001].
Annual risk of TB infection (ARTI)
Recognizing the limitations of our current understanding of the optimal IFN-γ
threshold to define new infection, we generated a range of plausible estimates of risk of
new infection (Table 1). Based on the data presented in Tables 2 and 3, the use of less
stringent thresholds for TST or QFT could potentially result in misclassification of non-
specific variations as new infections. Therefore, a QFT value of >0.70 IU/mL on repeat
testing might be more specific for new infections. Using this stringent definition, which
identified all HCWs with a TST increment of >10 mm, 11 of 147 (7.5%) HCWs were
newly infected over an 18 month period, equivalent to an annual risk of infection (ARTI)
of 5% (95% CI 2% - 9%). Because the average community ARTI in India is about 1.5%
(26), the 3.5% excess risk among HCWs may be attributable to nosocomial exposure.

Blue-200604-472OC [Revised - Clean]
11
DISCUSSION
Screening of HCWs for TB is an important component of infection control
programs (3-5, 27). In North American alone, an estimated 13 to 14 million individuals
are employed in the health sector (28, 29); most undergo testing at least when recruited.
The current screening approach relies on the imperfect TST (7, 8). IGRAs are more
specific than TST, and have characteristics suited for serial testing (9, 13, 20).
Although QFT has been recommended for serial testing in the US (5, 11), there
are currently no data on how much IFN-γ responses will increase with new TB infection
as opposed to increases due to test-related error and biologic variations. To our
knowledge, this is the first report on conversions, reversions, and ARTI among HCWs
screened using the “In Tube” version of QFT; this assay, a simplified, improved version
of the FDA-approved QFT assay, uses antigen TB7.7 (Rv2654) in addition to the early
secreted antigenic target 6 (ESAT-6) and culture filtrate protein 10 (CFP-10) peptides,
and this may result in higher positivity (30).
Our preliminary data suggest that QFT, when used alone with a less stringent
threshold, produced a higher conversion rate than the TST with the 10 mm increment
threshold. While this might suggest that QFT has a higher sensitivity for detecting new
infections, it is also plausible that this represents lower specificity for conversions. Of the
HCWs who had a QFT conversion with the threshold of >0.35 IU/mL, nearly half did not
meet the 6 mm TST conversion criterion, suggesting that some of these were probably
false positive QFT conversions due to non-specific variations around the threshold.
It is important to note that there is strong evidence than QFT has high specificity
for diagnosis (9, 11-13); our concern is about specificity for conversion when the less

Blue-200604-472OC [Revised - Clean]
12
stringent, CDC-recommended negative to positive definition is used (5). As an
illustration, one HCW with a baseline IFN-γ level of 0.14 IU/mL had a repeat IFN-γ of
0.35 IU/mL (concurrent TST indurations were 2 and 5 mm, respectively). Does this
relatively small increase in IFN-γ responses (with only minor TST increase) constitute a
true conversion? What if, instead, the IFN-γ level had increased from 0.34 to 0.35
IU/mL? A TST increase from 9 mm to 10 mm will usually not be considered a true
conversion. Applying the same logic, a minor increase from 0.34 to 0.35 IU/mL may not
be a conversion; it may merely reflect non-specific IFN-γ variability. We approached this
problem by setting a higher threshold for QFT conversions. Even with a stringent
threshold, QFT produced a higher conversion rate than the TST with a 10 mm increment
threshold, raising the possibility that IGRAs may be more sensitive for recent
conversions (17, 31). This hypothesis deserves further study. However, it is important to
consider the possibility that IGRA sensitivity for existing LTBI may be different from
IGRA sensitivity for recent infection.
The TST, when used alone with the 10 mm increment threshold, produced the
lowest conversion rate. The TST may be less sensitive for conversions, but possibly more
specific. The TST, when used with a stringent threshold, may have missed some
individuals who have substantial increases in IFN-γ responses, as well as increases in
TST reactions, but just fail to make the 10 mm threshold. It is noteworthy that TST and
QFT conversions were strongly concordant when stringent thresholds were used for both
tests. Large increases (10+ mm) in TST indurations were always accompanied by
substantial increases in IFN-γ. This is an interesting finding because it suggests that
individuals with recent exposure have vigorous increases in T-cell responses, probably
Blue-200604-472OC [Revised - Clean]
13
due to active bacterial replication. As with a TST conversion, it is plausible that a QFT
conversion with strong increases in IFN-γ responses might be predictive of progression to
active disease. This is a critical area for future research (9-11, 13).
Our data on reversions, although limited, suggest that QFT reversions were
significantly more likely when the baseline test results were discordant than concordant.
Individuals who were concordant positive (TST+/QFT+) at baseline had very high IFN-γ
levels to begin with, in contrast to those who were discordant at baseline (TST-/QFT+).
Thus, reversions were less likely in those who had high baseline IFN-γ responses; this is
probably because IFN-γ responses have to drastically drop for the result to become
negative. In contrast, reversions were frequent in those with baseline IFN-γ levels close to
the diagnostic cut-point. Thus, most of the reversions in the discordant group were
probably due to non-specific variations around the diagnostic threshold. If a QFT test
reverted, this may well have been a false positive result at baseline. Alternatively, some
of these reversions may reflect spontaneous clearing of TB infection. Because we did not
repeat TST on participants who were previously TST-positive, we were unable to
compare QFT reversions with TST reversions.
Overall, our results show that conversions, reversions, and non-specific variations
occur with serial IGRA testing, as they do with TST. Although IGRAs are often thought
of as tests that produce simple yes/no results, our data suggest that these tests are
threshold dependent, and that the optimal thresholds to distinguish new infections from
non-specific variation are yet to be defined. Analogous to the TST, different thresholds
may be appropriate for different populations or settings (e.g. threshold for diagnosis
versus conversion). Further research is needed to validate IGRA thresholds (13, 32).
Blue-200604-472OC [Revised - Clean]
14
Our study had limitations. First, because of the small sample size, we were unable
to adequately evaluate risk factors for conversions and reversions. Second, although
standard in India (21), the use of 1 TU dose of PPD limits our ability to compare our
results with studies that have used the 2 TU dose. However, use of the 1 TU dose permits
a comparison of our ARTI with the community estimate for India (26). Third, because we
did not perform a two-step baseline TST, the first TST may have boosted the follow-up
TST results, and, potentially affected the second QFT results, since ESAT-6 and CFP10
are present in PPD (12). Because repeat TST and QFT were performed 18 months after
the baseline TST, the effect may be limited. In addition, there is some evidence that a
previous TST is unlikely to increase T cell responses in a subsequent IGRA (33). Fourth,
due to the lack of previous data on within subject IFN-γ variability and test
reproducibility, our choice of thresholds for conversions was arbitrary; these thresholds
need validation in larger, prospective studies. Last, despite using a trained TST reader
and blinded calipers, some amount of digit preference was noted, and this might have
influenced the assessment of TST conversions; digit preference is a known limitation of
the TST (8), and unlikely to affect IGRAs.
Acknowledging these limitations, our data provide a useful starting point for
understanding the complexity of serial IGRA testing. Also, our study provides new
information on TB among Indian HCWs. Even with the most stringent definition, ARTI
among HCWs was higher than the community ARTI in India (26). In fact, because we
included only young trainees with limited work experience, our study probably
underestimates the true ARTI among Indian HCWs. Our data underscores a need to study

Blue-200604-472OC [Revised - Clean]
15
nosocomial TB in India and devise control strategies appropriate for the high burden,
resource-limited setting (20, 27, 34, 35).
In conclusion, IGRAs show promise for serial testing, and may facilitate novel
approaches to nosocomial TB control. However, our results suggest that health care
facilities that switch to IGRAs for serial testing might observe higher conversion rates
than those with TST, especially if the less stringent definition is used for conversion.
There is a risk that such clusters of conversions might be interpreted as nosocomial
outbreaks. There is also a potential risk of over-treatment if non-specific increases in
IFN-γ are misinterpreted as conversions. Therefore, research is needed to understand the
biological basis of IGRA conversions and reversions, to optimize test reproducibility and
thresholds, and to determine risk factors for conversions and reversions.
Such studies are being initiated - the Tuberculosis Epidemiologic
Studies Consortium (TBESC) of the CDC is planning a multi-centric cohort study on
serial testing of HCWs using the TST and both commercially available IGRAs (Rachel
Albalak, TBESC, personal communication). Also, the CDC is planning a mechanism for
postmarketing surveillance of QFT (11). These important initiatives should enable a more
evidence-based approach to serial IGRA testing. Until then, health professionals should
be cautious about using a simplistic negative to positive definition of conversion, and
instead consider the amount of change in absolute IFN-γ responses, as well as relevant
clinical information (e.g. likelihood of exposure, concurrent TST results, if available) to
detect and treat conversions. Health facilities that plan to switch to IGRA for serial
testing should seek expert help from local and regional TB control programs, at least
during the initial phase of implementation.

Blue-200604-472OC [Revised - Clean]
16
Acknowledgments
We thank the medical and nursing students at MGIMS hospital, Sevagram, for their
enthusiastic participation, and Padmakar Dhone, BSc, Santosh Chavhan, BSW, Prashant
Raut, BA, Sandeep Taksande, DMLT, and Bharti Taksande, MD, for contributing to this
project. We are grateful to Puneet Dewan, MD (Centers for Disease Control &
Prevention, Atlanta, USA), Ashutosh Nath Aggarwal, MD (Postgraduate Institute of
Medical Education and Research, Chandigarh, India), Kevin Schwartzman, MD, and
Marcel Behr, MD (McGill University, Montreal, Canada) for providing critical feedback
on the draft manuscript.
Blue-200604-472OC [Revised - Clean]
17
REFERENCES 1. Corbett, E. L., C. J. Watt, N. Walker, D. Maher, B. G. Williams, M. C.
Raviglione, and C. Dye. 2003. The growing burden of tuberculosis: global trends and
interactions with the HIV epidemic. Arch Intern Med 163(9):1009-21.
2. World Health Organization. 2005. Global tuberculosis control. Surveillance,
planning, financing. WHO Report 2005. World Health Organization, Geneva. 1-247.
3. Menzies, D., A. Fanning, L. Yuan, and M. Fitzgerald. 1995. Tuberculosis among
health care workers. N Engl J Med 332(2):92-8.
4. Blumberg, H. M. 2004. Tuberculosis infection control in healthcare settings. In E.
Lautenbach and K. Woeltje, editors. Practical handbook for healthcare epidemiologists.
Slack Incorporated, New Jersey.
5. Centers for Disease Control and Prevention. 2005. Guidelines for preventing the
transmission of Mycobacterium tuberculosis in health-care settings, 2005. MMWR
54(No.RR-17):1-141.
6. American Thoracic Society. 2000. Targeted tuberculin testing and treatment of
latent tuberculosis infection. Am J Respir Crit Care Med 161(4 Pt 2):S221-47.
7. Menzies, D. 1999. Interpretation of repeated tuberculin tests. Boosting,
conversion, and reversion. Am J Respir Crit Care Med 159(1):15-21.
8. Menzies, R. I. 2000. Tuberculin skin testing. In L. B. Reichman and E. S.
Hershfield, editors. Tuberculosis: a comprehensive international approach. Marcel
Dekker, New York. 279-322.
9. Pai, M., L. W. Riley, and J. M. Colford, Jr. 2004. Interferon-gamma assays in the
immunodiagnosis of tuberculosis: a systematic review. Lancet Infect Dis 4(12):761-76.

Blue-200604-472OC [Revised - Clean]
18
10. Dheda, K., Z. F. Udwadia, J. F. Huggett, M. A. Johnson, and G. A. Rook. 2005.
Utility of the antigen-specific interferon-gamma assay for the management of
tuberculosis. Curr Opin Pulm Med 11(3):195-202.
11. Mazurek, G. H., J. Jereb, P. Lobue, M. F. Iademarco, B. Metchock, and A.
Vernon. 2005. Guidelines for using the QuantiFERON-TB Gold test for detecting
Mycobacterium tuberculosis infection, United States. MMWR Recomm Rep 54(RR-
15):49-55.
12. Rothel, J. S., and P. Andersen. 2005. Diagnosis of latent Mycobacterium
tuberculosis infection: is the demise of the Mantoux test imminent? Expert Rev Anti
Infect Ther 3(6):981-93.
13. Pai, M., S. Kalantri, and K. Dheda. 2006. New tools and emerging technologies
for the diagnosis of tuberculosis: Part 1. Latent tuberculosis. Expert Rev Mol Diag 6(3).
14. Pai, M., and D. M. Lewinsohn. 2005. Interferon-{gamma} Assays for
Tuberculosis: Is Anergy the Achilles' Heel? Am J Respir Crit Care Med 172(5):519-21.
15. Carrara, S., D. Vincenti, N. Petrosillo, M. Amicosante, E. Girardi, and D. Goletti.
2004. Use of a T cell-based assay for monitoring efficacy of antituberculosis therapy.
Clin Infect Dis 38(5):754-6.
16. Lalvani, A. 2004. Counting antigen-specific T cells: a new approach for
monitoring response to tuberculosis treatment? Clin Infect Dis 38(5):757-9.
17. Leyten, E. M., B. Mulder, C. Prins, K. Weldingh, P. Andersen, T. H. Ottenhoff, J.
T. van Dissel, and S. M. Arend. 2006. Use of enzyme-linked immunospot assay with
Mycobacterium tuberculosis-specific peptides for diagnosis of recent infection with M.
tuberculosis after accidental laboratory exposure. J Clin Microbiol 44(3):1197-201.
Blue-200604-472OC [Revised - Clean]
19
18. Hill, P. C., A. Fox, D. J. Jeffries, D. Jackson-Sillah, M. D. Lugos, P. K. Owiafe,
S. A. Donkor, A. S. Hammond, T. Corrah, R. A. Adegbola, K. P. McAdam, and R. H.
Brookes. 2005. Quantitative T cell assay reflects infectious load of Mycobacterium
tuberculosis in an endemic case contact model. Clin Infect Dis 40(2):273-8.
19. Pai, M., R. Joshi, S. Dogra, D. K. Mendiratta, P. Narang, S. P. Kalantri, A. L.
Reingold, J. M. Colford, L. W. Riley, and D. Menzies. 2006. QuantiFERON-TB Gold
assay for serial testing in health care workers: boosting, conversions, and reversions. 10th
Annual Meeting of the International Union Against Tuberculosis and Lung Disease
(North American Region), Chicago.
20. Pai, M., K. Gokhale, R. Joshi, S. Dogra, S. P. Kalantri, D. K. Mendiratta, P.
Narang, C. L. Daley, R. M. Granich, G. H. Mazurek, A. L. Reingold, L. W. Riley, and J.
M. Colford, Jr. 2005. Mycobacterium tuberculosis infection in health care workers in
rural India: comparison of a whole-blood, interferon-g assay with tuberculin skin testing.
JAMA 293:2746-2755.
21. Chadha, V. K., P. S. Jagannatha, P. S. Vaidyanathan, and P. Jagota. 2003. PPD
RT23 for tuberculin surveys in India. Int J Tuberc Lung Dis 7(2):172-9.
22. Mori, T., M. Sakatani, F. Yamagishi, T. Takashima, Y. Kawabe, K. Nagao, E.
Shigeto, N. Harada, S. Mitarai, M. Okada, K. Suzuki, Y. Inoue, K. Tsuyuguchi, Y.
Sasaki, G. H. Mazurek, and I. Tsuyuguchi. 2004. Specific detection of tuberculosis
infection: an interferon-gamma-based assay using new antigens. Am J Respir Crit Care
Med 170(1):59-64.

Blue-200604-472OC [Revised - Clean]
20
23. Brock, I., K. Weldingh, T. Lillebaek, F. Follmann, and P. Andersen. 2004.
Comparison of tuberculin skin test and new specific blood test in tuberculosis contacts.
Am J Respir Crit Care Med 170(1):65-9.
24. Dogra, S., P. Narang, D. K. Mendiratta, P. Chaturvedi, A. L. Reingold, J. M.
Colford, Jr., L. W. Riley, and M. Pai. 2006 (In Press). Comparison of a whole blood
interferon-gamma assay with tuberculin skin testing for the detection of tuberculosis
infection in hospitalized children in rural India. J Infect.
25. Ferrara, G., M. Losi, M. Meacci, B. Meccugni, R. Piro, P. Roversi, B. M.
Bergamini, R. D'Amico, P. Marchegiano, F. Rumpianesi, L. M. Fabbri, and L. Richeldi.
2005. Routine hospital use of a new commercial whole blood interferon-gamma assay for
the diagnosis of tuberculosis infection. Am J Respir Crit Care Med 172(5):631-5.
26. Chadha, V. K., P. Kumar, P. S. Jagannatha, P. S. Vaidyanathan, and K. P.
Unnikrishnan. 2005. Average annual risk of tuberculous infection in India. Int J Tuberc
Lung Dis 9(1):116-8.
27. World Health Organization. 1999. Guidelines for the prevention of tuberculosis in
health care facilities in resource-limited settings. World Health Organization, Geneva.
28. US Department of Labor - Bureau of Labor Statistics. Career Guide to Industries.
URL: http://www.bls.gov/oco/cg/cgs035.htm [date accessed: May 6, 2006].
29. Canadian Institute for Health Information. 2005. Canada's Health Care Providers.
2005 Chartbook. URL: http://www.cihi.ca/cihiweb/dispPage.jsp?cw_page=AR_35_E.
Ottawa, Canada.
30. Mahomed, H., E. J. Hughes, T. Hawkridge, D. Minnies, E. Simon, F. Little, W. A.
Hanekom, L. Geiter, and G. D. Hussey. 2006. Comparison of Mantoux skin test with

Blue-200604-472OC [Revised - Clean]
21
three generations of a whole blood IFN-g assay for tuberculosis infection. Int J Tuberc
Lung Dis 10(3):310-316.
31. Anderson, S. T., A. J. Williams, J. R. Brown, S. M. Newton, M. Simsova, M. P.
Nicol, P. Sebo, M. Levin, R. J. Wilkinson, and K. A. Wilkinson. 2006. Transmission of
Mycobacterium tuberculosis Undetected by Tuberculin Skin Testing. Am J Respir Crit
Care Med 173(9):1038-42.
32. Pai, M., S. Kalantri, and D. Menzies. 2006 (in press). Discordance between
tuberculin skin test and interferon-gamma assays [letter]. Int J Tuberc Lung Dis.
33. Richeldi, L., K. Ewer, M. Losi, P. Roversi, L. M. Fabbri, and A. Lalvani. 2006.
Repeated tuberculin testing does not induce false positive ELISPOT results. Thorax
61(2):180.
34. Bhanu, N. V., J. N. Banavalikar, S. K. Kapoor, and P. Seth. 2004. Suspected
small-scale interpersonal transmission of Mycobacterium tuberculosis in wards of an
urban hospital in Delhi, India. Am J Trop Med Hyg 70(5):527-31.
35. Rao, K. G., A. N. Aggarwal, and D. Behera. 2004. Tuberculosis among
physicians in training. Int J Tuberc Lung Dis 8(11):1392-4.

Blue-200604-472OC [Revised - Clean]
22
Figure Legend
Figure 1. Study flow diagram and baseline test results

Blue-200604-472OC [Revised - Clean]
23
Table 1. Incidence of TST and QFT conversions over a 18-month period among
participants who were concordantly negative by both tests at baseline (N=147)
Definition of conversion Number
serially
tested
Number of
conversions
Incidence of
conversions
(95% CI)
Tuberculin skin test (TST)
1. Baseline induration of <10 mm and follow-up
TST of >10 mm, with increment of >6 mm
147 14 9.5% (5.3, 15.5)
2. Baseline induration of <10 mm and follow-up
TST of >10 mm, with increment of >10 mm
147 6 4.1% (1.5, 8.7)
QuantiFERON-TB Gold In Tube assay (QFT)
3. Baseline IFN-γ <0.35 IU/mL and follow-up
IFN-γ >0.35 IU/mL
147 17 11.6% (6.9, 17.9)
4. Baseline IFN-γ <0.35 IU/mL and follow-up
IFN-γ >0.70 IU/mL
147 11 7.5% (3.8, 13.0)
Combinations of TST and QFT
#1 OR #3 147 22 14.9% (9.6, 21.8)
#2 OR #4 147 11 7.5% (3.8, 13.0)
#1 AND #3 147 9 6.1% (2.8, 11.3)
#2 AND #4 147 6 4.1% (1.5, 8.7)
Abbreviations: TST, tuberculin skin test; QFT, QuantiFERON-TB Gold In Tube assay; IFN-γ, interferon-
γ; CI, confidence interval

Blue-200604-472OC [Revised - Clean]
24
Table 2. Concordance between TST and QFT conversions among participants who were
concordantly negative by both tests at baseline (N=147)
Definition of TST
conversion*
Definition of QFT
conversion*
Agreement between TST
and QFT conversion
(κ; 95% CI for κ)
QFT conversion
(IFN-γ >0.35 IU/mL threshold)
Yes No
Yes 9 5 14TST conversion
(>6 mm increment) No 8 125 133
17 130 147
91% (0.53; 0.31, 0.76 )
QFT conversion
(IFN-γ >0.70 IU/mL threshold)
Yes No
Yes 6 0 6TST conversion
(>10 mm increment) No 5 136 141
11 136 147
96% (0.70; 0.44, 0.94)
*see Methods for a detailed description of the definitions used for conversion
Abbreviations: TST, tuberculin skin test; QFT, QuantiFERON-TB Gold In Tube assay; IFN-γ, interferon-
γ; κ, kappa; CI, confidence interval

Blue-200604-472OC [Revised - Clean]
25
Table 3. Changes in tuberculin skin test reactions and IFN-γ responses among participants who had either TST or QFT conversion
(N=22)
TST induration (mm) IFN-γ response (IU/mL) ID
Number
Age, sex BCG scar Student group
(nursing or
medical) Baseline Follow-up Baseline Follow-up
TST conversion (>6 mm increment) OR QFT conversion (>0.35 IU/mL) [N = 22]
1 21/M Y Medical 3 10 0 0.24
2 21/M Y Medical 6 6 0 0.62
3 22/F N Medical 3 10 0 0
4 24/M N Medical 5 7 0.11 0.42
5 22/M Y Medical 3 10 0.08 0.07
6 20/F Y Nursing 2 3 0 0.42
7 19/F Y Nursing 2 1 0 0.60
8 19/F N Nursing 5 11 0 0
9 20/F Y Nursing 2 5 0.14 0.35
10 21/M Y Medical 5 12 0.20 0
11 21/F Y Nursing 1 4 0 0.57
TST conversion (>6 mm increment) OR QFT conversion (>0.70 IU/mL) [N = 11]*
12 21/M N Medical 6 7 0 0.97
13 21/M Y Medical 5 12 0 2.34
14 21/F Y Nursing 4 13 0 10.0
Blue-200604-472OC [Revised - Clean]
26
15 21/M Y Medical 1 10 0.27 0.93
16 19/F Y Medical 1 3 0.01 0.72
TST conversion (>10 mm increment) AND QFT conversion (>0.70 IU/mL) [N = 6]**
17 20/F Y Nursing 2 17 0 10.0
18 21/F Y Nursing 0 15 0.22 3.88
19 21/F Y Nursing 2 17 0.08 1.34
20 20/F Y Nursing 4 14 0.06 10.0
21 19/F N Nursing 2 19 0.05 10.0
22 22/F Y Medical 0 12 0.03 10.0
*subset of the preceding group
Abbreviations: TST, tuberculin skin test; QFT, QuantiFERON-TB Gold In Tube assay; IFN-γ, interferon-γ

Blue-200604-472OC [Revised - Clean]
27
Table 4. Incidence of QFT reversions among health care workers with either QFT+/TST+
results, or QFT+/TST- results at baseline [N=38]
Baseline IFN-γ
response
(IU/mL)
Number re-
tested after
18 months
Number who
received INH after
baseline survey
(%)
Total
reversions
Incidence of
reversions
(%)
P-value for trend
in reversion rates
across IFN-γ
categories
0.35 – 0.69 11 1 (9) 6 6/11 (55)
0.7 – 1.0 2 0 (0) 1 1/2 (50)
1.1 – 5.0 9 3 (33) 1 1/9 (11)
>5.0 16 9 (56) 1 1/16 (6)
Total 38 13 (34) 9 9/38 (24)
<0.01
Abbreviations: TST, tuberculin skin test; QFT, QuantiFERON-TB Gold In Tube assay; IFN-γ,
interferon-γ; INH, isoniazid

Blue-200604-472OC [Revised - Clean]
28
Figure 1
353 total medical and nursing students at baseline with valid
TST and QFT results 107 ineligible (graduated from school or advanced
to internship)
216 recruited for follow-up TST and QFT testing
28 TST+/QFT+ at baseline (concordant
positive)
158 TST-/QFT- at baseline (concordant
negative)
20 TST+/QFT- at baseline (discordant)
10 TST-/QFT+ at baseline (discordant)
246 eligible students
30 refused to participate
TST indicates tuberculin skin test; QFT indicates QuantiFERON-TB Gold In Tube assay
TST cut-point >10 mm; QFT cut-point IFN-γ >0.35 IU/mL
Not eligible for follow-up TST
28 valid follow-up QFT
147 valid follow-up TST (11 TST refusals)
158 valid follow-up QFT
Not eligible for follow-up TST
20 valid follow-up QFT
10 valid follow-up TST 10 valid follow-up QFT
1
Serial testing of health care workers for tuberculosis using interferon-γ assay
Madhukar Pai, Rajnish Joshi, Sandeep Dogra, Deepak K. Mendiratta, Pratibha Narang,
Shriprakash Kalantri, Arthur L. Reingold, John M. Colford, Jr., Lee W. Riley, Dick
Menzies
Online Data Supplement
2
METHODS
Study cohort
In 2004, we established a cohort of HCWs at the Mahatma Gandhi Institute of
Medical Sciences (MGIMS), a rural medical school in India (1). Between January and
May 2004, 726 HCWs (median age, 22 years; 62% women) underwent tuberculin skin
test (TST) and IFN-γ testing. This cohort of 726 HCWs was comprised of 353 (49%)
medical students and nursing students, 73 (10%) interns and residents, 161 (22%) nurses,
13 (2%) attending physicians/faculty, and 126 (17%) orderlies and laboratory workers.
About 71% of the cohort had BCG vaccine scars, and only 5% had received TST prior to
the study. At baseline, of the 726 HCWs, 68% reported having had at least one direct
contact with a patient with TB (direct contact was defined as contact between two people
that is of sufficient distance to allow conversation between them (2)).
At baseline, these HCWs underwent a one-step TST and the QuantiFERON-TB
Gold® In Tube (QFT) assay. TST and QFT procedures are described below.
Tuberculin skin test
TST was performed using 1 TU PPD RT23 (Statens Serum Institut, Denmark),
the standard dosage used in India (3). 1 TU of the PPD was administered on the volar
surface of the forearm by a certified technician using the Mantoux method. The
maximum transverse diameter of the induration was read after 48 – 72 hours using a
blinded caliper.
QuantiFERON TB Gold In Tube assay
The QFT-Gold In Tube (Cellestis Limited, Victoria, Australia) assay involves two
stages: (1) incubation of whole blood with antigens, and (2) measurement of IFN-γ
3
production in harvested plasma by ELISA. Venous blood was directly collected into three
1mL heparin-containing tubes. One tube contained only heparin as negative control,
another also contained the T-cell mitogen phytohemagglutinin (PHA) as positive control,
and the third tube had overlapping peptides representing the entire sequences of ESAT-6
and CFP-10 and another peptide from the TB antigen TB7.7 (Rv2654). Within 2 - 6
hours of blood draw, the tubes were incubated at 37o C. After 24 hours of incubation, the
tubes were centrifuged and plasma was harvested and frozen at -70o C until the ELISA
was performed.
The amount of IFN-γ was quantified using the QFT ELISA. IFN-γ values
(IU/mL) for TB-specific antigens and mitogen were corrected for background by
subtracting the value obtained for the respective negative control. As recommended by
the manufacturer and based on previous studies (1, 4-7), a positive QFT was defined as
IFN-γ >0.35 IU/mL. Because the ELISA cannot accurately measure absolute IFN-γ
values >10 IU/mL, such values were treated as 10 IU/mL. QFT testing was performed at
the study site in India, and all assays met quality control standards. No indeterminate
results were noted.
Baseline results and distribution of interferon-γ responses
As reported elsewhere (1), at baseline (in 2004), valid TST results were available
for 720 of 726 HCWs, and valid QFT results were available for 725 of 726 HCWs. The
baseline prevalence estimates of TST and QFT-positivity were comparable (41% [95%
CI 38% – 45%] and 40% [95% CI 37% – 43%], respectively). Baseline agreement
between TST and QFT was high (81%, κ=0.61 [95% CI 0.56 – 0.67]). Increasing age and
4
years in the health profession were significant risk factors for both QFT and TST
positivity. BCG vaccination has little impact on TST and QFT results.
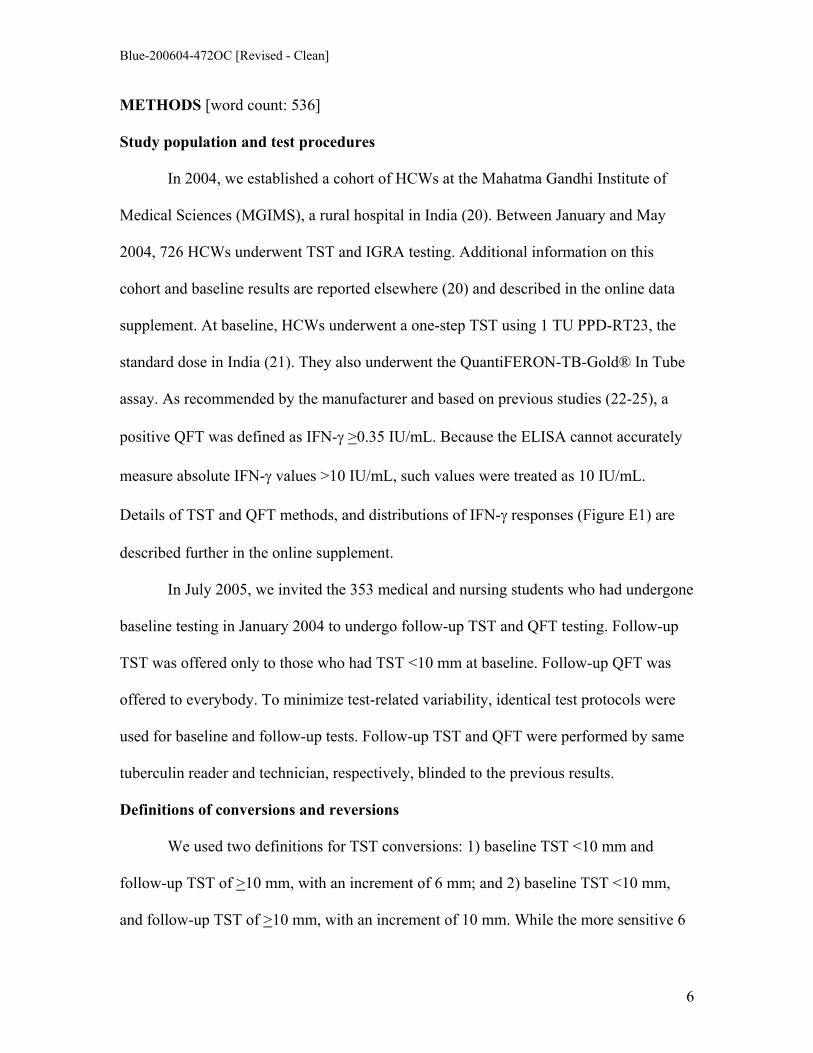
Figure E2A shows the distribution of IFN-γ responses. The mean IFN-γ level was
2.08 IU/mL, standard deviation 3.46 IU/mL, and median 0.11 IU/mL. Among the 216
medical and nursing students who participated in the repeat survey, the baseline mean
IFN-γ level was 0.86 IU/mL, standard deviation 2.45 IU/mL, and median 0.01 IU/mL
(Figure E2B). In the same cohort of students, the summary repeat QFT results were:
mean IFN-γ level 1.25 IU/mL, standard deviation 3.01 IU/mL, and median 0.02 IU/mL
(Figure E2C).
References for methods:
E1. Pai, M., K. Gokhale, R. Joshi, S. Dogra, S. P. Kalantri, D. K. Mendiratta, P.
Narang, C. L. Daley, R. M. Granich, G. H. Mazurek, A. L. Reingold, L. W. Riley, and J.
M. Colford, Jr. 2005. Mycobacterium tuberculosis infection in health care workers in
rural India: comparison of a whole-blood, interferon-g assay with tuberculin skin testing.
JAMA 293:2746-2755.
E2. Rieder, H. L. 1999. Epidemiologic basis of tuberculosis control. International
Union Against Tuberculosis and Lung Disease, Paris.
E3. Chadha, V. K., P. S. Jagannatha, P. S. Vaidyanathan, and P. Jagota. 2003. PPD
RT23 for tuberculin surveys in India. Int J Tuberc Lung Dis 7(2):172-9.

5
E4. Brock, I., K. Weldingh, T. Lillebaek, F. Follmann, and P. Andersen. 2004.
Comparison of tuberculin skin test and new specific blood test in tuberculosis contacts.
Am J Respir Crit Care Med 170(1):65-9.
E5. Mori, T., M. Sakatani, F. Yamagishi, T. Takashima, Y. Kawabe, K. Nagao, E.
Shigeto, N. Harada, S. Mitarai, M. Okada, K. Suzuki, Y. Inoue, K. Tsuyuguchi, Y.
Sasaki, G. H. Mazurek, and I. Tsuyuguchi. 2004. Specific detection of tuberculosis
infection: an interferon-gamma-based assay using new antigens. Am J Respir Crit Care
Med 170(1):59-64.
E6. Mahomed, H., E. J. Hughes, T. Hawkridge, D. Minnies, E. Simon, F. Little, W. A.
Hanekom, L. Geiter, and G. D. Hussey. 2006. Comparison of Mantoux skin test with
three generations of a whole blood IFN-g assay for tuberculosis infection. Int J Tuberc
Lung Dis 10(3):310-316.
E7. Dogra, S., P. Narang, D. K. Mendiratta, P. Chaturvedi, A. L. Reingold, J. M.
Colford, Jr., L. W. Riley, and M. Pai. 2006 (In Press). Comparison of a whole blood
interferon-gamma assay with tuberculin skin testing for the detection of tuberculosis
infection in hospitalized children in rural India. J Infect.

6
Figure legends Figure E1: Distribution of interferon-γ responses at baseline and follow-up. Note: IFN-γ values >10 IU/mL have been displayed as 10 IU/mL. The vertical line indicates the QFT cut-point of 0.35 IU/mL. Figure E2. Correlation between absolute increases in tuberculin skin test (TST) induration and interferon-γ (IFN-γ) responses among health care workers with TST conversions (10 mm increment) [N=6]. Note: IFN-γ values >10 IU/mL have been shown as 10 IU/mL

7
Table E1. Concordance between TST and QFT conversions among participants who were
concordantly negative by both tests at baseline (N=147)
Definition of TST
conversion*
Definition of QFT
conversion*
Agreement between TST
and QFT conversion
(κ; 95% CI for κ)
QFT conversion
(>0.70 IU/mL threshold)
Yes No
Yes 9 5 14TST conversion (>6
mm increment) No 2 131 133
11 136 147
95% (0.69; 0.48, 0.91)
QFT conversion
(>0.35 IU/mL threshold)
Yes No
Yes 6 0 6TST conversion (>10
mm increment) No 11 130 141
17 130 147
92% (0.49; 0.24, 0.74)
*see Methods in the main manuscript for a detailed description of the definitions used for conversion
Abbreviations: TST, tuberculin skin test; QFT, QuantiFERON-TB Gold In Tube assay; IFN-γ, interferon-γ
κ, kappa; CI, confidence interval
8
Table E2. Changes in TST reactions and IFN-γ responses among participants in whom QFT reversions were determined (N=38)
TST induration (mm) IFN-γ response (IU/mL) ID Number Age, sex BCG scar Student
group
(nursing or
medical)
Isoniazid
after
baseline
survey
QFT
reversion* Baseline Follow-up Baseline Follow-up
QFT reversions among participants with baseline concordant positive (QFT+/TST+) results [N=28]
1 19/F Y Medical Y Y 19 NA 4.46 0.02
2 24/F Y Nursing Y Y 17 NA 0.39 0.21
3 24/M Y Medical N N 16 NA 9.56 10.0
4 20/M Y Medical N N 11 NA 1.42 2.85
5 21/M N Medical N N 10 NA 5.12 10.0
6 20/F N Medical N N 17 NA 2.36 10.0
7 20/F N Medical N N 18 NA 10.0 10.0
8 19/F Y Medical N N 15 NA 6.02 10.0
9 19/M Y Medical N N 17 NA 3.27 10.0
10 21/M Y Medical N N 13 NA 0.69 3.15
11 22/M N Medical N N 11 NA 4.19 0.49
12 20/M Y Medical N N 12 NA 0.45 0.52
13 18/F Y Medical N N 18 NA 2.70 10.0
14 20/F Y Medical N N 20 NA 10.0 10.0
15 21/F Y Medical N N 10 NA 0.71 2.98

9
16 21/F N Medical N N 18 NA 4.69 10.0
17 20/F N Medical N N 20 NA 10.0 10.0
18 19/F Y Nursing Y N 14 NA 10.0 10.0
19 19/F Y Nursing Y N 18 NA 10.0 5.86
20 21/M Y Medical Y N 14 NA 4.47 10.0
21 19/F Y Nursing Y N 15 NA 10.0 10.0
22 19/F N Nursing Y N 15 NA 1.21 10.0
23 19/F N Nursing Y N 20 NA 10.0 3.31
24 18/F N Nursing Y N 18 NA 10.0 10.0
25 19/F Y Nursing Y N 17 NA 10.0 10.0
26 19/F N Nursing Y N 19 NA 10.0 2.04
27 19/F Y Nursing Y N 16 NA 10.0 1.51
28 20/M N Medical Y N 15 NA 8.14 6.73
QFT reversions among participants with baseline discordant (QFT+/TST-) results [N=10]
29 20/M Y Medical N Y 2 14 0.61 0.12
30 21/F Y Medical N Y 4 5 0.64 0
31 18/F Y Nursing N Y 7 6 0.54 0.03
32 20/F Y Medical N Y 0 3 0.68 0.05
33 19/F Y Nursing N Y 2 3 5.46 0
34 19/F N Medical N Y 4 5 0.40 0
35 24/M Y Medical N Y 6 12 0.83 0.28
10
36 21/F Y Medical N N 9 14 0.38 0.96
37 20/M Y Medical N N 1 8 0.64 3.51
38 26/M N Medical N N 9 16 0.62 3.36
*QFT reversions were defined as baseline IFN-γ >0.35 and follow-up IFN-γ <0.35 IU/mL
TST, tuberculin skin test; QFT, QuantiFERON-TB Gold In Tube assay; IFN-γ, interferon-γ; NA: not available

11
Figure E1: Distribution of interferon-γ responses at baseline and follow-up
(A) Among all HCWs at baseline (N=725)
020
4060
Pro
porti
on
0 2 4 6 8 10IFN-gamma values (IU/mL)
(B) Among medical and nursing students at baseline (N=216)
020
4060
80P
ropo
rtion
0 2 4 6 8 10IFN-gamma values (IU/mL)
(C) Among medical and nursing students at follow-up (N=216)
020
4060
80P
ropo
rtion
0 2 4 6 8 10IFN-gamma values (IU/mL)

12
Figure E2. Correlation between absolute increases in tuberculin skin test (TST) induration and interferon-γ (IFN-γ) responses among health care workers with TST
conversions (10 mm increment) [N=6]
(A) Absolute increases in TST induration
(B) Absolute increases in IFN-γ responses
0
2
4
6
8
10
12
IFNg1 IFNg2
IFN
-g in
crea
se (I
U/m
L)
ID21ID17ID20ID19ID18ID22
02468
101214161820
TST1 TST2
TST
(mm
incr
ease
)
ID21ID17ID20ID19ID18ID22
Related Documents


![Xpert(R) MTB/RIF assay for pulmonary tuberculosis and ......[Diagnostic Test Accuracy Review] Xpert® MTB/RIF assay for pulmonary tuberculosis and rifampicin resistance in adults Karen](https://static.cupdf.com/doc/110x72/6089b4043886915fb625acf3/xpertr-mtbrif-assay-for-pulmonary-tuberculosis-and-diagnostic-test-accuracy.jpg)

