Serial population bottlenecks and genetic variation: Translocated populations of the New Zealand Saddleback (Philesturnus carunculatus rufusater) D.M. Lambert 1, *, T. King 2,3 , L.D. Shepherd 1 , A. Livingston 4 , S. Anderson 4 & J.L. Craig 4,5 1 Allan Wilson Centre for Molecular Ecology and Evolution, Institute of Molecular BioSciences, Massey University, Private Bag 102904, Albany, New Zealand; 2 Institute of Molecular BioSciences, Massey Uni- versity, Private Bag 11-222, Palmerston North, New Zealand, 3 Current address: Department of Zoology, University of Otago, P.O. Box 56, Dunedin, New Zealand 4 School of Biological Sciences, University of Auckland, Private Bag 92019, Auckland, New Zealand; 5 School of Environmental and Marine Sciences, University of Auckland, Private Bag 92019, Auckland, New Zealand (*Corresponding author: Phone: +64- 94140800-41110; Fax: 1-64-94418142; E-mail: [email protected]) Received 24 February 2004; accepted 27 April 2004 Key words: conservation translocations, North Island Saddleback, Philesturnus carunculatus rufusater, serial population bottlenecks Abstract The genetic effects of population bottlenecks have been well studied theoretically, in laboratory studies, and to some extent, in natural situations. The effects of serial population bottlenecks (SPBs), however, are less well understood. This is significant because recurrent population bottlenecks are likely to be a common feature of the life history of many species. The lack of understanding of SPBs in natural populations has certainly been hampered by a lack of good examples where it can be studied. We report the results of a study into island populations of North Island Saddleback (Philesturnus carunculatus rufusater) that have undergone 13 translocations since 1964, all but one of these has been deliberate and for which detailed records are available. We have examined nine island populations of this passerine bird, from the source population, three first-order bottlenecked and five second-order bottlenecked populations. We examine variation in these nine populations using multilocus minisatellite DNA markers, together with Mendelian loci comprising six microsatellite DNA loci and a variable isozyme locus. Despite the generally low level of genetic variation in the Saddleback source population, we were able to detect a pattern of significant changes in both the mean number of minisatellite DNA bands per individual and the frequency of alleles at the Mendelian loci, with increasing population bottlenecks. This study generally shows that in a natural population, SPBs result in more pronounced genetic changes than do single population bottlenecks by themselves, thereby highlighting their importance for the conservation of rare and endangered species. Introduction Population bottlenecks are of particular interest to conservation biologists because they are thought to have major influences on the genetic composi- tion of populations. A common view is that there is a direct relationship between levels of genetic variation and fitness; low variation being likely to result in short-term decreases in fitness (inbreeding depression) and a long-term lack of adaptive flexibility (Frankel and Soule´ 1981; O’Brien et al. 1985; Simberloff 1988; Frankham et al. 2002). The severity of these effects depends upon several key features, including the size of the population reduction, the sex ratio of the survivors and the length of time taken for populations to recover. Conservation Genetics 6: 1–14, 2005. ȑ Springer 2005 DOI 10.1007/s10592-004-7857-z

Welcome message from author
This document is posted to help you gain knowledge. Please leave a comment to let me know what you think about it! Share it to your friends and learn new things together.
Transcript
Serial population bottlenecks and genetic variation: Translocated populations
of the New Zealand Saddleback (Philesturnus carunculatus rufusater)
D.M. Lambert1,*, T. King2,3, L.D. Shepherd1, A. Livingston4, S. Anderson4
& J.L. Craig4,51Allan Wilson Centre for Molecular Ecology and Evolution, Institute of Molecular BioSciences, MasseyUniversity, Private Bag 102904, Albany, New Zealand; 2Institute of Molecular BioSciences, Massey Uni-versity, Private Bag 11-222, Palmerston North, New Zealand, 3Current address: Department of Zoology,University of Otago, P.O. Box 56, Dunedin, New Zealand 4School of Biological Sciences, University ofAuckland, Private Bag 92019, Auckland, New Zealand; 5School of Environmental and Marine Sciences,University of Auckland, Private Bag 92019, Auckland, New Zealand (*Corresponding author: Phone: +64-94140800-41110; Fax: 1-64-94418142; E-mail: [email protected])
Received 24 February 2004; accepted 27 April 2004
Key words: conservation translocations, North Island Saddleback, Philesturnus carunculatus rufusater,serial population bottlenecks
Abstract
The genetic effects of population bottlenecks have been well studied theoretically, in laboratory studies, andto some extent, in natural situations. The effects of serial population bottlenecks (SPBs), however, are lesswell understood. This is significant because recurrent population bottlenecks are likely to be a commonfeature of the life history of many species. The lack of understanding of SPBs in natural populations hascertainly been hampered by a lack of good examples where it can be studied. We report the results of astudy into island populations of North Island Saddleback (Philesturnus carunculatus rufusater) that haveundergone 13 translocations since 1964, all but one of these has been deliberate and for which detailedrecords are available. We have examined nine island populations of this passerine bird, from the sourcepopulation, three first-order bottlenecked and five second-order bottlenecked populations. We examinevariation in these nine populations using multilocus minisatellite DNA markers, together with Mendelianloci comprising six microsatellite DNA loci and a variable isozyme locus. Despite the generally low level ofgenetic variation in the Saddleback source population, we were able to detect a pattern of significantchanges in both the mean number of minisatellite DNA bands per individual and the frequency of alleles atthe Mendelian loci, with increasing population bottlenecks. This study generally shows that in a naturalpopulation, SPBs result in more pronounced genetic changes than do single population bottlenecks bythemselves, thereby highlighting their importance for the conservation of rare and endangered species.
Introduction
Population bottlenecks are of particular interest toconservation biologists because they are thoughtto have major influences on the genetic composi-tion of populations. A common view is that thereis a direct relationship between levels of geneticvariation and fitness; low variation being likely to
result in short-term decreases in fitness (inbreedingdepression) and a long-term lack of adaptiveflexibility (Frankel and Soule 1981; O’Brien et al.1985; Simberloff 1988; Frankham et al. 2002). Theseverity of these effects depends upon several keyfeatures, including the size of the populationreduction, the sex ratio of the survivors and thelength of time taken for populations to recover.
Conservation Genetics 6: 1–14, 2005. � Springer 2005DOI 10.1007/s10592-004-7857-z

While one is unlikely to find a situation aboutwhich all these details are precisely known, themore information we have about a bottleneck, themore certain we can be of our conclusions. We canquantify the effects of population bottlenecks bydescribing in general terms, what happens before,during and after a population is bottlenecked.
A population is reduced to a particular mini-mum size, either as the result of a populationcrash, or through a founder event. If the popula-tion is below a critical size, demographic stochas-ticity may cause it to decline to extinction.Alternatively, it can remain at a small size forsome period of time, before increasing, eithergradually or rapidly. Once the population hasrecovered to a stable size, it will contain a reducedlevel of genetic variation. Eventually, an equilib-rium will be re-established between the introduc-tion of new genetic variants through mutation andfluctuations in allele frequencies through geneticdrift.
An ideal study of the effects of populationbottlenecks would have information on the fol-lowing: (1) genetic variation in the populationprior to the bottleneck, (2) the size of the bottle-neck, (3) number of generations following thebottleneck, combined with the rate of populationincrease, (4) genetic variation in the populationfollowing the bottleneck. Another aspect of geneticvariation that is often overlooked is a comparisonbetween different classes of markers. While thebehaviour of single locus, Mendelian markers isthought to be well understood, the effects ofreductions in population size on multilocusmarkers, particularly those with high mutationrates, such as minisatellite DNA, are less wellunderstood.
Few studies have published all of the aboveinformation. The present examination of Saddle-backs involves nine island populations, includingthe source population from Hen Island. Certainlyit is rare in conservation studies to have access to apopulation such as Hen Island from which allbottlenecked populations are derived. Moreover,since the size of the Hen Island population hasremained relatively constant, samples from thisisland provide an indirect estimate of the levels ofgenetic variation in pre-bottlenecked populations.In addition we have been able to sample three firstorder and five second order translocated popula-tions. These recently established populations were
founded from seven translocations and one natu-ral dispersal event.
The history of population bottlenecks in the NorthIsland Saddleback
The North Island Saddleback (Philesturnus car-unculatus rufusater) is one of three wattlebirdspecies (family Callaeatidae) endemic to NewZealand, a group that includes the extinct Huia(Heteralocha acutirostris) and the criticallyendangered Kokako (Callaeas cinerea).
Saddlebacks were common forest birds of themainland and offshore islands at the time ofEuropean arrival to New Zealand (Hooson andJamieson 2003). However, they rapidly declined innumbers and were eliminated from the New Zea-land mainland around the late 1800s. By 1910 theNorth Island Saddleback survived on a singleoffshore island (Hen Island). Since 1925, govern-mental wildlife agencies (particularly the NewZealand Wildlife Service) have carried out a seriesof translocations onto other islands as ‘‘insurance’’against loss of the species (Lovegrove 1996). Notall translocations were successful, but effortsproved more successful following a re-assessmentof, and increase in numbers of founders. A sum-mary of successful translocations is provided inFigure 1. Today, North Island Saddleback num-bers are estimated at around 6600 individuals(Hooson and Jamieson 2003).
As discussed earlier, there are several aspects ofpopulation bottlenecks that play an important rolein assessing their severity – particularly, an esti-mate of pre-bottleneck levels of genetic variation,the size and sex composition of the bottlenecksand their duration. In the case of North IslandSaddleback, we have information for most of thesefactors and can make reasonable assumptionsregarding the remaining ones. Prior to any trans-locations taking place, the North Island Saddle-back was confined to a single island population(Hen Island). Birds from this population were,directly or indirectly, the source for all transloca-tions, and bird numbers in that population arebelieved to have remained stable since thetranslocations began (~500 birds, Hooson andJamieson 2003). Samples of individuals from HenIsland can provide an estimate of the amount ofgenetic variation in the species prior to the trans-location events. However it is likely that this
2

source population was itself bottlenecked (Hoosonand Jamieson 2003) prior to the wildlife translo-cations. Consequently, there will be a reduction inthe statistical power to detect any subsequentgenetic effects of translocations.
Good records are available of the exact numberof birds involved in each translocation (Lovegrove1996). North Island Saddleback are poor fliers(Jenkins and Veitch 1991) and with the exceptionof Coppermine Island (Newman 1980), no popu-lations are likely to have received any naturalmigrants. Although there is explicit information onsex ratios for some North Island Saddlebacktranslocations (Turbott 1947; Merton 1965;Galbraith and Hayson 1994; Lovegrove 1996)most are unknown. However, the method ofcapture suggests that sex ratios were likely to havebeen approximately equal as birds were oftencaptured as pairs. North Island Saddlebacks aremonogamous and maintain pairs throughout theyear. It is also a reasonable assumption that thewildlife staff involved in these translocations wouldhave been aware of the importance of releasingapproximately equal sexes. Although birds mayhave been released as pairs, research suggests thatthe bonds do not necessarily persist following thetranslocation and that levels of familiarity amongfounders (i.e. whether or not established pairs wereused) was not an important factor in bird survival
and reproduction (Armstrong and Craig 1995;Armstrong et al. 1995).
The year in which each North Island Saddle-back translocation took place has been recorded,hence providing information on the time since thebottlenecks occurred. Most translocations werenot followed up by regular censuses, thus unfor-tunately, we do not know what occurred in theimportant early years following the translocations.We do know, however, that North IslandSaddleback breed at different rates, dependentupon population density. Typically, birds breed atage two or older and on average produce oneclutch of two chicks per year (Craig 1994). How-ever, at low population densities, such as the earlystages following translocations, birds can produceup to three clutches a year, with a maximum of upto four chicks (Craig 1994). For example, in thecase of the Mokoia Island population, translo-cated in 1992, juvenile survival was inverselyrelated to population density, although adultsurvival was not similarly affected (Davidson1999). For this population there was an initialrapid phase of growth, followed by stability innumbers (Davidson 1999). Thus differential ratesof population growth in each of the North IslandSaddleback translocations may influence themaintenance and structure of genetic variation inthe translocated populations.
Figure 1. The pattern of successful translocations among island populations of North Island Saddleback, starting with the sourcepopulation on Hen Island. The dates of deliberate translocations are given, together with the numbers of individuals transferred inparentheses. The establishment of the population on Coppermine Island was not human assisted. A further 42 individuals werereleased from Lady Alice and Whatupuke Islands on to Little Barrier Island in 1986 (not shown in figure). The location of all existingpopulations of North Island Saddlebacks are shown. The nine populations sampled in this study are shown in bold.
3
The translocation history of North IslandSaddlebacks provides an excellent opportunity tostudy the effects of serial population bottleneckson genetic diversity and differentiation in a rela-tively natural situation. We also examine the dif-ferences between multilocus (minisatellite DNA)and single locus (isozyme and microsatellite DNA)markers in detecting bottlenecks, notwithstandingthat the power of any of these markers is reducedsince the source population was itself almost cer-tainly bottlenecked.
Methods
Sample collection
A total of 372 North Island Saddleback, from nineislands, were caught between August, 1990 andDecember, 1992. They were sampled from a rangeof areas on each island in order to best representthe entire population and to ensure that individ-uals were as unrelated as possible. A maximum of200 ll of blood was drawn from the wing vein ofeach bird. Plasma and erythrocytes (red bloodcells) were separated in a hand-cranked centrifugeand placed immediately in liquid nitrogen. Sam-ples were later stored at )80 �C.
Minisatellite DNA
Twelve individuals from each of the nine islandswere minisatellite DNA fingerprinted. Erythro-cytes (15 ll) were mixed with 1 ml of lysing solu-tion (144 mM NH4HCl; 10 mM NH4HCO3). Thelysate was centrifuged at 7500 rpm for 15 min andthe supernatant discarded. The pellet was thenresuspended in 1 ml of SET buffer (0.1 M NaCl,1 mM EDTA, 0.1 M Tris-HCl pH 8.0) to whichSDS and proteinase K were added to final con-centrations of 0.5% and 60 lg/ml respectively andincubated overnight at 65 �C. Solvent extraction,using combinations of phenol followed by chlo-roform/isoamyl alcohol, removed any red bloodcell debris. Precipitations and re-suspensions wereperformed according to Sambrook et al. (1989).
Genomic DNA samples of approximately20 lg were digested overnight at 37 �C with10 units of the restriction enzyme AluI (BRL) withthe manufacturer’s recommended buffer in thepresence of 4 mM spermidine trihydrochloride
and bovine serum albumin (BSA) (l00 lg/ml). Thefollowing day a further 10 units of restriction en-zyme were added and incubation continued for anhour.
Approximately 3.5 lg of restricted genomicDNA was loaded on to a 0.8% agarose gel andelectrophoresed for 48 h at approximately 55 V inTBE running buffer (134 mM Tris, 74.9 mM boricacid, 2.55 mM EDTA pH 8.8). After electropho-resis the gel was soaked in depurination solution(0.25 M HCI) for 15 min, denaturation solution(0.5 M NaOH, 1.5 M NaCl) for 45 min and thenneutralising solution (1.5 M NaCl, 0.5 M Tris-HCI pH 7.2, 2 mM EDTA) twice for 15 min. TheDNA restriction fragments were transferred bySouthern blotting onto Amersham Hybond-Nnylon membrane in 6· SSC (1· SSC: 0.15 MNaCl, 15 mM sodium citrate) over 18 h. Mem-branes were briefly washed in fresh 6· SSC then airdried and baked at 80 �C for 2 h.
The probes 33.6 (Jeffreys et al. 1985) andpV47-2 (Longmire et al. 1990) were radioactivelya32P-labeled by random priming (Amershammultiprime kit). Membranes were pre-hybridisedin 0.25 M NaHP04 pH 7.2, 1 mM EDTA, 7%SDS, at either 57 �C (33.6) or 55 �C (33.15 andpV47-2) for 2 h before the addition of the probe.Hybridisation continued for approximately 16 h.Membranes hybridised with 33.6 were washedat 57 �C successively for 30 min in: 5· SSC, 0.1%SDS, 3· SSC, 0.1% SDS; 0.5· SSC, 0.1% SDS;and twice for 15 min in 0.1· SSC, 0.1% SDS.pV47-2 membranes required only one wash at55 �C in 5· SSC, 0.1% SDS. Membranes werethen exposed to X-ray film (Fuji, RX) at )80 �Cfor 21 h (33.6) or 24 h (pV47-2) to produce au-toradiographs.
Isozyme methods
Erythrocytes were diluted 1:1 with distilled waterand subjected to cellulose acetate electrophoresisusing Helena Titan III plates at room temperaturefor 20–30 min at a constant 200 volts. Electro-phoresis buffers were as detailed in Harris andHopkinson, (1976), Richardson et al. (1986) andHebert and Beaton (1989). The enzymes analysedwere: Ada, Ald-1, Ald-2, Est, Got-1, Got-2, G6pd,Gpi, Gsr, Idh, Ldh-1, Ldh-2, Mdh-1, Mdh-2, Me-1,Me-2, Mpi-1, Pgm-1, Pgm-2, Pep-B, Pep-C, 6Pgd,Sod-1, Sod-2.
4
Microsatellite DNA genotyping
Fifteen microsatellite DNA loci isolated from anenriched microsatellite library (Armour et al.1994) were screened for variation. Primer se-quences are given in Table 1. Six variable loci weregenotyped for all island populations (Pca02,Pca05, Pca08, Pca12, Pca14 and Pca15). Four loci(Pca02, Pca05, Pca08 and Pca15) were genotypedusing an autoradiographic technique. Reactionswere carried out in a total volume of 10 ll andcontained: 0.5 units Taq polymerase (Roche) and200 lM each dNTP. Radioactively labelled reac-tions contained 500 nM forward primer, 450 nMunlabelled reverse primer and 12.5 nM reverse
primer end-labelled with [c33P]-ATP. Sampleswere cycled at 96 �C for 240 s, followed by 35cycles of 50–62 �C for 30 s, 72 �C for 60 s and96 �C for 30 s, with a final extension step of 72 �Cfor 240 s. Amplified products were run on 6%denaturing polyacrylamide gels, dried ontoWhatman filter paper and exposed for betweentwo and ten days to BioMax MR film. Theremaining two loci (Pca14 and Pca12) were flu-orescently genotyped on an ABI Prism 377 se-quencer. Reverse primers for these loci were 5¢-endlabelled with HEX (Pca14) or TET (Pca12) (SigmaGenosys) phosphoramidite dye. PCR reactionsusing fluorescent primers contained 1 lM of eachprimer.
Table 1. Sequences of oligonucleotide PCR primers designed to amplify microsatellite DNA loci from North Island Saddleback.Optimal annealing temperatures, magnesium concentrations and number of alleles are also shown
Locus Primer sequences (5¢-3¢) Tm (�C) MgCl2 (mM) No. of alleles
Pca01 F-GTGGTGCTGAAACAGAAAAG 56 1.5 1
R-CTTCTTGCACTGACATTTGC
Pca02 F-CTGCACTCCTTTTGAGCCTCT 57 0.5 4
R-CCAAGGTGATGCTGACCCAT
Pca03 F-CACCACTGACAAAACATCTG 56 1.5 1
R-ATGCCTCCCTTAATCTGACA
Pca04 F-TATGGAGCAATATGGGCACT 50 2.5 1
R:TCTTTTAGGGGACAGGGGAG
Pca05 F-CAGAAGCATCCTTTGAGGAA 58 0.8 3
R-CAGTTCACGGAGCCTAGAAA
Pca06 F-GTCTGTGGTAAGACTTGGTC 62 1.5 1
R-ATTGCTGATGTGTATGTAGG
Pca07 F-GGACTGGAACCACACATTGA 56 1.5 1
R-ATCCTGAAGCACTTGACGTG
Pca08 F-TCTAACACCCTTCTTCTTAT 55 1.5 3
R-GCTATGTCTATCCCAAATGC
Pca09 F-TGGGAGGAAGTCTTTTGTAG 56 1.5 1
R-TGCTGTTCACACTGTTTCTG
Pca10 F-CCAGAACAAAGCAAGAACAG 56 1.5 2
R-CCAATTACTGGGAAGCAGTG
Pca11 F-CGCACCCCTCTATGATTATT 56 1.5 1
R-TGATTCAGCCCTCACACAAT
Pca12 F-TGTGGGAAACCAGAGGAAA 55 1.5 2
R-CAGGGGAAAAATAGAGAGGG
Pca13 F-GCCTCGGTGTGAGCATCATT 55 1.5 1
R-ACCCAAGCCCCATCCAAACA
Pca14 F-GTTTTGACCTACAGAGAGAG 55 1.5 3
R-GATAGGACAATCAACAGGCT
Pca15 F-AAAACAGGAATCAGGAGCAG 57 1.5 3
R-GAGAGGGAAAGAAGGAACAC
5

Data Analysis
Each minisatellite gel included a molecular weightmarker, together with DNA from an individualthat had been designated as the genomic control toensure that all gels could be standardised. Bands<4 kb in size were not scored. Bands were con-sidered to match if they were similar in intensityand if their centres were within a 1.5 mm bin.These data, in tabulated form, were used todetermine the mean number of bands per indi-vidual. Differences in mean number of bands perindividual between source and translocated pop-ulations were examined with two-tailed t-testsfollowed by the application of the sequentialBonferroni correction (Rice 1989) to adjust thesignificance level for multiple comparisons.
Genetic variation within each North IslandSaddleback population was assessed by computa-tion of the average percent difference (APD) inband-sharing as described in Ardern et al. (1997).To test whether the observed degree of minisatel-lite DNA variability in one population differedsignificantly from that in another population weused two statistical tests based on randomizationprocedures: the fixed covariance model (FCM)and the independent assortment model (IAM)(Ardern et al. 1997). These two tests assumedifferent levels of independence of restrictionfragments. The FCM generates bootstrappedpseudo-samples with the same number of individ-uals as in the original sample. The IAM generatespseudo-samples by sampling each different frag-ment detected in the original DNA fingerprintswith replacement across all individuals.
The microsatellite and allozyme data wereanalysed using GENEPOP version 3.1d (Ray-mond and Rousset 1995). Departures fromHardy–Weinberg equilibrium for each locus weretested. Exact probability tests for genic differenti-ation per locus between source and translocatedpopulations were also performed and the sequen-tial Bonferroni correction applied (Rice 1989). FST
and RST values were calculated for both first andsecond order translocations. We conducted aWilcoxon sign-rank test to test for heterozygosityexcess in the microsatellite data with theprogramme BOTTLENECK (Piry et al. 1999).BOTTLENECK compares the distribution of theexpected heterozygosity to that observed under theassumption of mutation-drift equilibrium for each
population. Heterozygosity excess is indicativethat the population has been through a bottleneck.Data was analysed using three mutational models,the stepwise mutation model (SMM), the infinitealleles model (IAM) and the two-phase model(TPM). Under the TPM 95% of the mutationswere assumed to occur under the SMM and thevariance was 11. For each mutational model10,000 replicates were performed.
Results
Multilocus data
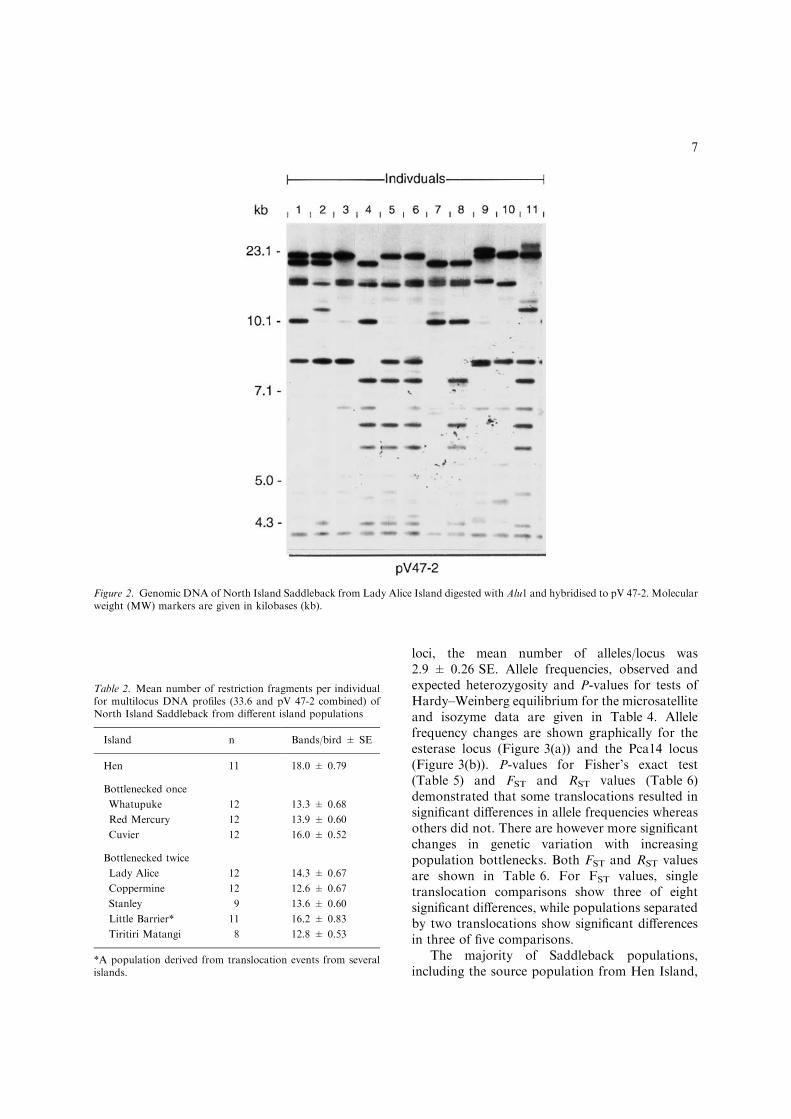
Analysis of genetic variation in island populationsof North Island Saddleback was carried out usingthe minisatellite probes 33.6 and pV47-2(Figure 2). Mean number of restriction fragmentsper individual for the island populations is given inTable 2. Comparisons of mean number ofrestriction fragments per individual between pop-ulations that were separated by a single translo-cation event revealed significant changes in a totalof four of eight comparisons (combining source tofirst order and first to second order comparisons).In contrast, populations separated by two trans-locations revealed significant changes in four offive comparisons. This result however includes theLittle Barrier population which is derived from anumber of translocations. In total, eight of the 13translocations resulted in a significant reduction inthe mean number of bands per individual(Table 3). However, using the FCM and IAMrandomisation procedures (Ardern et al. 1997) werecorded no significant differences in levels ofminisatellite DNA variation, as measured byAPD, among island populations of North IslandSaddleback.
Single locus data
Twenty-four loci representing 15 enzyme systemswere consistently resolved in saddleback. Twenty-three loci were monomorphic for the same allelesin all populations sampled. The esterase (Est)locus resolved the only polymorphism, althoughthe populations on Lady Alice and CoppermineIslands were both fixed for the same allele.
Low levels of polymorphism were also observedin the microsatellite data. Excluding monomorphic
6
loci, the mean number of alleles/locus was2.9 ± 0.26 SE. Allele frequencies, observed andexpected heterozygosity and P-values for tests ofHardy–Weinberg equilibrium for the microsatelliteand isozyme data are given in Table 4. Allelefrequency changes are shown graphically for theesterase locus (Figure 3(a)) and the Pca14 locus(Figure 3(b)). P-values for Fisher’s exact test(Table 5) and FST and RST values (Table 6)demonstrated that some translocations resulted insignificant differences in allele frequencies whereasothers did not. There are however more significantchanges in genetic variation with increasingpopulation bottlenecks. Both FST and RST valuesare shown in Table 6. For FST values, singletranslocation comparisons show three of eightsignificant differences, while populations separatedby two translocations show significant differencesin three of five comparisons.
The majority of Saddleback populations,including the source population from Hen Island,
Figure 2. Genomic DNA of North Island Saddleback from Lady Alice Island digested with Alu1 and hybridised to pV 47-2. Molecularweight (MW) markers are given in kilobases (kb).
Table 2. Mean number of restriction fragments per individualfor multilocus DNA profiles (33.6 and pV 47-2 combined) ofNorth Island Saddleback from different island populations
Island n Bands/bird ± SE
Hen 11 18.0 ± 0.79
Bottlenecked once
Whatupuke 12 13.3 ± 0.68
Red Mercury 12 13.9 ± 0.60
Cuvier 12 16.0 ± 0.52
Bottlenecked twice
Lady Alice 12 14.3 ± 0.67
Coppermine 12 12.6 ± 0.67
Stanley 9 13.6 ± 0.60
Little Barrier* 11 16.2 ± 0.83
Tiritiri Matangi 8 12.8 ± 0.53
*A population derived from translocation events from severalislands.
7

Table 4. Allele frequencies, observed and expected heterozygosity and Hardy–Weinberg values of six microsatellite loci and oneisozyme locus for nine island populations of North Island Saddleback
Locus Allele Hen
Island
Whatu-
puke
Island
Red
Mercury
Island
Cuvier
Island
Lady
Alice
Island
Copper-
mine
Island
Stanley
Island
Little
Barrier
Island*
Tiritiri
Matangi
Island
Pca02 n 41 41 43 62 32 37 40 46 28
A 0.3900 0.6460 0.7560 0.4760 0.5620 0.4320 0.5250 0.4020 0.4820
B 0.1710 0.0000 0.0000 0.2180 0.0620 0.0410 0.1620 0.2720 0.1610
C 0.0120 0.0000 0.0000 0.0000 0.0000 0.0000 0.0000 0.0000 0.0000
D 0.4270 0.3540 0.2440 0.3060 0.3750 0.5270 0.3120 0.3260 0.3570
HO 0.6341 0.4634 0.3954 0.6774 0.5938 0.4595 0.5750 0.6739 0.7143
HE 0.6441 0.4628 0.3735 0.6374 0.5476 0.5409 0.6079 0.6653 0.6253
P 0.2904 1.0000 1.0000 0.2891 0.3925 0.2487 0.2331 0.3226 0.6464
Pca05 n 37 39 39 56 24 36 36 47 25
A 0.2160 0.1920 0.5000 0.1520 0.2080 0.0420 0.2500 0.1170 0.2400
B 0.0540 0.2950 0.0000 0.0540 0.1880 0.0280 0.0280 0.0320 0.0200
C 0.7300 0.5130 0.5000 0.7950 0.6040 0.9310 0.7220 0.8510 0.7400
HO 0.3784 0.7180 0.5385 0.3750 0.5000 0.1389 0.4444 0.2979 0.4400
HE 0.4235 0.6211 0.5065 0.3457 0.5683 0.1334 0.4210 0.2638 0.4025
P 0.1475 0.3404 0.7551 0.8543 0.1744 1.0000 1.0000 1.0000 1.0000
Pca08 n 37 32 42 62 32 37 40 47 27
A 0.3510 0.2190 0.5240 0.4110 0.5470 0.0680 0.4630 0.4890 0.3520
B 0.3920 0.4380 0.1790 0.2340 0.1250 0.4190 0.2130 0.2340 0.2410
C 0.2570 0.3440 0.2980 0.3550 0.3280 0.5140 0.3250 0.2770 0.4070
HO 0.7297 0.6875 0.6667 0.7097 0.6250 0.5676 0.6500 0.6170 0.6296
HE 0.6661 0.6528 0.6125 0.6555 0.5868 0.5639 0.6434 0.6360 0.6646
P 0.1700 0.0184 0.7223 0.3178 0.3991 0.2198 0.7035 0.0000 0.4240
Table 3. Reduction in genetic variation between North Island Saddleback populations as measured by t-tests comparing mean numberof minisatellite fragments per bird. P-values significant following the sequential Bonferroni correction are shown in bold
Translocation type Translocation Difference
between means
Two-tailed P-value
From To
Source to 1st order Hen Red Mercury 4.083 0.0005
Cuvier 2.000 0.0449
Whatupuke 4.667 0.0002
1st order to 2nd order Cuvier Tiriri Matangi 3.250 0.0005
Little Barrier* )0.182 0.8520
Stanley 2.444 0.0064
Whatupuke Lady Alice )1.000 0.3043
Coppermine 0.667 0.5231
Source to 2nd order Hen Tiriri Matangi 5.250 0.0001
Little Barrier* 1.818 0.1298
Stanley 4.444 0.0005
Lady Alice 3.667 0.0019
Coppermine 5.333 <0.0001
*A population derived from translocation events from the several islands.
8

showed significant estimates of heterozygosityexcess (P < 0.05) under all three mutation mod-els (Table 7). However, estimates of heterozy-gosity excess for the Coppermine Islandpopulation were not significant under any of themutation models examined. Additionally theLittle Barrier Island population exhibited het-erozygosity excess under the IAM and TPM butnot under the SMM. However, the latter islandpopulation is not directly comparable to otherssince it is derived from several translocationevents (Figure 1).
Discussion
Generally we have detected genetic changes fol-lowing translocations of North Island Saddleback.We report that some translocations typicallyresult in a loss, or significant alteration, in thelevels of genetic variation between source andtranslocated populations, although some otherpopulations are consistently unaffected. Forexample, similar numbers of North IslandSaddleback were released from Hen Island on toRed Mercury Island, Whatapuke Island and
Table 4. Continued
Locus Allele Hen
Island
Whatu-
puke
Island
Red
Mercury
Island
Cuvier
Island
Lady
Alice
Island
Copper-
mine
Island
Stanley
Island
Little
Barrier
Island*
Tiritiri
Matangi
Island
Pca12 n 31 34 42 59 30 35 39 47 28
A 0.5000 0.4120 0.2620 0.3140 0.4500 0.4710 0.3850 0.5320 0.3930
B 0.5000 0.5880 0.7380 0.6860 0.5500 0.5290 0.6150 0.4680 0.6070
HO 0.2903 0.4118 0.4286 0.5254 0.5000 0.6000 0.5641 0.6383 0.6429
HE 0.5082 0.4917 0.3913 0.4342 0.5034 0.5056 0.4795 0.5033 0.4857
P 0.2920 0.4772 0.6944 0.1289 1.0000 0.3139 0.3151 0.0822 0.1184
P 0.3361 1.0000 0.4343 0.8486 0.8026 0.0165 0.3160 0.0572 0.4553
Pca14 n 26 31 41 52 28 31 38 46 26
A 0.0960 0.0000 0.0370 0.1060 0.0180 0.0480 0.1840 0.0980 0.1150
B 0.7310 0.7580 0.7560 0.6250 0.6250 0.5650 0.5790 0.6630 0.4620
C 0.1730 0.2420 0.2070 0.2690 0.3570 0.3870 0.2370 0.2390 0.4230
HO 0.3846 0.3548 0.3415 0.5577 0.5357 0.3548 0.5263 0.4565 0.6154
HE 0.4351 0.3728 0.3887 0.5308 0.4903 0.5378 0.5825 0.4990 0.6063
P 0.3361 1.0000 0.4343 0.8486 0.8026 0.0165 0.3160 0.0572 0.4553
P 0.2904 1.0000 1.0000 0.2891 0.3925 0.2487 0.2331 0.3226 0.6464
Pca15 n 40 39 44 62 31 34 40 45 28
A 0.3870 0.1150 0.3860 0.5000 0.2420 0.2210 0.2620 0.4110 0.6250
B 0.2750 0.1540 0.2730 0.1530 0.0810 0.1620 0.0870 0.1780 0.1790
C 0.3380 0.7310 0.3410 0.3470 0.6770 0.6180 0.6500 0.4110 0.1960
HO 0.7000 0.5682 0.6818 0.6290 0.5161 0.4412 0.4250 0.5778 0.5000
HE 0.6769 0.4346 0.6677 0.6112 0.4839 0.5512 0.5073 0.6375 0.5487
P 0.1686 0.0264 0.8671 0.2896 0.7728 0.0151 0.3046 0.7549 0.0774
Est-1 n 41 41 45 59 34 35 40 46 26
A 0.8050 0.9760 0.9670 0.8470 1.0000 1.0000 0.8120 0.7660 0.4420
B 0.1950 0.0240 0.0330 0.1530 0.0000 0.0000 0.1880 0.2340 0.5580
HO 0.3415 0.0488 0.0667 0.3051 0.0000 0.0000 0.3250 0.3478 0.4231
HE 0.3180 0.0482 0.0652 0.2608 0.0000 0.0000 0.3085 0.3703 0.5030
P 1.0000 1.0000 1.0000 0.3301 0.0000 0.0000 1.0000 0.6962 0.4526
*A population derived from translocation events from the several islands.
9

Cuvier Island. Red Mercury and WhatapukeIsland populations show significant differences inboth allele frequencies (as measured by FST andRST) and the mean number of minisatellite DNAfragments per individual compared to the HenIsland population. However, neither the single ormultilocus data showed significant differences ingenetic variation between Hen and Cuvier IslandSaddleback.
The fact that some translocations resulted insignificant changes and others did not, may be aresult of low statistical power due to low geneticvariation in the source population since bottleneckeffects have large stochastic components. Alter-natively it may reflect differences in post-translo-cation mortality after release, for example, only 22
of the 50 Saddleback released on Little Barrier in1984 survived a year after the release (Lovegrove1996). Therefore the bottleneck would have beenmuch smaller than that estimated from the numberof individuals released. In addition, the rate ofpopulation size increase on some islands washigher, in comparison to others (T. Lovegrove,pers. comm.). Hence, the number of animals usedin wildlife translocations is not the only, or nec-essarily the most important factor in maintaininggenetic variation in translocated populations.Other potential factors include random effects, thesex ratios of founder populations (as discussedearlier), as well as the size of the released cohortand changes in breeding rates in relation to pop-ulation densities.
Figure 3. Pie diagrams illustrating the allele frequencies at the (a) Pca14 microsatellite DNA locus and (b) esterase (Est-1) locus in nineNorth Island saddleback populations. Arrows show the translocation history of the populations.
10
Coppermine Island was the only island in thisstudy that was colonised naturally by North IslandSaddleback (Newman 1980) and therefore thenumber of colonising individuals is unknown.However, Coppermine Island Saddleback exhibitthe lowest number of fragments per individual forthe multilocus data which indicates that the num-ber of colonising individuals was probably small.Interestingly this population was the only oneexamined that did not have a significant excess ofheterozygosity under any of the three mutationmodels examined. Clearly this population hasundergone a genetic bottleneck so the lack of sig-nificance in the Wilcoxon signed rank test suggeststhat, as Whitehouse and Harley (2001) have pre-
viously suggested, the results of this test should beinterpreted with caution when demographic his-tory is unknown.
The overall low level of microsatellite DNA andisozyme variation (compared to data from a widerange of other species presented in Lambert andMillar 1995) and the significant result for the Wil-coxon sign rank test for the Hen Island Saddlebackpopulation suggests that this population has prob-ably experienced a bottleneck in the past. It has beensuggested, on the basis of theoretical and empiricalevidence, that island taxa have lower genetic vari-ability than mainland ones (Frankham 1997; Paxi-nos et al. 2002). Genotyping pre-1910 museumskins from Hen Island and the mainland could test
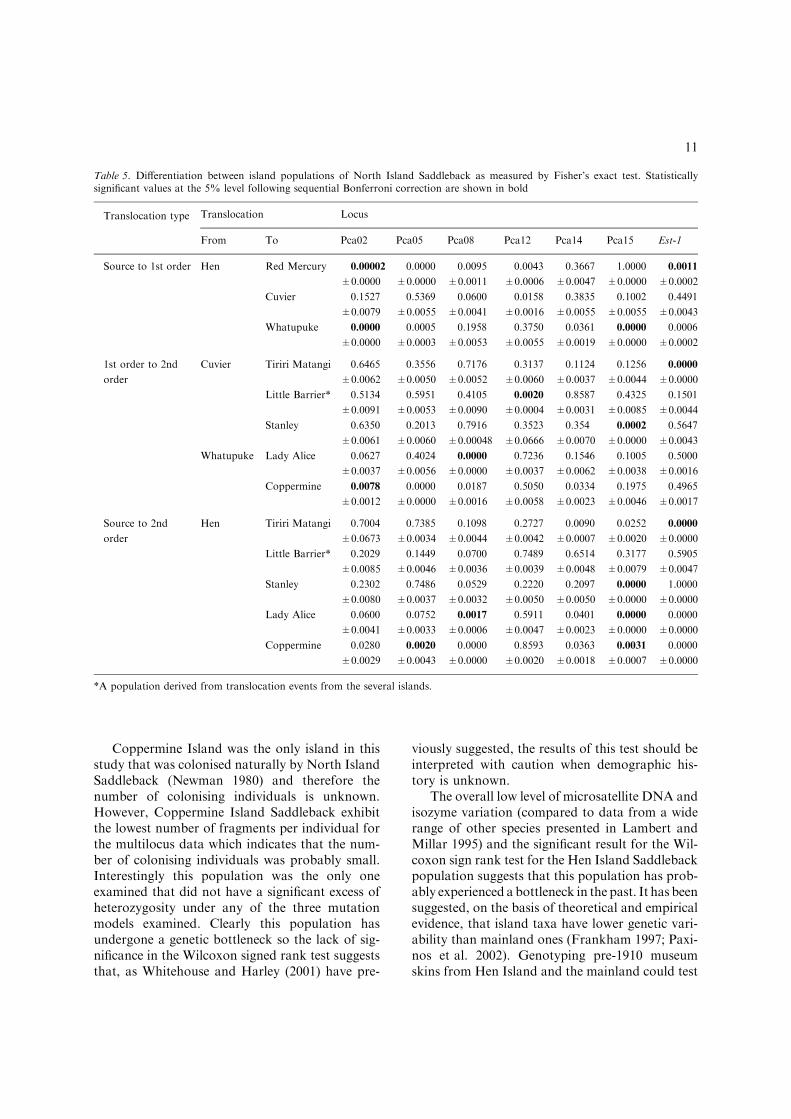
Table 5. Differentiation between island populations of North Island Saddleback as measured by Fisher’s exact test. Statisticallysignificant values at the 5% level following sequential Bonferroni correction are shown in bold
Translocation type Translocation Locus
From To Pca02 Pca05 Pca08 Pca12 Pca14 Pca15 Est-1
Source to 1st order Hen Red Mercury 0.00002 0.0000 0.0095 0.0043 0.3667 1.0000 0.0011
±0.0000 ±0.0000 ±0.0011 ±0.0006 ±0.0047 ±0.0000 ±0.0002
Cuvier 0.1527 0.5369 0.0600 0.0158 0.3835 0.1002 0.4491
±0.0079 ±0.0055 ±0.0041 ±0.0016 ±0.0055 ±0.0055 ±0.0043
Whatupuke 0.0000 0.0005 0.1958 0.3750 0.0361 0.0000 0.0006
±0.0000 ±0.0003 ±0.0053 ±0.0055 ±0.0019 ±0.0000 ±0.0002
1st order to 2nd
order
Cuvier Tiriri Matangi 0.6465
±0.0062
0.3556
±0.0050
0.7176
±0.0052
0.3137
±0.0060
0.1124
±0.0037
0.1256
±0.0044
0.0000
±0.0000
Little Barrier* 0.5134 0.5951 0.4105 0.0020 0.8587 0.4325 0.1501
±0.0091 ±0.0053 ±0.0090 ±0.0004 ±0.0031 ±0.0085 ±0.0044
Stanley 0.6350 0.2013 0.7916 0.3523 0.354 0.0002 0.5647
±0.0061 ±0.0060 ±0.00048 ±0.0666 ±0.0070 ±0.0000 ±0.0043
Whatupuke Lady Alice 0.0627 0.4024 0.0000 0.7236 0.1546 0.1005 0.5000
±0.0037 ±0.0056 ±0.0000 ±0.0037 ±0.0062 ±0.0038 ±0.0016
Coppermine 0.0078 0.0000 0.0187 0.5050 0.0334 0.1975 0.4965
±0.0012 ±0.0000 ±0.0016 ±0.0058 ±0.0023 ±0.0046 ±0.0017
Source to 2nd
order
Hen Tiriri Matangi 0.7004
±0.0673
0.7385
±0.0034
0.1098
±0.0044
0.2727
±0.0042
0.0090
±0.0007
0.0252
±0.0020
0.0000
±0.0000
Little Barrier* 0.2029 0.1449 0.0700 0.7489 0.6514 0.3177 0.5905
±0.0085 ±0.0046 ±0.0036 ±0.0039 ±0.0048 ±0.0079 ±0.0047
Stanley 0.2302 0.7486 0.0529 0.2220 0.2097 0.0000 1.0000
±0.0080 ±0.0037 ±0.0032 ±0.0050 ±0.0050 ±0.0000 ±0.0000
Lady Alice 0.0600 0.0752 0.0017 0.5911 0.0401 0.0000 0.0000
±0.0041 ±0.0033 ±0.0006 ±0.0047 ±0.0023 ±0.0000 ±0.0000
Coppermine 0.0280 0.0020 0.0000 0.8593 0.0363 0.0031 0.0000
±0.0029 ±0.0043 ±0.0000 ±0.0020 ±0.0018 ±0.0007 ±0.0000
*A population derived from translocation events from the several islands.
11

the hypothesis of differences between these. If therehave been past bottlenecks on Hen Island that haveeliminated much of the variation, then these mayhave made the recent bottlenecking both harder todetect and less important biologically.
The comparison between multilocus and single locusDNA variation
In general, the patterns of change in minisatelliteDNA and single locus markers (both esteraseprotein and microsatellite DNA loci) among island
populations of North Island Saddleback showedsome similarities. For example, genetic differenceswere detected between the same two source to firstorder translocations (Hen to Red Mercury andHen to Whatapuke Islands) with both the singleand multilocus data. However, minisatellite DNA,measured in terms of mean number of bands perindividual, appeared to be better than the singlelocus data at detecting changes in genetic variationthrough bottlenecks. This supports the suggestionby Miller et al. (2003) that minisatellite DNAmarkers may be more useful than microsatellite
Table 6. Genetic differentiation between North Island Saddleback populations as measured by Fst and Rst values calculated fromfrequencies of microsatellite and isozyme alleles. Significant values are shown in bold
Translocation type Translocation Fst Rst
From To
Source to 1st order Hen Red Mercury 0.0693 0.1196
Cuvier 0.0158 0.0158
Whatupuke 0.0647 0.1157
1st order to 2nd order Cuvier Tiriri Matangi 0.0180 )0.0040Little Barrier* 0.0120 0.0144
Stanley 0.0484 0.3012
Whatupuke Lady Alice 0.0311 )0.0013Coppermine 0.0636 0.0458
Source to 2nd order Hen Tiriri Matangi 0.0559 0.2263
Little Barrier* 0.0039 )0.0069Stanley 0.0258 )0.0080Lady Alice 0.0535 0.1428
Coppermine 0.0602 0.1494
*A population derived from translocation events from several islands.
Table 7. Results of the Wilcoxon signed ranks test. P-values given are the probability of obtaining the observed heterozygosity undervarious mutation models. Significant values are shown in bold
Population Mutation model
IAM TPM SMM
Hen Island 0.0078 0.0390 0.0390
Whatupuke Island 0.0078 0.0156 0.0156
Red Mercury Island 0.0078 0.0156 0.0156
Cuvier Island 0.0078 0.0234 0.0234
Lady Alice Island 0.0078 0.0078 0.0078
Coppermine Island 0.0547 0.2187 0.2187
Stanley Island 0.0078 0.0156 0.0234
Little Barrier Island* 0.0156 0.0234 0.0547
Tiritiri Matangi Island 0.0078 0.0156 0.0234
*A population derived from translocation events from several islands.
12

DNA markers in detecting genetic variation inhighly inbred species, owing to the higher muta-tion rates observed in the former.
The mean number of minisatellite bands perindividual in North Island Saddlebacks is a moresensitive indicator of reduction in genetic variationthrough population bottlenecks than is APD. Thisobservation contrasts the results of Ardern et al.(1997) who found that APD between source andtranslocated populations of New Zealand robinsprovided a better indication of a decrease in ge-netic variation than the mean number of bands perindividual.
Single versus serial translocations
Examination of single locus genetic data (Table 5)shows that the serially bottlenecked populations ofSaddleback studied here did not always showhigher levels of genetic differentiation than thosepopulations that were only bottlenecked once. Forexample, North Island Saddleback from Hen Is-land and the first order population on Red Mer-cury Island showed differences in allele frequenciesat five of the seven loci. In contrast, only one locusshowed significant differentiation between HenIsland and the second order transfer to TiritiriMatangi Island. Despite this pattern at the level ofindividual loci, changes in FST and RST values(Table 6) show pronounced effects of SPBs, inagreement with similar studies of SPBs (Clegget al. 2002; Gautschi et al. 2002).
The cumulative effect of serial bottlenecks ap-pears more noticeable in the multilocus minisat-ellite data, although bottleneck size almostcertainly has also had an effect. In contrast to thesingle locus data, all source to second ordertranslocations exhibited a reduction in meannumber of minisatellite bands per individual (ex-cept for the translocation to Little Barrier Islandwhose Saddleback population derives from trans-locations from several islands).
In conclusion, our analyses demonstrate overalllow levels of genetic variation in all North IslandSaddleback populations studied. Our investigationof the effect of serial population bottlenecks re-vealed that multilocus minisatellite markers, asmeasured by the mean number of bands per indi-vidual, and single locus allozyme and microsatel-lite DNA loci produced largely concordant resultsin terms of detecting changes in genetic variation.
However, since the source population (Hen Island)for these wildlife translocations was very likely it-self bottlenecked, this almost certainly resulted in areduced statistical power to detect any changes. Inthe context of conservation today, our results aresignificant since conservation managers typicallywork with source populations that are alreadygenetically impoverished.
Acknowledgements
This work was supported by grants from theMarsden Fund (MAU508), the Centres of ResearchExcellence Fund and Massey University to DML.We thank Tarmo Poldmaa and Craig Millar forlaboratory assistance. We also thank Tim Love-grove for discussion regarding Saddleback birdsand Peter Jenkins for initial stimulation. We aregrateful to Richard Frankham and an anonymousreviewer for helpful comments on the manuscript.
References
Ardern SL, Lambert DM, Rodrigo AG, McLean IG (1997) Theeffect of population bottlenecks on multilocus DNA varia-tion in robins. J. Heredity, 88, 179–186.
Armour J, Newmann R, Gobert S, Jeffreys A (1994) Isolationof human simple repeat loci by hybridization selection.Hum.Mol. Genet., 33, 599–605.
Armstrong DP, Craig JL (1995) Effects of familiarity on theoutcome of translocations, I. a test using saddlebacks Phile-sturnus carunculatus rufusater. Biol. Conserv., 71, 133–141.
Armstrong DP, Lovegrove TG, Allen DG, Craig JL (1995)Composition of founder groups for bird translocations: doesfamiliarity matter? In: Reintroduction Biology of Australianand New Zealand Fauna (ed. Serena M), pp. 105–111. SurreyBeatty and Sons, Chipping Norton, Australia.
Clegg SM, Degnan SM, Kikkawa J, et al. (2002) Genetic con-sequences of sequential founder events by an island-colo-nizing bird. Proc. Nat. Acad. Sci. USA, 99, 8127–8132.
Craig JL (1994) Meta-populations: is management as flexible asnature? In: Creative Conservation: Interactive Management ofWild and Captive Animals (eds. Olney PJS, Mace GM,Feistner ATC). Chapman and Hall, London.
Davidson RS (1999) Population Dynamics of the SaddlebackPopulation on Mokoia Island and Implications for Reintro-duction to the Mainland. Unpubl. MSc thesis, MasseyUniversity.
Frankel OH, Soule ME (1981) Conservation and Evolution.Cambridge University Press, Cambridge.
Frankham R (1997) Do island populations have less geneticvariation than mainland populations? Heredity, 78, 311–327.
Frankham R, Ballou JD, Briscoe DA (2002) Introduction toConservationGeneticsCambridgeUniversityPress,Cambridge.
Galbraith MP, Hayson CR (1994) Tiritiri Matangi Island, NewZealand: public participation in species translocation to an
13

open sanctuary. In: Reintroduction Biology of Australian andNew Zealand Fauna (ed. Serena M), pp. 149–154. SurreyBeatty and Sons, Chipping Norton, Australia.
Gautschi B, Widmer A, Joshi J, Koella JC (2002) Increasedfrequency of scale anomalies and loss of genetic variation inserially bottlenecked populations of the dice snake, Natrixtessellata. Conserv. Genet., 3, 235–245.
Harris H, Hopkinson DA (1976) Handbook of Enzyme Elec-trophoresis in Human Genetics. North Holland PublishingCompany, Amsterdam.
Hebert PDN, Beaton MJ (1989) Methodologies for AllozymeAnalysis using Cellulose Acetate Electrophoresis. HelenaLaboratories, TX, USA.
Hooson S, Jamieson IG (2003) The distribution and currentstatus of New Zealand Saddleback Philesturnus carunculatus.Bird Conserv. Int., 13, 79–95.
Jeffreys AJ, Wilson V, Thein SL (1985) Hypervariable ‘mini-satellite’ regions in human DNA. Nature, 314, 67–73.
Jenkins PF, Veitch CR (1991) Sexual dimorphism and agedetermination in the North Island saddleback (Philesturnuscarunculatus rufaster). New Zealand J. Zool., 18, 445–450.
Lambert DM, Millar CD (1995) DNA science and conserva-tion. Pacific Conserv. Biol., 2, 21–38.
Longmire JL, Kraemer PM, Brown NC, Hardenkopf LC, De-aven LL (1990) A new multilocus DNA fingerprinting probe:pV47-2. Nucl. Acids Res., 18, 1658.
Lovegrove TG (1996) Island releases of saddlebacks Philestur-nus carunculatus in New Zealand. Biol. Conserv., 77, 151–157.
Merton DV (1965) Transfer of saddlebacks from Hen Island toMiddle Chicken Island January, 1964. Notornis, 12, 213–222.
Miller H, Lambert D, Millar C, Robertson B, Minot E (2003)Minisatellite DNA profiling detects lineages and parentage
in the endangered kakapo (Strigops habroptilus) despite lowmicrosatellite DNA variation. Conserv. Genet., 4, 265–274.
Newman DG (1980) Colonisation of Coppermine Island by theNorth Island saddleback. Notornis, 27, 146–147.
O’Brien SJ, RoelkeME,Marker L, et al. (1985)Genetic basis forspecies vulnerability in the cheetah. Science, 227, 1428–1434.
Paxinos EE, James HF, Olsen SL, et al. (2002) Prehistoric de-cline of the geneic diversity of the nene. Science, 296, 1827.
Piry S, Luikart G, Cornuet JM (1999) BOTTLENECK:A computer program for detecting recent reductions in theeffective population size using allele frequency data.J. Heredity., 90, 502–503.
Raymond M, Rousset F (1995) GENEPOP (Version 1.2):population genetics software for exact tests and ecumeni-cism. J. Heredity, 86, 248–249.
Rice WR (1989) Analyzing tables of statistical tests. Evolution,43, 223–225.
Richardson BJ, Baverstock PR, Adams M (1986) AllozymeElectrophoresis: A Handbook for Animal Systematics andPopulation Studies. Academic Press Australia, North Ryde,New South Wales.
Sambrook J, Fritsch EF, Maniatis T (1989) Molecular Cloning:A Laboratory Manual. Cold Spring Harbor LaboratoryPress, New York.
Simberloff D (1988) The contribution of population and com-munity biology to conservation science. Ann. Rev. Ecol.Syst., 19, 473–511.
Turbott EG (1947) Birds of Little Barrier Island. New ZealandBird Notes, 2, 92–108.
Whitehouse AM, Harley EH (2001) Post-bottleneck geneticdiversity of elephant populations in South Africa, revealedusing microsatellite analysis. Mol. Ecol., 10, 2139–2149.
14
Related Documents