15 Sereno, M. I., A. M. Dale, et al. (1995). “Borders of multiple visual areas in humans revealed by functional magnetic resonance imaging.” Science 268(May 12): 889-893. Squire, L. R., J. G. Ojemann, et al. (1992). “Activation of the hippocampus in normal humans: a functional anatomical study of memory.” Proc. Nat. Acad. Sci. 89: 1837-1841. Steinmetz, H., G. Furst, et al. (1989). “Cerebral Cortical Localization: Application and Validation of the Proportional Grid System in MR Imaging.” J. Comput. Assist. Tomography 13: 10-19. Talairach, J., G. Szikla, et al. (1967). Atlas d'Anatomie Stereotaxique du Telencephale . Paris, Masson. Talairach, J. and P. Tournoux (1988). Co-Planar Stereotaxic Atlas of the Human Brain . New York, Thieme Medical Publishers. Thompson, P. M., D. MacDonald, et al. (1996). “Detection and Mapping of Abnormal Brain Structure with a Probabilistic Atlas of Cortical Surfaces.” Journal of Computer Assisted Tomography 21(4): 567- 581. Thompson, P. M. and A. W. Toga (1996). “A surface-based technique for warping 3-dimensional images of the brain.” IEEE Transactions on Medical Imaging 15: 1-16. Tootell, R. B. H., K. K. Kwong, et al. (1993). Functional MRI (fMRI) Evidence for MT/V5 and Associated Visual Cortical Areas in Man . Society for Neuroscience 23rd Annual Meeting, Washington, D.C., Soc. Neuro., Wash D.C. Tootell, R. B. H., J. B. Reppas, et al. (1995). “Functional analysis of human MT and related visual cortical areas using magnetic resonance imaging.” J. Neuroscience 15(4): 3215-3230. Van Essen, D. C. and H. A. Drury (1997). “Structural and Functional Analyses of Human Cerebral Cortex Using a Surface-Based Atlas.” The Journal of Neuroscience 17(18): 7079-7102. Zilles, K., E. Armstrong, et al. (1988). “The human pattern of gyrification in the cerebral cortex.” Anat. Embryology 179: 173-179.

Welcome message from author
This document is posted to help you gain knowledge. Please leave a comment to let me know what you think about it! Share it to your friends and learn new things together.
Transcript

15
Sereno, M. I., A. M. Dale, et al. (1995). “Borders of multiple visual areas in humans revealed by functional magnetic resonance imaging.” Science 268(May 12): 889-893.
Squire, L. R., J. G. Ojemann, et al. (1992). “Activation of the hippocampus in normal humans: a functional anatomical study of memory.” Proc. Nat. Acad. Sci. 89: 1837-1841.
Steinmetz, H., G. Furst, et al. (1989). “Cerebral Cortical Localization: Application and Validation of the Proportional Grid System in MR Imaging.” J. Comput. Assist. Tomography 13: 10-19.
Talairach, J., G. Szikla, et al. (1967). Atlas d'Anatomie Stereotaxique du Telencephale. Paris, Masson.
Talairach, J. and P. Tournoux (1988). Co-Planar Stereotaxic Atlas of the Human Brain. New York, Thieme Medical Publishers.
Thompson, P. M., D. MacDonald, et al. (1996). “Detection and Mapping of Abnormal Brain Structure with a Probabilistic Atlas of Cortical Surfaces.” Journal of Computer Assisted Tomography 21(4): 567-581.
Thompson, P. M. and A. W. Toga (1996). “A surface-based technique for warping 3-dimensional images of the brain.” IEEE Transactions on Medical Imaging 15: 1-16.
Tootell, R. B. H., K. K. Kwong, et al. (1993). Functional MRI (fMRI) Evidence for MT/V5 and Associated Visual Cortical Areas in Man. Society for Neuroscience 23rd Annual Meeting, Washington, D.C., Soc. Neuro., Wash D.C.
Tootell, R. B. H., J. B. Reppas, et al. (1995). “Functional analysis of human MT and related visual cortical areas using magnetic resonance imaging.” J. Neuroscience 15(4): 3215-3230.
Van Essen, D. C. and H. A. Drury (1997). “Structural and Functional Analyses of Human Cerebral Cortex Using a Surface-Based Atlas.” The Journal of Neuroscience 17(18): 7079-7102.
Zilles, K., E. Armstrong, et al. (1988). “The human pattern of gyrification in the cerebral cortex.” Anat. Embryology 179: 173-179.

14
5. Acknowledgments. This work was supported by grants from the Human Frontiers Science Foundation to AMD and RBHT, from the Whitaker Foundation to AMD, and from the National Eye Institute (EY07980) to RHBT. We thank Eric Halgren for useful discussions about validation of the proposed coordinate system, and Sean Marrett for suggestions that improved this paper. We also thank Janine Mendola and Chris Moore for providing functional data for testing the inter-subject averaging procedure, and Heather Drury and David Van Essen for fruitful discussions regarding surface-based coordinate systems.
6. References. Buckner, R. L., J. Goodman, et al. (1998). “Functional-anatomic correlates of object priming in humans revealed by rapid presentation event-related fMRI.” Neuron 20: 285-296.
Christensen, G. E., M. I. Miller, et al. (1995). Automatic analysis of medical images using a deformable textbook. Proceedings of Computer Assisted Radiology, Berlin, Germany, Springer-Verlag.
Dale, A., E. Halgren, et al. (1997). “Spatiotemporal localization of cortical word repetition effects in a size-judgment task using combined fMRI/MEG.” NeuroImage 5(4).
DeYoe, E. A., P. Bandettini, et al. (1994). “Functional magnetic resonance imaging (FMRI) of the human brain.” J. Neurosci. Meth 54: 171-187.
DeYoe, E. A., G. J. Carman, et al. (1996). “Mapping striate and extrastriate visual areas in human cerebral cortex.” Proc. Natl. Acad. Sci. (USA) 93(6): 2382-2386.
Drury, H. A., D. C. Van Essen, et al. (1998). Surface-based analyses of the human cerebral cortex. Brain Warping. A. Toga, Academic Press.
Engel, S. A., D. E. Rumelhart, et al. (1994). “fMRI of human visual cortex.” Nature 370: 106.
Evans, A. C., D. L. Collins, et al. (1994). Three-Dimensional Correlative Imaging: Applications in Human Brain Mapping. Functional Neuroimaging. R. W. Thatcher, M. Hallett, T. Zeffiro, E. R. John and M. Huerta. San Diego, Academic Press: 145-162.
Fischl, B., A. M. Dale, et al. (1998). “A coordinate system for the cortical surface.” NeuroImage 7(4): S740.
Fischl, B., M. I. Sereno, et al. (1998). “Cortical Surface-Based Analysis II: Inflation, Flattening, a Surface-Based Coordinate System.” NeuroImage: In Press.
Gabrieli, J. D. E., J. E. Desmond, et al. (1996). “Functional magnetic resonance imaging of
semantic memory processes in the frontal lobes.” Psychol. Sci 7: 278-283.
Hunton, D. L., F. J. Miezen, et al. (1996). “An assessment of functional-anatomical variability in neuroimaging studies.” Human Brain Mapping 4: 122-139.
Joshi, S. C., M. I. Miller, et al. (1997). “On the geometry and shape of brain sub-manifolds.” Processing of MR images of the human brain. International Journal of Pattern Recognition and Artificial Intelligence, Special Issue.
Miller, M. I., G. E. Christensen, et al. (1993). “A mathematical textbook of deformable neuroanatomies.” Proceedings of the National Academy of Sciences, U.S.A. 90: 11944-11948.
Mortenson, M. E. (1997). Geometric Modeling. New York, John Wiley and Sons.
Raichle, M. E., J. A. Fiez, et al. (1994). “Practice-related changes in human brain
functional anatomy during nonmotor learning.” Cerebral Cortex 4: 8-26.
Schacter, D. and R. Buckner (1998). “Priming and the brain.” Neuron 20(2): 185-195.

13
intervention as well as eliminating the dependence of the coordinate system on the somewhat arbitrary choice of landmarks. The accuracy of the registration and the associated coordinate system can be assessed using functional data and hand-labeled anatomical data sets. Preliminary results show that significantly higher localization accuracy can be achieved for both structural and functional regions using such a surface-based approach. The optimal parameters of the morphing procedure are an empirical issue and depend on the goals of the coordinate system. As discussed previously, optimal anatomical alignment does not necessarily result in optimal functional alignment. Thus, the exact weighting of the preservation of metric properties versus anatomical alignment may change depending on the application, and an optimization procedure can be used to find the optimal parameter values given a set of specific goals. Furthermore, if functional alignment is a priority, then functional information such as the automatically delineated retinotopic areas can be used to drive the morphing procedure. Once the parameter weighting has been fixed, a canonical surface must be chosen as the target of the registration procedure. One alternative is to use an exemplar as the basis for the coordinate system and map individuals into the exemplar. While this is a straightforward procedure, the use of an average surface has several advantages. Primarily, it prevents the coordinate system from being biased by atypical properties of any individual brain. Furthermore, it allows a direct assessment of the variability of the cortical folding pattern across individuals. Finally, it permits the use of the variability to weight the registration procedure. Thus, the alignment of highly variable regions is primarily driven by the more global metric properties of the entire cortical sheet, while more stable geometric features are aligned naturally. However, in order to bootstrap the procedure we propose to use the Visible Human as specified by Van Essen and Drury as the target of the initial alignment, which now exists in spherical form (Drury, Van Essen et al. 1998). The use of the Visible Human coordinate system as the initial target should facilitate the comparison of data and reported coordinates across coordinate systems. This coordinate system is anchored with its origin at the ventral tip of the central sulcus, and oriented such that the zero meridian is approximately parallel to the fundus of the central sulcus. Once the initial alignment of a large number of cortical surfaces has been accomplished, we can average the previously aligned surfaces to generate a probabilistic atlas as the target for the final registration procedure. The potential applications of the surface-based coordinate system are varied and important, and primarily derive from the significant increase in the accuracy of both anatomical and functional localization relative to Talairach coordinates. This increased accuracy makes it possible to distinguish nearby cortical areas based on their spherical coordinates alone. Furthermore, the reduced spatial blurring associated with the spherical coordinate system directly translates into increased statistical power for cross-subject averaging procedures. This is particularly important for studies of subtle cognitive effects, or for small activation foci. In addition, the high degree of localization accuracy permits the automatic labeling of functional and structural areas. A generalization of this is the construction of probabilistic atlases of functional, geometric and histological properties of the cortex, similar to the one proposed in (Thompson, MacDonald et al. 1996). For example, using such an atlas one can generate statistical maps of anatomical properties such as the thickness and volume of cortical gray matter, as well as the degree of expansion/compression and shear required to align an individual with the atlas. These maps can then be used to detect regions with abnormal anatomical or functional measurements within specified areas of cortex. An extension of this idea is to use probabilistic atlases for different subject- or patient populations to design optimal discriminant functions for classifying members of each population. Such an approach may have great potential as a clinical tool for detecting and/or assessing subtle functional or anatomical abnormalities. The combination of automated and accurate methods for surface reconstruction, inflation, flattening, and morphing, together with a cortical surface-based coordinate system, should greatly facilitate the study of both local and global properties of the human cortex. These properties include anatomical features such as cortical thickness and volume, geometric features such as folding patterns, as well as the detailed relationship between structure and function in the human cerebral cortex.
12
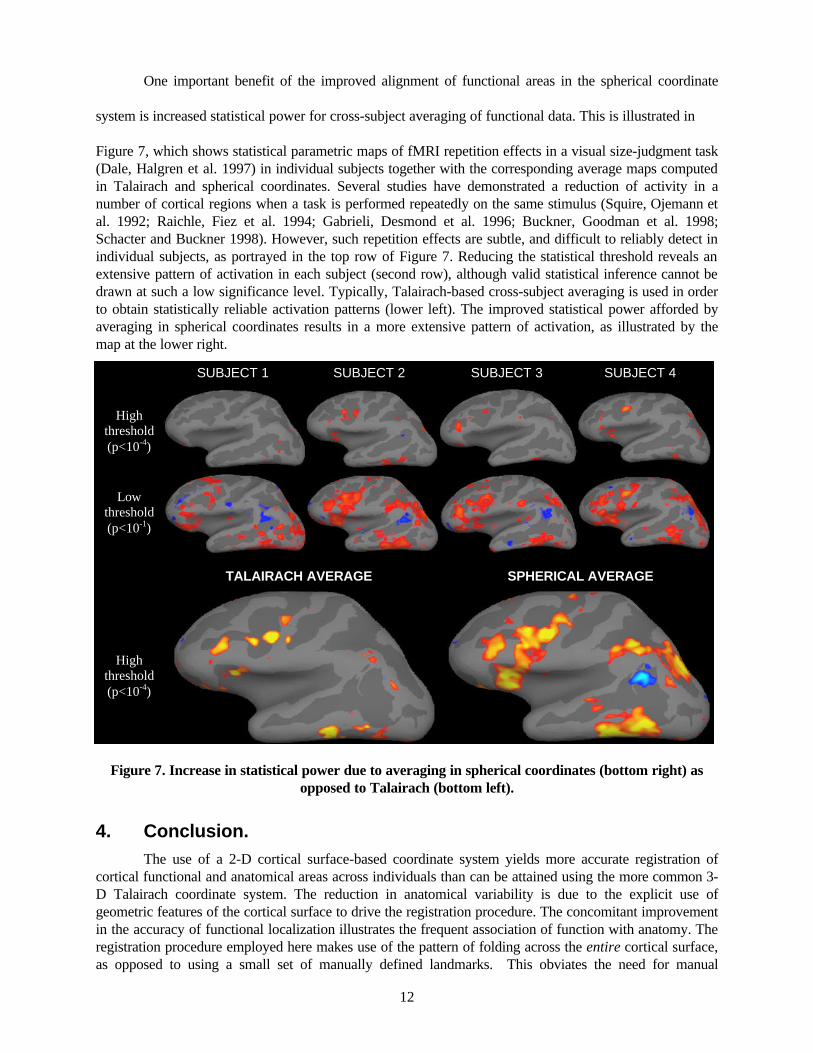
One important benefit of the improved alignment of functional areas in the spherical coordinate
system is increased statistical power for cross-subject averaging of functional data. This is illustrated in
Figure 7, which shows statistical parametric maps of fMRI repetition effects in a visual size-judgment task (Dale, Halgren et al. 1997) in individual subjects together with the corresponding average maps computed in Talairach and spherical coordinates. Several studies have demonstrated a reduction of activity in a number of cortical regions when a task is performed repeatedly on the same stimulus (Squire, Ojemann et al. 1992; Raichle, Fiez et al. 1994; Gabrieli, Desmond et al. 1996; Buckner, Goodman et al. 1998; Schacter and Buckner 1998). However, such repetition effects are subtle, and difficult to reliably detect in individual subjects, as portrayed in the top row of Figure 7. Reducing the statistical threshold reveals an extensive pattern of activation in each subject (second row), although valid statistical inference cannot be drawn at such a low significance level. Typically, Talairach-based cross-subject averaging is used in order to obtain statistically reliable activation patterns (lower left). The improved statistical power afforded by averaging in spherical coordinates results in a more extensive pattern of activation, as illustrated by the map at the lower right.
Highthreshold(p<10-4)
Lowthreshold(p<10-1)
Highthreshold(p<10-4)
SUBJECT 1 SUBJECT 3 SUBJECT 4
SPHERICAL AVERAGETALAIRACH AVERAGE
SUBJECT 2
Figure 7. Increase in statistical power due to averaging in spherical coordinates (bottom right) as opposed to Talairach (bottom left).
4. Conclusion. The use of a 2-D cortical surface-based coordinate system yields more accurate registration of cortical functional and anatomical areas across individuals than can be attained using the more common 3-D Talairach coordinate system. The reduction in anatomical variability is due to the explicit use of geometric features of the cortical surface to drive the registration procedure. The concomitant improvement in the accuracy of functional localization illustrates the frequent association of function with anatomy. The registration procedure employed here makes use of the pattern of folding across the entire cortical surface, as opposed to using a small set of manually defined landmarks. This obviates the need for manual
11
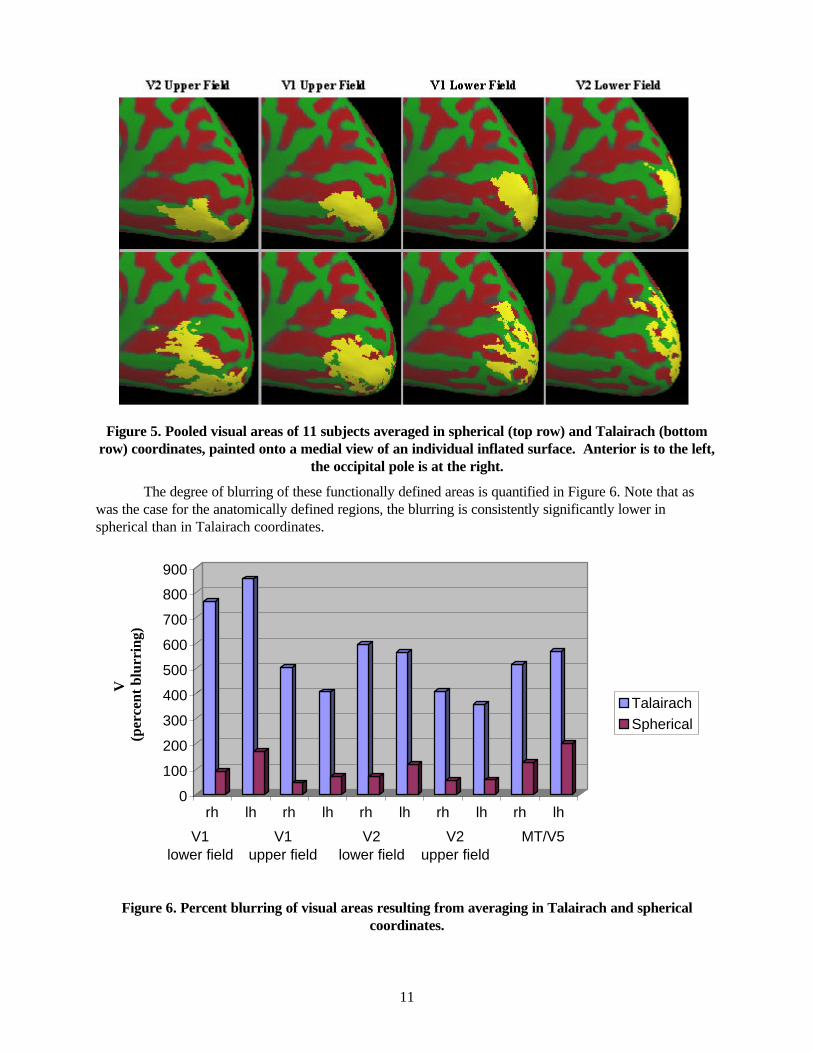
Figure 5. Pooled visual areas of 11 subjects averaged in spherical (top row) and Talairach (bottom row) coordinates, painted onto a medial view of an individual inflated surface. Anterior is to the left,
the occipital pole is at the right.
The degree of blurring of these functionally defined areas is quantified in Figure 6. Note that as was the case for the anatomically defined regions, the blurring is consistently significantly lower in spherical than in Talairach coordinates.
0
100
200
300
400
500
600
700
800
900
rh lh rh lh rh lh rh lh rh lh
TalairachSpherical
V1 lower field
V1 upper field
V2lower field
V2upper field
MT/V5
Figure 6. Percent blurring of visual areas resulting from averaging in Talairach and spherical coordinates.
V
(per
cent
blu
rrin
g)
10
0
20
40
60
80
100
120
140
160
180
rh lh rh lh rh lh
TalairachSpherical
Sylvian Central Calcarine
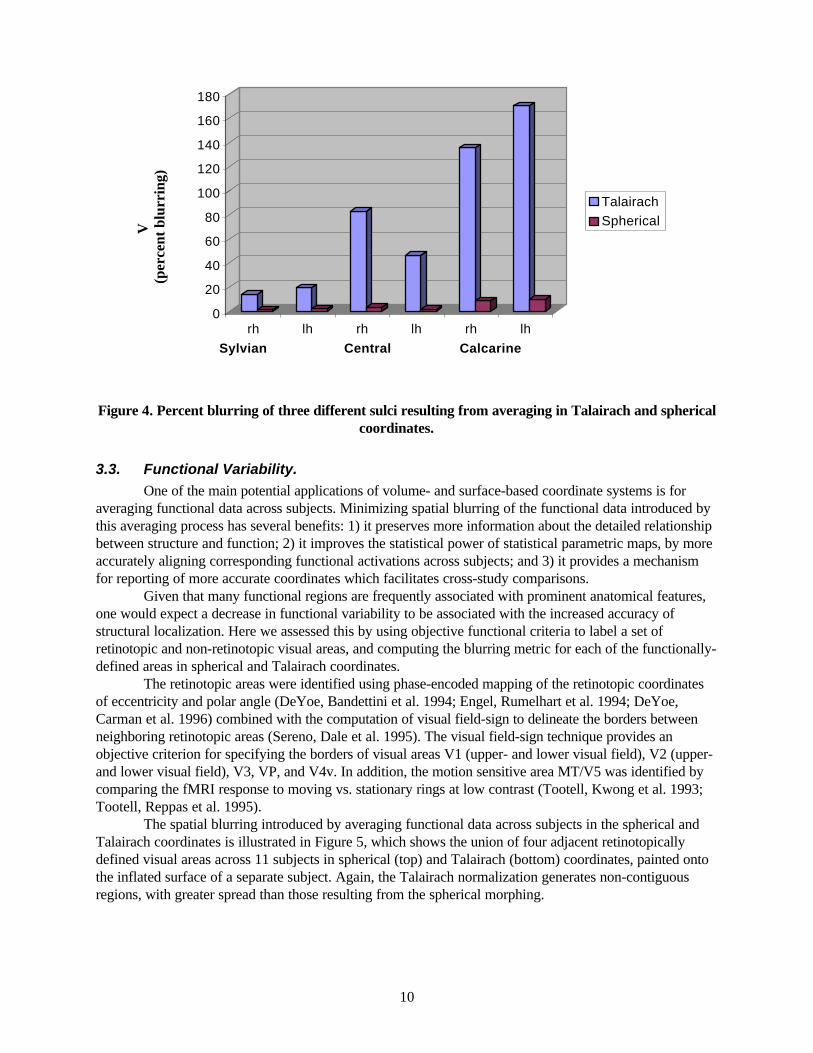
Figure 4. Percent blurring of three different sulci resulting from averaging in Talairach and spherical coordinates.
3.3. Functional Variability. One of the main potential applications of volume- and surface-based coordinate systems is for
averaging functional data across subjects. Minimizing spatial blurring of the functional data introduced by this averaging process has several benefits: 1) it preserves more information about the detailed relationship between structure and function; 2) it improves the statistical power of statistical parametric maps, by more accurately aligning corresponding functional activations across subjects; and 3) it provides a mechanism for reporting of more accurate coordinates which facilitates cross-study comparisons.
Given that many functional regions are frequently associated with prominent anatomical features, one would expect a decrease in functional variability to be associated with the increased accuracy of structural localization. Here we assessed this by using objective functional criteria to label a set of retinotopic and non-retinotopic visual areas, and computing the blurring metric for each of the functionally-defined areas in spherical and Talairach coordinates. The retinotopic areas were identified using phase-encoded mapping of the retinotopic coordinates of eccentricity and polar angle (DeYoe, Bandettini et al. 1994; Engel, Rumelhart et al. 1994; DeYoe, Carman et al. 1996) combined with the computation of visual field-sign to delineate the borders between neighboring retinotopic areas (Sereno, Dale et al. 1995). The visual field-sign technique provides an objective criterion for specifying the borders of visual areas V1 (upper- and lower visual field), V2 (upper- and lower visual field), V3, VP, and V4v. In addition, the motion sensitive area MT/V5 was identified by comparing the fMRI response to moving vs. stationary rings at low contrast (Tootell, Kwong et al. 1993; Tootell, Reppas et al. 1995). The spatial blurring introduced by averaging functional data across subjects in the spherical and Talairach coordinates is illustrated in Figure 5, which shows the union of four adjacent retinotopically defined visual areas across 11 subjects in spherical (top) and Talairach (bottom) coordinates, painted onto the inflated surface of a separate subject. Again, the Talairach normalization generates non-contiguous regions, with greater spread than those resulting from the spherical morphing.
V
(per
cent
blu
rrin
g)
9
50%
25%
0%
SPHERICAL
TALAIRACH
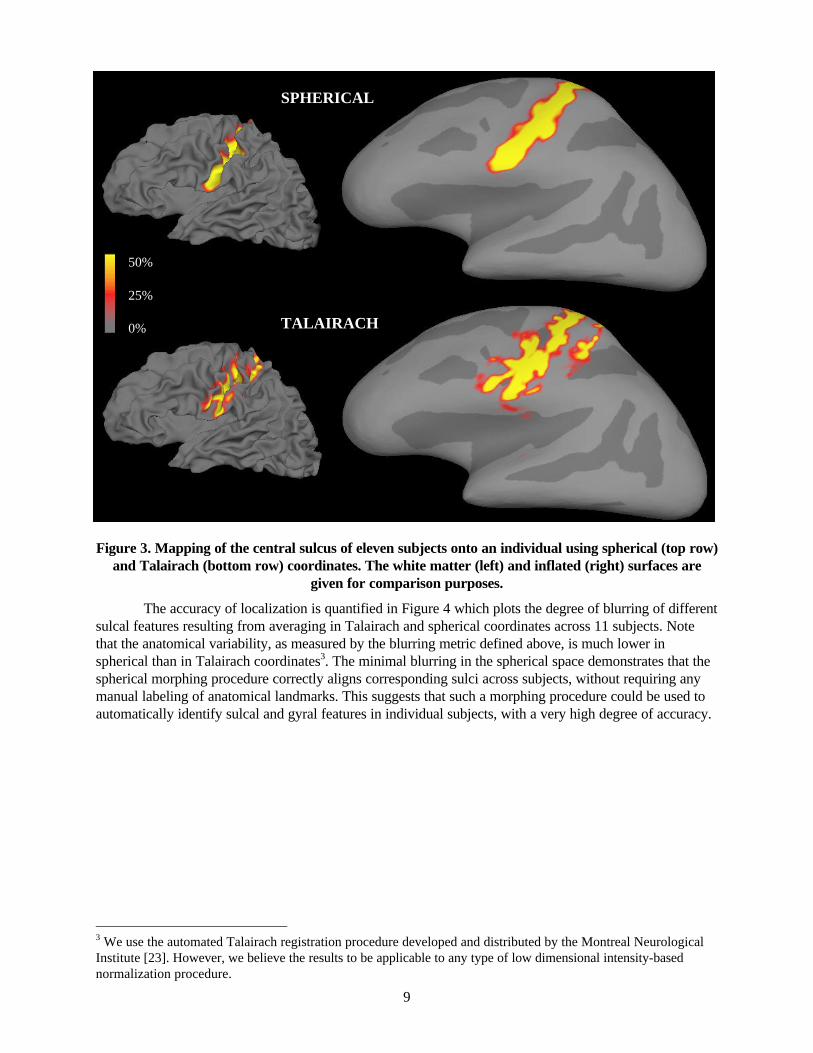
Figure 3. Mapping of the central sulcus of eleven subjects onto an individual using spherical (top row) and Talairach (bottom row) coordinates. The white matter (left) and inflated (right) surfaces are
given for comparison purposes.
The accuracy of localization is quantified in Figure 4 which plots the degree of blurring of different sulcal features resulting from averaging in Talairach and spherical coordinates across 11 subjects. Note that the anatomical variability, as measured by the blurring metric defined above, is much lower in spherical than in Talairach coordinates3. The minimal blurring in the spherical space demonstrates that the spherical morphing procedure correctly aligns corresponding sulci across subjects, without requiring any manual labeling of anatomical landmarks. This suggests that such a morphing procedure could be used to automatically identify sulcal and gyral features in individual subjects, with a very high degree of accuracy.
3 We use the automated Talairach registration procedure developed and distributed by the Montreal Neurological Institute [23]. However, we believe the results to be applicable to any type of low dimensional intensity-based normalization procedure.

8
Figure 2. Four individual hemispheres before (top) and after (bottom) alignment with an average folding pattern (40 subjects, middle left). CS – central sulcus, IPS – intraparietal sulcus, SF – sylvian
fissure, STS – superior temporal sulcus.
3.2. Anatomical Variability. Since the registration procedure is driven by the gyral and sulcal folding patterns of the cortex, one would expect the major gyri and sulci to be better localized in the spherical coordinate system than in a volume-based system such as that of Talairach. A graphical illustration of this reduction in anatomical variability is given in Figure 3, which depicts the points in the central sulcus of 11 subjects painted onto the surface of a separate subject. The top two surfaces in this figure are the folded (left) and inflated (right) representations, with the cross-subject mapping computed in spherical coordinates, while the bottom two surfaces are the same mapping computed in Talairach coordinates. The color scale indicates the percentage of the total number of subjects which map to a given point. Note the compact appearance of the spherical union of central sulci as opposed to that of the Talairach representation, which does not even preserve the topology of the sulcus, resulting in a non-contiguous labeled region.
CS IPS
STSSF

7
(6) l
lpooledll A
AAV
−= ,100 , ∑=
N
iill A
NA ,
1,
where pooledlA , is the volume of the lth labeled region across all subjects, ilA , is the area of the same region
in the ith subject, and lA is the mean area of the lth region across all subjects. If all labeled regions occur in
exactly the same coordinates, the pooled area will be equal to the individual areas, and V will be 0. Conversely, if the coordinates of a labeled region vary widely, then the pooled area will be substantially
larger than the individual areas, and V will be correspondingly larger. Note that the absolute value of V is related to the spatial extent of an area – larger areas will be intrinsically more likely to overlap than smaller ones, and thus blurring values should not be compared across areas.
3. Results. In this section we present the results of applying the registration procedure described above to a
number of brains. In order to generate an initial template, we begin with an individual surface and align a set of surfaces from other individuals with it, using a transformation with a high degree of rigidity (λA=0.1, λd=0.5)2. This allows the canonical surface to be constructed in a manner which represents the variability of folding patterns across subjects. A truly rigid morph would introduce too much blurring into the average surface. For example, the angle between the calcarine and parieto-occipital sulci is variable enough that averaging a large number of rigidly aligned surfaces causes them to merge. A more aggressive morphing would align all structures exactly, and not permit the average surface to quantify the true variability of curvature patterns. Once the initial alignment is completed we compute the summary statistics of the convexity of the aligned surfaces and generate a canonical surface. Next, we repeat the alignment procedure using the previously computed means and variances, using parameters which allow a less rigid and therefore more accurate morph (λA=0.2, λd=0.1).
3.1. Morphing. Figure 2 illustrates the results of the morphing procedure. The spherical surface in the middle row
at the left is the product of semi-rigidly aligning and averaging 35 individual cortical surfaces, as detailed above (red regions represent convex or sulcal areas, while green regions are concave or gyral). The top row contains the spherical surfaces of four typical subjects with the outline of the average sulci overlaid in blue. Initially, as shown, there is a large misalignment in a number of cortical regions. The results of the registration procedure are shown in the bottom row, which contains the same four surfaces after morphing into register with the canonical surface. The blue outlines illustrate the accuracy of the alignment between the average pattern and each of the individuals, indicating the correspondence between sulci and gyri across individuals after the morphing.
2 Note that all alignments are preceded by an optimal rigid alignment that is accomplished by globally searching the space of all rigid alignments in a multi-scale manner. The initial rigid alignment is critical to the robustness of the procedure as it ensures that the morphing energy functional begins within the right basin of attraction.

6
2.2. Minimization of metric distortion. Simply maximizing the correlation (or equivalently, minimizing the mean-squared difference) of the
folding patterns of a subject with that of the average imposes too few constraints on the types of allowable morphs. For example, transformations which cause folds or distortions in the local topology of the surface are undesirable as the coordinates of points in these regions are not unique. Thus, while we wish to afford the surface some flexibility in order to achieve successful alignment, we also require that some of the geometry of the original surface be preserved. In order to fulfill both these criteria, we add two terms to the energy functional that encourage the preservation of local areas and distances. The distance term serves to give the surface some local stiffness, thus discouraging the introduction of excessive shear, while the areal term prevents folds and significant compression/expansion. Note that the area is an oriented quantity, in which folded regions are assigned a negative value. This is accomplished by using the embedding space to give the spherical surface a consistent outward orientation, as discussed in (Fischl, Sereno et al. 1998). These two terms are given by:
(4) ∑=
−=T
ii
tiA AA
TJ
1
20 )(2
1, ∑ ∑
= ∈
−=V
i iNnin
tind dd
VJ
1 )(
20 )(4
1, t
nti
tind xx −=
where superscripts denote time, with 0 being the initial (i.e. on the folded surface) areal and distance values, T refers to the number of triangles in the tessellation, xi
t is the (x,y,z) position of vertex i at iteration number t, d0
in is the distance between the ith and nth vertices on the original cortical surface, N(i) is the set of neighbors of the ith vertex, and the functional dependence of the AIs on the position of the vertex and its neighbors has been suppressed to simplicity the notation. The full derivation of the gradient of these two terms is given in (Fischl, Sereno et al. 1998). Note that in contrast to the spherical transformation or flattening procedures in which the use of long-range distances is desirable, here the distances are to the nearest neighbors of each vertex, as locally correlated errors allow large regions of the surface to undergo modest expansion or contraction in order to account for individual variability in anatomical features.
2.3. The Complete Energy Functional. The complete energy functional balances the degree of allowable metric distortion as measured by
JA and Jd, and the amount of alignment of the folding patterns as governed by JP.
(5) ddAAP JJJJ λλ ++= ,
where the constant λA and λd determine the degree to which metric distortion is permitted in order to allow alignment of the folding patterns. Increasing λd increases the rigidity of the surface, with the morph becoming a rigid alignment in the limit of large λd. Conversely, an almost perfect fit can be achieved between the individual and the average if λA and λd are set to sufficiently small values. It is important to note this is not necessarily desirable if the goal is optimal alignment of functionally equivalent regions. This is due to the large compression/expansion and shear required to achieve this degree of alignment. Given the imperfect correlation between folding patterns and the location of functional areas, together with the relatively constant size of computational elements of the nervous system across individuals (e.g. columns), it seems unreasonable to allow too much expansion or compression of cortical regions. Nevertheless, the optimal values of λA and λd remain an empirical question.
2.4. Assessment of Variability. One of the primary goals of the proposed coordinate system is to reduce the spatial uncertainty associated with the location of a given anatomical or functional area. That is, we would like the coordinates of an anatomical or functional feature to be consistent across subjects. Toward that end we have designed a validation criterion which measures the blurring introduced by the coordinate transformation. This is achieved by computing the spatial spread over which a feature occurs across individuals in a given coordinate system. Specifically, we define the “blurring metric” V to be:
5
original surface (i.e. the local connectivity). In addition, a coordinate system based on the unit sphere retains much of the computational attractiveness of a flat space, facilitating the calculation of metric properties such as geodesic distances, areas and angles, properties that are more difficult to compute on less symmetric surfaces such as ellipsoids. As shown in our previous studies (Fischl, Dale et al. 1998; Fischl, Sereno et al. 1998), it is possible to transform the cortical surface into a spherical representation with moderate metric distortions (averaging 15% in cortex). The minimization of metric distortion is important in obtaining a spherical surface which can be used to accurately represent the shape of the folding pattern of the cortex. Once this spherical representation has been established, we can use any of the standard spherical coordinates systems (e.g. longitude and colatitude) to uniquely index a point on the cortical surface. Furthermore, because the energy functional used to generate the spherical transformation ensures that the transformation is invertible, we can use the spherical coordinate system to specify a point on any of the surface representations for a given subject. Once an individual cortical surface has been transformed into an optimal (from a metric standpoint) sphere, we wish to align the folding patterns of the individual with that of an average. In order to accomplish this, we need to construct a function which accurately and stably represents the folding patterns of the cortex, then treat it as a function on the unit sphere via the mapping established by the spherical transformation. This function can then be used to align the surface using a mean-squared energy functional that measures the difference between the individual folding and that of the average.
2.1. Alignment of folding patterns. The alignment of the folding patterns of the cortical surface is carried out by minimizing the mean
squared difference between the average convexity across a set of subjects (denoted by C ), and that of the individual (denoted byC ) modulated by the variance of the convexity across subjects. The measure of convexity we use reflects the large scale geometry of the surface, and is less noise-prone than mean curvature (Fischl, Sereno et al. 1998). Negative and positive values of C indicate gyral and sulcal regions respectively. The use of the variance of the convexity allows consistent folding patterns such as the central sulcus, the sylvian fissure, etc. to have a greater effect on the alignment than more variable patterns. The average convexity over N subjects is given by:
(1) ),(1
),(1
θϕθϕ ∑=
=N
iiC
NC .
An unbiased estimate of the variance is then:
(2) 2)),(),(1(
1
1),(2 θϕθϕθϕσ C
N
iC
N i −∑=−
=
Finally, the alignment energy functional is:
(3) 2
1
)))(),((
)))(),(((*(
2
1 ∑=
−=
V
v
vP vv
vvCCG
VJ
θφσθφα ,
where φ(v) and θ(v) are the spherical (φ,θ) coordinates of the vth vertex as established by the spherical transformation detailed in (Fischl, Sereno et al. 1998), V is the total number of vertices in the tessellation, Gα is a Gaussian kernel with standard deviation α and * denotes convolution. The alignment is performed in a multi-scale manner with α initially large and gradually decreasing as the integration asymptotes at each scale. Note that in practice the alignment is an iterative procedure. First, a single surface is used as an
exemplar to generate C , and all variances are set to unity. Next, a set of surfaces are aligned with this surface, then the aligned surfaces are used as the Ci in equation (3) to generate the canonical surface. This process can then be iterated until the canonical surface converges.

4
In contrast, the spherical coordinate system proposed here requires no incisions in the surface. This is possible because the cortical surface of each hemisphere is topologically equivalent to a sphere, after closing the surface medially across sub-cortical structures. The reconstructed surface of each individual subject is first mapped onto a sphere, using a maximally isometric transformation (Fischl, Dale et al. 1998). The surfaces are then morphed into register with an average, canonical surface, guided by a combination of folding-alignment (sulcus/gyrus) and isometry-preserving forces. The canonical cortical surface is generated by combining multiple surfaces that have each been morphed into a parameterizable surface. A unified latitude and longitude system can then be established, allowing surface-based averages across subjects. As with the Talairach atlas, the coordinates of a single point (here latitude and longitude as opposed to x,y,z) are used to index the corresponding point on each individual surface. This procedure is illustrated in Figure 1. The leftmost image is the reconstruction of the pial surface of an individual subject. This surface is then inflated to determine the large-scale folding patterns of the cortex (second image from left), and subsequently transformed into a sphere in a manner which minimizes metric distortion (third image from left). The folding patterns of the individual are then aligned with an average folding pattern (rightmost image). The natural coordinate system of the average surface, shown at the right, can then be used to index any point on any of the surface representations of the individual. The coordinate lines painted onto the individual surfaces are no longer uniform; rather they occur at the same locations relative to the primary cortical folding pattern across all subjects.
Figure 1. Different representations of an individual cortical surface as well as the average (12 subjects, right). Red and green regions represent sulci and gyri respectively.
The main advantages of this coordinate system are: 1) it respects the intrinsic topological structure of the cortical surface; 2) the metric distortions introduced in the registration process are explicitly minimized; 3) no manual labeling of anatomical landmarks is needed, as the entire curvature pattern is used in the alignment; 4) the coordinate system is one-to-one and onto, that is, every point on the surface has a unique coordinate, and every coordinate refers to a unique point on the surface; and 5) the “blurring” of anatomically and functionally defined cortical areas is greatly reduced, as demonstrated below. One of the main purposes of such a coordinate systems is to bring anatomical and functional areas across subjects into register as precisely as possible. Here, we propose a “blurring” metric which directly quantifies the degree of blurring introduced by different registration procedures and coordinate systems. This provides an objective criterion for comparing the anatomical and functional precision of such procedures, and can also be used to optimize any free parameters of a given registration procedure.
2. Methods. In order to map an individual’s cortical surface into a surface-based coordinate system, one first
has to obtain an accurate surface reconstruction. We have previously described a largely automated cortical surface reconstruction procedure capable of producing a highly detailed geometric description of the gray-white matter boundary, as well as the pial surface of the human cortex [20, 21]. To establish a coordinate system for this surface, it is necessary to transform or project it into a parameterizable shape, as the parameterization then provides a natural coordinate system for the surface. The coordinate system proposed here uses a sphere for this purpose. This choice is primarily motivated by the fact that the mapping of the cortical hemisphere onto a sphere allows the preservation of the topological structure of the

3
procedures, which require only a few parameters to represent the appropriate transformation, these techniques use tens of millions of degrees of freedom to morph one entire 3-D volume into another. This type of non-rigid alignment can therefore perform a significantly more dramatic warping of a volume in order to accurately align it with a predefined anatomical 'textbook'. While such high-dimensional warping methods are capable of producing an almost perfect match between the 3-D intensity values of different brains, this does not ensure the alignment of sulcal and gyral patterns of the individual cortical surfaces. This is because the curvature pattern (sulcal and gyral folding) is defined as a property of the 2-D cortical surface, and can therefore only be determined from an explicit representation of the surface itself. Since gyral and sulcal landmarks are typically accurate predictors of the location of functional areas, it seems likely that using these features to drive the registration of the cortical surfaces will result in a more accurate alignment of corresponding functional areas than can be achieved using volume-based deformation methods. Variants of this type of surface-based alignment approach have been proposed in a few recent studies [12-17]. The approach of Drury and Van Essen has been to apply fluid deformations similar to those of Miller et al. (Miller, Christensen et al. 1993) to flattened representation of the cortical surface, driven by a small number of manually-labeled anatomical landmarks. While this technique addresses some of the issues raised above, it is important to note that this procedure can only be carried out after several incisions have been made in the cortical surface to allow it to lie flat without major distortion [14]. This is problematic, as the resulting surface does not respect the topological structure1 of the original cortical surface. That is, neighboring points on the surface which lie on opposite sides of a cut may have very different locations on the flattened surface. Thus, the exact position of the incisions can greatly affect the resulting registration. Moreover, the location of the incisions introduces variability in the resulting surface, as it is difficult to make incisions at equivalent points in different subjects. Indeed, the purpose of inter-subject registration is to establish precisely this kind of correspondence. Thompson et al. (Thompson, MacDonald et al. 1996) take a similar approach to that of Drury and Van Essen, using fluid deformations to warp a manually-labeled flattened representation of one individual cortical surface into register with that of another. They avoid the problem of introducing cuts to some degree by using a spherical mapping of the cortical surface, then flattening and registering each octant of the sphere separately. While no incisions are required in the surface, this approach imposes an arbitrary partitioning into the cortical subregions that are aligned. In addition, it forces the use of manual labeling, as the spherical and flattened representations do not preserve metric properties of the original surface, and therefore introduce arbitrary distortions into the shape of the cortical folding patterns, preventing automated alignment. The volume- and surface-based normalization or alignment schemes described above can also be used to define a coordinate system for the volume or surface. In the case of the Talairach normalization approach, the coordinate system is based on the 3-D Cartesian embedding space of the standard brain. The main drawbacks of this coordinate system stem from 1) its poor anatomical precision, as noted above, and 2) the fact that its metric properties do not reflect the metric properties of the cortical sheet – i.e., Cartesian distances give poor estimates of geodesic distances along the surface. In the case of the post-flattening surface-based alignment approach of Van Essen and Drury, the coordinate system is based on the 2-D Cartesian embedding space of the flattened representation of the cortical surface of the Visible Human. While the metric properties of this 2-D coordinate system better reflect those of the cortical surface, large distance errors may result from the changes in topological structure caused by cuts needed to allow the surface to be flattened with minimal metric distortion. Furthermore, this coordinate system is not onto, that is, there are coordinates in the flattened space which do not correspond to any points on the cortical surface. In fact, since the flattened surface boundary is not convex, the average surface-based coordinate of points on opposite sides of a cut may fall outside the surface.
1The term Topological structure is frequently used to refer to the border of a domain as opposed to its global topology (Mortenson 1997). For example, once an incision has been made in the cortical surface it is topologically equivalent to a plane. Further incisions alter its topological structure, but not its topology (unless they result in multiple disconnected components).

2
Abstract - The neurons of the human cerebral cortex are arranged in a highly folded sheet, with the majority of the cortical surface area buried in folds. Cortical maps are typically arranged with a topography oriented parallel to the cortical surface. Despite this unambiguous sheet-like geometry, the most commonly used coordinate systems for localizing cortical features are based on 3-D stereotaxic coordinates rather than on position relative to the 2-D cortical sheet. In order to address the need for a more natural surface-based coordinate system for the cortex, we have developed a means for generating an average folding pattern across a large number of individual subjects as a function on the unit sphere, and of non-rigidly aligning each individual with the average. This establishes a spherical surface-based coordinate system which is adapted to the folding pattern of each individual subject, allowing for much higher localization accuracy of structural and functional features of the human brain.
1. Introduction. The cerebral cortex is the largest part of the human brain. Although it is highly folded in many mammalian species, the intrinsic 'unfolded' structure of the cortex is that of a 2-D sheet, several millimeters thick. In experimental animals, it is well-accepted that: 1) many functional dimensions (e.g. retinotopy, orientation tuning, ocular dominance, somatotopy, tonotopy, etc.) are mapped on the cortical surface; 2) these mapped parameters vary much more rapidly in the two dimensions parallel to the surface than they do through the several millimeters of cortical thickness (i.e. they are 'columnar'); and 3) different cortical areas are arranged in a characteristic pattern, or mosaic, across the cortical surface. In order to relate and compare anatomical features or functional activations across subjects, it is necessary to establish a mapping which specifies a unique correspondence between each location in one brain and the corresponding location in another---that is, to bring the two brains into register. Most comparisons of data across subjects in the human brain have relied on the 3-D normalization approach described by Talairach and Tournoux (Talairach, Szikla et al. 1967; Talairach and Tournoux 1988). While this type of approach has certain advantages (ease of use, widespread acceptance, applicability to subcortical structures), it also has significant drawbacks. These drawbacks derive directly from the fact that the intrinsic topology of the cerebral cortex is that of a 2-D sheet, as described above. For instance, estimates of the amount of 'buried' cortex range from 60-70% (Zilles, Armstrong et al. 1988; Van Essen and Drury 1997). Thus, distances measured in 3-D space between two points on the cortical surface will substantially underestimate the true distance along the cortical sheet, particularly in cases where the points lie on different banks of a sulcus. For example, the lateral tip of the central sulcus frequently lies within a centimeter of the superior temporal gyrus when the distance is measured in the Cartesian embedding space. The distance between the same two points as measured along the actual cortical surface is more than 10 centimeters due to the depth of the sylvian fissure. This problem is compounded by the poor anatomical accuracy afforded by the Talairach normalization approach. As numerous studies have demonstrated, the between-subject variability in the location of cortical anatomical landmarks after Talairach alignment is on the order of several centimeters (Steinmetz, Furst et al. 1989; Hunton, Miezen et al. 1996; Thompson and Toga 1996; Van Essen and Drury 1997). Since many human functional areas (e.g. visual areas V2, V3, VP, V4v, MT+, etc.) are less than 2 cm wide, the Talairach coordinate system does not have sufficient accuracy to differentiate neighboring cortical areas. This type of error makes it impossible to distinguish topographical and fine structural features of the cortical architecture based solely on Talairach coordinates. In order to achieve a more accurate inter-subject alignment, various groups have suggested the use of high-dimensional warpings to register two volumes (Miller, Christensen et al. 1993; Evans, Collins et al. 1994; Christensen, Miller et al. 1995; Joshi, Miller et al. 1997). In contrast to Talairach registration
1
Submitted to Human Brain Mapping
High-Resolution Inter-Subject Averaging and a Coordinate
System for the Cortical Surface
Bruce Fischl Nuclear Magnetic Resonance Center
Massachusetts Gen. Hosp/ Harvard Med. School Bldg. 149, 13th St.
Charlestown, MA 02129 tel: 617 726 8790 fax: 617 726-7422
and
Anders M. Dale * Nuclear Magnetic Resonance Center
Massachusetts Gen. Hosp/ Harvard Med. School Bldg. 149, 13th St.
Charlestown, MA 02129 tel: 617 724 8304 fax: 617 726-7422
[email protected] Keywords: Inter-subject averaging, coordinate systems, atlas.
* Author to whom correspondence should be addressed.
Martin I. Sereno Department of Cognitive Science
University of California at San Diego Mailcode 0515
9500 Gilman Drive La Jolla, CA 92093-0515 [email protected]
Roger B.H. Tootell Nuclear Magnetic Resonance Center
Massachusetts Gen. Hosp/ Harvard Med. School Bldg. 149, 13th St.
Charlestown, MA 02129 tel: 617 724 8304 fax: 617 726-7422
Related Documents